Embed Size (px)
Citation preview

Team Rock Paper Scissors Gelblum, Laucys, Saperstein, Sodha
MBA 211 1 5/13/2010
The Game Theory of Baseball Analysis of the 8th inning of 18-APR-2010 Dodgers/Giants game
Why baseball?
Baseball is a great game to analyze from a game theory perspective because of the
complexity and magnitude of strategic and tactical decisions that are constantly being made both on
the field and between the games. In every situation there are numerous players (baseball players,
coaches, team managers and owners) with different goals and payoffs, and hundreds of pitch-by-
pitch decisions are made in course of an inning, game and season. Major League Baseball is also ripe
for analysis because statistical information is tracked for almost every single aspect of the game. We
chose to inspect one half inning of a single game in detail as a microcosm of the strategies occurring
in baseball every day.
Background
The origins of baseball go back to 18th century England, and it is believed that the game was
originally brought to North America by English immigrants. By the late 19th century, baseball was
widely recognized as the national sport of the United States, and the modern version of the game
was gradually developed. Major League Baseball is the highest level of play in North American
professional baseball. Every year, the regular season is concluded by advancing four teams from
each league (National League and American League) to the “postseason” (playoffs), where a winner
is crowned after the World Seriesi. The Dodgers/Giants game on April 18, 2010 was a National
League game and was the third Dodgers/Giants game of the season.
The Los Angeles Dodgers and San Francisco Giants are known for having the oldest rivalry
in baseball (even though the feud between the Boston Red Sox and the New York Yankees receives
more publicity). Both teams originated in New York in 1883, and both played there until moving to
the West Coast in 1958. The Dodgers/Giants rivalry has traditionally been balanced: since 1901 the
Dodgers and Giants have played more head-to-head games than any other teams in Major League
Baseball, and in their 2,158 meetings (seasons 1901 through 2009) the Giants have won 1,079 games

Team Rock Paper Scissors Gelblum, Laucys, Saperstein, Sodha
MBA 211 2 5/13/2010
to the Dodgers’ 1,066.ii The Dodgers have won the World Series 6 times, and the Giants have won
it 5 times.
April 18th: The game up to the bottom 8th
There were no runs in the game over the first six innings – neither team even made it past
second base. In the seventh inning, Juan Uribe homered deep into the left field pavilion, scoring the
Giants’ only run of the game. In the top of the eighth, the Giants did not score, and the team went
into the bottom of the inning leading the Dodgers 1-0.iii The primary players involved in this half
inning were:
Giants:
#75 Barry Zito, Pitcher, Starter – Career Stats: 137-106, 3.80 ERA, 1.29 WHIP
#54 Sergio Romo, Pitcher, Reliever – Career Stats: 8-5, 2,82 ERA, .92 WHIP
Dodgers:
#9 Garret Anderson, Outfielder – Career Stats, .294 AVG, .325 OBP, .463 SLG
#99, Manny Ramirez, Outfielder – Career Stats: .314 AVG, .412 OBP, .591 SLG
The Game Tree
For our game tree we looked at the scenario the Giants faced at the bottom of the eighth
inning with one out and Garret Anderson at the plate. We analyzed each of the moves from this
point forward by examining the options for the Giants as well as for the Dodgers and then by
looking forward and reasoning back to determine the Giants’ optimal strategy.
Every play has an effect on each team’s probability of winning the game. Win Expectancy
(WE) is computed by analyzing every play in the history of baseball and then determining each
possible situation’s effect on a team’s chance of winning the game. This statistic is then adjusted for
home field advantage. Win Probability Added (WPA) looks at the change in WE based on a given
play. WPA is not calculated for each specific player, but instead given the particular situation.
The payoffs in the game tree represent the WPA - the change in either team’s likelihood of
winning the game from the given set of matchups. This is determined by calculating the WPA for

Team Rock Paper Scissors Gelblum, Laucys, Saperstein, Sodha
MBA 211 3 5/13/2010
each possible outcome (single, double, triple, etc), and then weighting it by the likelihood of that
outcome occurring based on the hitter’s career statistics given the situational on-base percentage
(OBP). OBPs were calculated by analyzing the historical OBPs for the hitter against the given
pitcher.iv
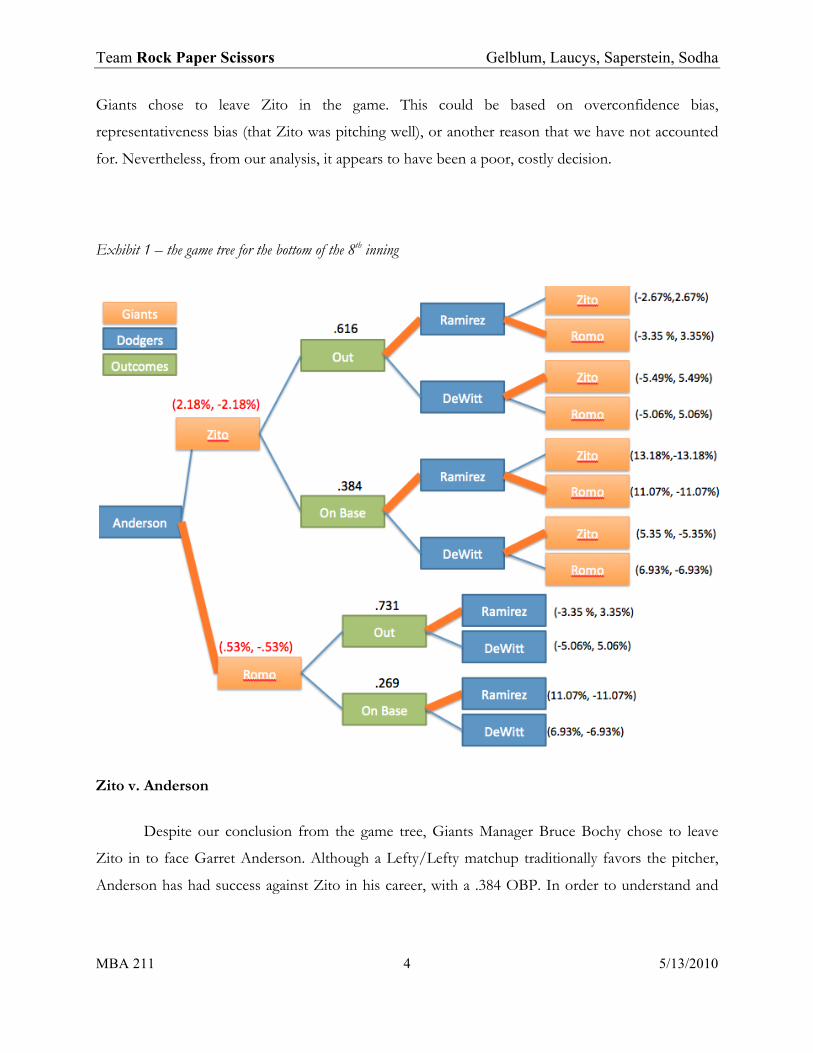
Looking forward and reasoning back, the Giants can see that, no matter what happens, it is
in the Dodgers’ best interest to put in Manny Ramirez after Anderson’s at-bat. Therefore, the
Giants’ decision concerning who should pitch to Anderson will not affect that decision. However,
Ramirez has a greater effect on the Dodgers WPA when there is a runner on base, and Anderson
gets on base more frequently against Zito than Romo. Therefore, when taking the probabilities into
account, we can see that, looking forward and reasoning back, the Giants should put Romo in to
pitch against Garret Anderson. Overall, putting in Romo instead of Zito to pitch against Anderson
would increase the Giants’ probability of winning by 1.65% (-.53% minus -2.18%). These payoffs
are symmetrical, so the opposite is true for the Dodgers, and they have a 1.65% greater chance of
winning if Anderson faces Zito as opposed to Romo.
It is worth noting that while having Ramirez bat may seem like a dominant strategy, it is not
always an option. On an individual occasion it will likely be the best scenario, but we are not
modeling the fact that this option can only be utilized once during the course of the game. The value
of having Ramirez pinch-hit has different values based on the situation in the game when it incurs.
For example, having Manny bat early in a tied game would be worth less (lower WPA) than the
current scenario. However, if the game goes to extra innings, and there is a runner in scoring
position, a Ramirez pinch-hit appearance will likely lead to a higher expected WPA. Therefore, even
if Manny has the greatest WPA, the opportunity cost of using him as a pinch hitter (not being able
to use him later) must be considered as well. In this case, the Dodgers seem to have made the right
decision to utilize Manny in the eighth inning, as there was a runner on base, the Dodgers were
down by a run, Manny was replacing the pitcher (a notoriously weak batter), and the top of the
order was up next.
Given the fact that the Dodgers were going to pinch hit with Manny, the best possible
option for the Giants was to have Romo pitching against Ramirez with no one on base. In order to
maximize this probability, the Giants should have brought in Romo to face Anderson. However, the
Team Rock Paper Scissors Gelblum, Laucys, Saperstein, Sodha
MBA 211 4 5/13/2010
Giants chose to leave Zito in the game. This could be based on overconfidence bias,
representativeness bias (that Zito was pitching well), or another reason that we have not accounted
for. Nevertheless, from our analysis, it appears to have been a poor, costly decision.
Exhibit 1 – the game tree for the bottom of the 8th inning
Zito v. Anderson
Despite our conclusion from the game tree, Giants Manager Bruce Bochy chose to leave
Zito in to face Garret Anderson. Although a Lefty/Lefty matchup traditionally favors the pitcher,
Anderson has had success against Zito in his career, with a .384 OBP. In order to understand and

Team Rock Paper Scissors Gelblum, Laucys, Saperstein, Sodha
MBA 211 5 5/13/2010
analyze the game theoretic decisions in this at bat, we will look at the pitcher’s and batter’s first level
of decision-making: whether to pitch in or out of the zone, and whether to swing or not.v
Exhibit 2 – the Payoffs
In order to determine the best response for each player, we must construct payoffs on a
pitch-by-pitch basis. In this game, the payoffs must be symmetrical, as a positive result for the hitter
is by definition a negative result for the batter. We are ignoring any third-party motivations, such as
the result’s effect on the player’s reputation or contract.
We used WPA (see explanation in game tree section) to determine the payoffs for the four
possible outcomes. Given the specifics of Anderson’s at bat – one out, no one on base, in the
bottom of the eighth in a 1-0 ballgame at Dodger Stadium – the possible outcomes and their
corresponding WPA were:

Team Rock Paper Scissors Gelblum, Laucys, Saperstein, Sodha
MBA 211 6 5/13/2010
Exhibit 3 – Possible Outcomes and their WPAs
Outcome Win Probability Added
(Dodgers)
Single 7.40%
Double 12.90%
Triple 22.10%
HR 33.70%
Out -4.50%
Strikevi -1.50%
Ball 1.85%
Using these win probabilities, we were then able to weigh the likelihood of each outcome
occurring with its effects on the Dodger’s overall chance of winning the game. For example, when
Anderson swings, a ball is no longer an option. Therefore, the possible outcomes are a single, a
double, a triple, a home run, an out, or a strike. Based on all of the at-bats in his career, we can
calculate Anderson’s likelihood of each outcome when he makes contact as well as his probability of
making contact when he swings at a ball in the zone. Therefore,
Payoff of an Anderson Swing in the Zone:
(Contact rate x WPA/hit) + (out/contact x WPA/out) + (1-contact rate) x WPA/strike
Where WPA/hit is:
WPA x (1B/contact) + WPA x (2B/contact) + WPA x (3B/Contact) + WPA x (HR/Contact)
Using this equation for all four outcomes, we can determine Anderson’s payoff in all four
scenarios. As baseball is a zero-sum game, we can then assume that any increase in the Dodger’s

Team Rock Paper Scissors Gelblum, Laucys, Saperstein, Sodha
MBA 211 7 5/13/2010
chance of winning is equivalent to a decrease in the Giants probability of winning. Therefore, we
can fill in the two-by-two matrix as:
Exhibit 4 – Payoff table
Each payoff is the expected percentage change in the player’s team’s likelihood of winning the game.
Equilibrium
In this situation, the only equilibrium is a mixed strategy. This strategy can be calculated by
determining the point at which Anderson is indifferent between swinging and not swinging, and
Zito is indifferent as to whether he pitches inside the zone.
By setting a probability to each outcome and equalizing the expected value from both
possible actions, we can determine that the Nash Equilibrium occurs when Zito pitches in the zone
46.3% of the time, while Anderson swings 87.9% of the time. This outcome leads to equilibrium at
an Expected Return of (.298%, -.298%), where Anderson’s at-bat is expected to increase the
Dodgers’ win probability by 0.3%. Given their history and skills, if both players maximized their
actions Anderson would still have the upper hand, albeit it by very little.

Team Rock Paper Scissors Gelblum, Laucys, Saperstein, Sodha
MBA 211 8 5/13/2010
Outcome
Unfortunately for the Giants, Zito did not pitch inside the zone 46.3% of the time. Of Zito’s
6 pitches to Anderson, 5 were out of the zone, and Anderson was able to lay off 4 of them and draw
a walk.
Exhibit 5 –Zito’s pitches against Anderson
This resulted in a walk, and an increase in the Dodgers’ probability of winning of 7.4%.
Sergio Romo v. Manny Ramirez
After Zito walked Anderson, Bruce Bochy brought in reliever Sergio Romo. Not surprisingly
(given the game tree), the Dodgers used Manny Ramirez as a pitch hitter, setting up a matchup that
would likely decide the outcome of the game. Romo throws primarily three pitches: a fastball (FB), a
slider (SL), and a changeup (CH).vii As Exhibit 6viii illustrates, these pitches are drastically different, as
his fastball averages 10 more miles per hour than his breaking pitches.

Team Rock Paper Scissors Gelblum, Laucys, Saperstein, Sodha
MBA 211 9 5/13/2010
Exhibit 6 –Romo’s Pitch pattern
Using game theory, we can inspect this at-bat on a deeper level, looking at the possible
outcomes and decisions on a pitch-by-pitch basis.
Payoffs
In order to inspect pitch selection issues, we cannot use WPA, as WPA is not calculated
based on the type of pitch thrown. However, Runs Above Average (RAA) has been catalogued and
calculated based on pitch typeix. RAA measures a hitter’s ability to create runs based on the pitch
that he sees. This statistic is then normalized per 100 pitches, although because we are looking at
results on a pitch-by-pitch basis, we have divided the number by 100 to determine RAA per pitch.
RAA is also measured for pitchers, although a positive RAA for a pitcher represents a run he did not
allow and thus a pitcher’s RAA actually measures Runs Below Average. Similar to WPA, this statistic
is symmetrical, allowing us to use it for pitch payoffs.
Based on the RAA statistics listed on fangraphs.com, we were able to compute payoffs for
Manny Ramirez and Sergio Romo. There is no data that details what occurs if a hitter expects a pitch
or is surprised by it. Therefore, in order to build this into our model and ensure that the hitter’s
payoffs are somewhat dependent on the talent of the pitcher he is facing, we created payoffs based
on the following rules:
Team Rock Paper Scissors Gelblum, Laucys, Saperstein, Sodha
MBA 211 10 5/13/2010
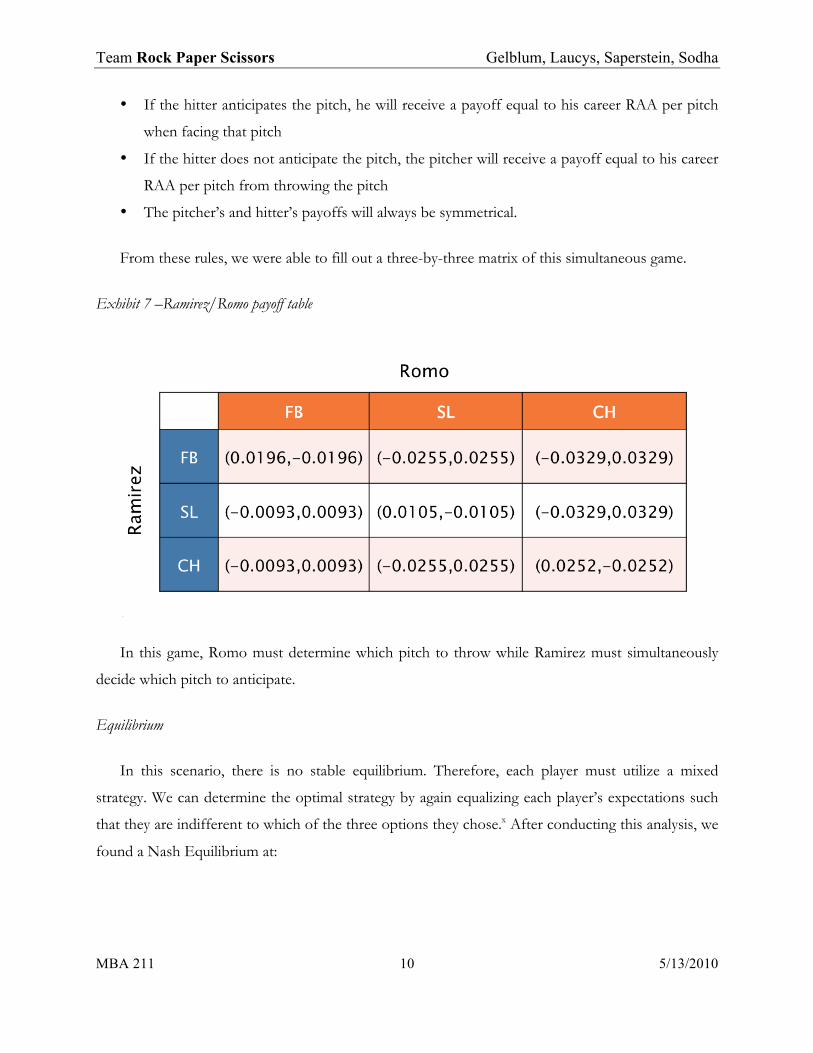
• If the hitter anticipates the pitch, he will receive a payoff equal to his career RAA per pitch
when facing that pitch
• If the hitter does not anticipate the pitch, the pitcher will receive a payoff equal to his career
RAA per pitch from throwing the pitch
• The pitcher’s and hitter’s payoffs will always be symmetrical.
From these rules, we were able to fill out a three-by-three matrix of this simultaneous game.
Exhibit 7 –Ramirez/Romo payoff table
In this game, Romo must determine which pitch to throw while Ramirez must simultaneously
decide which pitch to anticipate.
Equilibrium
In this scenario, there is no stable equilibrium. Therefore, each player must utilize a mixed
strategy. We can determine the optimal strategy by again equalizing each player’s expectations such
that they are indifferent to which of the three options they chose.x After conducting this analysis, we
found a Nash Equilibrium at:

Team Rock Paper Scissors Gelblum, Laucys, Saperstein, Sodha
MBA 211 11 5/13/2010
Exhibit 8 –Manny/Romo equilibrium calculation
At this equilibrium, the expected payouts are (-.00749, .00749), so Romo has a very slight
upper hand. These payouts are regardless of the count, so they do not change based on the specific
situation in the at-bat. If either player were to change his tendencies based on the count, the other
player could capitalize on this change by altering his strategy and increasing his expected return.
Outcome
Even though there is constant equilibrium based on the above game theory analysis, Romo’s
tendencies change based on the pitch count. As the pitch count tilts more in his favor, Romo begins
to use his fastball more sparingly, presumably because he believes that his slider is his strongest
strikeout pitch. In a vacuum, the RAA numbers support this hypothesis, as his career RAA for his
fastball is by far the lowest of his three pitches (.0055) while the RAA for his changeup and slider are
much stronger (.0345 and .0281, respectively). However, hitters also study these habits and are able
to increase their odds of creating a run at the plate by knowing what to expect from the pitcher.
In his at-bat against Romo, Manny Ramirez watched the first three pitches, bringing the
count to 1-2. At this point, Romo traditionally throws a fastball 12% of the time, a slider 53% of the
time, and a change-up 35% of the time. Based on his payoffs, Ramirez’s best response to these
pitching proportions is to wait on the changeup, increasing his expected payoff by .00168 runs
above average. While this is a small change, in baseball it can be enough.
On the 1-2 pitch, Romo threw a hanging breaking ball, and Ramirez crushed it for a home
run. The Dodgers went up 2-1, and their WP increased by 57.9%. The Dodgers went on to win the
game by that final score.

Team Rock Paper Scissors Gelblum, Laucys, Saperstein, Sodha
MBA 211 12 5/13/2010
Did Romo learn anything?
Based on this game theoretic analysis, Romo needs to throw his fastball more often – ideally
43% of the time. However, over the next several games his pitching led to a decrease in the Giants
WPA by greater than 30% on at least two occasions.xi
After the Dodgers game, Romo seemed to realize that he had to throw more fastballs – in
the next eight games, 50.7% of his 128 pitches were fastballs. However, this increase was driven
primarily by an overreaction in the first few games following the Manny home run – Romo began
throwing so many fastballs that hitters began to expect them. He then responded by
overcompensating back to the other extreme, and again began throwing too few fastballs. Romo’s
tendency to drastically overreact can be seen in Exhibit 9, where Romo’s 2010 pitch selection
tendencies show huge swings in fastball and slider percentages.
Exhibit 91 –Romo’s pitch selection
On Tuesday, May 4th, Romo came in against the Florida Marlins with the Giants up 4-3.
Over the first five batters, he threw 26 pitches, 61.5% of which were fastballs. While this is a very
small sample size, it appears that Romo was overcompensating coming out of his mistake against
1 Fangraphs.com

Team Rock Paper Scissors Gelblum, Laucys, Saperstein, Sodha
MBA 211 13 5/13/2010
Ramirez. On his sixteenth fastball, second baseman Dan Uggla hit a three run homerun to give the
Marlins the lead.
Less than a week later (May 7th), Romo faced the New York Mets in the bottom of the ninth.
Again, in a tight situation, everyone knew that Romo was going to throw a breaking pitch, and Mets
catcher Rod Barajas drove a 1-0 pitch out of the park to win the game. While the sample size is too
small to extrapolate any overarching trends (11 pitches), interviews with the players and managers
emphasized that Romo had continued to again lean too heavily on his breaking pitches. As the San
Jose Mercury reported the next dayxii:
It was obvious to everyone that Romo leaned way too heavily on his slider last night, even while it
also became clear that it didn’t have its usual snap. Barajas could barely swing a bat because he got
hit on the glove hand by Eli Whiteside’s bat two innings earlier, but he told reporters that he knew
Romo was in love with his slider and he got the pitch he was looking for.
This is Romo’s great internal monologue: He was upset at himself for giving up a homer on a
fastball to Dan Uggla in Florida on Tuesday. He vowed he wouldn’t get beaten on his second-best
pitch again. But that decision seems to have backfired against the Mets.
While the equilibrium strategy does not change with the count, Romo’s approach does. Due
to this change, Romo has been less effective in 1-2 counts then he is in 2-1, 0-2, or 2-2 counts (as
measured by OBP)xiii. Clearly, hitters know what to expect in 1-2 counts and are able to capitalize on
this knowledge.
Shortcomings of the Model
In developing our model for the optimal pitcher and batter strategies, we relied on extensive
statistics compiled by various data sources. We determined payoffs by looking at the Win
Probability Added, the Runs Above Average, and the players’ career statistics and tendencies.
However, we had to make some assumptions about the payoffs to conduct analysis and arrive at
conclusions on optimal strategies, even though we recognize that every situation is unique and that
statistics (and therefore payoffs in general) are situation-dependent. For example, there are many
Team Rock Paper Scissors Gelblum, Laucys, Saperstein, Sodha
MBA 211 14 5/13/2010
factors that may change the effectiveness of Romo’s sliders in a given situation, such as the weather,
Romo’s stamina, and even mental issues such as confidence.
Furthermore, in some cases we had small sample sizes and thus the data was not statistically
significant. For example, Romo had only faced Ramirez twice before their battle on April 18th.
Therefore, we had to make assumptions and calculate payoffs based on career statistics in similar
situations.
In order to provide the largest possible sample size, we utilized data spanning the entire
career of the players. Thus, any improvement or deterioration in the skills of the players over time
may be hidden by overall career results and our conclusions may not adequately reflect the players’
most recent abilities. Our model additionally does not incorporate the effects of fatigue or
loosening up of a pitcher, where the pitcher’s performance may decline or improve as the number of
pitches thrown increases. Similarly, we did not include any momentum effects in calculating WPA,
which merely looks at the change in WPA based on the outcome of similar plays across historical
data.
Using the calculated payoffs in the Ramirez/Romo at bat, we were able to determine an
equilibrium strategy. However, the payoffs for each individual at-bat are different, depending on the
skills of both the hitter and pitcher. Therefore, Romo’s optimal strategy will change based on the
hitter he is facing; however, we used season-wide tendencies to evaluate the efficacy of his strategy.
Due to small sample sizes, this is the only way to measure overarching pitch tendencies. In addition,
there is no data on hitter’s success given a certain pitch in a specific count, which would have added
another level to our analysis.
Lastly, when looking at the bottom of the eighth inning, we simplified the decision tree by
looking at three possible hitters (Ramirez, Anderson, and Dewitt) and two possible pitchers (Zito
and Romo). However, the Giants had several other options, as did the Dodgers. The decision tree
we inspected is merely one piece of a much larger, nine-inning tree.
Our simplifying assumptions may leave out crucial details that are part of the managers’
decisions on a play-by-play basis. However, by stripping these non-quantifiable aspects of the

Team Rock Paper Scissors Gelblum, Laucys, Saperstein, Sodha
MBA 211 15 5/13/2010
strategy out of our analysis, we are able to determine optimal strategies for the Giants and Dodgers
in this half inning. This in turn allows us to make conclusions on a larger scale.
Overall Conclusions
In analyzing the Giants-Dodgers game, we came to appreciate the utter complexity of
baseball. There are numerous game theoretic decisions that have to be made involving probabilities,
mixed strategies and signaling. Looking forward and reasoning back quickly becomes very complex
as the order of various possible pitchers and hitters intermix with several possible outcomes for each
match-up. These micro-decisions lead to an infinitely large decision tree incorporating thousands of
miniscule possibilities.
Nevertheless, decision trees can be utilized to allow a coach to make the best decision
possible about which player to put up to bat and in what order. Based on WPA, looking forward
and reasoning back suggests that Romo should have been brought in to face Garrett Anderson.
In addition, we analyzed pitch selection separately from the decision to pitch in or out of the
zone. In reality, both decisions are made simultaneously, adding an extra layer of complexity. For
example, in the Romo v. Ramirez at-bat, this would lead to a six-by-six matrix (Slider in the zone,
slider out of the zone, fastball in the zone, etc.). However, by breaking these two decisions apart, we
are able to clearly see the importance of minimizing predictability and employing mixed strategies.
Batters and pitchers must utilize mixed strategies to keep their opponent from anticipating
their moves and taking advantage of their tendencies. In the case of Zito versus Anderson, Zito
should pitch in the zone 46% of the time and Anderson should swing 87% of the time. Any
deviation from these percentages gives the other player an opportunity to increase his expected
value by changing his strategy as well. In particular, just because a pitch is a pitcher’s “best,” does
not mean that it is his most “valuable.” Statistics show that Romo pitches sliders and changeups
much more and fastballs much less than his optimal strategy would suggest. Because Romo’s
changeup and sliders are considered his best pitches, he relies on them, particularly in strikeout
situations. However, his ability to achieve optimal results is mitigated by his over-reliance on his
strongest pitches, which thus makes them less effective. Romo would be an even better pitcher if he
mixed in his fastball more often in order to keep batters off balance. A pitcher’s success is based
Team Rock Paper Scissors Gelblum, Laucys, Saperstein, Sodha
MBA 211 16 5/13/2010
not only on the quality of his pitches but also his ability to keep the batter off-kilter. Currently,
given the effectiveness of Romo’s pitches along with his non-optimal pitching tendencies, Ramirez’s
best response is to always expect a changeup. Unless he moves towards his equilibrium strategy,
Romo will not be successful against talented Major League hitters.
In this game, we saw that the Giants veered several times from their optimal strategy.
Instead of choosing Romo to pitch against Anderson, Giants Manager Bruce Bochy chose Zito.
Instead of pitching 46% in the zone, Zito pitched 17% in the zone. Finally, Romo chose to rely on
his changeup when facing Ramirez, and Ramirez successfully turned on one for a home run. Would
the Giants have been more successful had they chosen their pitching strategies more wisely?
Baseball is a game of probabilities, and it is impossible to predict the future with certainty. However
we do know that the numbers would have been more favorable had they analyzed the game theory
of baseball. If the Giants had looked forward and reasoned back, they would have put in Romo to
face Garret Anderson, and if Romo had analyzed Manny’s abilities, he would have realized the
importance of selecting pitches at an equilibrium level. If the Giants and their players had made
these slight changes, they would have been more likely to have ended April 18th with a victory, rather
than a defeat.
i http://en.wikipedia.org/wiki/Baseball ii http://en.wikipedia.org/wiki/Giants_dodgers_rivalry iii http://sports.espn.go.com/mlb/recap?gameId=300418119&source=ESPNHeadlines iv In instances where the sample size was too small, an average was taken of the pitcher’s OBP in the eighth inning, and the batters OBP in the same late-‐inning situation. This allowed us to take into account the trends for both the hitter and pitcher. v For the simplicity of analysis, we are approaching this as a simultaneous game. Admittedly, the pitcher must decide first, and then the batter has an opportunity to react. However, before the pitch is thrown, the batter must decide what to anticipate, and thus affects the final result. Therefore, while this is not a perfectly simultaneous game, concurrent decisions are crucial to the outcome. vi WPA is calculated per outcome, not per pitch. Therefore, we calculated strikes as 1/3 of an out, while balls are 1/4 of a walk. While this is not perfect (given that the WPA would change per pitch as the count changes), in this simple model it allows us to view each pitch individually.
Team Rock Paper Scissors Gelblum, Laucys, Saperstein, Sodha
MBA 211 17 5/13/2010
vii Romo also rarely throws a two-‐seam fastball that we are grouping with his four-‐seamer. His slider is also occasionally mistaken for a curveball. Different data sources identify pitches differently; the classifications for our analysis are from fangraphs.com. viii Fangraphs.com ix RAA data is from Fangraphs.com. While RAA is not a perfect corollary with output (given that it is dependent on “average”), it is the only statistic that tracks success based on pitch selection. x We set a, b, and c as Romo’s probabilities. Then, we established (.0196a -‐ .0255b -‐ .0329c) as equal to both (-‐.0093a + .0105b -‐ .0329c) and (-‐.0093a -‐ .0255b + .0252c). As c = 1-‐a-‐b, we had three equations and three variables, and were therefore able to solve for a, b, and c. Ramirez’s strategy was then determined using the same method. This point is at equilibrium, as neither player has a profitable deviation. xi WPA of Romo’s appearances figures come from fangraphs.com xii San Jose Mercury, blog by Andrew Baggarly, http://blogs.mercurynews.com/extrabaggs/2010/05/08/pregame-‐notes-‐bochy-‐plans-‐to-‐back-‐off-‐sergio-‐romo/ xiii Data from Baseball-‐reference.com