Embed Size (px)
Citation preview
0361-0128/01/3430/692-22 $6.00 691
The Gandy and Abolhassani Epithermal Prospects in the Alborz Magmatic Arc, Semnan Province, Northern Iran
GHOLAM HOSSEIN SHAMANIAN,†,*Department of Geology, University of Shahid Beheshti, Tehran, Iran
JEFFREY W. HEDENQUIST, KÉIKO H. HATTORI,Department of Earth Science, University of Ottawa, Ottawa, Ontario K1N 6N5, Canada
AND JAMSHID HASSANZADEH
Department of Geology, University of Tehran, Tehran, Iran
AbstractThe Gandy and Abolhassani epithermal precious and base metal deposits occur in the Torud-Chah Shirin
mountain range in the Alborz magmatic belt of northern Iran. The mountain range is considered to be part ofthe Paleogene Alborz volcanic arc. The exposed rocks in the study area consist of a volcaniclastic sequence ofthin-bedded siltstones and sandstones, lapilli tuffs, volcanic breccias, and intermediate lava flows at Gandy, andmostly andesitic flows at Abolhassani. The flows are middle to upper middle Eocene age and they show a typ-ical arc geochemical signature, with low concentrations of Nb, Ta, Zr, Hf, and Ti.
Variable hydrothermal alteration occurs in scattered outcrops, covering about 4 km2 at Gandy and 1 km2 atAbolhassani. The Gandy and Abolhassani areas are about 3 km apart, and each contains a small abandoned Pb-Zn mine. Mineralization at Gandy occurs in quartz sulfide veins and breccias and is accompanied by alterationhalos of quartz, illite, and calcite up to 2 m wide. The mineralization is divided into three main stages: brec-ciation (I), fracture filling (II), and crustiform banding (III). Stage I is economically important in terms of pre-cious metal content. Stage II consists of four substages and contains the majority of base metal ore with quartz,calcite, and barite. Native gold is commonly found within partially oxidized pyrite and secondary iron (hydr)ox-ides such as goethite in stage I and coexists with galena and chalcopyrite in stage II. The final stage is domi-nated by quartz and calcite. Mineralization in the Abolhassani veins occurred in three main stages. The firsttwo stages, which are economically important, contain similar mineral assemblages, including quartz, calcite,barite, galena, sphalerite, pyrite, and chalcopyrite, whereas the final stage is dominated by quartz and calcite.No gold grains were found in the Abolhassani samples. The average (max) assays from 14 channel samples ofGandy veins are 14.5 (68.3) g/t Au, 30.6 (161) g/t Ag, 3.1 (13) wt percent Pb, 0.84 (3.8) wt percent Zn, and 1.0(6.3) wt percent Cu. For comparison, the values from 19 channel samples of Abolhassani veins are 0.85 (6.0)g/t Au, 29.5 (115) g/t Ag, 6.4 (16.5) wt percent Pb, 1.2 (5.2) wt percent Zn, and 0.83 (7.7) wt percent Cu.
Fluid inclusion and sulfur isotope compositions were analyzed for the sulfide-sulfate assemblages of stageII at Gandy and stages I and II at Abolhassani. In both cases fluid inclusion assemblages were examinedmostly in subhedral crystals of sphalerite. The average homogenization temperatures (Th) and salinities offluid inclusion assemblages from Gandy range from 234° to 285°C, with a peak at about 250°C and 4.2 to 5.4wt percent NaCl equiv. These Th values are in good agreement with isotopic temperatures from two spha-lerite and galena pairs (236° and 245°C). The temperature and salinity values in fluid inclusion assemblagesfrom the Abolhassani deposit range from 234° to 340°C and 6.7 to 18.7 wt percent NaCl equiv. Sulfide pairsof sphalerite-galena do not give reasonable isotopic equibrium temperatures at Abolhassani. Comparison ofTh versus ice melting (Tm(ice)) values for the two deposits indicates the presence of a moderate-salinity fluid(5–6 wt % NaCl equiv) of similar temperature (~250°C) in each deposit but with a higher temperature andsalinity component also present at Abolhassani. The base metal-rich mineralization at Abolhassani may thushave been caused by the periodic injection of this higher salinity fluid. The Abolhassani deposit has a higheraverage Ag/Au ratio (~35) and Pb + Zn concentration (up to 7.6 wt %) than Gandy (Ag/Au ~ 2 and 3.9 wt %),consistent with this interpretation.
The minimum depth of formation was at least 430 m below the paleowater table for Gandy and possibly asmuch as 600 m at Abolhassani. The lower grades of gold and the presence of higher salinity fluids at Abolhas-sani suggest that the occurrence of higher grade precious metal zones is unlikely at greater depth. By contrast,Gandy may have potential at depth for extensions of the high-grade gold veins. Exploration in the region shouldfocus on areas with geologic evidence for relatively little posthydrothermal erosion, <200 to 300 m, thus in-creasing the preservation potential of epithermal veins with high gold grades, similar to those at Gandy. Resultsfrom Gandy and Abolhassani may aid exploration and assessment of the numerous, untested epithermal andrelated prospects along this 1,800-km-long volcanic belt in northern Iran.
©2004 by Economic GeologyVol. 99, pp. 691–712
† Corresponding author: email, [email protected]*Present address: Department of Geology, Faculty of Science, Gorgan University of Agricultural Sciences and Natural Resources, Gorgan, Golsten
Province, Iran.

IntroductionTHE TORUD-CHAH SHIRIN mountain range of SemnanProvince is located in the eastern part of the Alborz mountainsystem, which crosses northern Iran for about 1,800 km fromthe border with Afghanistan in the east to the Caucasus bor-der in the northwest (Fig. 1). A regional stream-sedimentgeochemical survey in the first half of the 1990s by the Geo-logical Survey of Iran located a number of precious metalanomalies that have subsequently been traced to sourcesfrom epithermal prospects. This paper describes the epither-mal occurrences of this region and focuses on two suchprospects, Gandy and Abolhassani, in the Moaleman area,~300 km east of Tehran. The Gandy and Abolhassani areas,located at 35° 20' N and 54° 38' E, are characterized by highprecious and base metal anomalies, respectively. This papercompares these two prospects and discusses their relativedepths of erosion and the significance for exploration in theregion.
The Gandy and Abolhassani areas are about 3 km apart(Fig. 1) and each contains a small abandoned Pb-Zn mine.They were in operation from 1960 to 1970. There are manyother showings and abandoned mines of mostly base metalveins in the Torud-Chah Shirin range. The regional geo-chemical exploration project from 1990 to 1996 covered42,000 km2 in north-central Iran, producing 26 map sheets ata scale of 1:100,000, including the Torud-Chah Shirin range(Geological Survey of Iran, 1995). Based on the survey re-sults, five districts were considered prospective, including
Gandy and Abolhassani, and were recommended for detailedprospecting for Au, Cu, Pb, and Zn.
Field observations and data collected prior to this study(Geological Survey of Iran, 1995; Kousari, 2001) suggestedthat these two areas host precious as well as base metal min-eralization of epithermal character. These include: (1) typicalhost rocks (volcanic, volcaniclastic, and sedimentary rocks);(2) deposit form (vein and breccia); (3) vein textures such asfine and coarse bands, crustiform bands, and hydrothermalbreccias; (4) gangue minerals such as quartz, carbonate, andbarite; (5) sulfides such as galena, sphalerite, chalcopyrite,pyrite; and (6) enrichment of Au, Ag, As, Sb, Hg, Pb, and Zn.
Earlier work in the area (Geological Survey of Iran, 1995)focused on the regional geology and geochemical exploration.The present study includes mapping of host rocks, alteration,and veins at a scale of 1:50,000, examination of the composi-tion of ore minerals and the alteration assemblages, mi-crothermometry of fluid inclusion assemblages, and sulfurisotope analysis of sulfide and sulfate minerals. These datahelp constrain the ore-forming environment and the depth oferosion of the exposed veins, the latter a critical feature in de-termining the depth potential of these prospects.
Regional SettingThe Torud-Chah Shiran range lies in the central to eastern
portion of the Alborz mountain system, a mountain chain ofcomplex tectonic, magmatic, and stratigraphic history (sum-marized by Alavi, 1996). On the basis of regional tectonic con-siderations, Alavi (1991, 1996) suggested that the Torud-ChahShiran range and volcanic rocks in the adjacent areas are re-lated to Eocene magmatism in the Central Iran magmaticzone to the south and not to the volcanic rocks of the Alborzmagmatic belt to the west. The distribution of Tertiary ig-neous rocks shows that the western portion of the Alborz arcmerges with another Tertiary calc-alkaline magmatic belt, theUrumieh-Dokhtar zone, which runs parallel to the mainnorthwest-trending Zagros thrust (Fig. 1). Recently, Hassan-zadeh et al. (2002) suggested that the two belts were once asingle arc but separated by intra-arc extension that started inthe late Eocene. Based on the latter view, the Alborz mag-matic belt includes Torud-Chah Shiran and represents thenorthern half of the proto-arc. This arc is characterized bythick accumulations of early to middle Eocene submarinegreen tuffs (equivalent to the Karaj Formation of central andwestern Alborz), followed by late Eocene, to possibly earlyOligocene, submarine to subaerial lava flows which locally in-clude nepheline-normative and shoshonitic rocks. A series ofsilica-saturated volcanic rocks occur locally. The intra-arcspreading formed sedimentary basins between the Alborzrange and Central Iran, an area characterized by Oligocenemafic-alkaline magmatism (Hassanzadeh et al., 2002). Chem-ical compositions of volcanic rocks presented below indicatethat Torud-Chah Shiran rocks have a typical arc signature,consistent with this proposed interpretation.
The Torud-Chah Shirin range consists mainly of igneousrocks of Tertiary age, although there are also scattered out-crops of metamorphosed Paleozoic and Mesozoic rocks.Peak magmatic activity occurred from middle to possiblylate Eocene and has been divided into three stages, fromoldest to youngest (Fig. 2; Hushmandzadeh et al., 1978) as
692 SHAMANIAN ET AL.
0361-0128/98/000/000-00 $6.00 692
Torud
Kuh-e-Razeh ShotorKuh
Moaleman
Torud-Chah Shirin
CaspianSea
Tehran
Persian Gulf
Anjilow Fault
Torud Fault35 30'o
54 30'o
0 20 km
GandyAbolhassani
PCH
CM
BGCL
KJR
T
b)a)
N
AMB
UDIran
Afghan-istan
MZT
Fig. 1b
FIG. 1. Location of two main Tertiary volcanic belts in Iran: the NW-trending Urumieh-Dokhtar (UD) zone, which runs parallel to the main Za-gros thrust (MZT) cutting central Iran, and the Alborz magmatic belt (AMB)in northern Iran. The Central Iranian Eocene volcanic zone, also called Lutvolcanic rocks, is located between the AMB and the MZT in eastern Iran andnot shown in the diagram. The exposed rock units of the Torud (T) area in-clude the Paleozoic Shotor-Kuh range, the Mesozoic Kuh-e-Reza range, andthe Paleogene Torud-Chah Shirin range. A variety of epithermal and otherdeposit types occur in the Torud-Chah Shirin mountain range in addition tothose in the Gandy and Abolhassani prospects. District names: BG = Baghu,CH = Cheshmeh Hafez, CL = Chalul, CM = Chahmessi, KJ = Khanjar, P =Pousideh, R = Reshm. Modified from Hushmandzadeh et al. (1978).
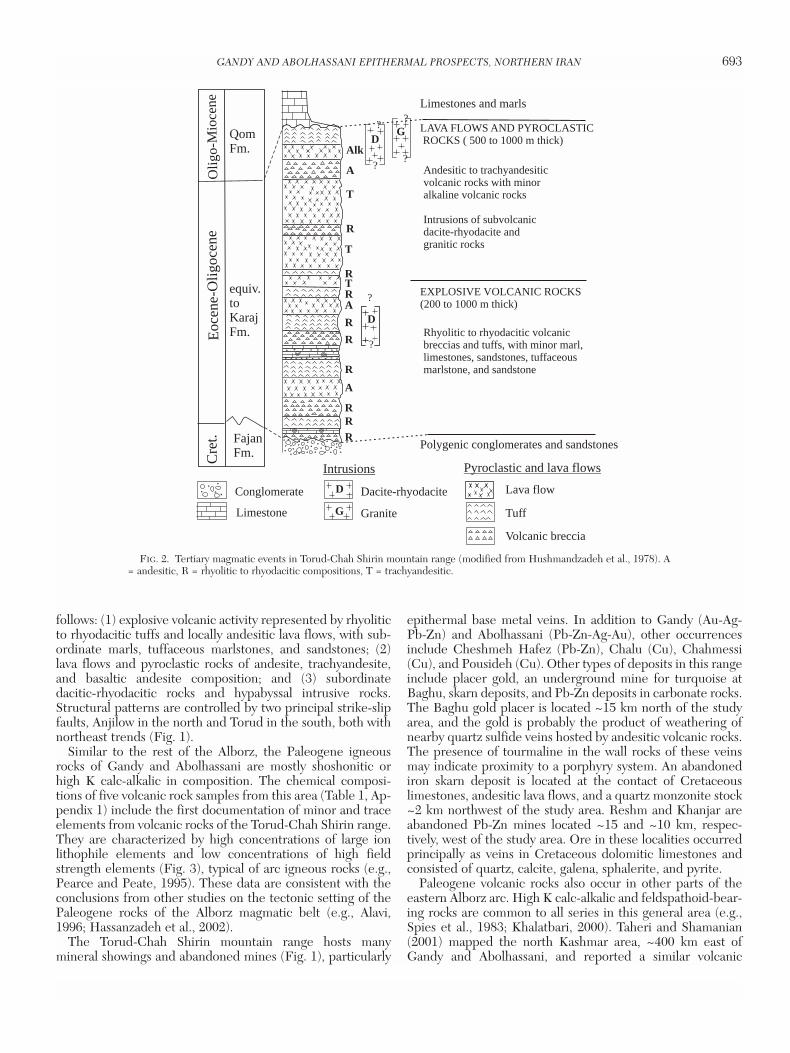
follows: (1) explosive volcanic activity represented by rhyoliticto rhyodacitic tuffs and locally andesitic lava flows, with sub-ordinate marls, tuffaceous marlstones, and sandstones; (2)lava flows and pyroclastic rocks of andesite, trachyandesite,and basaltic andesite composition; and (3) subordinatedacitic-rhyodacitic rocks and hypabyssal intrusive rocks.Structural patterns are controlled by two principal strike-slipfaults, Anjilow in the north and Torud in the south, both withnortheast trends (Fig. 1).
Similar to the rest of the Alborz, the Paleogene igneousrocks of Gandy and Abolhassani are mostly shoshonitic orhigh K calc-alkalic in composition. The chemical composi-tions of five volcanic rock samples from this area (Table 1, Ap-pendix 1) include the first documentation of minor and traceelements from volcanic rocks of the Torud-Chah Shirin range.They are characterized by high concentrations of large ionlithophile elements and low concentrations of high fieldstrength elements (Fig. 3), typical of arc igneous rocks (e.g.,Pearce and Peate, 1995). These data are consistent with theconclusions from other studies on the tectonic setting of thePaleogene rocks of the Alborz magmatic belt (e.g., Alavi,1996; Hassanzadeh et al., 2002).
The Torud-Chah Shirin mountain range hosts manymineral showings and abandoned mines (Fig. 1), particularly
epithermal base metal veins. In addition to Gandy (Au-Ag-Pb-Zn) and Abolhassani (Pb-Zn-Ag-Au), other occurrencesinclude Cheshmeh Hafez (Pb-Zn), Chalu (Cu), Chahmessi(Cu), and Pousideh (Cu). Other types of deposits in this rangeinclude placer gold, an underground mine for turquoise atBaghu, skarn deposits, and Pb-Zn deposits in carbonate rocks.The Baghu gold placer is located ~15 km north of the studyarea, and the gold is probably the product of weathering ofnearby quartz sulfide veins hosted by andesitic volcanic rocks.The presence of tourmaline in the wall rocks of these veinsmay indicate proximity to a porphyry system. An abandonediron skarn deposit is located at the contact of Cretaceouslimestones, andesitic lava flows, and a quartz monzonite stock~2 km northwest of the study area. Reshm and Khanjar areabandoned Pb-Zn mines located ~15 and ~10 km, respec-tively, west of the study area. Ore in these localities occurredprincipally as veins in Cretaceous dolomitic limestones andconsisted of quartz, calcite, galena, sphalerite, and pyrite.
Paleogene volcanic rocks also occur in other parts of theeastern Alborz arc. High K calc-alkalic and feldspathoid-bear-ing rocks are common to all series in this general area (e.g.,Spies et al., 1983; Khalatbari, 2000). Taheri and Shamanian(2001) mapped the north Kashmar area, ~400 km east ofGandy and Abolhassani, and reported a similar volcanic
GANDY AND ABOLHASSANI EPITHERMAL PROSPECTS, NORTHERN IRAN 693
0361-0128/98/000/000-00 $6.00 693
Alk
Polygenic conglomerates and sandstones
EXPLOSIVE VOLCANIC ROCKS(200 to 1000 m thick)
Rhyolitic to rhyodacitic volcanicbreccias and tuffs, with minor marl,limestones, sandstones,marlstone, and sandstone
tuffaceous
LAVA FLOWS AND PYROCLASTICROCKS ( 500 to 1000 m thick)
Andesitic to trachyandesiticvolcanic rocks with minoralkaline volcanic rocks
Intrusions of subvolcanicdacite-rhyodacite andgranitic rocks
T
Limestones and marls
?D
?
??
D
?
?
T
T
A
Cre
t.E
ocen
e-O
ligoc
ene
Olig
o-M
ioce
ne
QomFm.
FajanFm.
equiv.toKarajFm.
G
Limestone
Conglomerate
Tuff
Volcanic breccia
Pyroclastic and lava flows
A
D Dacite-rhyodacite
G Granite
Intrusions
Lava flow
RRR
R
R
R
R
R
R
A
FIG. 2. Tertiary magmatic events in Torud-Chah Shirin mountain range (modified from Hushmandzadeh et al., 1978). A= andesitic, R = rhyolitic to rhyodacitic compositions, T = trachyandesitic.
series. Geochemical prospecting by the Geological Survey ofIran has led to discoveries of anomalies and ore occurrencesassociated with these rocks, including the Arghash deposit(Au-Sb), located ~50 km south of Nishabour. The mineraliza-
tion at Arghash occurs in veins which consist of microcrys-talline quartz with calcite, stibnite, pyrite, and chalcopyrite(Shamanian, 1998). The grade in the quartz-calcite veinsranges up to 7 g/t Au. The presence of microcrystalline quartzand stibnite, and the low content of base metals in the veins,suggest that there may have been relatively little erosion ofthis epithermal prospect.
Local Geology
Gandy area
An area of about 8 km2 was mapped at Gandy. Outcropsconsist mainly of felsic pyroclastic rocks, intermediate lavaflows and volcanic breccias, and epizonal felsic intrusions(Fig. 4). The local stratigraphy, from oldest to youngest, com-prises the following:
1. A sequence of thin-bedded volcaniclastic siltstones andsandstones, with subordinate marlstones and tuffaceous sand-stones in the lower part, forms the basal section (sample Ga-M-41, Appendix 1). Rhyolitic tuffs and tuffaceous sandstoneswith intercalated thin chert beds occur in the upper section(samples Ga-M-31 and 79/H78, Appendix 1), which is lowermiddle Eocene in age based on the fossil record (Hush-mandzadeh, 1978). The thickness of individual tuff bedsvaries from 3 to 20 cm. In the Gandy area, this unit is about250 m thick.
2. Lapilli tuffs, volcanic breccias, and intermediate lavaflows (samples Ga-M-8, Ga-M-10, 79/H40, and TR-52-7, Ap-pendix 1), of middle Eocene age based on fossil evidence, un-conformably overlie the lower unit and are separated by a 20-m-thick basal conglomerate. This middle unit is about 200 mthick and is covered by a sequence of thin-bedded, coarse- tofine-grained sandstones and siltstones about 100 m thick(sample Zr-41, Appendix 1).
3. Rhyolitic to rhyodacitic domes (samples Ga-M-14 and79/H12, Appendix 1) are the youngest rocks in the area. It isdebatable whether they are Eocene or much younger in age.
694 SHAMANIAN ET AL.
0361-0128/98/000/000-00 $6.00 694
TABLE 1. Composition of Volcanic Rocks in the Gandy and Abolhassani Areas
Sample no. 79/H78 TR52-7 79/H40 TA1/6 79/A37Rhyolitic Basaltic
tuff Andesite Andesite andesite Andesite
SiO2 (wt %) 67.7 51.6 56.9 47.5 54.3TiO2 0.6 1.1 0.7 0.9 0.6Al2O3 12.6 16.6 16.5 14.5 13.7Fe2O3 1.2 7.9 3.1 8.3 5.7MnO 0.1 0.3 0.1 0.2 0.1MgO 0.2 1.3 0.3 7.6 1.1CaO 4.3 4.5 6.4 8.3 8.1Na2O <0.005 0.4 1.0 1.9 2.4K2O 4.7 5.8 4.0 1.9 3.4P2O5 0.2 0.6 0.2 0.3 0.3L.O.I 6.5 8.5 9.0 7.3 8.8Total 98.1 98.6 98.2 98.6 98.5V (ppm) 52 190 160 210 160Cr 79 140 31 360 76Co 1.5 18.2 3.1 34.4 13Ni 8.3 50 16 16 17Zn 29 136 14 150 42Rb 130 140 94 210 110Sr 150 150 180 590 190Y 127 18 18 17 12Zr 31 80 110 88 53Nb 4.7 18 9.6 7.0 6.0Ba 1,000 950 670 330 790La 26 31 28 16 22Ce 56 67 58 35 46Nd 25 31 26 19 24Pb 45 110 16 51 10Th 3.8 3.6 8.0 2.2 6.2U 1.4 1.4 2.3 0.9 1.7Ga 9.8 19 17 16 16Cu 87 200 9.7 92 0.1Mo 1.7 2.0 1.1 1.3 0.7Ag 230 79 98 86 36As 39 32 10 1.8 4.1Cd 0.1 0.3 <0.01 0.1 0.1Sb 6.4 8.8 1.9 3.0 1.1Bi 0.2 0.3 0.2 0.2 0.3W 1.3 1.5 1.5 0.4 0.5Sn 1.0 1.7 1.8 1.0 1.4Sc 4.1 13 12 19 14Pr 7.0 8.6 7.3 4.9 6.1Sm 4.7 6.0 5.5 4.3 4.9Eu 1.0 1.2 1.2 1.1 1.0Gd 3.5 5.5 4.6 4.1 3.9Tb 0.4 0.6 0.6 0.5 0.4Dy 2.6 4.1 3.6 3.7 2.6Ho 0.4 0.6 0.6 0.6 0.4Er 1.0 1.9 1.6 1.7 1.0Tm 0.1 0.2 0.2 0.2 0.1Yb 1.4 2.4 2.2 2.1 1.4Lu 0.1 0.2 0.2 0.2 0.1Hf 1.0 2.2 3.3 2.6 1.6Li 55 27 89 55 12Ta 0.3 1.0 0.7 0.4 0.4Cs 0.9 2.2 6.3 0.9 5.5
Notes: Major elements, Cr, and Zn determined by XRF; total Fe ex-pressed as Fe2O3; other elements determined by ICP-MS after digestionwith HF-HClO4-HNO3; analyses at the Ottawa-Carleton Geoscience Centre
1
10
100
1000
Rb
Ba
Th U K
Nb
TaL
aC
e Sr PSm
Zr
Hf
Eu
Ti
Gd
Dy
YY
bL
u
Nd
Roc
k/Pr
imiti
vem
antle
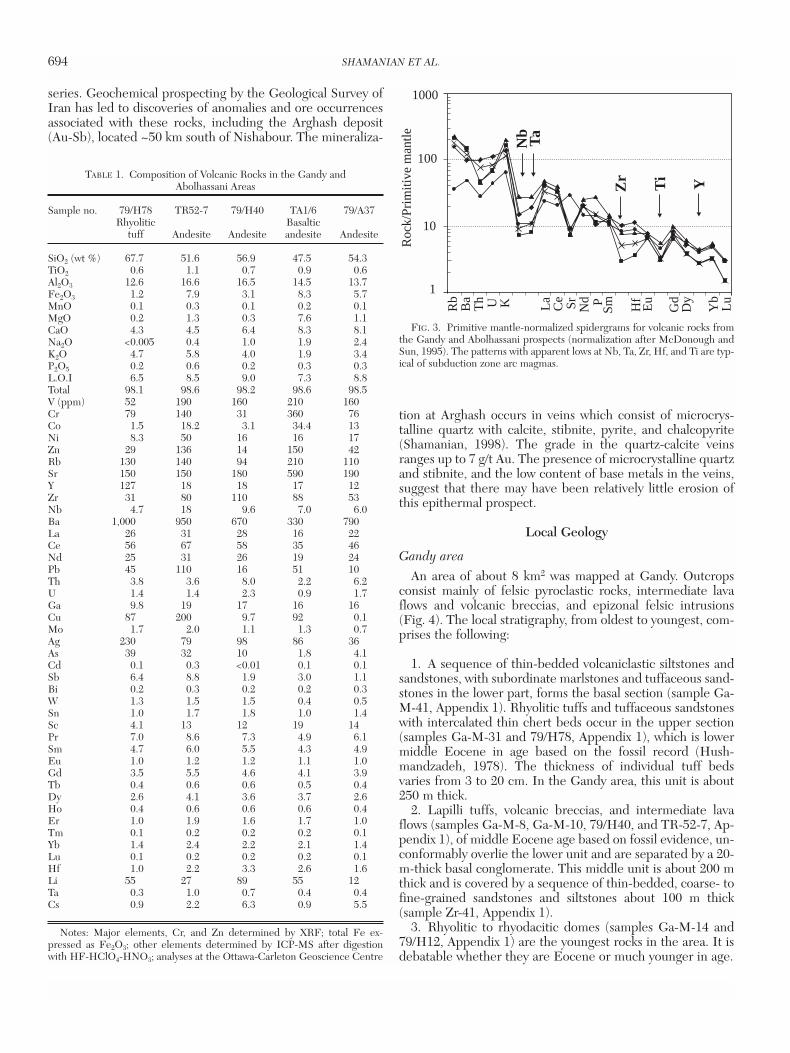
FIG. 3. Primitive mantle-normalized spidergrams for volcanic rocks fromthe Gandy and Abolhassani prospects (normalization after McDonough andSun, 1995). The patterns with apparent lows at Nb, Ta, Zr, Hf, and Ti are typ-ical of subduction zone arc magmas.
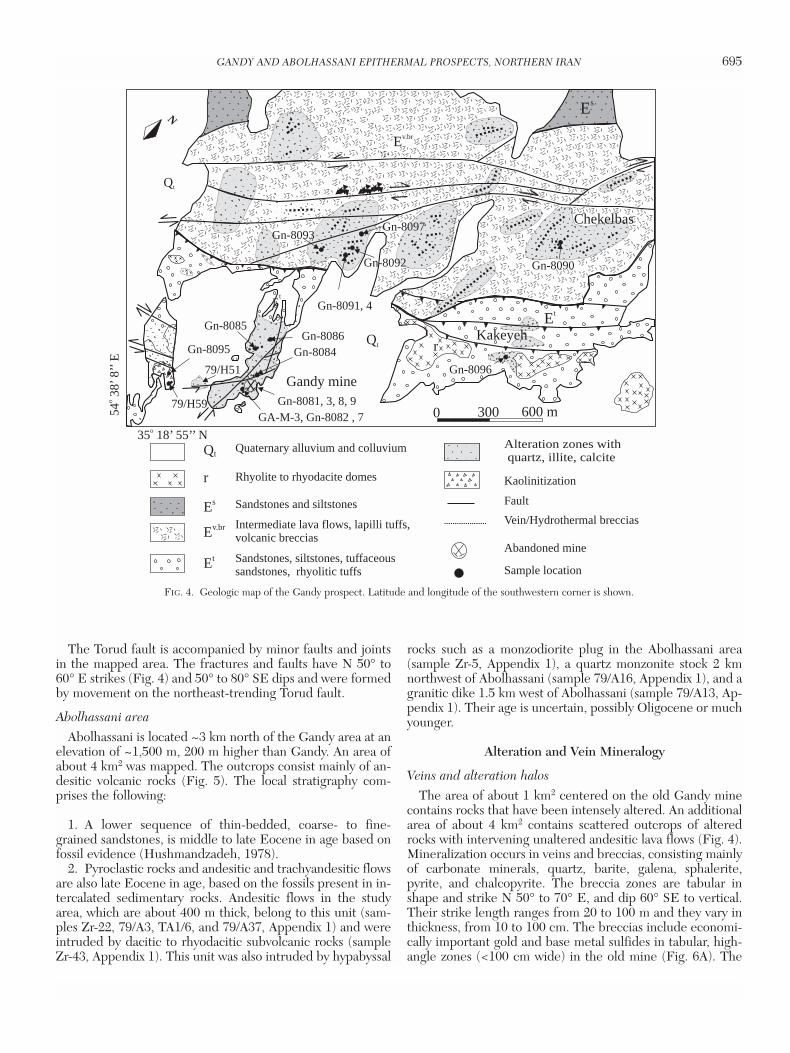
The Torud fault is accompanied by minor faults and jointsin the mapped area. The fractures and faults have N 50° to60° E strikes (Fig. 4) and 50° to 80° SE dips and were formedby movement on the northeast-trending Torud fault.
Abolhassani area
Abolhassani is located ~3 km north of the Gandy area at anelevation of ~1,500 m, 200 m higher than Gandy. An area ofabout 4 km2 was mapped. The outcrops consist mainly of an-desitic volcanic rocks (Fig. 5). The local stratigraphy com-prises the following:
1. A lower sequence of thin-bedded, coarse- to fine-grained sandstones, is middle to late Eocene in age based onfossil evidence (Hushmandzadeh, 1978).
2. Pyroclastic rocks and andesitic and trachyandesitic flowsare also late Eocene in age, based on the fossils present in in-tercalated sedimentary rocks. Andesitic flows in the studyarea, which are about 400 m thick, belong to this unit (sam-ples Zr-22, 79/A3, TA1/6, and 79/A37, Appendix 1) and wereintruded by dacitic to rhyodacitic subvolcanic rocks (sampleZr-43, Appendix 1). This unit was also intruded by hypabyssal
rocks such as a monzodiorite plug in the Abolhassani area(sample Zr-5, Appendix 1), a quartz monzonite stock 2 kmnorthwest of Abolhassani (sample 79/A16, Appendix 1), and agranitic dike 1.5 km west of Abolhassani (sample 79/A13, Ap-pendix 1). Their age is uncertain, possibly Oligocene or muchyounger.
Alteration and Vein Mineralogy
Veins and alteration halos
The area of about 1 km2 centered on the old Gandy minecontains rocks that have been intensely altered. An additionalarea of about 4 km2 contains scattered outcrops of alteredrocks with intervening unaltered andesitic lava flows (Fig. 4).Mineralization occurs in veins and breccias, consisting mainlyof carbonate minerals, quartz, barite, galena, sphalerite,pyrite, and chalcopyrite. The breccia zones are tabular inshape and strike N 50° to 70° E, and dip 60° SE to vertical.Their strike length ranges from 20 to 100 m and they vary inthickness, from 10 to 100 cm. The breccias include economi-cally important gold and base metal sulfides in tabular, high-angle zones (<100 cm wide) in the old mine (Fig. 6A). The
GANDY AND ABOLHASSANI EPITHERMAL PROSPECTS, NORTHERN IRAN 695
0361-0128/98/000/000-00 $6.00 695
Qt
Qt
EtE
t
r
Ev.br
35 18’ 55’’ No
5438
’8’’
Eo
Gandy mine
GA-M-3, Gn-8082 , 7
79/H51
79/H59
Kakeyeh
Chekelbas
Qt
r
Et
Es
Quaternary alluvium and colluvium
Rhyolite to rhyodacite domes
Sandstones and siltstones
Intermediate lava flows, lapilli tuffs,volcanic breccias
Sandstones, siltstones, tuffaceoussandstones, rhyolitic tuffs Sample location
Fault
Vein/Hydrothermal breccias
Abandoned mine
Ev.br
Kaolinitization
Alteration zones withquartz, illite, calcite
N
0 600 m300Gn-8081, 3, 8, 9
Gn-8085Gn-8086
Gn-8084
Gn-8090
Gn-8093
Gn-8095
Gn-8097
Gn-8091, 4
Gn-8092
Gn-8096
Es
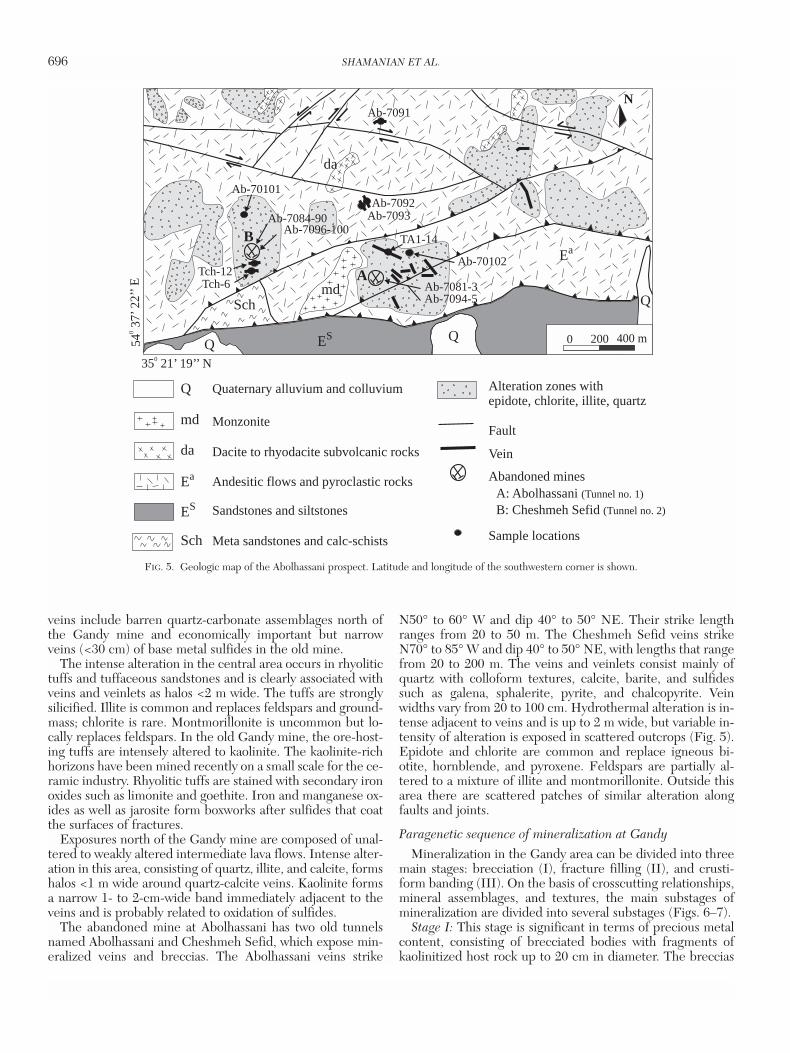
FIG. 4. Geologic map of the Gandy prospect. Latitude and longitude of the southwestern corner is shown.
veins include barren quartz-carbonate assemblages north ofthe Gandy mine and economically important but narrowveins (<30 cm) of base metal sulfides in the old mine.
The intense alteration in the central area occurs in rhyolitictuffs and tuffaceous sandstones and is clearly associated withveins and veinlets as halos <2 m wide. The tuffs are stronglysilicified. Illite is common and replaces feldspars and ground-mass; chlorite is rare. Montmorillonite is uncommon but lo-cally replaces feldspars. In the old Gandy mine, the ore-host-ing tuffs are intensely altered to kaolinite. The kaolinite-richhorizons have been mined recently on a small scale for the ce-ramic industry. Rhyolitic tuffs are stained with secondary ironoxides such as limonite and goethite. Iron and manganese ox-ides as well as jarosite form boxworks after sulfides that coatthe surfaces of fractures.
Exposures north of the Gandy mine are composed of unal-tered to weakly altered intermediate lava flows. Intense alter-ation in this area, consisting of quartz, illite, and calcite, formshalos <1 m wide around quartz-calcite veins. Kaolinite formsa narrow 1- to 2-cm-wide band immediately adjacent to theveins and is probably related to oxidation of sulfides.
The abandoned mine at Abolhassani has two old tunnelsnamed Abolhassani and Cheshmeh Sefid, which expose min-eralized veins and breccias. The Abolhassani veins strike
N50° to 60° W and dip 40° to 50° NE. Their strike lengthranges from 20 to 50 m. The Cheshmeh Sefid veins strikeN70° to 85° W and dip 40° to 50° NE, with lengths that rangefrom 20 to 200 m. The veins and veinlets consist mainly ofquartz with colloform textures, calcite, barite, and sulfidessuch as galena, sphalerite, pyrite, and chalcopyrite. Veinwidths vary from 20 to 100 cm. Hydrothermal alteration is in-tense adjacent to veins and is up to 2 m wide, but variable in-tensity of alteration is exposed in scattered outcrops (Fig. 5).Epidote and chlorite are common and replace igneous bi-otite, hornblende, and pyroxene. Feldspars are partially al-tered to a mixture of illite and montmorillonite. Outside thisarea there are scattered patches of similar alteration alongfaults and joints.
Paragenetic sequence of mineralization at Gandy
Mineralization in the Gandy area can be divided into threemain stages: brecciation (I), fracture filling (II), and crusti-form banding (III). On the basis of crosscutting relationships,mineral assemblages, and textures, the main substages ofmineralization are divided into several substages (Figs. 6–7).
Stage I: This stage is significant in terms of precious metalcontent, consisting of brecciated bodies with fragments ofkaolinitized host rock up to 20 cm in diameter. The breccias
696 SHAMANIAN ET AL.
0361-0128/98/000/000-00 $6.00 696
Sch
Q
da
mdTch-6Tch-12
TA1-14Ea
35 21’ 19’’ N0
5437
’22’
’E0
Q
md
da
Sch
Quaternary alluvium and colluvium
Monzonite
Dacite to rhyodacite subvolcanic rocks
Andesitic flows and pyroclastic rocks
Sandstones and siltstones
Meta sandstones and calc-schists
Fault
Vein
Abandoned mines
Sample locations
Alteration zones withepidote, chlorite, illite, quartz
N
ES 0 200 400 m
A: Abolhassani (Tunnel no. 1)
B: Cheshmeh Sefid (Tunnel no. 2)
A
B
ES
Ea
Q
QAb-7081-3
Ab-7084-90
Ab-7094-5
Ab-7096-100
Ab-7091
Ab-7092Ab-7093
Ab-70101
Ab-70102
FIG. 5. Geologic map of the Abolhassani prospect. Latitude and longitude of the southwestern corner is shown.
GANDY AND ABOLHASSANI EPITHERMAL PROSPECTS, NORTHERN IRAN 697
0361-0128/98/000/000-00 $6.00 697
2 cm
Fragmentsof altered dacite
2 cm
Stage II
Stage II
Stage II
Stage IAlteredtuff
AditAltered tuff
Hydrothermal brecciazone
Ion oxy-hydroxides
2 cm
A
Stage II
B
FE
C
D
Qtz-Carbveins
Andesite
Stage I
Iron oxy-hydroxides
MalachiteMalachite
10 cm
Alteredtuff
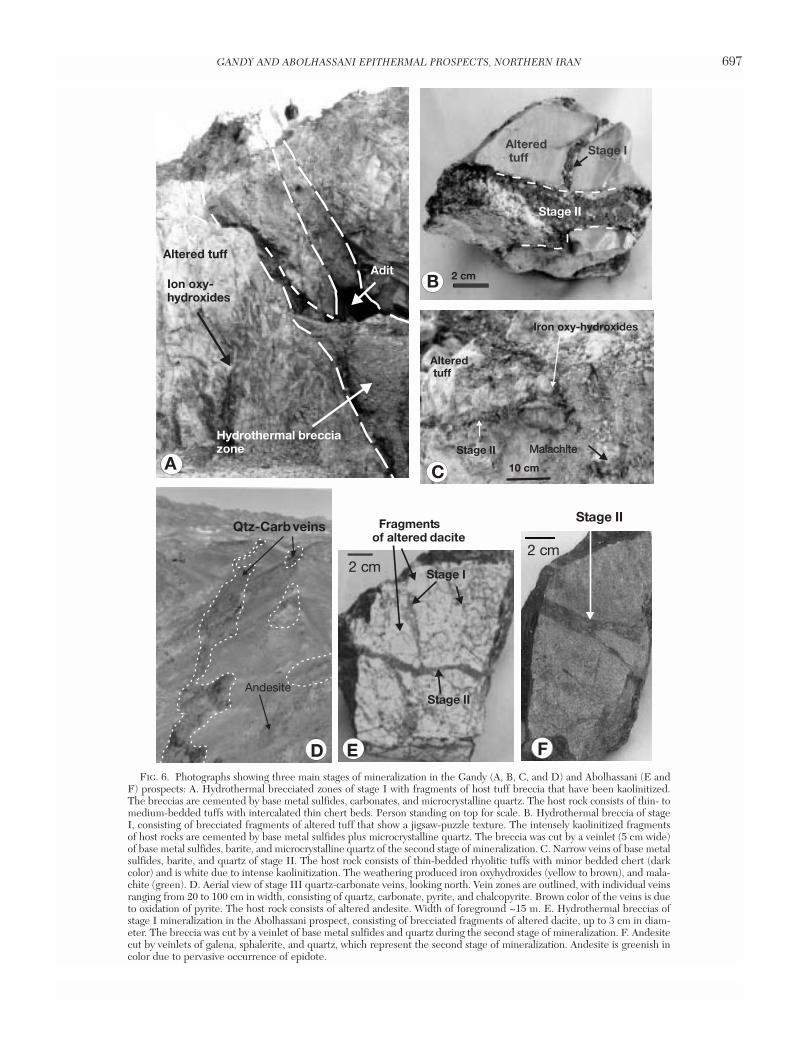
FIG. 6. Photographs showing three main stages of mineralization in the Gandy (A, B, C, and D) and Abolhassani (E andF) prospects: A. Hydrothermal brecciated zones of stage I with fragments of host tuff breccia that have been kaolinitized.The breccias are cemented by base metal sulfides, carbonates, and microcrystalline quartz. The host rock consists of thin- tomedium-bedded tuffs with intercalated thin chert beds. Person standing on top for scale. B. Hydrothermal breccia of stageI, consisting of brecciated fragments of altered tuff that show a jigsaw-puzzle texture. The intensely kaolinitized fragmentsof host rocks are cemented by base metal sulfides plus microcrystalline quartz. The breccia was cut by a veinlet (5 cm wide)of base metal sulfides, barite, and microcrystalline quartz of the second stage of mineralization. C. Narrow veins of base metalsulfides, barite, and quartz of stage II. The host rock consists of thin-bedded rhyolitic tuffs with minor bedded chert (darkcolor) and is white due to intense kaolinitization. The weathering produced iron oxyhydroxides (yellow to brown), and mala-chite (green). D. Aerial view of stage III quartz-carbonate veins, looking north. Vein zones are outlined, with individual veinsranging from 20 to 100 cm in width, consisting of quartz, carbonate, pyrite, and chalcopyrite. Brown color of the veins is dueto oxidation of pyrite. The host rock consists of altered andesite. Width of foreground ~15 m. E. Hydrothermal breccias ofstage I mineralization in the Abolhassani prospect, consisting of brecciated fragments of altered dacite, up to 3 cm in diam-eter. The breccia was cut by a veinlet of base metal sulfides and quartz during the second stage of mineralization. F. Andesitecut by veinlets of galena, sphalerite, and quartz, which represent the second stage of mineralization. Andesite is greenish incolor due to pervasive occurrence of epidote.
are commonly cemented by base metal sulfides, carbonates,and gray microcrystalline quartz (Fig. 6B). Stage I consists ofthree successive mineral assemblages: (A) dolomite, calcite,chalcopyrite, pyrite; (B) pyrite, native gold, sphalerite, galena,calcite; and (C) microcrystalline quartz. Dolomite in substageA occurs as euhedral to subhedral crystals and calcite occursas fine-gained aggregates, and chalcopyrite and pyrite arerare. Pyrite in substage B occurs as euhedral to subhedralcrystals whereas galena and sphalerite occur as intergrownanhedral crystals. Supergene minerals include goethite, ironoxyhydroxides, malachite, covellite, cerussite, and smith-sonite, which replace up to 50 percent of the primary sulfideminerals. Native gold grains occur in goethite and other sec-ondary iron oxides in the oxidized zone (Fig. 6C). The goldgrains vary from 20 to 50 µm in size, and they are similar insize and composition to native gold occurring in galena andchalcopyrite (see below).
Stage II: This stage contains high contents of base and pre-cious metals. Narrow veins and veinlets of base metal sulfides,quartz, carbonate, and barite characterize this stage. Veinthicknesses vary from a few centimeters up to 30 cm. On thebasis of crosscutting relationships and mineral assemblages,four substages were defined: (A) chalcopyrite, pyrite, andquartz; (B) chalcopyrite, pyrite, tennantite, sphalerite, galena,and barite; (C) pyrite, sphalerite, galena, calcite, dolomite,and rare epidote; and (D) pyrite and microcrystalline quartz.Sphalerite and galena are the main metallic minerals in sub-stage B. Native gold, varying in size from 40 to 70 µm, occurswithin chalcopyrite and galena. Pyrite grains in the final stageshow a colloform texture which surrounds earlier formed, eu-hedral pyrite. The supergene assemblage includes cerussite,smithsonite, willemite, covellite, chalcocite, and iron oxyhy-droxides, which replace up to 20 percent of primary sulfideminerals.
Stage III: This stage contains low concentrations of goldand comprises veins ranging from 10 to 100 cm in width, witha mineral assemblage of quartz, carbonates, and sulfides suchas pyrite and chalcopyrite (Fig. 6D). Finely banded, coarsely
banded, comb, crustiform, and breccia textures occur in theveins. This stage consists of four successive mineral associa-tions: (A) calcite and pyrite; (B) pyrite, bornite, chalcocite,chalcopyrite, barite, and calcite; (C) pyrite and barite; and(D) microcrystalline quartz. Although stage III represents avolumetrically major part of the veins, it contains a low con-centration of base metals (<1 wt % combined) and Au (<5g/t). The supergene assemblage in this stage includes mala-chite and iron oxyhydroxides, which replace up to 20 percentof the primary minerals.
Paragenetic sequence of mineralization at Abolhassani
The mineralogy of the Abolhassani veins consists of basemetal sulfides, quartz, and calcite. Like Gandy, the mineral-ization is divided into three main stages of brecciation, frac-ture filling, and crustiform banding. On the basis of crosscut-ting relationships, mineral assemblages, and textures, themain stages of mineralization are divided into several sub-stages (Figs. 6, 8).
Stage I: This is an important stage in terms of base metalcontent at Abolhassani. It is composed of breccias containinghost-rock fragments (Fig. 6E) up to 5 cm in diameter thatshow propylitic alteration of biotite, hornblende, and pyrox-ene. The breccias are cemented by base metal sulfides, mi-crocrystalline to fine-grained quartz, calcite, and chlorite. Thebreccia zones are irregular to tabular in shape and vary from20 to 30 cm thick. This stage consists of three successive min-eral associations: (A) quartz, pyrite; (B) pyrite, chalcopyrite,sphalerite, galena; and (C) quartz, calcite, chlorite. Supergeneminerals include covellite, smithsonite, and cerussite.
Stage II: This stage is also important for base metals and ischaracterized by veins of base metal sulfides (Fig. 6F),quartz, and calcite. Veins vary from 10 to 100 cm thick. Thisstage consists of four successive mineral assemblages: (A)quartz, pyrite; (B) pyrite, chalcopyrite, sphalerite; (C) pyrite,sphalerite, galena; and (D) quartz, calcite, chlorite. The su-pergene assemblage includes malachite, covellite, smith-sonite, cerussite, and iron oxyhydroxides. Supergene alter-ation is minor and incipient at Abolhassani and has replaced<10 percent of the primary sulfide minerals.
Stage III: This stage comprises millimeter- to centimeter-thick veinlets of quartz. The veinlets are located on the con-tact between the hanging wall and footwall of the main veins.The mineral assemblage consists of quartz with fine bands,combs and crustiform textures, and rare pyrite.
698 SHAMANIAN ET AL.
0361-0128/98/000/000-00 $6.00 698
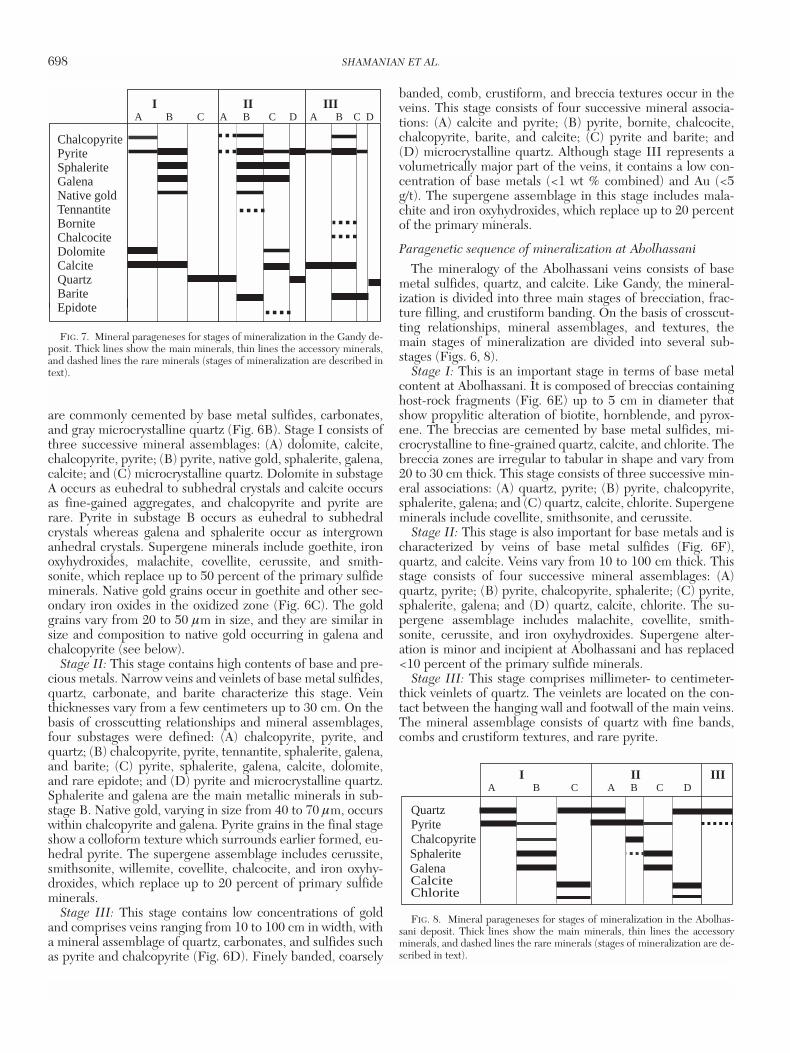
ChalcopyritePyriteSphaleriteGalenaNative goldTennantiteBorniteChalcociteDolomiteCalciteQuartzBariteEpidote
I II IIIA B C A B C D A B C D
FIG. 7. Mineral parageneses for stages of mineralization in the Gandy de-posit. Thick lines show the main minerals, thin lines the accessory minerals,and dashed lines the rare minerals (stages of mineralization are described intext).
CalciteChlorite
Chalcopyrite
QuartzPyrite
SphaleriteGalena
I II IIIA B C A B C D
FIG. 8. Mineral parageneses for stages of mineralization in the Abolhas-sani deposit. Thick lines show the main minerals, thin lines the accessoryminerals, and dashed lines the rare minerals (stages of mineralization are de-scribed in text).
Supergene effects
Supergene oxidation has affected the gold and base metalmineralization of Gandy above the groundwater table and toa lesser extent at Abolhassani. In the Gandy area, the main su-pergene minerals are goethite, iron oxyhydroxides, malachite,covellite, cerussite, and smithsonite, which replace 20 to 50percent of the primary sulfide minerals. The depth of weath-ering is related to the structure and level of the ground-watertable and is about 10 to 20 m below surface in the vicinity ofthe mine.
The main supergene minerals at Abolhassani are similar toGandy, including malachite, covellite, smithsonite, cerussite,and iron oxyhydroxides. However, supergene effects are min-imal in this area.
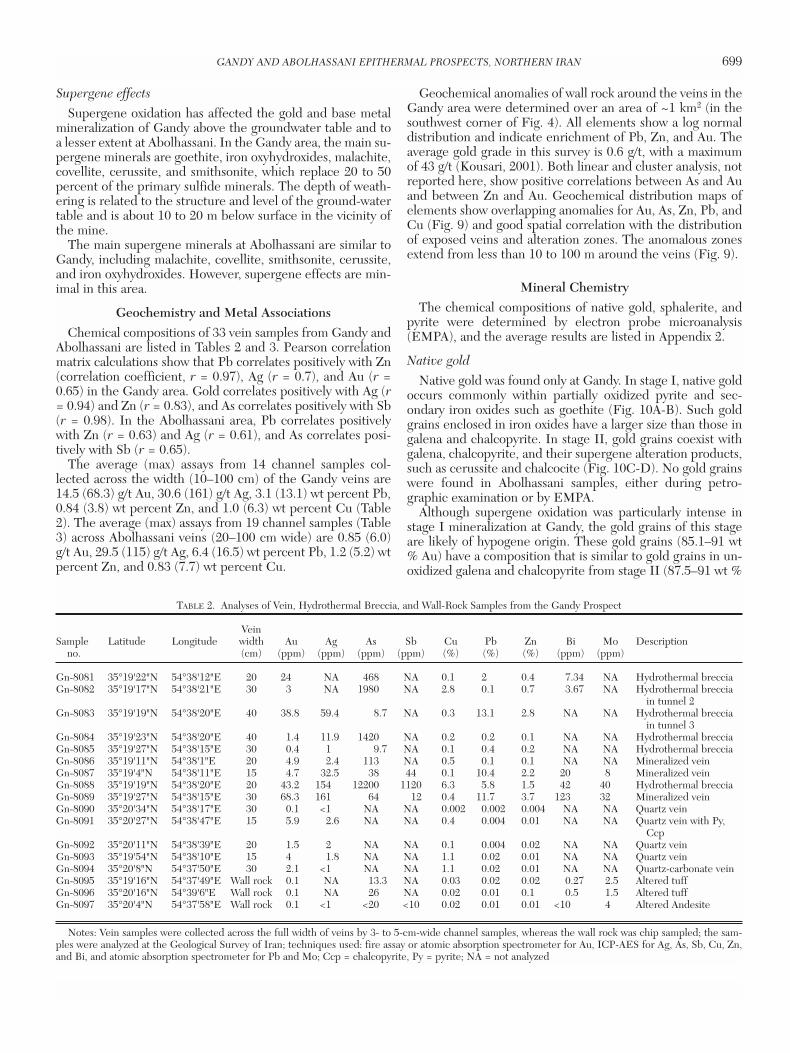
Geochemistry and Metal AssociationsChemical compositions of 33 vein samples from Gandy and
Abolhassani are listed in Tables 2 and 3. Pearson correlationmatrix calculations show that Pb correlates positively with Zn(correlation coefficient, r = 0.97), Ag (r = 0.7), and Au (r =0.65) in the Gandy area. Gold correlates positively with Ag (r= 0.94) and Zn (r = 0.83), and As correlates positively with Sb(r = 0.98). In the Abolhassani area, Pb correlates positivelywith Zn (r = 0.63) and Ag (r = 0.61), and As correlates posi-tively with Sb (r = 0.65).
The average (max) assays from 14 channel samples col-lected across the width (10–100 cm) of the Gandy veins are14.5 (68.3) g/t Au, 30.6 (161) g/t Ag, 3.1 (13.1) wt percent Pb,0.84 (3.8) wt percent Zn, and 1.0 (6.3) wt percent Cu (Table2). The average (max) assays from 19 channel samples (Table3) across Abolhassani veins (20–100 cm wide) are 0.85 (6.0)g/t Au, 29.5 (115) g/t Ag, 6.4 (16.5) wt percent Pb, 1.2 (5.2) wtpercent Zn, and 0.83 (7.7) wt percent Cu.
Geochemical anomalies of wall rock around the veins in theGandy area were determined over an area of ~1 km2 (in thesouthwest corner of Fig. 4). All elements show a log normaldistribution and indicate enrichment of Pb, Zn, and Au. Theaverage gold grade in this survey is 0.6 g/t, with a maximumof 43 g/t (Kousari, 2001). Both linear and cluster analysis, notreported here, show positive correlations between As and Auand between Zn and Au. Geochemical distribution maps ofelements show overlapping anomalies for Au, As, Zn, Pb, andCu (Fig. 9) and good spatial correlation with the distributionof exposed veins and alteration zones. The anomalous zonesextend from less than 10 to 100 m around the veins (Fig. 9).
Mineral ChemistryThe chemical compositions of native gold, sphalerite, and
pyrite were determined by electron probe microanalysis(EMPA), and the average results are listed in Appendix 2.
Native gold
Native gold was found only at Gandy. In stage I, native goldoccurs commonly within partially oxidized pyrite and sec-ondary iron oxides such as goethite (Fig. 10A-B). Such goldgrains enclosed in iron oxides have a larger size than those ingalena and chalcopyrite. In stage II, gold grains coexist withgalena, chalcopyrite, and their supergene alteration products,such as cerussite and chalcocite (Fig. 10C-D). No gold grainswere found in Abolhassani samples, either during petro-graphic examination or by EMPA.
Although supergene oxidation was particularly intense instage I mineralization at Gandy, the gold grains of this stageare likely of hypogene origin. These gold grains (85.1–91 wt% Au) have a composition that is similar to gold grains in un-oxidized galena and chalcopyrite from stage II (87.5–91 wt %
GANDY AND ABOLHASSANI EPITHERMAL PROSPECTS, NORTHERN IRAN 699
0361-0128/98/000/000-00 $6.00 699
TABLE 2. Analyses of Vein, Hydrothermal Breccia, and Wall-Rock Samples from the Gandy Prospect
VeinSample Latitude Longitude width Au Ag As Sb Cu Pb Zn Bi Mo Description
no. (cm) (ppm) (ppm) (ppm) (ppm) (%) (%) (%) (ppm) (ppm)
Gn-8081 35°19'22"N 54°38'12"E 20 24 NA 468 NA 0.1 2 0.4 7.34 NA Hydrothermal brecciaGn-8082 35°19'17"N 54°38'21"E 30 3 NA 1980 NA 2.8 0.1 0.7 3.67 NA Hydrothermal breccia
in tunnel 2Gn-8083 35°19'19"N 54°38'20"E 40 38.8 59.4 8.7 NA 0.3 13.1 2.8 NA NA Hydrothermal breccia
in tunnel 3Gn-8084 35°19'23"N 54°38'20"E 40 1.4 11.9 1420 NA 0.2 0.2 0.1 NA NA Hydrothermal brecciaGn-8085 35°19'27"N 54°38'15"E 30 0.4 1 9.7 NA 0.1 0.4 0.2 NA NA Hydrothermal brecciaGn-8086 35°19'11"N 54°38'1"E 20 4.9 2.4 113 NA 0.5 0.1 0.1 NA NA Mineralized veinGn-8087 35°19'4"N 54°38'11"E 15 4.7 32.5 38 44 0.1 10.4 2.2 20 8 Mineralized veinGn-8088 35°19'19"N 54°38'20"E 20 43.2 154 12200 1120 6.3 5.8 1.5 42 40 Hydrothermal brecciaGn-8089 35°19'27"N 54°38'15"E 30 68.3 161 64 12 0.4 11.7 3.7 123 32 Mineralized veinGn-8090 35°20'34"N 54°38'17"E 30 0.1 <1 NA NA 0.002 0.002 0.004 NA NA Quartz veinGn-8091 35°20'27"N 54°38'47"E 15 5.9 2.6 NA NA 0.4 0.004 0.01 NA NA Quartz vein with Py,
CcpGn-8092 35°20'11"N 54°38'39"E 20 1.5 2 NA NA 0.1 0.004 0.02 NA NA Quartz veinGn-8093 35°19'54"N 54°38'10"E 15 4 1.8 NA NA 1.1 0.02 0.01 NA NA Quartz veinGn-8094 35°20'8"N 54°37'50"E 30 2.1 <1 NA NA 1.1 0.02 0.01 NA NA Quartz-carbonate veinGn-8095 35°19'16"N 54°37'49"E Wall rock 0.1 NA 13.3 NA 0.03 0.02 0.02 0.27 2.5 Altered tuffGn-8096 35°20'16"N 54°39'6"E Wall rock 0.1 NA 26 NA 0.02 0.01 0.1 0.5 1.5 Altered tuffGn-8097 35°20'4"N 54°37'58"E Wall rock 0.1 <1 <20 <10 0.02 0.01 0.01 <10 4 Altered Andesite
Notes: Vein samples were collected across the full width of veins by 3- to 5-cm-wide channel samples, whereas the wall rock was chip sampled; the sam-ples were analyzed at the Geological Survey of Iran; techniques used: fire assay or atomic absorption spectrometer for Au, ICP-AES for Ag, As, Sb, Cu, Zn,and Bi, and atomic absorption spectrometer for Pb and Mo; Ccp = chalcopyrite, Py = pyrite; NA = not analyzed
Au; Appendix 2a). This suggests that the gold grains hosted bygoethite are hypogene and were not affected during super-gene oxidation of pyrite. In the Gandy area, relief is low, theclimate is now arid (annual rainfall <150 mm), and the vege-tation is sparse. Under these conditions, gold and silver mo-bility in the weathering environment is limited (Webster andMann, 1984).
Sphalerite
Sphalerite crystals and aggregates in the Gandy veins dis-play subtle color zoning. Cores of sphalerite grains rangefrom clear to light yellow, changing to yellow toward theirrims. The FeS and CdS contents range from 0.8 to 1.6 and 0.2to 0.6 mol percent (Appendix 2b), respectively, and increaseslightly from core to rim. Sphalerite contains blebs of chal-copyrite.
In the Abolhassani area, sphalerite crystals do not displayany color zoning. Their FeS content ranges from 1 to 2.9 molpercent (Appendix 2b). Sphalerite contains blebs of chal-copyrite and also occurs as fine inclusions (20–50 µm) withingalena (Fig. 10E). The FeS content of these inclusions is 0.2mol percent, much lower than other sphalerite grains. TheCdS contents of both types of sphalerite range from 0.15 to0.32 wt percent, averaging approximately 0.2 mol percent.
Pyrite
Two types of pyrite have been documented in stage II ofGandy mineralization. The first type is characterized by
euhedral to subhedral crystals that are disseminated through-out the ore. These pyrite grains are As poor (<0.02 wt %) andare commonly found in association with chalcopyrite, spha-lerite, and galena. The second type is characterized by a collo-form texture, which occurs most commonly as overgrowths onsmall (20–50 µm) euhedral pyrite crystals. The overgrowthsvary in thickness from 5 to 30+ µm. Within the rims, the high-est As concentrations (up to 6.4 wt %, Appendix 2c) were de-tected in the outermost growth zone, which is brighter than therest of the rims in the backscattered electron images. Theseconcentrations compare with low As concentration (<0.02 wt%) in the euhedral pyrite cores (Fig. 10F-G). In this study, goldwas not detected in the arsenian pyrite samples, althoughEMPA detection limit is quite high (about 300 ppm Au).
A strong correlation between Au and As in arsenian pyritehas been noted in sediment-hosted gold deposits (Bakken etal., 1991; Arehart et al., 1993) but not from epithermal veinshosted by volcanic rocks. Nevertheless, it appears that a por-tion of the gold may be associated with arsenian pyrite in thisdistrict. Gold is typically incorporated into pyrite bychemisorption onto As-rich, Fe-deficient growth surfaces(Fleet et al., 1993; Fleet and Mumin, 1997). The amount ofgold that can enter arsenian pyrite is probably a function ofthe amount of arsenic present, as well as the crystallographicposition and distribution of arsenic in the pyrite structure(Simon et al., 1999).
In the Abolhassani area, euhedral to subhedral pyrite grainsdo not display zoning. The pyrite is mostly As poor (Appendix
700 SHAMANIAN ET AL.
0361-0128/98/000/000-00 $6.00 700
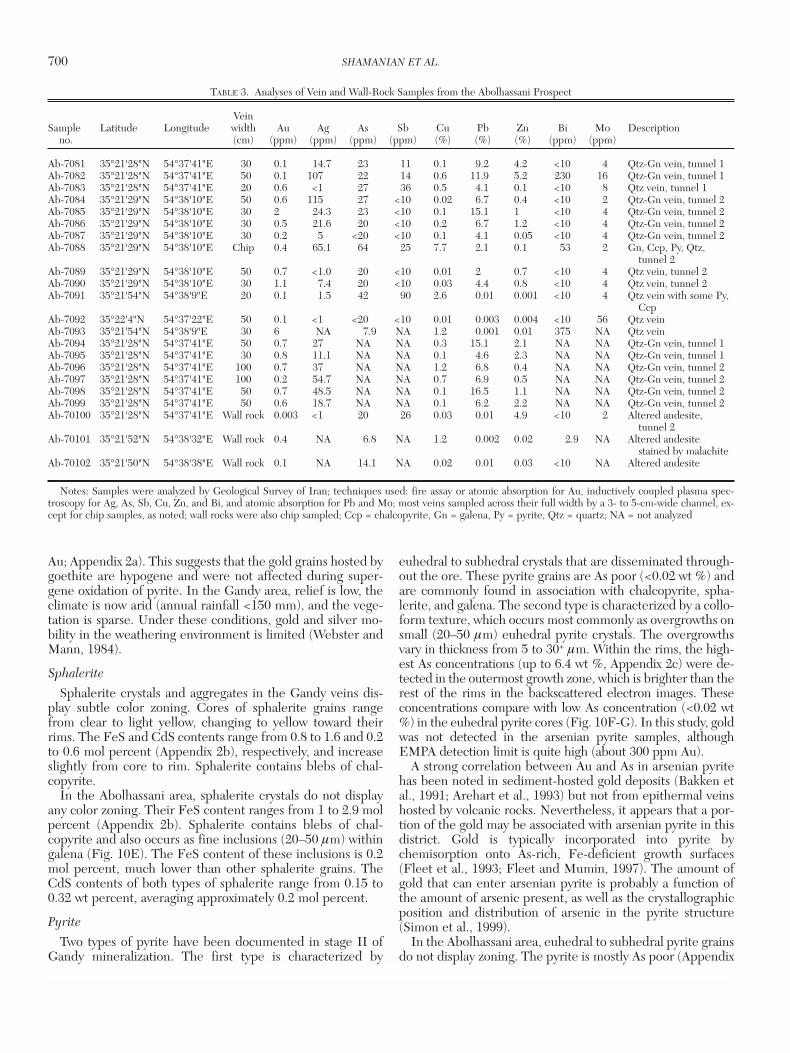
TABLE 3. Analyses of Vein and Wall-Rock Samples from the Abolhassani Prospect
VeinSample Latitude Longitude width Au Ag As Sb Cu Pb Zn Bi Mo Description
no. (cm) (ppm) (ppm) (ppm) (ppm) (%) (%) (%) (ppm) (ppm)
Ab-7081 35°21'28"N 54°37'41"E 30 0.1 14.7 23 11 0.1 9.2 4.2 <10 4 Qtz-Gn vein, tunnel 1 Ab-7082 35°21'28"N 54°37'41"E 50 0.1 107 22 14 0.6 11.9 5.2 230 16 Qtz-Gn vein, tunnel 1 Ab-7083 35°21'28"N 54°37'41"E 20 0.6 <1 27 36 0.5 4.1 0.1 <10 8 Qtz vein, tunnel 1Ab-7084 35°21'29"N 54°38'10"E 50 0.6 115 27 <10 0.02 6.7 0.4 <10 2 Qtz-Gn vein, tunnel 2 Ab-7085 35°21'29"N 54°38'10"E 30 2 24.3 23 <10 0.1 15.1 1 <10 4 Qtz-Gn vein, tunnel 2 Ab-7086 35°21'29"N 54°38'10"E 30 0.5 21.6 20 <10 0.2 6.7 1.2 <10 4 Qtz-Gn vein, tunnel 2 Ab-7087 35°21'29"N 54°38'10"E 30 0.2 5 <20 <10 0.1 4.1 0.05 <10 4 Qtz-Gn vein, tunnel 2Ab-7088 35°21'29"N 54°38'10"E Chip 0.4 65.1 64 25 7.7 2.1 0.1 53 2 Gn, Ccp, Py, Qtz,
tunnel 2Ab-7089 35°21'29"N 54°38'10"E 50 0.7 <1.0 20 <10 0.01 2 0.7 <10 4 Qtz vein, tunnel 2Ab-7090 35°21'29"N 54°38'10"E 30 1.1 7.4 20 <10 0.03 4.4 0.8 <10 4 Qtz vein, tunnel 2 Ab-7091 35°21'54"N 54°38'9"E 20 0.1 1.5 42 90 2.6 0.01 0.001 <10 4 Qtz vein with some Py,
Ccp Ab-7092 35°22'4"N 54°37'22"E 50 0.1 <1 <20 <10 0.01 0.003 0.004 <10 56 Qtz veinAb-7093 35°21'54"N 54°38'9"E 30 6 NA 7.9 NA 1.2 0.001 0.01 375 NA Qtz veinAb-7094 35°21'28"N 54°37'41"E 50 0.7 27 NA NA 0.3 15.1 2.1 NA NA Qtz-Gn vein, tunnel 1Ab-7095 35°21'28"N 54°37'41"E 30 0.8 11.1 NA NA 0.1 4.6 2.3 NA NA Qtz-Gn vein, tunnel 1Ab-7096 35°21'28"N 54°37'41"E 100 0.7 37 NA NA 1.2 6.8 0.4 NA NA Qtz-Gn vein, tunnel 2Ab-7097 35°21'28"N 54°37'41"E 100 0.2 54.7 NA NA 0.7 6.9 0.5 NA NA Qtz-Gn vein, tunnel 2Ab-7098 35°21'28"N 54°37'41"E 50 0.7 48.5 NA NA 0.1 16.5 1.1 NA NA Qtz-Gn vein, tunnel 2Ab-7099 35°21'28"N 54°37'41"E 50 0.6 18.7 NA NA 0.1 6.2 2.2 NA NA Qtz-Gn vein, tunnel 2Ab-70100 35°21'28"N 54°37'41"E Wall rock 0.003 <1 20 26 0.03 0.01 4.9 <10 2 Altered andesite,
tunnel 2Ab-70101 35°21'52"N 54°38'32"E Wall rock 0.4 NA 6.8 NA 1.2 0.002 0.02 2.9 NA Altered andesite
stained by malachiteAb-70102 35°21'50"N 54°38'38"E Wall rock 0.1 NA 14.1 NA 0.02 0.01 0.03 <10 NA Altered andesite
Notes: Samples were analyzed by Geological Survey of Iran; techniques used: fire assay or atomic absorption for Au, inductively coupled plasma spec-troscopy for Ag, As, Sb, Cu, Zn, and Bi, and atomic absorption for Pb and Mo; most veins sampled across their full width by a 3- to 5-cm-wide channel, ex-cept for chip samples, as noted; wall rocks were also chip sampled; Ccp = chalcopyrite, Gn = galena, Py = pyrite, Qtz = quartz; NA = not analyzed

2c). A high concentration of As was detected in only onepyrite grain, ranging from 0.2 to 1.9 wt percent (Fig. 10H).
Fluid Inclusion DataFluid inclusion data were collected from Gandy and Abol-
hassani to characterize and compare the fluid temperaturesand compositions. Fluid inclusions in quartz crystals are verysmall and only a few were selected for study, whereas sphaleritecontains inclusions suitable for study. Most data were obtainedfrom six doubly polished sections (70 µm thick) of subhedralsphalerite crystals, which range from 2 mm to 1 cm in size. Thesize of fluid inclusions ranges from 5 to 40 µm, with maximumsizes up to ~120 µm in elliptical, irregular, and rod shapes. Pri-mary, pseudosecondary, and secondary inclusions were identi-fied, and these are mostly liquid rich and aqueous with nodaughter minerals. All inclusions are two phase at room tem-perature (liquid and vapor), with vapor to liquid ratios rangingbetween 0.1 and 0.4. Vapor-rich secondary inclusions were
found in three samples, and they coexist with liquid-rich inclu-sions, although necking phenomena are suspected in thesesamples because some liquid-rich or liquid-only inclusionswere found adjacent to vapor-rich inclusions.
Primary fluid inclusions occur in growth zones parallel tocrystal faces, as solitary inclusions or as isolated assemblagesof inclusions. The latter are randomly distributed. Pseudosec-ondary inclusions occur along planes crosscut by later growthzones. The growth zones in sphalerite are distinguished bycolor variations, from yellow to clear, and by numerous verysmall primary fluid inclusions which define former crystalsurfaces.
Microthermometric studies were carried out by conven-tional techniques using a FLUID INC.-adapted U.S. Geolog-ical Survey gas-flow heating-freezing system with precisionsof ±1° and ±0.1°C for temperatures of homogenization andice melting, respectively. The results are summarized in Ap-pendices 3 and 4. Each line of fluid inclusion data in these
GANDY AND ABOLHASSANI EPITHERMAL PROSPECTS, NORTHERN IRAN 701
0361-0128/98/000/000-00 $6.00 701
Au (ppm)
1.01-440.87-10.52-0.86
Cu (ppm)
1100-23000370-1000210-360
Vein &breccia
N
0 200 400Meters
Quaternary alluvium& colluvium
Zn (ppm)
410-8600300-40088-290
As (ppm)
130-610074-12050-73
35 19’2”No
5438
’5”E
o
FIG. 9. Lithogeochemical anomaly maps of Au, As, Cu, and Zn for the southwestern portion of the Gandy prospect; thecentral area is covered by Quaternary sediments. Vein and breccia locations are shown by solid lines. Sampling locations areshown as small solid circles in the diagram.

Appendices represents measurements along individual planesor in groups of inclusions having constant vapor to liquid ra-tios and that yielded consistent data. Such populations of fluidinclusions are termed fluid inclusion assemblages, and these
provide the most reliable data sets (Goldstein and Reynolds,1994). Homogenization and ice-melting temperatures wereobtained for 524 and 44 fluid inclusions, respectively, repre-senting 94 fluid inclusion assemblages in the six samples.
702 SHAMANIAN ET AL.
0361-0128/98/000/000-00 $6.00 702
Au
Au
sample no. GA1
Gt
# 11
Au
Gn
Au
Ccp
Gn
Sample no. Gn-1# 5
sample no. 79/H59# 2
+3 +2+1
sample no. 79/H59
+1+2
+3
# 1
SpSp
Qtz
Gn
Ccp
A B
C D
E F
G H
Au
FIG. 10. Backscattered electron images of minerals from the Gandy and Abolhassani prospects. A. and B. Gold grains (Au)in secondary iron oxides of stage I (Gandy prospect). C. and D. Gold within galena (Gn) and chalcopyrite (Ccp) of stage II(Gandy prospect). E. Sphalerite (Sp) within galena of stage I (Abolhassani prospect). F. and G. Compositional zoning ofpyrite of stage II (Gandy prospect); the bright bands contain up to 6.4 wt percent As. H. Weakly zoned, As-poor pyrite fromAbolhassani.
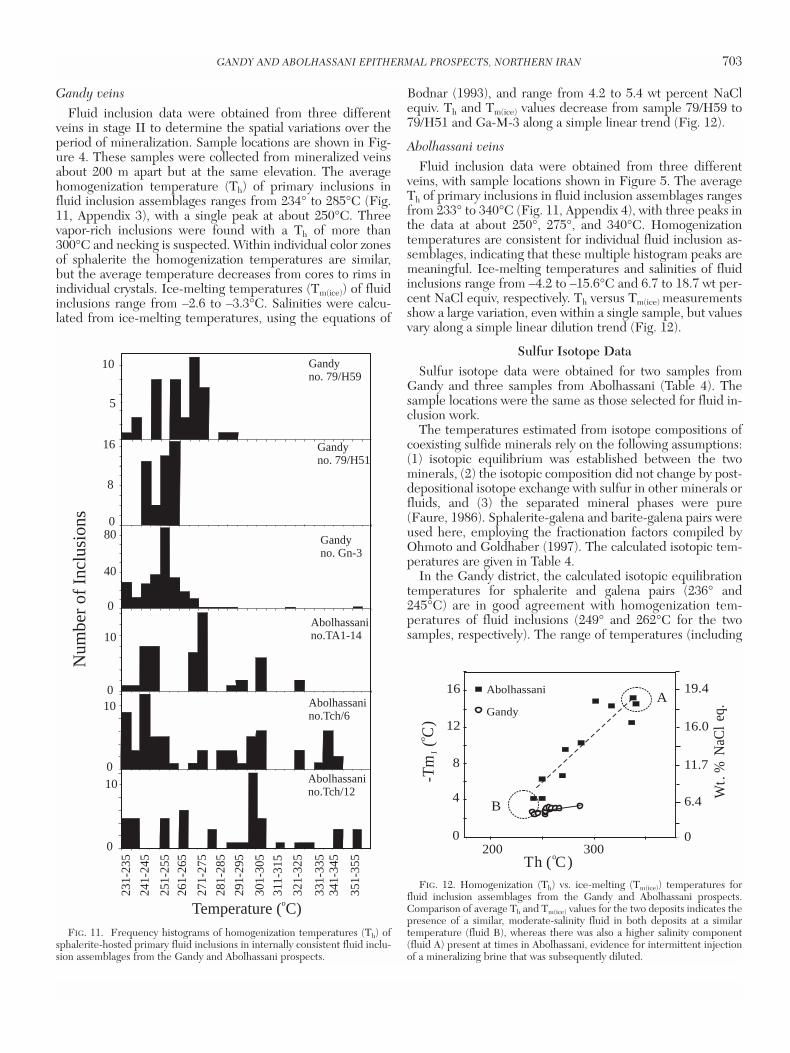
Gandy veins
Fluid inclusion data were obtained from three differentveins in stage II to determine the spatial variations over theperiod of mineralization. Sample locations are shown in Fig-ure 4. These samples were collected from mineralized veinsabout 200 m apart but at the same elevation. The averagehomogenization temperature (Th) of primary inclusions influid inclusion assemblages ranges from 234° to 285°C (Fig.11, Appendix 3), with a single peak at about 250°C. Threevapor-rich inclusions were found with a Th of more than300°C and necking is suspected. Within individual color zonesof sphalerite the homogenization temperatures are similar,but the average temperature decreases from cores to rims inindividual crystals. Ice-melting temperatures (Tm(ice)) of fluidinclusions range from –2.6 to –3.3°C. Salinities were calcu-lated from ice-melting temperatures, using the equations of
Bodnar (1993), and range from 4.2 to 5.4 wt percent NaClequiv. Th and Tm(ice) values decrease from sample 79/H59 to79/H51 and Ga-M-3 along a simple linear trend (Fig. 12).
Abolhassani veins
Fluid inclusion data were obtained from three differentveins, with sample locations shown in Figure 5. The averageTh of primary inclusions in fluid inclusion assemblages rangesfrom 233° to 340°C (Fig. 11, Appendix 4), with three peaks inthe data at about 250°, 275°, and 340°C. Homogenizationtemperatures are consistent for individual fluid inclusion as-semblages, indicating that these multiple histogram peaks aremeaningful. Ice-melting temperatures and salinities of fluidinclusions range from –4.2 to –15.6°C and 6.7 to 18.7 wt per-cent NaCl equiv, respectively. Th versus Tm(ice) measurementsshow a large variation, even within a single sample, but valuesvary along a simple linear dilution trend (Fig. 12).
Sulfur Isotope DataSulfur isotope data were obtained for two samples from
Gandy and three samples from Abolhassani (Table 4). Thesample locations were the same as those selected for fluid in-clusion work.
The temperatures estimated from isotope compositions ofcoexisting sulfide minerals rely on the following assumptions:(1) isotopic equilibrium was established between the twominerals, (2) the isotopic composition did not change by post-depositional isotope exchange with sulfur in other minerals orfluids, and (3) the separated mineral phases were pure(Faure, 1986). Sphalerite-galena and barite-galena pairs wereused here, employing the fractionation factors compiled byOhmoto and Goldhaber (1997). The calculated isotopic tem-peratures are given in Table 4.
In the Gandy district, the calculated isotopic equilibrationtemperatures for sphalerite and galena pairs (236° and245°C) are in good agreement with homogenization tem-peratures of fluid inclusions (249° and 262°C for the twosamples, respectively). The range of temperatures (including
GANDY AND ABOLHASSANI EPITHERMAL PROSPECTS, NORTHERN IRAN 703
0361-0128/98/000/000-00 $6.00 703
0
Gandyno. Gn-3
0
40
80
Num
ber
ofIn
clus
ions
Gandyno. 79/H51
8
16
10 Gandyno. 79/H59
5
Abolhassanino.TA1-14
0
10
Abolhassanino.Tch/6
0
10
0
Abolhassanino.Tch/12
231-
235
241-
245
251-
255
261-
265
271-
275
281-
285
291-
295
301-
305
311-
315
321-
325
331-
335
341-
345
351-
355
Temperature ( C)o
10
FIG. 11. Frequency histograms of homogenization temperatures (Th) ofsphalerite-hosted primary fluid inclusions in internally consistent fluid inclu-sion assemblages from the Gandy and Abolhassani prospects.
Abolhassani
Gandy
16
12
8
4
0200 300
0
6.4
11.7
16.0
19.4
Th ( C)o
-Tm
(C)
I
o
A
B
Wt.
%N
aCl
eq.
FIG. 12. Homogenization (Th) vs. ice-melting (Tm(ice)) temperatures forfluid inclusion assemblages from the Gandy and Abolhassani prospects.Comparison of average Th and Tm(ice) values for the two deposits indicates thepresence of a similar, moderate-salinity fluid in both deposits at a similartemperature (fluid B), whereas there was also a higher salinity component(fluid A) present at times in Abolhassani, evidence for intermittent injectionof a mineralizing brine that was subsequently diluted.
uncertainties) from the two methods overlaps, with a varia-tion in the mean temperatures of 15°C. The isotopic temper-atures from barite-galena pairs are higher (293° and 313°C)than the corresponding temperatures of homogenization offluid inclusion assemblages. Sphalerite-galena pairs do notgive reasonable isotopic equilibration temperatures in theAbolhassani samples, and in one case (sample Tch/6), δ34SSph-
Gn is negative (Table 4). The isotopic temperatures are 100°and 200°C higher than the ~275°C mean for Th, although therange of homogenization temperatures of fluid inclusions is ashigh as 354°C (Appendix 4). These discrepancies suggest thatsphalerite and galena did not coprecipitate.
Discussion
Composition of fluids
Fluid inclusions from gold-rich epithermal environmentsare generally two-phase liquid and vapor (Roedder, 1984;Bodnar et al., 1985) and have small freezing point depressions(Hedenquist and Henley, 1985), indicating salinities <1 to 2wt percent NaCl equiv. By contrast, those from silver- andbase metal-rich deposits have higher salinity, with evidencefor pulses of much higher salinity. For example, at Fresnillo(Simmons et al., 1988) and other Mexican deposits (Albinsonet al., 2001), salinities vary from ~5 to 20 wt percent NaClequiv or higher. Salinity determinations indicate that spha-lerite-hosted fluid inclusions from the Gandy veins are moredilute than similar fluid inclusions from the Abolhassaniveins. Clathrates (Collins, 1979) were not observed in any ofthe freezing runs. However, Hedenquist and Henley (1985)noted that up to –1.5°C of the freezing point depression inepithermal fluid inclusions could be due to the presence of upto 4 wt percent dissolved CO2 without clathrate formationduring freezing. If CO2 is present, the salinities indicated inthis study represent maximum values and could be up to ~2.6wt percent NaCl equiv lower (however, this will not affect theinterpretation here).
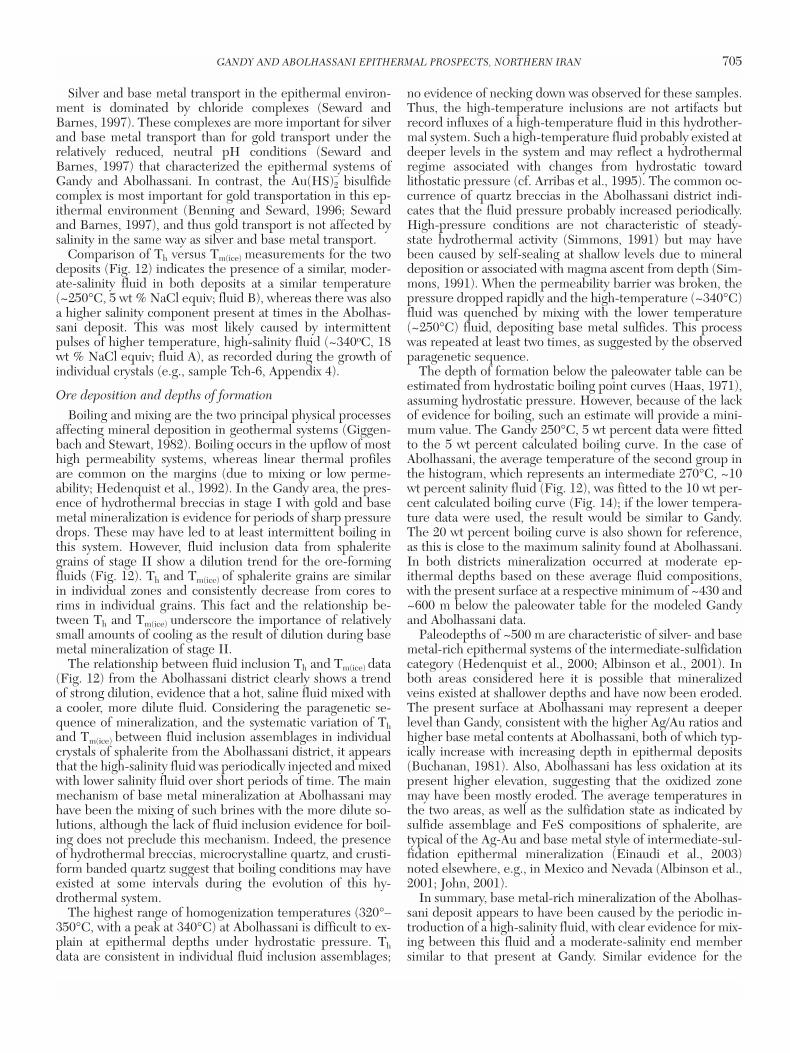
The salinities of inclusions are consistent with metal con-tents and mineralogical data from the two areas. The Abol-hassani samples have higher average Ag/Au ratios (~35) andhigher Pb + Zn contents (avg 7.6 wt %) than those fromGandy (Ag/Au ratios of 2 and avg 3.9 wt %, respectively; Fig.13), consistent with the significantly higher (~4×) maximumsalinity at Abolhassani (18.7 wt %) compared to Gandy (5.4 wt%). Such a relationship between silver and base metal oreswith relatively higher salinities and gold-silver ores with lowersalinities has been previously noted (Henley, 1985) and con-firmed for Mexican epithermal deposits (Simmons et al.,1988; Simmons, 1991; Albinson et al., 2001).
704 SHAMANIAN ET AL.
0361-0128/98/000/000-00 $6.00 704
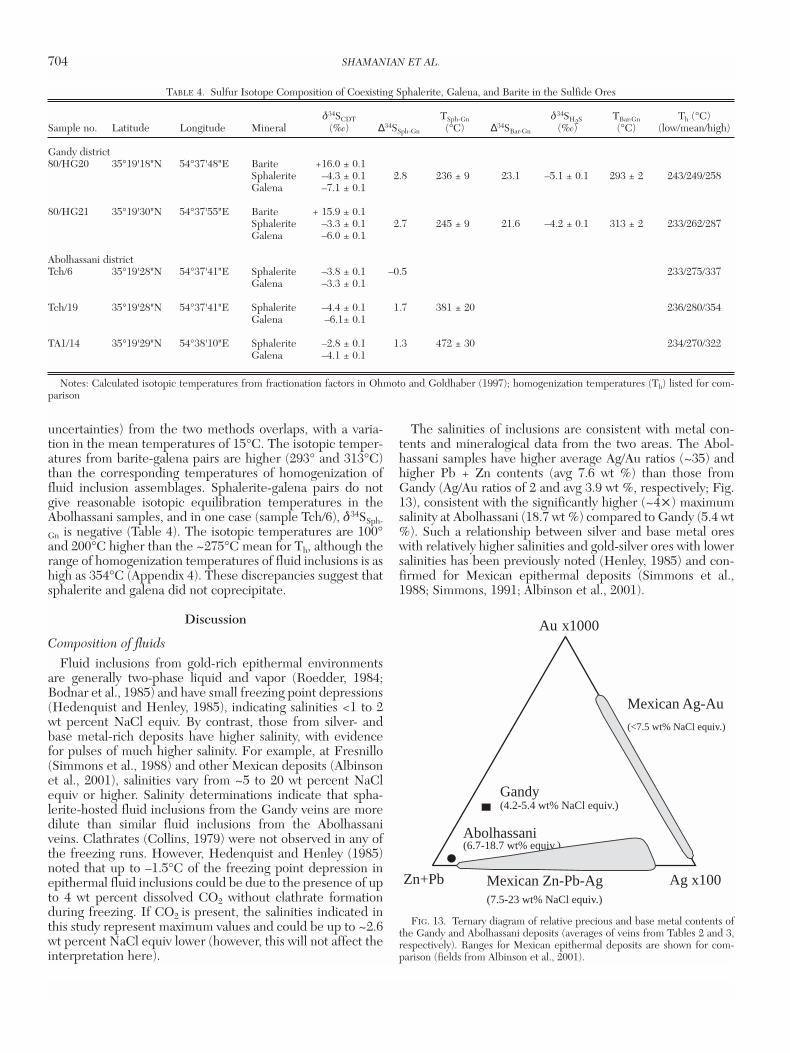
TABLE 4. Sulfur Isotope Composition of Coexisting Sphalerite, Galena, and Barite in the Sulfide Ores
δ34SCDT TSph-Gn δ34SH2S TBar-Gn Th (°C)Sample no. Latitude Longitude Mineral (‰) ∆34SSph-Gn (°C) ∆34SBar-Gn (‰) (°C) (low/mean/high)
Gandy district80/HG20 35°19'18"N 54°37'48"E Barite +16.0 ± 0.1
Sphalerite –4.3 ± 0.1 2.8 236 ± 9 23.1 –5.1 ± 0.1 293 ± 2 243/249/258Galena –7.1 ± 0.1
80/HG21 35°19'30"N 54°37'55"E Barite + 15.9 ± 0.1Sphalerite –3.3 ± 0.1 2.7 245 ± 9 21.6 –4.2 ± 0.1 313 ± 2 233/262/287Galena –6.0 ± 0.1
Abolhassani districtTch/6 35°19'28"N 54°37'41"E Sphalerite –3.8 ± 0.1 –0.5 233/275/337
Galena –3.3 ± 0.1
Tch/19 35°19'28"N 54°37'41"E Sphalerite –4.4 ± 0.1 1.7 381 ± 20 236/280/354Galena –6.1± 0.1
TA1/14 35°19'29"N 54°38'10"E Sphalerite –2.8 ± 0.1 1.3 472 ± 30 234/270/322Galena –4.1 ± 0.1
Notes: Calculated isotopic temperatures from fractionation factors in Ohmoto and Goldhaber (1997); homogenization temperatures (Th) listed for com-parison
Au x1000
Ag x100Zn+Pb
Gandy
Abolhassani
(4.2-5.4 wt% NaCl equiv.)
(6.7-18.7 wt% equiv.)
Mexican Ag-Au
(<7.5 wt% NaCl equiv.)
Mexican Zn-Pb-Ag(7.5-23 wt% NaCl equiv.)
FIG. 13. Ternary diagram of relative precious and base metal contents ofthe Gandy and Abolhassani deposits (averages of veins from Tables 2 and 3,respectively). Ranges for Mexican epithermal deposits are shown for com-parison (fields from Albinson et al., 2001).
Silver and base metal transport in the epithermal environ-ment is dominated by chloride complexes (Seward andBarnes, 1997). These complexes are more important for silverand base metal transport than for gold transport under therelatively reduced, neutral pH conditions (Seward andBarnes, 1997) that characterized the epithermal systems ofGandy and Abolhassani. In contrast, the Au(HS)–
2 bisulfidecomplex is most important for gold transportation in this ep-ithermal environment (Benning and Seward, 1996; Sewardand Barnes, 1997), and thus gold transport is not affected bysalinity in the same way as silver and base metal transport.
Comparison of Th versus Tm(ice) measurements for the twodeposits (Fig. 12) indicates the presence of a similar, moder-ate-salinity fluid in both deposits at a similar temperature(~250°C, 5 wt % NaCl equiv; fluid B), whereas there was alsoa higher salinity component present at times in the Abolhas-sani deposit. This was most likely caused by intermittentpulses of higher temperature, high-salinity fluid (~340oC, 18wt % NaCl equiv; fluid A), as recorded during the growth ofindividual crystals (e.g., sample Tch-6, Appendix 4).
Ore deposition and depths of formation
Boiling and mixing are the two principal physical processesaffecting mineral deposition in geothermal systems (Giggen-bach and Stewart, 1982). Boiling occurs in the upflow of mosthigh permeability systems, whereas linear thermal profilesare common on the margins (due to mixing or low perme-ability; Hedenquist et al., 1992). In the Gandy area, the pres-ence of hydrothermal breccias in stage I with gold and basemetal mineralization is evidence for periods of sharp pressuredrops. These may have led to at least intermittent boiling inthis system. However, fluid inclusion data from sphaleritegrains of stage II show a dilution trend for the ore-formingfluids (Fig. 12). Th and Tm(ice) of sphalerite grains are similarin individual zones and consistently decrease from cores torims in individual grains. This fact and the relationship be-tween Th and Tm(ice) underscore the importance of relativelysmall amounts of cooling as the result of dilution during basemetal mineralization of stage II.
The relationship between fluid inclusion Th and Tm(ice) data(Fig. 12) from the Abolhassani district clearly shows a trendof strong dilution, evidence that a hot, saline fluid mixed witha cooler, more dilute fluid. Considering the paragenetic se-quence of mineralization, and the systematic variation of Thand Tm(ice) between fluid inclusion assemblages in individualcrystals of sphalerite from the Abolhassani district, it appearsthat the high-salinity fluid was periodically injected and mixedwith lower salinity fluid over short periods of time. The mainmechanism of base metal mineralization at Abolhassani mayhave been the mixing of such brines with the more dilute so-lutions, although the lack of fluid inclusion evidence for boil-ing does not preclude this mechanism. Indeed, the presenceof hydrothermal breccias, microcrystalline quartz, and crusti-form banded quartz suggest that boiling conditions may haveexisted at some intervals during the evolution of this hy-drothermal system.
The highest range of homogenization temperatures (320°–350°C, with a peak at 340°C) at Abolhassani is difficult to ex-plain at epithermal depths under hydrostatic pressure. Thdata are consistent in individual fluid inclusion assemblages;
no evidence of necking down was observed for these samples.Thus, the high-temperature inclusions are not artifacts butrecord influxes of a high-temperature fluid in this hydrother-mal system. Such a high-temperature fluid probably existed atdeeper levels in the system and may reflect a hydrothermalregime associated with changes from hydrostatic towardlithostatic pressure (cf. Arribas et al., 1995). The common oc-currence of quartz breccias in the Abolhassani district indi-cates that the fluid pressure probably increased periodically.High-pressure conditions are not characteristic of steady-state hydrothermal activity (Simmons, 1991) but may havebeen caused by self-sealing at shallow levels due to mineraldeposition or associated with magma ascent from depth (Sim-mons, 1991). When the permeability barrier was broken, thepressure dropped rapidly and the high-temperature (~340°C)fluid was quenched by mixing with the lower temperature(~250°C) fluid, depositing base metal sulfides. This processwas repeated at least two times, as suggested by the observedparagenetic sequence.
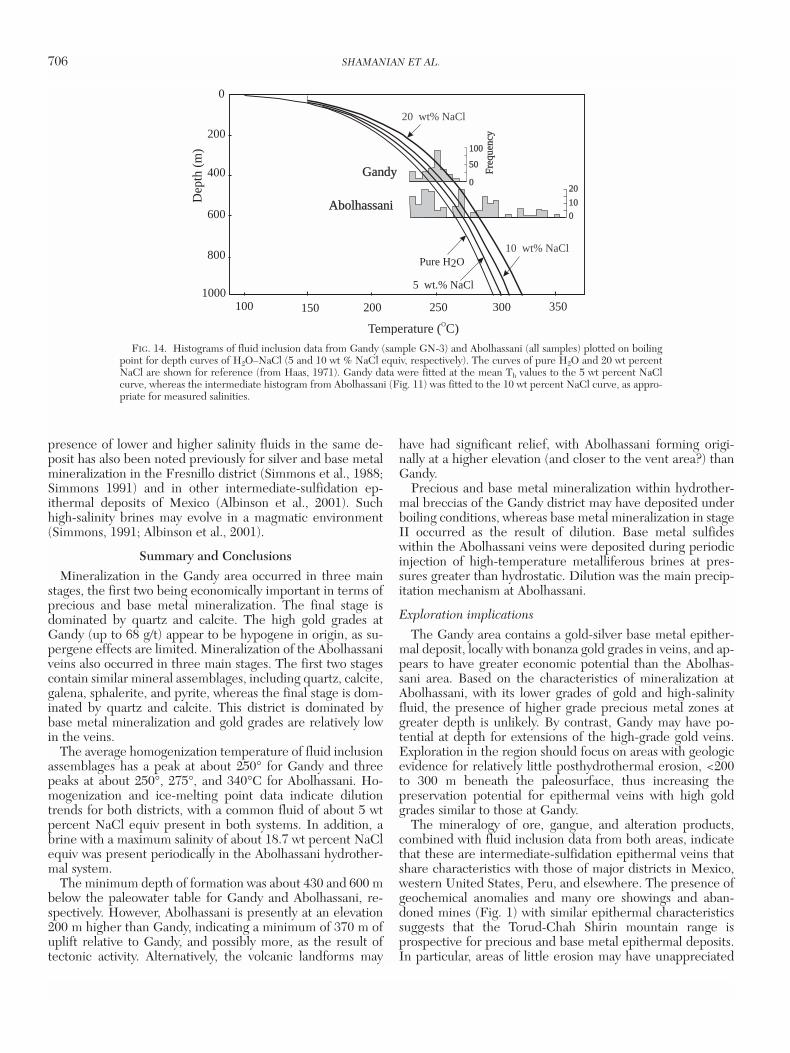
The depth of formation below the paleowater table can beestimated from hydrostatic boiling point curves (Haas, 1971),assuming hydrostatic pressure. However, because of the lackof evidence for boiling, such an estimate will provide a mini-mum value. The Gandy 250°C, 5 wt percent data were fittedto the 5 wt percent calculated boiling curve. In the case ofAbolhassani, the average temperature of the second group inthe histogram, which represents an intermediate 270°C, ~10wt percent salinity fluid (Fig. 12), was fitted to the 10 wt per-cent calculated boiling curve (Fig. 14); if the lower tempera-ture data were used, the result would be similar to Gandy.The 20 wt percent boiling curve is also shown for reference,as this is close to the maximum salinity found at Abolhassani.In both districts mineralization occurred at moderate ep-ithermal depths based on these average fluid compositions,with the present surface at a respective minimum of ~430 and~600 m below the paleowater table for the modeled Gandyand Abolhassani data.
Paleodepths of ~500 m are characteristic of silver- and basemetal-rich epithermal systems of the intermediate-sulfidationcategory (Hedenquist et al., 2000; Albinson et al., 2001). Inboth areas considered here it is possible that mineralizedveins existed at shallower depths and have now been eroded.The present surface at Abolhassani may represent a deeperlevel than Gandy, consistent with the higher Ag/Au ratios andhigher base metal contents at Abolhassani, both of which typ-ically increase with increasing depth in epithermal deposits(Buchanan, 1981). Also, Abolhassani has less oxidation at itspresent higher elevation, suggesting that the oxidized zonemay have been mostly eroded. The average temperatures inthe two areas, as well as the sulfidation state as indicated bysulfide assemblage and FeS compositions of sphalerite, aretypical of the Ag-Au and base metal style of intermediate-sul-fidation epithermal mineralization (Einaudi et al., 2003)noted elsewhere, e.g., in Mexico and Nevada (Albinson et al.,2001; John, 2001).
In summary, base metal-rich mineralization of the Abolhas-sani deposit appears to have been caused by the periodic in-troduction of a high-salinity fluid, with clear evidence for mix-ing between this fluid and a moderate-salinity end membersimilar to that present at Gandy. Similar evidence for the
GANDY AND ABOLHASSANI EPITHERMAL PROSPECTS, NORTHERN IRAN 705
0361-0128/98/000/000-00 $6.00 705
presence of lower and higher salinity fluids in the same de-posit has also been noted previously for silver and base metalmineralization in the Fresnillo district (Simmons et al., 1988;Simmons 1991) and in other intermediate-sulfidation ep-ithermal deposits of Mexico (Albinson et al., 2001). Suchhigh-salinity brines may evolve in a magmatic environment(Simmons, 1991; Albinson et al., 2001).
Summary and ConclusionsMineralization in the Gandy area occurred in three main
stages, the first two being economically important in terms ofprecious and base metal mineralization. The final stage isdominated by quartz and calcite. The high gold grades atGandy (up to 68 g/t) appear to be hypogene in origin, as su-pergene effects are limited. Mineralization of the Abolhassaniveins also occurred in three main stages. The first two stagescontain similar mineral assemblages, including quartz, calcite,galena, sphalerite, and pyrite, whereas the final stage is dom-inated by quartz and calcite. This district is dominated bybase metal mineralization and gold grades are relatively lowin the veins.
The average homogenization temperature of fluid inclusionassemblages has a peak at about 250° for Gandy and threepeaks at about 250°, 275°, and 340°C for Abolhassani. Ho-mogenization and ice-melting point data indicate dilutiontrends for both districts, with a common fluid of about 5 wtpercent NaCl equiv present in both systems. In addition, abrine with a maximum salinity of about 18.7 wt percent NaClequiv was present periodically in the Abolhassani hydrother-mal system.
The minimum depth of formation was about 430 and 600 mbelow the paleowater table for Gandy and Abolhassani, re-spectively. However, Abolhassani is presently at an elevation200 m higher than Gandy, indicating a minimum of 370 m ofuplift relative to Gandy, and possibly more, as the result oftectonic activity. Alternatively, the volcanic landforms may
have had significant relief, with Abolhassani forming origi-nally at a higher elevation (and closer to the vent area?) thanGandy.
Precious and base metal mineralization within hydrother-mal breccias of the Gandy district may have deposited underboiling conditions, whereas base metal mineralization in stageII occurred as the result of dilution. Base metal sulfideswithin the Abolhassani veins were deposited during periodicinjection of high-temperature metalliferous brines at pres-sures greater than hydrostatic. Dilution was the main precip-itation mechanism at Abolhassani.
Exploration implications
The Gandy area contains a gold-silver base metal epither-mal deposit, locally with bonanza gold grades in veins, and ap-pears to have greater economic potential than the Abolhas-sani area. Based on the characteristics of mineralization atAbolhassani, with its lower grades of gold and high-salinityfluid, the presence of higher grade precious metal zones atgreater depth is unlikely. By contrast, Gandy may have po-tential at depth for extensions of the high-grade gold veins.Exploration in the region should focus on areas with geologicevidence for relatively little posthydrothermal erosion, <200to 300 m beneath the paleosurface, thus increasing thepreservation potential for epithermal veins with high goldgrades similar to those at Gandy.
The mineralogy of ore, gangue, and alteration products,combined with fluid inclusion data from both areas, indicatethat these are intermediate-sulfidation epithermal veins thatshare characteristics with those of major districts in Mexico,western United States, Peru, and elsewhere. The presence ofgeochemical anomalies and many ore showings and aban-doned mines (Fig. 1) with similar epithermal characteristicssuggests that the Torud-Chah Shirin mountain range isprospective for precious and base metal epithermal deposits.In particular, areas of little erosion may have unappreciated
706 SHAMANIAN ET AL.
0361-0128/98/000/000-00 $6.00 706
0
1010
20200
600
Dep
th(m
)
0
200
400
800
1000300250150100
Temperature ( C)O
Pure H2O
5 wt.% NaCl
20 wt% NaCl
350200
5050
100100
Freq
uenc
yFr
eque
ncy
AbolhassaniAbolhassani
GandyGandy
10 wt% NaCl
FIG. 14. Histograms of fluid inclusion data from Gandy (sample GN-3) and Abolhassani (all samples) plotted on boilingpoint for depth curves of H2O–NaCl (5 and 10 wt % NaCl equiv, respectively). The curves of pure H2O and 20 wt percentNaCl are shown for reference (from Haas, 1971). Gandy data were fitted at the mean Th values to the 5 wt percent NaClcurve, whereas the intermediate histogram from Abolhassani (Fig. 11) was fitted to the 10 wt percent NaCl curve, as appro-priate for measured salinities.

potential at depth for high-grade gold veins, particularlywhere there is evidence for the presence of relatively lowsalinity hydrothermal systems. In addition, the presence ofother types of deposits indicates that this region is alsoprospective for a variety of styles of volcanic-hosted mineral-ization, depending on the level of erosion. Much of the epi-thermal mineral potential of this arc, and adjacent regions, re-mains untested.
AcknowledgmentsWe are sincerely grateful to the management of the Geo-
logical Survey of Iran, in particular M.T. Korehei and S.Kousari, for providing support in the field. Saeed Alirezaeigave timely advice and encouragement throughout manyparts of this investigation, and Bahram Daneshfar (Universityof Ottawa) provided advice on the lithogeochemical presen-tation. Peter Jones (Carleton University) assisted with theelectron probe work, and Wendy Adi (University of Ottawa)assisted with stable isotope analysis. We thank Ron Hartreefor XRF analysis (University of Ottawa), and Kambeaz Tahieriand George Mrazek for their help with the preparation of pol-ished thin and doubly polished sections. We thank J. Langand S. Turner for their helpful reviews of the paper.
This paper is part of a Ph.D. study by the senior author atthe University of Shahid Beheshti, sponsored by the Ministryof Science, Research, and Technology of Iran, and much ofanalytical work was carried out while the senior author was anexchange Ph.D. student at the University of Ottawa. The sup-port for the work was supplied by research grants to KHHfrom the Natural Science and Research Council of Canada. July 26, 2002; January 30, 2004
REFERENCESAlavi, M., 1991, Tectonic map of the Middle East (scale 1:5,000,000): Geo-
logical Survey of Iran.——1996, Tectonostratigraphic synthesis and structural style of the Alborz
mountain system in northern Iran: Journal of Geodynamics, v. 21, p. 1–33.Albinson, T., Norman, D.I., Cole, D., and Chomiak, B., 2001, Controls on
formation of low-sulfidation epithermal deposits in Mexico: Constraintsfrom fluid inclusion and stable isotope data: Society of Economic Geolo-gists Special Publication 8, p. 1–32.
Arehart, G.B., Chryssoulis, S.L., and Kesler, S.E., 1993, Gold and arsenic iniron sulfides from sediment-hosted disseminated gold deposits: Implica-tions for depositional processes: ECONOMIC GEOLOGY, v. 88, p. 171–185.
Arribas, A., Jr., Cunningham, C.G., Rytuba, J.J., Rye, R.O., Kelly, W.C., Pod-wysocki, M.H., McKee, E.H., and Tosdal, R.M., 1995, Geology, geochronol-ogy, fluid inclusions, and isotope geochemistry of the Rodalquilar gold alu-nite deposit, Spain: ECONOMIC GEOLOGY, v. 90, p. 795–822.
Bakken, B.M., Fleming, R.H., and Hochella, M.F., Jr., 1991, High-resolutionmicroscopy of auriferous pyrite from the Post deposit, Carlin district,Nevada: Minerals, Metals, and Materials Society, Process Mineralogy XI, p.13–23.
Benning, L.G., and Seward, T.M., 1996, Hydrosulfide complexing of Au(I) inhydrothermal solutions from 150 to 400oC and 500 to 1500 bars: Geochim-ica et Cosmochimica Acta, v. 60, p. 1849–1871.
Bodnar, R.J., 1993, Revised equation and table for determining the freezingpoint depression of H2O-NaCl solutions: Geochimica et CosmochimicaActa, v. 57, p. 683–684.
Bodnar, R.J., Reynolds, T.J., and Kuehn, C.A., 1985, Fluid inclusion system-atics in epithermal systems: Reviews in Economic Geology, v. 2, p. 73–97.
Buchanan, L.J., 1981, Precious metal deposits associated with volcanic envi-ronments in the Southwest: Arizona Geological Society Digest 14, p.237–262.
Collins, P.L.F., 1979, Gas hydrate in CO2-bearing fluid inclusions and the useof freezing data for estimation of salinity: ECONOMIC GEOLOGY, v. 74, p.1435–1444.
Cooke, D.R., and Simmons, S.F., 2000, Characteristics and genesis of ep-ithermal gold deposits: Reviews in Economic Geology, v. 13, p. 221–244.
Einaudi, M.T., Hedenquist, J.W., and Inan, E., 2003, Sulfidation state of hy-drothermal fluids: The porphyry-epithermal transition and beyond: Societyof Economic Geologists and Geochemical Society Special Publication 10,p. 285–313.
Faure, G., 1986, Principles of isotope geology, 2nd ed.: New York, John Wileyand Sons, 541 p.
Fleet, M.E., and Mumin, A.H., 1997, Gold-bearing arsenian pyrite and mar-casite and arsenopyrite from Carlin trend gold deposits and laboratory syn-thesis: American Mineralogist, v. 82, p. 182–193.
Fleet, M.E., Chryssoulis, S.L., MacLean, P.J., Davidson, R., and Weisener,C.G., 1993, Arsenian pyrite from gold deposits, Au and As distribution in-vested by SIMS and EMP, and color staining and surface oxidation byLIMS: Canadian Mineralogist, v. 31, p. 1–17.
Geological Survey of Iran, 1995, Explanatory text of geochemical map ofMoaleman (6960), Report 9, v. 1, 33 p.
Giggenbach, W.F., and Stewart, M.K., 1982, Processes controlling the iso-topic composition of steam and water discharges from steam vents andsteam-heated pools in geothermal areas: Geothermics, v. 11, p. 71–80.
Goldstein, R.H., and Reynolds, T.J., 1994, Systematics of fluid inclusions indiagenetic minerals: Society of Economic Paleontologists and Mineralo-gists Short Course 31, 199 p.
Haas, J.L., Jr., 1971, The effect of salinity on the maximum thermal gradientof a hydrothermal system at hydrostatic pressure: ECONOMIC GEOLOGY, v.66, p. 940–946.
Hassanzadeh, J., Ghazi, A.M., Axen, G., and Guest, B., Stockli, D., andTucker, P., 2002, Oligocene mafic-alkaline magmatism in north and north-west of Iran: Evidence for the separation of the Alborz from the Urumieh-Dokhtar magmatic arc [abs.]: Geological Society of America Abstracts withProgram, v. 34, no. 6, p. 331.
Hedenquist, J.W., and Henley, R.W., 1985, Effect of CO2 on freezing pointdepression measurements of fluid inclusions: Evidence from active systemsand application to epithermal studies: ECONOMIC GEOLOGY, v. 80, p.1379–1406.
Hedenquist, J.W., Reyes, A.G., Simmons, S.F., and Taguchi, S., 1992, Thethermal and geochemical structure of geothermal and epithermal systems:A framework for interpreting fluid inclusion data: European Journal ofMineralogy, v. 4, p. 989–1015.
Hedenquist, J.W., Arribas R., A., and Gonzalez-Urien, E., 2000, Exploration forepithermal gold deposits: Reviews in Economic Geology, v. 13, p. 245–277.
Henley, R.W., 1985, The geothermal framework of epithermal deposits: Re-views in Economic Geology, v. 2, p. 1–24.
Hushmandzadeh, A.R., Alavi Naini, M., and Haghipour, A.A., 1978, Evolu-tion of geological phenomenon in Totud area: Geological Survey of IranReport H5, 136 p. (in Farsi).
John, D. A., 2001, Miocene and early Pliocene epithermal gold-silver de-posits in the northern Great Basin, western United States: Characteristics,distribution, and relationship to magmatism: ECONOMIC GEOLOGY, v. 96, p.1827–1853.
Khalatbari, M., 2000, Geological map of Abbas Abad: Geological Survey ofIran.
Kousari, S., 2001, Detail geochemical exploration in Gandy ore field, Moale-man area, southern Damghan: Geological Survey of Iran, unpublished re-port, 210 p.
McDonough, W.F., and Sun, S.-S., 1995, The composition of the earth:Chemical Geology, v. 120, p. 223–253.
Ohmoto, H., and Goldhaber, M.B., 1997, Sulfur and carbon isotopes, inBarnes, H.L., ed., Geochemistry of hydrothermal ore deposits, 3rd ed.: NewYork, John Wiley and Sons, p. 517–611.
Pearce, J.A., and Peate, D.W., 1995, Tectonic implications of the compositionof volcanic arc magmas: Annual Review of Earth and Planetary Science, v.23, p. 251–285.
Roedder, E., 1984, Fluid inclusions: Reviews in Mineralogy, v. 12, 644 p.Seward, T.M., and Barnes, H.L., 1997, Metal transport by hydrothermal ore
fluids, in Barnes, H.L., ed., Geochemistry of hydrothermal ore deposits, 3rd
ed.: New York, John Wiley and Sons, p. 435–486. Shamanian, G.H., 1998, Hammer prospecting of gold in Arghash area (scale
1:20,000), southern Nishabour, Khorasan province, Iran: Geological Surveyof Iran, unpublished report, 100 p. (in Farsi).
Simon, G., Huang, H., Penner-Hahn, J.E., Kesler, S.E., and Kao, L.S., 1999,Oxidation state of gold and arsenic in gold-bearing arsenian pyrite: Ameri-can Mineralogist, v. 84, p. 1071–1079.
GANDY AND ABOLHASSANI EPITHERMAL PROSPECTS, NORTHERN IRAN 707
0361-0128/98/000/000-00 $6.00 707

Simmons, S.F., 1991, Hydrothermal implications of alteration and fluid in-clusion studies in the Fresnillo district, Mexico: Evidence for a brine reser-voir and a descending water table during the formation of hydrothermalAg-Pb-Zn orebodies: ECONOMIC GEOLOGY, v. 86, p. 1579–1601.
Simmons, S.F., Gemmell, B., and Sawkins, F.J., 1988, The Santo Nino silver-lead-zinc vein, Fresnillo district, Zacatecas, Mexico: Part II. Physical andchemical nature of ore-forming solutions: ECONOMIC GEOLOGY, v. 83, p.1619–1641.
Spies, O., Lensch, G., and Mihm, A., 1983, Geochemistry of the post-ophi-olitic Tertiary volcanics between Sabzavar and Quchan/NE-Iran: Geologi-cal Survey of Iran Report 51, p. 247–267.
Taheri, J., and Shamanian, G.H., 2001, Geological map of Kashmar (scale1:100,000): Geological Survey of Iran.
Webster, J.G., and Mann, A.W., 1984, The influence of climate, geomorphol-ogy and primary geology on the supergene migration of gold and silver:Journal of Geochemical Exploration, v. 22, p. 21–42.
708 SHAMANIAN ET AL.
0361-0128/98/000/000-00 $6.00 708
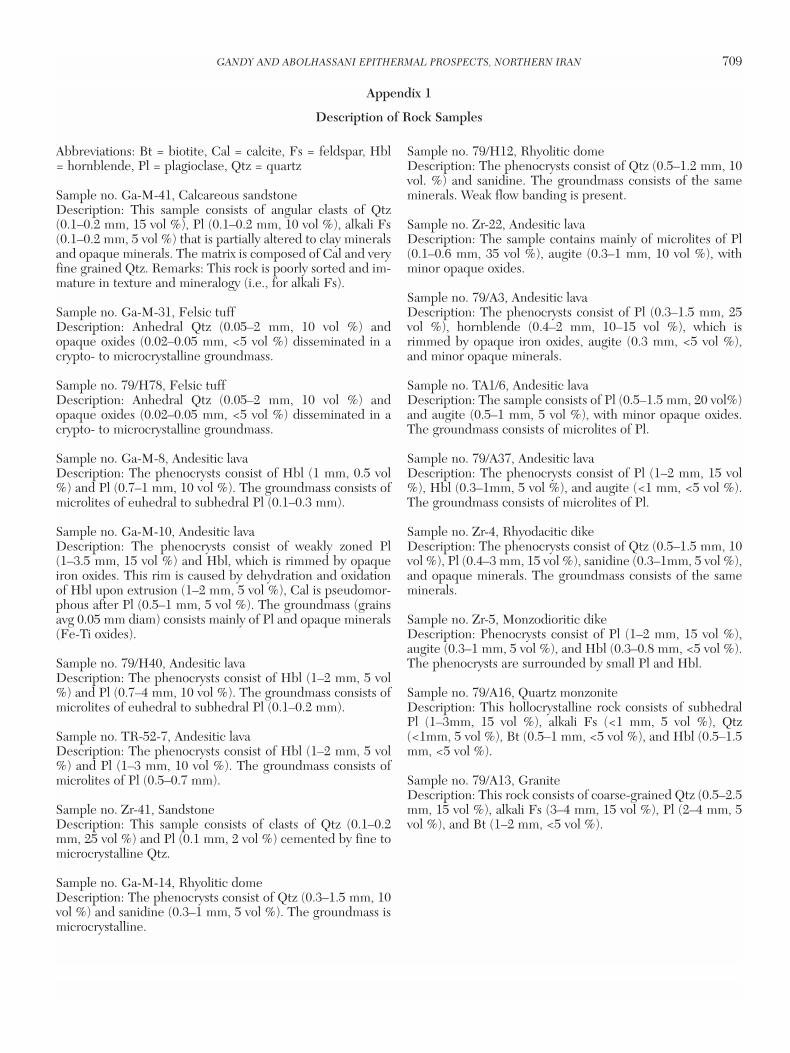
GANDY AND ABOLHASSANI EPITHERMAL PROSPECTS, NORTHERN IRAN 709
0361-0128/98/000/000-00 $6.00 709
Abbreviations: Bt = biotite, Cal = calcite, Fs = feldspar, Hbl= hornblende, Pl = plagioclase, Qtz = quartz
Sample no. Ga-M-41, Calcareous sandstone Description: This sample consists of angular clasts of Qtz(0.1–0.2 mm, 15 vol %), Pl (0.1–0.2 mm, 10 vol %), alkali Fs(0.1–0.2 mm, 5 vol %) that is partially altered to clay mineralsand opaque minerals. The matrix is composed of Cal and veryfine grained Qtz. Remarks: This rock is poorly sorted and im-mature in texture and mineralogy (i.e., for alkali Fs).
Sample no. Ga-M-31, Felsic tuff Description: Anhedral Qtz (0.05–2 mm, 10 vol %) andopaque oxides (0.02–0.05 mm, <5 vol %) disseminated in acrypto- to microcrystalline groundmass.
Sample no. 79/H78, Felsic tuffDescription: Anhedral Qtz (0.05–2 mm, 10 vol %) andopaque oxides (0.02–0.05 mm, <5 vol %) disseminated in acrypto- to microcrystalline groundmass.
Sample no. Ga-M-8, Andesitic lavaDescription: The phenocrysts consist of Hbl (1 mm, 0.5 vol%) and Pl (0.7–1 mm, 10 vol %). The groundmass consists ofmicrolites of euhedral to subhedral Pl (0.1–0.3 mm).
Sample no. Ga-M-10, Andesitic lava Description: The phenocrysts consist of weakly zoned Pl(1–3.5 mm, 15 vol %) and Hbl, which is rimmed by opaqueiron oxides. This rim is caused by dehydration and oxidationof Hbl upon extrusion (1–2 mm, 5 vol %), Cal is pseudomor-phous after Pl (0.5–1 mm, 5 vol %). The groundmass (grainsavg 0.05 mm diam) consists mainly of Pl and opaque minerals(Fe-Ti oxides).
Sample no. 79/H40, Andesitic lavaDescription: The phenocrysts consist of Hbl (1–2 mm, 5 vol%) and Pl (0.7–4 mm, 10 vol %). The groundmass consists ofmicrolites of euhedral to subhedral Pl (0.1–0.2 mm).
Sample no. TR-52-7, Andesitic lavaDescription: The phenocrysts consist of Hbl (1–2 mm, 5 vol%) and Pl (1–3 mm, 10 vol %). The groundmass consists ofmicrolites of Pl (0.5–0.7 mm).
Sample no. Zr-41, SandstoneDescription: This sample consists of clasts of Qtz (0.1–0.2mm, 25 vol %) and Pl (0.1 mm, 2 vol %) cemented by fine tomicrocrystalline Qtz.
Sample no. Ga-M-14, Rhyolitic domeDescription: The phenocrysts consist of Qtz (0.3–1.5 mm, 10vol %) and sanidine (0.3–1 mm, 5 vol %). The groundmass ismicrocrystalline.
Sample no. 79/H12, Rhyolitic dome Description: The phenocrysts consist of Qtz (0.5–1.2 mm, 10vol. %) and sanidine. The groundmass consists of the sameminerals. Weak flow banding is present.
Sample no. Zr-22, Andesitic lavaDescription: The sample contains mainly of microlites of Pl(0.1–0.6 mm, 35 vol %), augite (0.3–1 mm, 10 vol %), withminor opaque oxides.
Sample no. 79/A3, Andesitic lavaDescription: The phenocrysts consist of Pl (0.3–1.5 mm, 25vol %), hornblende (0.4–2 mm, 10–15 vol %), which isrimmed by opaque iron oxides, augite (0.3 mm, <5 vol %),and minor opaque minerals.
Sample no. TA1/6, Andesitic lavaDescription: The sample consists of Pl (0.5–1.5 mm, 20 vol%)and augite (0.5–1 mm, 5 vol %), with minor opaque oxides.The groundmass consists of microlites of Pl.
Sample no. 79/A37, Andesitic lavaDescription: The phenocrysts consist of Pl (1–2 mm, 15 vol%), Hbl (0.3–1mm, 5 vol %), and augite (<1 mm, <5 vol %).The groundmass consists of microlites of Pl.
Sample no. Zr-4, Rhyodacitic dikeDescription: The phenocrysts consist of Qtz (0.5–1.5 mm, 10vol %), Pl (0.4–3 mm, 15 vol %), sanidine (0.3–1mm, 5 vol %),and opaque minerals. The groundmass consists of the sameminerals.
Sample no. Zr-5, Monzodioritic dikeDescription: Phenocrysts consist of Pl (1–2 mm, 15 vol %),augite (0.3–1 mm, 5 vol %), and Hbl (0.3–0.8 mm, <5 vol %).The phenocrysts are surrounded by small Pl and Hbl.
Sample no. 79/A16, Quartz monzoniteDescription: This hollocrystalline rock consists of subhedralPl (1–3mm, 15 vol %), alkali Fs (<1 mm, 5 vol %), Qtz(<1mm, 5 vol %), Bt (0.5–1 mm, <5 vol %), and Hbl (0.5–1.5mm, <5 vol %).
Sample no. 79/A13, GraniteDescription: This rock consists of coarse-grained Qtz (0.5–2.5mm, 15 vol %), alkali Fs (3–4 mm, 15 vol %), Pl (2–4 mm, 5vol %), and Bt (1–2 mm, <5 vol %).
Appendix 1
Description of Rock Samples
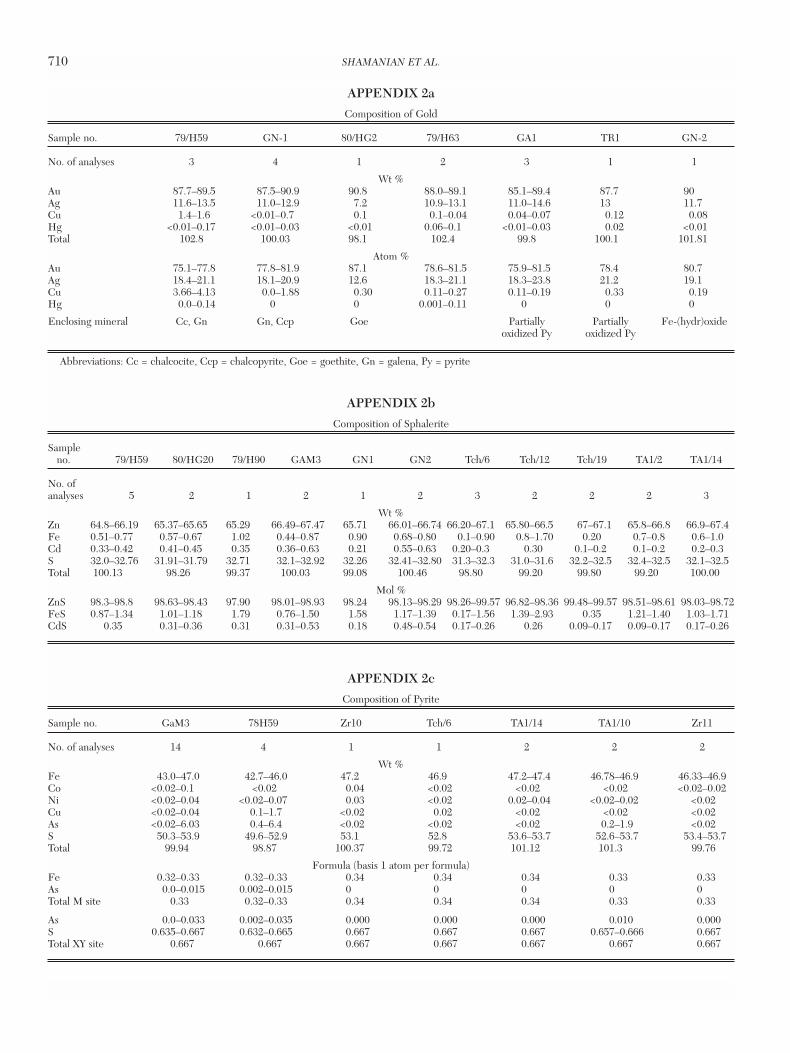
710 SHAMANIAN ET AL.
0361-0128/98/000/000-00 $6.00 710
APPENDIX 2cComposition of Pyrite
Sample no. GaM3 78H59 Zr10 Tch/6 TA1/14 TA1/10 Zr11
No. of analyses 14 4 1 1 2 2 2
Wt %Fe 43.0–47.0 42.7–46.0 47.2 46.9 47.2–47.4 46.78–46.9 46.33–46.9Co <0.02–0.1 <0.02 0.04 <0.02 <0.02 <0.02 <0.02–0.02Ni <0.02–0.04 <0.02–0.07 0.03 <0.02 0.02–0.04 <0.02–0.02 <0.02Cu <0.02–0.04 0.1–1.7 <0.02 0.02 <0.02 <0.02 <0.02As <0.02–6.03 0.4–6.4 <0.02 <0.02 <0.02 0.2–1.9 <0.02S 50.3–53.9 49.6–52.9 53.1 52.8 53.6–53.7 52.6–53.7 53.4–53.7Total 99.94 98.87 100.37 99.72 101.12 101.3 99.76
Formula (basis 1 atom per formula)Fe 0.32–0.33 0.32–0.33 0.34 0.34 0.34 0.33 0.33As 0.0–0.015 0.002–0.015 0 0 0 0 0Total M site 0.33 0.32–0.33 0.34 0.34 0.34 0.33 0.33
As 0.0–0.033 0.002–0.035 0.000 0.000 0.000 0.010 0.000S 0.635–0.667 0.632–0.665 0.667 0.667 0.667 0.657–0.666 0.667Total XY site 0.667 0.667 0.667 0.667 0.667 0.667 0.667
APPENDIX 2bComposition of Sphalerite
Sampleno. 79/H59 80/HG20 79/H90 GAM3 GN1 GN2 Tch/6 Tch/12 Tch/19 TA1/2 TA1/14
No. of analyses 5 2 1 2 1 2 3 2 2 2 3
Wt %Zn 64.8–66.19 65.37–65.65 65.29 66.49–67.47 65.71 66.01–66.74 66.20–67.1 65.80–66.5 67–67.1 65.8–66.8 66.9–67.4Fe 0.51–0.77 0.57–0.67 1.02 0.44–0.87 0.90 0.68–0.80 0.1–0.90 0.8–1.70 0.20 0.7–0.8 0.6–1.0Cd 0.33–0.42 0.41–0.45 0.35 0.36–0.63 0.21 0.55–0.63 0.20–0.3 0.30 0.1–0.2 0.1–0.2 0.2–0.3S 32.0–32.76 31.91–31.79 32.71 32.1–32.92 32.26 32.41–32.80 31.3–32.3 31.0–31.6 32.2–32.5 32.4–32.5 32.1–32.5Total 100.13 98.26 99.37 100.03 99.08 100.46 98.80 99.20 99.80 99.20 100.00
Mol %ZnS 98.3–98.8 98.63–98.43 97.90 98.01–98.93 98.24 98.13–98.29 98.26–99.57 96.82–98.36 99.48–99.57 98.51–98.61 98.03–98.72FeS 0.87–1.34 1.01–1.18 1.79 0.76–1.50 1.58 1.17–1.39 0.17–1.56 1.39–2.93 0.35 1.21–1.40 1.03–1.71CdS 0.35 0.31–0.36 0.31 0.31–0.53 0.18 0.48–0.54 0.17–0.26 0.26 0.09–0.17 0.09–0.17 0.17–0.26
APPENDIX 2aComposition of Gold
Sample no. 79/H59 GN-1 80/HG2 79/H63 GA1 TR1 GN-2
No. of analyses 3 4 1 2 3 1 1
Wt %Au 87.7–89.5 87.5–90.9 90.8 88.0–89.1 85.1–89.4 87.7 90Ag 11.6–13.5 11.0–12.9 7.2 10.9–13.1 11.0–14.6 13 11.7Cu 1.4–1.6 <0.01–0.7 0.1 0.1–0.04 0.04–0.07 0.12 0.08Hg <0.01–0.17 <0.01–0.03 <0.01 0.06–0.1 <0.01–0.03 0.02 <0.01Total 102.8 100.03 98.1 102.4 99.8 100.1 101.81
Atom %Au 75.1–77.8 77.8–81.9 87.1 78.6–81.5 75.9–81.5 78.4 80.7Ag 18.4–21.1 18.1–20.9 12.6 18.3–21.1 18.3–23.8 21.2 19.1Cu 3.66–4.13 0.0–1.88 0.30 0.11–0.27 0.11–0.19 0.33 0.19Hg 0.0–0.14 0 0 0.001–0.11 0 0 0
Enclosing mineral Cc, Gn Gn, Ccp Goe Partially Partially Fe-(hydr)oxideoxidized Py oxidized Py
Abbreviations: Cc = chalcocite, Ccp = chalcopyrite, Goe = goethite, Gn = galena, Py = pyrite

GANDY AND ABOLHASSANI EPITHERMAL PROSPECTS, NORTHERN IRAN 711
0361-0128/98/000/000-00 $6.00 711
Tm(ice) Salinityrange (oC) (mean) Th range Low/mean/ Wt % (oC)
Sample high (no. NaCl Low/mean/no. Type inclusions) equiv high Comments
GA-M-3 S 195/216/225 (12) In clear coreP 231/237/243 (3) In clear core
PS 248/251/252 (14) In yellow borderP 236/242/245 (5) In yellow borderP 274 (1) In yellow borderP 284 (1) In yellow borderS 222/222/224 (13) In clear coreP 230/234/243 (14) In clear core
PS 240/241/241 (4) In yellow borderS 201/202/202 (6) In clear, coreS 224/225/226 (12) In clear coreP 257/258/258 (3) In clear coreP 259/261/262 (13) In clear coreP 234/235/239 (10) In yellow borderP 258/259/260 (10) In clear coreS 208 (6) In clear coreP 253 (2) In yellow borderP –2.7 (1) 4.5 232/234/240 (9) In yellow borderP 290 (1) In yellow borderP 258 (1) In clear coreP 254 (1) In yellow border
PS 243 (2) In yellow borderS 180/186/198 (8) In yellow border
PS 239 (3) In yellow borderS 150/151/152 (9) In yellow borderP 244/245/248 (9) In yellow borderP 277 (1) In yellow border
PS 250/251/252 (8) In clear corePS 250/252/254 (6) In clear corePS 267 (2) In clear coreP 320 (1) In clear zone,
necked?PS 252/253/254 (11) In clear corePS 254/255/255 (8) In clear corePS 253 (2) In clear corePS 253 (2) In clear coreP 356 (1) In clear zone,
neckedPS 252/253/253 (3) In clear coreP 246/247/247 (7) In yellow borderS 208/206/220 (13) In yellow borderP –2.9 (1) 4.8 253 (2) In yellow borderS 227 (5) In yellow borderP 241/242/244 (6) In yellow borderP –2.6 (3) 4.3 244/246/247 (6) In yellow borderP 250/251/252 (2) In clear coreP 254 (2) In yellow borderP 254 (1) In yellow border
Tm(ice) Salinity Th range range (oC) Wt % (oC)
Sample Low/mean/ NaCl Low/mean/no. Type high equiv high Comments
P 255 (1) In clear coreP 256 (2) In clear coreP 252 (1) In yellow borderP 248 (1) In yellow borderP 242 (1) In yellow borderP 265/266/266 (9) In clear zone,
neckedP 238 (1) In clear coreP 244/245/246 (5) In clear coreP 250/251/252 (2) In clear core
PS –2.7 (2) 4.5 251/253/257 (10) In clear corePS 251/253/258 (3) In clear coreP 248 (3) In clear coreP 255 (2) In yellow border
PS 253 (4) In yellow borderPS 253/259/264 (7) In yellow borderPS 253/254/257 (8) In yellow borderPS –3.3/–3.2/–
3.2 (4) 5.3 258/260/263 (5) In clear corePS 251/252/252 (6) In yellow borderS 222/225/230 (10) In clear coreP –2.5 (2) 4.2 251/253/257 (3) In clear coreP –2.9 (1) 4.8 253/254/255 (13) In clear core
79/H51 PS 246 (3) In clear coreP –2.5 (1) 4.2 243 (2) In yellow borderP –3.1 (1) 5.1 256/256/257 (10) In clear coreP 244 (1) In clear coreP –3.1 (3) 5.1 253/254/255 (12) In clear coreP 256/257/258 (6) In clear coreS 216 (6) In clear coreS 194 (5) In clear core
PS 243 (7) In clear coreP 308 (1) in clear zone,
necked?PS 247/252/254 (3) In yellow borderP –3.0 (1) 5.0 257 (1) In clear coreP 242/242/243 (3) In yellow border
79/H59 S 168 (5) In clear coreS 217 (6) In clear coreP –3.1 (2) 5.1 262/263/264 (3) In yellow borderP –3.2 (1) 5.3 267 (4 ) In yellow border
PS 259/259/260 (8) In clear corePS 233/235/236 (4) In yellow borderPS 248/248/249 (8) In yellow borderP –3.3 (2) 5.4 283/285/287 (2) In clear coreS 217 (6) In clear core
PS 273/273/274 (7) In clear corePS 266 (7) In clear coreP >350 (1) In clear zone,
necked
APPENDIX 3Homogenization and Ice-Melting Temperatures of Fluid Inclusion Assemblages in Sphalerite from Gandy (sample locations shown in Fig. 4)
Notes: Number of measured inclusions in each fluid inclusion assemblage shown in parentheses; where Tm value is constant, only one value is listed;Abbreviations: P = primary, PS = pseudosecondary, S = secondary inclusions
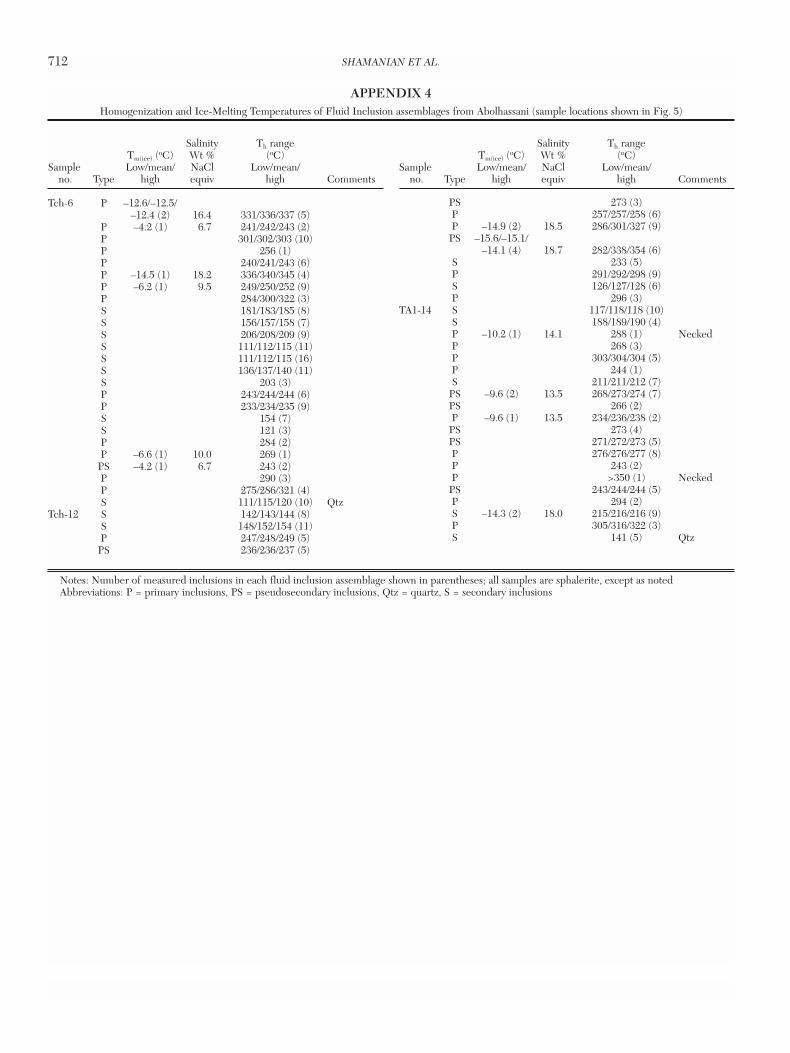
712 SHAMANIAN ET AL.
0361-0128/98/000/000-00 $6.00 712
Salinity Th range Tm(ice) (oC) Wt % (oC)
Sample Low/mean/ NaCl Low/mean/no. Type high equiv high Comments
Tch-6 P –12.6/–12.5/–12.4 (2) 16.4 331/336/337 (5)
P –4.2 (1) 6.7 241/242/243 (2)P 301/302/303 (10)P 256 (1)P 240/241/243 (6)P –14.5 (1) 18.2 336/340/345 (4)P –6.2 (1) 9.5 249/250/252 (9)P 284/300/322 (3)S 181/183/185 (8)S 156/157/158 (7)S 206/208/209 (9)S 111/112/115 (11)S 111/112/115 (16)S 136/137/140 (11)S 203 (3)P 243/244/244 (6)P 233/234/235 (9)S 154 (7)S 121 (3)P 284 (2)P –6.6 (1) 10.0 269 (1)
PS –4.2 (1) 6.7 243 (2)P 290 (3)P 275/286/321 (4)S 111/115/120 (10) Qtz
Tch-12 S 142/143/144 (8)S 148/152/154 (11)P 247/248/249 (5)
PS 236/236/237 (5)
PS 273 (3)P 257/257/258 (6)P –14.9 (2) 18.5 286/301/327 (9)
PS –15.6/–15.1/–14.1 (4) 18.7 282/338/354 (6)
S 233 (5)P 291/292/298 (9)S 126/127/128 (6)P 296 (3)
TA1-14 S 117/118/118 (10)S 188/189/190 (4)P –10.2 (1) 14.1 288 (1) NeckedP 268 (3)P 303/304/304 (5)P 244 (1)S 211/211/212 (7)
PS –9.6 (2) 13.5 268/273/274 (7)PS 266 (2)P –9.6 (1) 13.5 234/236/238 (2)
PS 273 (4)PS 271/272/273 (5)P 276/276/277 (8)P 243 (2)P >350 (1) Necked
PS 243/244/244 (5)P 294 (2)S –14.3 (2) 18.0 215/216/216 (9)P 305/316/322 (3)S 141 (5) Qtz
Notes: Number of measured inclusions in each fluid inclusion assemblage shown in parentheses; all samples are sphalerite, except as notedAbbreviations: P = primary inclusions, PS = pseudosecondary inclusions, Qtz = quartz, S = secondary inclusions
Salinity Th range Tm(ice) (oC) Wt % (oC)
Sample Low/mean/ NaCl Low/mean/no. Type high equiv high Comments
APPENDIX 4Homogenization and Ice-Melting Temperatures of Fluid Inclusion assemblages from Abolhassani (sample locations shown in Fig. 5)

GANDY AND ABOLHASSANI EPITHERMAL PROSPECTS, NORTHERN IRAN 713
0361-0128/98/000/000-00 $6.00 713