Embed Size (px)
Citation preview
AVA Cambridge 2000, Basic Physics and Measurement: THE GAS LAWS
THE GAS LAWS
Some aspects of their importance in anaesthesia
Presentation: Yves Moens, DVM, PhD, Dipl. ECVA
1. Molecular theory 2. The gas laws 3. Adiabatic changes 4. Dalton’s law of partial pressures 5. Avogadro’s hypothesis 6. Universal gas constant 7. Critical temperature 8. Dalton’s law , barometric pressure and water vapour Some References: 1. Basic Physics and Measurement in Anaesthesia; Davis, Parbrook and Kenny;
Butterworth-Heineman, 4th edition. 2. All you really need to know to interpret arterial blood gases; Lawrence Martin; Lea and
Febiger, 1992. 3. Water vapor calibration errors in some capnometers: respiratory conventions
misunderstood by manufacturers? John W. Severinghaus, Anesthesiology 70; 996-998, 1989.
4. Physics applied to anaesthesia, third ed., ISBN 0407 00399. 5. Textbook of Medical Physiology; Arthur C. Guyton; 6thed., WB Saunders. 6. Anesthetic considerations at moderate altitude. MF James, JF White; Anesth Analg
63;1097-1105, 1984.
1
AVA Cambridge 2000, Basic Physics and Measurement: THE GAS LAWS
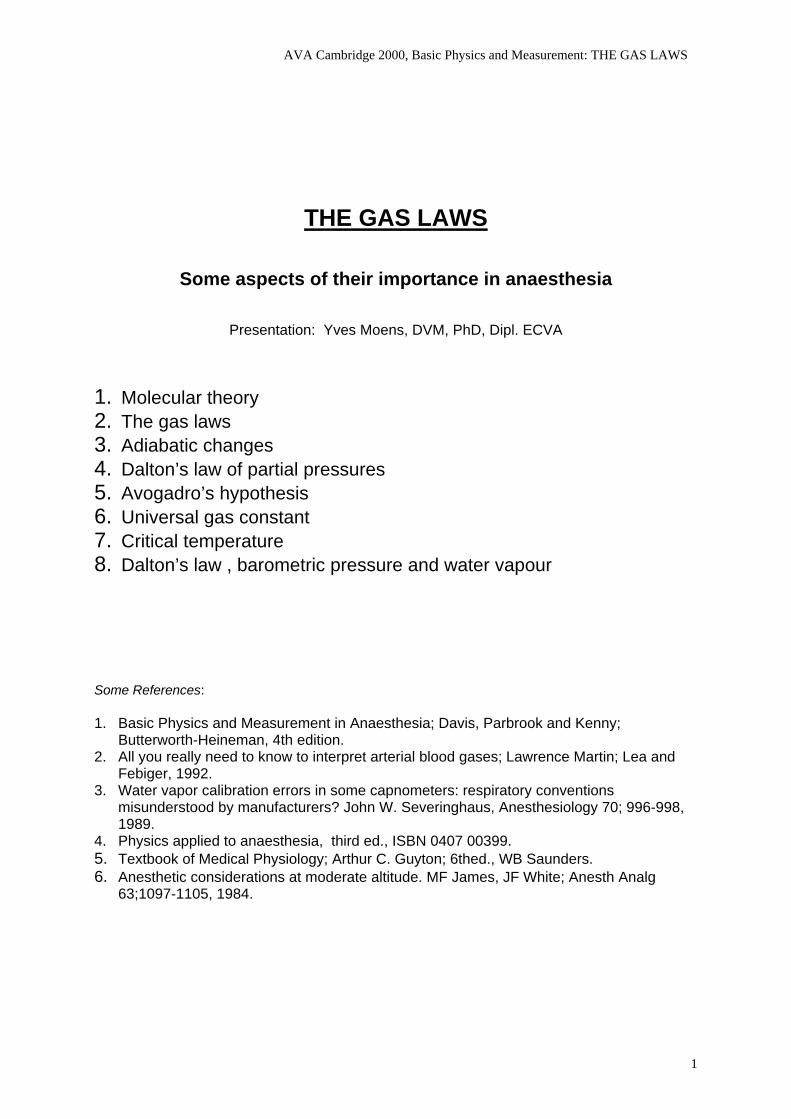
1. MOLECULAR THEORY A brief review of molecular theory is given first because it is a help in understanding the gas laws. All substances are composed of atoms or compounds of atoms, i.e. molecules. In a solid, the atoms or molecules are usually arranged in a regular formation called a lattice and each molecule in the lattice exerts forces on its neighbours and is continuously in motion, oscillating about a mean position. ff heat is added to a solid, each molecule vibrates with a greater amplitude and therefore takes up a greater amount of space. The molecules move further apart and consequentIy the force exerted by each on its neighbours is reduced. Eventually the forces are not sufficient to hold the molecules in a lattice although smaller groupings remain. The lattice breaks down, the substance melts, and turns into a liquid. In a liquid the molecules still exert some influence on each other and the forces of attraction between them are called Van der Waals' forces. The molecules in a liquid have more vibrational energy than in a solid and each one can move about through the liquid. If heat is added to a liquid, each molecule gains further kinetic energy and eventually some are able to overcome the Van der Waals' forces exerted by their neighbours and are able to move about in space. This state is that of a gas or vapour . Figure 1 illustrates the interface between a liquid and its vapour. Molecules at the surface of the liquid occasionally escape, as shown at 'A’
Figure 1 : Interface between a liquid and a gas. in the diagram. Conversely, molecules of gas moving towards the liquid may transfer into the liquid phase, as shown at 'B'. Eventually, at any one temperature an equilibrium occurs between these two rates of molecular transfer and the vapour above the liquid is said to be saturated. li the liquid is heated to its boiling point, the energy of the molecules is so great that they all transfer to the gaseous phase. In a gas, the molecules collide with each other and with the walls of a container at frequent intervals. The result of the collisions between the molecules of a gas and the walls of the container is that a force is exerted on the walls, and this force exerted over a certain area is defined as the pressure.
2
AVA Cambridge 2000, Basic Physics and Measurement: THE GAS LAWS
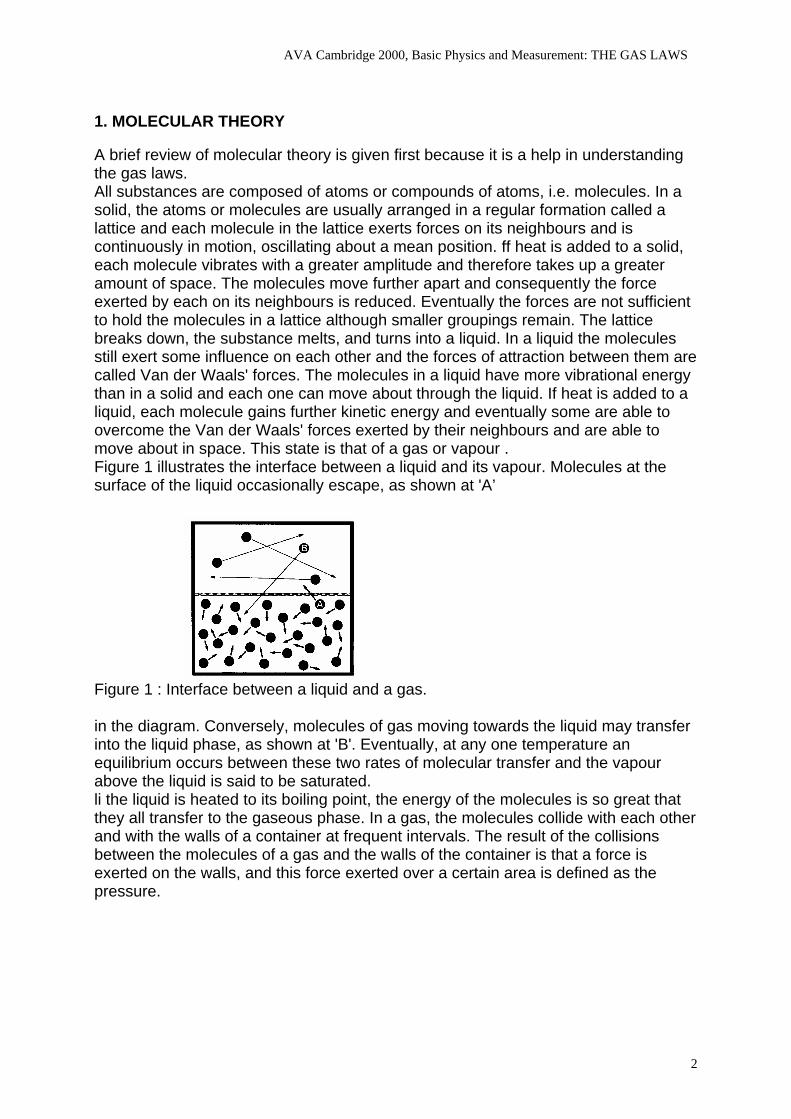
2. THE GAS LAWS Figure 2 illustrates a volume of gas within a large syringe. The collisions between the molecules and the walls of the container result in an absolute pressure P, which in this case is a typical atmospheric pressure of 100 kPa (1 bar). If this syringe is at a constant temperature, the molecules will have a certain energy of motion and will therefore collide with the walls of the container at a given frequency.
Absolute pressure p
Figure 2: Gas in a syringe model to illustrate molecular theory. If the temperature is kept constant and the volume of the container is reduced (Fig. 3), the molecules will still have the same energy of motion but, as they are in a smaller volume, they will collide with the walls of the container more frequently. The greater the number of collisions with the walls, the greater the pressure of the gas in the container. Halving the volume V of the syringe, as in Fig. 3, doubles the absolute pressure p from 100 to 200 kPa.
Figure 3: Effect of volume change at constant temperature.
3
AVA Cambridge 2000, Basic Physics and Measurement: THE GAS LAWS
PV 1∝ )(tan 1ktConsPV =
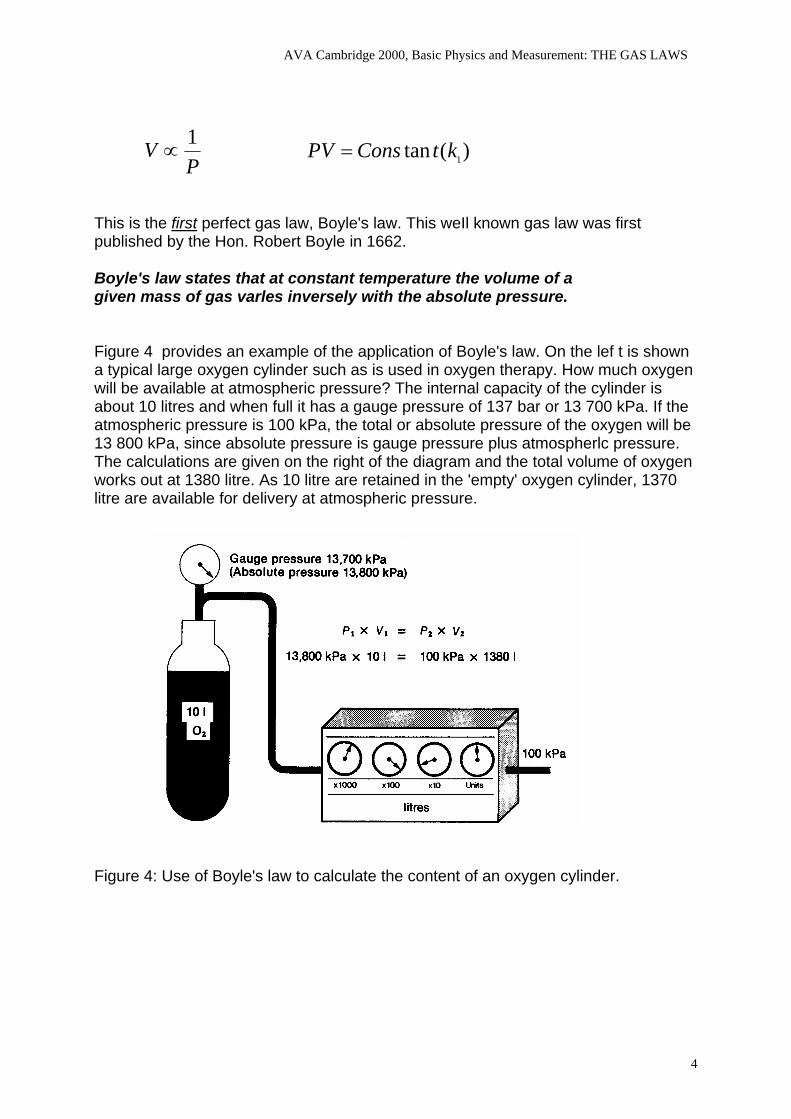
This is the first perfect gas law, Boyle's law. This weIl known gas law was first published by the Hon. Robert Boyle in 1662. Boyle's law states that at constant temperature the volume of a given mass of gas varles inversely with the absolute pressure. Figure 4 provides an example of the application of Boyle's law. On the lef t is shown a typical large oxygen cylinder such as is used in oxygen therapy. How much oxygen will be available at atmospheric pressure? The internal capacity of the cylinder is about 10 litres and when full it has a gauge pressure of 137 bar or 13 700 kPa. If the atmospheric pressure is 100 kPa, the total or absolute pressure of the oxygen will be 13 800 kPa, since absolute pressure is gauge pressure plus atmospherlc pressure. The calculations are given on the right of the diagram and the total volume of oxygen works out at 1380 litre. As 10 litre are retained in the 'empty' oxygen cylinder, 1370 litre are available for delivery at atmospheric pressure.
Figure 4: Use of Boyle's law to calculate the content of an oxygen cylinder.
4
AVA Cambridge 2000, Basic Physics and Measurement: THE GAS LAWS
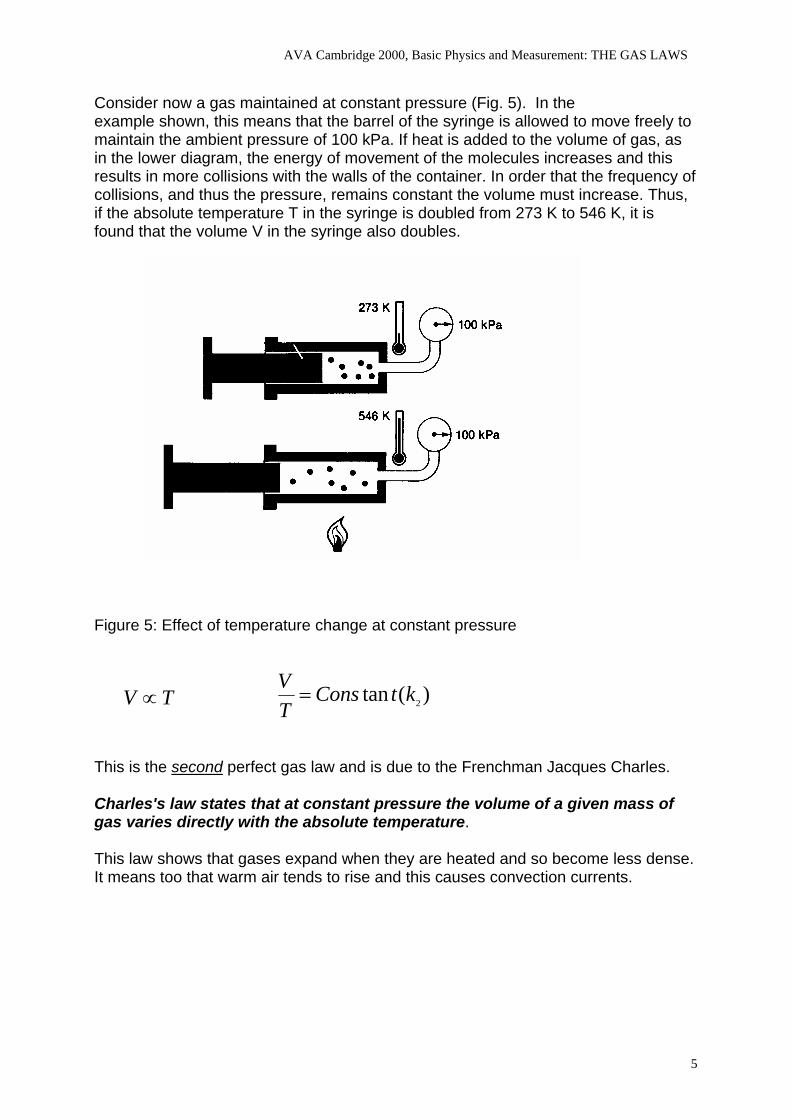
Consider now a gas maintained at constant pressure (Fig. 5). In the example shown, this means that the barrel of the syringe is allowed to move freely to maintain the ambient pressure of 100 kPa. If heat is added to the volume of gas, as in the lower diagram, the energy of movement of the molecules increases and this results in more collisions with the walls of the container. In order that the frequency of collisions, and thus the pressure, remains constant the volume must increase. Thus, if the absolute temperature T in the syringe is doubled from 273 K to 546 K, it is found that the volume V in the syringe also doubles.
Figure 5: Effect of temperature change at constant pressure
)(tan 2ktConsTV=TV ∝
This is the second perfect gas law and is due to the Frenchman Jacques Charles. Charles's law states that at constant pressure the volume of a given mass of gas varies directIy with the absolute temperature. This law shows that gases expand when they are heated and so become less dense. It means too that warm air tends to rise and this causes convection currents.
5
AVA Cambridge 2000, Basic Physics and Measurement: THE GAS LAWS
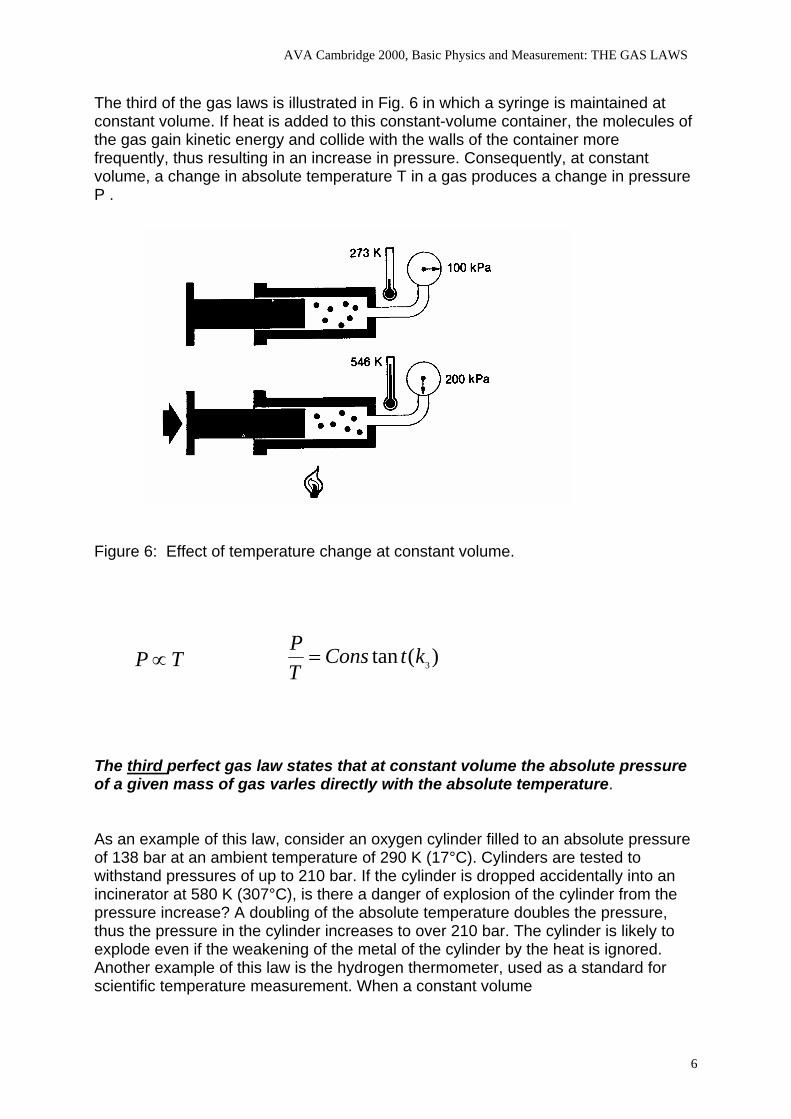
The third of the gas laws is illustrated in Fig. 6 in which a syringe is maintained at constant volume. If heat is added to this constant-volume container, the molecules of the gas gain kinetic energy and collide with the walls of the container more frequently, thus resulting in an increase in pressure. Consequently, at constant volume, a change in absolute temperature T in a gas produces a change in pressure P .
Figure 6: Effect of temperature change at constant volume.
)(tan 3ktConsTP=TP∝
The third perfect gas law states that at constant volume the absolute pressure of a given mass of gas varles directIy with the absolute temperature. As an example of this law, consider an oxygen cylinder filled to an absolute pressure of 138 bar at an ambient temperature of 290 K (17°C). Cylinders are tested to withstand pressures of up to 210 bar. If the cylinder is dropped accidentally into an incinerator at 580 K (307°C), is there a danger of explosion of the cylinder from the pressure increase? A doubling of the absolute temperature doubles the pressure, thus the pressure in the cylinder increases to over 210 bar. The cylinder is likely to explode even if the weakening of the metal of the cylinder by the heat is ignored. Another example of this law is the hydrogen thermometer, used as a standard for scientific temperature measurement. When a constant volume
6
AVA Cambridge 2000, Basic Physics and Measurement: THE GAS LAWS
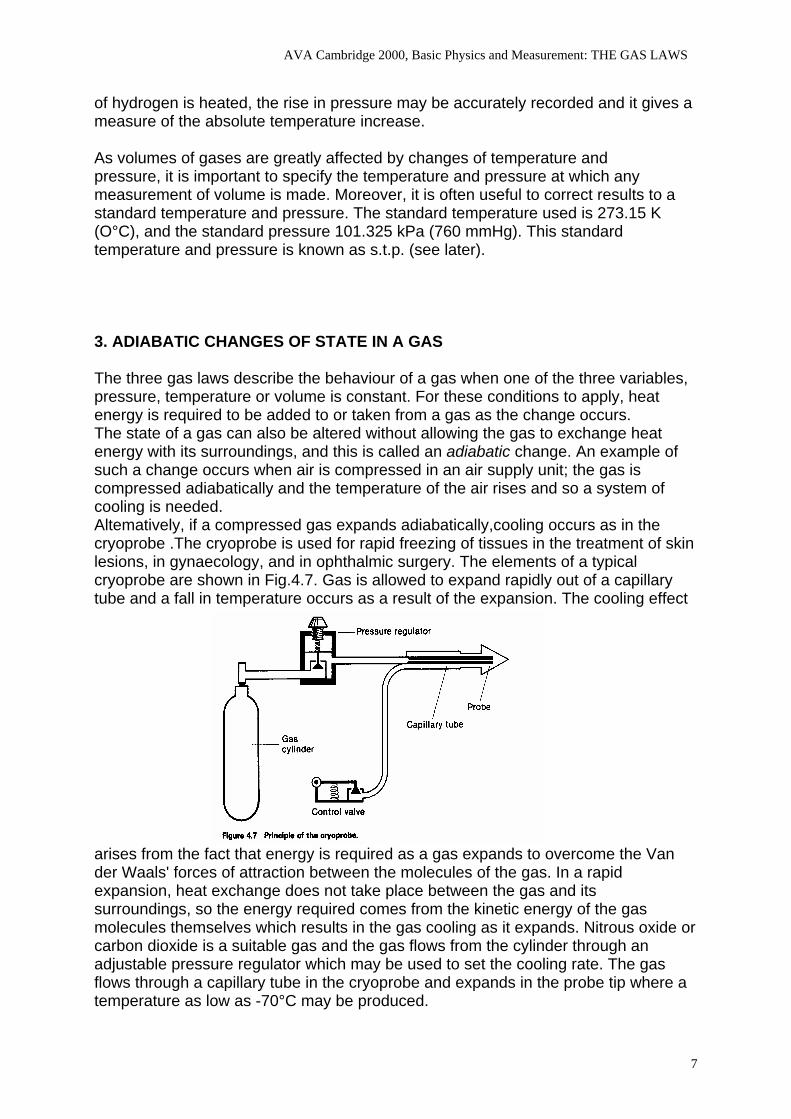
of hydrogen is heated, the rise in pressure may be accurately recorded and it gives a measure of the absolute temperature increase. As volumes of gases are greatly affected by changes of temperature and pressure, it is important to specify the temperature and pressure at which any measurement of volume is made. Moreover, it is often useful to correct results to a standard temperature and pressure. The standard temperature used is 273.15 K (O°C), and the standard pressure 101.325 kPa (760 mmHg). This standard temperature and pressure is known as s.t.p. (see later). 3. ADIABATIC CHANGES OF STATE IN A GAS The three gas laws describe the behaviour of a gas when one of the three variables, pressure, temperature or volume is constant. For these conditions to apply, heat energy is required to be added to or taken from a gas as the change occurs. The state of a gas can also be altered without allowing the gas to exchange heat energy with its surroundings, and this is called an adiabatic change. An example of such a change occurs when air is compressed in an air supply unit; the gas is compressed adiabatically and the temperature of the air rises and so a system of cooling is needed. Altematively, if a compressed gas expands adiabatically,cooling occurs as in the cryoprobe .The cryoprobe is used for rapid freezing of tissues in the treatment of skin lesions, in gynaecology, and in ophthalmic surgery. The elements of a typical cryoprobe are shown in Fig.4.7. Gas is allowed to expand rapidly out of a capillary tube and a fall in temperature occurs as a result of the expansion. The cooling effect
arises from the fact that energy is required as a gas expands to overcome the Van der Waals' forces of attraction between the molecules of the gas. In a rapid expansion, heat exchange does not take place between the gas and its surroundings, so the energy required comes from the kinetic energy of the gas molecules themselves which results in the gas cooling as it expands. Nitrous oxide or carbon dioxide is a suitable gas and the gas flows from the cylinder through an adjustable pressure regulator which may be used to set the cooling rate. The gas flows through a capillary tube in the cryoprobe and expands in the probe tip where a temperature as low as -70°C may be produced.
7
AVA Cambridge 2000, Basic Physics and Measurement: THE GAS LAWS
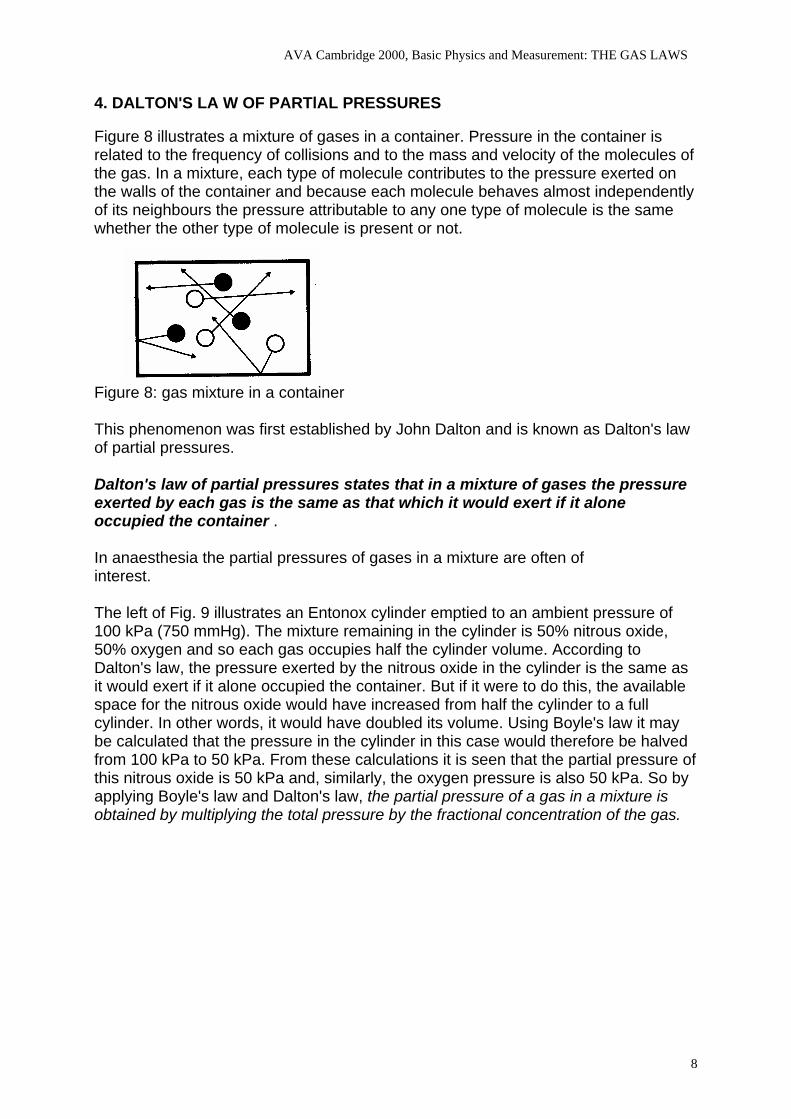
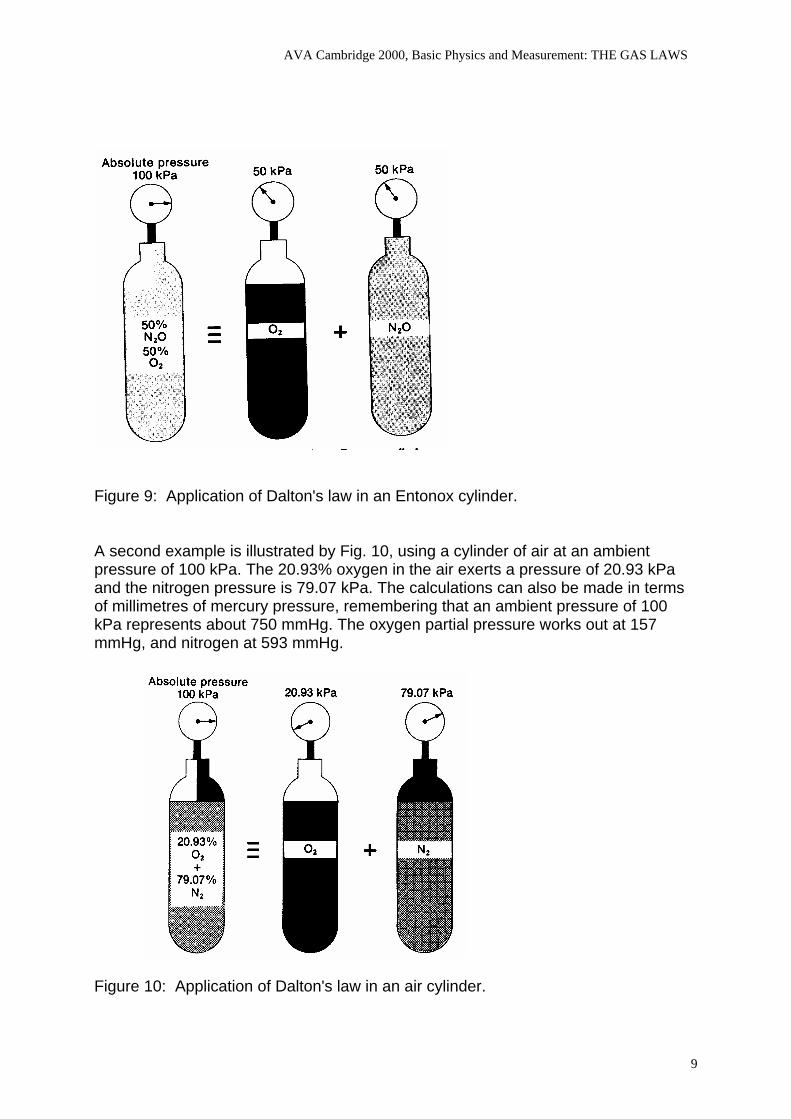
4. DALTON'S LA W OF PARTlAL PRESSURES Figure 8 illustrates a mixture of gases in a container. Pressure in the container is related to the frequency of collisions and to the mass and velocity of the molecules of the gas. In a mixture, each type of molecule contributes to the pressure exerted on the walls of the container and because each molecule behaves almost independently of its neighbours the pressure attributable to any one type of molecule is the same whether the other type of molecule is present or not.
Figure 8: gas mixture in a container This phenomenon was first established by John Dalton and is known as Dalton's law of partial pressures. Dalton's law of partial pressures states that in a mixture of gases the pressure exerted by each gas is the same as that which it would exert if it alone occupied the container . In anaesthesia the partial pressures of gases in a mixture are often of interest. The left of Fig. 9 illustrates an Entonox cylinder emptied to an ambient pressure of 100 kPa (750 mmHg). The mixture remaining in the cylinder is 50% nitrous oxide, 50% oxygen and so each gas occupies half the cylinder volume. According to Dalton's law, the pressure exerted by the nitrous oxide in the cylinder is the same as it would exert if it alone occupied the container. But if it were to do this, the available space for the nitrous oxide would have increased from half the cylinder to a full cylinder. In other words, it would have doubled its volume. Using Boyle's law it may be calculated that the pressure in the cylinder in this case would therefore be halved from 100 kPa to 50 kPa. From these calculations it is seen that the partial pressure of this nitrous oxide is 50 kPa and, similarly, the oxygen pressure is also 50 kPa. So by applying Boyle's law and Dalton's law, the partial pressure of a gas in a mixture is obtained by multiplying the total pressure by the fractional concentration of the gas.
8
AVA Cambridge 2000, Basic Physics and Measurement: THE GAS LAWS
Figure 9: Application of Dalton's law in an Entonox cylinder. A second example is illustrated by Fig. 10, using a cylinder of air at an ambient pressure of 100 kPa. The 20.93% oxygen in the air exerts a pressure of 20.93 kPa and the nitrogen pressure is 79.07 kPa. The calculations can also be made in terms of millimetres of mercury pressure, remembering that an ambient pressure of 100 kPa represents about 750 mmHg. The oxygen partial pressure works out at 157 mmHg, and nitrogen at 593 mmHg.
Figure 10: Application of Dalton's law in an air cylinder.
9
AVA Cambridge 2000, Basic Physics and Measurement: THE GAS LAWS
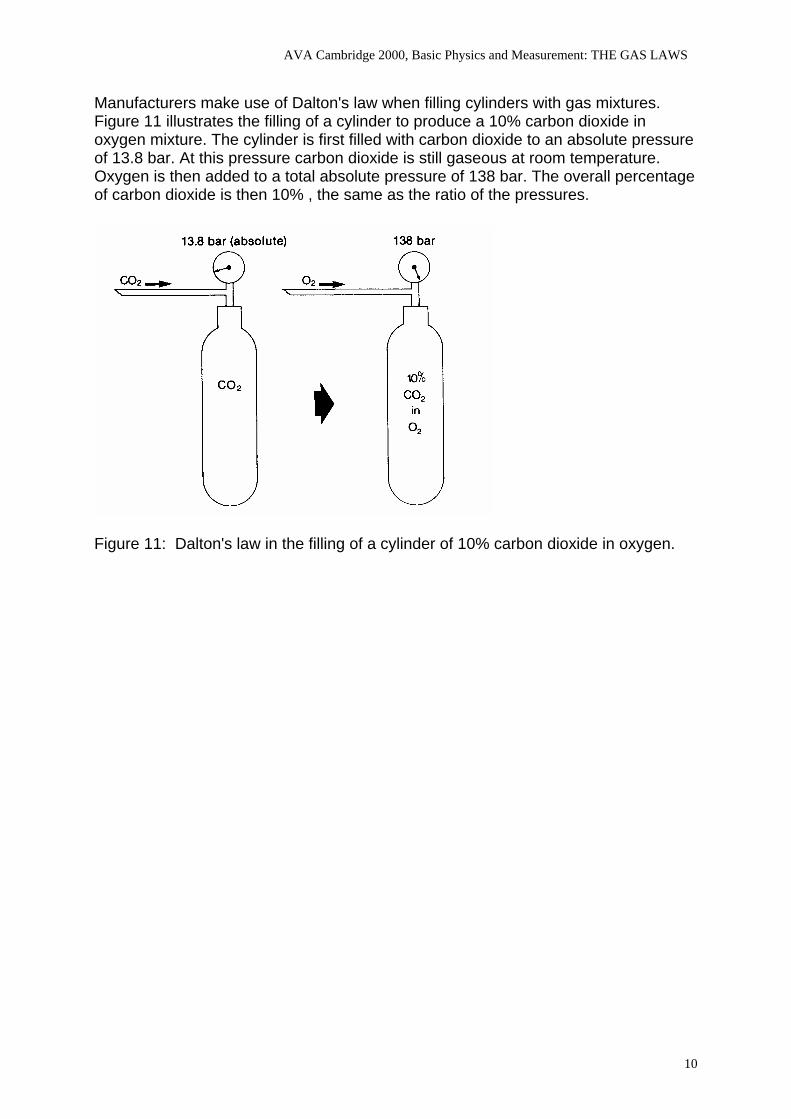
Manufacturers make use of Dalton's law when filling cylinders with gas mixtures. Figure 11 illustrates the filling of a cylinder to produce a 10% carbon dioxide in oxygen mixture. The cylinder is first filled with carbon dioxide to an absolute pressure of 13.8 bar. At this pressure carbon dioxide is still gaseous at room temperature. Oxygen is then added to a total absolute pressure of 138 bar. The overall percentage of carbon dioxide is then 10% , the same as the ratio of the pressures.
Figure 11: Dalton's law in the filling of a cylinder of 10% carbon dioxide in oxygen.
10
AVA Cambridge 2000, Basic Physics and Measurement: THE GAS LAWS
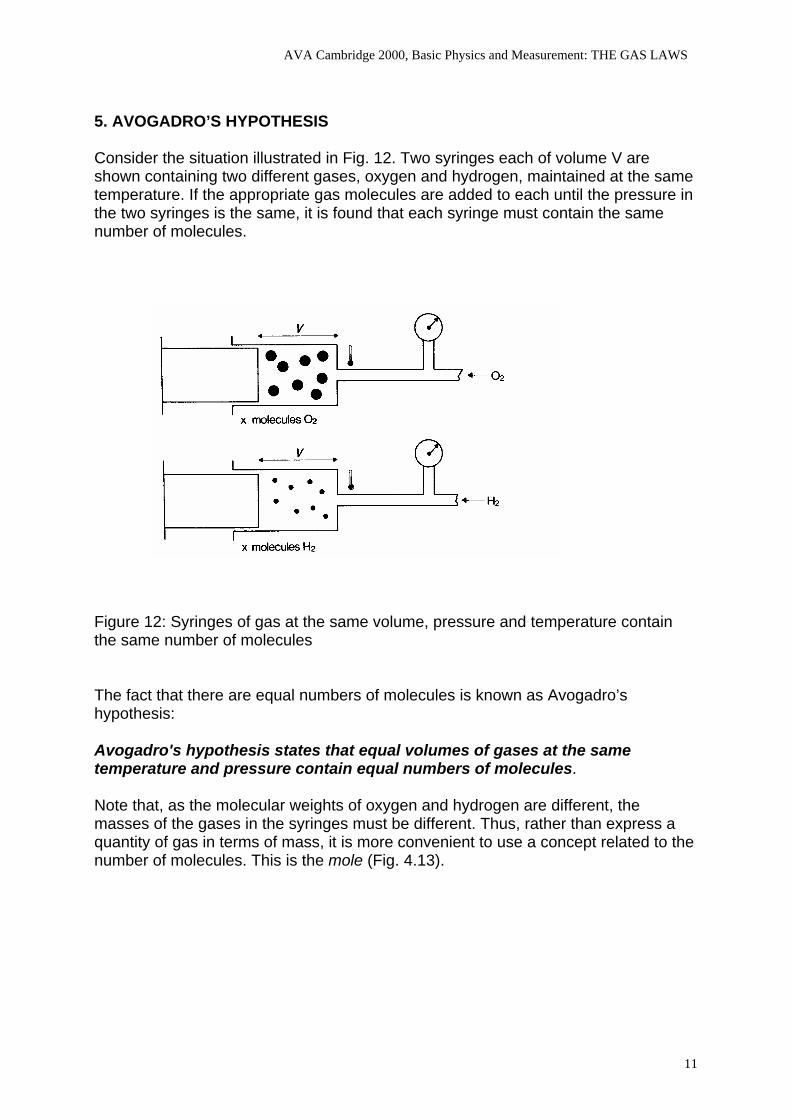
5. AVOGADRO’S HYPOTHESIS Consider the situation illustrated in Fig. 12. Two syringes each of volume V are shown containing two different gases, oxygen and hydrogen, maintained at the same temperature. If the appropriate gas molecules are added to each until the pressure in the two syringes is the same, it is found that each syringe must contain the same number of molecules.
Figure 12: Syringes of gas at the same volume, pressure and temperature contain the same number of molecules The fact that there are equal numbers of molecules is known as Avogadro’s hypothesis: Avogadro's hypothesis states that equal volumes of gases at the same temperature and pressure contain equal numbers of molecules. Note that, as the molecular weights of oxygen and hydrogen are different, the masses of the gases in the syringes must be different. Thus, rather than express a quantity of gas in terms of mass, it is more convenient to use a concept related to the number of molecules. This is the mole (Fig. 4.13).
11
AVA Cambridge 2000, Basic Physics and Measurement: THE GAS LAWS
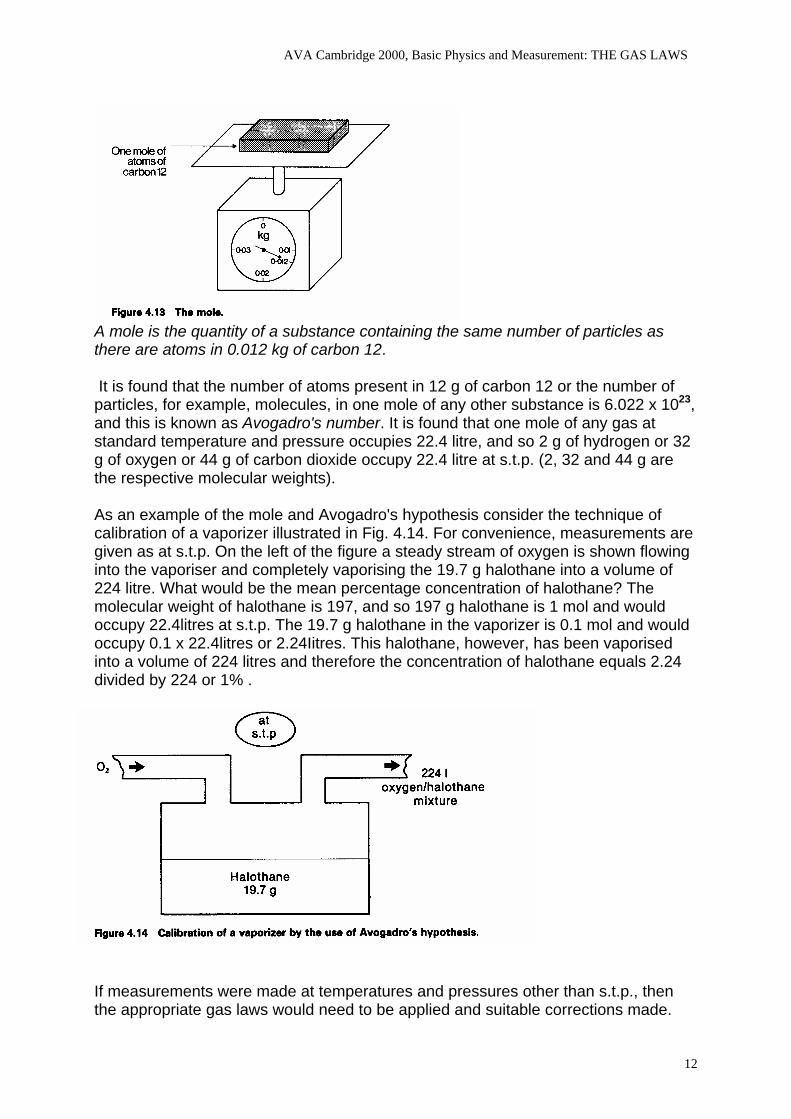
A mole is the quantity of a substance containing the same number of particles as there are atoms in 0.012 kg of carbon 12. It is found that the number of atoms present in 12 g of carbon 12 or the number of particles, for example, molecules, in one mole of any other substance is 6.022 x 10²³, and this is known as Avogadro's number. It is found that one mole of any gas at standard temperature and pressure occupies 22.4 litre, and so 2 g of hydrogen or 32 g of oxygen or 44 g of carbon dioxide occupy 22.4 litre at s.t.p. (2, 32 and 44 g are the respective molecular weights). As an example of the mole and Avogadro's hypothesis consider the technique of calibration of a vaporizer illustrated in Fig. 4.14. For convenience, measurements are given as at s.t.p. On the left of the figure a steady stream of oxygen is shown flowing into the vaporiser and completely vaporising the 19.7 g halothane into a volume of 224 litre. What would be the mean percentage concentration of halothane? The molecular weight of halothane is 197, and so 197 g halothane is 1 mol and would occupy 22.4litres at s.t.p. The 19.7 g halothane in the vaporizer is 0.1 mol and would occupy 0.1 x 22.4litres or 2.24Iitres. This halothane, however, has been vaporised into a volume of 224 litres and therefore the concentration of halothane equals 2.24 divided by 224 or 1% .
If measurements were made at temperatures and pressures other than s.t.p., then the appropriate gas laws would need to be applied and suitable corrections made.
12
AVA Cambridge 2000, Basic Physics and Measurement: THE GAS LAWS
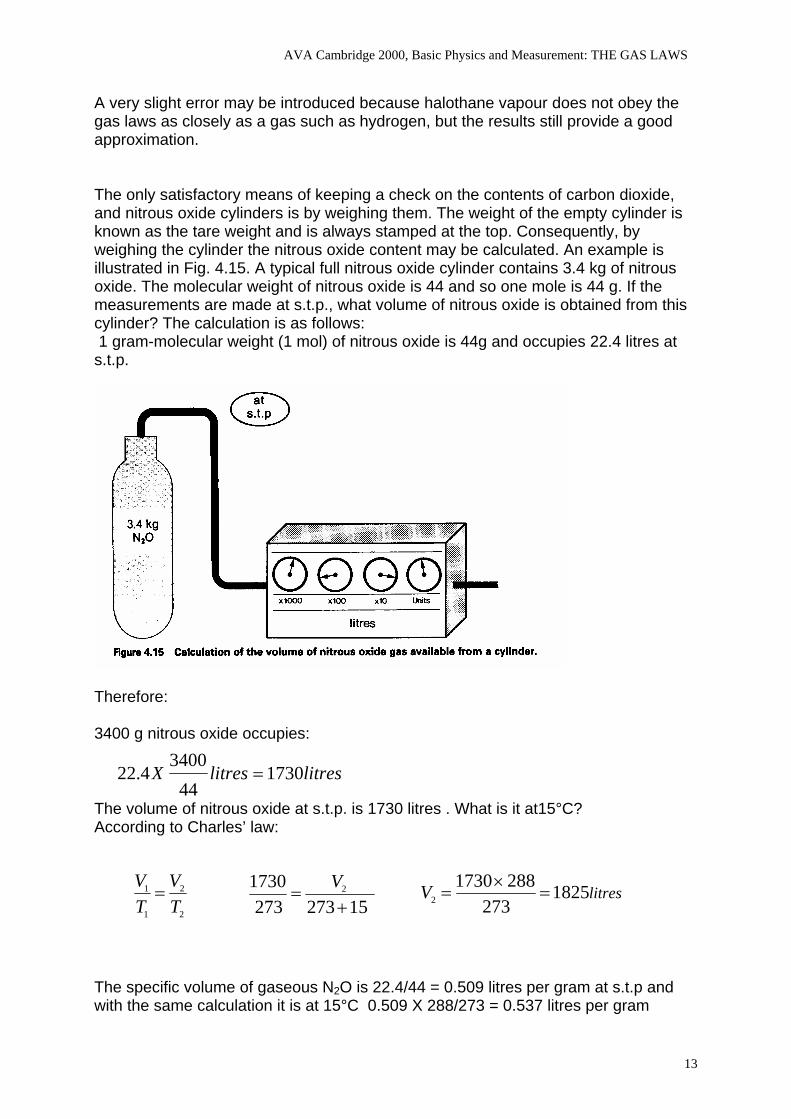
A very slight error may be introduced because halothane vapour does not obey the gas laws as closely as a gas such as hydrogen, but the results still provide a good approximation. The only satisfactory means of keeping a check on the contents of carbon dioxide, and nitrous oxide cylinders is by weighing them. The weight of the empty cylinder is known as the tare weight and is always stamped at the top. Consequently, by weighing the cylinder the nitrous oxide content may be calculated. An example is illustrated in Fig. 4.15. A typical full nitrous oxide cylinder contains 3.4 kg of nitrous oxide. The molecular weight of nitrous oxide is 44 and so one mole is 44 g. If the measurements are made at s.t.p., what volume of nitrous oxide is obtained from this cylinder? The calculation is as follows: 1 gram-molecular weight (1 mol) of nitrous oxide is 44g and occupies 22.4 litres at s.t.p.
Therefore: 3400 g nitrous oxide occupies:
The volume of nitrous oxide at s.t.p. is 1730 litres . What is it at15°C?
litreslitresX 173044
34004.22 =
According to Charles’ law:
2
2
1
1
TV
TV
= litresV 1825273
28817302 =
×=
152732731730 2
+=
V
The specific volume of gaseous N2O is 22.4/44 = 0.509 litres per gram at s.t.p and with the same calculation it is at 15°C 0.509 X 288/273 = 0.537 litres per gram
13
AVA Cambridge 2000, Basic Physics and Measurement: THE GAS LAWS
6. UNIVERSAL GAS CONSTANT The concept of the perfect gas laws can be combined with that of Avogadro's hypothesis and the mole as follows:
)(tan 2ktConsTV= )(tan 3ktCons
TP=)(tan 1ktConsPV =
Therefore:
2
22
1
11
TVP
TVP
=tConsT
PV tan=
nRTPV = It is found that PV/T equals a constant for a given quantity of gas and for 1 mole of any gas PV/T equals a unique constant known as the universal gas constant R. The more generally applicable equation with slight rearrangement can be written as PV = nRT , where n is the number of moles of the gas and may be greater or less than one. This equation has many practical applications. Example1 This formula is applied in anaesthetic practice in the contents gauge of a gas cylinder. The gas cylinder has a fixed volume. Therefore, V in the equation is constant. R is a constant, and if the cylinder is at a fixed temperature, T is constant. Thus, from the formula, P is directIy proportional to n, the number of moles. The pressure in the cylinder is therefore directIy proportional to the number of moles in the cylinder and so to the amount of gas in the cylinder. The pressure gauge thus acts as a contents gauge provided the cylinder contains a gas. Example 2 Suppose that the pressure gauge of a 10 l capacity oxygen cylinder indicates a pressure of 2,000 Ibf /in2 in a laboratory at 20°C, what would be the reading of the gauge if the cylinder was taken into an operating room at 24°C? Assume that the volume of the cylinder remains constant. Provided that the units chosen to express pressure, volume and temperature are the same on both sides of the equation, it does not matter what these units are.
24273
102
20273102
+
×=
+
× POOO 2/2028293
29720002 inlbfP =
×=
14
AVA Cambridge 2000, Basic Physics and Measurement: THE GAS LAWS
Example 3 By the use of this equation, it is possible to change gas volumes measured under one set of conditions to those which would obtain under another set of conditions. This manipulation is often necessary to compare results. It is advocated to quote b.t.p.s. for the conditions under which lung volumes and ventilation are to be measured, a. t. p.s. for maximal inspiratory and expiratory flow rates, and s.t.p.d. for oxygen consumption and carbon dioxide output. b.t.p.s= body temperature and pressure, saturated a.t.p.s.= ambient temperature and pressure, saturated s.t.p.s.= standard temperature and pressure, dry (273 K,101.3 kPa or 760 mmHg) Suppose that a patient expires into a Douglas bag which is then removed into a laboratory at 20°C and squeezed out through a dry gas meter. From a knowledge of the number of expirations collected and the respiratory frequency, the volume of gas at 20°C corresponding to the minute volume can be calculated easily. If the minute volume was six litres, what would this volume, which is measured under the conditions of ambient temperature and pressure, saturated (a.t.p.s.), become when referred back to the conditions of body temperature and pressure, saturated (b. t. p.s. ) ? Assume that the patient's body temperature is 37°C, the saturated vapour pressure of water is 18 mmHg at 20°C and 47 mmHg at 37°C and that the barometric pressure is 760 mmHg. In order to work only in terms of gas pressures, the appropriate water vapour pressures must be subtracted from the barometric pressure (see also later).
37273)47760(
202736)18760( 2
+×−
=+
×− VlitresV 61.6
2937133106742
2 =×××
=
What would be the volume of the six litres, measured under atmospheric conditions, when referred to the conditions of standard temperature and pressure, dry (s.t.p.d.) i.e. 760 mmHg and 0°C?
litresV 45.5293760
27367422 =
×××
=273
76020273
6)18760( 2V×=
+×−
15
AVA Cambridge 2000, Basic Physics and Measurement: THE GAS LAWS
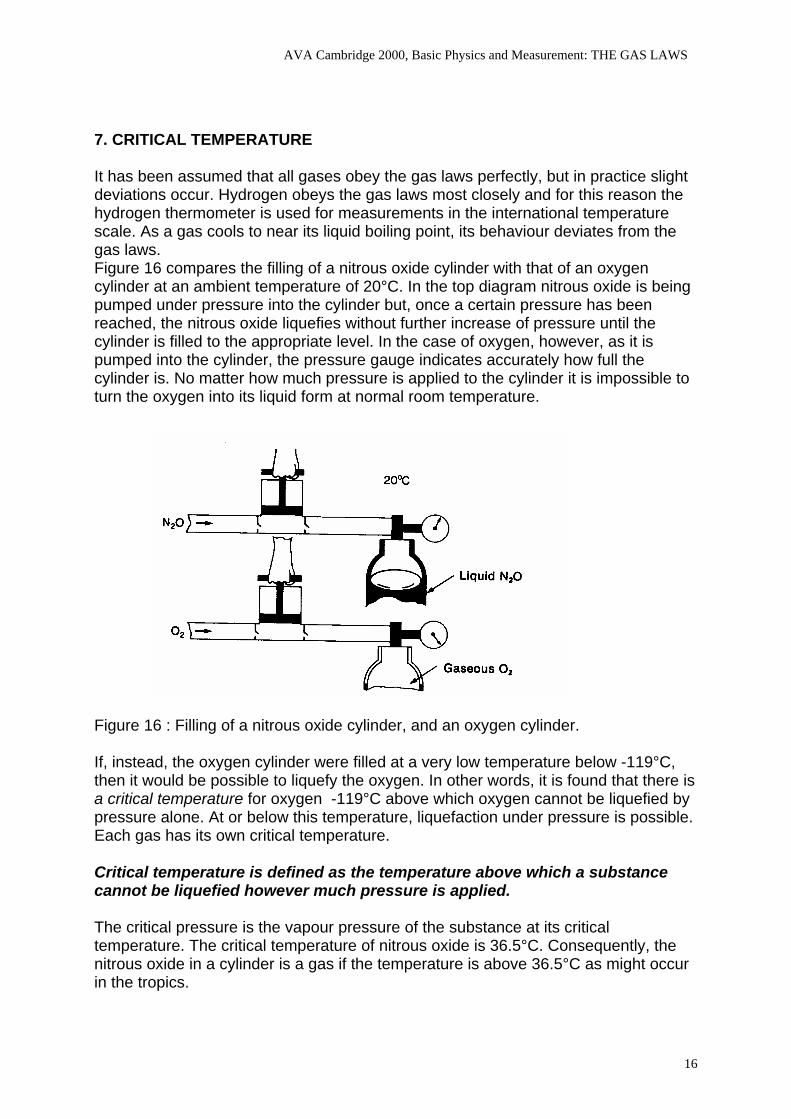
7. CRITICAL TEMPERATURE It has been assumed that all gases obey the gas laws perfectly, but in practice slight deviations occur. Hydrogen obeys the gas laws most closely and for this reason the hydrogen thermometer is used for measurements in the international temperature scale. As a gas cools to near its liquid boiling point, its behaviour deviates from the gas laws. Figure 16 compares the filling of a nitrous oxide cylinder with that of an oxygen cylinder at an ambient temperature of 20°C. In the top diagram nitrous oxide is being pumped under pressure into the cylinder but, once a certain pressure has been reached, the nitrous oxide liquefies without further increase of pressure until the cylinder is filled to the appropriate level. In the case of oxygen, however, as it is pumped into the cylinder, the pressure gauge indicates accurately how full the cylinder is. No matter how much pressure is applied to the cylinder it is impossible to turn the oxygen into its liquid form at normal room temperature.
Figure 16 : Filling of a nitrous oxide cylinder, and an oxygen cylinder. If, instead, the oxygen cylinder were filled at a very low temperature below -119°C, then it would be possible to liquefy the oxygen. In other words, it is found that there is a critical temperature for oxygen -119°C above which oxygen cannot be liquefied by pressure alone. At or below this temperature, liquefaction under pressure is possible. Each gas has its own critical temperature. Critical temperature is defined as the temperature above which a substance cannot be liquefied however much pressure is applied. The critical pressure is the vapour pressure of the substance at its critical temperature. The critical temperature of nitrous oxide is 36.5°C. Consequently, the nitrous oxide in a cylinder is a gas if the temperature is above 36.5°C as might occur in the tropics.
16
AVA Cambridge 2000, Basic Physics and Measurement: THE GAS LAWS
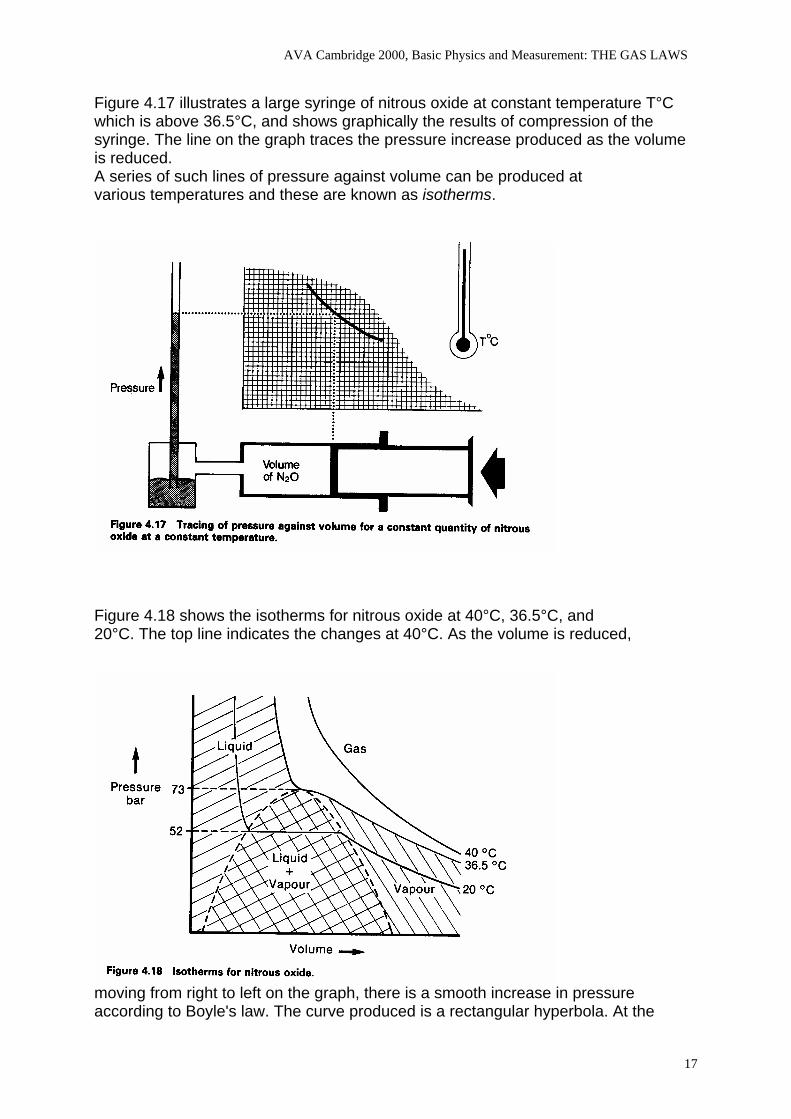
Figure 4.17 illustrates a large syringe of nitrous oxide at constant temperature T°C which is above 36.5°C, and shows graphically the results of compression of the syringe. The line on the graph traces the pressure increase produced as the volume is reduced. A series of such lines of pressure against volume can be produced at various temperatures and these are known as isotherms.
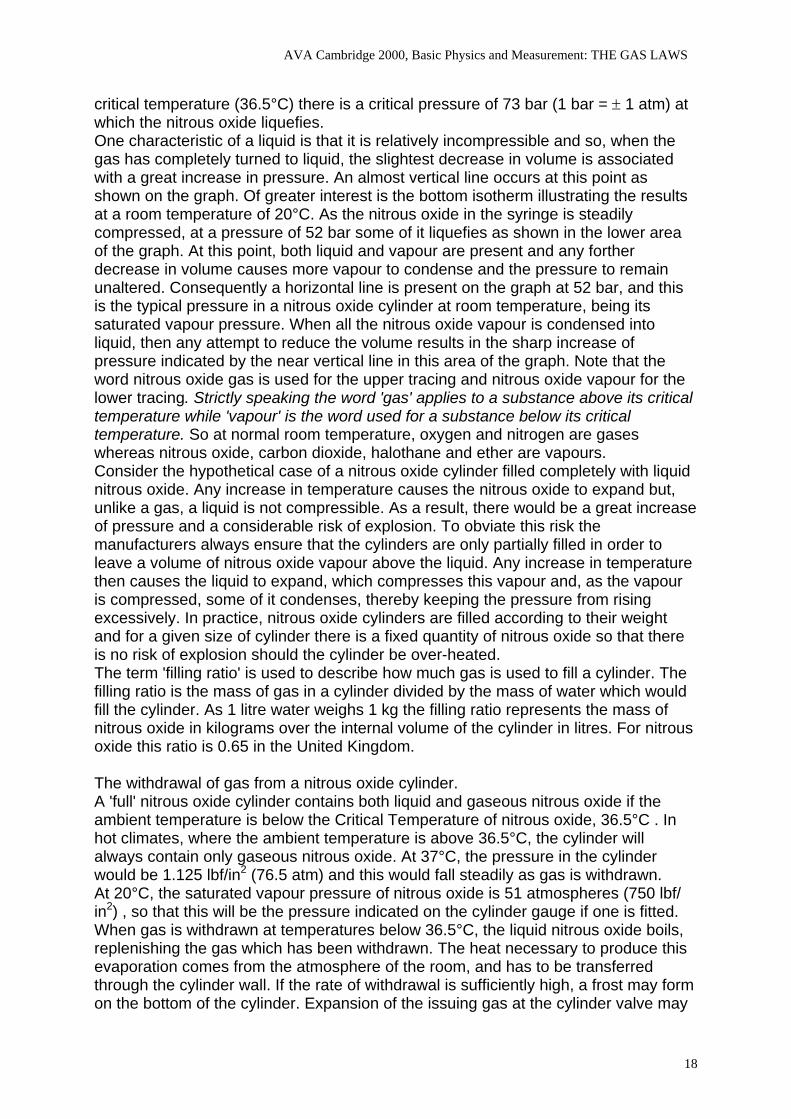
Figure 4.18 shows the isotherms for nitrous oxide at 40°C, 36.5°C, and 20°C. The top line indicates the changes at 40°C. As the volume is reduced,
moving from right to left on the graph, there is a smooth increase in pressure according to Boyle's law. The curve produced is a rectangular hyperbola. At the
17
AVA Cambridge 2000, Basic Physics and Measurement: THE GAS LAWS
critical temperature (36.5°C) there is a critical pressure of 73 bar (1 bar = ± 1 atm) at which the nitrous oxide liquefies. One characteristic of a liquid is that it is relatively incompressible and so, when the gas has completely turned to liquid, the slightest decrease in volume is associated with a great increase in pressure. An almost vertical line occurs at this point as shown on the graph. Of greater interest is the bottom isotherm illustrating the results at a room temperature of 20°C. As the nitrous oxide in the syringe is steadily compressed, at a pressure of 52 bar some of it liquefies as shown in the lower area of the graph. At this point, both liquid and vapour are present and any forther decrease in volume causes more vapour to condense and the pressure to remain unaltered. Consequently a horizontal line is present on the graph at 52 bar, and this is the typical pressure in a nitrous oxide cylinder at room temperature, being its saturated vapour pressure. When all the nitrous oxide vapour is condensed into liquid, then any attempt to reduce the volume results in the sharp increase of pressure indicated by the near vertical line in this area of the graph. Note that the word nitrous oxide gas is used for the upper tracing and nitrous oxide vapour for the lower tracing. Strictly speaking the word 'gas' applies to a substance above its critical temperature while 'vapour' is the word used for a substance below its critical temperature. So at normal room temperature, oxygen and nitrogen are gases whereas nitrous oxide, carbon dioxide, halothane and ether are vapours. Consider the hypothetical case of a nitrous oxide cylinder filled completely with liquid nitrous oxide. Any increase in temperature causes the nitrous oxide to expand but, unlike a gas, a liquid is not compressible. As a result, there would be a great increase of pressure and a considerable risk of explosion. To obviate this risk the manufacturers always ensure that the cylinders are only partially filled in order to leave a volume of nitrous oxide vapour above the liquid. Any increase in temperature then causes the liquid to expand, which compresses this vapour and, as the vapour is compressed, some of it condenses, thereby keeping the pressure from rising excessively. In practice, nitrous oxide cylinders are filled according to their weight and for a given size of cylinder there is a fixed quantity of nitrous oxide so that there is no risk of explosion should the cylinder be over-heated. The term 'filling ratio' is used to describe how much gas is used to fill a cylinder. The filling ratio is the mass of gas in a cylinder divided by the mass of water which would fill the cylinder. As 1 litre water weighs 1 kg the filling ratio represents the mass of nitrous oxide in kilograms over the internal volume of the cylinder in litres. For nitrous oxide this ratio is 0.65 in the United Kingdom. The withdrawal of gas from a nitrous oxide cylinder. A 'full' nitrous oxide cylinder contains both liquid and gaseous nitrous oxide if the ambient temperature is below the Critical Temperature of nitrous oxide, 36.5°C . In hot climates, where the ambient temperature is above 36.5°C, the cylinder will always contain only gaseous nitrous oxide. At 37°C, the pressure in the cylinder would be 1.125 lbf/in2 (76.5 atm) and this would fall steadily as gas is withdrawn. At 20°C, the saturated vapour pressure of nitrous oxide is 51 atmospheres (750 lbf/ in2) , so that this will be the pressure indicated on the cylinder gauge if one is fitted. When gas is withdrawn at temperatures below 36.5°C, the liquid nitrous oxide boils, replenishing the gas which has been withdrawn. The heat necessary to produce this evaporation comes from the atmosphere of the room, and has to be transferred through the cylinder wall. If the rate of withdrawal is sufficiently high, a frost may form on the bottom of the cylinder. Expansion of the issuing gas at the cylinder valve may
18
AVA Cambridge 2000, Basic Physics and Measurement: THE GAS LAWS
cause a marked cooling, and for this reason precautions are taken by the manufacturer to ensure that the gas is dry. This prevents ice formation from blocking the valve. In practice it is possible for the issuing gas to have a temperature of -60°C. The cylinder pressure gauge will indicate a steady pressure of 750 Ibf/in2 as long as any liquid nitrous oxide remains in the cylinder. Once this has all evaporated, only gaseous nitrous oxide remains, and the pressure then falls steadily until the cylinder is empty. This is in contrast to the case of an oxygen cylinder where the cylinder pressure falls steadily all the time gas is withdrawn. Hence the pressure gauge on a nitrous oxide cylinder does not provide a reliable indication of the capacity of gas within the cylinder. The better method is to weigh the cylinder PSEUDO-CRITICAL TEMPERATURE The term 'critical temperature' applies to a single gas. When a mixture of gases is present such as the 'Entonox' mixture of 50% nitrous oxide and 50% oxygen, there is a specific critical temperature at which the gas mixture may separate out into its constituents. This is a different concept to the critical temperature of a single gas, and so the term 'pseudo-critical temperature' is often used for such gas mixtures. In the case of Entonox cylinders it is found that there is a risk of separation if the temperature in the cylinder falls below -5.5°C. Such separation is most likely if the cylinder pressure before cooling is 117 bar and is found to be less likely at higher or lower pressures. In Entonox in pipelines, for instance, the pseudo-critical temperature is much lower. It is below -30°C at the pipeline pressure of 4.1 bar. Consequently, there is normally no risk of separation of the nitrous oxide mixture in pipelines. THE ABSOLUTE SCALE OF TEMPERATURE On the Celsius Scale of temperature, the temperature of melting ice is taken as 0°C. On the Absolute Scale, 0°Absolute is the lowest possible temperature that can ever be attained, and corresponds to -273°C. The intervals corresponding to a degree are the same on both Celsius and Absolute Scales. Thus 0°C corresponds to 273° A. There are no negative temperatures on the Absolute Scale. In order to convert °C to ° A, simply add 273, e.g. 20°C = 293° A. °K is more usually written than °A. It is so-calIed after Lord Kelvin who contributed much to the study of heat.
19
AVA Cambridge 2000, Basic Physics and Measurement: THE GAS LAWS
8. DALTON’s LAW, BAROMETRIC PRESSURE AND WATER VAPOUR Normal PaO2 is dependent on FIO2 and barometric pressure, as weIl as the patient's age. Air consists of a mixture of gases containing approximately 21% oxygen, 78% nitrogen and 1% inert gases, a composition that is unchanged throughout the breathable atmosphere. At any altitude the fraction of inspired oxygen (FIO2 ) is 0.21. FIO2 is sometimes written as a percentage, e.g., 21 %. Barometric pressure is a function of the weight of the atmosphere above the point of measurement. At sea level the barometric pressure averages 760 mm Hg, i.e., air pressure at sea level will sustain a closed column of mercury 760 mm high. The higher the altitude, the less weight of air at that point and the lower the barometric pressure. At the highest point on earth, the summit of Mt. Everest, barometric pressure is only 253 mm Hg Barometric pressure is the sum of the pressures of all the constituent gases. Each gas exerts its own "partial pressure, which is the same pressure it would exert if no other gases were present (Dalton’s Law). The partial pressure of any gas in dry air is the percentage of gas in the air times the barometric pressure:
P GAS in dry air = percentage of gas x PB
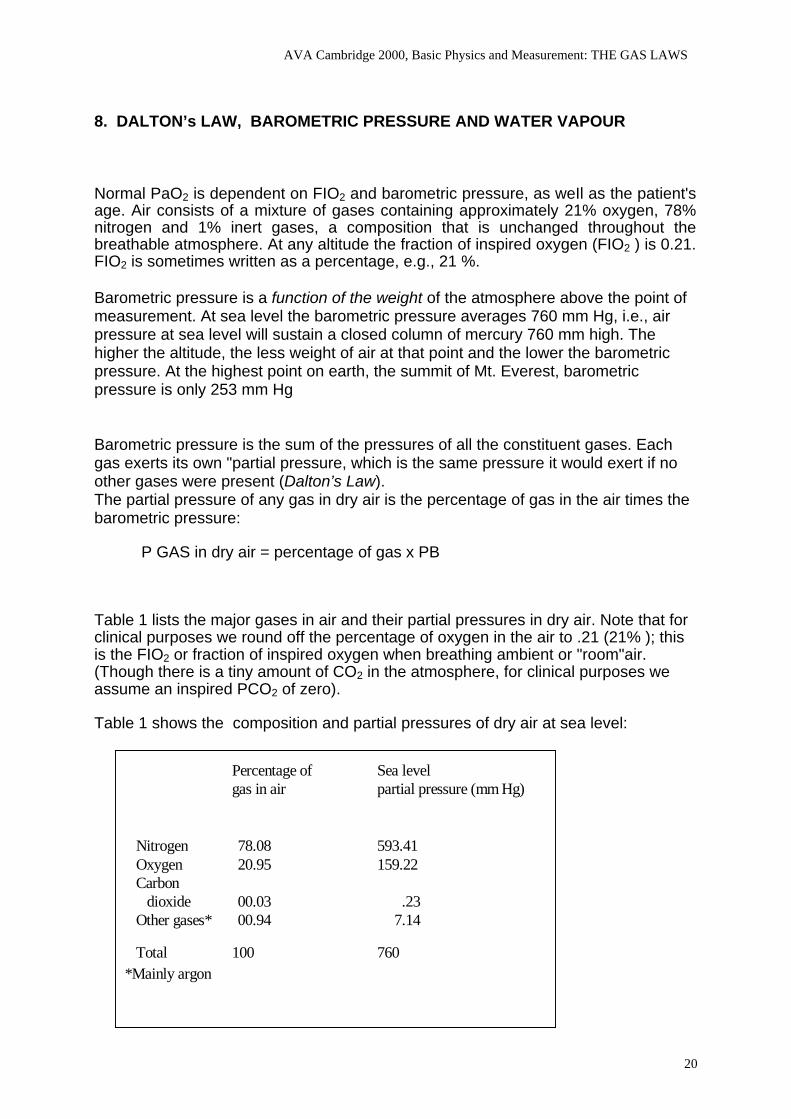
Table 1 lists the major gases in air and their partial pressures in dry air. Note that for clinical purposes we round off the percentage of oxygen in the air to .21 (21% ); this is the FIO2 or fraction of inspired oxygen when breathing ambient or "room"air. (Though there is a tiny amount of CO2 in the atmosphere, for clinical purposes we assume an inspired PCO2 of zero).
Table 1 shows the composition and partial pressures of dry air at sea level:
*Mainly argon
Percentage of Sea levelgas in air partial pressure (mm Hg)
Nitrogen 78.08 593.41Oxygen 20.95 159.22Carbon
dioxide 00.03 .23Other gases* 00.94 7.14
Total 100 760
20
AVA Cambridge 2000, Basic Physics and Measurement: THE GAS LAWS
Why dry air? Air often contains water vapour, which exerts its own partial pressure: To obtain the partial pressure of any gas such as oxygen or nitrogen, water vapor pressure must first be substracted from the barometric pressure since it dilutes out all the dry gases. Depending on the climate, the amount of water vapor in ambient air varies from zero to fuIly saturated, and the partial pressure of water vapor from zero to over 50 mm Hg. For example, if ambient air is partIy saturated so that PH20 is 27 mm Hg, then
P GAS = percentage of gas x (PB -27 mm Hg).
Regardless of the PH20 in ambient air, once air is inhaled it becomes fully saturated in the upper airway; hence all inspired air has a water vapor pressure of 47 mm Hg. at 37°C (water vapor pressure varies slightly with body temperature but the resulting changes in dry gas pressure are trivial). For this reason, knowledge of the ambient air PH20 is not clinicaIly important.
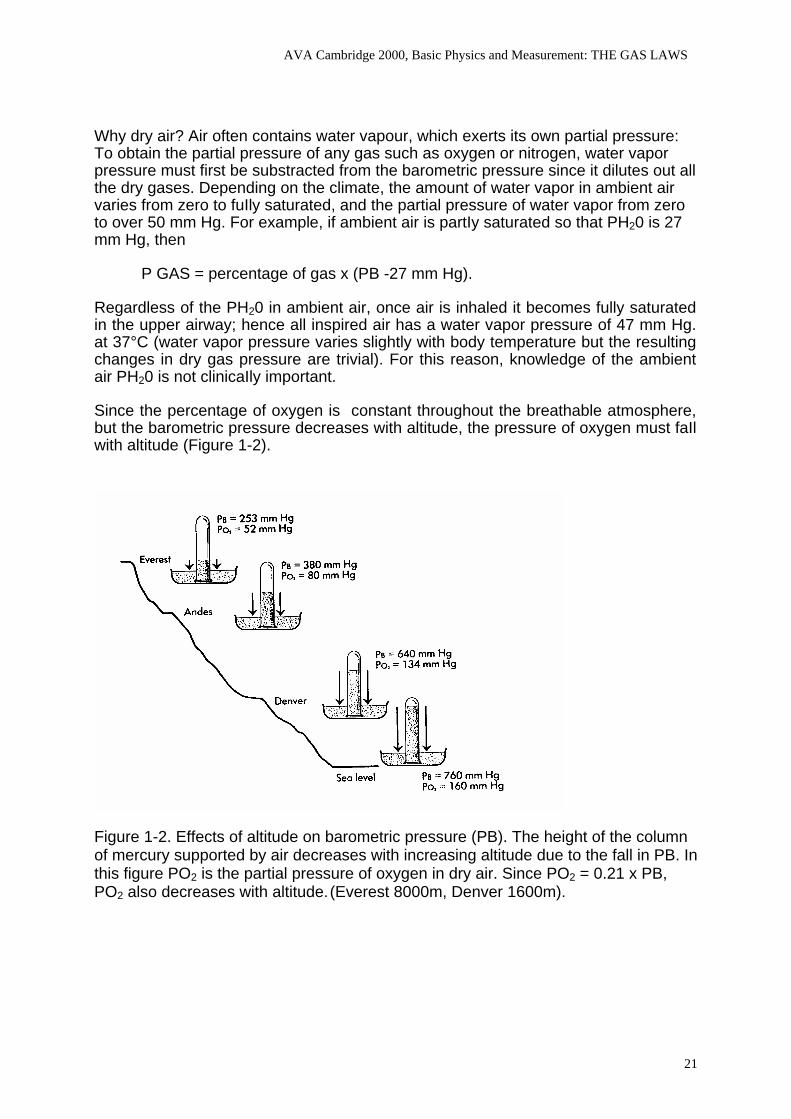
Since the percentage of oxygen is constant throughout the breathable atmosphere, but the barometric pressure decreases with altitude, the pressure of oxygen must faIl with altitude (Figure 1-2).
Figure 1-2. Effects of altitude on barometric pressure (PB). The height of the column of mercury supported by air decreases with increasing altitude due to the fall in PB. In this figure PO2 is the partial pressure of oxygen in dry air. Since PO2 = 0.21 x PB, PO2 also decreases with altitude. (Everest 8000m, Denver 1600m).
21
AVA Cambridge 2000, Basic Physics and Measurement: THE GAS LAWS
To maintain acceptable oxygen levels at extreme altitude there are two broad options: change the environment or adapt physiologicaIly.
The first option involves increasing either the FIO2 or the barometric pressure. Airplane cabins are pressurized to the pressure existing around 2000 m (PB around 580 mmHg) whenever planes fly higher than this altitude; this pressurization aIlows FIO2 to be kept at 0.21 (the air outside the plane that is used to pressurize contains always 21% O2) throughout the flight no matter how high they fly. Pressurization is of course not feasible out in the open. The drop in PB (from 760 at sea level to 580 mmHg in the pressurised cabin) and thus of PaO2 of the passenger has insignificant physiological consequences for the healthy person ( decreasing saturation; see oxyhemoglobin dissociation curve) but it will be more sigificant for a person with mild COPD although it should pose no clinical problem if his PaO2 at sea level is 75 mmHg. If the cabin depressurises oxygen is delivered via oxygen masks. Mountain climbers carry portable oxygen to increase their FIO2 at extreme altitudes (e.g., above 6600 m)
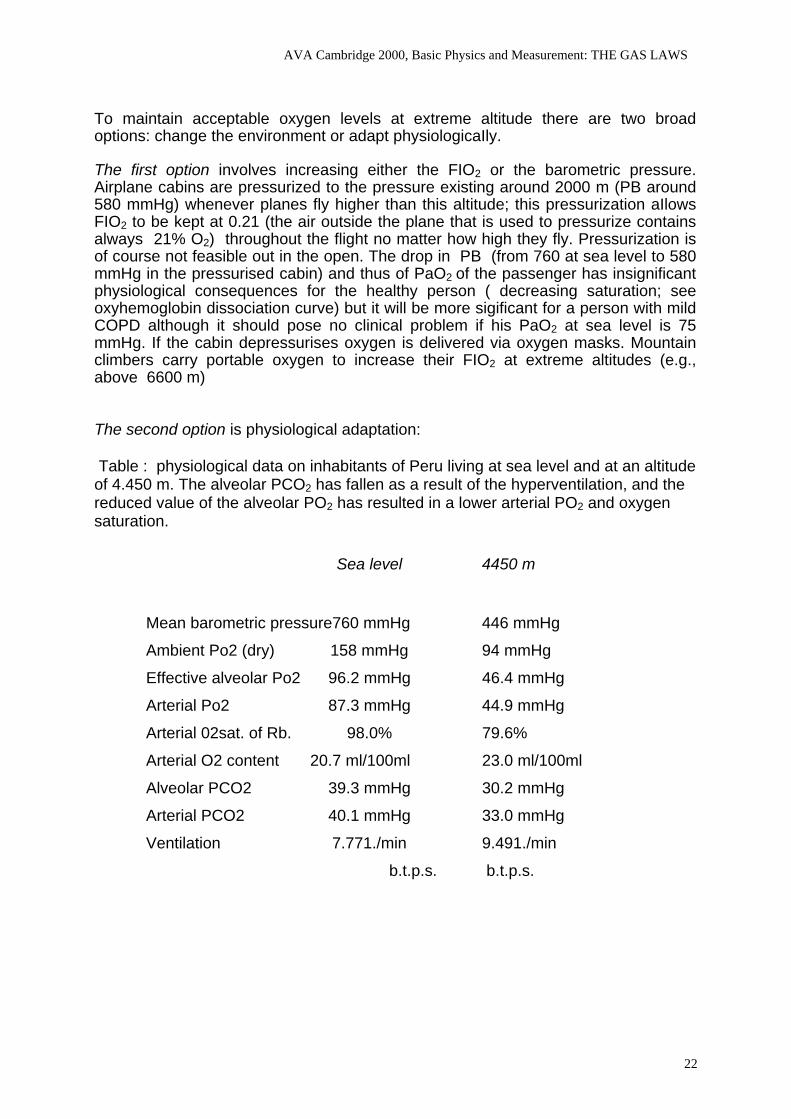
The second option is physiological adaptation: Table : physiological data on inhabitants of Peru living at sea level and at an altitude of 4.450 m. The alveolar PCO2 has fallen as a result of the hyperventilation, and the reduced value of the alveolar PO2 has resulted in a lower arterial PO2 and oxygen saturation.
Sea level 4450 m
Mean barometric pressure760 mmHg 446 mmHg
Ambient Po2 (dry) 158 mmHg 94 mmHg
Effective alveolar Po2 96.2 mmHg 46.4 mmHg
Arterial Po2 87.3 mmHg 44.9 mmHg
Arterial 02sat. of Rb. 98.0% 79.6%
Arterial O2 content 20.7 ml/100ml 23.0 ml/100ml
Alveolar PCO2 39.3 mmHg 30.2 mmHg
Arterial PCO2 40.1 mmHg 33.0 mmHg
Ventilation 7.771./min 9.491./min
b.t.p.s. b.t.p.s.
22
AVA Cambridge 2000, Basic Physics and Measurement: THE GAS LAWS
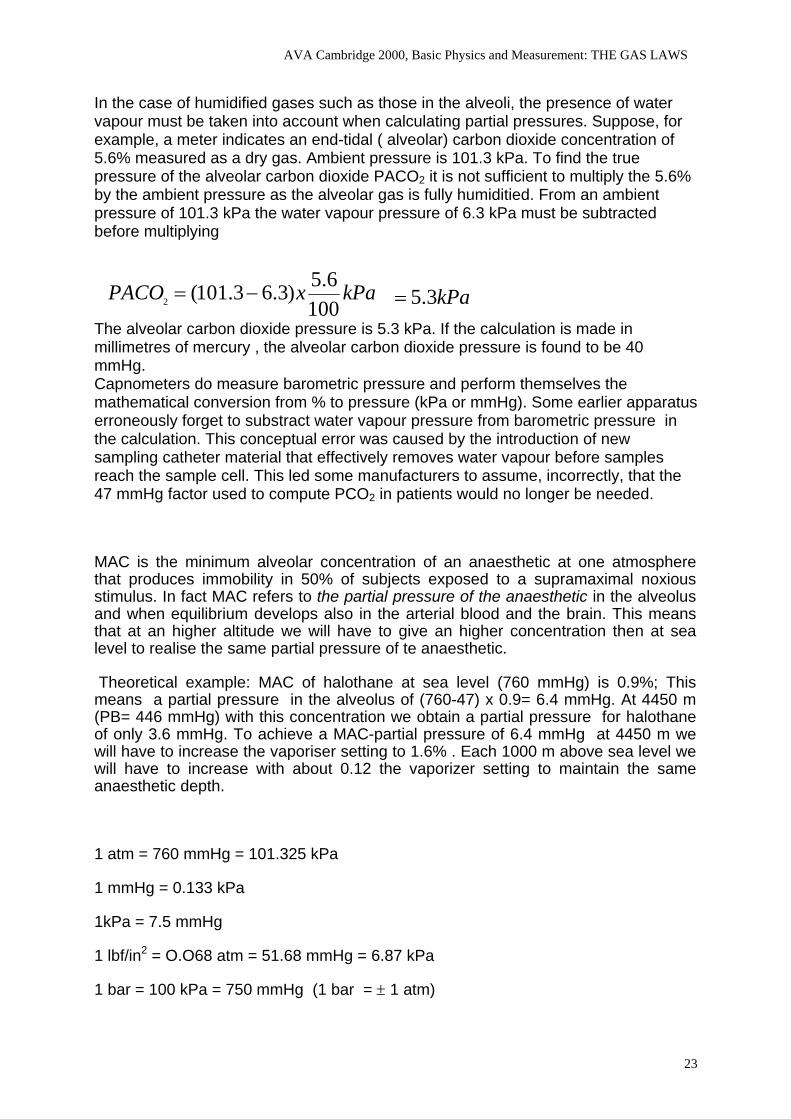
In the case of humidified gases such as those in the alveoli, the presence of water vapour must be taken into account when calculating partial pressures. Suppose, for example, a meter indicates an end-tidal ( alveolar) carbon dioxide concentration of 5.6% measured as a dry gas. Ambient pressure is 101.3 kPa. To find the true pressure of the alveolar carbon dioxide PACO2 it is not sufficient to multiply the 5.6% by the ambient pressure as the alveolar gas is fully humiditied. From an ambient pressure of 101.3 kPa the water vapour pressure of 6.3 kPa must be subtracted before multiplying
The alveolar carbon dioxide pressure is 5.3 kPa. If the calculation is made in millimetres of mercury , the alveolar carbon dioxide pressure is found to be 40 mmHg.
kPaxPACO100
6.5)3.63.101(2 −= kPa3.5=
Capnometers do measure barometric pressure and perform themselves the mathematical conversion from % to pressure (kPa or mmHg). Some earlier apparatus erroneously forget to substract water vapour pressure from barometric pressure in the calculation. This conceptual error was caused by the introduction of new sampling catheter material that effectively removes water vapour before samples reach the sample cell. This led some manufacturers to assume, incorrectly, that the 47 mmHg factor used to compute PCO2 in patients would no longer be needed.
MAC is the minimum alveolar concentration of an anaesthetic at one atmosphere that produces immobility in 50% of subjects exposed to a supramaximal noxious stimulus. In fact MAC refers to the partial pressure of the anaesthetic in the alveolus and when equilibrium develops also in the arterial blood and the brain. This means that at an higher altitude we will have to give an higher concentration then at sea level to realise the same partial pressure of te anaesthetic.
Theoretical example: MAC of halothane at sea level (760 mmHg) is 0.9%; This means a partial pressure in the alveolus of (760-47) x 0.9= 6.4 mmHg. At 4450 m (PB= 446 mmHg) with this concentration we obtain a partial pressure for halothane of only 3.6 mmHg. To achieve a MAC-partial pressure of 6.4 mmHg at 4450 m we will have to increase the vaporiser setting to 1.6% . Each 1000 m above sea level we will have to increase with about 0.12 the vaporizer setting to maintain the same anaesthetic depth.
1 atm = 760 mmHg = 101.325 kPa
1 mmHg = 0.133 kPa
1kPa = 7.5 mmHg
1 lbf/in2 = O.O68 atm = 51.68 mmHg = 6.87 kPa
1 bar = 100 kPa = 750 mmHg (1 bar = ± 1 atm)
23
ri I {
g T H F E ä
t pl i
l i,l
l_.1
@rl
;Ä-/
""":
:)[
itF
/ ffi: Wff,
ffi$
.*un
\i'ffi
/4l
jmt
'ff
iLi
$ffif
fi. I
-1*-
**I
-'*
\\Y t\
\ \
\ \\
.,tr
'
-
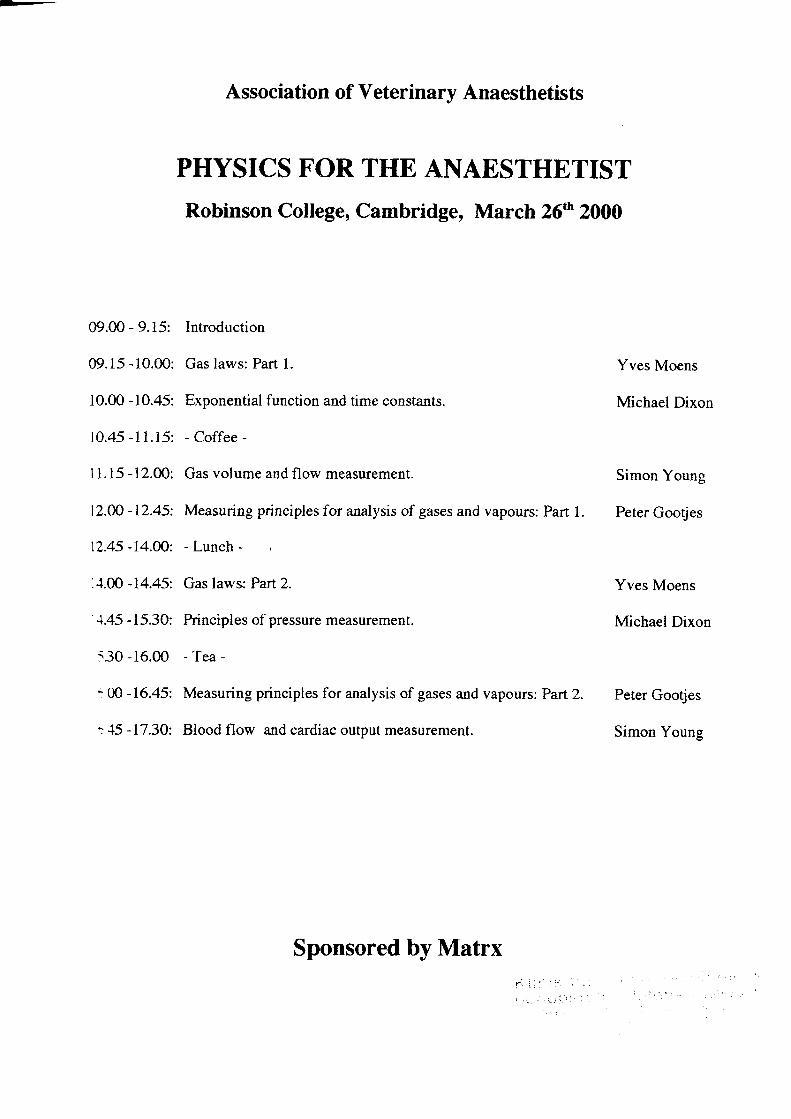
Association of Veterinarv Anaesthetists
PHYSICS FOR THE ANAESTHETISTRobinson College, Cambridge, March 26th 2000
09.00 - 9.I5: Introduction
09.15 -10.00: Gas laws: Part 1. Yves Moens
10.00 -10.45: Exponential function and time constants. Michael Dixon
10.45 -11.15: - Coffee -
11.15 -12.00: Gas volume and flow measurement. Simon Young
12.40 -12.45: Measuring principles for analysis of gases and vapours: Part 1 Peter Gootjes
12.45 -I4.W: - Lunch - ,
.1.0O -14.45: Gas laws Part 2. Yves Moens
1.45 -15.30: Principles of pressure measurement. Michael Dixon
5.30 -16.00 - Tea -
<.00 -16.45: Measuring principles for analysis of gases and vapours: Paft2. Peter Gootjes
:15 -17.30: Blood flow and cardiac output measurement. Simon young
Sponsored by Matrxl i i ' . ! t i .
' ' . ' , . , . ,
Exponential Processes and Time Constants
What is an exponential process?
. . . .. . It is a particular sort ofnon linear process.
And just remind me...what is a l inear process?
. . . .. . A linear process is one where the quantity changes at the same rate throughout the process.
. Filling a bath (assuming vertical sides) is a good example ofa linear process: a gaph of water depth againsttime is a straight line, assuming that the flowrate fiom the tap is constant.
So what is a non linear process?
.....Anonlinearprocessis one where the rate ofthe process changes during that process. A graph ofthequantity against time is a curve rather than a straight line.
And an exponential is?
..... A particular sort of non-linear process where the rate of change of the quantity is proportional to thequantity at that time. Think about emptying the bath we just filled. Pull the plug out and assume that the waterruns straight out onto the floor. The initial flowrate is determined by the pressure from the head of water in thebath, pgh and the resistance of the plughole and outlet pipe. As soon as the bath starts to empty, the head ofwaterdecreasesand so the flowrate decreases. When the bath is nearly empty, there is very little head of waterand hence a very low flowrate.
Why is this important?
.......It's important to us because many of the processes in anaesthesia are exponential. Understanding theprocess aad why it happens gives us a befter feel for controlling anaesthesia. The key points, compared with alinear process are:
1. The majority ofthe change takes place very quickly.2. In theory the process never reaches completion (although for practical purposes, approdmations can be
made).3. For a linear process, the overall rate may be quantified in terms of the gradient ofthe graph. (We all did it at
school....increase in Y divided by increase in X). For an exponential process, the overall rate is expressedin terms ofthe time constant.
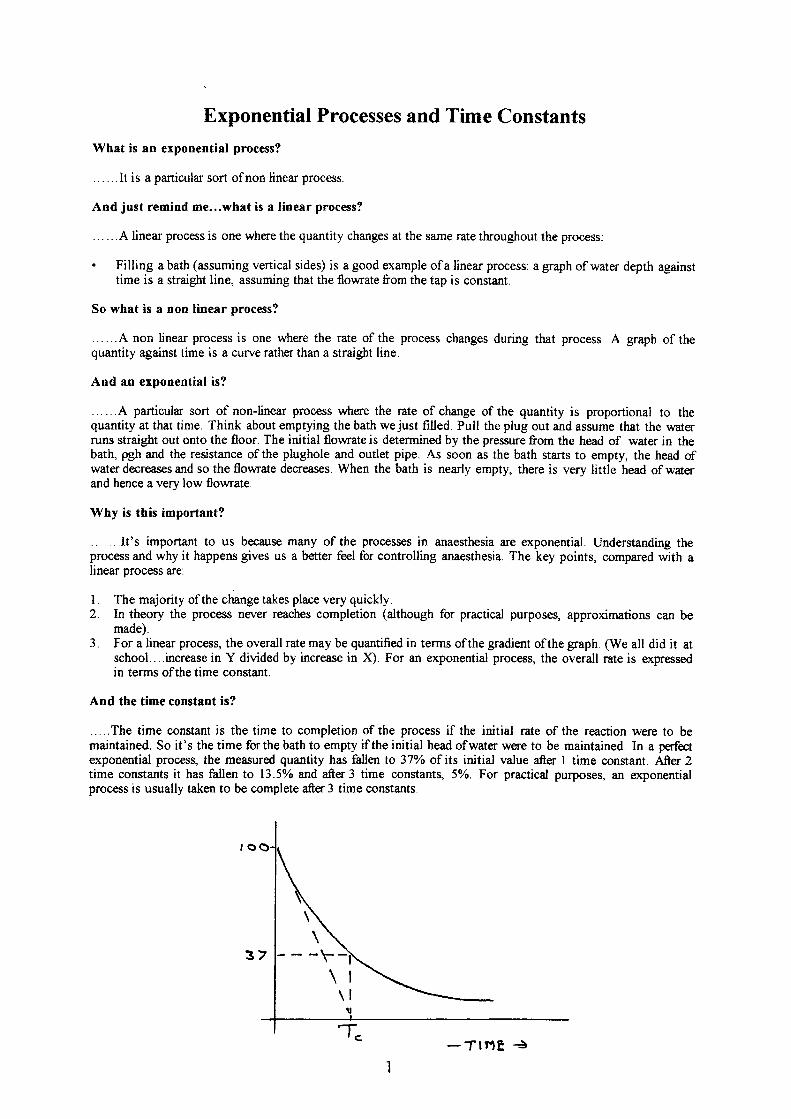
And the time constant is?
. . ..The time constant is the time to completion of the process if the initial rate of the reaction were to bemaintained. So it's the time forthe bath to empty if the initial head ofwater were to be maintained. In a pafectexponential process, the measured quantity has fallen to 37%o of its initial value after I time constant. After 2time constants it has fallen to 13.50Ä and after3 time constants, 5o/o. For practical purposes, an exponentialprocess is usually taken to be complete after 3 time constants.
\-F
\ l\ l
t
3
T.-T INE ä
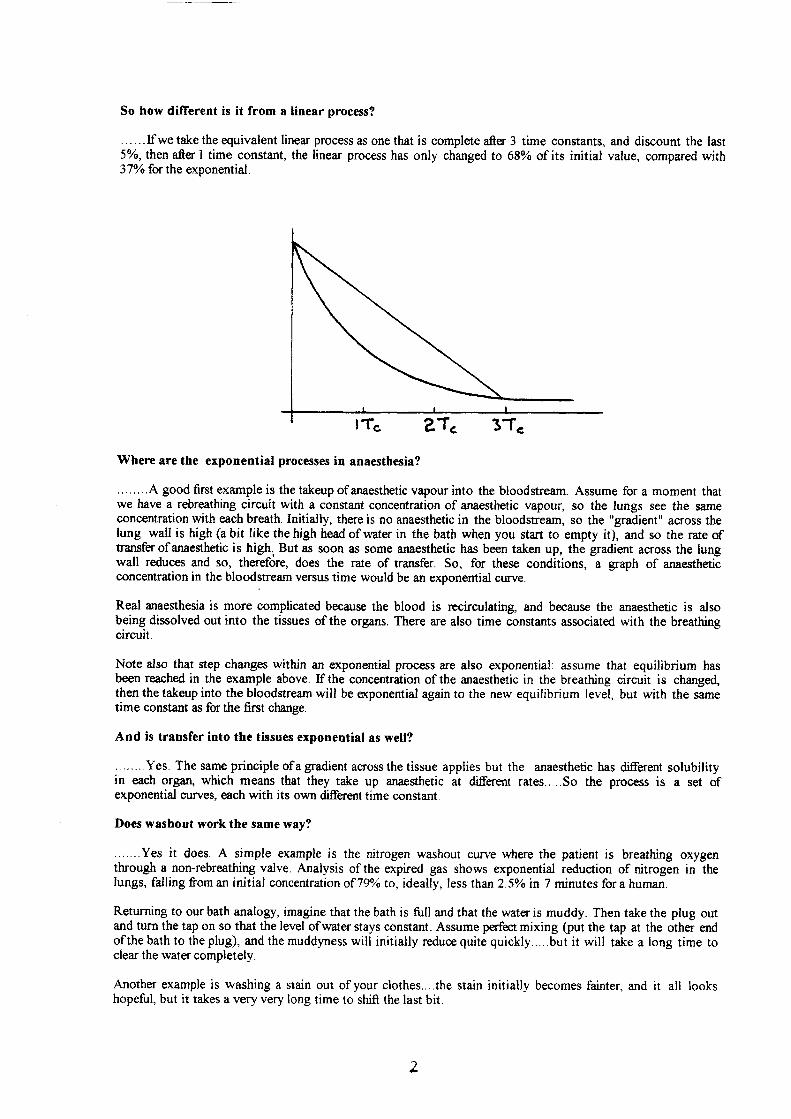
So how different is it from a linear process?
......If we take the equivalent linear process as one that is complete after 3 time constants, and discount the lastSoÄ,then afterl time constant, the linear process has only changed to 68yo of its initial value, compared with37o/o for the exponential.
Where are the exponential processes in anaesthesia?
........A good fust example is the takeup of anaesthetic vapour into the bloodstream. Assume for a moment thatwe have a rebreathing circuit with a constant concentration of anaesthetic vapour, so the lungs see the sameconcentration with each breath. Initially, there is no anaesthetic in the bloodstream, so the "gradient" across thelung wall is high (a bit like the high head of water in the bath when you start to empty it), and so the rate oftransferofanaesthetic is high. Butas soon as some anaesthetic has been taken up, the gradient across the lungwall reduces and so, therefore, does the rate of trarsfer. So, for these conditions, a graph of anaestheticconcentration in the bloodstream versus time would be an exponential curve.
Real anaesthesia is more complicated because the blood is recirculating, and because the anaesthetic is alsobeing dissolved out into the tissues of the organs. There are also time constants associated with the breathingcircuit.
Note also that step changes within an exponential process are also exponentialt assume that equilibrium hasbeen reached in the example above. Ifthe concentration ofthe anaesthetic in the breathing circuit is changed,then the takeup into the bloodstream will be o(ponential again to the new equilibrium level, but with the sametime constant as for the first change.
And is transfer into the tissues exponential as well?
........Yes. The same principle ofagradient aoossthetissue applies but the anaesthetic has differenrt solubilityin each orga4 which means that they take up anaesthetic at different rates.....So the process is a set ofexponential curves, each with its own different time constant
Does washout work the same way?
.....Yes it does. A simple example is the nitrogen washout curve where the patient is breathing oxygenthrough a non-rebreathing valve. Analysis of the expired gas shows exponential reduction of nitrogen in thelungs, falling from an initial concentration of 79/o to, ideally, less than 2.50Ä in 7 minutes for a human.
Returning to our bath analogy, imagine that the bath is fult and that the water is muddy. Then take the plug outand turn the tap on so that the level ofwater stays constant. Assume perfect mixing (put the tap at the other endof the bath to the plug), and the muddyness will initially rcduce quite quickly.....but it will take a long time toclear the water completely.
Another example is washing a stain out of your clothes....the stain initially becomes fainter, and it all lookshopeful, but it takes a very very long time to shift the last bit.
z
A more complicated example is the concentration ofanaesthetic in the blood during washout because it will be acombination ofthe individual exponential curves for all the organs. This is known as a multiple exponential andthere are graphical and mathematical methods for separating the time constants ofthe components.
How about breething...is that exponential?
.......There is an exponential element to it, but spontaneousmechanisms in the diaphragm.
breathing is complicated by the feedback
Expiration during ventilation is largely exponential: The tissues ofthe lungs are stretched elastically as the lungis filled. When expiration starts, there is a high pressure differential between the lung and the outside world. Ifquiet respiration is assumed, the expiratory flow is mainly laminar, and the flowrate is proportional to thispressure differential. When gas flows out of the lung, the volume decreases as the tissues rela:< elastically. Thepressure in the lung reduces and the flowrate hence decreases.
The time constant of the process will be atrected by the elasticity of the lung. This elasticity is normallydescribed as compliance.
And compliance is?
For a one dimensional linear spring, compliance is defined as the deflection/load. So a high compliance springis a soft one which gives a large deflection for a given load. Compliance is the reciprocal of stiftress.
Lung tissue may be thought of as a tkee dimensional spring, where linear deflection has been replaced byvolume change, and force has been replaced by pressure (forcdarea). Note that the units remain consistent.
A low compliance lung is one where the tissues are unusually stif and a high compliance lung is one where thetissues are floppy.
So for a lung, a change in conrpliance rezults in a change in tidal volume for an applied pressure. I-owcompliance results in low tidal volume because the spring is stiff Expiration also ocqrs quicker.
The lung also has a resistance to flow, in the same way that nuurow tubes have a higher resistance than widetubes. Assuming laminar flow, the relationship baween the pressure differential and the flowrate is linear.
Typical values for a human are:
Compliance 0.5 litre kPa''Resistance 0.6 kPa s [itre-'
The time constant Tc is the product ofthese two parameters.
A low compliance gives a short time constant because the spring is stiffer.A low resistance gives a short time constant because the volume flowrate is higher for a given pressuredifferential.
Time Constants in Anaesthetic Breathing Circuits
The vaporizer
The oxygen supply is initially from a cylinder at high pressure, regulated to 60 psi at the cylinder, and thendown again to a more convenient pressure within the anaesthetic machine. The flowrate into the breathing circuitis then controlled.
A proportion ofthe oxygen flow through the vaporizer into the circuit is diverted to the vaporisation chamber bya bypass valve Modern vaporizers are designed so that the flow leaving the chamber is saturated. The takeup ofvapour into the oxygen flow is thus not exponential when measured at the outlet ofthe chamber.
Note that there may be a non linear element to some older vaporizers without thermal control: the latent heat ofvapourisation causes the temperature ofthe vaporizer to drop and thus the saturated vapour pressure reduces,
3
The rebreathing circuit
The volume flowrate of anaesthetic gas into the circuit can be varied by changing the orygen flowrate, or byadjustment of the bypass valve to vary the flow through the vapourisation chamber and tMore change theconcentration of vapour leaving the vaporizer.
The mixing ofthis vapour into the rebreathing circuit is an exponential process, with a time constant controlledby the flowrate (he higher the flowrate, the shorter the time constant).
At the start ofanaesthesia, a high flowrate is set with the popofvalve open. This gives a high concentration ofanaesthetic, aiding rapid induction of anaesthesia in the patient and a short time constant ör the nitrogenwashout.
An awareness ofpollution, combined with the high cost ofmodern inhalable anaesthetics (such as isoflurane) hasled to widespread adoption oflow flowrates during the operation. This results in longer time constants and moretime to react.....but a slower r€spons€.
The first reaction ifdeeper anaesthesia is required is often to adjust the vaporizer to give a higher concentration ofanaesthetic into the circuit. This is necessary if equilibrium has been reached, but quicker results will beachieved by simultaneously increasing the flowrate, reducing the time constant in the circuit.
Ofteqhowwer,takeupis onthelong tail of the exponential curve (somewhere afterthe second time constant),and increasing the flowrate alone may be suffcient
page 1
Physics and Measurement in Anaesthesia: Gas volumes,gas flow, blood flow and cardiac output
Gas volume measurement
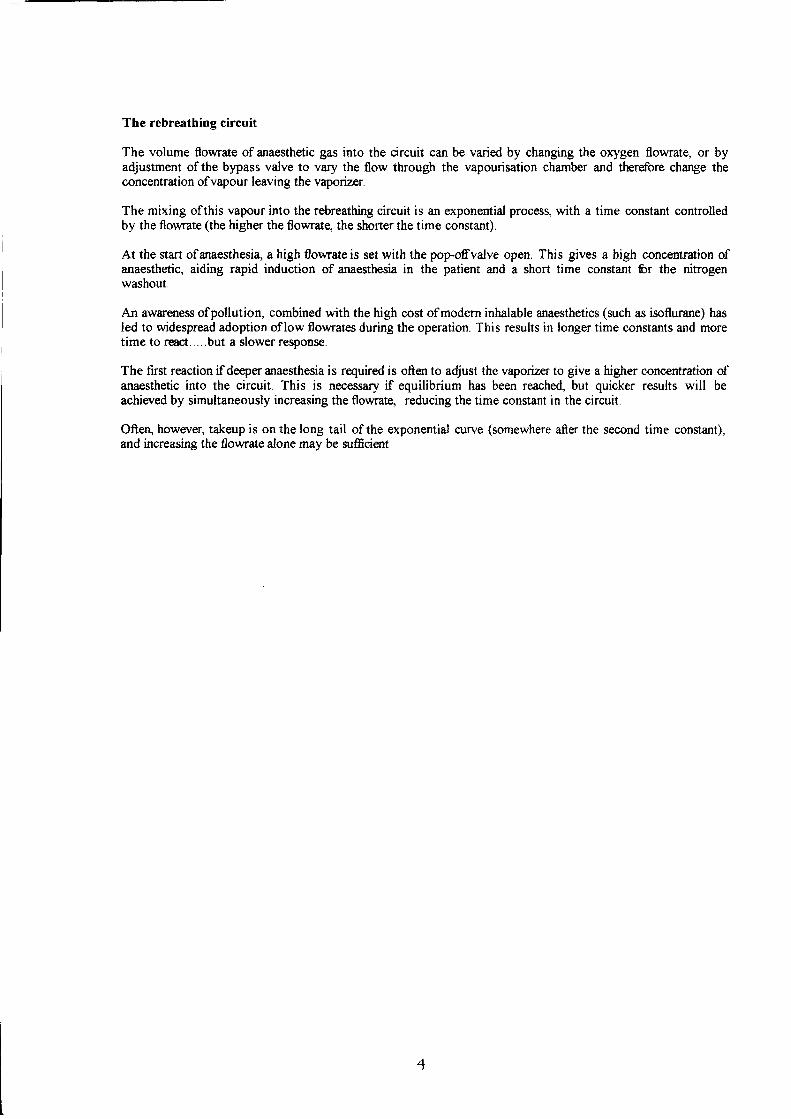
SpirometrySpirometers directly measure the volume of gas from first principles. The waterspirometer is considered the gold standard for volume measurement. They are bulky,have a slow response and are used for research rather than clinical work.
Water spirometerThe water spirometer uses a metal bell suspended in a water seal. The bell iscounterweighted so that the gas inside is at ahospheric pressure. The cross-sectionalarea of the bell is constant so that if gas is added to or removed from the bell it moves upor down by an amount proportional to the volume. The vertical movement of the bell ismeasured directly with a ruler, or electronically. The temperature of the gas inside thebell is measured so that the gas volume can be corrected to STPD or BTPS. Largerspirometers also have a fan inside to make sure the gas composition is uniform andisothermal.
CO, atrsorber
A wet spirometer. Kymograph drums are obsolete and the output would normally beelectronic using a rotational sensor attached to one of the pulleys.
Page2
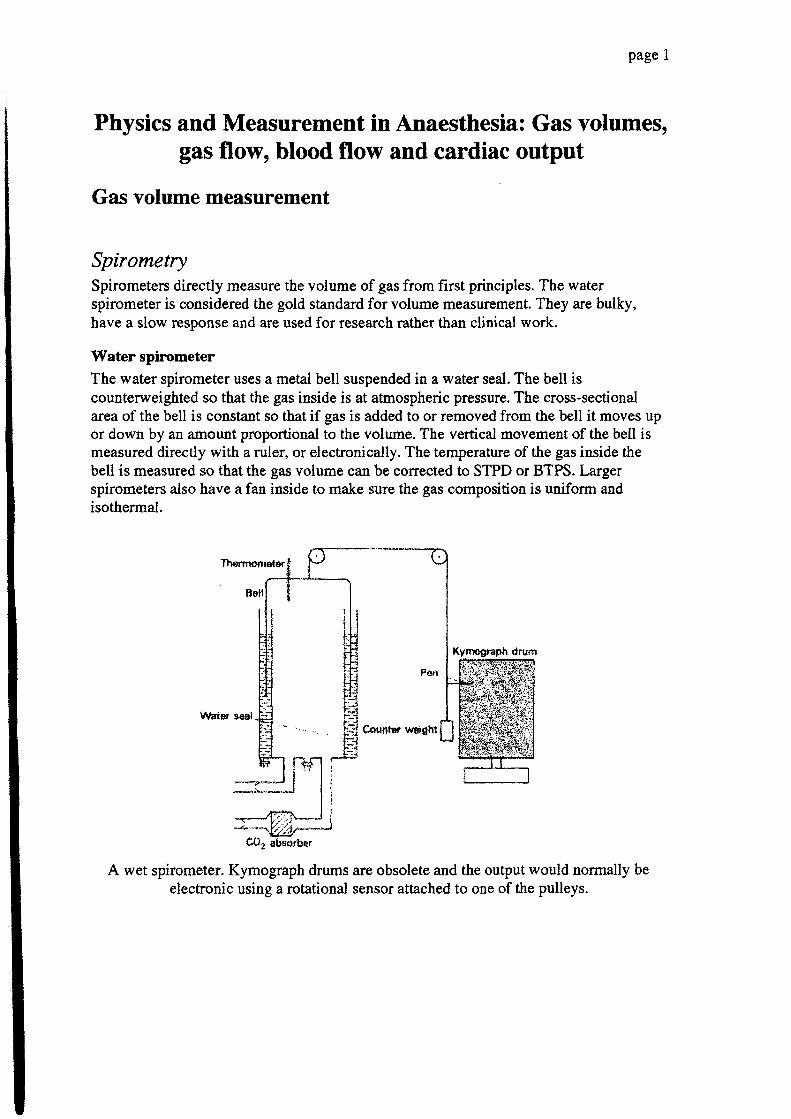
Dry spirometerDry spirometers do not use water to provide the gas seal and are more practical forclinical work. One type uses a low friction rolling diaphragm to seal the piston. Othertypes use folded bellows. Movement of the piston or bellows is detected electronically.Dry spirometers were extensively used for pulmonary function testing but are beingreplaced by pheumotachograph-based systems.
.--= Fotded sc\tors' belloy$
P;rtiert!
Low.trictir:rrlru-arirtg
Dry spirometers, rolling diaphragm and bellows type.
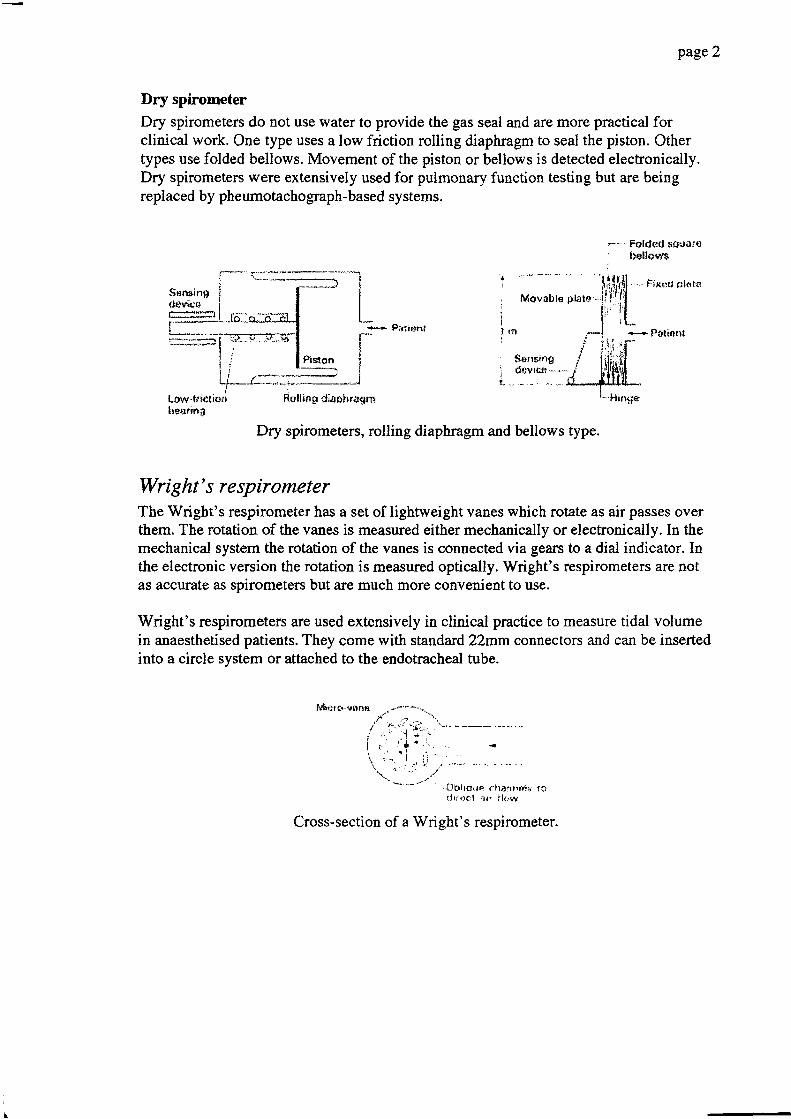
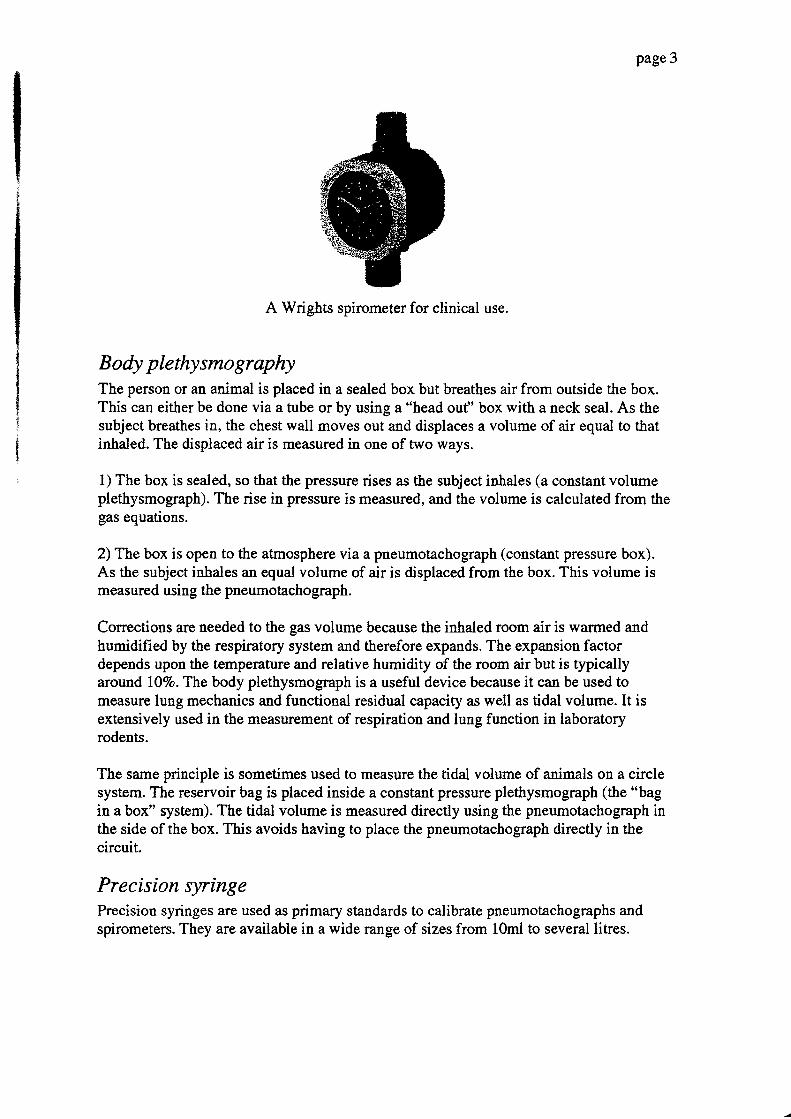
Wright's respirometerThe Wright's respirometer has a set of lightweight vanes which rotate as air passes overthem. The rotation of the vanes is measured either mechanically or electronically. In themechanical system the rotation of the vanes is connected via gears to a dial indicator. Inthe electronic version the rotation is measured optically. Wright's respirometers are ootas accurate as spirometers but are much more convenient to use.
Wright's respirometers are used extensively in clinical practice to measure tidal volumein anaesthetised patients. They come with standard 22mrn connectors and can be insertedinto a circle system or attached to the endotracheal tube.
. 0blrcile chänFd.,is t?c l r r . t c l a r r Hr - .w
Cross-section of a Wright's respirometer.
56ne.ing
Hinge
page 3
A Wrights spirometer for clinical use.
Body plethysmographyThe person or an animal is placed in a sealed box but breathes air from outside the box.This can either be done via a tube or by using a "head out'' box with a neck seal. As thesubject breathes in, the chest wall moves out and displaces a volume of air equal to thatinhaled. The displaced air is measured in one of two ways.
1) The box is sealed, so that the pressure rises as the subject in-hales (a constant volumeplethysmograph). The rise in pressure is measured, and the volume is calculated from thegas equations.
2)Tlne box is open to the atmosphere via a pneumotachograph (constant pressure box).As the subject inhales an equal volume of air is displaced from the box. This volume ismeasured using the pneumotachograph.
Corrections are needed to the gas volume because the inhaled room air is warmed andhumidified by the respiratory system and therefore expands. The expansion factordepends upon the temperature and relative humidity of the room air but is typicallyaround lÜVo.The body plethysmograph is a useful device because it can be used tomeasure lung mechanics and functional residual capacity as well as tidal volume. It isextensively used in the measurement of respiration and lung function in laboratoryrodents.
The same principle is sometimes used to measure the tidal volume of animals on a circlesystem. The reservoir bag is placed inside a constant pressure plethysmograph (the "bagin a box" system). The tidal volume is measured directly using the pneumotachograph inthe side of the box. This avoids having to place the pneumotachograph directly in thecircuit.
Precision syringePrecision syringes are used as primary stendards to calibrate pneumocachographs andspirometers. They are available in a wide range of sizes from 10ml to several litres.
page 4
Integration of flowThe most common method of measuring respiratory gas volume is by integrating gasflow. Gas flow is measured using a pneumotachograph. The volume is the integral of theflow:
volume =/flow. dt
The gas flow is converted !o an electrical signal by the pneumotachograph. The flowsignal is then integrated electronically. Analogue integrators were used for many yearsbut digital systems have taken over. Drift, caused by small offsets in the flow signal, is amajor problem with the integration technique. It is solved by resening the integrator afterevery breath.
Penumoüachographs are used 8o measure tidal volume and respiratory rate in ventilators,pulmonary function testing systems and anaesthetic monitors such as the Datex.
Gas flow measurement
Physics of fluid flow in tubesFluid flow in a long tube at low flow rates follows the Hagen-Poiseuille law.
flow =.4'Srtl
where r = tube radius, p - pressure drop across the tube, I = tube length and Tl - viscosity.Note the strong dependence of flow on tube radius. Also, flow rate is independent of gasdensity and depends only on the gas viscosity.
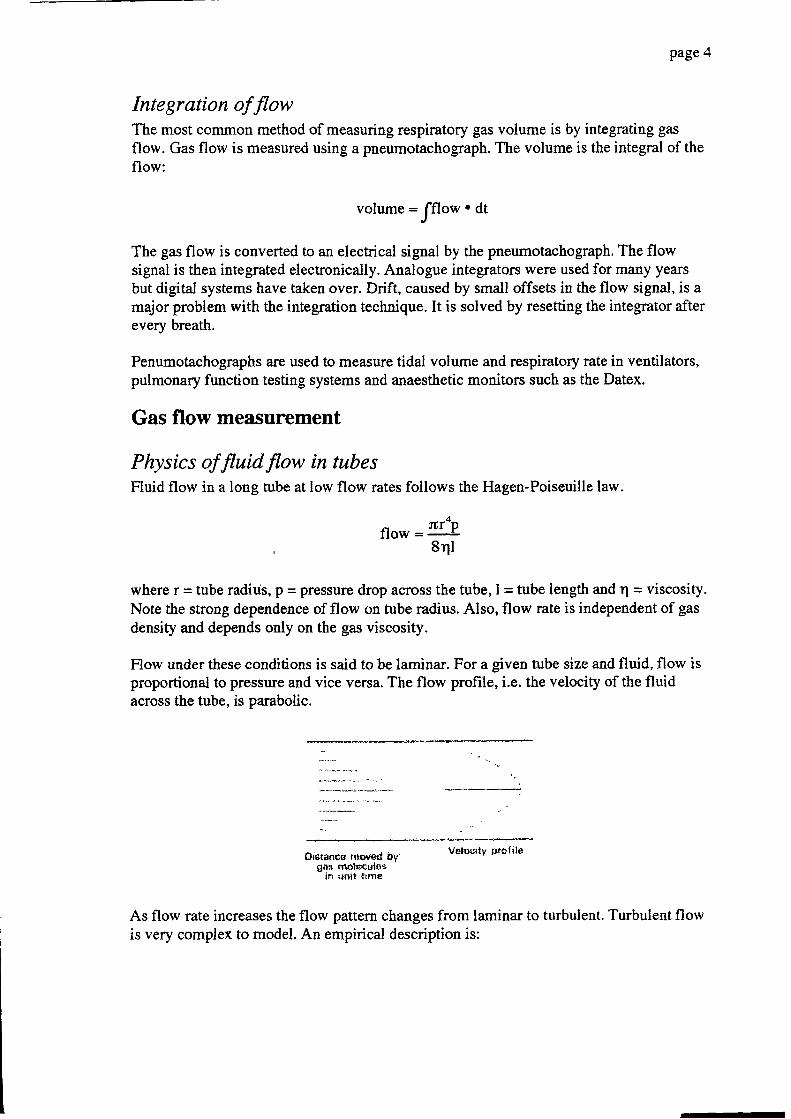
Flow under these conditions is said to be laminar. For a given tube size and fluid, flow isproportional to pressure and vice versa. The flow profile, i.e. the velocity of the fluidacross the tube, is parabolic.
oi$tsflca nrovetJ br vel$oty pralilo
gos nroleculcsin -.!trit trrn€
As flow rate increases the flow pattern changes from laminar to turbulent. Turbulent flowis very complex to model. An empirical description is:
page 5
flow = kpn
where k depends upon the tube dimensions and gas properties. n varies between I and2.For a given flow rate, turbulent flow requires a greater pressure gradient than laminarflow. The flow profile is also no longer parabolic and tends to be flatter, i.e. the flow ismore constant across the tube.
In small airways, veins and peripheral arteries the flow is laminar. In the aorta and largeairways flow is turbulent. Turbulent flow produces audible vibrations and is the origin ofmost breath sounds. It also produces the Korotkoff sounds that are used to measure bloodpressure clinically in humans.
The type of flow pattern present has great importance in the measurement of air andblood flow. Several methods for measuring flow actually measure velocity, for exampleDoppler systems. The flow is estimated by measuring the diarneter of the vessel andassuming a laminar or turbulent flow profile.
The type of flow present can be estimated by the Reynolds number.
Nr = 2ilP
rlwhere Nr is the Reynolds number, r is the tube radius, v is the average flow velocity, p isthe fluid density and I the viscosity. The transition between laminar and turbulent flowoccurs at a Reynolds number of about ?l0f,.. However, the flow pattern is greatlyinfluenced by bends and branches in the tube and by surface roughness.
A tube has to be about ten diameters or more in length and sraight for a fully laminarflow pattern to develop. Tubes that are shorter than tlis, or which have frequent branches,bends or changes in diarneter, cannot support fully lamiaar flow.
RotameterThe rotameter is widely used to measure gas flow in pipes. It can only measure steadyflow in one direction, and has to be calibrated for a specific gas. Rotameters are relativelycheap and reasonably accurate (2Vo for the best rotameters, SVo typical).
A rotameter consists of a light metal bobbin inside a tapered tube. Gas flowing up thetube supports the weight of the bobbin. As the gas flow increases, the bobbin moves up towhere the tube is wider. The bobbin spins in the gas flow to increase stability and preventthe bobbin from touching the walls of the tube. Cheap rotatmeters use a glass or metalball as a float.
Rotameters are universally used to measure fresh gas flow on anaesthetic machines.
page 6
Pitot tubeA tube facing into the flow of a gas experienggs a higher pressure than one at right anglesto the flow. This difference is caused uy the kinetic
"ortö of the flowing gas being
converted to potential energy. The Pitot tube uses this efiäct to measure gas velocity. Asensor tube faces into the gas flow and measures the dynamic pressure. Ä second tubemeasures the static pressure at the same point. The difieren", ir, pressure is related to thegas velocity.
velocity = klffi-
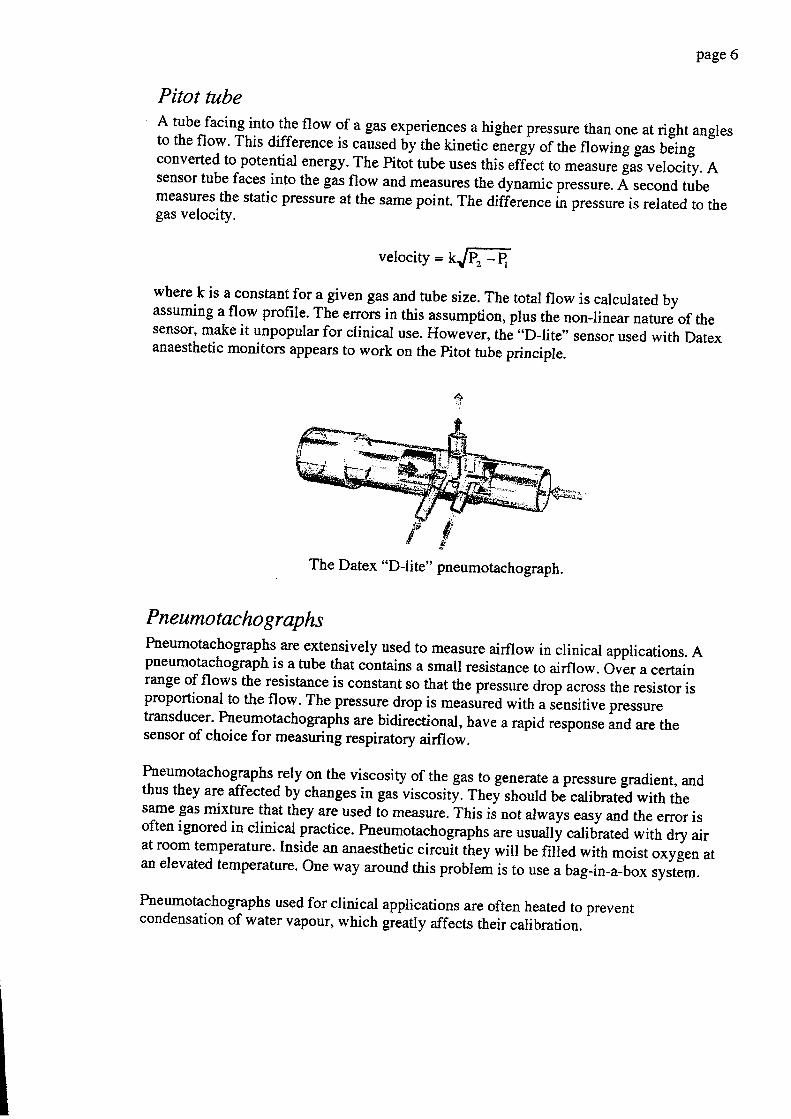
where k is a constant for a given gas and tube size. The total flow is calculated byassuming a flow profile. The errors in this assumption, plus the nonJinear nature of thesensor, make it unpopular for clinical use. However, the "D-lite" sensor used with Datexanaesthetic monitors appears to work on the pitot tube principle.
PneumotachographsPneumotachographs are extensively used to measure airflow in clinical applications. Apneumotachograph is a tube that contains a small resistance to airflow. Over a certainrange of flows the resistance is constant so that the pressure drop across the resistor isproportional to the flow. The presstue drop is measured with a sensitive pressuretransducer. Pneumotachographs are bidirectional, have a rapid response and are thesensor of choice for measuring respiratory airflow.
Pneumotachographs rely on the viscosity of the gas to generate a pressure gradient, andthus they are affected by changes in gas viscosit!. Thei should be calibrated with thesame gas mixture that they are used to measure. This ii not always easy and the error isoften ignored in clinical practice. Pneumotachographs are usually calibrated with dry airat room temperature. Inside an anaesthetic circuit they will be filied with moist oxygen atan elevated temperature. One way around this probleä i, to use a bag-in-a-box system.
Pneumoüachographs used for clinical applications are often heated to preventcondensation of water vapour, which greafly affects their calibration.
The Datex uD -lita" pneumotachograph.
pageT
Fleisch
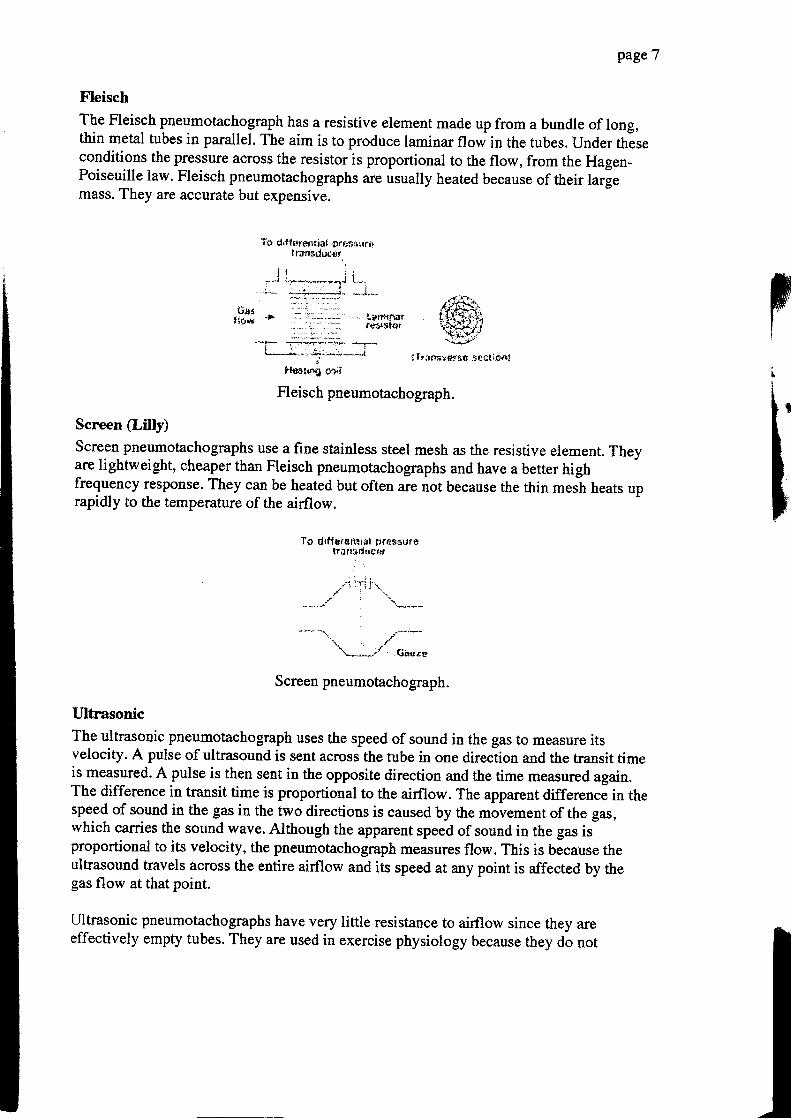
The Fleisch pneumotachograph has a resistive element made up from a bundle of long,thin metal tubes in parallel. The aim is to produce laminar flow in the tubes. Under thäseconditions the pressure across the resistor is proportional to the flow, from the Hagen-Poiseuille law. Fleisch pneumotachographs are usually heated because of their largemass. They are accurate but expensive.
T- ri difler+ntiai pr*$*urrll.tafladut4r
l l l ii-.-u r 1*+r-,,..,aba{ r-,,.:
- i-* . , ; : , ,1- _J_,r"1Alf,.{iF-#;.iftf#
1 i * f
iTr;xtsygy&ü :itclirai
{ian.I t o w - - >
'lqrrt{rufr#rJstttI
Screen tl.illgScreen pneumoüachographs use a fine stainless steel mesh as the resistive element. Theyare lightweight, cheaper than Fleisch pneumotachographs and have a better highfrequency response. They can be heated but often are not because the thin mesh heats uprapidly to the temperature of the airflow.
Tp drtlürerlttill frrnäsurölron!idrf gef
,. ,/***'i.*-'" Go,rro
Screen pneumotachograph.
Ultrasonic
The ultrasonic pneumotachograph uses the speed of sound in the gas to measure itsvelocity. A pulse of ultrasound is sent across the tube in one direction and the transit timeis measured. A pulse is then sent in the opposite direction and the time measured again.The difference in transit time is proportional to the airflow. The apparent difference in thespeed of sound in the gas in the two directions is caused by the movement of the gas,which carries the sound wave. Although the apparent speed of sound in the gas isproportional to its velocity, the pneumotachograph measures flow. This is because theultrasound travels across the entire airflow and its speed at any point is affected by thegas flow at that point.
Ultrasonic pneumotachographs have very little resistance to airflow since they areeffectively empty tubes. They are used in exercise physiology because they do not
I
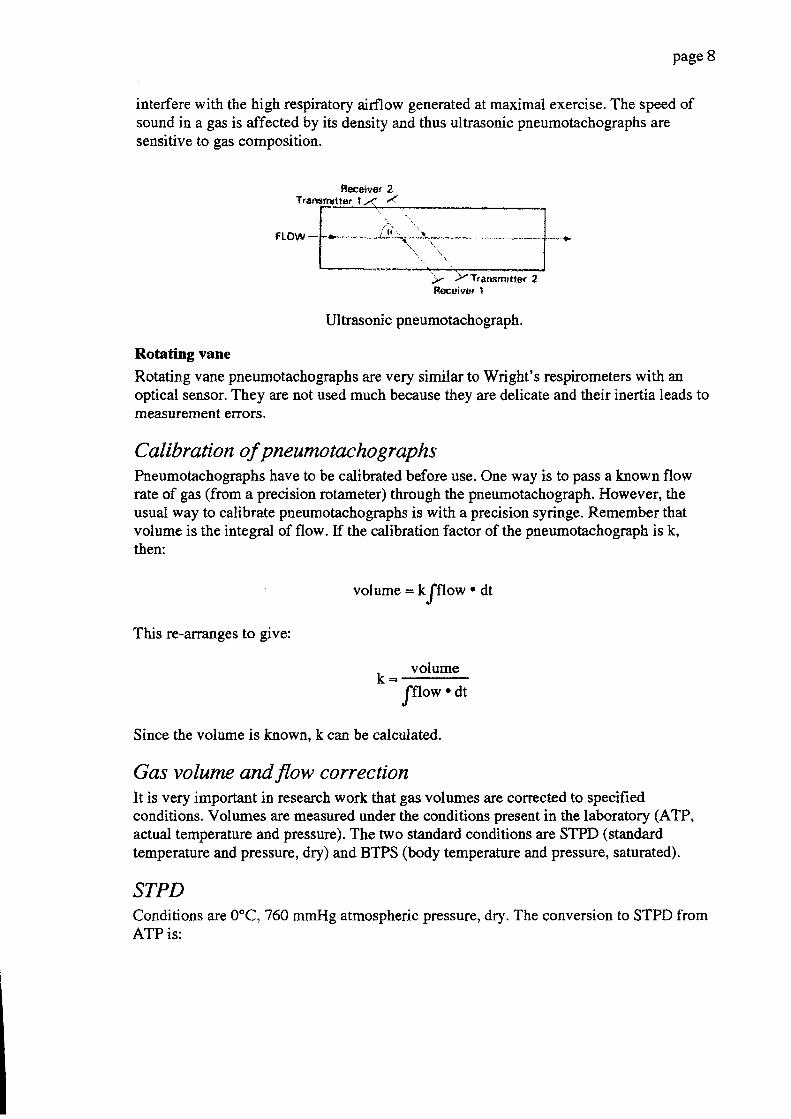
page 8
interfere with the high respiratory airflow generated at maximal exercise. The speed ofsound in a gas is affected by its density and thus ultrasonic pneumotachographs aresensitive to gas composition.
Fleceivor 2Trenvnrtfnr t -< /
Ftow -
Ultrasonic pneumotachograph.
Rotating vane
Rotating vane pneumotachographs are very similar to Wright's respirometers with anoptical sensor. They are not used much because they are delicate and their inertia leads tomeasurement errors.
C al ibr atio n of p ne umo tac ho I r ap h sPneumotachographs have to be calibrated before use. One way is to pass a known flowrate of gas (from a precision rotameter) through the pneumotachograph. However, theusual way to calibrate pneumotachographs is with a precision syringe. Remember thatvolume is the integral of flow. If the calibration factor of the pneumotachograph is k,then:
t )r''ftarßmifla( 2
volume = k/flow. dt
This re-arranges to give:
k = volume
/flow. dt
Since the volume is known. k can be calculated.
Gas volume and flow correctionIt is very important in research work that gas volumes are corrected to specifiedconditions. Volumes are measured under the conditions present in the laboratory (ATP,actual temperature and pressure). The two standard conditions are STPD (standardtemperature and pressure, dry) and BTPS (body temperature and pressure, saturated).
STPDConditions are 0"C,760 mmHg atmospheric pressure, dry. The conversion to STPD fromATP is:
page9
Vnpo = Vo* x +" P":&-
273 +T 7ff i
where T = actual temperature (oC), ps=barometric pressure (mmHg), p"ro - partialpressure of water vapour in the measured gas.
BTPSConditions are body temperarure, ambient pressure, saturated with water vapour. Theconversion to BTPS from ATp is:
vsrps =v^rrx #X"
P, - P"ro
P" - P"ro @Tu"oy
where T = temperafure (oc), Ps=baromehic pressure (mmHg), p'zo = partial pressure ofwater vapour in the measured gas, pruo @Tr.av = saturated vapour presiure of water atbody temperature.
Blood flowPeripheral blood flow msasurement is used clinically to assess organ viability, and inresearch work' Cardiac outPut is more frequently mÄasured. It is in overall indicator ofcardiac function and is also used in the calculatiän ofderived functions such as peripheralresistence.
Ultrasonic transit timeEssentially the sami as the ultrasonic pneumotachograph. The method is invasivebecause the ultrasonic transducers must be placed riouoO the blood vessel. The output isin real time and the method is extensively used in research.
Limb plethysmographyA cuff is placed around the limb. The cuff is inflated to a pressure slightly belowdiastolic. This occludes all venous flow but allows arteriai blood to flow into the limb.The limb swells with the increased blood volume and the swelling is measured usingmercury-in-rubber extensometers. The method is limited to research applications inhumans.
Doppler ultrasoundThe velocity of blood in a vessel can be measured non-invasively using ultrasound. Abeam of ultrasound is fired at the vessel. The frequency of the rehecteä signal is shifted!I * amount proportional to the velocity of the blood flowing through thJ vessel. If thediameter of the vessel is known, and the flow profile, the blood flow can be calculated.Also, the angle of incidence of the beam relative to the flow needs to be known.
I
page 10
In practice, the restrictions and assumptions of the method make it difficult to useclinically. The diameter of the vessel can be measured using the same ultrasound systemin imaging mode. The angle of incidence usually has to be estimated. The flow profilealso has to be estimated and is usually assumed to be flat (turbulent). Flow can only bemeasured in arteries, where the Doppler shift is large enough to measure. The subjectmust keep still during the measurement.
Cardiac outputCardiac output is a much more useful measurement than peripheral blood flow. Heartraüe, blood pressure and cardiac output are the key parameters that define the state of thecardiovascular system.
Principle of indicator dilutionBlood flows through a pipe. At one point an indicator, an inert substance whoseconcentration in blood can easily be measured, is injected iuto the flow. The flow rate ofthe indicator is negligible compared to the main flow. The indicator mixes completelywith the flow, and at some later point its concentration is measured.
flow --->
t' l
inject indicatort
measure indicator
F.In this system, C, = * where Ci = cotrcentration of indicator after mixing (mg/litre, for
F,example), Fi = räte of addition of indicator (mg/minute, for example) and Fo = main blood
flow rate (litres/minute). Thus F, = +.Li
For cardiac output measurements the indicator needs to be added to a vessel that takes allthe blood flow to the heart. The indicator can be measured after mixing at any convenientpoint downstream as long as its concentration does not change during its passage throughthe arterial tree.
The indicator dilution principle can be extended to include non-constant indicatorinjection. In particular, this includes a bolus injection of indicator. As before, thefollowing assumptions apply:1) Flow rate is constanL2) The volume of indicator injected is negligible compared to the cardiac output.3) The indicator is inert.
page 11
A bolus of indicator is injected and the concentration of indicator is measuredcontinuously downstream. Measurement is continued until all the indicator has passed thesensor, i.e. the indicator concentration has returned to its pre-injection level. If the flowrate is Fo and the concentration is measured for time t, then the total volume V that hasflowed in this time is V = Fo .t. The time period t covers the entire period when
indicator was present in the main flow. Therefore, volume V contains all of the indicator.
If a mass m of indicator was injected, then { = i! where { ir tn" average'V
concentration of indicator in the volume V. Combining this with the earlier expression for
V we come up with E = +. We now need to find Q. The concentration of indicator" t , t '
is not constant with time after a bolus injection. However, we can obtain the equivalentvalue by finding the area under the concentration-time curve. If A is the area under the
concentration-time curve, then A = IC,.dt
(where C, is the instantaneous
concentration). But we can obtain the same area by replacing the time-varyingconcentration with the mean value f , because A = Ei . t. Substituting, we end up withthe equation for indicator dilution using a bolus injection:
Fo =T-L-
fC, 'dtJ0
The time period t over which the indicator concenu?tion is measured must include thecomplete injection, i,e, start measuring before the injection and continue until the levelfalls to the pre-injection value. t can be any arbitrary time but the longer it is the lessaccurate the reading. Also, flow must be constant during time t.
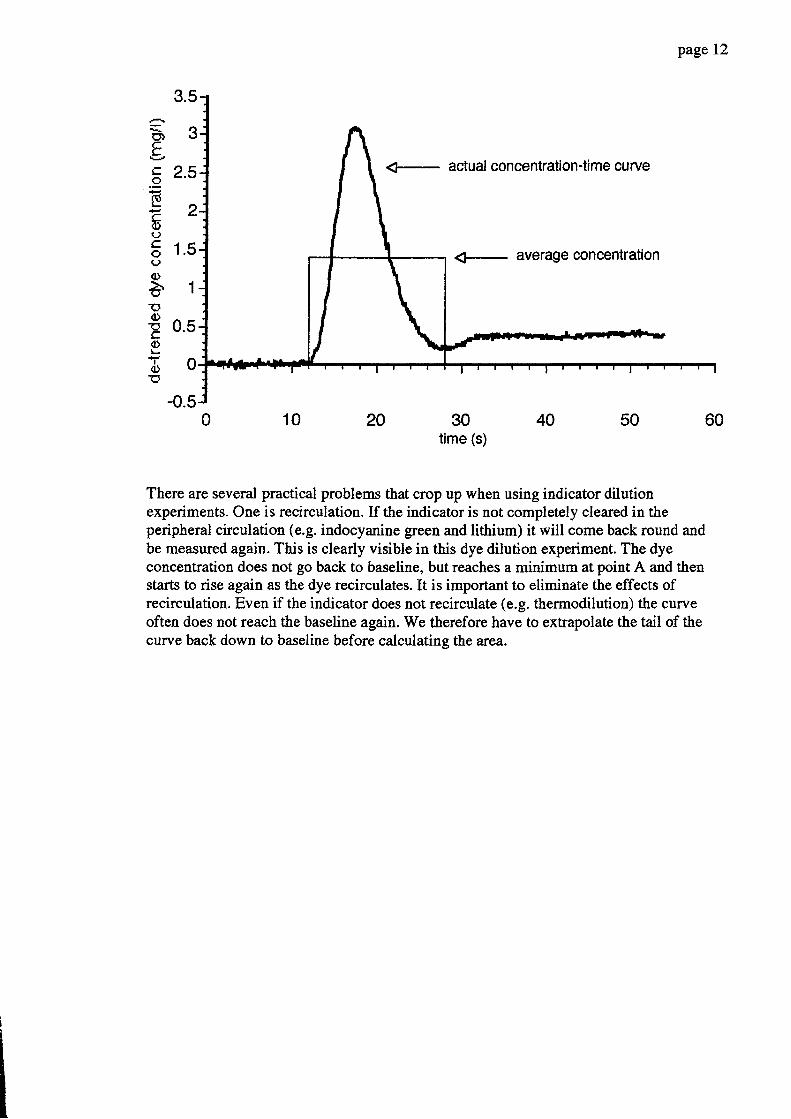
The following graph shows an indicator dilution experiment. In this case the indicatorwas a dye, indocyanine green. The areas under the main peak and the rectangle are thesame. The mean concentration is 1,39 mg.Lt.
(t,EC.9ECo(J
c()(J
{)ä.'q,
E(l)ECö
(l)E
page 12
actual concentration-time curye
<- average concentration
1
0.5
0
-0.530
time (s)
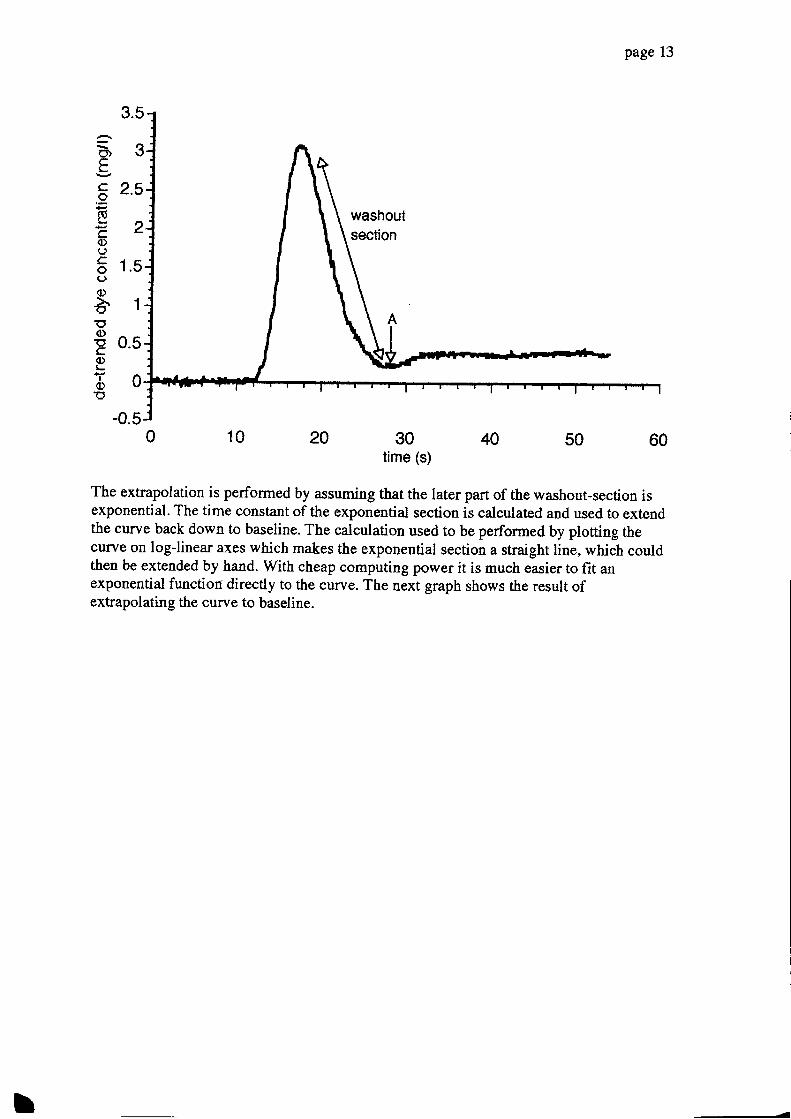
There are several practical problems that crop up when using indicator dilutionexperiments. One is recirculation. If the indicator is not completely cleared in theperipheral circulation (e.g. indocyanine green and lithium) it will come back round andbe measured again. This is clearly visible in tlis dye dilution experiment. The dyeconcentration does not go back to baseline, but reaches a minimum at point A and thenstarts to rise again as the dye recirculates. It is important to eliminate the effects ofrecirculation. Even if the indicator does not recirculate (e.g. thermodilution) the curveoften does not reach the baseline again. We therefore have to extrapolate the tail of thecurye back down to baseline before calculating the area.
2.5
1.5
50402010 60
=Ct)Ec,otrC(l)(Jcö(J
oäE(l)aC{)
(I)T'
Page 13
1
0.5
0
-0.50 10 20 30 40 s0 60
time (s)
The extrapolation is performed by assuming that the later part of the washout-section isexponential. The time consrant of the exponential section is calculated and used to extendthe curve back down to baseline. The calculation used to be performed by plotting thecurve on logJinear axes which makes the exponential section a straight line, which couldthen be extended by hand. With cheap computing power it is much easier to fit anexponential function directly to the curye. The next graph shows the result ofextrapolating the curve to baseline.
2.5
1.5
=O)EC.oEE<l)Ico()oä15(t)cC{)L
a(l)rc
1.5
page 14
60
1
0.5
0
-0.530
time10 20 40 50
(s)
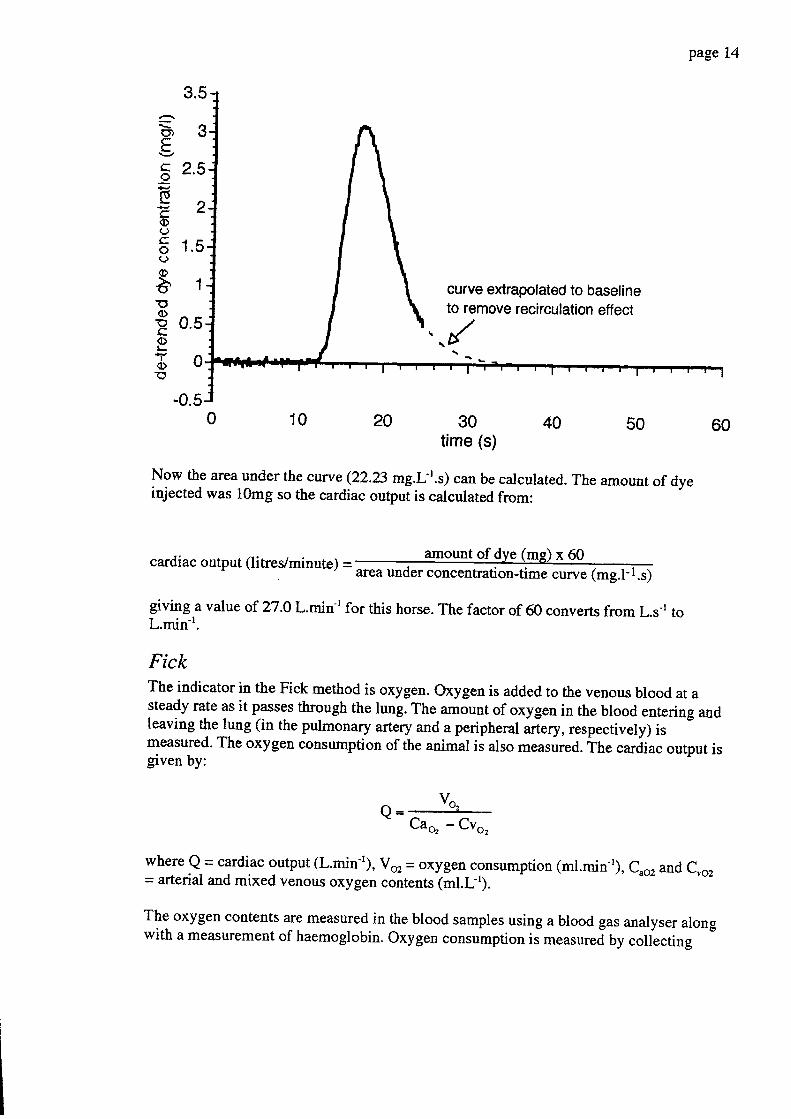
Now the area under the curve (22.23 mg.L-t.s) can be calculated. The amount of dyeinjected was 10mg so the cardiac output is calculated from:
cardiac output (litres/minute) -amount of dye (mg) x 60
area under concentration-time curye (mg.l- 1.s)
giving.a value of ?i7.0 L.min-r for this horse. The factor of 60 converts from L.s't toL.min-t.
FickThe indicator in the Fick method is oxygen. Oxygen is added to the venous blood at asteady rate as it passes thrgugh the lun!. The amJunt of oxygen in the blood entering andleaving the lung (in the pulmonary artery and a peripheral artery,respectively) ismeasured. The oxygen consumption of the animal is also measured. The cardiac output isgiven by:
Q= = vo '=
Cao - Cvo,
where Q = cardiac output (L.min-t), Voz = oxygen consumption (ml.min-r), C,ozand C,o,= arterial and mixed venous oxygen contents (ml.Lt).
The oxygen contents are measured in the blood samples using a blood gas analyser alongwith a measurement of haemoglobin. Oxygen consumption is measur"ä Uy coliecting
curve extrapolated to baselineto remove recirculation etfect
I
page 15
expired air and measuring its volume and oxygen concentration. The patient must be in asteady state so that oxygen stores are neitler increasing nor decreasing. The method isinaccurate if large extrapulmonary right-to-left shunts are present.
The Fick method can also be used with carbon dioxide as the indicator. However,because of the large carbon dioxide stores in the body it takes a long time (1130 min) forthe subject to reach a steady state.
Dye dilutionAn indicator that was commonly used is indocyanine green. The concentration of this dyecan be measured photometrically in arterial blood. To perform a measurement, a bolus ofdye of known amount is injected into the right atrium or jugular vein. The concentrationin a peripheral artery is measured continuously by withdrawing arterial blood at a steadyrate through a spectophotometer. See the example above for details. The method is notused much now that thermodilution catheters are available.
ThermodilutionThe most widely used method for measuring cardiac output is thermodilution. Heat is theindicator. A bolus of cold fluid is injected into the right auium. The fluid mixes with theblood in the right side of the heart and the temperature is measured in the pulmonaryartery. Specialised Swan-Ganz catheters are used for the measurement. The catbeter isfed down the jugular vein, through the right side of the heart and into the pulmonaryartery. The correct placement is verified by measuring the arterial pressure from a port atthe tip of the catheter. A thermistor at the tip of the catheter measures the temperature ofthe blood in the pulmonary artery. A bolus of cold dextrose is injected through anotherlumen into the right.atrium and the temperahrre in the pulmonary afirlry is measured. Thecardiac output is calculated using the equation above, with corrections for the specificheat capacities of blood and dextrose solution. The calculations are perforrredimmediately by a dedicated computer.
For small animals and humans a bolus of 2-5ml of room temperature fluid is sufficient.For larger animals the injectate has to be cooled to obtain a reasonable temperature dropin the pulmonary arterial blood. Typically, measurements in horses require the injectionof 60ml of ice-cold dextrose in less than 5 seconds.
Li dilutionA new method uses a lithium ion sensitive catheter. The catheter is placed in a peripheralartery and monitors the lithium concentration continuously. A bolus of lithium cNoride isinjected into the jugular vein. The method avoids having to place a catheter in thepulmonary artery, which is the major drawback to the thernodilution method. Uthium iscleared slowly from the body and so there is a maximum number of measurements thatcan be made at one time.
page 16
Doppler ultrasoundThis is the same principle used to measure blood flow in peripheral arteries. If the bloodflow is measured in the aorta it will equal the cardiac output (with a small error for thecoronary circulation). The problerns are measuring the aortic diameter and the angle ofincidence of the beam. The flow profile is assumed to be flat (turbulent) in the aorta. Theblood flow in the aorta is pulsatile and reverses at the end of systole as the aortic valvesclose. The calculations are therefore performed on a beat-to-beat basis with correctionsfor the negative flow.
Sternal notch
In humans the ascending aorta can be insonated using a probe in tle sternal notch. Theangle of the beam is in line with the flow and the flow profile is flat The aortic diameteris estimated using the patient's height, weight, sex etc.
Transoesophageal
In animals the sternal notch approach does not work because of the differences in chestanatomy from humans. The descending aorta can be reached from a probe placed in theoesophagus. The aorta and oesophagus are assumed to be parallel and the angle ofincidence is the angle at which the transmitter is placed in the probe. The diameter of theaorüa has to be estimated from nomograms or by imaging the aorta using radiography orultrasound. The method is only suitable for animals that will accept an oesophageal probeand is usually perforrred under anaesthesia.
Cardiac innaging
The stroke volume, an[ thus the cardiac output, can be measured using imagingultrasound. The stroke volume can be estimated from measurements of the ventricularvolumes in systole and diastole. Alternatively, the diameter of the oudlow tract can bemeasured and the velocity of the blood found using the ultrasound in Doppler mode.
BioimpedanceThe electrical impedance of the chest can be measured using a small current at a highfrequency (5 - 50 kHz). The impedance of the chest (Zo) varies stightly during thecardiac cycle. This variation is assumed to be due to the ejection of blood, which has highconductivity, into the lungs (which have low conductivity) during systole. The exactorigin of the variation in impedance is not certain. However, the derivative of theimpedance (dzJdt) can be used to estimate stroke volume and hence cardiac output.
The system has limited use. Its great advantage is that it is non-invasive and only requiresthe placement of ECG electrodes on the patient. Its accuracy is questionable, especially ifthere are changes in body position and it is generally used to track changes in cardiacoutput rather than absolute values. The non-invasive nature makes it useful in aerospaceapplications.It has been validated in dogs.
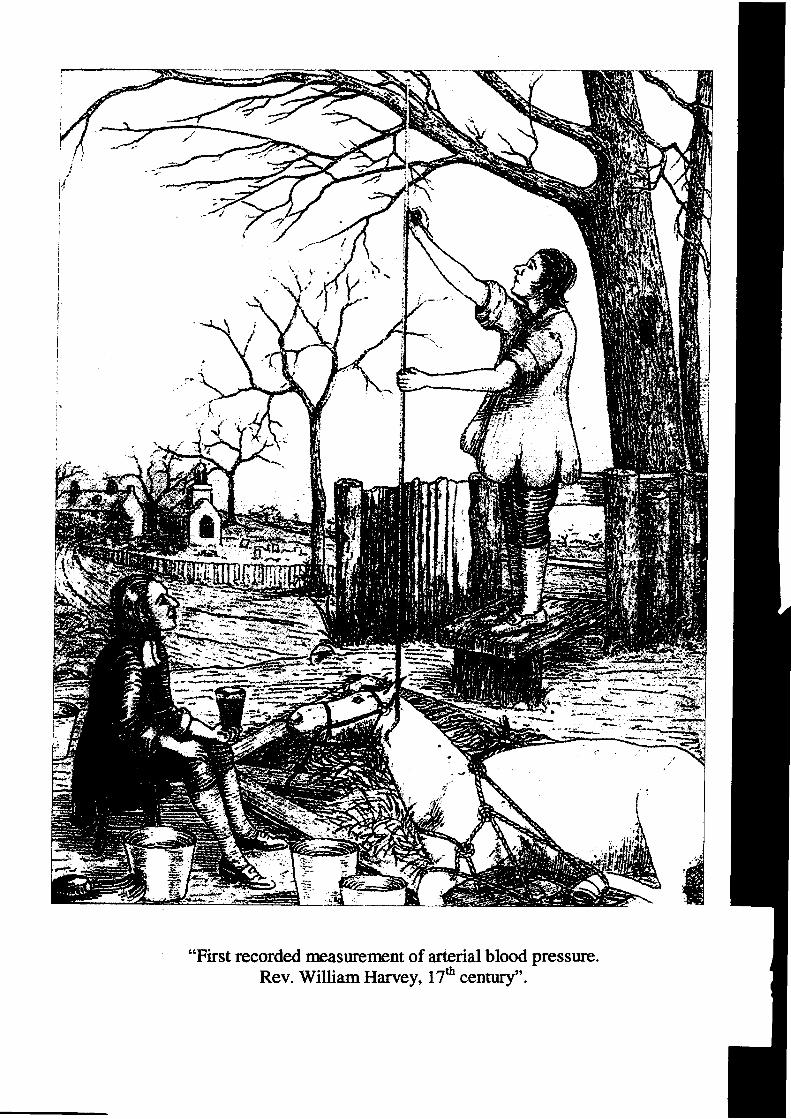
"First recorded nnasurenrent of arterial blood pressure.Rev. William Harvey, I'l* century".
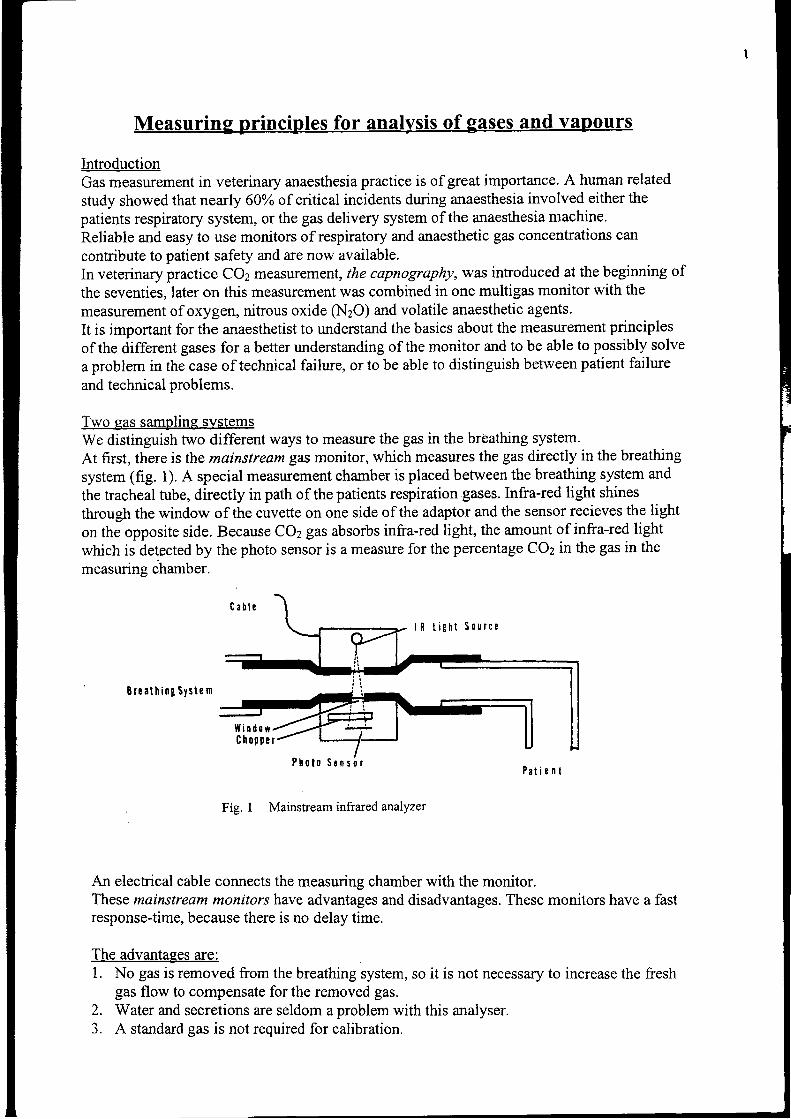
lntroductionGas measurement in veterinary anaesthesia practice is of great importance. A human related
study showed that nearly 600Ä of citical incidents during anaesthesia involved either thepatients respiratory system, or the gas delivery system of the anaesthesia machine.Reliable and easy to use monitors of respiratory and anaesthetic gas concentrations can
contribute to patient safety and are now available.In veterinary practice COz measurement, the capnography, was introduced at the beginning of
the seventies, later on this measurement was combined in one multigas monitor with the
measurement of oxygen, nitrous oxide (NzO) and volatile anaesthetic agents'It is important for the anaesthetist to understand the basics about the measurement principles
of the different gases for a better understanding of the monitor and to be able to possibly solve
a problem in the case of technical failure, or to be able to distinguish between patient failure
and technical problems.
Two gas sampline systemsWe distinguish nvo different ways to measure the gas in the bröathing system.At first, there is the mainstream BN monitor, which measures the gas directly in the breathing
system (fig. 1). A special measurement cha:nber is placed between the breathing system and
the tracheal tube, directly in path of the patients respiration gases. lnfra-red light shines
through the window of the cuvette on one side of the adaptor and the sensor recieves the light
on the opposite side. Because COz gas absorbs infra-red light, the amount of infra-red light
which is detected by the photo sensor is a measure for the percentage COz in the gas in the
measurins chamber.
B r e a t h i n g S y s t e m
Fig. 1 Mainstream ffiared analYzer
An electrical cable connects the measuring chamber with the monitor.These mainstream monitors have advantages and disadvantages. These monitors have a fastresponse-time, because there is no delay time.
The advantaees are:l. No gas is removed from the breathing system, so it is not necessary to increase the fresh
gas flow to compensate for the removed gas.Water and secretions are seldom a problem with this analyser.A standard gas is not required for calibration.
W i n d o w
S c n s o l
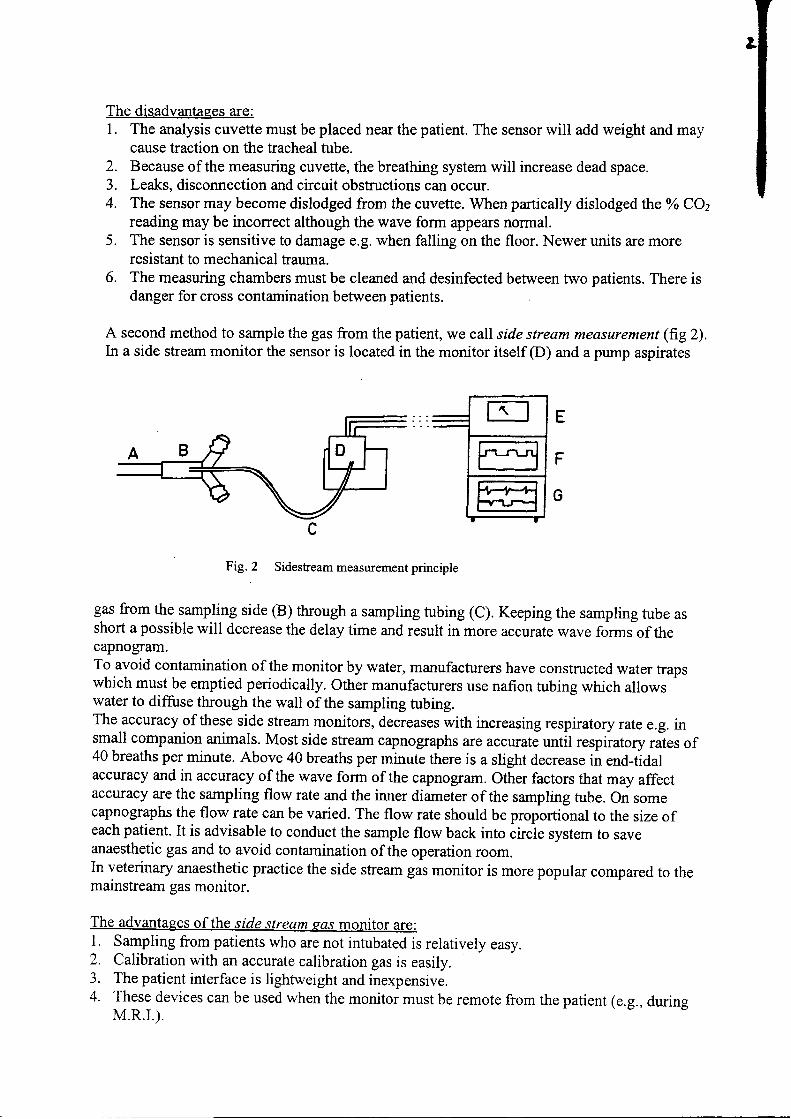
The disadvantages are:1. The analysis cuvette must be placed near the patient. The sensor will add weight and may
cause traction on the tracheal tube.Because of the measuring cuvette, the breathing system will increase dead space.Leaks, disconnection and circuit obstructions can occur.The sensor may become dislodged from the cuvette. When partically dislodged theoÄ COzreading may be incorrect although the wave form appears normal.The sensor is sensitive to damage e.g. when falling on the floor. Newer units are moreresistant to mechanical trauma.
6. The measuring chambers must be cleaned and desinfected between two patients. There isdanger for cross contamination between patients.
A second method to sample the gas from the patient, we call side stream measurement (fig2).In a side stream monitor the sensor is located in the monitor itself @) and a pump aspirates
Fig. .2
Sidesteam measurement principle
gas from the sampling side (B) through a sampling tubing (C). Keeping the sampling tube asshort a possible will decrease the delay time and result in more accurate wave forms of thecapnogram.To avoid contamination of the monitor by water, manufacfurers have constructed water trapswhich must be emptied periodically. Other manufacturers use nafion tubing which allowswater to diffuse through the wall of the sampling tubing.The accuracy of these side stream monitors, decreases with increasing respiratory rate e.g. insmall companion animals. Most side stream capnographs are accurate until respiratory rates of40 breaths per minute. Above 40 breaths per minute there is a slight decrease in end-tidalaccuracy and in accuracy of the wave form of the capnogrnm. Other factors that may affectaccuracy are the sampling flow rate and the imer diameter of the sampling tube. On somecapnographs the flow rate can be varied. The flow rate should be proportional to the size ofeach patient. It is advisable to conduct the sample flow back into circle system to saveanaesthetic gas and to avoid contamination of the operation room.In veterinary anaesthetic practice the side stream gas monitor is more popular compared to themainstream gas monitor.
The advantages of the side stream gas motitor are:l. sampling from patients who are not intubated is relativery easv.2. Calibration with an accurate calibration gas is easily.3. The patient interface is lightweight and inexpensive.4. These devices can be used when the monitor must be remote from the patient (e.g., during
M.R. I . ) .
2.J .
4.
5 .
ffi
3
The disadvantages are:T-r"blr*r *th th. toUittg sample system can occure. Secrations or water can cause
obstruction of the tubing-. Some water traps may be saturated so that water enters the
measurement sYstem'2. Leaks in the sampling tubing or obstruction by kinking can occur'
3. The gases aspiraäa must be either routed to the scanvenging system or rreturned to the
breathing sYstem.4. Some delaY time is inevitable'
TechnoloKv
lnfra-red light absorptionThe principl. of irrä-d üght absorption is an old measuring principle and was developed by
Luft (19a3) in Germany to ireasure ittt CO, percentage in a gasmixture' At that time it was
important io know the COz percentage inside submarines'
Infra-red analyzers ur" bar"ä on the lact that gases that have two or more dissimilar atoms in
the molecule like coz, NzO and the halogenied agents, have specifi" Td Tuque absorption
.p""Ou of infra-red tiffrt. Since the amount of light absorbed is proportional to the
concentration of the absorbing molecules, the cäcentration can be determined by comparing
the absorbance with that of a known stanäard. The nonpolar molecules of nitrogen and Oz do
not absorb infra-red light and cannot be measured using this technology'
I i
'C- i ! rn r rsht sou 'ce
f i r rers I Iäl-a: -c iopper i lheel
i
l ! l
t ! lt i t
t i a
i
f , e f e r e n c e C h e m b ! r
l f at c I
> [ l c c l t o n i c s
P h s t o s c n s o t
Fig. 3 Sidestream optical infrared analyzet
Figure 3 shows a side stream I.R. analyser. A beam of IR light is generated by an IR light
source and conducted though a spinning weel: the chopper' This chopper wheel has holes
with filters specially selecte-d for ihe go;* to be measur.a' fn" gas to be measured is pumped
continously through a sample chamber: the measuring chamber. The selectively filtered and
pulsed light is passed through the sample chamber and also through a reference chamber with
no absorption characteristic-s. The IR tigttt i, then focused on an IR light detector: the photo
sensor. The amount of tigtt absorbed u! tne sample gas is proportional to the partial pressures
of the gases to U. *"*,räd. The "h*g'irrg
light Lvels on.tht photosensor produce changes in
the electrical current that runs through it.ln etectric amplifier processes the signal to a
perfect caPnogram.
l l l t t t o r
Mono chromatic side stream IR analyzers use one wavelength to measure potent inhalationalagents and are unable to distinguish between agents. When such an analyzer is used, the
anaesthetist must select which agent is to be monitored. Polychromatic IR analyzers usemultiple wavelengths to both identify and quantify the various agents. This eliminates theneed for the user to select the agent to be monitored.Most side stream analyzers have fixed sampling rates (usually 150 mVmin.). The measuring
cell is calibrated to zero, usually with room air and to a standard level using a calibration gas
mixture delivered by a small pressurized cilinder. Some old types side stream capnographs are
sensitive for interfearing of N2O gas. These monitors (e.g. Gould, Godart) have a knob ('Ttr2O
comp") which has to be used during anaesthesia with Oz and NzO. The COz measurement at
that momentis compensated for NzO interfearing.
A i r w a y
Fig.4 Mainsüeam infrared analyzer, cross-sectional view
Figure 4 shows the measuring principle of the mainstream CO2 measurement. As was showedbefore, the patient respiratory gas stream passes through a chamber (cuvette) with twowindows, usually made from sapphire which is transparant to infra-red light. The cuvette isplaced between the breathing system and the patient. The sensor, which houses both the lightsource and detector, fits over the cuvette. To prevent condensation of water, the sensor isheated slightly above body temperature. IR light shines through the window on one side of theadapter and the sensor receives the light on the opposite side. After passing through thesample chamber the light goes through three ports in a rotating wheel, which contains (a) asealed cell with a known high CO2 concentration, (b) a chamber vented to the sensor'sinternal atmosphere, and (c) a sealed cell containing only nitrogen. The radiaton then passesthrough a filter that screens the light to the correct wavelength to isolate COz informationfrom interfering gases and onto a photo detector. The signal is amplified and sent to displaymodule.
Photoacoustic spectroscopyPhotoacoustic spectroscopie is based on the fact that absorption of IR light by moleculescauses them to expand and thereby increases the pressure of the gas. If the light is delivered inpulses, the pressure increase will be intermittent. If the frequency of pulsation is in the audible
ChoDDr r l l hee I
S a m p l e C h a m b e r
f i l t e r - 0 e t e c t o r
I RS o u r c ePowe rS u t p l y
l R I i g h t
5
range, the changes in pressure will create an acoustic signal that can be detected by amicrophone. A photoacoustic gas analyzer is shown in fig. 5.
tlcrcphoac
r.ä'hIt uEp-loo. RofcrcacctPrtlGlt ():5rgca
oü Rafctcaceblct Gü
Irlct
Fig.5 Photoacousticffiared analyzer
The gas sample is drawn into the merlsurement chamber through a flow regulator. This makesthe sample flbw rate independent of changes in the patient's airway pressure. Light from aninfra-red source is aimed toward a window in the measurement chamber. Before the lightenters the chamber, it passes through a spinning chopper wheel that causes it to pulsate. Todifferentiate between the three signals caused by carbon dioxide (COz) nitrous oxide (NzO)and anaesthetic agents (A.A.), the chopper has three concentric bands of holes. This causesthe light to pulsate at three different frequencies. Each light beam then passes through anoptical filter that only allows light of a specific wavelength to pass through. Thus thefrequencies and wavelengths of the incident light are matched to the infra-red spectra of thethree gases to be measured. [n the measurement chambers, each beam excites one of thegases, causing it to expand and contract at a frequency equal to the pulsating frequency of theappropriate infra-red beam. The periodic expansion and contraction of the gas sample producea fluctation of audible frequency that can be detected by a microphone. The oxygenconcentration in this monitor is estimated according to the paramagnetic principle. Thisprinciple will be explained later on. Because of the switched magnetic field, again a soundwave is produced. The amplitude of this wave will be proportional to the concentration of the02 present.The photoacoustic principle was developped by a Danish company Bruel and Kjaer, acompany which produced high quality professional microphones. Later on Hewlett Packardproduced this multigas monitor in licence. This type of monitor uses a special selected infra-red band with for anaesthetic agent concentration measurement. This is shown in fig. 6.A bandwidth 10 - 13 pm (micrometer) wavelength was chosen while most othercommercially available multigas monitors use a bandwidth around 3,3 pm. To use thebandwidth of 10 - 13 pm has special advantage. The problem is that herbivores like horses,sheep and cows produce methane (CH4) in their intestines and consequently in the expirationgases. The upper curve of fig. 6 shows the absorbance of methane in the infra-red spectrum.
wavelength7
Capnomacbandwith
AGM 1304bandwith
Fig. 6 Diagram representing absorption of methane (CHa) and halothane in the infrared spectrum. Thebandwidth used by two different anaesthetic agent mouitors is indicated.
We see alarge absorption peak around 3,3 pm. The lower curve shows the halothaneabsorption curve of the infta-red light. We see a small absorption peak at 3,3 pm and a largeabsorption peak betwee4 10 - 13 pm for halothane. This results in interference of methane inthe halothane measurement for all the multigas analyses which use 3,3 pm as a wavelength.These multigas monitors cannot be used at horses and herbivores, because halothanemeasurement is incorrect. Methane is detected by this gas analyzer as halothane and added atthe normal halothane concentration. Examples of this analysers are: Datex multicap, Datexcapnomac, Datex AS/3 old model, Siemens SC9000 monitor and others. The influence ofniethane dwing isoflurane measurement in this type of monitors (3,3 pm) is not so dramaticand is seven times (7 x) lower compared to halothane measurement in the same monitor.The sensitivity for methane of a multigas analyser can be easily tested. Make for this test agasmixture of L,Zo/o natural gas (which consists of 80% CFI4) and 98,8o/o air in an anaesthesiaballoon. When the sampletube of the analyzer is connected to the gasmixture, the multigasmonitor with the 3,3 pm bandwidth will show a false "halothane" reading of > 10oÄ'halothane". At the same time when switched to "isoflurane" the reading will be 2%o false,isoflurane switched to enflurane, desflurane or sevoflurane, these false measurements arerespectively 2,5%o (Enfl.), 1,5% @esfl.) or 1,3Yo (Sevo). Remark that this test is done with 1%CII+ which equals to 10.000 ppm (parts per million).The same methane lesl with a 10 - 13 pm bandwidth multigas monitor will show not anyfalse reading for halothane, isoflurane, enflurane, desflurane or sevoflurane.Example, of non-methane sensitive analyzers are: Bruel and Kjaer type 1304 multigasanalyzer, Hewlett Packard M1025 Anaesthetic Gas analyzer and others.Summarizing the photoacoustic spectroscopy, the next advantages can be noticed:
Better long-term stability than traditional lnfrared insfrumentsAccuracy is greater compared to I.R. technologyNot sensive for interfering gases like methane or alcoholExcellent zero stabilityShort warmup time (some minutes)
As a disadvantage can be mentioned that the prices of this gas analyzers are higher comparedto I.R. analyzers.
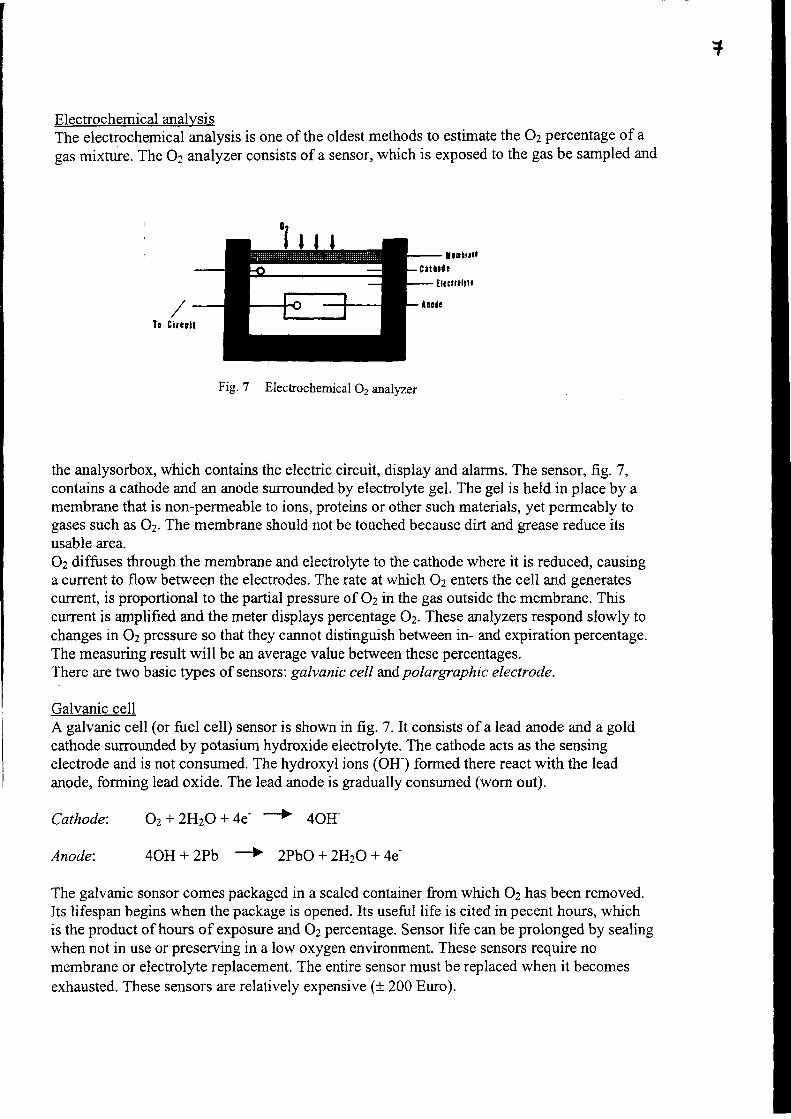
+
Electrochemical analysisThe electrochemical analysis is one of the oldest methods to estimate the Oz percentage of a
gas mixture. The 02 analyzer consists of a sensor, which is exposed to the gas be sampled and
Fig. 7 Electochemical 02 analyzer
the analysorbox, which contains the electric circuit, display and alarms. The sensor, frg. 7,contains a cathode and an anode surrounded by electrolyte gel. The gel is held in place by amembrane that is non-perrneable to ions, proteins or other such materials, yet permeably togases such as Oz. The membrane should not be touched because dirt and grease reduce itsusable area.Oz diffuses through the membrane and electrolye to the cathode where it is reduced, causinga current to flow between the electrodes. The rate at which Oz enters the cell and generatescurrent, is proportional to the partial pressure of 02 in the gas outside the membrane. Thiscurrent is amplified and the meter displays percentage 02. These analyzers respond slowly tochanges in Oz pressure so that they cannot distinguish between in- and expiration percentage.The measuring result will be an average value between these percentages.There are two basic fypes of sensors: galvanic cell andpolargraphic electrode.
Galvanic cellA galvanic cell (or fuel cell) sensor is shown in fig. 7. It consists of a lead anode and a goldcathode surrounded by potasium hydroxide electrolyte. The cathode acts as the sensingelectrode and is not consumed. The hydroxyl ions (OH-) formed there react with the leadanode, forming lead oxide. The lead anode is gradually consumed (worn out).
Cathode:
Anode:
Oz+ ZHzO + 4e' + 4OH-
4OH + 2pb -> 2pbo + ZHtO + 4e-
The galvanic sonsor comes packaged in a scaled container from which Oz has been removed.Its lifespan begins when the package is opened. Its useful life is cited in pecent hours, whichis the product of hours of exposwe and 02 percentage. Sensor life can be prolonged by sealingwhen not in use or preserving in a low oxygen environment. These sensors require nomembrane or electrolyte replacement. The entire sensor must be replaced when it becomesexhausted. These sensors are relatively expensive (t 200 Euro).
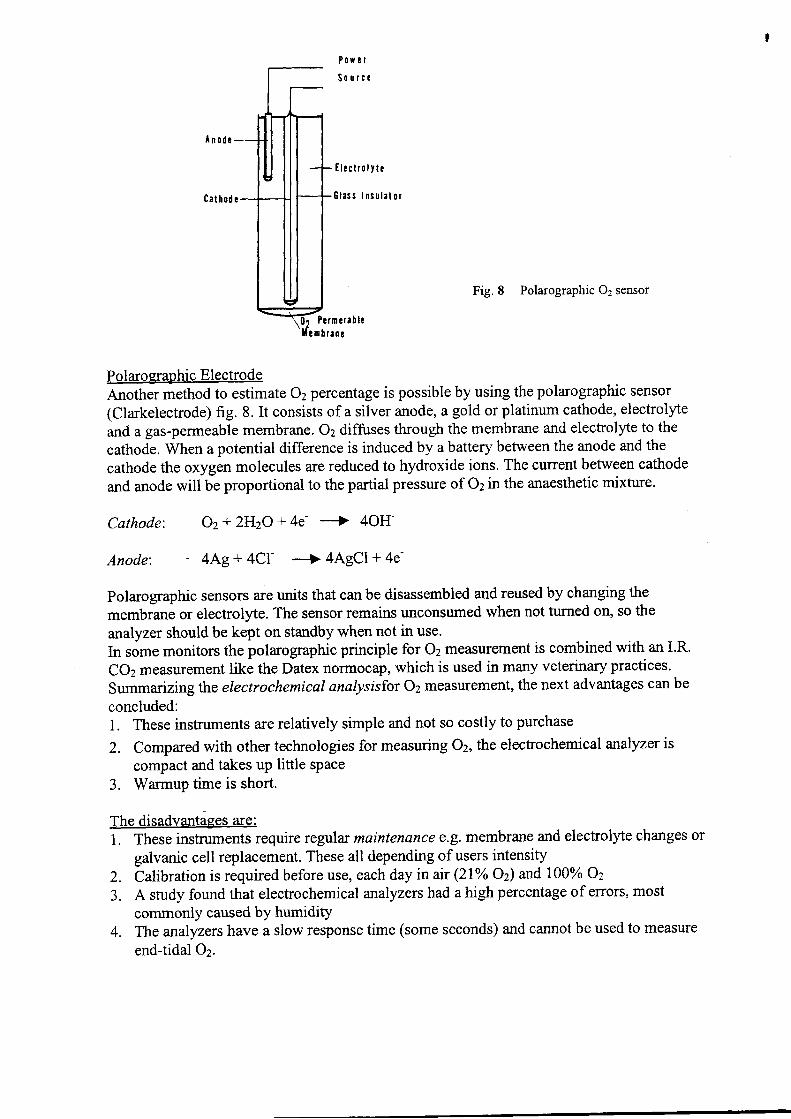
P o ü ! l
S o u r c c
I l e c t r o l t t c
E l a s s I n s t l l a l o r
Fig. 8 Polarographic 02 sensof
Pcrmcra ! l c! m b r a n r
Polaro graphic ElectrodeAnother method to estimate 02 percentage is possible by using the polarographic sensor(Clarkelectrode) fig. 8. It consists of a silver anode, a gold or platinum cathode, electrolyte
and a gas-permeable membrane. Oz diffuses through the membrane and electrolyte to the
cathode. When a potential difference is induced by a battery between the anode and the
cathode the oxygen molecules are reduced to hydroxide ions. The current between cathode
and anode will be proportional to the partial pressure of Oz in the anaesthetic mixture.
Cathode:
Anode:
Oz+ 2HzO + 4e' -+ 4OH-
4Ag + 4Cl- --+ 4AgCl + 4e-
polarographic sensors are units that can be disassembled and reused by changing the
membrane or electrolyte. The sensor remains unconsumed when not turned on, so the
analyzer should be kept on standby when not in use.ln some monitors the polarographic principle for Oz measurement is combined with an I.R.
COz measurement like the Datex nofinocap, which is used in many veterinary practices.
Summarizing the electrochemical analysisfor Oz measruement, the next advantages can be
concluded:l. These instruments are relatively simple and not so costly to purchase
2. Compared with other technologies for measuring 02, the electrochemical analyzer is
compact and takes up little space3. Warmup time is short.
The disadvantiges are:1. These instruments require regular maintenance e.g. membrane and electrolyte changes or
galvanic cell replacement. These all depending of users intensity
2. Calibration is required before use, each day in ay (21% Oz) md 100% Oz
3. A study found that electrochemical malyzers had a high percentage of errors, most
commonly caused by humiditY4. The analyzers have a slow response time (some seconds) and cannot be used to measure
end-tidal Oz.
1
Paramaexetic AnalysisA different method to measure 02 concentrations is based onthe paramagnetic analysis.When induced into a magnetic field, some substances locate themselves in the sfongestportion of the field. These substances are termedparamagnetic. Of thegases of interest inanasthesia, only 02 is paramagnetic. The Oz molecule can be seen as a molecule withmagnetic properties (comparable like iron molecules).When a gas containing 02 is passed through a switched magnetic field, the gas will expandand confract, causing a pressure wave proportional to the partial pressure of 02 present. Toobtain a high degree of accuracy it is necessary to compare the pressure in the gas sample to areference signal obtained using air.
l l r r t ü r r ( } u t
) * " n " ' ' ' ' ' ' o
Fig. 9 Paramagnetic 02 analyzer
A paramagnetrc Oz analyser is shown in fig. 9. Reference (air) and sample gases are pumpedthrough the analyzer. The two gas paths are joined by a differential pressure or flow sensor.The magnet is switched on and off rapidly. If the streams of sample and reference gas havedifferent 02 partial pressures, the magnet will cause their pressures to differ. This difference isdetected by the transducer and converted into an electrical signal that is displayed as 02partial pressure (or converted to volumes percent). The short rise time (100-200 m. sec) of thistechnique allows measurement of inspired and end-tidal Oz levels at high respiratory rates.The paramagnetic analyzer is strongly temperature dependent; therefore accurate temperaturecompensation is needed. Some monitors (e.g. Bruel and Kjaer, Hewlett Packard Ml025)combine photoacoustic infrared analysis of COz, NOz and anaesthetic agents withparamagnetic Oz analysis. Switching the magnet on and off at a certain frequency generates apressure wave that can be detected in the acoustic spectrum. This is known asmagnetoacoustics. One problem with these instruments is that if the gas from the analyzer isretumed to the breathing system, or to the low flow or closed circle system, the air that is usedas a reference gas will dilute the other gases and cause an increase in nitrogen.
U ! r t r o n . g n r t
0 i l f r r ! n t i a l I r r n t d u c c t
R r l r r ! n c ! G e s l r
Piezo electric AnalysisThe piezo electric method is used to measure the concentration of the anaesthetic agents. Thismethod uses vibrating crystals coated with a layer of lipid or thin silicon rubber, see fig. 10.One crystal is coated and one crystal is uncoated. When exposed to a volatile anaestheticagent, the vapor is adsorbed into the lipid- or silicon layer. The resulting change in the massof the lipid- or silicon layer, alters the vibrating frequency of the coated crystal. By use of anelectronic system consisting of two oscillating circuits, one of which has the uncoated(reference) crystal and the other a coated (detector) crystal, an electric signal which isproportional to the vapor concentration is generated. By comparing the vibration frequenciesof the cristals, the levels of anaesthetic agent in the gas being analyzed can be measured.
6 r s I l c r
U n s o s l t dC r y s t r l
C o r t ! d
S r t s t . l
0 i s p l l t
Fig. 10 Piezoelectric anralyzer for anaesthetic agents
Advantages1. Investigations show an accuracy of better than0,l%o2. Fast response time - newer models can measure inspired and expired levels of agents3. Short warm up time4. Compact - the units are small-
Disadvantages1. Only suitable for the anaesthetic agents2. No automatic agent identification3. Water will cause effors with the piezoelectric monitor. In the sampling tube, water
separators or nafion tubing must be used.
A
i l ! c t t 0 n i c s
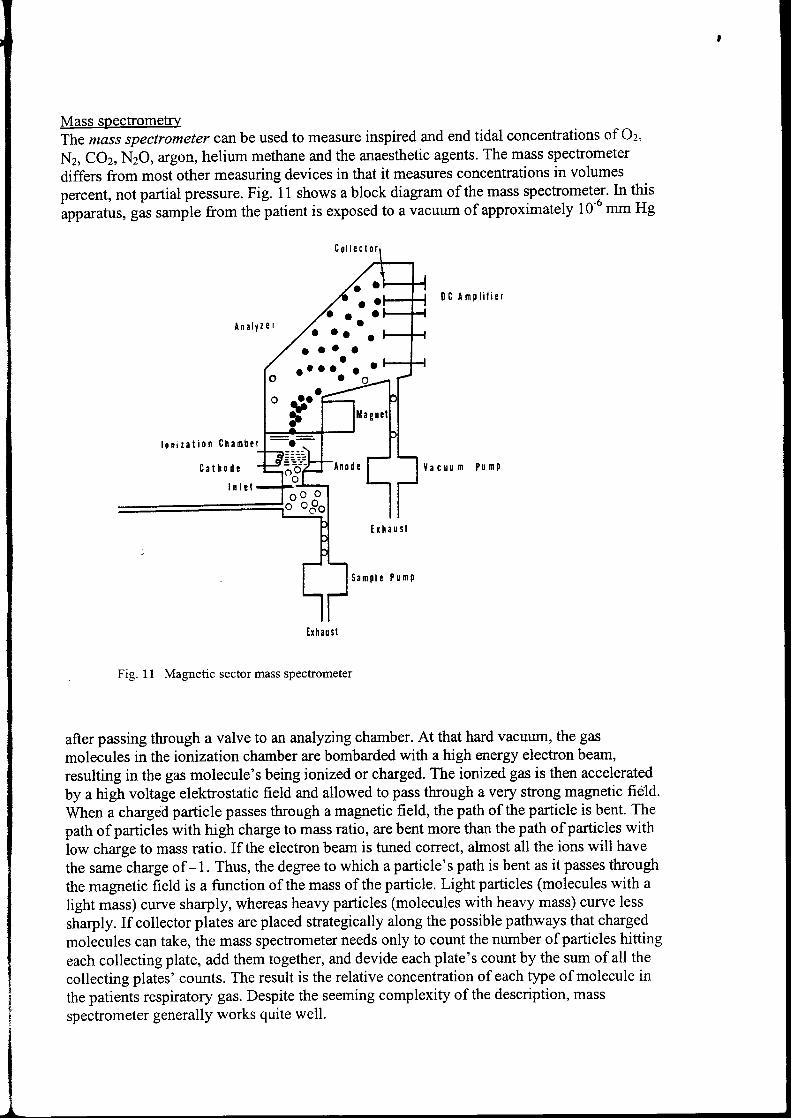
Mass spectromebryThe mass spectrometer canbe used to measure inspired and end tidal concentrations of Oz,
Nz, COz, N2O, argon, helium methane and the anaesthetic agents. The mass spechometer
differs from most other measuring devices in that it measures concentrations in volumes
percent, not partial pressure. Fig. 11 shows a block diagram of the mass spectrometer. In this
apparatus, gas sample from thelatient is exposed to a vacuum of approximately 10-6 mm Hg
0 C A m t l i l i e t
P ü n P
Fig. 11 Magnetic sector mass spectrometer
after passing through a valve to an analyzing charnber. At that hard vacuum, the gas
molecules in the ionization charnber are bombarded with a high energy electron beam,
resulting in the gas molecule's being ionized or charged. The ionized gas is then accelerated
by a high voltage eleltrostatic field and allowed to pass through a very strong magnetic field.
When a charged particle passes through a magnetic field, the path of the particle is bent. The
path of particles with high charge to mass ratio, are bent more than the path of particles with
low charge to mass ratio. If the electron beam is tuned correct, almost all the ions will have
the same charge of -1. Thus, the degree to which a particle's path is bent as it passes through
the magnetic field is a function of the mass of the particle. Light particles (molecules with a
light mass) curve sharply, whereas heavy particles (molecules with healy mass) curve less
sharply. If collector plates are placed strategically along the possible pathways that charged
molecules can take, the mass spectrometer needs only to count the number of particles hitting
each collecting plate, add them together, and devide each plate's count by the sum of all the
collecting plates' counts. The result is the relative concentration of each type of molecule in
the patients respiratory gas. Despite the seeming complexity of the description, mass
spectrometer generally works quite well.
A n a l t l e r
l o n i r a t i o n C h a r n b e t
C a t h o d r
I n l r l
I r h a u s t
S a m p l r P r m P
t o t t t t a t . r t ,
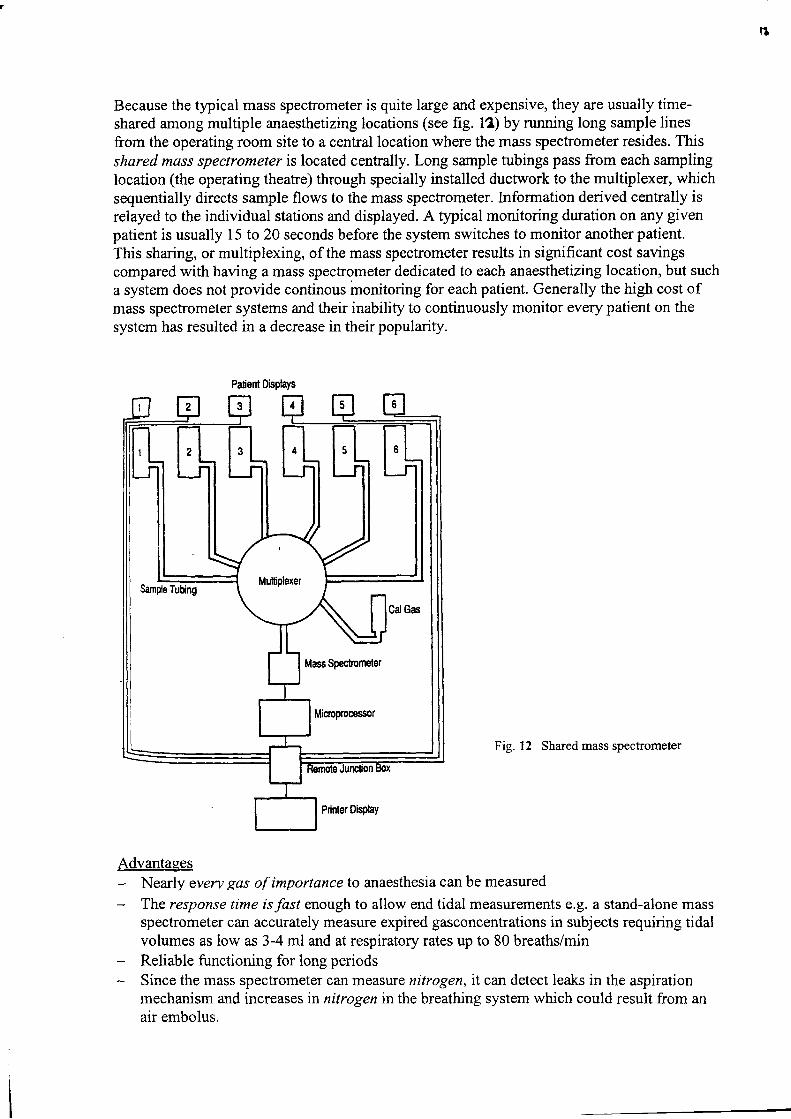
B
Because the typical mass spectrometer is quite large and expensive, they are usually time-shared among multiple anaesthetizing locations (see fig. 12) by rurming long sample linesfrom the operating room site to a central location where the mass spectrometer resides. Thisshared mass spectrometer is located centrally. Long sample tubings pass from each samplinglocation (the operating theatre) through specially installed ductwork to the multiplexer, whichsequentially directs sample flows to the mass spectrometer. Information derived centrally isrelayed to the individual stations and displayed. A typical monitoring duration on any givenpatient is usually 15 to 20 seconds before the system switches to monitor another patient.This sharing, or multiplexing, of the mass spectrometer results in significant cost savingscompared with having a mass spectrometer dedicated to each anaesthetizing location, but sucha system does not provide continous monitoring for each patient. Generally the high cost ofmass spectrometer systems and their inabilify to continuously monitor every patient on thesystem has resulted in a decrease in their popularity.
Fig. 12 Shared mass spectrometer
AdvantagesNearly every gas of importance to anaesthesia can be measured
The response time is fast enough to allow end tidal measurements e.g. a stand-alone massspectrometer can accurately measure expired gasconcentrations in subjects requiring tidalvolumes as low as 3-4 ml and at respiratory rates up to 80 breaths/minReliable functioning for long periodsSince the mass spectrometer can measure nitrogen, it can detect leaks in the aspirationmechanism and increases in nitrogen in the breathing system which could result from anair embolus.
I
I
Palient Displays
Mass Spestmneter
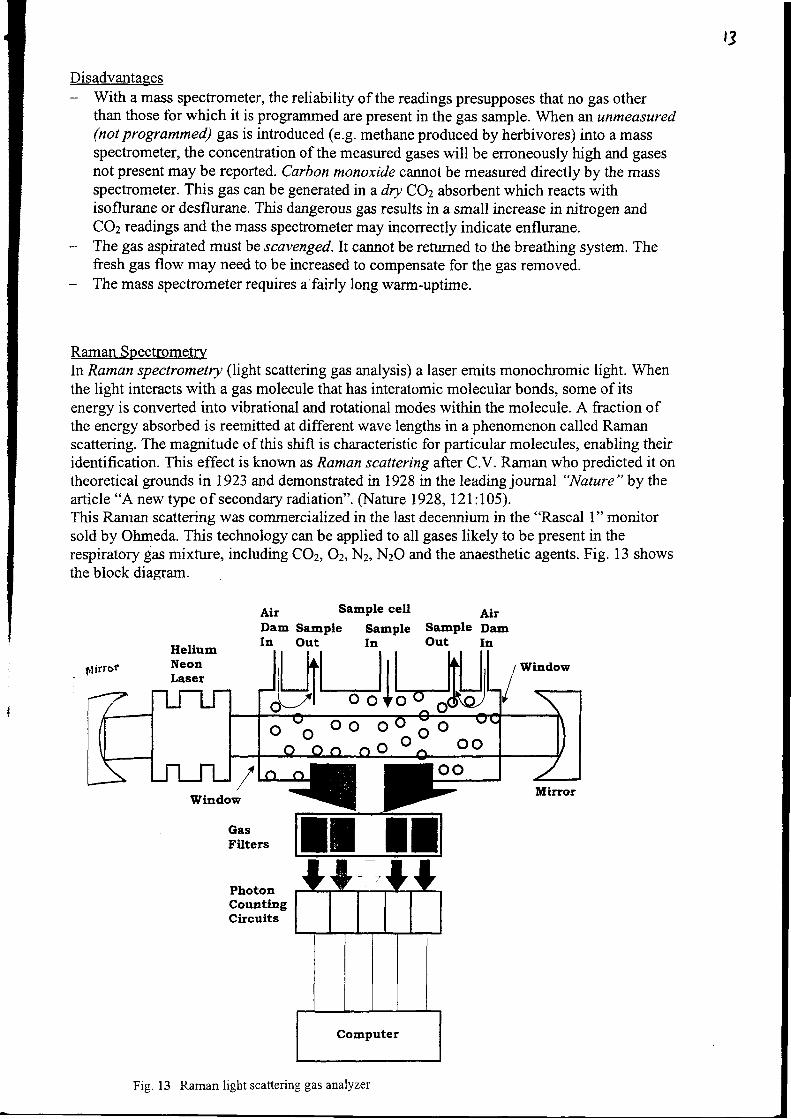
t3
DisadvantagesWith a mass spectrometer, the reliability of the readings presupposes that no gas otherthan those for which it is programmed are present in the gas sample. When an unmeasured(not programmed) gas is introduced (e.g. methane produced by herbivores) into a m:Nsspectrometer, the concentration of the measured gases will be erroneously high and gasesnot present may be reported. Carbon monoxide cannot be measured directly by the massspectrometer. This gas can be generated in a dry COz absorbent which reacts withisoflurane or desflurane. This dangerous gas results in a small increase in nitrogen andCOz readings and the mass spectrometer may incorrectly indicate enflurane.The gas aspirated must be scavenged.It cannot be reftrmed to the breathing system. Thefresh gas flow may need to be increased to compensate for the gas removed.The mass spectrometer requires a fairly long warm-uptime.
Raman SpectrometryIn Raman spectrometry (light scattering gas analysis) a laser emits monochromic light. Whenthe light interacts with a gas molecule that has interatomic molecular bonds, some of itsenergy is converted into vibrational and rotational modes within the molecule. A fraction ofthe energy absorbed is reemitted at different wave lengths in a phenomenon called Ramanscattering. The magnitude of this shift is characteristic for particular molecules, enabling theiridentification. This effect is known as Raman scattering after C.V. Raman who predicted it ontheoretical grounds in 1923 and demonstrated n 1928 in the leading journal "Nature " by thearticle "A new type of secondary radiation". fNature 1928,l2I:105).This Raman scattering was commercialized in the last decennium in the "Rascal 1" monitorsold by Ohmeda. This technology can be applied to all gases likely to be present in therespiratory gas mixture, including CO1 Oz, N2, N2O and the anaesthetic agents. Fig. 13 showsthe block diagrarn.
Ai' Sample cell
Dam Sample Sarnple SampleIu Out In Out
ttirror Window
oo
Window
PhotonCountingCircuits
AirDamIn
oo oo^öoo o- oo
Fig. 13 Raman light scatteri:rg gas analyzer
,l
The gas mixture to be analysed is drawn continuously through a water separator into theinstrument. The measwing cell is a cylinder with a window at each end. The light is generatedby a helium-neon laser. Two mirors increase light intensity within the cell. The illuminationis so powerful that it could combust the anaesthetic agents. To prevent this, room air is drawninto the cell close to the windows, creating an air dam across the windows.There are port holes on the side of the sample cell. Each has a frlter of narrow opticalbandwidth, tuned to a specific Raman scatter frequency. Transmitted light is detected byphoto diodes. The number of photons at each wavelength is directly proportional to theconcentration of the particular gas present.
AdvantagesThis technology can identiff and measure inspired end expired partial pressures for mostgases of interest in anaesthesia.Fast response time.Fast start up time.High degree of accuracy.Unknown or unusual gases such as methane or alcohol do not interfere and don't affectthe accuracy.
DisadvantagesThe analyzer is fairly large and heavy compaired to LR. monitors.Air will be added in the returned breathing gas. In low flow or closed system anaesthesiathe sample out gas cannot be returned.This technology is relatively new in commercially available instruments (+ 10 year); theinitial co3t of the monitor is somewhat higher than with other technologies. Also technicalproblems with the laser were reported.
Chemical Carbon Dioxide Detectionihemical (colorimetric) indicator devices consists of a pH sensitive chemical indicator whosepH is just above the level where the dye chosen is expected to change its colors enclosed in adisposable housing. When the detector is exposed to CO2, it becomes more acidic andchanges color from pink (low COz) to yellow (high CO2).The inlet and outlet parts are 15 mm, so the device can fit between patient and the breathingsystem. The chemical COz detector is used primarily for confirming successful trachealintubation:A minimum of six breaths should be performed before a determination is made.This device can function durine 10-24 hours.
AdvantagesThe device is easy to use.The device is very cheap.Requires no power source.Very accurate in diagnosing esophageal intubation.Device can indicate effectiveness of resuscitation. A negative test result may indicate pooror absent pulmonary blood flow.
DisadvantagesThe device is not suitable for continuous monitoring. There is no wave form or alarm.Not suitable for very low tidal volumes.
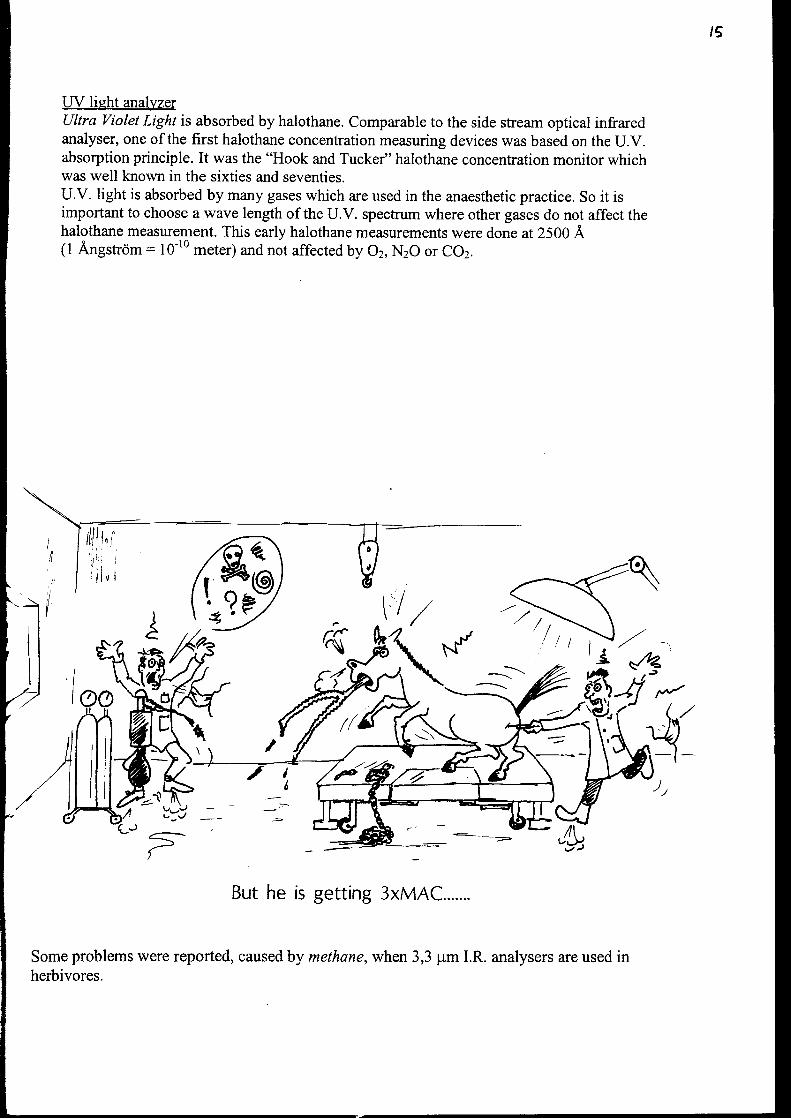
t5
IJV lieht analvzerUltra Violet Light is absorbed by halothane. Comparable to the side stream optical infraredanalyser, one of the first halothane concentration measuring devices was based on the U.V.absorption principle. It was the "Hook and Tucker" halothane concentration monitor whichwas well known in the sixties and seventies.U.V. light is absorbed by many gases which are used in the anaesthetic practice. So it isimportant to choose a wave length of the U.V. spectrum where other gases do not affect thehalothane measurement. This early halothane measurements were done at 2500 A(1 Angström: l0-10 meter) and nät affected by Oz,NzO or COz.
'li:1\:' I ,/
.{.
+,But he is getting 3xMAC.......
Some problems were reported, caused by methane, when 3,3 pm I.R. analysers are used inherbivores,
t{-\.Y-j
)
Oz
Nz
NzO
-Infrared analyzer-Photoacoustic infrare d analy zer-Mass spectrometer-Raman light scatteing analyzer-Chemical/hygro scop ic
-lnfrared analyzer-Photoacoustiq infr ared analy zer-Mass spectrometer-Raman light scatteing analyzer
-Paramagnetic Oz analy zer-Mass spectrometer-Elecko chemical 02 analyzer-Polarographic Oz sensor-Mass spectrometer-Raman light scatteing analyzer
-Mass spectrometer-Raman light scattering
AnaestheticAgents -Infrared analyzer(Hal, Iso, Des,Sevo) -Photoacoustic infrared analyzer
-Mass spectrometer
CO
Methane
-Raman light scattering analyzer-Piezo electric alrralyzer-W light analyzer
-Indirectly with mass spectrometer
-Indirectly with short wavelength (3.3 pm) infrared analyzer-Mass spectrometer
AcknowledgementsThe author thanks miss B. Rietbergen for editing the text.
ReferencesJ.A' Dorsch, M.D. , S.E. Dorsch, M.D. Understanding Anaesthesia equipment Ed. 4lgggWilliams and WilkinsL.J. saidman, M.D., N.Ty.smith, M.D. Monitoring in Anasthesia. Ed. 3 rgg3Butterworth-HeinemannY. Moens, W. Verstraeten. Capnographic monitoring in Small Animal Anaesthesia. J. ofAm. Anim. Hosp. Assoc. (1982) 18, 659-67gY' Moens, A. de Moor. Use of infrared carbon dioxide analysis during general anaesthesiain the horse. Equine Vet. J. ( I 98 1) 13, 229-234Y. Moens, P. Goodes, E. Lagerwerj. The influence of methane on the infraredmeasrrement of halothane in the horse. J. vet. Anaesth. (1991)l 9,4-7P' Gootjes, Y. Moens' A simple method to correct infrared measurement of anaestheticvapour concentration in the presence of methane. J. Vet. Anaesth. (lgg7) 24.24-25
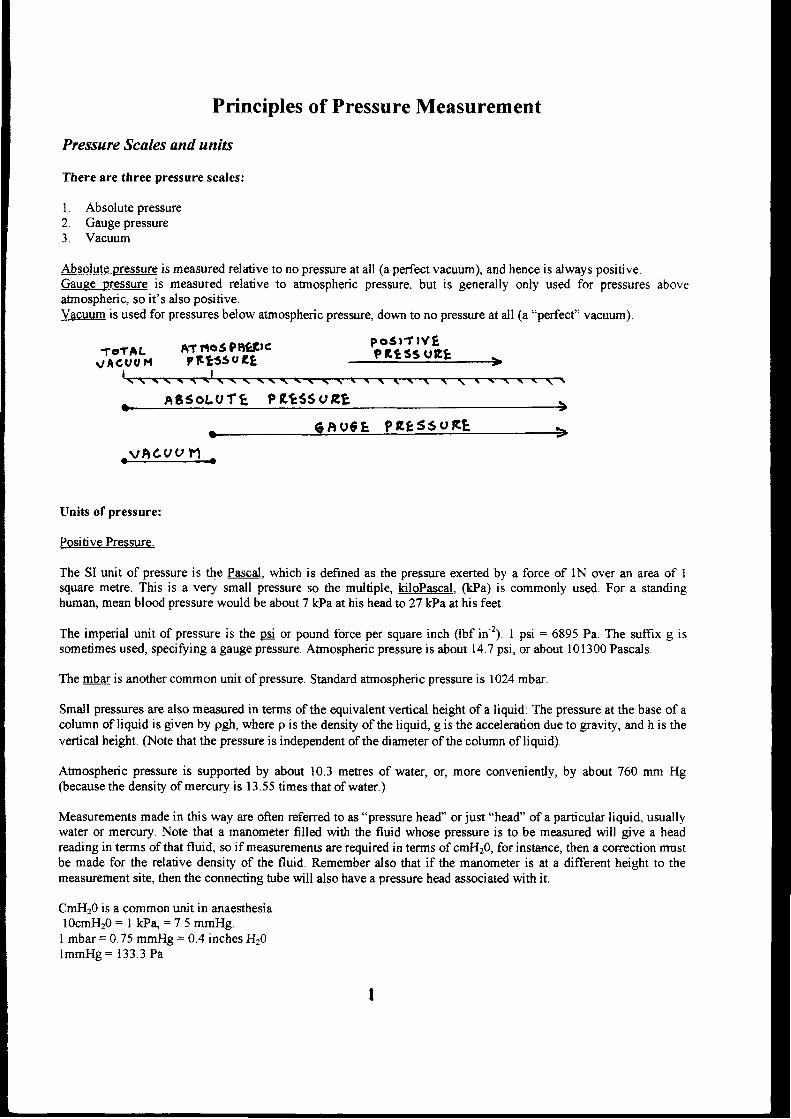
Principles of Pressure Measurement
Pressure Scales and units
There are three pressure scales:
1. Absolute pressure2. Gauge pressure3 Vacuum
Absolute pfessure is measured relative lo no pressure at all (a perfect vacuum), and hence is always positiveGauge pressure is measured relative to atrnospheric pressure, but is generally only used for pressures aboveatmospheric, so it's also positive.Vacuum is used for pressures below aünospheric pressure, down to no pressure at all (a "perfect" vacuum).
fg fALvACUo t{
AT ltos P6ۧlc?lt t55ut8
p o 3 t T l V EP ß 1 3 3 U E T
AESOLUTI , Pß t65UEE
, vACU U n -
Units of pressure:
Positive Pressure.
The SI unit of pressure is the Pascal, which is defined as the pressure exerted by a force of lN over an area of Isquare metre. This is a very small pressure so the multiple, kiloPascal, (kPa) is commonly used. For a standinghuman, mean blood pressure would be about 7 kPa at his head to 27 kPa at his feet.
The imperial unit of pressure is the pgi or pound force per square inch (lbf in-21. I psi = 6895 Pa. The suffrx g issometimes used, specifying a gauge pressure. Atrnospheric pressure is about 14.7 psi, or about 101300 Pascals.
The mbar is another common unit of pressure. Standard arnospheric pressure is 1024 mbar.
Small pressures are also measured in terms of the equivalent vertical height of a liquid: The pres$ue at the base of acolumn of liquid is given by pgh, where p is the density of the liquid, g is the acceleration due to gravity, and h is thevertical height. (Note that tle pressure is independent of the diameter of the column of liquid).
Atmospheric pressure is supported by about 10.3 metres of water, or, more conveniently, by about 760 mm Hg(because the density of mercury is 13.55 times that of water.)
Measurements made in this way are often referred to as "pressure head" or just "head" of a particular liquid, usuallywater or mercury. Note that a manometer filled with the fluid whose pressure is to be measured will give a headreading in terms of that fluid, so if measurements are required in terms of cmH20, for instance, then a cosection rnustbe made for the relative density of the fluid. Remember also that if the manometer is at a different height to themeasurement site, then the connecting ü.rbe will also have a pressure head associated with it.
CmHzO is a common unit in anaesthesia.l0cmH20 = 1 kPa" = 7 5 mmHg.I mbar = 0 75 mmHg = 0.4 inches H20lmmHe = 133.3 Pa
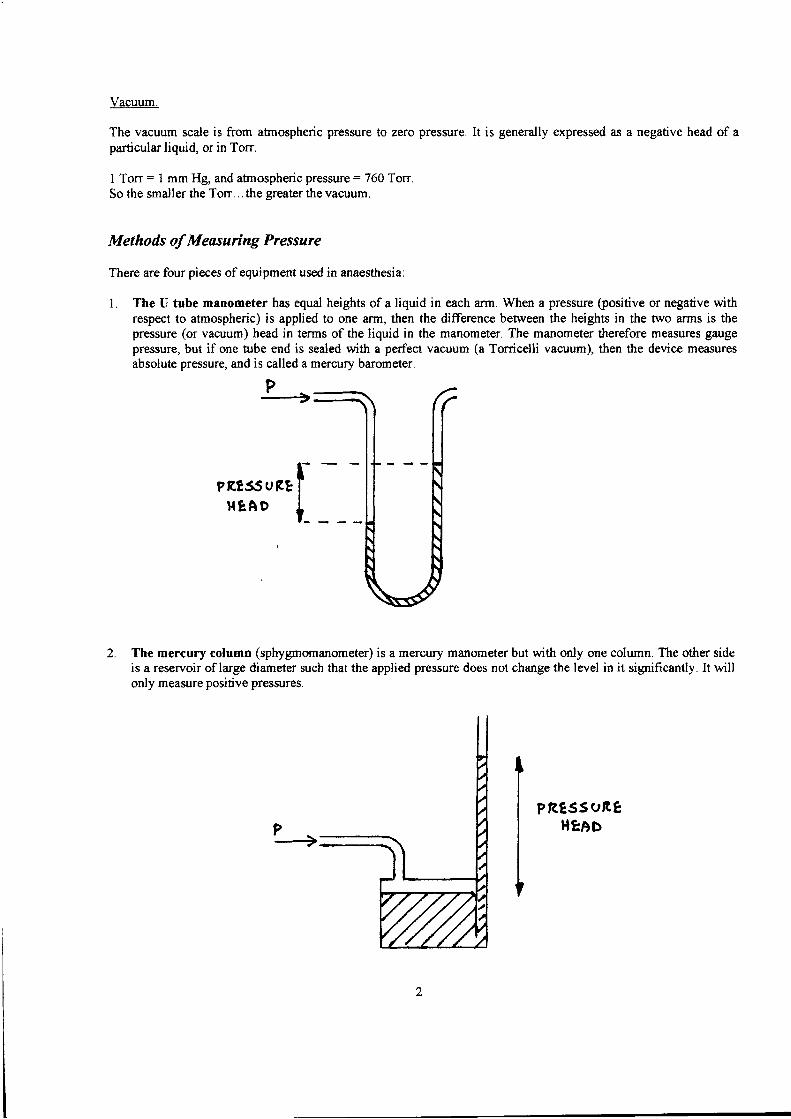
Vacuum.
The vacuum scale is from atrnospheric pressure to zero pressure. It is generally expressed as a negative head of aparticular liquid, or in Torr.
I Ton = I mm Hg, and afnospheric pressure = 760 TonSo the smaller the Torr. .. the greater the vacuum.
Methods of Measuring Pressure
There are four pieces of equipment used in anaesthesia:
I The U tube manometer has equal heights of a liquid in each arm. When a pressure (positive or negative withrespect to atrnospheric) is apptied to one arm, then the difference between the heights in the two arms is thepressure (or vacuum) head in terms of the liquid in the manometer. The manometer therefore measures gaugepressure, but if one nrbe end is sealed with a perfect vacuum (a Tonicelli vacuum), then the device measuresabsolute pressure, and is called a mercury barometer.
P1
The mercury column (sphygmomanometer) is a mercury manometer but wittr only one column. The other sideis a reservoir of large diameter such that the applied pressure does not change the level in it significantly. It willonly measure positive pressures.
PRTSSUßEHIAD
Pßrss u ßE l-r{sAD l_
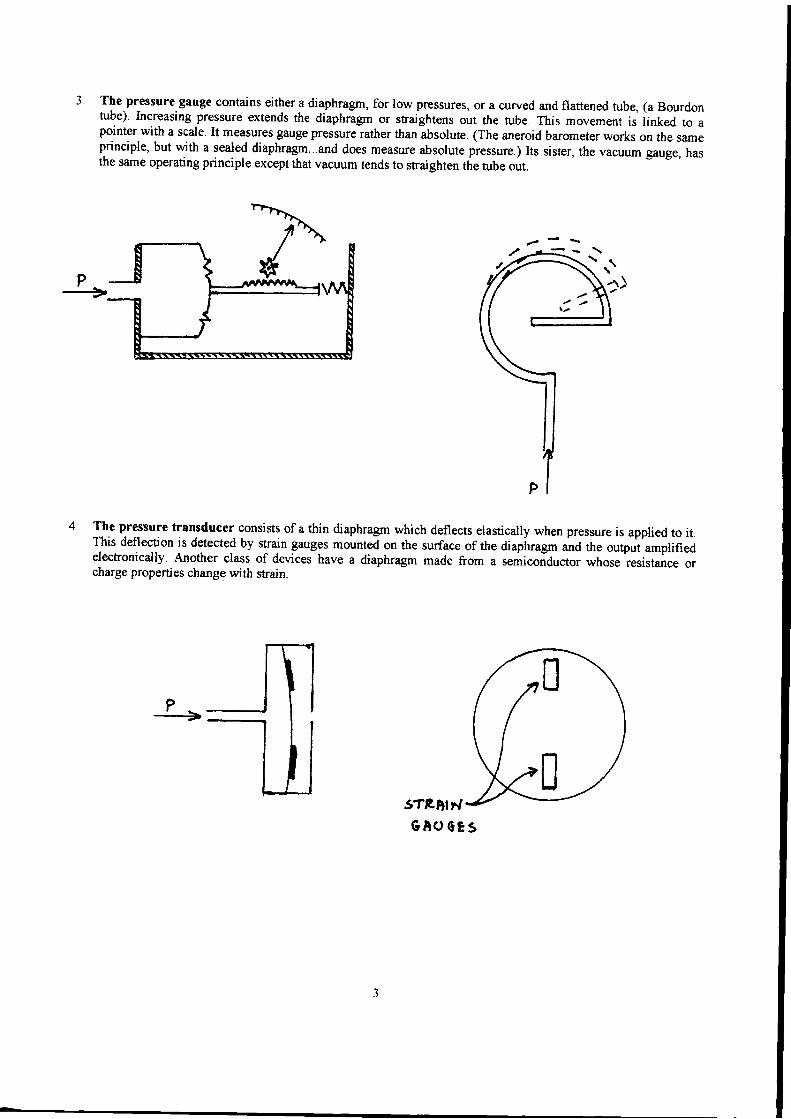
P..--->
The.pressure gauge contains either a diaphragrn, for low pressures, or a curved and flattened tube, (a Bourdontube). Increasing pressure extends the diaphragm or straightens out the tube. This movement is linked to apointer with a scale. It measures gauge pressure rather than
-absolute. (The aneroid barometer works on t1,e same
principle, but with a sealed diaphragm...and does measure absolute pressure.) Its sister, the vacuum gauge, hasthe same operating principle except that vacuum tends to straighten the tube out.
The pressure transducer consists of a thin diaphragm which deflects elastically when pressure is applied to it.This deflection is detected by strain gauges mounted on the surface of the diap-hragrn äa tn" output amplifiedelectronically. Another class of devices have a diaphragm made from a semiconductor whose resistance orcharge properties change with strain.
Pt
sTßDlF,GAo c83
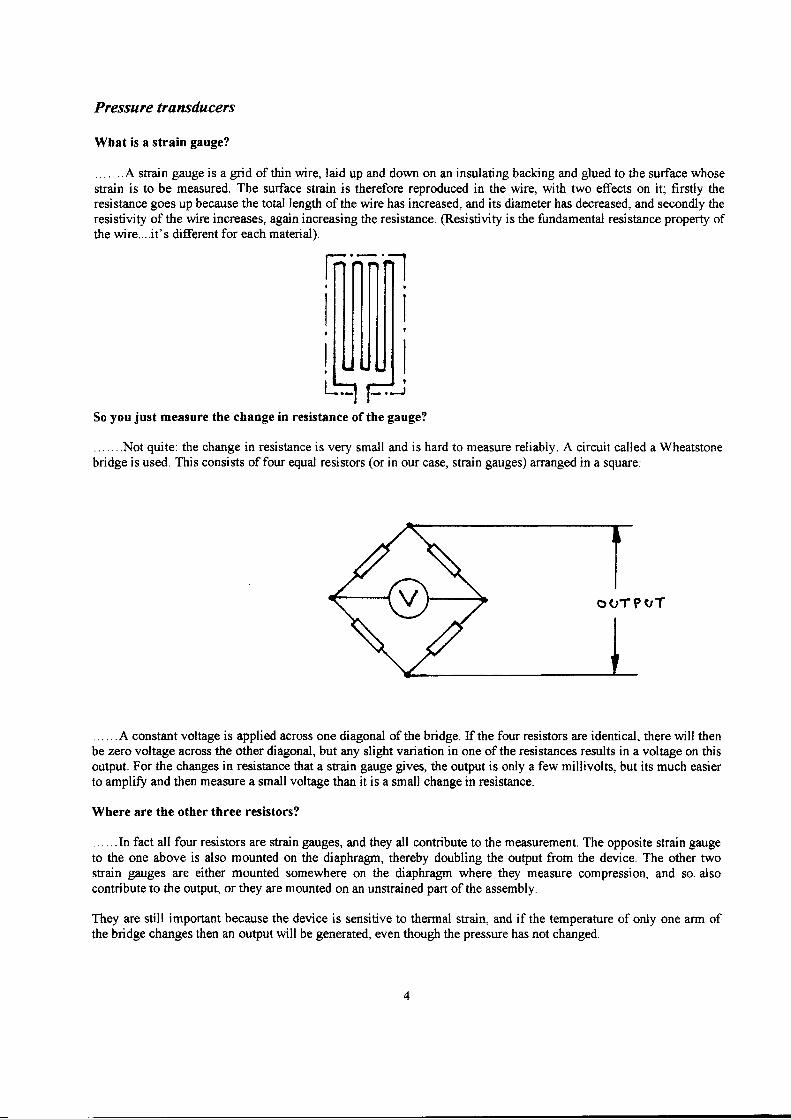
Pressure transducerc
What is a strain gauge?
. . . .. ..4 strain gauge is a grid of thin wire, laid up and down on an insulating backing and glued to the surface whosestrain is to be measured. The surface strain is therefore reproduced in the wire, with two effects on it; firstly theresistance go€s up because the total length of the wire has increased, and its diameter has decreased, and secondly theresistivity of the wire increases, again increasing the resistance. @esistivity is the fundamental resistance property ofthe wire....it's different for each material).
So you just measure the change in resistance of the gauge?
... .. ..Not quite: the change in resistance is very small and is hard to measure reliably. A circuit called a Wheatstonebridge is used. This consists offour equal resistors (or in our case, strain gauges) ananged in a square:
. . . . . . A constant voltage is applied across one diagonal of the bridge. If the four resistors are identical, there will thenbe zero voltage across the other diagonal, but any slight variation in one ofthe resistances results in a voltage on thisoutput. For the changes in resistance that a strain gauge gives, the output is only a few millivolts, but its much easierto amplifo and then measure a small voltage than it is a small change in resistance.
Where are the other three resistors?
... ...In fact all four resistors are strain gauges, and they all contribute to the measurement. The opposite strain gaugeto the one above is also mounted on the diaphragm, thereby doubling the output from the device. The other twostrain gauges are either mounted somewhere on the diaphragm where they measure compression, and so. alsocontribute to the output, or they are mounted on an unstrained part of the assembly.
They are still important because the device is sensitive to thermal strain, and if the temperature of only one arm ofthe bridge changes then an output will be generated, even though the pressure has not changed.
O O T P V T
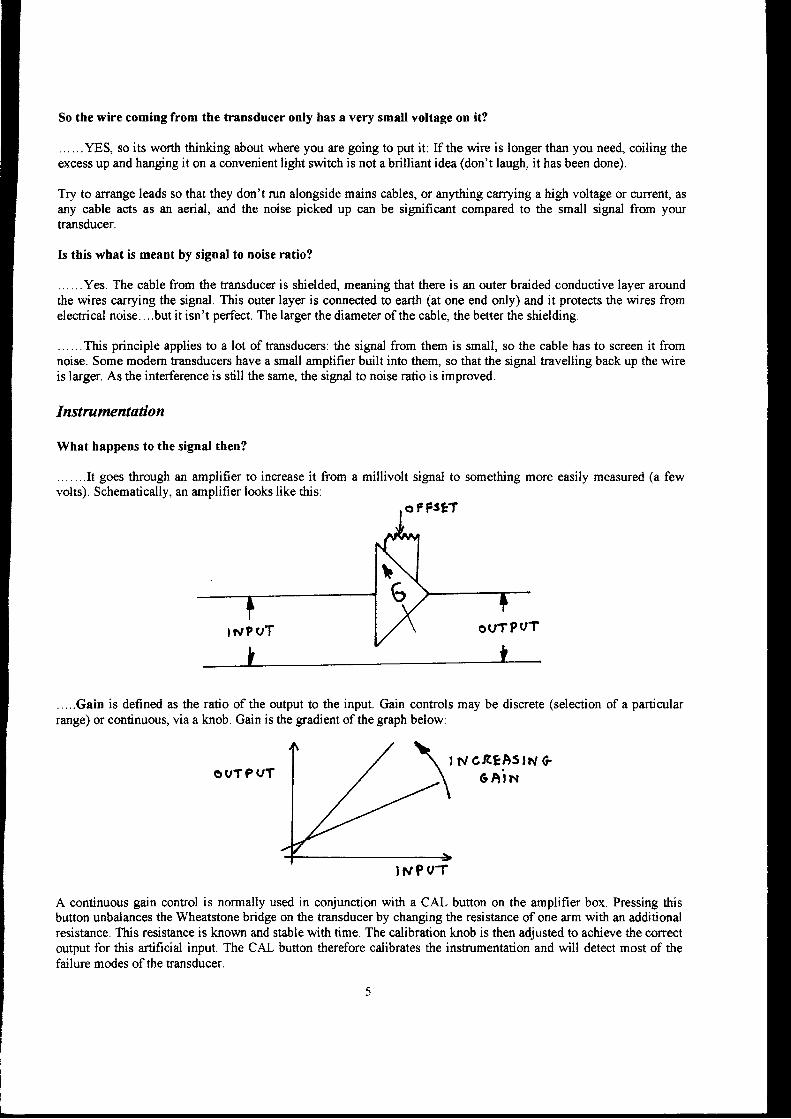
So the wire coming from the trensduccr only has a very small voltage on it?
. . . .. . YES, so its worth thinking about where you are going to put it: If the wire is longer than you need, coiling theexcess up and hanging it on a convenient light switch is not a brilliant idea (don't laugh, it has been done).
Try to arrange leads so that they don't run alongside mains cables, or anything carrying a high voltage or current, asany cable acts as an aerial, and the noise picked up can be significant compared to the small signal from yourtransducer.
Is this what is meant by signal to noise ratio?
... ...Yes. The cable from the transducer is shielded, meaning that there is an outer braided conductive layer aroundthe wires carrying the sigrral. This outer layer is connected to earth (at one end only) and it protects the wires fromelectrical noise....but it isn't perfect. The larger the diameter of the cable, the better the shielding.
......This principle applies to a lot of transducers: the signal from them is small, so the cable has to screen it fromnoise. Some modem transducers have a small amplifier built into them, so tlat the sigrral travelling back up the wireis larger. As the interference is still the same, the sigrral to noise ratio is improved.
Instrumentation
What happens to the signal then?
.......I1 goes through an amplifier to increase it from a millivolt signal to something more easily measured (a fewvolts). Schematically, an amplifier looks like this:
.,...Gain is defined as the ratio of the output to the input. Gain controls may be discrete (selection of a particularrange) or continuous, via a knob. Gain is the gradient of the graph below:
O V T P V T, i l cßEAs lN G
6A in
INPOT
A continuous gain control is normally used in conjunction with a CAL button on the amplifier box. Pressing thisbutton unbalances the Wheatstone bridge on the transducer by changing the resistance of one arm with an additionalresistance. This resistance is known and stable with time. The calibration knob is then adjusted to achieve the correctoutput for this artificial input. The CAL button therefore calibrates the instrumentation and will detect most of thefailure modes of tle transducer.
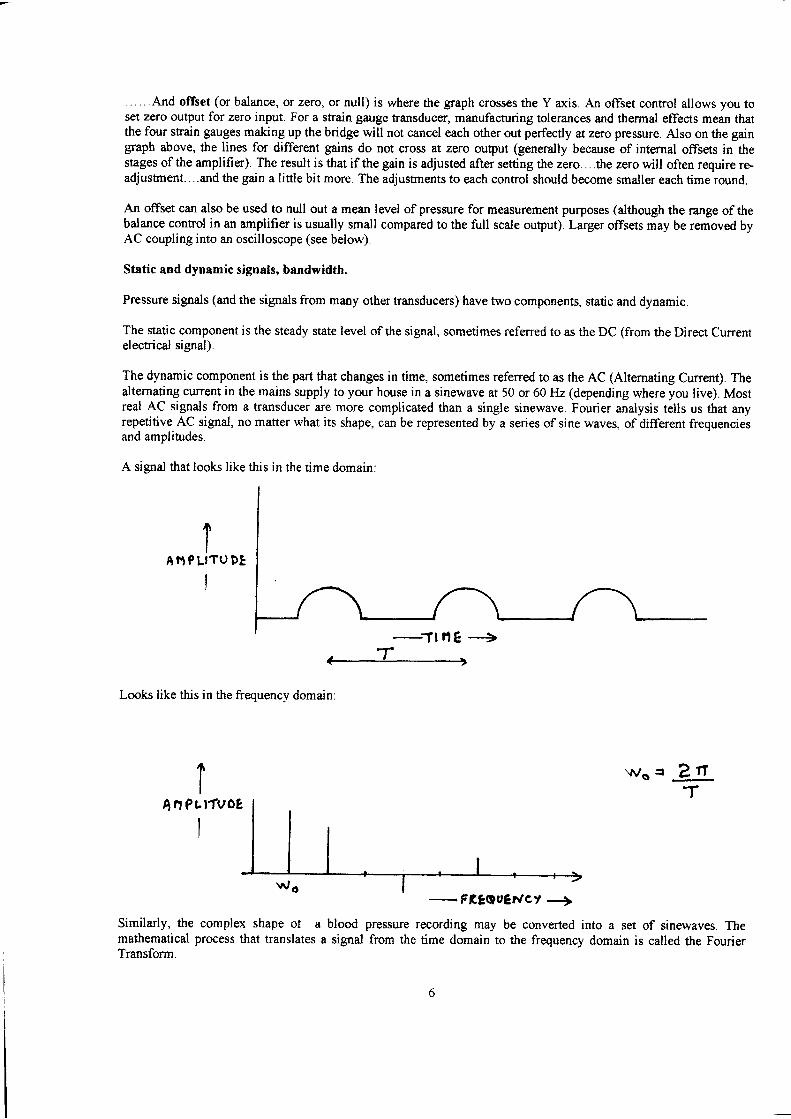
. .. . . . fuld offset (or balance, or zero, or null) is where the graph crosses the Y axis. An offset control allows you toset zero output for zero input. For a strain gauge transducer, manufaauring tolerances and thermal effects mean thattlre four strain gauges making up the bridge will not cancel each other out perfectly atzero pressure. Also on the gaingraph above, the lines for different gains do not cross at zero output (generally because of internal offsets in thestages of the amplifier). The result is that if the gain is adjusted after setting the zero. . . .the zero will often require re.adjustnent....and the gain a little bit more. The adjustments to each control should become smaller each time round.
An offset can also be used to null out a mean level of pressure for measurement purposes (although the range of thebalance control in an amplifier is usually small compared to the full scale output). Larger offsets may be rernoved byAC coupling into an oscilloscope (see below).
Stetic and dynamic signals, bandwidth.
Pressure signals (and the signals from many other transducers) have two components, static and dynamic.
The static rcmponent is the steady state level of the signal, sometimes referred to as the DC (from the Direa Currentelectrical signal).
The dynamic component is the part that changes in time, sometimes refened to as the AC (Altemating Current). Thealternating current in the mains supply to your house in a sinewave at 50 or 60 Hz (depending where you live). Mostreal AC signals from a transducer are more complicated than a single sinewave. Fourier analysis tells us that anyrepetitive AC signal, no matter what its shape, can be represented by a series of sine waves, of different frequenciesand amplitudes.
A signal that looks like this in the time domain:
IA N ? L ' T U D E
I
Looks like this in the frequency domain:
Similarly, the complex shape ot amathematical process tlat translates aTransform.
( 'T>
wss
blood pressure recording may be converted into a set of sinewaves. Thesignal from the time domain to the frequency domain is called the Fourier
2t-T
- FßEQueilct +
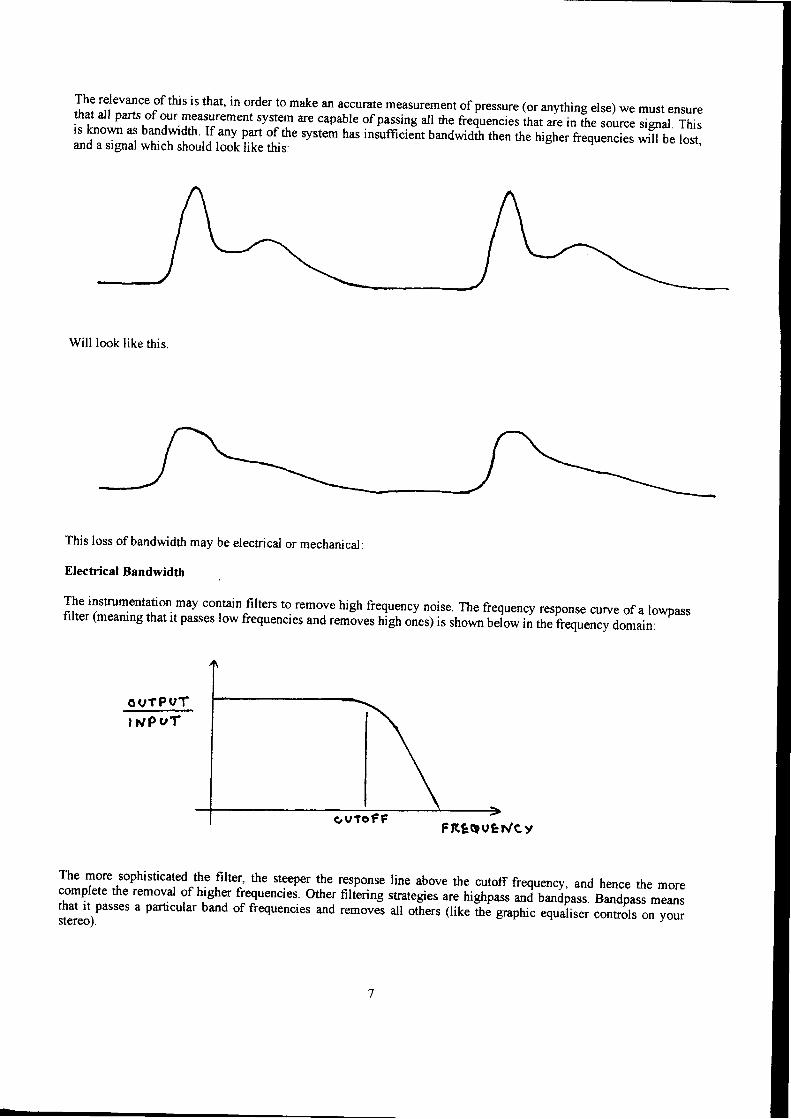
The relevance of this is that, in order to make an accurate measurement of pressure (or anything else) we must ensurethat all parts of our measurement system are capable of passing all the frequencies ihat ure in it e source signal. Thisis known as bandwidth If any part of the system tras inJufficiät bandwidth then the higher frequencies will be lost,and a signal which should look like this:
Will look like this.
O U T P U T
I lüP uT
This loss of bandwidth may be electrical or mechanical:
Electricd Bandwidth
The instrumentation may contain filters to remove high frequency noise..The frequency response curve of a lowpassfilter (meaning that it passes low frequencies and r"tnäues nigh onesy is shown befow in the frequency domain;
The more sophisticatedLhe {ilter, tle steeper the response line above the cutoff frequeacy, and hence the morecomplete the removal of higher frequenciei. other filfering strategies are highpass -i o-äp"rr. Bandpass meansthat it passes a particular band of frequencies and removei all ot-hers (ike the gaphic equaliser controls on yourstereo).
s v t o F FFßtAueh/ey
L
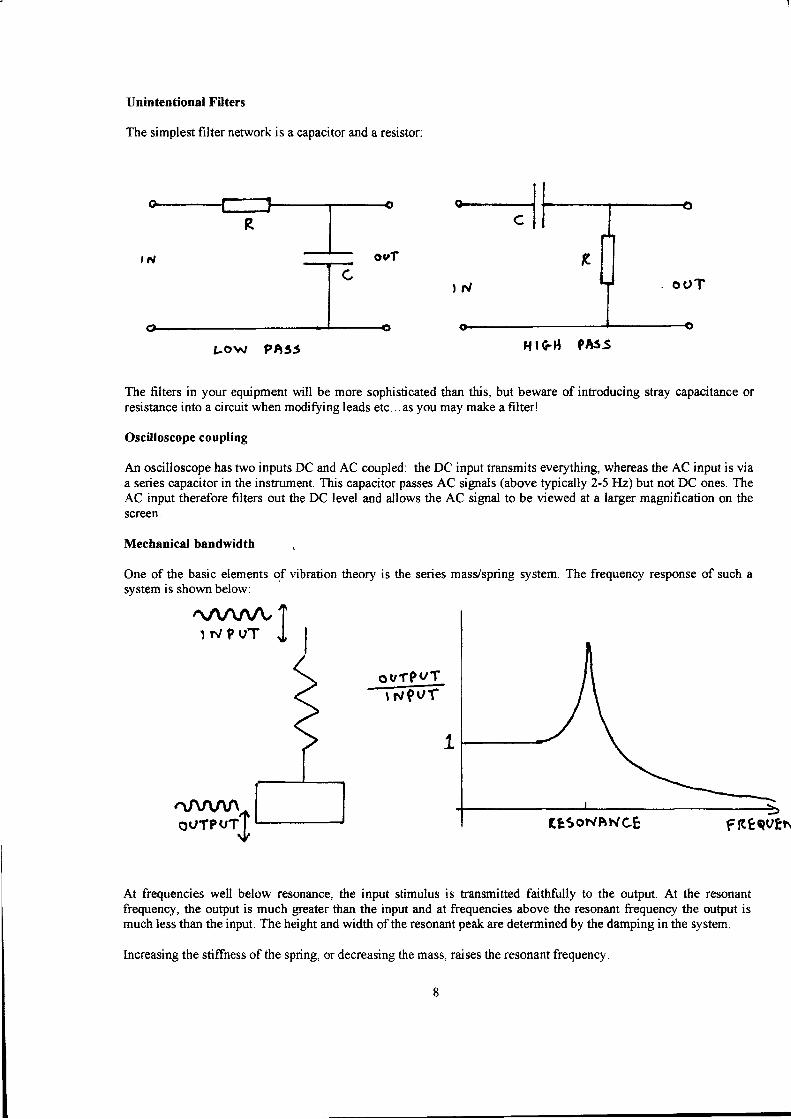
Unintentional Filters
The simplest filter network is a capacitor and a resistor:
Low ?h35 ä | rrä röJ>
The filters in your equipment will be more sophisticated than this, but beware of introducing stray capacitance orresistance into a circuit when modifoing leads etc... as you may make a filterl
Oscilloscope coupling
An oscilloscope has two inputs DC and AC coupled: the DC input transmits everything, whereas the AC input is viaa series capacitor in the instrument. This capacitor passes AC signals (above typically 2-5 Hz) but not DC ones. TheAC input therefore filters out the DC level and allows the AC signal to be viewed at a larger magrification on thescreen.
Mechanical bandwidth
One of the basic elements of vibration theory is the series masVspring system. The frequency response of such asvstem is shown below:
At frequencies well below resonance, the input stimulus is transmitted faithfully to the output. At the resonantfrequency, the output is much grcater than the input and at frequencies above the resonant frequency the output ismuch less than the input. The height and width of the resonant peak are determined by the damping in the system.
lncreasing the stiffness ofthe spring, or decreasing the mass, raises the resonant frequency.
r{ | GB 9AsS
O U f P V T
ßE5oNtrl.rcE FßeauEN
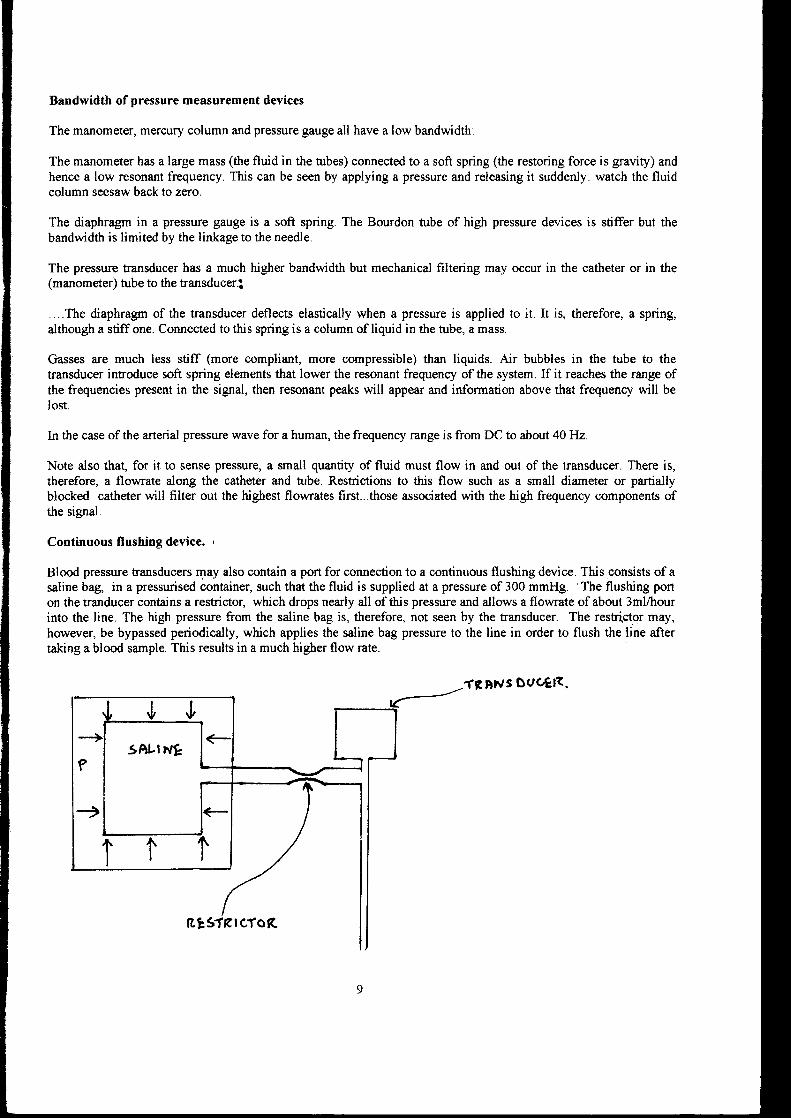
Bandwidth of pressure measurement devices
The manometer, mercury column and pressure gauge all have a low bandwidth:
The manometer has a large mass (the fluid in the tubes) connect€d to a soft spring (the restoring force is gravity) andhence a low resonant frequency. This can be seen by applying a pressure and releasing it suddenly: watch the fluidcolumn seesaw back to zero.
The diaphragm in a pressure gauge is a soft spring. The Bourdon tube of high pressure devices is stiffer but thebandwidth is limited by the linkage to the needle.
The pressure transducer has a much higher bandwidth but mechanical filtering may occur in the catheter or in the(manometer) tube to the transduceri
. ..The diaphragm of the transducer deflects elastically when a pressure is applied to it. It is, therefore, a spring,although a stiff one. Connected to this spring is a column of liquid in the tube, a mass.
Gasses are much less stiff (more compliant, more compressible) than liquids. Air bubbles in the tube to thetransducer introduce soft spring elements that lower the resonant frequency of the system. If it reaches the range ofthe frequencies present in the signal, then resonant peaks will appear and information above that frequency will belost.
ln the case of the arterial pressure wave for a human, the frequency range is from DC to about 40Hz'
Note also thag for it to sense pressure, a small quantity of fluid must flow in and out of the transducer. There is,therefore, a flowrate along the catheter and tube. Restrictions to this flow such as a small diameter or partiallyblocked catheter will filter out the highest flowrates first...those associated with the high frequency components ofthe signal.
Continuous flushing device. ,
Blood pressure transducers may also contain a port for connection to a continuous flushing devicc. This consists of asaline bag, in a pressurised container, such that the fluid is supplied at a pressure of 300 mmHg. 'The flushing porton the tranducer contains a restrictor, which drops nearly all of this pressure and allows a flowrate of about 3ml/hourinto the line. The high pressure from the saline bag is, therefore, not seen by the transducer. The restrictor may,however, be bypassed periodically, which applies the saline bag pressure to the line in order to flush the line aftertaking a blood sample. This results in a much higher flow rate.
fßDh/s ouc,gß.
ßtslErcfoß