Embed Size (px)
Citation preview
Contributors:
Marisa Jacott, Fronteras Comunes
Cyrus Reed, Texas Center for Policy Studies Mark Winfield, The Pembina Institute for Appropriate Development
July of 2004
44 East Avenue, Suite 306 * Austin Texas 78701
512.474.0811 phone 512.474.7846 fax
[email protected] * www.texascenter.org
The Generation and Management of Hazardous Wastes and Transboundary Hazardous Waste Shipments between Mexico, Canada and the United States Since NAFTA:
A 2004 Update

The Generation and Management of Hazardous Wastes and Transboundary Hazardous Waste Shipments between Mexico, Canada and the United States Since NAFTA: A 2004 Update
ii
Table of Contents
Executive Summary
iii
I. Introduction
1
II. Connection to NAFTA
3
III. Changes in U.S. Generation, Management and Waste Shipments since 1997
8
IV. Changes in Mexican Generation, Management and Waste Shipments Since 2000
39
V. Assessment/Explanation: Possible explanations of the Shifts in the US-Mexico Waste Traffic
77
VI. Changes in Canadian Generation, Management and Waste Shipments Since 2000
84
VII. Assessment/Explanation: Possible explanations of the Shifts in the US-Canadian Waste Traffic
93
VIII. Conclusions and Recommendations
105
Note: An initial version of this report was presented at the Symposium on Understanding the Linkages between Trade and Environment sponsored by the North American Commission for Environmental Cooperation (CEC) in Washington, D.C. on October 11th, 2000 and then published in 2001. In 2003, the CEC provided a grant to update the original study. The authors would like to thank the CEC for providing a grant to assist in the preparation of this updated version of the report. The views contained herein, however, do not necessarily reflect the views of the CEC, or the governments of Canada, Mexico or the United States of America. Acknowledgements: In addition to the main authors, both J. Scott McClain of Austin, Texas and James Marks of Toronto, Ontario contributed in the research and writing of the report. We would also like to cite our appreciate of both Dr. Chantal Line Carpentier and Timothy Whitehouse of the North American Commission for Environmental Cooperation for overseeing the update of the report and for their helpful comments throughout. Finally, during the course of the research, numerous government officials in all three countries provided information that was requested by the authors. This information is cited in the footnotes and tables of the report.

The Generation and Management of Hazardous Wastes and Transboundary Hazardous Waste Shipments between Mexico, Canada and the United States Since NAFTA: A 2004 Update
iii
EXECUTIVE SUMMARY Building on a previous report published in 2001, this report reviews and updates information on the generation, management and shipments of industrial hazardous wastes – as well as policy and regulatory developments -- in Mexico, Canada and the U.S. It accomplishes this task in three basic steps. First, changes introduced through NAFTA and its institutions are described, including those that have occurred in the last three years. Second, the changes with respect to government policies, disposal capacity, waste generation and disposal and transboundary traffic since 1999 are outlined in the U.S., then Mexico, and then Canada. Third, possible explanations for these changes, including changes in waste generation patterns, disposal site availability, general economic conditions, policy and regulatory changes and changes in the commercial hazardous waste industry iself, are reviewed and assess. A conclusion and summary follow.
The report finds that NAFTA and its institutions have continued to play a part in issues related to industrial hazardous wastes. For example, several waste management companies have utilized the investor-state dispute process contained within Chapter 11 of NAFTA to seek redress for actions which they argue are tantamount to expropriation. Most recently, the Spanish company TECMED successfully won a tribunal against the Mexican government for failing to renew an operating permit. For this “expropriation,” the tribunal awarded the company $6 million. The action represents the second time that foreign companies have used the enforcement and regulatory actions by Mexican environmental authorities in denying a permit to a hazardous waste landfill to seek redress.
Similarly, citizens – particularly in Mexico and Canada – have continued to file citizen complaint for failure to effectively enforce their environmental regulations. In the last few years, three complaints – two in Mexico and one in Canada – have been filed for failure to enforce hazardous waste regulations. Finally, in 2001, the North American Commission for Environmental Cooperation identified regulatory differences between the three countries on hazardous waste tracking and disposal standards as worthy of both further study and action. In 2003, the CEC Ministerial Statement reconfirmed this commitment and adopted a specific resolution on proper disposal, management and tracking of hazardous wastes, directing the CEC Secretariat to identify priority wastes and improve tracking among other matters.
The 2004 decision by the U.S. Supreme Court to allow Mexican trucks to enter the U.S. past the 20-mile commercial zone – as required by NAFTA – could potentially allow Mexican trucks carrying hazardous wastes and products to operate throughout the U.S., though the actual impact of this rule is still probably several years away.
In terms of generation, the report finds that incomplete data in Mexico and Canada complicate the ability to assess trends in the generation of hazardous waste since NAFTA went into effect. Even in the U.S. – with a well-established hazardous waste generation data system – there are potential problems with underreporting. Still, the data in the U.S. suggests that hazardous waste generation among industrial manufacturing plants has not changed significantly between 1993 and 2001, the last year for which data is available. In 2001, manufacturing plants generated slightly more than 37 million metric tons (40.8 million short tons).
Information in Mexico on hazardous waste generation is still incomplete. While a 1994 study estimated that manufacturing plants generated some 8 million metric tons, in 2000, some 27,200 plants reported generating 3.7 million metric tons. However, Mexican environmental officials continue to believe the actual universe of hazardous waste generated in Mexico is significantly higher. Belying that fact, recent information available on a state basis showed that just seven

The Generation and Management of Hazardous Wastes and Transboundary Hazardous Waste Shipments between Mexico, Canada and the United States Since NAFTA: A 2004 Update
iv
states reported some 2.8 million metric tons of hazardous waste generated in 2003. In Canada, only Ontario has recently approved requirements for generators to report annual generation of hazardous wastes, but no totals have yet been made available. Estimates for the country range from two to five million metric tons per year.
Table A. Generation of Hazardous Wastes ( million metric tons) in three NAFTA countries
2000 2001 2003
Canada NR, estimate of 2-5 million tons
NR, estimate of 2-5 million tons
NR, estimate of 2-5 million tons
U.S. NR 37.0 Not currently available
Mexico 3.71 NR 2.85 (only seven states reporting)
Where does the waste go? In the U.S., an increasing amount of the waste generated was apparently being sent off-site. For example, treatment of hazardous wastes off-site increased from 6.0 million tons to 6.8 million metric tons between 1993 and 2001. Interestingly, the waste was going to fewer facilities as consolidation occurred in the commercial hazardous waste management industry. In 2001, more waste was reported flowing to a fewer number of landfills, incinerators, and hazardous waste-burning cement kilns. Consolidation, opposition to particular facilities and tighter air and waste regulations all appear to be factors in this trend.
Unfortunately, while Mexican data shows a clear trend in an increase in the number of facilities authorized to treat hazardous wastes – including incinerators, cement kilns, metal, battery and solvent recyclers – but not interestingly landfills – there is no public information on the amount of waste actually received by these facilities. In Canada, like the U.S., the consolidation of the waste commercial industry has led to a relatively few facilities accounting for the bulk of treatment. These facilities are concentrated in the provinces of Ontario and Quebec and include energy and metal recyclers as well as disposal units.
Imports and exports of hazardous wastes between the three countries have varied since NAFTA. Again, however, differences in data between the three countries and gaps make comparisons difficult. Interestingly, while hazardous waste generation and treatment data in the U.S. is better than in Canada and Mexico, information about imports and exports is significantly better in Canada and Mexico than in the U.S.
Based upon Canadian government information, exports of hazardous wastes from Canada to the U.S. have risen steadily since NAFTA. Most exports came from Ontario and most went to metal recycling facilities in the U.S. Total exports from Canada neared 350,000 tons in 2002, an historic high. Waste flows from the U.S. to Canada, on the other hand, have been more erratic, though higher. There was a steep rise in imports, particularly for disposal between 1993 and 1999, and then a rapid drop in total imports from a 1999 peak. The decline has been in imports for both disposal and recycling, with imports for disposal down to 230,000 tonnes in 2002 from 394,000 tonnes in 1999, a 42% decrease. Imports for recycling peaked in 1998, and then fell off, although not as dramatically as has been the case with imports of wastes for disposal. Overall imports to Canada topped 400,000 tons in 2002.

The Generation and Management of Hazardous Wastes and Transboundary Hazardous Waste Shipments between Mexico, Canada and the United States Since NAFTA: A 2004 Update
v
Waste flows from the U.S. to Mexico and vice-versa are difficult to assess. Based both upon U.S and Mexican data, it appears that the amount of one particular waste stream – K061 – electric arc furnace dust from the recycled steel industry – increased between 1993 and 1999 to a single Mexican receiver, Zinc Nacional in Monterrey, Mexico. U.S. data suggests there was a slight curtailment of exports of K061 in 2001, while Mexican data reports a continued increase. While U.S. data is silent about other exports, Mexican data suggests there has been an increase in different types of batteries – including lead acid batteries – being sent to Mexico. There is even less information on other types of wastes – including tires and electronic wastes –which are known to be flowing to Mexico.
Waste flows from Mexico to the U.S consist of two types. Under Mexican law and an agreement between the two countries, maquiladoras are required to return their wastes to the U.S. when the waste is generated by U.S. imports. “Return” waste from maquiladoras appears to be increasing, due both to better compliance and an improved reporting system in Mexico. This increase is also reflected in data in HAZTRAKS, a U.S. hazardous waste data tracking which was discontinued in 2003. It is important to note, however, that Mexican data shows much higher rates of export than HAZTRAKS data did. The other type of waste is largely made up of oil drilling residue, apparently from gas and oil drilling activities in eastern Mexico. However, this data is not captured in U.S. systems, and reflects authorizations to export rather than the actual volume of waste exported. Thus, despite some improvements in data, this report could not come up with an accurate account of volumes exported between the three NAFTA countries. Still, with the exception of hazardous wastes from the U.S. to Canada – which have declined in the last few years – there appears to be a tendency for these volumes to increase. Given that some waste categories – such as electronic waste, tires and used batteries – are not captured by tracking systems, the total amount of hazardous wastes flowing between the countries is probably higher than indicated by Table B.
Table B. Hazardous Waste Flows Between NAFTA Countries, 2002 in Metric Tons
Exports to U.S. Exports to Canada Exports to Mexico Total NAFTA Exports
Canada 350,000 350,000 (2002)
U.S. (1) --- 248,500 (U.S. Data)
415,000 (Canadian Data)
130,000 (U.S. Data)
325,000 (Mexican data)
378,500 (U.S. Data)
740,000 (Mexican and
Canadian Data)
Mexico 864,000 (2002)
111,000 Return Wastes from
Maquilas (2002)
0 ---- 975,000 (2002)
Note: (1) Because of differences in reporting requirements and definitions of hazardous wastes, the U.S., Canada and Mexico provide different numbers in terms of U.S. exports of hazardous wastes to the other NAFTA countries.
This report also analyzed the reasons for the likely increase in waste flows between the U.S. and Mexico as well as the apparent decline in waste flows from the U.S. to Canada. In terms of waste flows between the U.S. and Mexico, the increases of waste from the U.S. to Mexico is most related

The Generation and Management of Hazardous Wastes and Transboundary Hazardous Waste Shipments between Mexico, Canada and the United States Since NAFTA: A 2004 Update
vi
to the growing production of recycled steel in the U.S., improved tracking of the resulting waste, and the presence of a major recycler of those wastes in Mexico. In addition, while the data is limited, it appears that the presence of new recycling facilities in Mexico for both LAB and electronic waste may be attracting U.S. exports.
The growth in authorizations of exports from the Mexico to the U.S. are related on the one hand to better reporting and compliance by maquiladoras with waste return provisions in Mexican law, and to the other, new drilling operations in eastern Mexico and the need to properly treat oil drilling residues.
In our 2001 report, the principle and potentially disturbing finding was the dramatic growth in US waste exports to Ontario and Quebec and, in the context of a weakened regulatory environment, a significant increase in disposal capacity in those provinces. This report, however, found that US waste exports overall to Canada declined in the 1999 to 2003 period, while imports of materials for recycling from Canada actually increased substantially.
The decline is likely the result of financial and management problems with the key importers of waste into Canada – Safety Kleen and Philips Environmental Services -- rather than a reflection of the implementation of stricter regulations in Canada – which to a limited degree has occurred at the provincial level in Ontario and Quebec. With the sale in 2002 of much of Safety Kleen’s operations to Clean Harbors Inc, it remains to be seen to what extent U.S. exports to Canada will continue to decline. The regulatory ‘gap’ that was identified as a key factor in the dramatic rise in imports to Canada for disposal remains, particularly with respect to land disposal in Ontario. Imports may increase again as the economic situation of importers improves, or new entrants arrive in the market, although the province’s new government has committed to impose land disposal restrictions along the lines of those in place in the United States. In the context of the moderate strengthening of the provincial regulatory and approval regimes with respect to hazardous waste disposal in Ontario and Quebec since 2000, there is evidence that proponents of new disposal facilities are shifting their proposals to other provinces with weaker approval requirements. The recent transfer of a proposed thermal treatment facility for contaminated soils from Ontario to New Brunswick may be an example of this trend. This reinforces the need for a strong federal regulatory backstop to ensure that new pollution havens do not emerge, as standards are strengthened in locations that have been traditional receivers of waste imports. The most important finding of this report continues to be the major data gaps in tracking the generation, management and shipments of hazardous wastes both within and among the three NAFTA countries. Specific concerns include:
Both Mexico and Canada appear to be still years away from having an accurate count of hazardous waste generated on a facility by facility basis, making it difficult to plan for needed infrastructure and help promote pollution prevention. However, Mexico now has more comprehensive national data on waste generation and waste disposal facilities than does Canada
After approval of an obligatory and publicly accessible PRTR in Mexico in 2001, with significant support from the CEC, Mexico finally approved the actual regulations implementing such an information system in 2004; the actual standards detailing the mechanism of the annual operating permit as well as which chemicals will be reported could take up to two years to develop however;
The Generation and Management of Hazardous Wastes and Transboundary Hazardous Waste Shipments between Mexico, Canada and the United States Since NAFTA: A 2004 Update
vii
While information on imports and exports of hazardous wastes from Mexico appears to have improved over the last three years, there continues to be a disconnect between what is actually “authorized” for import and export and what actually crosses the border;
While the U.S. EPA has some good information on import and export notices, these notices do not actually provide information on volumes or types of waste, at least in a pubicly-accessible form. Recent efforts to summarize annual export data submitted by primary exporters should be applauded and continued at the federal level.
While there is information in Mexico about facilities authorized to treat or manage hazardous wastes, there is little information about the amount of waste actually treated by these facilities;
While the U.S. has for several years required reporting of the generation of hazardous wastes, there appear to be significant gaps in the information, and budget cuts have prevented the most recent disaggregated data from being queried on-line;
Exemptions from reporting in U.S. law – under RCRA – for some types of recycling – including Lead Acid Batteries and some electronic waste -- as well as current proposals to make CRT monitors a “Universal” waste have led to a lack of manifest and/or export data on these wastes. These gaps are particularly worrisome given past problems with lead smelters in Mexico importing U.S. waste as well as with the well-evidenced problems of electronic wastes exported to China and other Asian countries;
The October 2003 U.S. EPA proposal to change the definition of solid waste, allowing secondary hazardous materials that are generated and managed in a continous process within the same industry to be excluded from RCRA hazardous waste requirements, could lead to problems in tracking off-site transport of hazardous wastes, particularly across borders.
While the U.S. EPA made some efforts to create a hazardous tracking system on its Southern Border, in 2003 funding was pulled from the HAZTRAKS database project, leaving the U.S. with no specific plan to track hazardous wastes imported from Mexico.
Because scrap and used tires have been put on and off a “subject to control” list in Mexico, it is likely that thousands of tons of tires are flowing to Mexico, either for illegal dumping or burning in cement kilns, but the exact amount is unknown. Recent proposals to allow for even more imports for the purpose of burning them in cement kilns is worrisome.
Finally, the present report continues to find a worrisome trend of spotty and declining enforcement at TSDs, particularly in the southern U.S.. Another worrisome trend along the southern U.S. border – with the possible exception of California -- is the lack of an inspection and enforcement presence focused at the Ports of Entry. Despite millions of trucks that enter the U.S., and in some cases, trains, there is no national, funded effort to inspect and enforce RCRA provisions on manifesting, labeling and shipping hazardous wastes. Given the recent Supreme Court decision to allow Mexican trucks to enter the U.S. under NAFTA, proper inspection and enforcement of RCRA provisions is even more imperative.
The report does make some basic recommendations for both the governments and the CEC. These include:
In light of the recent Chapter 11 decisions regarding S.D.Myers, Metalclad and TECMED which we believe ultimately undermine the right of Parties to enforce their own environmental standards rules, the three Parties must again revisit NAFTA's

The Generation and Management of Hazardous Wastes and Transboundary Hazardous Waste Shipments between Mexico, Canada and the United States Since NAFTA: A 2004 Update
viii
Chapter 11 provisions. Appropriate changes must be made to safeguard the ability of Parties to set and maintain environmental standards and make environmental policy decisions which they regarding as necessary to protect the health and environment of their citizens.
Through the CEC, the three parties should reopen negotiations on transboundary environmental impact assessments, as mandated by NAFTA.
The CEC should promote the interchange of successful experiences in North America of industries which have committed to and achieved source reduction and pollution prevention.
The CEC should facilitate the interchange and cooperation among governments, institutes, academics and industry of information and technologies which promote pollution prevention and the development and use of cleaner technologies.
The difficulty in tracking hazardous wastes across borders is a serious concern. All three countries should work to improve reporting and tracking of hazardous waste generation and disposal and strengthen the compatibility of their hazardous waste tracking systems. The 2003 decision by the Council to look into coordinating and improving these systems should continue.
The CEC should make a specific focus on electronic wastes, particularly as countries develop take-back legislation. The NAFTA countries – through the CEC – should assure that electronic wastes can be tracked to assure that exports from one country to another, or indeed outside the region, are being properly handled.
All three countries should agree on a system of common unique identifiers for facilities receiving transfers of PRTR listed substances in their national PRTR systems. This would facilitate the detailed analysis of transboundary transfers of PRTR substances.
Mexico should finalize its standards governing its obligatory Pollutant Release and Transfer Registry -- known in Mexico as the RETC -- particularly those parts detailing both toxic releases and hazardous waste generation. As part of this effort, Mexico should conduct and make publicly accessible a complete inventory of the types and volumes of hazardous wastes generated and treated in the country. This knowledge should help Mexico develop a true policy of source reduction and the promotion of clean technologies.
Mexican government officials must respect the right to environmental information and recognize the right to know the volumes, types and management of the waste generated by the industrial sector.
Mexico should conduct a full needs assessment of hazardous waste management capacity and shortages, including opportunities for source reduction and reuse. The recently published draft regulations for its new hazardous waste law call for a basic diagnostic of waste which could serve as a model for this assessment. The CEC could play a role in coordinating this effort.
Mexico should issue a definitive ruling that incineration and use of hazardous wastes as a fuel in cement kilns and other industrial furnaces is a disposal technology and therefore importation of hazardous wastes to such facilities is not permitted under Mexican law. This ban should include wastes “subject to control” such as scrap tires.

The Generation and Management of Hazardous Wastes and Transboundary Hazardous Waste Shipments between Mexico, Canada and the United States Since NAFTA: A 2004 Update
ix
Mexico should amend its proposed regulations to the new hazardous waste law (LGPYGIR) to make sure that facilities proposing to co-process hazardous wastes as fuels – such as cement kilns – require the same authorization process – including risk assessments -- as other managers of hazardous waste, such as incinerators, rather than giving a blanket approval to such practices. This should include both liquid hazardous wastes and solid waste such as used scrap tires.
Mexico should reactivate and expand its SIRREP (Sistema de Rastreo de Residuos Peligrosos) which will allow it to know, inform and control the quantities and types of wastes moving across its borders. Providing information only on the number of authorizations or movements does not assure compliance with environmental legislation nor with integrated waste management methods.
Mexico should incorporate notice requirements and public participation mechanisms for residents who could be impacted by new hazardous waste management facilities seeking permits or authorizations to operate into its new regulations for the hazardous waste law;
Canada needs to establish regular national waste generation and disposal reporting requirements for hazardous waste generators, as well as a system to make the resulting information publicly available and accessible.
Canada should adopt standards for "environmentally sound disposal" of hazardous wastes, as per its obligations under the Basel Convention. These standards should be at least comparable to the U.S. RCRA standards for land disposal, and the RCRA/Clean Air Act MACT standards for hazardous waste incinerators and other facilities burning hazardous wastes as ‘fuel.’ Canada should incorporate “derived from” and “mixing” rules into its definitions of hazardous wastes within the Export/Import of Hazardous Waste Regulations made under the Canadian Environmental Protection Act 1999.
The U.S. should rescind or ammend RCRA regulations which exclude used batteries from export notification requirements to accurately track exports from the U.S. to Mexico and other countries.
The U.S. should put both its proposal to change the definition of Solid Waste – designed to reduce regulations for hazardous waste being recycled – on hold, particularly until a better system to track wastes across borders is put in place.
The U.S. should increase resources to border states to adequately inspect Ports of Entry for compliance with hazardous waste handling, transport and reporting requirements and increase cooperation between U.S. Customs and state, local and federal environmental authorities to track hazardous waste in a timely manner.
The U.S. must come up with an alternative to HAZTRAKS, which was canceled in 2003. If HAZTRAKS was a less than stellar system for tracking hazardous wastes, its absence only makes it apparent that the U.S. does not have a timely, complete system to track its imports and exports of hazardous and other potentially dangerous solid wastes.

I. Introduction/Context The generation and management of hazardous wastes in the NAFTA-party countries has been a major concern for decades. This paper updates information previously presented by the authors at the Symposium on Understanding the Linkages between Trade and Environment sponsored by the North American Commission for Environmental Cooperation (CEC) in Washington, D.C. on October 11th, 2000 and then published by the CEC in 2001. It specifically updates information about transboundary shipments of industrial hazardous waste between the NAFTA countries and about the commercial hazardous waste management "sector" of the North American economy.1 That paper focused on two major hypotheses, often referred to as the "pollution haven" and "race-to-the bottom" hypothesis:
• Is trade and investment liberalization concentrating economic activity (in both manufacturing and the hazardous waste management industry) in areas where it takes place more efficiently, or conversely, where ecological stress is already acute such as the U.S. - Mexico border region and the U.S. Canada-Border Region?
• Are companies in the manufacturing or hazardous waste management sectors relocating or are they sending hazardous wastes to other areas to take advantage of less stringent hazardous waste regulations or enforcement?
Based on available data from 1990 to 1999, the previous paper found an ongoing concentration of economic activity, including hazardous waste generation and management in the US-Mexico Border region. In the Canada-U.S. border region, waste generation in Ontario and Quebec were also increasing significantly, particularly in the steel and chemical industries, which are concentrated in the border region, although waste generation in states such as Michigan, Pennsylvania and Wisconsin declined between 1993 and 1997. In addition, despite the decline in waste generation among the US border states, there was a dramatic growth in US waste exports to Ontario and Quebec and, in the context of a weakened regulatory environment, a significant increase in disposal capacity in those provinces.
Differences in regulatory requirements related to hazardous waste disposal, specifically the existence of less stringent standards in Ontario and Quebec were identifies as the key factor in the increase in US hazardous waste exports to Canada. Similarly, the expansion of disposal capacity in these provinces is in part intended to serve the US market, although the bulk of the investments in this capacity is Canadian in origin. The report also found that the ban on imports of hazardous wastes for final disposal into Mexico limited the economic incentive for the establishment of disposal capacity to deal with imported wastes to take advantage of differences in the regulatory and enforcement regime between Mexico and the US. However, the report found significant US investment through joint ventures in Mexican capacity for the treatment, incineration and disposal of domestically generated wastes, with the market for these services being driven by stronger disposal requirements in Mexico in some cases, as well as “temporary” authorizations without publicly-approved standards in others. In addition, hazardous waste exports of electric arc furnace dust from the U.S. to Mexico have increased due to both price differentials and sectoral changes in the US that have increased the volume of this particular waste stream.
1 This paper looks only at the generation, management and shipment of industrial hazardous wastes and does not consider to any great extent other hazardous wastes, such as those generated in mining, petroleum exploration, agriculture, silviculture and – except to some extent in Mexico – medical wastes. Hazardous wastes are defined differently in all three countries, although there is significant overlap.

The Generation and Management of Hazardous Wastes and Transboundary Hazardous Waste Shipments between Mexico, Canada and the United States Since NAFTA: A 2004 Update
2
The report also confirmed significant gaps existed in the systems for tracking hazardous waste generation and disposal in all three countries. Reliable data on waste generation in Canada and Mexico is extremely limited, and the reliability of the data regarding transboundary waste movements among the three countries has been seriously questioned. Tracking of transboundary waste movements from “cradle to grave” when the “cradle” is in one country and the “grave” in another is almost impossible. The present paper updates and reviews trends in hazardous waste generation and management in all three countries, as well as regulatory and policy developments and information about waste shipments across boundaries. It accomplishes this task in three basic steps. First, changes introduced through NAFTA and its institutions are described, including those that have occurred in the last three years. Second, the changes with respect to government policies, disposal capacity, waste generation and disposal and transboundary traffic since 1999 are outlined in the U.S., then Mexico, and then Canada. Third, possible explanations for these changes, including changes in waste generation patterns, disposal site availability, general economic conditions, policy and regulatory changes and changes in the commercial hazardous waste industry iself, are reviewed and assessed for both the U.S. – Mexico border and U.S. – Canada border areas. A conclusion and summary –including recommendations -- follow.

The Generation and Management of Hazardous Wastes and Transboundary Hazardous Waste Shipments between Mexico, Canada and the United States Since NAFTA: A 2004 Update
3
II.Connection to NAFTA
A. NAFTA Rule Changes
1. General Provisions of NAFTA Chapter 3 of the NAFTA sets out requirements for the “national treatment” of goods. Article 309 specifically provides:
“1.Except as otherwise provided in this agreement, no party may adopt or maintain any prohibition or restriction on the importation of any good of another Party -- except in accordance with Art. XI of the GATT.”
Article 415 of the NAFTA defines good to include “waste and scrap derived from (I) production in the territory of one or more of the Parties.” Therefore hazardous wastes are likely to be considered a good for the purposes of the Agreement, and the right of Parties to prohibit or restrict their import -- or for that matter their export -- may therefore be limited. Article XI of the GATT permits countries to impose restrictions or bans on imports of goods, via article XX, where such measures are “necessary to protect human, animal or plant life or health.” The term “necessary” has been interpreted to mean that the country maintaining the ban must show: (1) there is no reasonable available alternative measure consistent with the GATT to achieve the desired end and (2) the measure taken is the least trade restrictive measure available. Thus, by incorporating Article XI, NAFTA allows countries to ban or restrict exports and imports of hazardous wastes only to the extent that they can show there is no alternative and that it is the least restrictive trade measure. 2. Hazardous Waste and NAFTA NAFTA declares that major multilateral conventions on hazardous waste disposal, as well as bilateral agreement on hazardous waste shipments and disposal take precedence over NAFTA itself. Specifically, Article 104 provides that:
In the event of any inconsistency between this agreement (NAFTA) and the specific trade obligations set out in: (c) the Basel Convention on the Transboundary Movement of Hazardous Wastes, on its entry into force for Canada, Mexico and the US, such obligations shall prevail to the extent of the inconsistency, provided that where a party has a choice among equally effective and reasonably available means of complying with such obligations, the Party choose the alternative that is least inconsistent with the other provisions of (NAFTA). (d) the agreements set out in Annex 104.1 (these are the 1986 U.S. Canada Agreement on Transboundary Movement of Hazardous Waste and the 1983 U.S.-Mexico Agreement on Cooperation for the Protection and Improvement of the Environment in the Border Area (the La Paz Agreement )
The Basel Convention, which has been in existence since 1989, together with the Basel Ban Amendment, adopted in 1995, is ultimately intended to prevent hazardous wastes from being
The Generation and Management of Hazardous Wastes and Transboundary Hazardous Waste Shipments between Mexico, Canada and the United States Since NAFTA: A 2004 Update
4
exported from developed OECD countries to developing countries.2 Article 4 of the Basel convention permits countries to ban or restrict imports of hazardous waste if they have reason to believe that the wastes will not be managed in an “environmentally sound manner.” While both Canada and Mexico have ratified the Basel convention, the U.S. still has not, making the two binational agreements currently more relevant to NAFTA. (In any case, since Mexico is now considered an OECD country, the Basel Convention would not prohibit such exports from the U.S. or Canada). Both of these agreements establish the mechanisms for imports and exports between the countries. Of particular importance is Annex III of the La Paz agreement, which states that as long as applicable hazardous waste regulations are met, either country must accept the return of hazardous waste generated by production from raw materials that were imported under a temporary import regime. In practice, this requirement, along with Mexican regulations adopted under the LGEEPA, has meant that most maquiladoras and other importing raw materials are required to send their hazardous wastes back to the U.S. More recently, however, changes in the new “General Waste Law” in Mexico allow wastes generated by maquiladoras which can be recycled to be managed in-country, though other wastes must be repatriated.3 In addition, while NAFTA does not address the maquiladora program wholesale, several provisions of NAFTA do change some unique features that have fostered their export orientation. On the one hand, under Article 303, NAFTA continues to allow the duty drawback (repayment of the in-bond) on NAFTA-originating inputs to the extent tariffs still remain, while phasing out requirements on the % of sales which must be exported outside of Mexico and other export performance requirements on January 1, 2001 (NAFTA, Article 304). These changes lessen the advantages between being a maquiladora and being a national Mexican company. Some have suggested that maquiladoras might increasingly choose to nationalize, at least partly to escape the repatriation of hazardous waste required under the La Paz Agreement. However, the recent changes in the General Waste Law may lessen this incentive as well.
Other articles of NAFTA may also impact management of hazardous wastes and shipments between the three parties. Article 1114(2) of the NAFTA declares that Parties should not waive or relax environmental measures in an attempt to attract foreign investment. Article 1110, on the other hand, states that no Party may directly or indirectly nationalize or expropriate an investment of an investor in another Party in its territory or take a measure tantamount to nationalization or expropriation of such an investment without compensation. The article allows companies which believe such an measure to have taken place to initiate a "Chapter 11" case against the government through the World Bank's International Center for the Settlement of Investment Disputes.
In recent years, measures intended to restrict the import or export of substances believed to be harmful to human health or to deny operating permits to landfills believed to be violating environmental laws have been challenged under these Chapter 11 provisions. Examples of such actions include:
2 This decision was passed by a consensus of the 82 Parties present at the Third Conference of Parties of the Basel Convention on 22 September 1995. The decision established an amendment to the Convention to establish a new Article 4A. The article obligates Parties that are listed on Annex VII (country members of the OECD, EU and Liechtenstein) to ban exports of hazardous wastes to all countries not listed on Annex VII. The ban would take place immediately for final disposal, and for those wastes bound for recycling destinations, the ban would take effect on 31 December 1997. Basel Action Network, International Toxics Progress Report Card, October 19, 2003 (Available at www.ban.org/country_status/report_card.htm). 3 Ley General para la Prevención y Gestión Integral de los Residuos, art. 94, as reported in Maddie Kadas, “Mexico Adopts New Omnibus Waste Law with Producer Responsibility Requirements,” Texas Environmental Law Justice (Vol. 34), Winter 2003-04, p. 136.

The Generation and Management of Hazardous Wastes and Transboundary Hazardous Waste Shipments between Mexico, Canada and the United States Since NAFTA: A 2004 Update
5
• Ethyl Corporation’s challenge of Canada’s ban on the import and interprovincial trade in MMT;
• Methanex Corporation, a Canadian Company, filing a $970 million claim for California’s ban of imports of a gasoline additive (MBTE),
• the claim recently won by Metalclad in August of 2000 that Mexico violated its investor rights by not allowing it to open a hazardous waste landfill in the state of San Luis Potosí. Mexico agreed to pay more than $16 million in damages to the company.
• the claim recently won by S.D. Myers, an Ohio company, in November 2000 for damages related to lost business when Canada banned the export of PCB waste from November 1995 to February 1997 in an attempt to meet obligations under the Basel Convention. Canada later reversed its decision on PCB exports.
• The claim recently won in May of 2003 by the Spanish company TECMED, which filed a claim under Chapter 11 that the closing of its hazardous waste landfill near Hermosillo, Sonora (known as Cytrar) violated its investor rights. The tribunal ordered the Mexican government to pay the Spanish company $5.533 million plus interest for the value of the property of the landfill plus some compensation for the loss in benefit of the two open hazardous waste cells.4
Finally, under Annex I of the North American Free Trade Agreement, Mexico was to allow U.S. cross-border trucking into Mexican border states by 1997 and throughout Mexico by 2000, while the U.S. was to allow Mexico cross-border trucking services to or from border states by 1997 and to or from all U.S. states by 2000.5 Nonetheless, the U.S. administration continued to impose a moratorium on Mexican trucks entering the U.S. past a 20-mile commercial zone. The Government of Mexico challenged the U.S.’s implementation of NAFTAs motor carrier provisions under the NAFTA dispute-resolution process. In 2001, an international arbitration panel ruled that the U.S. was breaching their obligations under NAFTA. In response, the Federal Motor Carrier Safety Administration – a division of the U.S. Department of Transportation -- began rule-making to allow Mexican trucks to enter the U.S. After Congress modified these rules in December of 2001 – essentially preventing the FMSCA from proceeding until additional steps were taken -- the FMCSA issued a Finding of No Significant Impact in its Environmental Assessment of its modified rules. However, the EA only considered the impacts of the safety inspections themselves, not the possible environmental impact due to increased traffic of Mexican trucks. President Bush lifted the moratorium on Mexican trucks in November of 2002. In the meantime, a number of labor and environmental organizations – including Public Citizen and the Teamster’s Union -- successfully filed petitions for judicial review before the Ninth Circuit Court of Appeals in California of the FMSCA’s actions, arguing that the regulations violated both the Clean Air Act and the National Environmental Protection Act since the EA did not consider all the environmental impacts of the rules and their implementation. The administration and Department of Transportation then petitioned the U.S. Supreme Court to review the case. In 2004, the Supreme Court6 found in favor of the administration, maintaining that because the FMCSA itself is charged with enforcing motor carrier safety – not air quality standards – they have no obligation to ensure compliance with the CAA, and they can not prevent a Mexican truck
4 Award of the Tribunal, May 29, 2003, Técnicas Medioambientales Tecmed, S.A. v. United Mexican States (ICSID Case No. ARB(AF)/00/2) 5 North American Free Trade Agreement, Annex I, I-U-16 and I-M-69, Cross-Border Services. 6 Supreme Court of the United States, 541 U.S. No. 03-358, Department of Transportation et. Al., Petitioners, v Public Citizen et al., June 7, 2004.

The Generation and Management of Hazardous Wastes and Transboundary Hazardous Waste Shipments between Mexico, Canada and the United States Since NAFTA: A 2004 Update
6
from entering the U.S. as long as the President has lifted the moratorium (providing the trucks meets their safety regulations and are properly registered). In essence, the Supreme Court found that the FMSCA is not required to consider the larger air quality impacts of the entry of Mexican trucks – but only the air quality impacts caused by the regulations themselves- and therefore is not required to do a larger Environmental Impact Study or to make sure that the entry of Mexican trucks would not cause border states to violate their State Implimentation Plans under the Clean Air Act. Environmental organizations are still pushing the Administration to complete a $1.8 EIS, since it is in fact the lifting of the moratorium which ultimately could cause environmental impacts not the FMSCA rules. While the lawsuits and challenges have focused almost exclusively on air quality impacts, because potentially some of these trucks could carry hazardous materials and wastes, the entry of Mexican trucks could spur an increase in hazardous waste transhipments. Nonetheless, it will probably be several years before the full impact of the lifting of the moratorium and the Supreme Court decision can be assessed in terms of its impact on hazardous waste shipments and management. 3. The North American Agreement for Environmental Cooperation The North American Agreement for Environmental Cooperation (NAAEC), sometimes referred to as the Environmental Side-Agreement to the NAFTA, came into effect at the same time of the NAFTA. Articles 5,6,7, 10(4), 12 (2) collectively impose obligations on parties to effectively enforce laws; to pursue avenues of cooperation to this end; to effect specified private enforcement rights and opportunities; and to provide an annual public report on the enforcement of environmental laws. Article 10 (7) calls for the parties to agree upon a mechanism for a Transboundary Environmental Impact Assessment for certain types of projects. To date, the parties have not been able to agre upon a framework or mechanism. The Agreement also provided for the creation of the North American Commission for Environmental Cooperation (CEC). Articles 14 and 15 of the NAAEC establish a mechanism through which any resident of a NAFTA country may file a submission that assert that a NAFTA country “is failing to effectively enforce its environmental law.” To date, five cases directly related to hazardous waste mismanagement have been brought forward under the Article 14/15 process, while several others have some relation to hazardous waste management. The cases include: Metales y Derivados. A
“factual record” was prepared in 2001 by the CEC on this lead acid battery smelter abandoned by its owner in Mexico even before NAFTA was approved.
MOLYMEX II – The CEC requested preparation of a factual record of this citizen submission in 2001, which concerns a factory making a hazardous product in the State of Sonora;
CYTRAR III – The Mexican government recently responded in November of 2003 to the citizen submission, which alleges that the operation of a hazardous waste landfill in Sonora involved failure by Mexican authorities to adequately enforce their environmental laws. Interestingly, in their response the Mexican government notes that because the Cytrar site was also the subject of a Chapter 11 investor-state dispute won by the Spanish-owners, they could not initiate clean-up until after payments were made to the company. Montreal Technoparc. In 2003, three Canadian and two U.S. NGOs allege that Canada has failed
to effectively enforce its laws by allowing an industrial and municipal waste landfill owned by the City of Montreal to continue to leach toxic wastes into the St. Lawrence River.7
Hazardous Waste in Arteaga. 8 In 2004, several individuals alleged that the Mexican federal authorities had failed to enforce regulations related to the proper management, transport and disposal of hazardous wastes and materials by a hazardous waste management company –
7 Information from the Commission for Environmental Cooperation, “Citizen Submissions on Enforcement Matters,” available at www.cec.org/citizen/submissions/details/. 8 Information from the Commission for Environmental Cooperation, SEM 04-001, available at http://www.cec.org/citizen/submissions/details/index.cfm?varlan=english&ID=96
The Generation and Management of Hazardous Wastes and Transboundary Hazardous Waste Shipments between Mexico, Canada and the United States Since NAFTA: A 2004 Update
7
Ecolimpio de Mexico -- and a transport company called Transportes J. Guadalupe Jimenez in the municipality of Saltillo, Coahuila. In February, the CEC Secretariat found that insufficient information was presented to allege the claim and asked for further information. After receiving further information in March of 2004, the CEC again found the submission did not meet all of the criteria required under Article 14. However, most recently, in May, the submitters again sent more information in the hopes of having the claim considered further.
B. NAFTA's Institutions related to Hazardous Wastes
1. North American Commission for Environmental Cooperation (CEC)
In 1995 the CEC’s law and policy program initiated an ongoing project for enhancing regional cooperation for improved tracking and enforcement of North American Laws regulating the transboundary movement of hazardous wastes and chloroflurocarbons (CFCs). A report published in 1999 under the auspices of the law and policy program concluded that the hazardous waste tracking systems in all three countries were deficient with respect to the quality, quantity and timing of information (CEC 1999: ix). The CEC has also begun an effort known as Sound Management of Chemicals program, which has led to North American Action Plans on Chlordane, PCBs, Mercury and DDTs, and environmental monitoring and assessment as well as draft plans on dioxin and furans and hexachlorobenzene. These efforts have appeared to focus attention on particular toxics and helped lead Mexico to phase out use of chlordane and DDT.9Finally, in 2001, the CEC Ministerial Statement called for the development of a compatible, North American approach for the environmentally sound management of hazardous wastes, including its tracking. In 2003, the CEC Ministerial Statement reconfirmed this commitment and adopted a specific resolution on proper disposal, management and tracking of hazardous wastes, directing the CEC Secretariat to identify priority wastes and improve tracking and convene a hazardous waste task force.10 Most recently, as part of this effort, the CEC published a draft report entitled Crossing the Border: Opportunities to Improve Tracking of Transboundary Hazardous Waste Shipments in North America (CEC: November 2003). 2. Land Transportation Standards Subcommittee and Transportation Consultative
Group The Land Transportation Standards Subcommittee (LTSS) is a subcommittee of the Committee on Standards-Related Measures and was expressly authorized by NAFTA under Article 913 (5) (a) (I) and Annex 913. The primary purpose of the LTSS is to make the Parties’ relevant standards-related measures on bus, truck and rail operations, including the transportation of dangerous goods, compatible. The three countries have substantially “ harmonized” regulations regarding hazardous materials transport although significant challenges remain. At their 2001 meeting, LTSS Working Group 5 (Dangerous Goods/Hazardous Materials Transportation) reported that Canada had adopted new Transportation of Dangerous Goods Regulations and Mexico had adopted six new Official Standards. Both the Canadian and Mexican standards were harmonized with the “11th edition of the UN recommendations.” Other indications of progress include the publication of several versions of the Emergency Response Guidebook for use in all three countries and further developments in Mexico in certifying and verifying containers and packages for hazardous material transport.11
9 CEC Ministerial Statement, Tenth Regular Session of the CEC Council, June 25, 2003. 10 CEC, Council Resolution 03-08, “Promoting the Environmentally Sound Management and Tracking of Hazardous Wastes Destined for Final Disposal and Hazardous Recyclable Materials and Wastes Destined for Recovery/Recycling Operations,”June 25, 2003. 11 Canada, Transport Canada, Report on 2001 NAFTA Plenary: LTSS 5, available at www.tc.gc.ca/pol/nafta-alena/plenaries/plenary-2001/ltss-5.htm.

The Generation and Management of Hazardous Wastes and Transboundary Hazardous Waste Shipments between Mexico, Canada and the United States Since NAFTA: A 2004 Update
8
III. Changes in U.S. Generation, Management and Waste Shipments since 1997 A. Hazardous waste generation and management in the United States: An Introduction and Overview Under the Resource Conservation and Recovery Act, hazardous waste generators of a certain size (so-called “Large Quantity Generators”) are required to summarize and report their hazardous waste generation to state and/or federal agencies, and every two years, the U.S. Environmental Protection Agency prepares a national report on hazardous waste known as the Biennial Report. According to this report, hazardous waste generation between 1995 and 2001 – when taking into account reporting requirement changes – has stayed relatively stable over the period. For example, when eliminating most wastewaters from consideration – since before 1997 most wastewaters containing hazardous elements were reported as hazardous waste – hazardous waste generation rose from approximately 32.9 million metric tons in 1995 to 37.0 million metric tons of hazardous waste in 2001 (See Table 1). However, even when eliminating wastewaters, direct comparisons between reporting years are difficult, given slight changes in both what is considered hazardous wastes as well as differing reporting requirements. For example, in 2001, EPA included some data from individual states that was previously excluded. In addition, a recent report highlighted the amount of missing data in the Biennial Reporting System, estimating that some 34 percent of hazardous waste generation goes unreported.12 Still, overall, it is safe to conclude that hazardous waste generation has not changed dramatically over the period, at least through 2001. Geographically, however, there has been a slight change, with a significant increase between 1999 and 2001 in the northern border states, and a decline in the State of Texas, which generates more waste than any other state due to its high concentration of refineries and chemical manufacturing plants. The other states along the U.S. –Mexico Border saw significant increases in their generation of hazardous waste. However, again care must be taken. In the case of New Mexico, for example, the quadrupaling of waste generation between 1999 and 2001 is due to new types of refinery waste being classified as hazardous for the first time in 2001 along with production increases at a single refinery rather than a “dirtier” industry locating in New Mexico (see Table 1). Similar changes impacted the reporting of hazardous wastes at one or two sites occurred in states such as North Dakota and New York.
12 Environmental Information Ltd., “Nearing 30 Years Since Passage of RCRA & About 1/3 of Hazardous Waste Generator’s Reports Missing From Biennial USEPA Surveys,” May 21, 2003, available at http://www.envirobiz.com/news/pr/052203.htm. According to the press release, their own survey of commercial hazardous waste facilities found underreporting in the 2001 BRS of 34 percent from these facilities due to missing generator and facility reports.

The Generation and Management of Hazardous Wastes and Transboundary Hazardous Waste Shipments between Mexico, Canada and the United States Since NAFTA: A 2004 Update
9
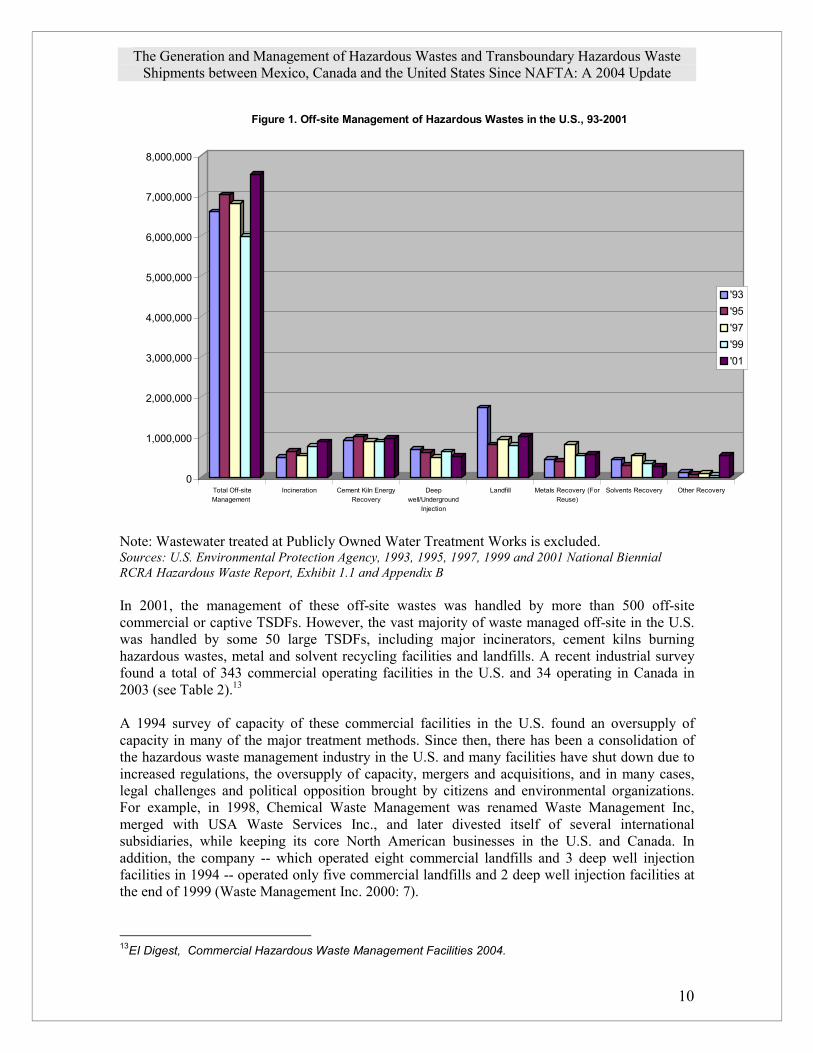
Table 1. Hazardous Waste Generation in Key U.S. States, 1995 through 2001 (metric tons) 1995 1997 1999 2001 Texas 15,610,024 17,212,389 13,538,393 6,854,147 California 703,690 610,487 387,642 732,368 New Mexico 6,692 90,241 216,416 873,445 Arizona 38,382 48,109 35,395 87,583 Mexico Border States (1) 16,358,788 17,961,226 14,177,846 8,547,543 New Hampshire 14,303 8,846 10,053 11,130 Idaho 462,381 920,634 772,708 194,509 Minnesota 181,653 387,722 51,322 1,508,315 Maine 4,872 4,316 3,968 5,596 North Dakota 3,301 2,437 2,427 521,281 Vermont 8,895 3,687 4,785 3,719 Michigan 658,204 901,785 1,256,791 588,951 Washington 123,725 114,851 82,776 218,446 New York 408,111 380,926 497,979 3,206,229 Ohio 1,490,885 1,536,088 1,491,438 1,713,733 Pennsylvania 741,700 335,680 378,729 361,425 Canada Border States (2) 4,098,029 4,596,971 4,552,977 8,333,332 New Jersey 365,508 316,434 590,155 531,801 Indiana 830,106 977,410 893,482 1,022,889 All States and Territories 32,912,920 36,900,725 36,311,032 37,032,635 Notes: Most wastewaters excluded. Because of changes in 2001, which gave states and EPA regional offices more discretion in accepting additional state-level data, care must be taken when comparing 2001 numbers with previous reports. All numbers have been changed to metric tons as opposed to U.S. tons. (1) Includes all four states – Texas, Arizona, California and New Mexico. (2) Includes Idaho, Minnesota, Maine, Michigan, Vermont, North Dakota, Washington, New York, Ohio and Pennsylvania. Sources: U.S. Environmental Protection Agency, 1997, 1999 and 2001 National Biennial RCRA Hazardous Waste Report, Exhibit 1.1 and Appendix B. Most hazardous waste generated in the U.S. is treated on-site through a variety of methods. For example, in 2001, some 42 million tons of hazardous waste were managed in 2,479 Treatment, Storage and Disposal Facilities. However, only 7.3 million tons were managed “off-site.” Management of hazardous waste off-site declined significantly between 1993 and 1999, but in 2001, increased substantially, particularly at landfills, incinerators, and cement kilns (see Figure 1). In fact, when comparing management methods listed in all five reporting years between 1993 and 2001, there was more management of (non-wastewater) waste off-site in 2001 than in the previous four reports.
The Generation and Management of Hazardous Wastes and Transboundary Hazardous Waste Shipments between Mexico, Canada and the United States Since NAFTA: A 2004 Update
10
0
1,000,000
2,000,000
3,000,000
4,000,000
5,000,000
6,000,000
7,000,000
8,000,000
Total Off-siteManagement
Incineration Cement Kiln EnergyRecovery
Deepwell/Underground
Injection
Landfill Metals Recovery (ForReuse)
Solvents Recovery Other Recovery
Figure 1. Off-site Management of Hazardous Wastes in the U.S., 93-2001
'93'95'97'99'01
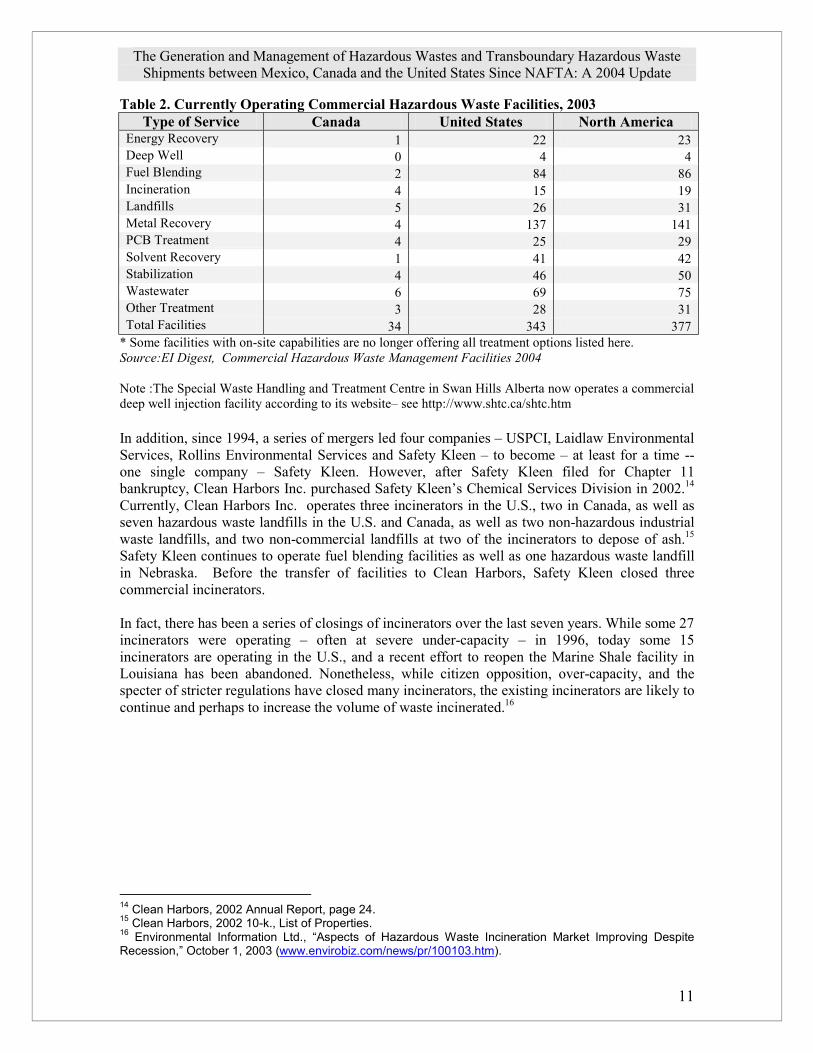
Note: Wastewater treated at Publicly Owned Water Treatment Works is excluded. Sources: U.S. Environmental Protection Agency, 1993, 1995, 1997, 1999 and 2001 National Biennial RCRA Hazardous Waste Report, Exhibit 1.1 and Appendix B In 2001, the management of these off-site wastes was handled by more than 500 off-site commercial or captive TSDFs. However, the vast majority of waste managed off-site in the U.S. was handled by some 50 large TSDFs, including major incinerators, cement kilns burning hazardous wastes, metal and solvent recycling facilities and landfills. A recent industrial survey found a total of 343 commercial operating facilities in the U.S. and 34 operating in Canada in 2003 (see Table 2).13 A 1994 survey of capacity of these commercial facilities in the U.S. found an oversupply of capacity in many of the major treatment methods. Since then, there has been a consolidation of the hazardous waste management industry in the U.S. and many facilities have shut down due to increased regulations, the oversupply of capacity, mergers and acquisitions, and in many cases, legal challenges and political opposition brought by citizens and environmental organizations. For example, in 1998, Chemical Waste Management was renamed Waste Management Inc, merged with USA Waste Services Inc., and later divested itself of several international subsidiaries, while keeping its core North American businesses in the U.S. and Canada. In addition, the company -- which operated eight commercial landfills and 3 deep well injection facilities in 1994 -- operated only five commercial landfills and 2 deep well injection facilities at the end of 1999 (Waste Management Inc. 2000: 7).
13EI Digest, Commercial Hazardous Waste Management Facilities 2004.
The Generation and Management of Hazardous Wastes and Transboundary Hazardous Waste Shipments between Mexico, Canada and the United States Since NAFTA: A 2004 Update
11
Table 2. Currently Operating Commercial Hazardous Waste Facilities, 2003 Type of Service Canada United States North America
Energy Recovery 1 22 23 Deep Well 0 4 4 Fuel Blending 2 84 86 Incineration 4 15 19 Landfills 5 26 31 Metal Recovery 4 137 141 PCB Treatment 4 25 29 Solvent Recovery 1 41 42 Stabilization 4 46 50 Wastewater 6 69 75 Other Treatment 3 28 31 Total Facilities 34 343 377
* Some facilities with on-site capabilities are no longer offering all treatment options listed here. Source:EI Digest, Commercial Hazardous Waste Management Facilities 2004 Note :The Special Waste Handling and Treatment Centre in Swan Hills Alberta now operates a commercial deep well injection facility according to its website– see http://www.shtc.ca/shtc.htm In addition, since 1994, a series of mergers led four companies – USPCI, Laidlaw Environmental Services, Rollins Environmental Services and Safety Kleen – to become – at least for a time -- one single company – Safety Kleen. However, after Safety Kleen filed for Chapter 11 bankruptcy, Clean Harbors Inc. purchased Safety Kleen’s Chemical Services Division in 2002.14 Currently, Clean Harbors Inc. operates three incinerators in the U.S., two in Canada, as well as seven hazardous waste landfills in the U.S. and Canada, as well as two non-hazardous industrial waste landfills, and two non-commercial landfills at two of the incinerators to depose of ash.15 Safety Kleen continues to operate fuel blending facilities as well as one hazardous waste landfill in Nebraska. Before the transfer of facilities to Clean Harbors, Safety Kleen closed three commercial incinerators. In fact, there has been a series of closings of incinerators over the last seven years. While some 27 incinerators were operating – often at severe under-capacity – in 1996, today some 15 incinerators are operating in the U.S., and a recent effort to reopen the Marine Shale facility in Louisiana has been abandoned. Nonetheless, while citizen opposition, over-capacity, and the specter of stricter regulations have closed many incinerators, the existing incinerators are likely to continue and perhaps to increase the volume of waste incinerated.16
14 Clean Harbors, 2002 Annual Report, page 24. 15 Clean Harbors, 2002 10-k., List of Properties. 16 Environmental Information Ltd., “Aspects of Hazardous Waste Incineration Market Improving Despite Recession,” October 1, 2003 (www.envirobiz.com/news/pr/100103.htm).

The Generation and Management of Hazardous Wastes and Transboundary Hazardous Waste Shipments between Mexico, Canada and the United States Since NAFTA: A 2004 Update
12
Table 3. Facilities Owned or Leased by Clean Harbor, U.S. and Canada, 2002 Type of Facility Number Owned in U.S. Number Owned in
Canada Total
Hazardous Waste Incinerator
3 2 5
Hazardous and Non-Hazardous Waste Landfills
7 2 9 (1)
Wastewater Treatment Facilities, Owned or Leased
11 1 12
TSDFs (Treatment, Storage and Disposal Facilities)
16 6 23 (2)
PCB Management and Oil Recycling
10 0 10
Other – Non-commercial landfills for incinerator ash
2 0 2
Total 49 11 61 Includes two non-hazardous industrial waste landfills.
Includes one hazardous waste transfer facility in Mexico Source: Clean Harbors, 2002 10-K, Pages 22 – 24. In addition to Clean Harbors, Safety Kleen and Waste Management Inc., other leading commercial companies providing off-site waste management include Veolia Environment, a French company which recently purchased units of Vivendi, which itself had previously purchased both Onyx Environmental Services and U.S. Filter17, Philip Environmental Services, Horsehead Resource Development, recently purchased by Sun Finance Bank18, and Rhodia Inc., also a French Company previously known as Rhone-Poulonc. The other major hazardous waste managers are cement companies, which burn hazardous wastes in their kilns. The number of cement kilns burning hazardous waste has decreased – in part to citizen opposition as well as difficulty meeting more stringent regulatory standards – even as the amount of waste has stayed stable or even increased slightly in 2001. According to the EPA, in 2003, there were 14 cement plants burning hazardous wastes in 25 kilns throughout the U.S., as well as three light-weight aggregate kiln facilities – which produce shale, clay and slate -- burning wastes in seven kilns.19 In 2001, 12 of the top 50 receivers of hazardous waste in the U.S were cement kilns (see Table).20 Most of these cement facilities are owned by European companies such as Lafarge and Holcim. (In Europe, hazardous wastes make up a much greater percentage of fuel burned in cement kilns.) While the first phase of meeting new stricter standards began in September of 2003, about 2/3rd – 18 out of 27 – cement kilns burning hazardous wastes in 1994 have continued burning hazardous wastes, suggesting that larger cement kilns have made the decision to modernize to meet stricter emission standards in return for burning hazardous wastes,
17 Cary Perket, Treatment and Disposal Market Overview 2000, EI DIGEST, No. 1 (2000), p. 14. 18 Associated Press, “New Owner Dismisses Horsehead CEO, President,” February 4, 2004 (available at http://www.sunherald.com/mld/tallahassee/2004/02/07/business/7900461.htm). 19 Federal Register, Vol. 69, No. 76. Proposed Rules for MACT Standards, April 20, 2004. 20 U.S. EPA, National Biennial RCRA Hazardous Waste Report: Based on 2001 Data (2003), Exhibit 3.8.

The Generation and Management of Hazardous Wastes and Transboundary Hazardous Waste Shipments between Mexico, Canada and the United States Since NAFTA: A 2004 Update
13
which is a profitable business for them because it reduces fuel costs and provides some monetary benefit from manufacturers needing to treat their hazardous wastes. In summary, the U.S. manufacturing industry continued to generate approximately 37 million metric tons of hazardous wastes per year, excluding wastewater, between 1995 and 2001, according to EPA statistics. The vast majority of this total was treated on-site through a variety of treatment methods. Still, for all the years reviewed, between 6 and 7.5 million metric tons of hazardous wastes were treated off-site within the U.S., and data suggests that the amount of waste being treated off-site increased between 1999 and 2001. Despite increasing regulations on the incineration, and thermal treatment of hazardous wastes, data suggests that there is an increasing use of these methods, though at fewer facilities. The contraction in the number of facilities is due to overcapacity in certain sectors of the industry built in the 1980s and early 1990s, increasing regulations impacting costs at some sites, mergers and acquisitions, and citizen opposition, particularly to incineration facilities. It is important to note that this total does not include waste exported either to Canada or Mexico for treatment, and so the actual amount of waste treated off-site is several hundred thousand tons higher (see following sections). Some of the possible explanations for the changes in hazardous waste management are discussed in the third section. Table 4. Cement Kilns Burning Hazardous Wastes in Top 50 Commercial Waste Handlers, 2001 Name of Facility Location Metric Tons Received in 2001 Giant Cement Company South Carolina 116,396 Lafarge North America Ohio 97,392 Continental Cement Co. Missouri 85,077 Essroc Cement Indiana 81,902 Holcim South Carolina 78,902 Holcim Missouri 71,821 Ash Grove Cement Arkansas 68,592 Keystone Cement Pennsylvania 65,208 Holcim Mississippi 59,958 TXI Texas 56,254 Lone Star Missouri 46,517 Lone Star Indiana 43,963 Total – Top Cement Handlers 872,689 Source: U.S. Environmental Protection Agency, National Biennial RCRA Hazardous Waste Report Based on 2001 Data, Exhibit 3.8. B. Waste Flows Across U.S. Borders, 1995 - 2002 Data on exports and imports of hazardous waste between the U.S. and Canada, Mexico and other countries is incomplete for a variety of reasons. First of all, there is not currently a working federal-level database which specifically tracks the volume of waste either exported to or imported from other countries. Secondly, the current manifest data system either does not provide sufficient information to track hazardous wastes or it is not sufficiently available for analysis. Third, some wastes which are exported, including universal wastes, electronic wastes and lead acid batteries in some cases do not require manifests and would not be reflected in these totals. Still, there have been attempts to track hazardous wastes. For example, since the early 1990s, two EPA regions – Region IX and Region VI – have cooperated with U.S. Customs, EPA

The Generation and Management of Hazardous Wastes and Transboundary Hazardous Waste Shipments between Mexico, Canada and the United States Since NAFTA: A 2004 Update
14
headquarters, the U.S. states bordering Mexico and the Mexican government to attempt to create a working database on imports of hazardous waste from Mexico to the U.S. Known as HAZTRAKS, the database allowed EPA to gain some insight into the volume of imports from Mexico from the early 1990s until 2002 despite significant gaps in reporting, funding problems and other issues. The existence of HAZTRAKS also led to development of a similar system in Mexico known as SIRREP. Nevertheless, the information contained in HAZTRAKS should be considered at best incomplete. Among the problems that have been identified with the system include:
Coordination with Customs. There was no legal requirement for U.S. Customs Ports of Entry to share manifest data with the state agencies and U.S. EPA. Instead, the sharing of paper information was voluntary. While some POEs shared significant amounts of information, others did not, making the information incomplete. Table 5 makes this quite apparent, with significant waste manifest information from POEs in Otay Mesa, Calexico and El Paso, but very limited information avaiable in HAZTRAKS from the Brownsville, Laredo and the Arizona and New Mexico POEs. Timeliness. The information was often six months to several years behind by the time the
EPA subcontractor had collected the manifest and TSD receipt information from state agencies, had physically entered the information into the database, and quality checked the information. Because of funding issues, there were lags when no information was entered into the database for more than a year at a time. In fact, for some years, only half of the year was entered into the database making trend analysis near impossible. Differences in hazardous waste codes. At times, information contained in the manifests
was based on Mexican waste codes, making it difficult in individual cases to determine whether waste would be considered hazardous or non-hazardous in the U.S. Lack of export data. While there is considerable information on imports, there is
incomplete information in the system on exports from the U.S. to Mexico. Real vs. Actual Volume. In some cases, manifests contained the amount of waste
authorized to pass the border, and not the actual amount of waste transported across the border.
In part because of these issues, as well as budgetary cuts at the federal level, EPA headquarters made the decision to discontinue funding for HAZTRAKS in 2003. While there are several possible alternative database systems proposed, thus far there is no definitive replacement. Interestingly, the new Border 2012 Plan approved by the U.S. and Mexico still lists one of the goals of the program to coordinate sharing of information and development of a joint database for imports and exports of hazardous wastes between Mexico and the U.S..21 In addition to HAZTRAKS, EPA does maintain separate import and export databases known respectively as WITS and EXPORTS which track hazardous waste notices of import and exports. Figures 2 and 3 show a decrease in import notices from Canada since 1997 and an increase in export notices to Canada since 1995. The same databases show notices of import and export staying relatively stable between the U.S. and Mexico. These databases also have data on the number of waste streams – the number of different types of waste coming from or going to Canada or Mexico. Figures 4 and 5 show increases in the number of waste streams being exported – particularly to Canada – and a general decline (1995-1998), followed by an increase (1998-2000), and again a decline (2000 to 2002) in the number of waste streams being imported. 21 U.S. EPA, Border 2012 Plan, 2003.

The Generation and Management of Hazardous Wastes and Transboundary Hazardous Waste Shipments between Mexico, Canada and the United States Since NAFTA: A 2004 Update
15
Figure 2. Notices of Imports from Canada, Mexico and the World, 95-2002
0
200
400
600
800
1000
1200
1400
'95 '96 '97 '98 '99 '00 '01 '02
No.
of N
otic
es
Canada Notices Mexico NoticesAll Notices
Figure 3. Notices of Export to Canada, Mexico and All Countries, 95-2002
0
200
400
600
800
1000
1200
'95 '96 '97 '98 '99 '00 '01 '02
No.
of N
otic
es
Canada Export NoticesMexico Export NoticesAll Countries

The Generation and Management of Hazardous Wastes and Transboundary Hazardous Waste Shipments between Mexico, Canada and the United States Since NAFTA: A 2004 Update
16
Figure 4. Number of Hazardous Waste Streams Imported to U.S. by Country, 1995 - 2002
0
500
1000
1500
2000
2500
3000
'95 '96 '97 '98 '99 '00 '01 '02
CanadaMexicoTotal WS
Figure 5. Number of Hazardous Waste Streams Exported from U.S. to Canada, Mexico and Other Countries, 1995-2002
0
1000
2000
3000
4000
5000
6000
7000
8000
'95 '96 '97 '98 '99 '00 '01 '02
CanadaMexicoAll Countries
Sources for Figures 2,3,4 and 5: U.S. EPA, Information from WITS and Export Database, 1995 – 2002.

The Generation and Management of Hazardous Wastes and Transboundary Hazardous Waste Shipments between Mexico, Canada and the United States Since NAFTA: A 2004 Update
17
Nevertheless, WITS and the EXPORT database are not particularly helpful in determining trends of exports and imports of hazardous waste between the NAFTA countries as neither the number of notice or number of waste stream trends appear to be reflective of the actual trends reported by the Canadian government, as outlined in Section V, or by HAZTRAKS and other data contained in the Biennial Reporting System, as reported below. There may be a number of reasons for this. First of all, the number of notices or waste streams does not correspond to the actual waste volume that cross the border. One notice or waste stream might involve tens of thousands of tons of waste while another might correspond to less than a ton. In addition, in some cases, a notice to export or import may be sent in and approved by EPA, but the waste is never sent, or may be sent in a future year. Finally, there are particular waste streams such as lead acid batteries or recycled electronic waste which do not require the same level of reporting and thus may not even be reflected in the system. For example, the number of waste notices of export and waste stream of export from the U.S. to Mexico appear only to reflect one particular waste stream – K061 – electric arc furnace dust from recyled steel manufacturers – and not other waste streams such as lead acid batteries for recycling which are sent with some regularity to Mexico according to Mexican authorities. These waste streams are just not there in the system. Still, HAZTRAKS, state-level databases such as Texas’s STEERS, and the Biennial Reporting System do contain some export and import volume data.22 In addition, EPA has taken summary data provided by facilities exporting hazardous waste to come up with fairly accurate figures. Currently, for example, EPA is subcontracting with a company to examine annual export summaries for the past several calendar years to get a better handle on total exports. Just recently, EPA and its subcontractors have completed analysis of Calender Years 2001 and 2002 annual export summary data. Figure 6 shows total exports of waste to Canada and Mexico during these two years, according to the annual EPA export data. The data suggests a significant decline in exports of hazardous wastes to Canada and a significant increase in exports to Mexico between 2001 and 2002.
0
100000
200000
300000
400000
2001 2002
Figure 6. U.S. Hazardous Waste Exports (Metric Tons), 2001-2002
CanadaMexico N. America
Source: Office of Solid Waste and Office of Enforcement and Compliance Assistance, U.S. EPA, Annual Exporter’s Data, Provided to Authors, June 24, 2004.
22 This section will mainly provided data for the U.S. – Mexico waste trade will be presented as Section V has more complete information on waste transfers between the U.S. and Canada.

The Generation and Management of Hazardous Wastes and Transboundary Hazardous Waste Shipments between Mexico, Canada and the United States Since NAFTA: A 2004 Update
18
1. Imports from Mexico Figure 7 provides basic information supplied by the HAZTRAKS database between 1994 and 2002. Only those years for which complete information was entered into the system is included. The table suggests that imports of hazardous wastes generally increased between 1994 and 2002. Information on non-RCRA industrial waste is more varied, but it should be noted that in 2002 only manifests indicating RCRA hazardous waste were entered into the system. Again, care must be taken in interpreting these numbers since increases could indicate either better compliance with manifest requirements or better sharing of data between U.S. Customs Ports of Entry and EPA. In particular, when looking at actual data in HAZTRAKS by port of entry, it becomes apparent that only a few port of entry were actually supplying data on a regular basis to the EPA. Either there was very little hazardous wastes flowing from those ports, the U.S. Customs officials were not collecting the paperwork, there was little compliance, or the U.S. Customs chose not to share the data (Table 5). This is important for a variety of reasons.
Figure 7. HAZTRAKS Hazardous and Industrial Waste Imports from Mexico,1994-2002
0
5,000
10,000
15,000
20,000
25,000
30,000
35,000
'94 '95 '96 '97 '99 '02
RCRA Non-RCRA
Source: Authors, Query run on U.S. EPA’s HAZTRAKS Database, November 2003. Notes: In 2002, virtually no information was entered into the system from non-RCRA hazardous waste manifests. Information from calender years 1998, 2000 and 2001 was not entered into HAZTRAKS. According to the HAZTRAKS database, between 1994 and 2002, some 373 TSD facilities received solid waste from Mexico, including 232 which received RCRA hazardous waste. However, most of this RCRA hazardous waste appeared to go to a relatively few facilities (Table 6). If non-RCRA waste is included, two municipal and industrial, non-hazardous waste landfills --Numex Landfill in Sunland Park, New Mexico and Butterfield Station in Mobile, Arizona -- become the largest managers of Mexican waste in the U.S., each taking in nearly 30,000 tons in the period of record. The data suggests that the vast majority of solid waste coming from Mexico is for disposal at non-hazardous industrial landfills and the vast majority of RCRA hazardous

The Generation and Management of Hazardous Wastes and Transboundary Hazardous Waste Shipments between Mexico, Canada and the United States Since NAFTA: A 2004 Update
19
wastes is for disposal at hazardous waste landfills and underground injection wells in Texas, California and Nevada. Table 5. RCRA Hazardous Waste Imports from Mexico by Port of Entry (mt. tons) Port of Entry 1994 1995 1996 1997 1999 2002 Otay Mesa 3,517 2,918 2,640 6,759 9,140 11,554 Calexico 94 233 360 720 1,119 1,508 Nogales 402 77 0 9 445 58 San Luis 9 30 80 93 30 0 El Paso 2,439 2,624 2,455 2,575 3,393 361 Laredo 0 0 0 0 60 118 Del Rio 256 27 0 0 1 0 Brownsville 351 0 131 318 323 25 Other (Eagle Pass, Hidalgo, Pharr) 191 49 38 5 0 0 Unknown 5,192 3,091 1,901 1,782 88 26 Total 12,450 9,049 7,604 12,261 14,598 13,650 Source: Query run on HAZTRAKS, Top 20 U.S. Ports of Entry, RCRA Manifests Only, Mexico to U.S., February 2004. Table 6. Hazardous Waste Imports to the U.S by Top 10 TSD Receiving Facilities, 1994 –2002 Company Location Total RCRA Tons Received
in Tons US Ecology Beatty, Nevada 12,790 American Ecology Winona, Texas 8,556 Chemical Waste Management Azusa, California 7,943 Hydrocarbon Recyclers San Antonio, Texas 6,076 Rho-Chem Inglewood, California 5,058 Phibro-Tecg Santa Fe, California 4,393 Chemical Waste Management Kettleman City, California 3,978 Laidlaw Environmental Westmorland, California 3,931 Rineco Benton, Arkansas 2,764 Hydrocarbon Recyclers Tulsa, Oklahoma 2,365 Essex Waste Management Kingsville, Missouri 2,347 Source: Query run on U.S. EPA’s HAZTRAKS Database, November 2003. RCRA waste only. Data from Texas’s TRACS system—a component of STEERS -- tells a similar story (see Figure 8). An analysis of data on imports from Mexico in 1999 shows that about half the total – over 6,700 tons -- went to hazardous and non-hazardous landfills, another 2,959 tons of waste went for treatment, 2,382 went to storage, 1,205 tons went for stabilization and 1,159 to fuel blending for later burning. Inorganic solids, non-halogenated organic solids, inorganic sludge, solid resins, petroleum contaminated solids, wood debris and paints and varnishes were some of the leading imports to Texas TSDs.

The Generation and Management of Hazardous Wastes and Transboundary Hazardous Waste Shipments between Mexico, Canada and the United States Since NAFTA: A 2004 Update
20
02000400060008000
10000120001400016000
'93 '95 '97 '99 '01
Figure 8. Tons of Mexican Waste Imported to Texas TSD Facilities, TRACS Database
Note: 1999 includes a significant amount of non-hazardous industrial waste. Source: Texas Commission on Environmental Quality, Query run on TRACS Database, October 2003.
2. Exports to Mexico The HAZTRAKS database has much more incomplete data on U.S. exports to Mexico. The database only provides information on U.S. exports of electric arc furnace dust in 1993 (31,750), 1994 (34,500), 1995 (80,750 tons) and 1997 (20,000 tons).23 Between eight and eighteen different recycled steel “mini-mill” manufacturers reported sending the waste to Mexico in Haztraks in those years. The majority of these facilities are located in Texas (four), Arkansas (two), and southern states like California, Alabama, Mississippi, and Oklahoma. By 1999 and 2001, no information on U.S. exports to Mexico was entered into the database due to budgetary constraints. However, again, information from Texas’s TRACS database, summaries done by EPA based on exporters’ annual reports and some information from EPA’s BRS database suggests that exports of K061 – the metal-laden dust resulting in furnaces from mini-mill steel production – have increased since the early 1990s before falling off slightly in 2001 and may have risen substantially in 2002. Figure 9 shows information from companies in Texas that export their waste to the Zinc Nacional facility in Mexico. In 2001, the exports came from only three companies: Nucor Steel, Chapparal Steel and Structural Metals.24 The decline in 1999 is apparently due to reduced production levels in the mini-mill steel industry in Texas rather than changes in off-site management of this waste stream.
23 U.S. EPA, HAZTRAKS Database, Query run on December 5, 2003. 24 Information provided by Waste Analysis and Planning Division, Texas Commission on Environmental Quality, October 2003.
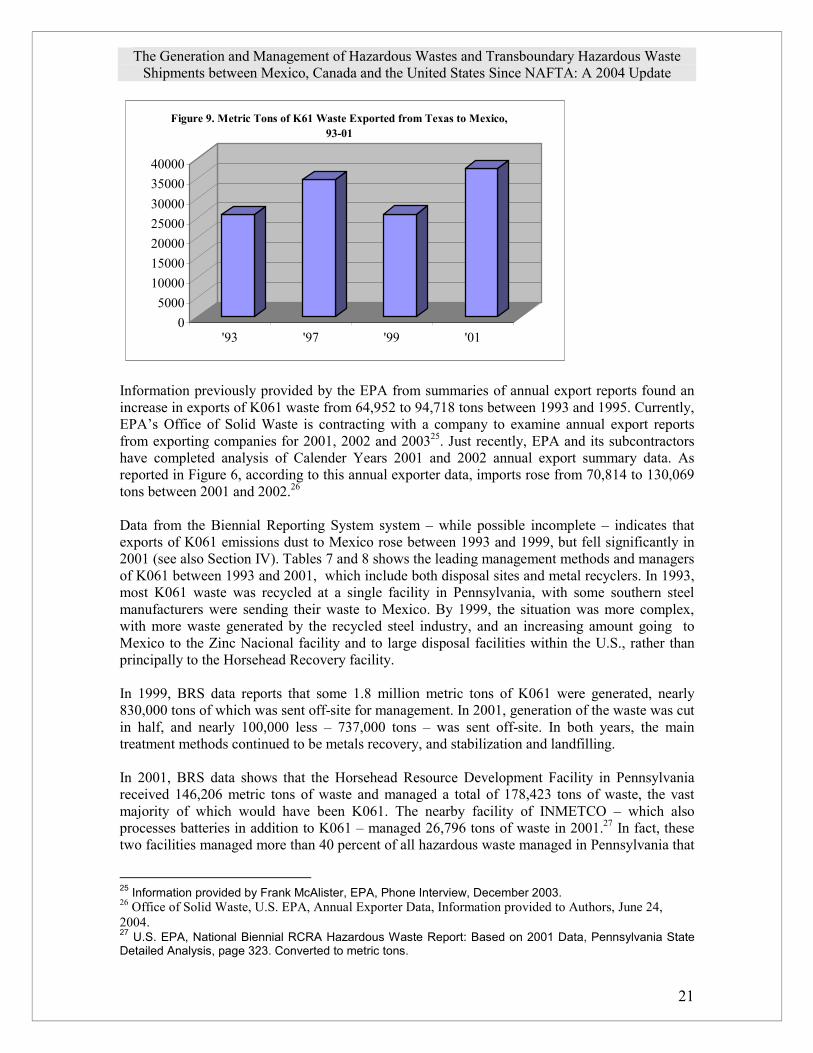
The Generation and Management of Hazardous Wastes and Transboundary Hazardous Waste Shipments between Mexico, Canada and the United States Since NAFTA: A 2004 Update
21
05000
10000150002000025000300003500040000
'93 '97 '99 '01
Figure 9. Metric Tons of K61 Waste Exported from Texas to Mexico, 93-01
Information previously provided by the EPA from summaries of annual export reports found an increase in exports of K061 waste from 64,952 to 94,718 tons between 1993 and 1995. Currently, EPA’s Office of Solid Waste is contracting with a company to examine annual export reports from exporting companies for 2001, 2002 and 200325. Just recently, EPA and its subcontractors have completed analysis of Calender Years 2001 and 2002 annual export summary data. As reported in Figure 6, according to this annual exporter data, imports rose from 70,814 to 130,069 tons between 2001 and 2002.26 Data from the Biennial Reporting System system – while possible incomplete – indicates that exports of K061 emissions dust to Mexico rose between 1993 and 1999, but fell significantly in 2001 (see also Section IV). Tables 7 and 8 shows the leading management methods and managers of K061 between 1993 and 2001, which include both disposal sites and metal recyclers. In 1993, most K061 waste was recycled at a single facility in Pennsylvania, with some southern steel manufacturers were sending their waste to Mexico. By 1999, the situation was more complex, with more waste generated by the recycled steel industry, and an increasing amount going to Mexico to the Zinc Nacional facility and to large disposal facilities within the U.S., rather than principally to the Horsehead Recovery facility. In 1999, BRS data reports that some 1.8 million metric tons of K061 were generated, nearly 830,000 tons of which was sent off-site for management. In 2001, generation of the waste was cut in half, and nearly 100,000 less – 737,000 tons – was sent off-site. In both years, the main treatment methods continued to be metals recovery, and stabilization and landfilling. In 2001, BRS data shows that the Horsehead Resource Development Facility in Pennsylvania received 146,206 metric tons of waste and managed a total of 178,423 tons of waste, the vast majority of which would have been K061. The nearby facility of INMETCO – which also processes batteries in addition to K061 – managed 26,796 tons of waste in 2001.27 In fact, these two facilities managed more than 40 percent of all hazardous waste managed in Pennsylvania that
25 Information provided by Frank McAlister, EPA, Phone Interview, December 2003. 26 Office of Solid Waste, U.S. EPA, Annual Exporter Data, Information provided to Authors, June 24, 2004. 27 U.S. EPA, National Biennial RCRA Hazardous Waste Report: Based on 2001 Data, Pennsylvania State Detailed Analysis, page 323. Converted to metric tons.
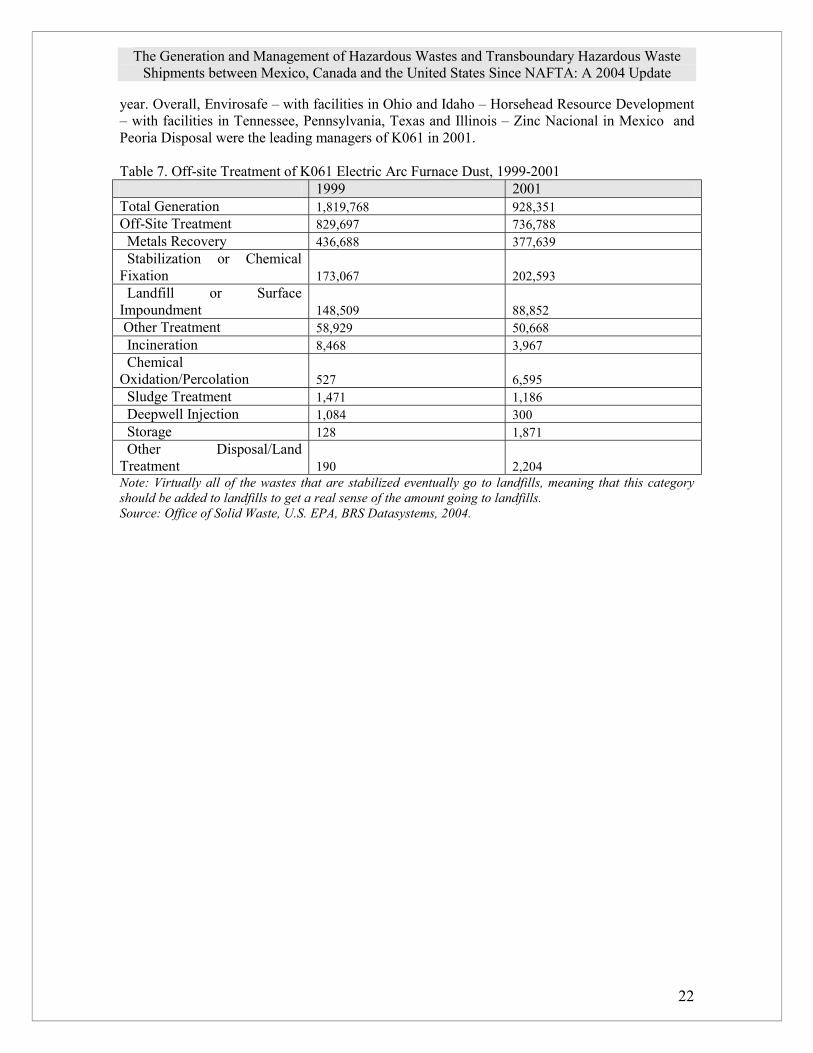
The Generation and Management of Hazardous Wastes and Transboundary Hazardous Waste Shipments between Mexico, Canada and the United States Since NAFTA: A 2004 Update
22
year. Overall, Envirosafe – with facilities in Ohio and Idaho – Horsehead Resource Development – with facilities in Tennessee, Pennsylvania, Texas and Illinois – Zinc Nacional in Mexico and Peoria Disposal were the leading managers of K061 in 2001. Table 7. Off-site Treatment of K061 Electric Arc Furnace Dust, 1999-2001 1999 2001 Total Generation 1,819,768 928,351 Off-Site Treatment 829,697 736,788 Metals Recovery 436,688 377,639 Stabilization or Chemical Fixation 173,067 202,593 Landfill or Surface Impoundment 148,509 88,852 Other Treatment 58,929 50,668 Incineration 8,468 3,967 Chemical Oxidation/Percolation 527 6,595 Sludge Treatment 1,471 1,186 Deepwell Injection 1,084 300 Storage 128 1,871 Other Disposal/Land Treatment 190 2,204 Note: Virtually all of the wastes that are stabilized eventually go to landfills, meaning that this category should be added to landfills to get a real sense of the amount going to landfills. Source: Office of Solid Waste, U.S. EPA, BRS Datasystems, 2004.
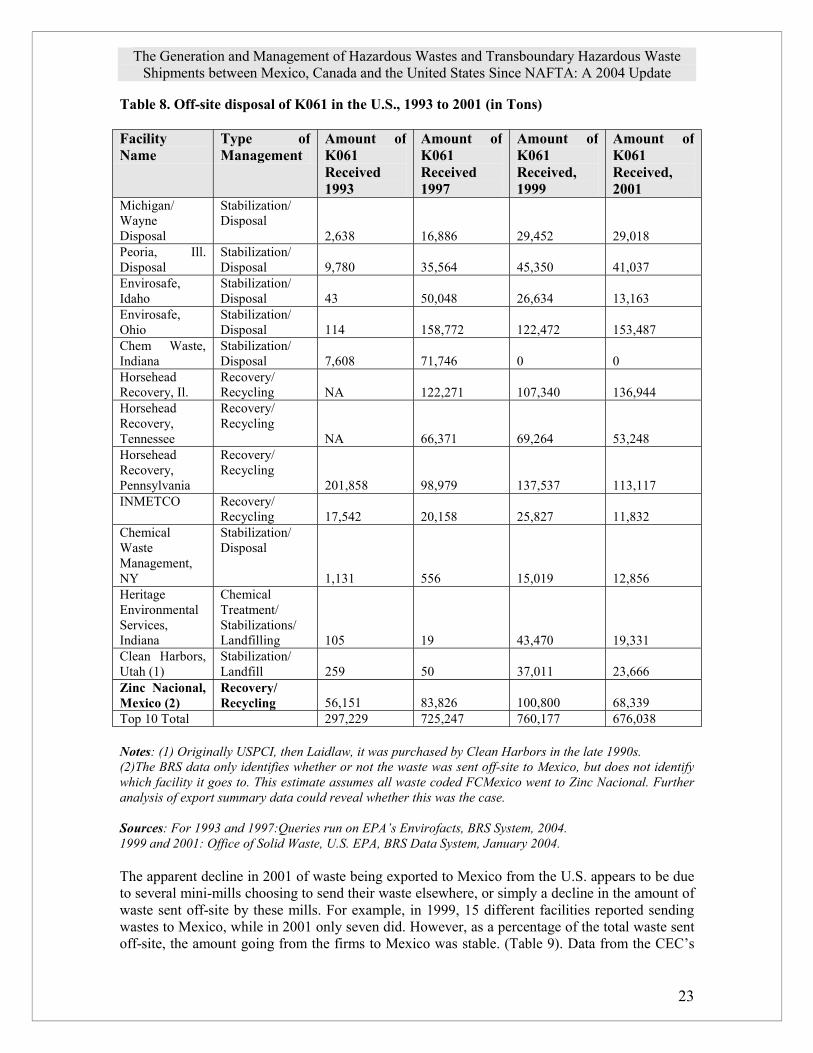
The Generation and Management of Hazardous Wastes and Transboundary Hazardous Waste Shipments between Mexico, Canada and the United States Since NAFTA: A 2004 Update
23
Table 8. Off-site disposal of K061 in the U.S., 1993 to 2001 (in Tons) Facility Name
Type of Management
Amount of K061 Received 1993
Amount of K061 Received 1997
Amount of K061 Received, 1999
Amount of K061 Received, 2001
Michigan/ Wayne Disposal
Stabilization/ Disposal
2,638 16,886 29,452 29,018 Peoria, Ill. Disposal
Stabilization/ Disposal 9,780 35,564 45,350 41,037
Envirosafe, Idaho
Stabilization/ Disposal 43 50,048 26,634 13,163
Envirosafe, Ohio
Stabilization/ Disposal 114 158,772 122,472 153,487
Chem Waste, Indiana
Stabilization/ Disposal 7,608 71,746 0 0
Horsehead Recovery, Il.
Recovery/ Recycling NA 122,271 107,340 136,944
Horsehead Recovery, Tennessee
Recovery/ Recycling
NA 66,371 69,264 53,248 Horsehead Recovery, Pennsylvania
Recovery/ Recycling
201,858 98,979 137,537 113,117 INMETCO Recovery/
Recycling 17,542 20,158 25,827 11,832 Chemical Waste Management, NY
Stabilization/ Disposal
1,131 556 15,019 12,856 Heritage EnvironmentalServices, Indiana
Chemical Treatment/ Stabilizations/ Landfilling 105 19 43,470 19,331
Clean Harbors, Utah (1)
Stabilization/ Landfill 259 50 37,011 23,666
Zinc Nacional, Mexico (2)
Recovery/ Recycling 56,151 83,826 100,800 68,339
Top 10 Total 297,229 725,247 760,177 676,038 Notes: (1) Originally USPCI, then Laidlaw, it was purchased by Clean Harbors in the late 1990s. (2)The BRS data only identifies whether or not the waste was sent off-site to Mexico, but does not identify which facility it goes to. This estimate assumes all waste coded FCMexico went to Zinc Nacional. Further analysis of export summary data could reveal whether this was the case. Sources: For 1993 and 1997:Queries run on EPA’s Envirofacts, BRS System, 2004. 1999 and 2001: Office of Solid Waste, U.S. EPA, BRS Data System, January 2004. The apparent decline in 2001 of waste being exported to Mexico from the U.S. appears to be due to several mini-mills choosing to send their waste elsewhere, or simply a decline in the amount of waste sent off-site by these mills. For example, in 1999, 15 different facilities reported sending wastes to Mexico, while in 2001 only seven did. However, as a percentage of the total waste sent off-site, the amount going from the firms to Mexico was stable. (Table 9). Data from the CEC’s

The Generation and Management of Hazardous Wastes and Transboundary Hazardous Waste Shipments between Mexico, Canada and the United States Since NAFTA: A 2004 Update
24
Taking Stock 2001 report also shows a slight decline in transfers of toxics to Mexico from U.S. facilities in 2001, compared to 2000 and 1999 (Figure 10). Again, more recent data suggests that K061 exports again climbed past 130,000 tons in 2002, almost doubling. Table 9. Steel operators exporting EAF dust to Mexico, 1999 – 2001 (metric tons) Name of Company
Tons Sent to Mexico, 1999
Total Amount Sent Off-Site, 1999
Tons Sent to Mexico, 2001
Total Amount Sent Off-Site, 2001
Arkansas Steel Associates 2,932.75 2,932.75 2,778.71 3,362.54 Ameristeel, Jacksonville, Fl. 3,507.18 8,139.26 0.00 5,290.65 Ameristeel, Ga 530.70 679.48 0.00 0.00 Compass Big Blue, Mo. 13,481.68 13,481.68 0.00 0.00 Cascade Steel Rolling Mill, Or. 261.09 10,974.35 0.00 10,677.17 Nucor Steel, SC 9,578.65 15,675.67 0.00 2,086.69 Nucor Steel, Al. 9,706.70 9,706.70 13,607.78 13,607.78 Owens Electric Steel Co., South Carolina 5,369.04 6,407.34 0.00 1,932.91 Birmingham Steel, Wa 9,559.16 9,559.16 10,018.57 10,018.57 Chapparal Steel, Tx 16,945.76 17,596.85 15,512.46 17,025.20 Chapparral, Va. 1,052.06 1,911.80 0.00 4.64 Rocky Mountain Steel, Co. 10,962.97 12,950.07 0.00 979.76 TAMCO, Ca. 2,515.62 8,893.32 0.00 31.99 Nucor Co. TX 0.00 0.00 8,504.86 8,747.98 Structural Metals, TX 9,066.18 9,217.12 13,353.86 13,573.54 Birmingham Southeast, MS 5,330.83 5,330.83 4,562.93 4,564.18 Totals 100,800.36 133,456.37 68,339.16 91,903.60 % of Total 75.5% 100% 74.3% 100% Source: Office of Solid Waste, U.S. EPA, BRS Data System, January 2004.

The Generation and Management of Hazardous Wastes and Transboundary Hazardous Waste Shipments between Mexico, Canada and the United States Since NAFTA: A 2004 Update
25
0
10
20
30
40
1998 1999 2000 2001
Figure 10. Millions of Kilograms of Toxics Sent from U.S. Facilities to Mexico, 1998-2001
Metal TreatmentMetal Recycling
Source: CEC, Taking Stock 2001 (June 2004), Figure 8-4.

The Generation and Management of Hazardous Wastes and Transboundary Hazardous Waste Shipments between Mexico, Canada and the United States Since NAFTA: A 2004 Update
26
What is K061 and how is it managed in the U.S.? The 1980s saw the rise of a new type of steel manufacturer in the U.S. and Canada. Rather than producing steel from iron ore, these steel manufacturers have maintained competitiveness by using mini-mills with electric arc furnaces (EAF) to make steel, increasing their market share to some 46.2 percent in the US in 19991. One of the challenges of this industry, however, has been managing EAF dust, which since 1985 has been regulated as a hazardous waste under EPA’s RCRA. EAF dust, known as K061, contains small quantities of lead, cadmium and zinc, as well as iron, chlorides and metal oxides. About 15 to 20 kilograms of dust are produced for every ton of steel produced. The dust is produced when volatile metals like zinc and lead are oxidized in the vapor phase in the arc furnaces and cooled in the extractive air flow and captured by a variety of dust control systems. The mini-mill steel industry also produces a significant amount of sludge from this same process, but this hazardous waste is managed separately from K061. Analysts estimate that some 720,000 tons of EAF dust are generated and treated off-site in the U.S. per year. Unfortunately for the industry, treating the waste off-site often costs between $150 and $200 per ton. There are, however, a variety of treatment options for the industry which include: metal recycling, stabilization and landfilling, alternative recycled products, including as a fertilizer, and more recently, on-site reduction and treatment through a variety of processes (Table 10). Other more recent uses of EAF dust include the production of magnetite by combining the dust with metals grindings and scale to produce a raw material for shingles, pigments and colorants, research into converting the dust into a slag conditioner, and turning EAF dust into bricks. First of all, there are a number of metal recyclers which process the waste. The largest in the U.S., Horsehead Resource Development in Palmerton, Pennsylvania, uses a “High Temperature Metal Recovery (HTMR)” process to recycle and recover zinc, lead and iron from the waste. Still, a significant amount of the product is still left and is disposed of on the ground at a HRD-owned landfill. In addition to recycling zinc for its own zinc production facility, HRD has instituted a process to produce what it calls QuickIron -- an iron product that is 70 to 83 percent metal. HRD was a subsidiary of Horsehead Incorporated, which also owned Zinc Corporation of America and has been the leading producer of zinc. In 2002, the company filed for bankruptcy and after several negotiations with potential buyers reached agreement in 2003 with Sun Capital Group, an investment bank operating out of Florida, to take over the metal recycler and zinc producer. Horsehead has facilities in Pennsylvania, Tennessee, Illionois and Texas, all of which recycle a significant amount of K061. The second largest metal recycler of EAF dust in the North American market is Zinc Nacional in Mexico. In the mid-1990s, the firm improved its production process by instituting both a pyrolisis and hydrometalurgical process to capture the different waste streams from the dust. INMETCO, another metal recycler located in Pennsylvania, is also a leading recycler of K061, as well as of a variety of battery wastes. The company also uses a thermal High Temperature Metal Recovery Process, although in the last few years the company has concentrated more on a new process to recover cadmium from used batteries. Still, K061 and other wastes from the stainless steel industry still make up the majority of its waste stream.1 In Canada, Philip Environmental built an iron-bearing-dust recovery/zinc-iron-plasma-process plant in Hamilton, Ontario which can take up to 75 percent EAF dust to produce zinc powder for resale. However, significant problems in the production process as well as financial problems has not allowed the company to use this technology. Indeed, Canada has been exporting its EAD wastes to the U.S. for several years. While at one time HRD and other off-site metal recyclers were the main option for mini-mills, a number of companies have stepped into the business of treating electric arc furnace dust. In recent years, stabilization of electric arc furnace dust followed by disposal has increased. Leading this option has been EnviroSafe Inc., which first treats the dust with chemicals to make it less soluble, then binds the metals in the dust with another process before sending it to its landfills in Ohio, Idaho and Michigan. Other leading “stabilizers” of the dust include Chemical Waste Services in Niagara, New York, Peoria Disposal in Illionois, Wayne Disposal in Michigan and Heritage Environmental Services in Indiana. Clean Harbors – after purchasing the Laidlaw Landfill in Utah – has been increasing its management of the waste as well. Still other companies have been exploring ways to make products from their dust on-site. Since 1996, Nucor has teamed up with Inorganic Recycling to produce a glass-like abrasive material mainly for the sandblasting industries at one of its plants, and more recently joined up with AllMet Technologies at its plant it owns with Yamato to produce DRI – Direct Reduced Iron Pellets for resale to foundries – as well as zinc oxide. A brick manufacturing plant in Michigan has been charging much less to take the EAF dust from nearby mini-mills to produce a heated brick product. Finally, some companies have been exploring ways to reduce their production of the dust. A recent study concluded that by putting the EAF dust right back into the furnace, nearly 40 percent of the volume of the dust is reduced. Other measures to reduce dust generation include scrap preheating, charging lime with the scrap (rather than injection), installing adjustable-speed-drive fans in the bag house and optimizing foamy-slag practices.1 The reduction in generation of dust between 1999 and 2001—as reported by the EPA’s BRS system – may be a reflection of this trend.
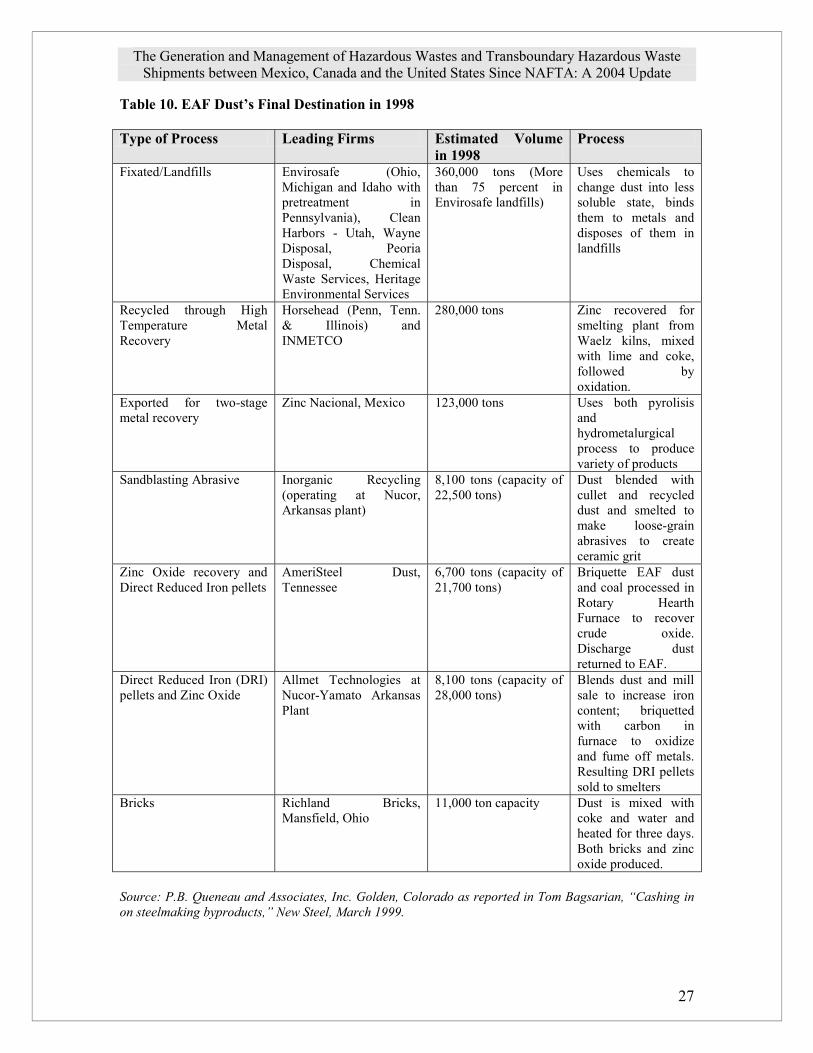
The Generation and Management of Hazardous Wastes and Transboundary Hazardous Waste Shipments between Mexico, Canada and the United States Since NAFTA: A 2004 Update
27
Table 10. EAF Dust’s Final Destination in 1998 Type of Process Leading Firms Estimated Volume
in 1998 Process
Fixated/Landfills Envirosafe (Ohio, Michigan and Idaho with pretreatment in Pennsylvania), Clean Harbors - Utah, Wayne Disposal, Peoria Disposal, Chemical Waste Services, Heritage Environmental Services
360,000 tons (More than 75 percent in Envirosafe landfills)
Uses chemicals to change dust into less soluble state, binds them to metals and disposes of them in landfills
Recycled through High Temperature Metal Recovery
Horsehead (Penn, Tenn. & Illinois) and INMETCO
280,000 tons Zinc recovered for smelting plant from Waelz kilns, mixed with lime and coke, followed by oxidation.
Exported for two-stage metal recovery
Zinc Nacional, Mexico 123,000 tons Uses both pyrolisis and hydrometalurgical process to produce variety of products
Sandblasting Abrasive Inorganic Recycling (operating at Nucor, Arkansas plant)
8,100 tons (capacity of 22,500 tons)
Dust blended with cullet and recycled dust and smelted to make loose-grain abrasives to create ceramic grit
Zinc Oxide recovery and Direct Reduced Iron pellets
AmeriSteel Dust, Tennessee
6,700 tons (capacity of 21,700 tons)
Briquette EAF dust and coal processed in Rotary Hearth Furnace to recover crude oxide. Discharge dust returned to EAF.
Direct Reduced Iron (DRI) pellets and Zinc Oxide
Allmet Technologies at Nucor-Yamato Arkansas Plant
8,100 tons (capacity of 28,000 tons)
Blends dust and mill sale to increase iron content; briquetted with carbon in furnace to oxidize and fume off metals. Resulting DRI pellets sold to smelters
Bricks Richland Bricks, Mansfield, Ohio
11,000 ton capacity Dust is mixed with coke and water and heated for three days. Both bricks and zinc oxide produced.
Source: P.B. Queneau and Associates, Inc. Golden, Colorado as reported in Tom Bagsarian, “Cashing in on steelmaking byproducts,” New Steel, March 1999.

The Generation and Management of Hazardous Wastes and Transboundary Hazardous Waste Shipments between Mexico, Canada and the United States Since NAFTA: A 2004 Update
28
3. Enforcement, Regulation and Compliance Issues with EAF Dust in the U.S.
There have been a variety of controversial issues involving the management of EAF dust through the years. After the dust was declared hazardous wastes in 1984, there have been a number of disputes over how the dust should be properly managed. First of all, a major dispute erupted between Envirosafe and HMD over the correct management of the material. In 1995, EPA determined that once the material was stabilized, it could be disposed of in landfills; even in some cases in non-hazardous waste landfills.28 The change in interpretation of Land Disposal Restrictions for the waste led to a major shift in management of the hazardous waste toward disposal. While EPA and the states have generally allowed those reclaiming the EAF Dust to make new products with the dust and then consider the product non-hazardous, an attempt by Oregon Steel Mills (OSM) to recycle EAF dust into glass frit was closed down when OSHA determined the product did not meet safety criteria.29 In 1997, EPA proposed new standards after a comprehensive study of hazardous contaminants in fertilizers. In some cases, EAF dust has been used to make a zinc-based fertilizer. EPA found that in many cases, the fertilizers still contained high levels of lead and other dangerous heavy metals. Therefore, in 2001, the agency adopted new contaminant-based standards for fertilizers made from K061 and other industrial waste products, which could impact a small amount of KO61 waste used as fertilizers.30 Compliance problems at both metal recycling operators as well as at the mini-mills themselves have been fairly common. First of all, in 1995, Horsehead was forced to settle with the EPA and the Justice Department after it was found that its practices led to harmful releases of lead and cadmium into the soil, air and water. The settlement forced the company to pay a $5.65 million fine and spend another $30 to $40 million to upgrade its plant, constructing buildings to house the hazardous dust before processing, upgrade its emission controls and take measures to reduce run-off from its operations.31 In fact, in part because of these problems, HRD’s Palmerton site has actually been listed as a Superfund site since 1983. In 1999, the EPA reached a $4.7 million settlement with Horsehead and 196 other parties to clean up waste that had been at the site for decades. Under the settlement, the monies will be used to clean up the site, which in some cases has impacted residential properties.32 It is important to note that the Zinc Nacional facility near Monterrey, Mexico has also been under enforcement. A variety of problems with emissions and improper management of waste led to fines by Profepa and an agreement to shut the zinc recycler down temporarily in the early 1990s.
28 “Horsehead Corrects Envirosource Statement,” Garden State EnviroNet, June 26, 1995. Available at www.gsenet.org/library/03bus/horshead.php. 29 Tom Bagsarian, “Cashing in on steelmaking byproducts,” New Steel, March 1999. 30 U.S. EPA, Environmental Fact Sheet: Regulations to be revised for zinc fertilizer recycling, November 2000. 31 U.S. Department of Justice, “Horsehead Settles Environmental Violations,” August 24, 1995, DOJ Press Release. 32 U.S. Environmental Protection Agency, Region 3, “Settlement Reached with 197 Parties at Palmerton Superfund Site,” EPA Region 3 Press Release, June 23, 1999.

The Generation and Management of Hazardous Wastes and Transboundary Hazardous Waste Shipments between Mexico, Canada and the United States Since NAFTA: A 2004 Update
29
After significant investment, the plant re-engineered its recovery process and the company is now one of the members of Industria Limpia. Improper handling of EAF dust has also been rampant at the mini-mills themselves. In December of 2000, the Department of Justice filed suit against Nucor Steel Inc. and reached a settlement agreement for multiple violations at eight minimills and six steel foundries.33 Nucor was assessed a $9 million fine in civil penalties, $4 million for environmental projects and an estimated $85 million over nine years to implement all parts of the settlement agreement. Nucor violated the Clean Air Act, provisions of the Emergency Planning and Community Right-to-Know Act for reporting toxic releases and transfers, and mismanaged and illegally disposed of K061 dust, which also contributed to violations of its wastewater treatment discharge permit and stormwater regulations under the Clean Water Act. As part of the settlement agreement, Nucor is implementing enhancement to its management of K061 waste, including ending the practice of discharging some K061 waste through its wastewater discharge system and taking measures to avoid run-off during heavy rains. EPA began a special inspection and enforcement effort during the late 1990s at the steel and iron minimill industries and found that many facilities had expanded their operation without meeting more stringent emission control requirements of the Clean Air Act triggered by these expansions. In addition, the EPA notes that “some companies have failed to take steps to minimize the possibility of release of K061,” and “found that a company ….failed to clean up a hazardous waste spill from a baghouse.” More specifically, companies have also allowed K061 waste releases to contaminate stormwater discharges. In Region V, the EPA found that K061 waste at minimills often remained in baghouses and was never collected and managed. In part because of these continuing problems, in August of 2000, EPA’s Office of Regulatory Enforcement invited 41 minimills to participate in a voluntary audit and self-disclosure initiative. Companies had until February of 2001 to participate in the audit program. In summary, in the early 1990s, most K061 in the U.S. was managed at a single facility in Pennsylvania, although some southern minimills sent their waste to Mexico. Since that time, the market has become more crowded. An important regulatory decision by the EPA to allow disposal of the waste, as well as new technology implemented both at the Pennsylvania, Mexico and at other facilities, including some implemented at the plant level itself have led to the waste being turned into a variety of products, some still in the exploratory phase. Enforcement activities taken in the late 1990s forced minimills to more properly manage their wastes, increasing the total amount “available” for off-site management. Similarly, enforcement activities and competition from disposal facilities and other recyclers forced zinc recyclers in Pennsylvania and Mexico to also improve their operations and management of the waste.
4.Other Exports of Waste To Mexico: Information gaps in Manifest Data A U.S. manifest is required for all imports or exports of hazardous wastes from or to the U.S. subject to manifesting requirements. Nevertheless, it is important to note that some wastes considered hazardous do not require a manifest. These include so-called universal wastes, lead acid batteries going for recycling and possibly some electronic wastes.
33 U.S. EPA, Enforcement Alert: U.S. EPA Encourages Iron and Steel “Minimills” to Self Audits to Address Noncompliance with Environmental Requirements, December 2000.
The Generation and Management of Hazardous Wastes and Transboundary Hazardous Waste Shipments between Mexico, Canada and the United States Since NAFTA: A 2004 Update
30
In 1995, the U.S. EPA promulgated the Universal Waste Rule whose purpose was to reduce the amount of hazardous wastes entering the municipal solid waste stream, encourage recycling and proper disposal of certain wastes and reduce the regulatory burden. There were four types of waste considered universal under the 1995 rules (with subsequent adoptions), including thermostats containing mercury, some, but not all, batteries with hazardous characteristics, some types of lamps and certain types of agricultural pesticides. What does the universal waste rule do? In simple terms, it exempts some hazardous wastes that are generated by a large number of businesses but in small quantities from having to meet some reporting, transporting and handling requirements under RCRA, although the final disposal and recycling rules generally still apply. For example, under the rule, small quantity generators of nickel and cadmium batteries, or other batteries considered hazardous, may sort, mix, discharge, regenerate, disassemble and even remove the eloctrolyte from batteries and even transport battery waste in a non-hazardous transporter as long as the batteries are held in a contained, structurally sound container. In addition to these federal rules, each state with authority to implement RCRA has developed their own universal waste rules, which in many cases are more expansive than the federal Universal Waste Rule. For example, in 2002 California proposed and then expanded the state universal waste rules to include: Cathode ray tube materials, Consumer electronic devices, Aerosol cans, and Mercury-containing motor vehicle light switches34 Under the California Universal Waste Rules, individuals disposing of household waste and conditionally exempt small quantity generators of these wastes are exempt until February of 2006. However, under the rules, these exemptions do not apply to CRTs, aerosal cans and universal wastes containing mercury which must be handled as universal wastes even by households. Rules for the recycling and disposal of batteries are complicated. For example, in 1985, the EPA exempted spent lead-acid batteries from hazardous waste management requirements when they are handled by retailers, wholesalers, local service stations, collected and stored and transported, and also exempted spent lead-acid batteries from hazardous waste management requirements when they are returned to a battery manufacturer for regeneration. In 1995, with the Universal Waste Rule, this last exemption – the regeneration at a battery manufacturer – was temporarily removed. However, additional clarification in 1998 again made most types of regeneration at battery manufacturers exempt from hazardous waste management requirements. Currently, LAB waste can be managed under the“Universal Waste Rules” ,under 40 CFR 266.80, Subpart G or can be exempt from RCRA altogether. CFR Chapter 266 exempts LAB from hazardous waste management rules if they are regenerated, as well as exempting those generating, collecting or transporting the batteries. Essentially, only those reclaiming the batteries or storing them before reclamation are required to meet certain hazardous waste rules. Even so, various regulations involving waste analysis and reporting are relaxed considerably.35 While EPA credits these rules with leading to the regeneration, reclamation and recycling of some 90 percent of spent LABs, there has been a loss of information on the actual amounts transported and reclaimed. The 1995 Universal Waste Rules were also applied to rechargeable nickel-cadmium batteries, silver button batteries, mercury batteries, small sealed lead acid batteries such as burglar alarms, most alkaline batteries, carbon-zinc batteries and other batteries that exhibit a characteristic of hazardous waste. Then in May of 1996, President Clinton signed the Mercury-containing and Rechargeable Battery Management Act. The Act established national, uniform labeling
34 California Department of Toxic Substances Control, Managing Universal Waste in California, June 2003. 35 40 CFR Part 266.80 Subpart G.

The Generation and Management of Hazardous Wastes and Transboundary Hazardous Waste Shipments between Mexico, Canada and the United States Since NAFTA: A 2004 Update
31
requirements for regulated batteries and rechargeable consumer products, phased out certain types of mercury batteries and established a public education campaign on recycling batteries. The law also made the universal waste rules a national standard for battery wastes.36
5. Exports of Universal Wastes and LAB Under the Universal Waste Rules, any exporter of waste to Mexico or Canada or any other non-OECD country must comply with basic exporter requirements, including compliance with EPA’s Acknowledgement of Consent provisions.37 In addition, any exporter who is the primary exporter – actually transports the waste to a foreign destination – must comply with Section 273.56 of the Code of Federal Regulations which require an annual report to the EPA by March 1 of each year detailing the exports. Thus, even though an individual manifest is not required for universal wastes everytime they are exported, there are still Acknowledgement of Consent provisions and annual export reports which must be filed. This means there should be some information about exports of universal wastes to Mexico and Canada in the EPA’s data system (although there doesn’t appear to be any going to Mexico). If lead acid batteries are being managed as a universal waste, then these requirements would also apply. Nonetheless, it appears the generators and collectors of LABs which choose to operate under 40 CFR 266.80 (subpart g) would not be subject to most export notification requirements (though they still might be subject to Mexican and Canadian requirements). In essence, this means there could be a substantial amount of exports of LABs and some other wastes which do not require manifesting and which also are not captured by either the Acknowledgement of Consent or export summary provisions. Basically, if LAB waste was managed as universal waste it would require an AOC, but if it were managed under 40 CFR 266.80, it would not. However, there is wide knowledge that a considerable amount of lead acid batteries does go to Mexico for recycling. The U.S. has information on the dollar value of lead acid batteries going to Mexico. A conversion factor done by a trade magazine suggests that some 400 to 600 truckloads a month of lead acid batteries -- or some 1,900 metric tons --are sent to Mexico. During the mid-1990s a significant amount of this total went to Acumuladores Mexicanos, near Mexico City. However, in 1998, this secondary lead smelting operation closed.38 Data from the Mexican government suggests that the volume of lead acid batteries authorized for importation has increased over time, from some 21,000 tons in 1996 to over 100,000 tons in 2002 (see section III). The lack of information on these exports to Mexico in U.S. databases, including both the Biennial Reporting System as well as the Annual Export Reports from primary exporters, is a significant data gap with regulatory implications. A number of secondary lead smelters in Mexico have had serious environmental and public health problems, including Metales y Derivados, which resulted in an Article 14 and 15 citizen submission process and preparation of a factual record. Given the existence of such problems, better control and understanding of exports should be a priority for both U.S. and Mexican environmental regulators.
36 U.S. EPA, The Mercury-Containing and Rechargeable Battery Management Act: A Guide, 1997. 37 40 CFR 273.20 and 40 CFR 273.40. 38 Edward Worden, “Lead Battery Exports Climb 62%,” American Metal Market, May 7,1998.

The Generation and Management of Hazardous Wastes and Transboundary Hazardous Waste Shipments between Mexico, Canada and the United States Since NAFTA: A 2004 Update
32
6. Management and Regulation of E-Waste.
Electronic waste, or E-waste, is sometimes considered hazardous and sometimes not, depending on who generates it and where it goes (See “What is E-Waste?”). In the U.S., individuals and conditionally exempt small quantity generators are not required to comply with any RCRA provisions and can throw electronic waste in the garbage for disposal at municipal landfills. Large generators or businesses generating more than a certain amount can not simply throw out electronic waste in a municipal landfill. Nonetheless, through the years, a number of exemptions have been created allowing less control for E-waste. Thus, a processed scrap metal exemption allows circuit boards with a “minimal amount” of mercury and nickel-cadmium or lithium batteries to be exempted as long as the final destination is recycling, while a precious metal exemption allows those circuit boards with more mercury and batteries to also be exempted providing certain conditions are met.39 Finally, computer monitors are also exempt from most RCRA provisions if they are going to a facility for recycling. Because of these exemptions, data on E-waste is largely not captured in the EPA’s BRS data system. In addition, the exemptions also make E-waste largely exempt from export regulations requiring manifests, prior informed consent and the “Acknowledgement of Consent” form. The lack of regulation has led to significant environmental and health impacts in developing countries such as China, as documented in a recent report called “Exporting Harm.” (see “What is E-Waste?”) Still, in some cases, other countries do require manifests and consent forms. Thus, for example, Canada requires consent and manifesting of monitors if the CRTs are broken, but not if they are contained, while most OECD countries do require manifesting and consent of E-waste. In 2002, EPA proposed adding Cathode Ray Tubes from computer and television monitors and a variety of other consumer products containing mercury such as barometers, gauges, sprinkler system contacts and parts of coal conveyor systems to the universal waste list. 40 The EPA estimates that this expansion of universal waste would incentivize the recycling of some 2,400 tons of CRTs (out of approximately 15,400 tons) and some 500 metric tons of mercury-containing products, in the process preventing them from going to either municipal or hazardous waste landfills. Under the proposal intact CRTs being sent for possible reuse would be considered products not waste, even when they are disassembled and the glass sent for recycling (as long as the broken parts are properly labeled and contained). Essentially, the proposed rule lessens the regulatory burden for glass recyclers, lead smelters and generators of CRTs, and also significantly reduces the transportation costs.41 While Universal Waste Rules would require an exporter to provide an annual report of its E-waste universal waste exports, no manifest information would be required. For waste going to Canada and Mexico, an Acknowledgement of Consent form would also be required.
39 40 CFR 261.6 (a) and 40 CFR 266.70. 40 U.S. EPA, More Recycling and Reuse Proposed for Electronic Wastes and Mercury-Containing Equipment, April 2002 (EPA530-F-02-018). 41 Federal Register, “Hazardous Waste Management System: Modification of the Hazardous Waste Program Cathode Ray Tubes and Mercury-Containing Equipment,” June 12, 2002.

The Generation and Management of Hazardous Wastes and Transboundary Hazardous Waste Shipments between Mexico, Canada and the United States Since NAFTA: A 2004 Update
33
While Europe has embraced the concept of “Take-Back” legislation – requiring manufacturers to phase out toxic substances and take back their computers for management and recycling – in the U.S. attempts at the federal level have been stalled in Congress. At the state level, several states have explored the possibility of an electronic “Take-Back” law. Thus far, the only state to pass such a law is California. Nonetheless, the initial proposal – which would have put a fee on manufacturers and required meeting a goal of 50 percent diversion from waste disposal by 2005 – was defeated, and the current law only assesses a $6 to $10 “electronic waste recycling fee” on the sale of new monitors and televisions and requires manufacturers to inform consumers on how to recycle or dispose of their products. The fees will flow to a governmental agency that will allocate funding to organizations in recovering those devices.42 The approved legislation was heavily criticized by the organizations authoring the “Exporting Harm” report for not dealing with the export issue. In essence, they argue that the legislation will continue and perhaps expand the practice of recyclers shipping a significant amount of the waste overseas and does nothing to force manufacturers to design a product with less hazardous materials present.43 In 2002, both California and Massachusetts banned CRT monitors from landfills. Again, however without a take-back program or better regulation of exports, the ban may have the unintended effect of exporting waste to other countries with less developed environmental and safety laws. Most recently, participants in a three-year effort to develop a national take-back program for E-waste known as the National Electronics Stewardship Initiative agreed to draft legislation to create a nationwide program. However, the details of the legislation as well as the financing mechanism to actually implement the program have yet to be developed.44
42 Michael Toffel, “Closing the Loop: Product Take-Back Regulations and Their Strategic Implications,” International Journal of Corporate Sustainability (Vol. 10, Issue 9), October 2003, 2-147. 43 Joe Truini, “Nick of Time: California O.K.s e-waste bill as recall looms,” Waste News, September 29, 2003. 44 Joe Truini, “E-waste Impasse Cleared at Last,” Waste News, February 16, 2004.

The Generation and Management of Hazardous Wastes and Transboundary Hazardous Waste Shipments between Mexico, Canada and the United States Since NAFTA: A 2004 Update
34
What are E-wastes and how are they managed in the U.S.? A growing category of hazardous wastes in the U.S are so-called E-Wastes, or electronic wastes. Consisting mainly of consumer electronic items, E-wastes include television and computer monitors containing Cathode Ray Tubes, computer processing units, microwaves, cell phones, palm pilots, video games and other devices. As computer and television technology improves, older models become obsolete and must be discarded. E-waste does contain hazardous materials such as lead, mercury, hexavalent chromium, brominated flame retardants, and PVC plastics among other materials. At the same time, the computers do contain valuable materials such as paladium, gold and other precious metals, steel, plastics and glass.1 In 1998, as much gold was recovered from E-waste – about 2 million metric tons – as from gold ore and waste.1 Unfortunately, there is not a definitive study estimating the amount of e-waste generated in the U.S. Several studies, however, have come up with pretty good guesses. In 1999, the National Safety Council estimated that some 5 to 7 million tons of E-waste had been generated, and that in 1998 alone, some 20 million computers became obsolete. Studies of the future generation of e-waste vary widely. A 1991 study by H. Scott Matthews and others estimated that by 2005, there would be some 340 million computers sold worldwide, and that 148 million would be landfilled, with only 2 million recycled. Nonetheless, just six years later, Carnegie Mellon predicted that by 2005, a total of 680 million computers will have been sold worldwide, with about 140 million of those destined for recycling, 55 million for landfills and the rest in use or stockpiled. E-waste is generated by three types of users: Individuals, electronic manufacturers who either generate scrap in the production process or who may have models stockpiled that become obsolete, or institutions and businesses which use computers and other electronic devices in bulk and then must upgrade or replace them every few years. Where do these products go? They are stockpiled in individual homes or business, sent to municipal landfills, donated or sold for reuse, or recycled, either in the U.S. or abroad. In 1997, the EPA estimated that some 3.2 million tons of E-waste went to municipal landfills, some 5 percent of total landfill space. An estimated 70 percent of heavy metals found in municipal landfills come from E-waste, offering the possibility and probability of groundwater contamination. In 2001, both Massachusetts and California banned the disposal of CRTs in municipal landfills because of their hazardous nature. Only some three percent of computers discarded by their users are re-used. The 1999 study estimated that some 50,000 tons a year of E-waste were being recycled a year, a quarter of which consisted of glass from cathode ray tube (CRT) monitors. Overall, about 11 percent were recycled, either in the U.S. or abroad. About 75 percent of this total comes from direct electronic manufacturers or large corporations replacing their computers, while individuals and small businesses only provide some 25 percent. And where is this waste recycled? The same 1999 study estimated that some 1.8 million CRT monitors were collected in the United States, but more than 60 percent were exported abroad for this purpose. While a significant amount of these exports go to Canada to Noranda’s smelters, the majority appear to go the Asian market. In its well documented report “Exporting Harm”, the Basel Action Network and Silicon Valley Toxics Coalition estimated that between 50 and 80 percent of all E-waste collected by recyclers in the U.S actually ends up in China, Pakistan, Taiwan, India or other countries. The reason is simple. Exporters make a profit both by taking the waste and reselling it in Asia, where lax or non-existent environmental regulations allow for recycling by workers with little or no protection as they pick through scraps and heaps of waste for a few valuable commodities. In some cases, E-waste in Asia is simply left in rice fields, river valleys and villages once the valuable commodities are extracted from the waste, or actually burned, releasing dangerous toxins. Numerous environmental and public health problems have been cited.1 Noranda is the largest recycler of e-waste in North America, receiving some 50,000 tons per year of scrap e-waste in 1999, used principally to recover precious metals as feed for its smelters.1 Noranda has three facilities –in California, Rhode Island and Tennessee – dedicated to receiving, separating and recycling components of E-waste. In 1996, Noranda entered into an agreement with Hewlett-Packard to provide obsolete PCs and other scrap metals to Noranda, which separates and resells the materials at its Roseville, California plant, sending the valuable metals to its smelters in Canada. Broken glass is recovered from CRT monitors and sent to Noranda’s lead smelter in New Brunswick, while whole monitors are sent to its copper smelter in Quebec for copper, lead and silica contained in the monitors. There is relatively little information about E-waste shipments to Mexico. At border cities in California and Texas, used computer equipment are often purchased at auctions and then taken for resale to Mexico. According to press reports, what is never sold is then transferred to municipal landfills. In addition, computers donated by non-profit organizations also eventually find their way into municipal landfills in Mexico.1 A number of companies in Mexico take old computers and refurbish them for resale either in Mexico or the U.S. It should also be noted that with internet sales of computers increasing, it is likely that computers made in the U.S. are shipped to Mexico and later discarded. Finally, a recent regulatory change allows used computers to be imported into Mexico duty-free. Some have suggested that this could lead to dumping of computers known not to work in Mexico, and/or shipping of computers that will soon be discarded in Mexico because the programs are not compatible with Mexican programs.

The Generation and Management of Hazardous Wastes and Transboundary Hazardous Waste Shipments between Mexico, Canada and the United States Since NAFTA: A 2004 Update
35
7. Enforcement at the Borders: Screening for hazardous wastes? While it is beyond the scope of the present report to include a full assessment of enforcement trends of RCRA, it is clear that there has been limited attention on enforcement of import and export regulations either by EPA or the states. Enforcement of RCRA by EPA and designated states of generators, transporters and TSD facilities appears to have remained relatively stable over the last several fiscal years. Thus, in FY 2001, the EPA assessed $1.6 million in criminal penalties, $25.9 million in civil penalties and $5 million in administrative penalties, while in FY 2002, EPA assessed $2.6 million in criminal penalties, $11.1 million in civil penalties and $5.6 million in administrative penalties under RCRA.45 Overall, nationally the numbers of inspections has gone down between FY 99 and FY 02, while the use of audit policy and disclosure under the audit policy has increased. Part of this was the already-mentioned corporate-wide agreements with the iron and steel sectors, which included the steel mini-mills already discussed in a previous section. These trends are also revealed when looking at rates of inspection, compliance and the number of formal enforcement actions at the national and regional level of Treatment, Storage and Disposal Facilities. While comparing the numbers between years is difficult because of changing definitions of TSDFs, the chart below appears to indicate that the number of inspections, the percentage of facilities in significant non-compliance and the number of formal enforcement actions declined when comparing the FY 1997-1999 period with the FY 2000-2002 three-year period. The numbers also seem to suggest a more aggressive enforcement regime in the northern border region as opposed to the southern border region of TSDFs in terms of both inspections and formal enforcement actions. Of course, comparing periods is always difficult without much greater detail. Thus, if the number of formal enforcement actions against TSDFs declined from 75 from FY 1997-1999 to 59 in the FY 2000-2002 period in the U.S. –Mexico Border States, does this indicate less enforcement or greater compliance? The numbers also reflect the greater reliance in many large states such as Texas on audit disclosure and voluntary clean-up rather than traditional enforcement. More worrisome than this possible decline in inspections and enforcement against TSDFs is the lack of a large-scale RCRA enforcement presence at the Ports of Entry. In the late 1990s, EPA placed greater emphasis on enforcing RCRA transportation regulations on hazardous waste imports and exports through financial support to state programs and use of the HAZTRAKS database. Utilizing HAZTRAKS, EPA filed 17 administrative enforcement actions against transport and TSD companies that did not comply with export or import regulations between 1996 and 1998, with penalties totaling $482,000. In 2000, the U.S. EPA fined a Mexican maquiladora facility for the first time – Maquiladora Chambers Belt Co. – as well as its parent company and a storage facility a total of $50,000 for illegally shipping hazardous wastes to facilities not authorized to receive the waste, as well as improperly labeling, packaging and completing the manifests for the waste. 45 U.S. EPA, Dollar Value of FY 2001 and 2002 EPA Enforcement Actions by Statute, May 2003.
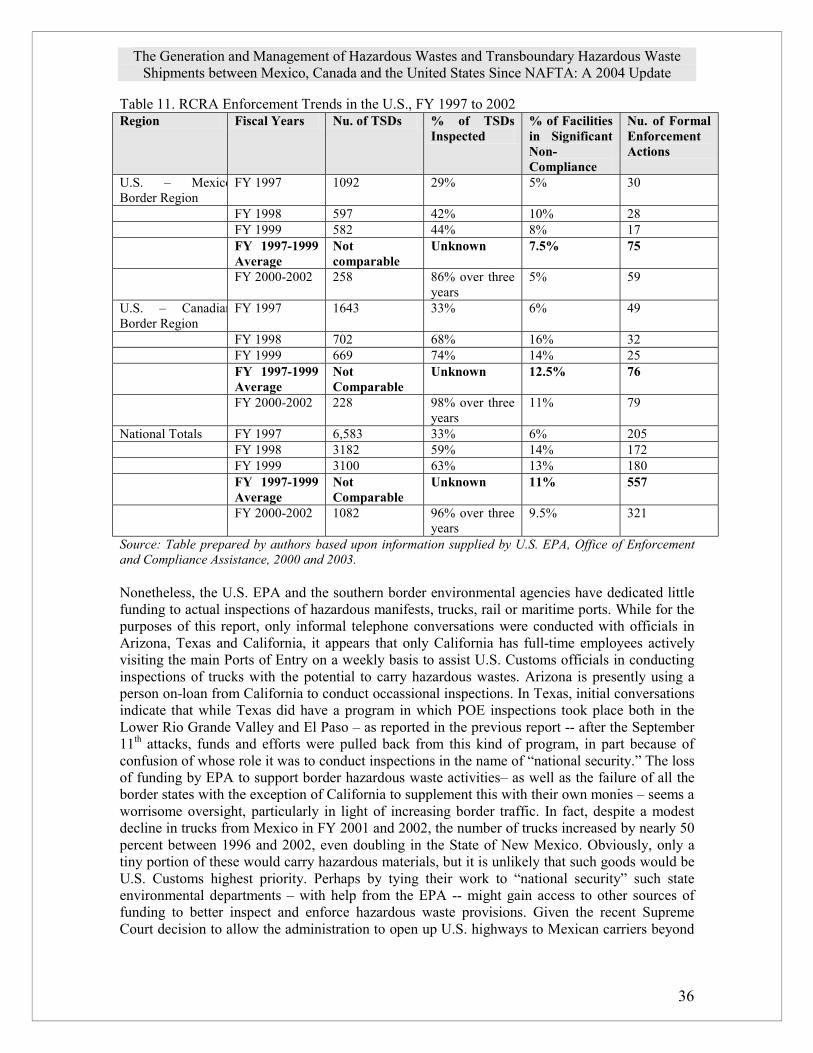
The Generation and Management of Hazardous Wastes and Transboundary Hazardous Waste Shipments between Mexico, Canada and the United States Since NAFTA: A 2004 Update
36
Table 11. RCRA Enforcement Trends in the U.S., FY 1997 to 2002 Region Fiscal Years Nu. of TSDs % of TSDs
Inspected % of Facilities in Significant Non-Compliance
Nu. of Formal Enforcement Actions
U.S. – MexicoBorder Region
FY 1997 1092 29% 5% 30
FY 1998 597 42% 10% 28 FY 1999 582 44% 8% 17 FY 1997-1999
Average Not comparable
Unknown 7.5% 75
FY 2000-2002 258 86% over three years
5% 59
U.S. – CanadianBorder Region
FY 1997 1643 33% 6% 49
FY 1998 702 68% 16% 32 FY 1999 669 74% 14% 25 FY 1997-1999
Average Not Comparable
Unknown 12.5% 76
FY 2000-2002 228 98% over three years
11% 79
National Totals FY 1997 6,583 33% 6% 205 FY 1998 3182 59% 14% 172 FY 1999 3100 63% 13% 180 FY 1997-1999
Average Not Comparable
Unknown 11% 557
FY 2000-2002 1082 96% over three years
9.5% 321
Source: Table prepared by authors based upon information supplied by U.S. EPA, Office of Enforcement and Compliance Assistance, 2000 and 2003. Nonetheless, the U.S. EPA and the southern border environmental agencies have dedicated little funding to actual inspections of hazardous manifests, trucks, rail or maritime ports. While for the purposes of this report, only informal telephone conversations were conducted with officials in Arizona, Texas and California, it appears that only California has full-time employees actively visiting the main Ports of Entry on a weekly basis to assist U.S. Customs officials in conducting inspections of trucks with the potential to carry hazardous wastes. Arizona is presently using a person on-loan from California to conduct occassional inspections. In Texas, initial conversations indicate that while Texas did have a program in which POE inspections took place both in the Lower Rio Grande Valley and El Paso – as reported in the previous report -- after the September 11th attacks, funds and efforts were pulled back from this kind of program, in part because of confusion of whose role it was to conduct inspections in the name of “national security.” The loss of funding by EPA to support border hazardous waste activities– as well as the failure of all the border states with the exception of California to supplement this with their own monies – seems a worrisome oversight, particularly in light of increasing border traffic. In fact, despite a modest decline in trucks from Mexico in FY 2001 and 2002, the number of trucks increased by nearly 50 percent between 1996 and 2002, even doubling in the State of New Mexico. Obviously, only a tiny portion of these would carry hazardous materials, but it is unlikely that such goods would be U.S. Customs highest priority. Perhaps by tying their work to “national security” such state environmental departments – with help from the EPA -- might gain access to other sources of funding to better inspect and enforce hazardous waste provisions. Given the recent Supreme Court decision to allow the administration to open up U.S. highways to Mexican carriers beyond

The Generation and Management of Hazardous Wastes and Transboundary Hazardous Waste Shipments between Mexico, Canada and the United States Since NAFTA: A 2004 Update
37
the 20-mile commercial zone, proper inspection and enforcement of RCRA rules would seem imperative.46 Table 12. Total Trucks Entering U.S. on U.S.-Mexico Border, 1996-2002
PORTS 1996 1997 1998 1999 2000
2001
2002
1996-2002 Chang
Brownsville 224,537 238,175 273,087 294,938 311,808 255,231 252,704 12.54%
Del Rio 39,107 43,530 50,949 58,881 61,018 59,286 71,052 81.69%
Eagle Pass 54,269 68,385 85,974 98,755 107,540 100,983 90,580 66.91%
El Paso 539,650 596,538 591,258 657,664 725,064 656,257 700,235 29.76%
Fabens 141 178 181 191 198 147 3 -97.87%
Hidalgo/Pharr 198,260 225,337 261,322 62,482 367,217 367,991 387,157 95.28%
Laredo 899,754 1,162,419 1,340,653 1,455,597 1,502,978 1,419,165 1,433,954 59.37%
Presidio 2,987 3,823 6,683 8,370 9,051 7,562 7,028 135.29%
Progreso 21,978 17,963 17,298 17,800 11,401 16,649 24,834 12.99%
Rio Grande City 11,937 16,867 18,658 20,103 22,793 26,391 25,436 113.09%
Roma 12,630 12,019 13,140 15,753 14,551 12,141 10,845 -14.13%
Texas Total 2,005,250 2,385,234 2,659,203 2,690,534 3,133,619 2,921,803 3,003,828 49.80%
Columbus 2,426 1,997 4,004 5,189 4,892 4,239 4,452 83.51%
Santa Teresa 13,611 31,788 31,093 28,294 31,018 30,612 28,491 109.32% New Mexico Total 16,037 33,785 35,097 33,483
35,910
34,851
32,943
105.42%
Douglas 34,585 41,802 35,561 33,288 32,788 34,054 24,480 -29.22%
Lukeville 2,766 3,254 3,723 4,355 3,887 4,271 2,235 -19.20%
Naco 5,610 6,578 7,650 8,126 8,239 9,976 4,983 -11.18%
Nogales 225,274 236,425 256,494 255,412 258,201 251,474 241,785 7.33%
San Luis 44,377 45,175 42,472 39,974 41,522 39,908 37,847 -14.71%
Sasabe 1,512 1,393 1,844 2,381 2,775 2,215 2,044 35.19%
Arizona Total 314,124 334,627 347,744 343,536 347,466
341,898
313,374
-0.24%
Andrade 3,935 3,078 2,137 2,072 1,578 1,727 1,899 -51.74%
Calexico 169,403 190,160 222,105 250,083 281,032 259,174 269,412 59.04%
Otay Mesa 475,427 558,383 599,001 638,210 683,703 700,453 725,710 52.64%
San Isidro 0 0 0 0 46,635 0 0 0.00%
Tecate 45,932 64,262 57,914 59,647 61,707 62,243 57,756 25.74%
California Total 694,697 815,883 881,157 950,012 1,028,020 1,023,597 1,054,777 51.83%
GRAND TOTAL 3,030,108 3,569,529 3,923,201 4,017,565 4,545,015
4,322,149
4,404,922
45.37%
Source: U.S. Customs Service, Various Divisions, 2003. C. Summary Hazardous waste generation in the U.S. appears to have leveled off between 1997 and 2001. At the same time, perhaps due to more restrictive standards on treatment, more of this waste was sent off-site, in particular to landfills, incinerators and cement kilns. There appears to have been
46 Supreme Court of the United States, 541 U.S. No. 03-358, Department of Transportation et. Al., Petitioners, v Public Citizen et al., June 7, 2004.

The Generation and Management of Hazardous Wastes and Transboundary Hazardous Waste Shipments between Mexico, Canada and the United States Since NAFTA: A 2004 Update
38
further consolidation of the commercial waste management industry, and several incinerators and landfills closed, as those remaining expanded their receipt of hazardous wastes. Unfortunately, it is unclear from U.S. data how much waste was exported or imported due to the lack of a comprehensive system for tracking imports and exports. However, data from the Biennial Reporting System on K061 waste – electric arc furnace dust from the recycled steel industry -- suggest that exports of K061 waste to Mexico increased between 1993 and 1999. In 2001, there appeared to be a decline in exports of K061 waste, mainly due to a reduction in the amount of K061 waste being sent off-site as the steel industry began to recycle the waste on-site or perhaps due to a slight decline in production during the beginning of the recession. However, annual export data from the U.S. EPA suggest a near doubling of exports of K061 in 2002. There is, however, a lack of information on some waste streams that may also be exported to Mexico, including Lead Acid Batteries, Universal Wastes like batteries and lamps, and E-waste. Initial analysis of annual primary exporter reports –still on-going -- has not provided any information on these waste streams. While again import information is incomplete, information from HAZTRAKS indicates a slight increase in imports of hazardous wastes between 1999 and 2002. However, due in part to its numerous defects, funding for HAZTRAKS was discontinued in 2003. While this report does not purport to conduct a full-scale analysis of enforcement data, it appears that EPA and state officials – particularly along the U.S. – Mexico border – conducted less direct inspections and enforcement actions against TSDFs in the last three years than in the late 1990s. Part of this may reflect a trend toward compliance assistance, although budgetary issues are also a potential explanation. Perhaps of greater concern is the lack of a comprehensive RCRA border inspection regime at the Ports of Entry and warehouses, particularly given U.S. security concerns. After a discussion of waste generation, management and shipment trends in Mexico, Section V will analyze possible reasons for the increase of exports and imports of hazardous waste across the U.S. – Mexico border.

The Generation and Management of Hazardous Wastes and Transboundary Hazardous Waste Shipments between Mexico, Canada and the United States Since NAFTA: A 2004 Update
39
IV. Changes in Mexican Generation, Management and Waste Shipments Since 2000 A. Overview and Introduction
The reduction in the generation of hazardous wastes and the proper and safe management of these wastes should be a major concern for all nations. Hazardous wastes are a direct result of the industrial, commercial and population development and growth – people after all consume the products which produce the hazardous wastes. At times, hazardous waste generation is aggravated by the international commitments of trade and other agreements. For countries like Mexico still “in development,” the problems associated with hazardous wastes are real, due to its high level of poverty, lack of experience in a sustainable development culture, and a relatively meager budget dedicated to environmental protection; and finally, the lack of a state-led strategy which results in policies to reduce hazardous waste generation at the source.
At the same time, institutions such as the Commission for Environmental Cooperation (CEC) have made continent-wide efforts to increase protection and rules to better manage and reduce hazardous wastes. While Mexico is a participant in these efforts, this participation is not only to protect human health and the environment but also to meet obligations made under the rules of the North American Free Trade Agreement (NAFTA). In essence, Mexico is agreeing to participate in these efforts in return for the market access and investment which has flowed from the commercial agreement.
Just what are the concrete problems facing Mexico in terms of hazardous wastes and hazardous materials? Even Mexican authorities recognize lapses in terms of environmental rules and standards and the absence of continuity in an environmental policy on management.
Among the principle obstacles to develop an integrated waste management policy are: lack of a precise and accurate waste inventory; lack of a methodology to assess the actual or potential impacts on human health and the environment associated with different wastes and management methods; and an insufficient, inadequate and obsolete , and poorly distributed hazardous waste management infrastructure. (Authors’ Translation. National Program for the Environment and Natural Resources, Programa Nacional de Medio Ambiente y Recursos Naturales 2001-2006)
Mexico still lacks a sufficiently clear and strict legislation. The lack of accurate, obligatory and public inventories and registries, as well as the lack of contaminant and toxic measurements by the industry itself has led to general public, governmental and even industrial ignorance on the real levels of environmental contamination and dangers to public health. “There hasn’t been instruments to promote the application of clean technologies that incentivize modernization of productive sectors, nor sufficient compensation for those providing environmental services” (Authors translation. National Program for the Environment and Natural Resources, 2001-2006)
Another element that complicates the environmentally sound management of hazardous wastes is the economic valorization of these wastes. The fact that they are considered a good or product can weaken efforts to minimize their generation and promote cleaner technologies. This valorization of wastes has fomented in the case of Mexico the incineration and combustion of wastes as alternative fuels in the cement industry without a full consideration of the possible impacts and costs of that combustion.

The Generation and Management of Hazardous Wastes and Transboundary Hazardous Waste Shipments between Mexico, Canada and the United States Since NAFTA: A 2004 Update
40
A new hazardous waste law (“General Law for the Prevention and Integral Management of Wastes” Ley General para la Prevención y Gestión Integral de los Residuos”approved October 8, 2003 and entering in force on January 6, 2004) promotes recycling and incineration as environmental protection mechanisms, rather than establishing strategies at the point of generation and in the promotion of cleaner technologies. It continues the obsolete focus on end-of-pipe technologies which clean contamination after it has already been generated.. What is needed is to prevent pollution and reduce hazardous waste generation. The new law also impedes fulfilling the Stockholm Convention, an international tool ratified by Mexico and Canada but not the U.S, since it promotes the incineration of hazardous wastes in cement kilns (known as “energy recycling”), which generate dioxins, furans and other toxic emissions, including some that are carcinogenic. Therefore, the objectives of the Convention to protect human health and the environment from Persistent Organic Pollutants (POPs) are contradicted by the new law and by current waste management practices in Mexico.
In addition, the new General Waste Law allows maquiladoras to treat the hazardous waste they generate within Mexico if it is recycled, rather than exporting it to the U.S., as had previously been the requirement. In addition, there exists a greater possibility and incentive for the Maquiladora Export Industry to nationalize, which in terms of hazardous waste means they would no longer be required to return their hazardous wastes generated as a result of imported inputs to the country of origin of those inputs, namely the United States. This would also increase the amount of waste needing treatment in Mexico.
Still, the new General Waste Law does create a clearer responsibility on generators of hazardous waste to clean up contaminated sites and be responsible for hazardous products, although the details of these measures still must be worked out. Potentially, Mexico could begin a smaller scale Superfund program to clean up the dozens of abandoned hazardous waste sites. In addition, the regulations governing the obligatory RETC – pollutant release and transfer registry – recently published in June of 2004 will eventually lead to a publicly-accessible database of toxics and hazardous waste generation, although again the details have not been established.
Mexico needs to dedicate more resources and efforts to give priority to environmental and public health programs, as well as poverty reduction. Without this, it will be difficult to move toward the creation and implementation of sustainable policies in the generation and management of hazardous wastes.. The table below shows that the increase in Mexico’s environmental protection budget was small, of approximately 3.14 percent between 2001 and 2002. While the budget for 2003 is higher – about 17.18 percent overall – ($17,404,217,059.00 pesos), the 48 percent budget cut for the Subsecretary of Environmental Protection and Management (Subsecretaría de Gestión para la Protección Ambiental), responsible for the policy development for hazardous wastes, is worrisome.

The Generation and Management of Hazardous Wastes and Transboundary Hazardous Waste Shipments between Mexico, Canada and the United States Since NAFTA: A 2004 Update
41
Table 13. Budget Assigned to SEMARNAT by Administrative Unit, 2001-2002 (pesos) 2001 2002 Administrative Unit Pesos % Pesos % Office of the Secretary and Dependents 304 430 997 2.11 291 283 432 1.96 Federal Delegations 981 969 183 6.82 668 576 820 4.50 Subsecretary of Planning and Environmental Policy (Subsecretaría de Planeación y Política Ambiental)
269 600 141 1.87 214 407 574 1.44
Subsecretary of Environmental Standards (Subsecretaría de Fomento y Normatividad Ambiental2)
0 0.00 45 270 762 0.30
Subsecretary of Environmental Protection and Management (Subsecretaría de Gestión para la Protección Ambiental)3
660 410 391 4.59 344 096 115 2.32
Oficialía Mayor 1 100 420 466 7.64 991 450 907 6.68 National Water Commission (Comisión Nacional del Agua) 9 716 885 681 67.48 9 502 532 393 63.98 Mexican Institute of Water Technology (Instituto Mexicano de Tecnología del Agua)
190 981 204 1.33 203 172 200 1.37
National Ecology Institute (Instituto Nacional de Ecología)4 435 992 397 3.03 226 990 459 1.53 Federal Attorney General for Environmental Protection (Procuraduría Federal de Protección al Ambiente)
554 074 953 3.85 610 454 185 4.11
National Natural Protected Areas Commission (Comisión Nacional de Áreas Naturales Protegidas)
185 693 118 1.29 228 209 653 1.54
National Forestry Commission (Comisión Nacional Forestal)2 0 0.00 1 526 495 500 10.28 Total Budget 14 ,400,458, 531 100 14, 852, 940, 000 100 1 Oficina del C. Secretario, Contraloría Interna, Unidad Coordinadora de Participación Social y Transparencia, Unidad Coordinadora de Asuntos Internacionales, Coordinación General Jurídica, Coordinación General de Comunicación Social, Oficina del C. Coordinador General de Delegaciones, Centro de Educación y Capacitación para el Desarrollo Sustentable. 2 This administrative unit was created with the change in the administration of the SEMARNAT administration. 3 The budget for this subsecretary was reduced as part of its functions were transferred to the National Foerstry Commission (Comisión Nacional Forestal) 4 INE’s budget was reduced when some of its functions were transferred to the Subscretary for the Environmental Protection Management and the General Directorate of Environmental Policy (Subsecretaría de Gestión para la Protección Ambiental and la Dirección General de Política Ambiental e Integración Regional y Sectorial) Note: Only original approved budget shown. Budget cuts during the year are not reflected in this table. Source: Presupuesto de Egresos de la Federación para los Ejercicios Fiscales de los años 2001 y 2002, México. Source: SEMARNAT. Compendio de estadísticas ambientales 2002. Gastos del Sector Público. http://148.233.168.204/estadisticas_2000/compendio_2000/04dim_institucional/04_01_Gasto/index.shtml B. Hazardous Waste Generation
The General Law of Ecological Equilibrium and Environmental Protection (LGEEPA), in Article 3o. XXXII provides the following definition of hazardous wastes:
“All those wastes, in whatever physical state, which by their characteristics are corrosive reactive, explosive, toxic, inflamable or bologically infectious represent a danger for the ecology and environment.”
The specific hazardous wastes considered dangerous are listed in the Mexican Official Standard (NOM) NOM-052-SEMARNAT-93. This standard also contains maximum concentration levels.
More recently, the General Waste Law maintained the definition of hazardous waste, but also allows for a new category of hazardous wastes known as special management wastes. The concept is similar to EPA’s Universal Waste category and is meant to encourage proper management and recycling of the waste without requiring as much actual regulation and

The Generation and Management of Hazardous Wastes and Transboundary Hazardous Waste Shipments between Mexico, Canada and the United States Since NAFTA: A 2004 Update
42
reporting. While SEMARNAT has published proposed regulations for the new General Waste Law for public comment, the detailed standards on how such “special management wastes” will be defined and treated have not been approved.47 Information about hazardous waste generation has gone through several phases.
In 1994, SEMARNAT used hazardous waste generation information from industries in Ontario, Canada involving different industrial sectors and then applied them to Mexico’ s industrial profile.
1999 to 2000. SEMARNAT no longer using these estimates, but based their totals on information contained in manifests and yearly reports provided by companies. For the year 2000 report, the reporting universe included some 30 percent of all industries required to report, meaning information from 70 percent of potential generation is not reflected in the total. However, environmental authorities note that virtually all of these 70 percent firms not reporting are small or medium-sized generators. Until Mexico adopts and implements its obligatory Pollutant Release and Transfer Registry (PRTR or RETC in Spanish), which includes a section on hazardous waste generation, it will be difficult to estimate total hazardous waste generation in Mexico, including information about particular waste streams.
2001 to 2003. As some environmental activities have been devolved to the state level in Mexico, several state governments working with the SEMARNAT delegations have begun publishing information about waste generation, capacity, and management. Unfortunately, while some of this data is available, others is not. It is also unclear to what extent states are using the same methodology. Eventually, all of this data is supposed to be incorporated in a national report, but at the moment it is piecemeal.
Even though there is reported data in 1999 and 2000, and even data in 2002 and 2003 for some states, environmental authorities continue to use the 1994 estimates of 8 million tons as better reflecting the universe of hazardous waste generated in the country.
There does not exist a precise diagnostic on the volume or types of hazardous waste generated. At the same time, many of the generating facilities lack options for the proper treatment of their wastes, particularly small and medium-sized companies. The petrochemical, metal-making, chemical and electric industries, along with mining, are the main generators of industrial and hazardous waste (Authors translation, Programa Nacional de Medio Ambiente y Recursos Naturales 2001-2006).
47 Proyecto de Reglamento de la Ley General para la Prevención y Gestión Integral de los Residuos (Regulations of the LGPIR) was opened to public comment on June 17, 2004. After these regulations are adopted, specific standards governing management of special wastes still may be adopted.

The Generation and Management of Hazardous Wastes and Transboundary Hazardous Waste Shipments between Mexico, Canada and the United States Since NAFTA: A 2004 Update
43
Table 14. Hazardous Waste Generation in Mexico. Year Tons/year Percent Change Facilities reporting
hazardous waste generation (potential universe of 100,000)
1994* 8, 000,000.00
1999 3,183,250.74 -60.20% 12,514
2000 3, 705,846.21 16.41% 27,280 Note: 1994 numbers are based on estimates “of the annual volume of hazardous waste generation in the country, using as a reference sectoral estimates made in Ontario, Canada, assuming that Mexican firms in the same sectors generate a similar amount” (Dirección General de Gestión Integral de Materiales y Actividades Riesgosas. SENARNAT). For 1999 and 2000, the numbers are based on reporting mechanisms such as manifests and annual generation and receiving reports and environmental audit information from PROFEPA. Sources: Table prepared by authors from several sources. 1994: SEMARNAP. Programa para la minimización y manejo integral de residuos industriales peligrosos en México. 1996-2000. INE-SEMARNAP. México. 1996. 1999: SEMARNAP. Promoción de la minimización y manejo integral de los residuos peligrosos. INE-SEMARNAP. México. 1999. INE: http://www.ine.gob.mx/ueajei/publicaciones/libros/139/situacion.html?id_pub=139 2000: Instituto Nacional de Ecología, Julio 2000. http://148.233.168.204/dgmic/rpaar/rp/volumen/volumen.shtml

The Generation and Management of Hazardous Wastes and Transboundary Hazardous Waste Shipments between Mexico, Canada and the United States Since NAFTA: A 2004 Update
44
Table 15. Estimated (1994) and Reported (1999 and 2000) Hazardous Waste Generation and Number of Generators By State
1994 1999 2000 SEMARNAT State
Haz. Waste Generation
(tons/yr)
% of national
total
Haz. Waste Generation
(tons/yr)
No. of Facilities
Reporting
Haz. Waste Generation
(tons/yr)
No. of Facilities
Reporting
Aguascalientes 65,000.00 0.81 7,198.70 410 9,554.77 608
Baja California 160,000.00 2.00 29,508.47 75 33,523.00 2,359
Baja California Sur 10,000.00 0.13 107.50 124 107.50 124
Campeche 12,000.00 0.15 50,025.05 183 58,501.91 183
Coahuila 300,000.00 3.75 2,359.34 1,020 2,359.34 1,020
Colima 15,000.00 0.19 959.44 211 1,697.73 254
Chiapas 60,000.00 0.75 939.20 527 939.20 527
Chihuahua² 210,000.00 2.62 779,223.06 203 3,862.50 2,224
Distrito Federal 1,839,000.00 22.98 270,199.76 1,245 624,995.00 3,955
Durango³ 80,000.00 1.0 264.00 297 976.57 272
Guanajuato 260,000.00 3.25 185,195.28 26 1,148,550.35 1,181
Guerrero 28,000.00 0.35 855,010.21 255 1,282.52 255
Hidalgo 135,000.00 1.68 453.35 14 392,843.47 916
Jalisco (4) 600,000.00 7.50 4,722.72 25 4,722.72 1,686
México 1,415,000.00 17.68 66,310.63 1,225 233,640.00 4,429
Michoacán 120,000.00 1.50 233,680.58 223 233,680.58 223
Morelos 110,000.00 1.37 2,233.91 337 8,315.97 562
Nayarit 40,000.00 0.50 2,389.85 263 2,389.85 263
Nuevo León 800,000.00 10.00 47,788.35 950 253,079.48 1,143
Oaxaca 70,000.00 0.87 60,533.73 131 60,533.73 131
Puebla 245,000.00 3.06 11,200.00 480 11,200.00 480
Querétaro 178,000.00 2.23 10,848.34 387 13,878.91 507
Quintana Roo 8,000.00 0.10 48.68 278 48.68 278
San Luis Potosí 180,000.00 2.25 29,292.40 341 29,292.40 341
Sinaloa 80,000.00 1.00 6,332.07 220 6,332.07 220
Sonora 145,000.00 1.81 4,082.00 545 7,404.50 545
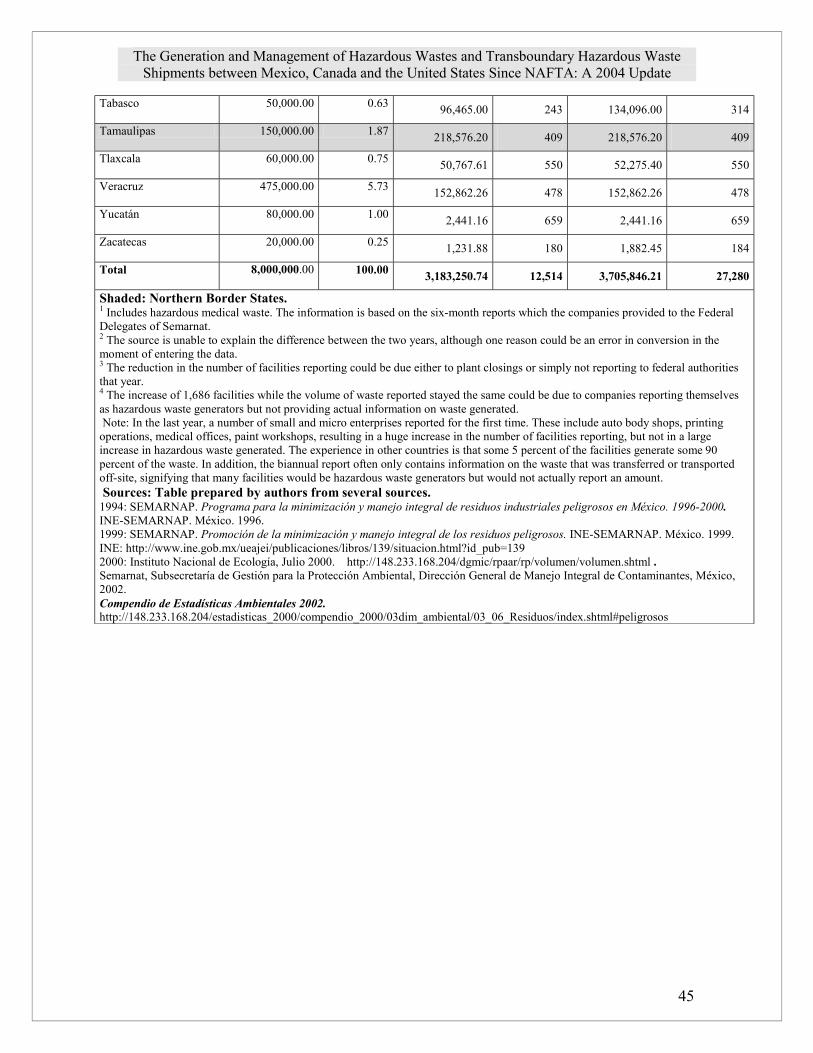
The Generation and Management of Hazardous Wastes and Transboundary Hazardous Waste Shipments between Mexico, Canada and the United States Since NAFTA: A 2004 Update
45
Tabasco 50,000.00 0.63 96,465.00 243 134,096.00 314
Tamaulipas 150,000.00 1.87 218,576.20 409 218,576.20 409
Tlaxcala 60,000.00 0.75 50,767.61 550 52,275.40 550
Veracruz 475,000.00 5.73 152,862.26 478 152,862.26 478
Yucatán 80,000.00 1.00 2,441.16 659 2,441.16 659
Zacatecas 20,000.00 0.25 1,231.88 180 1,882.45 184
Total 8,000,000.00 100.00 3,183,250.74 12,514 3,705,846.21 27,280
Shaded: Northern Border States. 1 Includes hazardous medical waste. The information is based on the six-month reports which the companies provided to the Federal Delegates of Semarnat. 2 The source is unable to explain the difference between the two years, although one reason could be an error in conversion in the moment of entering the data. 3 The reduction in the number of facilities reporting could be due either to plant closings or simply not reporting to federal authorities that year. 4 The increase of 1,686 facilities while the volume of waste reported stayed the same could be due to companies reporting themselves as hazardous waste generators but not providing actual information on waste generated. Note: In the last year, a number of small and micro enterprises reported for the first time. These include auto body shops, printing operations, medical offices, paint workshops, resulting in a huge increase in the number of facilities reporting, but not in a large increase in hazardous waste generated. The experience in other countries is that some 5 percent of the facilities generate some 90 percent of the waste. In addition, the biannual report often only contains information on the waste that was transferred or transported off-site, signifying that many facilities would be hazardous waste generators but would not actually report an amount. Sources: Table prepared by authors from several sources. 1994: SEMARNAP. Programa para la minimización y manejo integral de residuos industriales peligrosos en México. 1996-2000. INE-SEMARNAP. México. 1996. 1999: SEMARNAP. Promoción de la minimización y manejo integral de los residuos peligrosos. INE-SEMARNAP. México. 1999. INE: http://www.ine.gob.mx/ueajei/publicaciones/libros/139/situacion.html?id_pub=139 2000: Instituto Nacional de Ecología, Julio 2000. http://148.233.168.204/dgmic/rpaar/rp/volumen/volumen.shtml . Semarnat, Subsecretaría de Gestión para la Protección Ambiental, Dirección General de Manejo Integral de Contaminantes, México, 2002. Compendio de Estadísticas Ambientales 2002. http://148.233.168.204/estadisticas_2000/compendio_2000/03dim_ambiental/03_06_Residuos/index.shtml#peligrosos

The Generation and Management of Hazardous Wastes and Transboundary Hazardous Waste Shipments between Mexico, Canada and the United States Since NAFTA: A 2004 Update
46
Table 16. Percent Change in 1994 Hazardous Waste Estimate and Reported Hazardous Waste Generation in 1999 and 2000 by State
% Change % Change STATE 1994-2000 1999-2000
Aguascalientes -85.30% 32.72% Baja California -79.04% 13.60% Baja California Sur -98.92% 0% Campeche 387.51% 16.94% Coahuila -99.21% 0% Colima -88.68% 76.95% Chiapas -98.43% 0% Chihuahua -98.16% -95.04% Distrito Federal -66.01% 131.30% Durango -98.77% 269.91% Guanajuato 341.75% 520.18% Guerrero -95.41% -99.84% Hidalgo -190.99% 86,553.46% Jalisco -99.21% 0%
México -83.48% 252.34%
Michoacán 94.73% 0% Morelos -92.44% 272.26% Nayarit -94.02% 0% Nuevo León -68.36 -94.70 Oaxaca -13.52% 0 Puebla -95.42% 0 Querétaro -92.20% 27.93 Quintana Roo -99.39% 0 San Luis Potosí -83.72% 0 Sinaloa -92.08% 0 Sonora -94.89 81.39 Tabasco -168.19% 39.01 Tamaulipas 45.71% 0 Tlaxcala -12.87% 2.96% Veracruz -67.81 0 Yucatán -103.05% 0 Zacatecas -90.58% 52.81% Total -53.67 16.41% Source: Table prepared by authors. 1994: SEMARNAP. Programa para la minimización y manejo integral de residuos industriales peligrosos en México. 1996-2000. INE-SEMARNAP. México. 1996. 1999:SEMARNAP. Promoción de la minimización y manejo integral de los residuos peligrosos. INE-SEMARNAP. México. 1999. INE: http://www.ine.gob.mx/ueajei/publicaciones/libros/139/situacion.html?id_pub=139 2000: Instituto Nacional de Ecología, Julio 2000. http://148.233.168.204/dgmic/rpaar/rp/volumen/volumen.shtml

The Generation and Management of Hazardous Wastes and Transboundary Hazardous Waste Shipments between Mexico, Canada and the United States Since NAFTA: A 2004 Update
47
The previous tables (Tables 14 to 16) produced the following information:
The most nationwide recent information available is 2000. There is public information available for 2001, 2002, and 2003 is available for selected states. Total hazardous waste generation for the available data was the following:
1994: 8,000,000.00 ton/year 1999: 3,183,250.74 ton/year 2000: 3,705,846.21 ton/year
Percent change from one year to another was the following: 1994 –2000 is -53.67%48 1999 – 1999 is 16.41%
In 1999, 12,514 industries reported their generation. In 2000, 27,280 industries reported their generation, an increase of 14,766 industries
reporting, more than a 100 percent increase and 522,595.7 additional tons. SEMARNAT estimates that some 73 percent of all industries that should report their
generation of hazardous waste did not (they estimate a total universe of generators of 100,000); although the majority of these would be small and medium generators of hazardous wastes.
Recently, SEMARNAT has begun to publish hazardous waste data on a state by state basis. Thus, there is some limited information on hazardous waste generation at the state level for the last three years. However, as Table 17 makes clear, the estimates of hazardous waste generation vary widely from previous estimates as well as previous reports. For example, in Zacatecas, while 1994 estimates figured that some 20,000 tons of hazardous waste was generated in the state, and reported levels in 1999 and 2000 reached less than 2,000 tons – less than 2 percent – the state delegation of SEMARNAT reports that in 2003, over 2 million tons of waste was generated by Zacatecas generators. It is unclear if perhaps the first figures only account for waste being sent off-site, while the more recent figure might include – for example – the large amounts of mining waste that are presumably left on-site. Still, the number for Zacatecas and other states now available over the internet point to the confusing nature of Mexican hazardous waste data. A similar example would be the state of Nuevo Leon, which reported some 250,000 tons generated in 2000 and just a year later, nearly one million tons. Clearly, Mexico is still developing a hazardous waste data system.
48 Again, it must be emphasized that 1994 is an estimate and 1999 and 2000 represent reported data.

The Generation and Management of Hazardous Wastes and Transboundary Hazardous Waste Shipments between Mexico, Canada and the United States Since NAFTA: A 2004 Update
48
Table 17. Generation of Hazardous Waste in Selected States, 2000 and 2001-2003.
State 2000 2001 2002 2003
Haz. Waste Generation
(tons/yrs)
No. of Facilities
Haz. Waste Generation
(tons/yrs)
No. of Facilities
Reporting
Haz. Waste
Generation (tons/yrs)
No. of Facilities
Reporting
Haz. Waste
Generation (tons/yrs
No. of Facilities
Reporting
Aguascalientes 9,554.77 608 26,288
910
Coahuila 2,359.34 1,020 51,492 1,771
Chihuahua² 3,862.50 2,224 1,336,514 396
Guanajuato 1,148,550.35
1,181 2,077
Guerrero 1,282.52 255 384.436 378.69 2,239
México 233,640.00
4,429 113,456 1,731.
Nayarit 2,389.85 263 1,950 862
Nuevo León 253,079.48
1,143 998,974.398
1,351 668,444.5 1,724
Puebla 11,200.00 480 950 1,500
San Luis Potosí 29,292.40 341 150,299 21,553.8 554
Sinaloa 6,332.07 220 63,016
Tlaxcala 52,275.40 550 523 573
Zacatecas 1,882.45 184 2,069,882
197
Total, Selected States 1,755,701 12,898 998,974 2,301 1,631,423 7,998 2,851,513 7,059
Source: Table prepared by authors based on numerous sources, including: Aguascalientes:http://carpetas.semarnat.gob.mx/aguascalientes/plannue_impacto_03.shtml Coahuila:http://carpetas.semarnat.gob.mx/coahuila/pagina_web/spa/index.htm Colima:http://carpetas.semarnat.gob.mx/colima/mic.htm#graficas Chihuahua: http://carpetas.semarnat.gob.mx/chihuahua/residuos.shtml Guanajuato:http://carpetas.semarnat.gob.mx/guanajuato/contenido/05_gestion/04_manejo_de_contaminantes/03_residuos/03_residuos.shtml; Guerrero:http://carpetas.semarnat.gob.mx/guerrero/temas_y_contenidos/objetivos/t_residuos.shtml México:http://carpetas.semarnat.gob.mx/edomex/residuos.php Nuevo Leon:http://carpetas.semarnat.gob.mx/nl/industria_est.shtml Puebla:http://carpetas.semarnat.gob.mx/puebla/Residuos%20Peligrosos.htm San Luis Potosí: http://carpetas.semarnat.gob.mx/slp/gestion/residuos/reportes.shtml Sinaloa: http://carpetas.semarnat.gob.mx/sonora/inventario_residuos_peligrosos.shtml Sonora: http://carpetas.semarnat.gob.mx/sonora/inventario_residuos_peligrosos.shtml Zacatecas: http://carpetas.semarnat.gob.mx/zacatecas/medamb/induspelig.shtml

The Generation and Management of Hazardous Wastes and Transboundary Hazardous Waste Shipments between Mexico, Canada and the United States Since NAFTA: A 2004 Update
49
Table 18. Generation of Hazardous Wastes by Border States
1994 1999 2000 STATE Hazardous Waste
Generation (tons/year) Hazardous Waste
Generation (tons/year)
Hazardous Waste Generation (tons/year)
Baja California 160,000 29,508.47 33,523.00 Coahuila 300,000 2,359.34 2,359.34 Chihuahua 210,000 779,223.06 3,862.50 Nuevo León 800,000 47,788.35 253,079.48 Sonora 145,000 4,082.00 7,404.50 Tamaulipas 150,000 218,576.20 218,576.20 TOTAL BORDER STATES
1,765,000 1,081,537.42 518,805.02
Sources: Table prepared by authors. 1994: SEMARNAP. Programa para la minimización y manejo integral de residuos industriales peligrosos en México. 1996-2000. INE-SEMARNAP. México. 1996. 1999:SEMARNAP. Promoción de la minimización y manejo integral de los residuos peligrosos. INE-SEMARNAP. México. 1999. INE: http://www.ine.gob.mx/ueajei/publicaciones/libros/139/situacion.html?id_pub=139 2000: Instituto Nacional de Ecología, Julio 2000. http://148.233.168.204/dgmic/rpaar/rp/volumen/volumen.shtml
Table 19. Percent Change in Estimated(1994) and Reported (1999 and 2000) Generation of Hazardous Wastes in Northern Border States
1994-2000 1999-2000 STATE Percent Change (%) Percent Change (%)
Baja California -79.04% 13.60% Coahuila -99.21% 0% Chihuahua -98.16% -99.50% Nuevo León -68.35% 429.58% Sonora -94.89% 81.39% Tamaulipas 45.71% 0% Northern Border States Total -70.60% -52.03%
Sources: Table prepared by authors. 1994: SEMARNAP. Programa para la minimización y manejo integral de residuos industriales peligrosos en México. 1996-2000. INE-SEMARNAP. México. 1996. 1999:SEMARNAP. Promoción de la minimización y manejo integral de los residuos peligrosos. INE-SEMARNAP. México. 1999. INE: http://www.ine.gob.mx/ueajei/publicaciones/libros/139/situacion.html?id_pub=139 2000: Instituto Nacional de Ecología, Julio 2000. http://148.233.168.204/dgmic/rpaar/rp/volumen/volumen.shtml
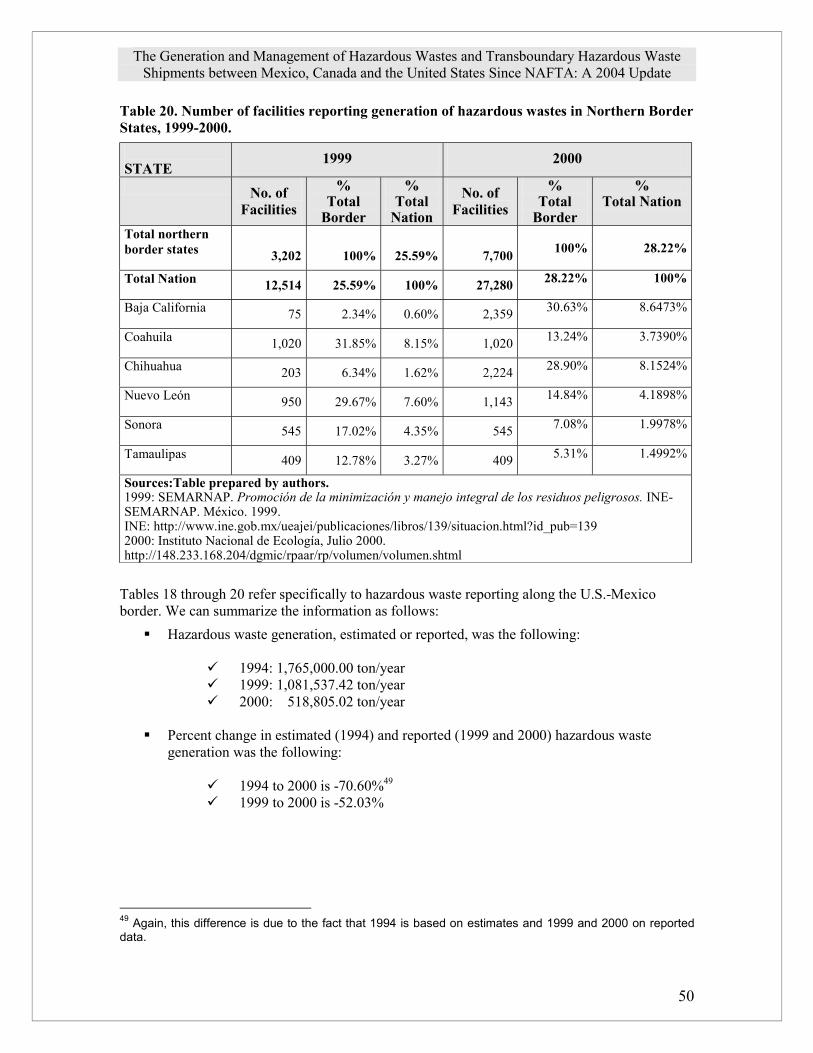
The Generation and Management of Hazardous Wastes and Transboundary Hazardous Waste Shipments between Mexico, Canada and the United States Since NAFTA: A 2004 Update
50
Table 20. Number of facilities reporting generation of hazardous wastes in Northern Border States, 1999-2000. STATE
1999 2000
No. of Facilities
% Total
Border
% Total
Nation
No. of Facilities
% Total
Border
% Total Nation
Total northern border states
3,202
100%
25.59%
7,700
100%
28.22%
Total Nation 12,514 25.59% 100% 27,280 28.22% 100%
Baja California 75 2.34% 0.60% 2,359 30.63% 8.6473%
Coahuila 1,020 31.85% 8.15% 1,020 13.24% 3.7390%
Chihuahua 203 6.34% 1.62% 2,224 28.90% 8.1524%
Nuevo León 950 29.67% 7.60% 1,143 14.84% 4.1898%
Sonora 545 17.02% 4.35% 545 7.08% 1.9978%
Tamaulipas 409 12.78% 3.27% 409 5.31% 1.4992%
Sources:Table prepared by authors. 1999: SEMARNAP. Promoción de la minimización y manejo integral de los residuos peligrosos. INE-SEMARNAP. México. 1999. INE: http://www.ine.gob.mx/ueajei/publicaciones/libros/139/situacion.html?id_pub=139 2000: Instituto Nacional de Ecología, Julio 2000. http://148.233.168.204/dgmic/rpaar/rp/volumen/volumen.shtml
Tables 18 through 20 refer specifically to hazardous waste reporting along the U.S.-Mexico border. We can summarize the information as follows:
Hazardous waste generation, estimated or reported, was the following:
1994: 1,765,000.00 ton/year 1999: 1,081,537.42 ton/year 2000: 518,805.02 ton/year
Percent change in estimated (1994) and reported (1999 and 2000) hazardous waste
generation was the following:
1994 to 2000 is -70.60%49 1999 to 2000 is -52.03%
49 Again, this difference is due to the fact that 1994 is based on estimates and 1999 and 2000 on reported data.
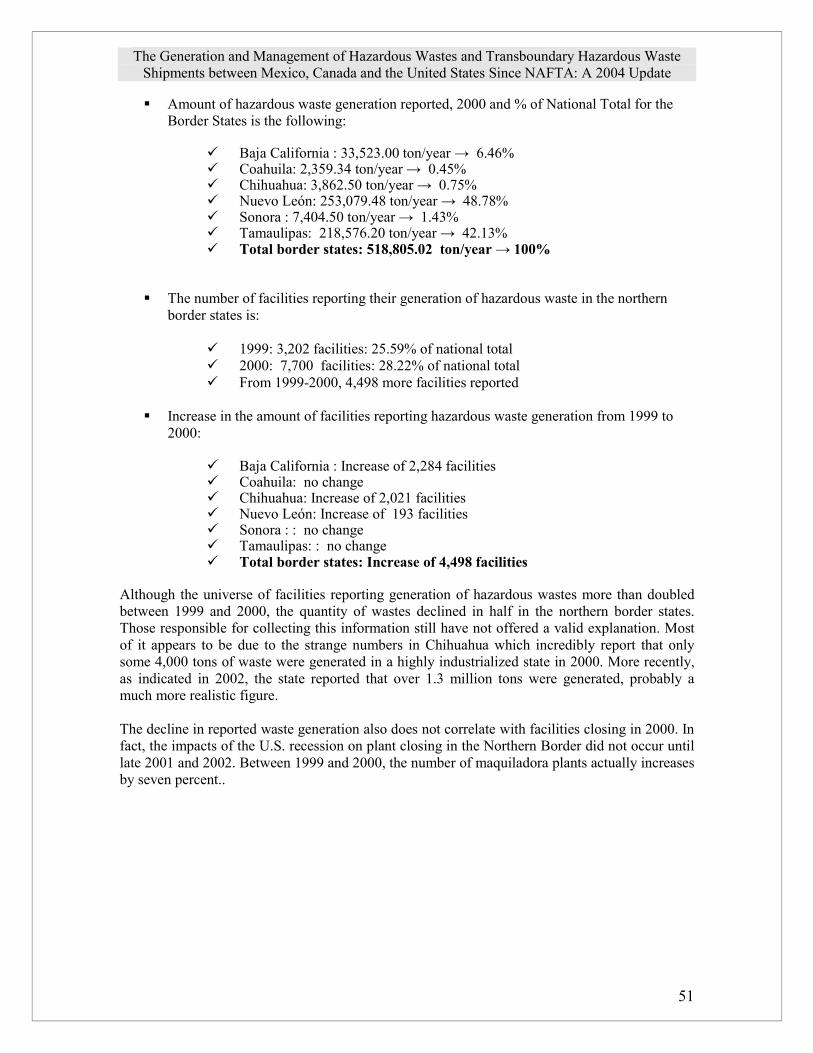
The Generation and Management of Hazardous Wastes and Transboundary Hazardous Waste Shipments between Mexico, Canada and the United States Since NAFTA: A 2004 Update
51
Amount of hazardous waste generation reported, 2000 and % of National Total for the Border States is the following:
Baja California : 33,523.00 ton/year → 6.46% Coahuila: 2,359.34 ton/year → 0.45% Chihuahua: 3,862.50 ton/year → 0.75% Nuevo León: 253,079.48 ton/year → 48.78% Sonora : 7,404.50 ton/year → 1.43% Tamaulipas: 218,576.20 ton/year → 42.13% Total border states: 518,805.02 ton/year → 100%
The number of facilities reporting their generation of hazardous waste in the northern border states is:
1999: 3,202 facilities: 25.59% of national total 2000: 7,700 facilities: 28.22% of national total From 1999-2000, 4,498 more facilities reported
Increase in the amount of facilities reporting hazardous waste generation from 1999 to
2000:
Baja California : Increase of 2,284 facilities Coahuila: no change Chihuahua: Increase of 2,021 facilities Nuevo León: Increase of 193 facilities Sonora : : no change Tamaulipas: : no change Total border states: Increase of 4,498 facilities
Although the universe of facilities reporting generation of hazardous wastes more than doubled between 1999 and 2000, the quantity of wastes declined in half in the northern border states. Those responsible for collecting this information still have not offered a valid explanation. Most of it appears to be due to the strange numbers in Chihuahua which incredibly report that only some 4,000 tons of waste were generated in a highly industrialized state in 2000. More recently, as indicated in 2002, the state reported that over 1.3 million tons were generated, probably a much more realistic figure. The decline in reported waste generation also does not correlate with facilities closing in 2000. In fact, the impacts of the U.S. recession on plant closing in the Northern Border did not occur until late 2001 and 2002. Between 1999 and 2000, the number of maquiladora plants actually increases by seven percent..

The Generation and Management of Hazardous Wastes and Transboundary Hazardous Waste Shipments between Mexico, Canada and the United States Since NAFTA: A 2004 Update
52
Table 21. Active Maquiladora Plants, 1999 to 2003 by State
STATE 1999 2000 2001 2002 2003 (August)
Baja California 1,125 1,218 1,267 1,055 873
Coahuila 272 280 281 258 216
Chihuahua 401 446 447 433 381
Nuevo León 131 156 165 175 178
Sonora 263 2,284 277 210 189
Tamaulipas 360 375 397 402 377
Total Northern Border States
2,588
2,774
2,834
2,533 2,214
National Total 3,297 3,590 3,684 3,251 2,830
Source: Consejo Nacional de la Industria Maquiladora de Exportación. Estadísticas. http://www.cnime.org.mx
By the same token, the manufacturing industry did not suffer losses or experience plant closings until 2001. Thus, overall, there were 5,801 manufacturing facilities in 2000, which fell to 5,507 in 2001. Overall, there were over 33,000 facilities in 2000 under federal regulations and oversight with the potential to be a contaminating industry. All of these figures suggest that it is likely that hazardous waste generation was increasing in the late 1990s and early 2000s. Table 22. Principle sources of contamination, 2000
Sector Number Petrochemical 106 Chemical 2 404 Hazardous Waste Treatment and Service Operators 356 Electric 221 Metal Making 1 404 Petroleum 489 Paint and Dyes 353 Automotive 1 052 Asbestos 30 Cement 261 Lime 153 Cellulose and Paper 499 Glass 183 Hospitals 2 939 Other hazardous waste generators 23 246 Total 33 696 Source: SEMARNAT. Compendio de estadística Ambiental 2002 http://148.233.168.204/estadisticas_2000/compendio_2000/04dim_institucional/04_03_Cumplimiento_normatividad/index.shtml#superficie

The Generation and Management of Hazardous Wastes and Transboundary Hazardous Waste Shipments between Mexico, Canada and the United States Since NAFTA: A 2004 Update
53
Table 23. Imported inputs and Value Added in the Export Maquila Industry, 1999 to 2003 Period Imported Inputs (thousands of pesos
non-adjusted) Value added (thousands of pesos,
non-adjusted) 1999 432, 076, 951 132, 216, 323 2000 505, 147, 039 163, 414, 471 2001 489, 752, 064 180, 034 ,432 2002 628, 518, 721 181,758 ,729 2003 (through May) 45, 787, 431 16, 286, 795 Source: INEGI. Indicadores Regionales de Coyuntura. Estadísticas Económicas. Julio 2003. México. http://fractal.inegi.gob.mx/infoinegi/basico/irc/irc1.pdf C. Hazardous Waste Management, Infrastructure.
“Only an estimated 10 percent of the total amount of hazardous wastes generated in the country receive adequate treatment” (Authors’ translation. Programa Nacional de Medio Ambiente y Recursos Naturales 2001-2006. Suelos).
Mexico does not have any publicly accessible information on hazardous waste generation after 2000 by industrial sector. Nor do there exist – at least for the public – facility-level information as the information is aggregated by state. Information on reuse, recycling, energy recovery, landfilling and incineration refer to installed capacity and not to the actual amount of waste managed by facility, either on or off-site. There is currently no way – other than through perhaps surveys – to know when, how and in what manner hazardous wastes are being managed in Mexico. In fact, at times, different governmental entities – such as SEMARNAT and INEGI -- provide different information on capacity and hazardous waste treatment and generation. Table 24. Facilities authorized for industrial hazardous waste management, 1989 -2000.
State
Collection and
Transport
Temporary
Storage
Reuse Recycling
Treatment
Incineration
Landfill/Land
Disposal
Total
Baja California 27 11 0 9 1 0 0 48 Chihuahua 19 6 0 3 1 0 0 29 Coahuila 14 0 0 6 1 0 0 21 Nuevo León 72 15 0 21 8 1 1 118 Sonora 6 4 0 3 0 0 1 14 Tamaulipas 24 10 0 2 7 0 0 43
Total Northern Border States
162 46 0 44 18 1 2 273
Total Nation 320 105 7 140 64 11 4 651 Source: INE-SEMARNAP. Informe Nacional de Emisiones y Transferencia de Contaminantes 1998-1999. Registro de Emisiones y Transferencia de Contaminantes. México. 2000. INEGI: http://www.inegi.gob.mx/est/contenidos/espanol/tematicos/mediano/ent.asp?t=mamb61&c=3771

The Generation and Management of Hazardous Wastes and Transboundary Hazardous Waste Shipments between Mexico, Canada and the United States Since NAFTA: A 2004 Update
54
In the table above, the incineration column does not include the cement plants which burn hazardous wastes in their kilns. Information provided by INE indicates that in 2003 there are only two sites authorized for final disposal/landfilling of hazardous wastes. Nonetheless, only the landfill located in Mina, Nuevo Leon, owned by RIMSA, is authorized to receive hazardous waste from throughout the country. 50 The other landfill – located in Jalisco – is a private landfill for one company’s use.51 Two other landfills which were permitted – the TecMed facility in Sonora and the Metalclad facility in San Luis Potosí-- both of which have been the subject of Chapter 11 Investor Dispute Cases – were shut down by Mexican authorities. The following table provides updated information on the number of facilities authorized for hazardous waste management in 2003. Table 25. Facilities authorized for hazardous waste management. SEMARNAT. 2003. Collection and Transport: 444
Number of operators authorized to collect and transport hazardous wastes
65 Operators authorized to collect and transport medical waste Storage: 27 Facilities authorized for storage of hazardous wastes 17 Facilities authorized for storage of medical waste 8 Facilities authorized for storage of PCBs Reuse: 9 Facilities authorized to reuse spent solvents 1 Reuse of hydrocarbon sludges
Recycling: 49 Used container recyclers
39 Used solvent recyclers 9 Photographic fixer recyclers 36 Used lubricant recyclers 30 Metal recyclers 3 Other recyclers
Treatment: 29 Fuel blenders, who mix and prepare alternative fuels
18 Facilities which treat oils and other materials contaminated with PCBs
142 Facilities which conduct "in-situ" treatment of wastes 39 Medical waste treatment facilities 18 Hazardous waste treatment facilities
Incineration/ Combustion
18 Hazardous waste incinerators ( 16 Facilities which burn hazardous wastes as alternative fuels to produce energy
(cement plants and power plants) Final Disposal 2 Hazardous Waste Landfills Total 1,019 Facilities authorized to collect, transport, store, treat, burn, recycle, reuse and
dispose of hazardous wastes, including medical wastes Source: SEMARNAT. Dirección General de Gestión Integral de Materiales y Actividades Riesgosas http://148.233.168.204/dgmic/rpaar/rp/directorio/rubro1.shtml *rubro1.2,3,4,5,6,7,8,9.
50 Residuos Industriales Multiquim in Nuevo León has a capacity of 100,000 tons per month 51 Ciba Especialidades Químicas de México in Jalisco has a capacity of 1,090 tons per year.

The Generation and Management of Hazardous Wastes and Transboundary Hazardous Waste Shipments between Mexico, Canada and the United States Since NAFTA: A 2004 Update
55
Table 26. Evolution of new infrastructure for hazardous waste management authorized in Mexico, 1999-2003
Type of Infrastucture Number of new facilities/operators authorized
Accumulated Totals
1999
2000
2001
2002
2003
1999
2000
2001
2002
2003
Transport and Collection Operators
0 40 7 0 1 307 347 354 354 355
Reuse Facilities 1 1 1 1 - 11 12 13 14 14 Recycling Facilities 42 16 24 32 13 137 153 177 209 222 Treatment Facilities 18 8 7 3 5 57 65 72 72 80 Incineration Facilities* 1 1 3 1 1 10 11 14 15 16 Landfill Facilities** - - - - - 4 4 4 4 4 Storage Facilities 105 116 118 122 126 Total 62 26 35 37 19 631 708 752 790 817 Source: SEMARNAT. Subdirección de Generación y Manejo de Residuos Industriales Peligrosos. Presentación Montreal. Noviembre 2003. Notes: * Does not appear to include cement kilns burning hazardous wastes for energy recycling; **Two of the four landfills – Cytrar in Sonora and the Metalclad facility in San Luis Potosí--were shut down by authorities in the 1990s.
Table 27. Installed capacity of facilities authorized to treat industrial hazardous waste and contaminated soils (in tons)
Year Recycling % Incineration % Reuse % Treatment % Total
2002 311,448.50
32.06 7,008.00
0.72 500,000.00
51.48 152,860.00
15.74 971,316.50
2003 67,103.90
13.68 9,925.00
2.02 0.00
0.00 413,500.00
84.30 490,528.90 Total 1999-2003 2,714,508.40
60.30
236,738.00
5.25
500,820.00
11.12
1,050,190.00
23.33
4,502,256.4
0 Source: SEMARNAT. Subdirección de Generación y Manejo de Residuos Industriales Peligrosos. Presentation in Montreal at Hazardous Waste Task Force Meeting. November 2003.

The Generation and Management of Hazardous Wastes and Transboundary Hazardous Waste Shipments between Mexico, Canada and the United States Since NAFTA: A 2004 Update
56
Table 28. Cement plants in Mexico and number authorized for the burning of hazardous wastes as energy recycling. 2001.
Authorizations for burning of hazardous
wastes as energy recycling and percentage of total fuel use
Plants Total Annual Production/Year
No. of Authorized Plants
%
7 10-30% Cementos Apasco 8,912,000 1 5%
11 5% 1 10-25%
CEMEX México 27,2000,000
2 10-30% Grupo Cementos de
Chihuahua México: 1,925,000
U.S.: 3,325,000 1
(México) 5%
Cementos Pórtland Moctezuma
2,950,000 1 25%
Cooperativa Cruz Azul 3 10-30% Total: 27 plants
Sources: Dirección General de Residuos, Materiales y Actividades Riesgosas. Dirección de Residuos Peligrosos. Instituto Nacional de Ecología. SEMARNAP, 2001/ Documento de CANACEM. http://www.canacem.org.mx Jacott, Reed, Taylor and Winfield. Energy use in the N. American Cement Industry: Emissions, Waste Generation and Pollution Controls, 1990-2002. CEC 2003. Table 29. Industries authorized for burning of hazardous wastes as alternative fuels Name of Company No. of Authorized
Plants Cementos Apasco 5 Cementos Yaqui 1 Cementos Guadalajara 1 Cementos Maya 2 CEMEX 6 Cementos Pórtland 1 Cementos Moctezuma 1 Cementos Tolteca 3 Compañía Federal de Electricidad 1 Cementera Cooperativa La Cruz Azul 2 Ecoltec 1 Francisco de la barrera mares (Before known as manufacturas metalicas, s.a. de c.v.)
1
Petroquimica morelos, s.a. de c.v. 1 Procesos ambientales alfa, s.a. de c.v. 1 Sistema de destrucción térmica, s.a. de c.v. 1 Quest internacional de méxico, s.a. de c.v. 1 Total 29 Source: INE Web Page http://148.233.168.204/dgmic/rpaar/rp/directorio/rubro8.shtml

The Generation and Management of Hazardous Wastes and Transboundary Hazardous Waste Shipments between Mexico, Canada and the United States Since NAFTA: A 2004 Update
57
Table 30. Types of hazardous waste recycling and installed capacity, 2000Recycling Type Installed Capacity (tons/year) Used Lubricants 116,181 Solvents 197,369 Used photo chemicals 5 Contaminated textile materials 300 Metals and metal wastes 504,913 Used Containers 44,863 Paints 17,655 Others (Greases, Break Fluids, etc) 3,668 Energy Recycling (*) 1'249,841 TOTAL 2'134,795 (*) Includes preparation of alternative fuels
806,756
Source: Instituto Nacional de Ecología, July, 2000. http://new.ine.gob.mx/dgmrar/rip/infraestructura/infraestructura.html Just as information about hazardous waste infrastructure does not include detail about the actual amount of waste being treated or managed at each facility, information provided by INEGI on spending on environmental infrastructure and protection also lacks needed details for more complete analysis . For example, collection and treatment activities are registered without distinguishing whether the collection and treatment is for municipal, non-hazardous or hazardous wastes. In addition, there is no detailed information separating environmental spending by equipment, operation, maintenance, fuel and salaries. Table 31. Spending on environmental protection and percentage of gross domestic product
(Millions of non-adjusted pesos)
Year
Gross Domestic Product
Environmental Protection Spending a
Percentage of Environmental
Protection Spending of GDP
1990 676,067 2,536 0.4 1991 868,219 3,248 0.4 1992 1,029,005 4,414 0.4 1993 1,155,132 5,494 0.5 1994 1,306,302 6,190 0.5 1995 1,678,835 6,096 0.4 1996 2,296,675 7,182 0.3 1997 2,873,273 7,934 0.3 1998 3,517,782 11,143 0.3 1999 4,205,704 23,192 0.6 2000 4,980,785 25,890 0.5 2001 5,285,606 27,562 0.5 a: Refers to spending exclusively in budgetary outlays, and ignores spending that was budgeted but never spent. The figures for 1998 forward are not comparable to those before 1998 as important improvements in the methodology of calculating environmental protection spending resulted from an investigation to detect more detailed information, allowing for more specificity and identification of such spending. Source: INEGI. Sistema de Cuentas Nacionales de México.

The Generation and Management of Hazardous Wastes and Transboundary Hazardous Waste Shipments between Mexico, Canada and the United States Since NAFTA: A 2004 Update
58
Table 32. Environmental protection spending, 1996-2001 Millions of non-adjusted pesos
1996 1997 1998 1999 2000 2001
Totals 7, 181 7, 934 11, 143 23, 192 25, 890 27, 562 Operating Expenses
5, 183, 6, 231 6, 774 14, 603 13, 118 16, 669
Capital Investments 1, 998 1, 703 4, 368 8, 588 12, 772 10, 894 NOTE: Includes spending by federal, state and local governments as well as private capital on environmental protection. Source: INEGI. Sistema de Cuentas Nacionales de México.
C.1 Contaminated soil treatment Mexico is a petroleum-rich country. In terms of the environment, petroleum exploration, mining and refining generates spills, hazardous wastes and toxic emissions. Currently, Petróleos Mexicanos (PEMEX) is a parastatal company that should comply with all environnmental laws, and has the goal to upgrade all of its installations so that the environment and health of the communities in which it operates is not impacted. Nonetheless, in the southeast, the children in the local communities still clean up the oil spills without protection and at times without even clothes. In recent years, as part of the new policy to clean up oil spills and hazardous wastes resulting from drilling operations, a number of new facilities have been authorized to treat contaminated soils and oil wastes. One of the most common is thermal desorption, a type of combustion process which uses heat to lower the toxicity of the soils, although the heat used is not as intense as a commmercial hazardous waste incinerator.52 It should be noted that thermal desorption treats soils to a certain level – the process also produces ashes which themselves might require further treatment. However, there are a variety of other options for treating contaminated soils and drilling waste authorized in Mexico. As the next section details, in recent years, the government has also authorized the exports of some oil drilling wastes to the U.S. for treatment.
52 For more information on the benefits and drawbacks of Thermal Desorption see Asociacion Santo Tomas, Tratadoras Termicas: Caso Tabasco (Austin: TCPS), 2002.

The Generation and Management of Hazardous Wastes and Transboundary Hazardous Waste Shipments between Mexico, Canada and the United States Since NAFTA: A 2004 Update
59
Table 33. Authorized facilities to treat contaminated soils
State No. of Authorized Facilities
Type of Treatment
Aguascalientes 1 Physical-Chemical Baja California Sur 1 Chemical and Biological Campeche 1 Physical-Chemical Coahuila* 2 Biochemical and Biodegredation Distrito Federal 35 Biological, Biochemical, Bioremediation, Physical-Chemical
Bioremediation, Physical-Chemical Estado de México 9 Biochemical and Bioremediation; Bioremediation; Physical; Physical-
Chemical; Physical Thermal and Bioremediation Hidalgo 1 Bioremediation Michoacán 1 Bioremediation Morelos 1 Chemical and Biological Nuevo León** 9 Bioremediation; Physical, Physical-Chemical; Prosipa soli safe; Sinaloa 1 Chemical and Biological Tabasco 9 Bioremediation, Physical-Chemical, Physical-Chemical-Biological,
Chemical, Biochemical Tamaulipas 8 Bioremediation, Physical, Physical-Chemical Veracruz 7 Bioremediation; Bioremediation and Physical-Chemical; Physical-
Biological; Physical-Chemical; Chemical and Biological Total 86 Note: * In Coahuila, the type of treatment is listed for only one of the facilities, while three of the facilities in Nuevo Leon authorized to treat contaminated soils do not list their treatment method.. Source: Table prepared by authors. http://148.233.168.204/dgmic/suelos/registro-federal.shtml
Table 34. Hazardous Waste Generation in the Production of Hydrocarbons at PEMEX , 1999-2001 (Tons)
PEMEX Operation 1999 2000 2001 Exploration 134,556 150,443 217,758 Refining 32,812 15,023 40,277 Gas and Basic Petrochemicals 1,085 1,064 1,219 Petrochemicals 16,548 18,773 19,269 Total 185,002 185,303 278,523 Note: Since 2001, a new information system known as the Environmental Security and Protection Information Subsystem (Subsistema de Información de Seguridad Ambiental y Protección Ambiental (SISPA) was put in place so that it is likely that the numbers from 2001 are more accurate and not directly comparable with previous years. The generation of hazardous wastes are a function of the different kinds of operations carried out be PEMEX (and in some cases its subcontractors), so that PEMEX Exploration is engaged in the discovery and production of crude oil and gas, while PEMEX Refining (PR) in processing the crude oil in refineries, PEMEX Gas and Basic Petrochemicals (PGPB) in processing natural gas and PEMEX Petrochemicals (PPQ) in petrochemical production. Source: Petróleos Mexicanos, Informe de Salud, Seguridad y Medio Ambiente, años 1999, 2000 y 2001, Pemex, México, various years. Compendio de Estadísticas Ambientales 2002. Impactos ambientales de la industria petrolera http://148.233.168.204/estadisticas_2000/compendio_2000/02dim_economica/02_04_Industria/index.shtml#petrolera

The Generation and Management of Hazardous Wastes and Transboundary Hazardous Waste Shipments between Mexico, Canada and the United States Since NAFTA: A 2004 Update
60
D. Transboundary Hazardous Waste Shipments from Mexico Transboundary movement of hazardous wastes in Mexico consists principally of two types:
1. The export of hazardous wastes from maquiladoras and other companies which import inputs temporarily under a drawback duty scheme and by law are required to return the resulting waste (Article 153 of the LGEEPA. Fraction VI53);
2. The import of hazardous wastes by companies dedicated to recycling and recuperation of secondary materials.
Unfortunately, there is still not an accurate count of the actual volumes of hazardous waste imports and exports from Mexico. In most cases, the data provided by the government reflects “authorizations” for the import or export of a certain volume of hazardous wastes. The authorization must be used within 90 days, which makes annual totals difficult to surmise since in some cases a company might reapply for an authorization several times but only use the authorization once.
In 1999, the Mexican government initiated a new system for return of hazardous wastes to the U.S known as the “Aviso de Retorno” or “Notice of Return.” Under this system, maquilas and others required to export hazardous wastes could simply report their intent to export their waste to the authorities and would actually reflect the amount of waste returned to the U.S. The “Avisos de Retorno” form part of a new information system also recently set up in Mexico known as SIRREP (Sistema de Rastreo de Residuos Peligrosos (SIRREP)), which controls the movements of wastes. Initially set up to interact with EPA’s HAZTRAKS, which as highlighted has been discontinued, SIRREP is the mechanism for the Mexican government to follow the exports of the maquila and other industries required to export hazardous wastes to the U.S. Thus far, only aggregated data has been made available to the public from this system, though SEMARNAT maintains it could provide more detailed information to the public from SIRREP in the first six months of 2004. Table 35. Number of Export and Import Authorizations of Hazardous Wastes, 1999-2002 Year Imports Exports 1999 276 43 2000 231 56 2001 82 72 2002 81 51 Note: Import and Export Hazardous Waste Authorizations are only valid for 90 days, so that the annual figures reflect the number of authorizations granted, but do not reflect actual waste volumes and are not cumulative. In some cases, authorizations are never used. Source: Questionairre submitted by Fronteras Comunes to the Dirección General de Contaminantes. Subdirección de Generación y Manejo de Residuos Industriales Peligrosos as per the Ley Federal de Transparencia y Acceso a la Información Pública Gubernamental, November 2003.
53 LGEEPA. Artículo 153 VI. “Los materiales y residuos peligrosos generados en los procesos de producción, transformación, elaboración o reparación en los que se haya utilizado materia prima introducida al país bajo el régimen de importación temporal, inclusive los regulados en el artículo 85 de la Ley Aduanera, deberán ser retornados al país de procedencia dentro del plazo que para tal efecto determine la Secretaría”

The Generation and Management of Hazardous Wastes and Transboundary Hazardous Waste Shipments between Mexico, Canada and the United States Since NAFTA: A 2004 Update
61
D.1 Imports
Article 153 of the LGEEPA lays out restrictions on imports and exports of hazardous materials and wastes. In particular, the following restrictions are important:
Section (Fracción) II. Imports of hazardous waste are only allowed for treatment, recycling or reuse.
Section III. Imports of hazardous waste are not permitted for final disposal, deposit, storage or landfilling.
Section VI. The temporary import of materials and hazardous wastes generated in the production, transformation, elaboration or reparation should be returned to the country of origin within the period determined by SEMARNAT. The “Avisos de Retorno” are legally based on this Article and Section of the LGEEPA.
Table 36. Quantities of Hazardous Wastes Authorized for Import (tons)
Description of Waste 2000 2001 2002 2003 Used Oils 600.0 Used Batteries 52,500.0 57,000 102,289.0 Electric Batteries 20,000.0 Borra de pulido 300.0 Metallic Oxides (such as lead) 200.0 100.0 300.0 100.0 Electric Arc Furnace (EAF) Dust 206,150.0 196,500.0 223,100.0 97,700.0 Tire Incineration Ash 700.0 Solids Contaminated with Solvents and Oils 1,500.0 Solvent Residues 148.4 Reconditioned Hazardous Containers 20.0 20.0 Soil Contaminated with Oils and Grease 500.0
Total 262,018.4 254,220.0 325,689.0 117,800.0 Source: Table prepared by authors: http://148.233.168.204/dgmic/importaciones/estadisticas/estadisticas.shtml In addition to these hazardous wastes, other types of waste “subject to control” are imported into Mexico. Table 37 provides information on imports of tires, including radial tires (“bandas de caucho vulcanizadas”) authorized in 2000. There are some materials “subject to control” and others which are not. Materials like used tires and radial tires which were previously subject to control, were taken off the control list on November 20, 2000. Information about which wastes are subject to control can be found in the Agreement which establishes the classification and codification of merchandise whose import and export is subject to SEMARNAT and other governmental dependencies.54 Its legal basis can be found in Article 15 of the LGEEPA which stipulates an annual review of the list by SEMARNAT55. 54 Acuerdo que establece la clasificación y codificación de mercancías cuya importación y exportación está sujeta a regulación por parte de la Secretaría de Medio Ambiente, Recursos Naturales y Pesca y sus diversos. 55 ARTICLE 15.- SEMARNAT, in coordination with the Commercial Exterior Commission, will annualy review the list of merchandise subject to non-tariff regulation, with the purpose of eliminating those tariffs whose

The Generation and Management of Hazardous Wastes and Transboundary Hazardous Waste Shipments between Mexico, Canada and the United States Since NAFTA: A 2004 Update
62
Table 37. Authorizations. Imports of Wastes/Products “Subject to Control”, 2000 Waste Tons
Radial Tires Bandas de caucho vulcanizadas (PITEX – temporary import)
10,800.0000
Used Tires (PITEX – temporary import) 444.5232 Used Tires 641.6058 Used Tires (B.C. and Sonora) 2,177.0760 TOTAL 14,063.2050 Source : SEMARNAT. http://148.233.168.204/dgmic/importaciones/estadisticas/estadisticas.shtml Despite this decision to deregulate the import of used tires and similar materials, in August of 2003, senators at the federal level called on the Secretaries of Economy and SEMARNAT to initiate actions to supress the import of used tires into Mexico, claiming “…they are a threat to human health and the environment. Every year in Mexico we add 25 to 30 million used tires to the hundreds of millions which already exist. These includes millions of tires considered garbage in their country of origin and which are imported to our country largely as contraband. The export of used tires from other countries is a way in which these countries transpose an environmental and human health problem. It is enough to note that our neighbor generates 280 million used tires every year, and by sending millions of them to Mexico they solve part of this environmental issue.56.
Recently, the import of domestic garbage stopped being considered a waste “subject to control” although SEMARNAT has yet to authorize any import of such waste.
SEMARNAT determines the limits of permitted imports of hazardous wastes and other wastes “subject to control” depending mainly on the recycling capacity of the company wishing to import the waste. Thus, the amounts authorized are not established in an official standard but depend on the criteria of the environmental authorities on the capacity of treatment the company reports it has. Because of their high commercial value, a special agreement was reached with the States of Sonora and Baja California to allow for a greater import of the tire wastes in 2000.
On June 24 of 2004, SEMARNAT announced a major effort to deal with huge piles of scrap and used tires along the U.S. – Mexico border.57 Under the agreement between SEMARNAT and the Cement Industry, an estimated 10 million tires would be burned at a number of cement kilns located in the northern part of the country over the next year or so. It is unclear, however, to what extent these tires would be imported from the U.S., or taken from illegal dump sites in Mexico, or what type of authorization would be needed to import the tires originating in the U.S.. At the same time, a major importer of tires has proposed importing tires for cement kiln burning through a U.S. company called International Tire Recycling. The announcement to increase the amount of regulation is considered unnecessary, or integrating those considered convenient, based on applicable technical criteria. Author Translation of “La Secretaría de Medio Ambiente, Recursos Naturales y Pesca en coordinación con la Comisión de Comercio Exterior, revisará anualmente las listas de mercancías sujetas a regulación no arancelaria en los términos del presente Acuerdo, a fin de excluir de éste las fracciones arancelarias cuya regulación se considere innecesaria, o integrar las que se consideren convenientes, basándose en los criterios técnicos aplicables.” 56Cámara de Senadores. Press Release 2003/385. August 20, 2003. México.D.F. http://www.senado.gob.mx/comunicacion/content/permanente/2003/boletines/bc20agosto.html#1 57 SEMARNAT, “SEMARNAT EMPRENDE ACCIONES PARA ELIMINAR LOS TIRADEROS DE LLANTAS Y REMEDIAR SITIOS CONTAMINADOS CON RESIDUOS TÓXICOS,” June 24, 2004, Tijuana, Baja California. Available at http://carpetas.semarnat.gob.mx/comunicacionsocial/boletines_2004_112.shtml

The Generation and Management of Hazardous Wastes and Transboundary Hazardous Waste Shipments between Mexico, Canada and the United States Since NAFTA: A 2004 Update
63
burning of tires in Mexico at cement kilns has been met with protests by many environmental and public health organizations, who see it as a way for tire manufacturers to avoid taking responsibility for their product, especially for tires moving across borders. Table 36 suggests that the only major categories of hazardous waste imported by Mexico from the U.S. are batteries and Electric Arc Furnace Dust. Furthermore, the data suggests that authorizations increased significantly between 2000 and 2002 before dropping off in 2003, although this represents only part of the year. Furthermore, information suggests that in 2000, only three companies had authorization to import hazardous wastes, indicating just a few companies control the hazardous waste import market. Table 38 provides additional information on authorized imports of waste between 1995 and 2002 which again confirms that most hazardous wastes are either solid wastes – EAF dust – batteries or tires. Again, however, information on tire imports is available only through 2000, but indicates an increasing amount of imports of this waste. It should be emphasized that it is extremely likely that many more tires were imported without authorization. Table 39 provides some additional information on the waste streams in 1995 and 1996 which again emphasize that the majority of “solid hazardous wastes” were EAF dust and other metalic wastes. Table 38. Authorizations. Imports of Hazardous Wastes, 1995-2002. Tons. Waste 1995 1996 1997 1998 1999 2000 2001 2002 Solid Wastes 154,110 203,857 169,300 195,360 201,080 209,350 196,600 223,400 Tires 3,240 4,022 4,954 5,391 10,324 14,063 0 0 Hazardous Waste Containers
1,193 1,247 1,459 70 10 20 20 0
Batteries 0 21,291 48,000 84,000 53,400 52,500 57,000 102,289 Liquid Wastes 0 0 0 0 47 148 600 0 Total 158,543 230,417 223,713 284,821 264,861 276,082 254,220 325,689 Note: In 2001 and 2002, tires were not required to obtain authorizations for import and are not reflected in this table. Source: Questionnaire, Fronteras Comunes, 2003.
Table 39. Authorizations. Imports of Solid Hazardous Wastes, 1995-1996 Waste Description 1995 1996 (through June)
EAF Dust 105,000 tons 60,000 tons Lead and Estano 3,500 tons 1,400 tons Used Batteries 0.00 45,000 pieces Tires 539,980 pieces 338,653 pieces Containers (Tambores)
59,666 pieces 36,010 pieces
Total: (tons) 108,500 61,400 Note: Total includes only first two categories of waste since other wastes were not measured by weight. Source : INE. http://new.ine.gob.mx/upsec/programas/prog_rip/cap-5.htm

The Generation and Management of Hazardous Wastes and Transboundary Hazardous Waste Shipments between Mexico, Canada and the United States Since NAFTA: A 2004 Update
64
D.2 Exports
Table 40 presents information on exports of hazardous wastes from Mexico to other countries. The vast majority are to the U.S., though certain wastes, such as PCBs, are actually sent to Europe. Of particular note is the huge increase in authorizations of oil drilling waste between 1999 and 2002. Thus, in 2000, 64,335 tons were authorized for export, while in 2001, nearly two million tons were authorized. The source of the information did not have an explanation for this huge increase between 2000 and 2001, although it could simply be that the companies applying for the authorization did not know that actual amount of waste they would be generating and so the export companies applying for the authorization asked and received authorization for a large amount of waste. In any case, this type of waste is not reflected in the U.S. EPA’s HAZTRAKS database in 2001 and 2002. For example, only 15,000 tons of hazardous waste was reported in the HAZTRAKS database as entering the U.S. from Mexico in 2002. Table 40. Authorizations. Exports of Hazardous Wastes, 1995-2002 Waste 1995 1996 1997 1998 1999 2000 2001 2002 Solid Wastes 3,713.00 1,808.00 6,607.00 8,192.86 1,827.15 19,382.00 4,402.30 5,453.47 Liquid Wastes 7.00 101.00 9.00 37.00 0.00 1.00 29.00 1.00 BPCs 2,023.00 627.00 824.00 551.00 1,333.00 3,211.00 5561.08 260.00 Hexachloride Residuals
na 2,500.00 2,500.00 0.00 0.00 10,000.00 50.00 0.00
Containers 10.00 19.00 10.00 2.00 0.65 0.00 24.00 20.00 Batteries¹ na na na 4,550.00 0.00 3.00 20.00 0.00 Oil Drilling Waste (Recortes de Perforacion)
na na nd 8,500 30,000 64,335 1,866,000 858,446.
Total 5,753 5,055 9,950 21,833 33,161 96,932 1,876,086 864,181 Sources: SEMARNAT, Answers to Questionnaire, Fronteras Comunes, 2003. Compendio de Estadísticas Ambientales 2002. Semarnat, Subsecretaría de Gestión para la Protección Ambiental, Dirección General de Manejo Integral de Contaminantes, México, 2002. 1 The batteries exported in 2000 were nickel-cadmium and other nickel based batteries. na= Not available.
In addition to these exports of waste, companies such as maquiladoras subject to the requirement to return their waste to the country of origin use a different system known as “Avisos de Retorno,” or Return Notices. Essentially, the company simply announces to SEMARNAT the amount of waste it will return to the U.S. No manifest need be carried by the transport company, only a copy of the Aviso itself. If information from all states are added, the return notices indicate that the following amounts of waste were exported to the U.S. between 2001 and 2003 (partial year):
2001 → 57,170.12 tons
2002 → 111,309.59 tons
2003 → 38,278.90 tons

The Generation and Management of Hazardous Wastes and Transboundary Hazardous Waste Shipments between Mexico, Canada and the United States Since NAFTA: A 2004 Update
65
Table 41. Maquila and other “Returns” of Hazardous Wastes to the U.S., 2001-2003 (Number of Return Notices and Quantity in Tons) Year 2001 2002 2003
Jan-July State No. of
Notices Tons No. of
Notices Tons No. of
Notices Tons
** Baja California 22,723 30,453.12 23,782 36,529.89 13,063 23,544.49 ** Chihuahua 990 4,499.58 1008 5,199.55 568 2,185.17 * Coahuila 461 1,346.07 404 49,643.73 122 2,002.550 ** Nuevo León 627 775.9411 459 576.3 303 261.5 ** Sonora 1,015 1,976.20 1546 5,518.62 ** Tamaulipas 3,149 14,663.036 2938 12,012.675
8 2,080 9,904.749
* Federal District (All other states)
298 3,456.173 265 1,828.820 45 380.436
Total 57,170.12 111,309.9 38,278.90 Note: The data is preliminary and subject to review and change. *Data obtained from SIRREP Central. **Data supplied by Border State SEMARNAT Federal Delegations Source: SEMARNAT. SIRREP. http://148.233.168.204/dgmic/aviso_de_retorno/estadisticas/estadisticas.shtml
Tables 42 and 43 provide information on hazardous waste exports from maquilas from non-border states, while Table 44 provides more detail on the types of waste authorized for exports from Mexico principally to the U.S. Again, the table suggests that the largest volume of waste authorized for export is drilling waste. Upon further analysis this authorization is directly related to exploration of the Burgos Gas Fields in Tamaulipas and Nuevo Leon by PEMEX and its subcontractors. These drilling wastes – like tires – have at times been subject to control and at other times not, making comparisons between years difficult. For example, for a portion of 2000, they were taken off the control list and authorizations for export from the Mexican government were not required.58 Federal congressmen from Tamaulipas have been extremely worried about the environmental damage caused by this gas exploration and the resulting wastes, affecting the local communities, soils and waterways. Most of the companies involved in the exploration are foreign, receiving contracts from PEMEX for gas exploration59.
Table 42. No of Notices of Return and Quantity of Waste from Headquarters, D.F. , 2000-2003168.2
HEADQUARTERS *México, D.F. (SEMARNAT)
2000
2001
2002
2003 Jan-Jul
No. of Notices 319 298 265 45 Tons 570.792 3,456.173 1,828.8206 380.436 Note: The data is preliminary and subject to review and change. Source: SEMARNAT. SIRREP. http://148.233.168.204/dgmic/aviso_de_retorno/estadisticas/estadisticas.shtml
58 PETROQUIMEX. La Revista de la Industria Petrolera. http://www.petroquimex.com/apoyo_desarrollo.htm) 59 More information is available at:. http://www.jornada.unam.mx/2003/oct03/031017/022n1eco.php?origen=index.html&fly=1.

The Generation and Management of Hazardous Wastes and Transboundary Hazardous Waste Shipments between Mexico, Canada and the United States Since NAFTA: A 2004 Update
66
Table 43. List of Companies by State which Filed Notices of Return with SEMARNAT Central Offices.
State Company Baja California Industrias Crown Chemical, S.A. De C.V. Durango Autopartes Y Arneses De Mexico, S.A. De C.V. Durango Lg Philips Displays Mexico, S.A. De C.V. Edo. De México Sandvik De Mexico, S.A. De C.V. Jalisco Benchmark Electonics De Mexico S. De R.L. De
C.V. Jalisco Motorola De Mexico, S.A. De C.V. Jalisco Sci Systems De Mexico, S.A. De C.V. Jalisco Vtech Innovations, S.A. De C.V Jalisco Kodak De México, S.A . De C.V. Jalisco Scg Mexico, S.A. De C.V. San Luis Potosí As Catalizadores Ambientales San Luis Potosí Interruptores De Mexico, S.A. De C.V. Sinaloa Alambrados Y Circuitos Electricos, S.A. De C.V. Yucatán Falco Electronics Mexico, S.A. De C.V. Zacatecas Delphi Cableados, S.A. De C.V. Note: Data for 2000 to 2003 only. Source: SEMARNAT. SIRREP. http://148.233.168.204/dgmic/aviso_de_retorno/estadisticas/estadisticas.shtml

The Generation and Management of Hazardous Wastes and Transboundary Hazardous Waste Shipments between Mexico, Canada and the United States Since NAFTA: A 2004 Update
67
Table 44. Quantities Authorized for Export, 2000 - 2003 Waste 2000 2001 2002 2003 Used Batteries (Acumuladores) 20.00 Wastewater 8.00 Oil Waste 60.00 Nickel-Cadmium Batteries (Baterías Ni-Cd y Ni-hidruro)
2.702.00
PCBs 3,210.91 5,561.07 260.00 313.73 Spent Catalytic Converters from Hydrotreatment (Catalizador agotado de hidrotratamiento)
300.00
Spent Catalytic Converters (Catalizadores gastados)
12,560.00
Ashes from hydrocarbons from petroleum
9.00 12.00 85.00
Empty Containers 20.00 Fuel Oil Wastes (Escoria de combustóleo)
6,735.00 4,320.00 4,780.00 4,280.00
Sodering Waste (Escoria de soldadura Sb-Pb)
60.00 50.00
Metal Filters which Contained Oils (Filtros de metal compactados que contuvieron aceite)
10.00
Latas presurizadas con mezcla de medicamentos cáducos
58.00 13.472.00
Lodos de filtro de prensa 5.00 Contaminated Sludges and Soils (Lodos y tierra contaminada con aceite)
15.00
Water mixed with hydrocarbons Mezcla de agua con hidrocarburos
13.00
Used oils and anti-freeze 7.00 Solids mixed with paints (Mezcla de sólidos contaminados con pintura base agua-aceite)
20.00
Solids contaminated with oils (Mezcla de sólidos contaminada con aceite)
15.30
Empty Containers (Recipientes vacíos que contuvieron materiales peligrosos)
14.00
Drilling Wastes (Recortes de perforación)
64,335.00 1,866,000.00 858,446.00 400,000.00
Residuos de antidetonante de Pb 100.00 100.00 Hexachloride Wastes 10,000.00 50.00 Chromium Wastes 5.00 Used Photochemical Process Liquids 1.00 1.00 1.00 Used hazardous waste containers 10.00 Rags and sawdust contaminated with wastes and oils
20.00 55.00
Total 96,931.61 1,876,086.37 864,180.47 404,743.73 Source: Table prepared by authors. http://148.233.168.204/dgmic/exportaciones/estadisticas/estadisticas.shtml

The Generation and Management of Hazardous Wastes and Transboundary Hazardous Waste Shipments between Mexico, Canada and the United States Since NAFTA: A 2004 Update
68
E. PCBs
“PCBs were produced in Europe and United States as well as other countries, with each company registering their own product. PCBs were commercialized under different names and each type had different mixes and components60.”
Some 95 companies report the generation of PCBs in the registration manifests required through the Mexican Official Standard NOM-133-SEMARNAT-2000. Table 45. Partial Inventory of PCB Generation through October 24, 2003 Quantity Total PCBs Generated, Tons 4,833.83 Parastatal Companies -- 30.99% 1,497.90 Private Companies -- 69.01% 3,335.92 Number of manifest notices 95.00 Number of Clean-up Programs 25.00 Source: SEMARNAT. Bifenilos Policlorados http://148.233.168.204/dgmic/bpc/Inventarios/inventario.shtml Management of PCBs depends on its concentration in parts per million. In Mexico, PCB waste with more than 50 ppm PCBs can only be treated and transported by authorized facilities and transporters. Currently, there are several companies which treat and prepare this waste for export for final destruction. None of this waste is exported to the U.S., which under TSCA prohibits the import of PCB waste which has a concentration greater than 50 PPM concentration. SEMARNAT indicates that some 15 percent of waste containing high levels of PCBs have been treated and eliminated. Most of this waste has been sent to Spain, France, Finland and Germany for final destruction. Table 46. Concentration Limits and Treatment Standards for PCBs in Mexico Concentration in PPM Aplicable Standard Type of Treatment
0 to 4 Non-hazardous waste Non-hazardous waste treatment facility
5 to 50 Hazardous waste subject to management as per NOM-052-ECOL-1993
Hazardous waste treatment facility authorized by SEMARNAT
Greater than 50 Hazardous waste contaminated by PCBs and must be managed according to NOM-133-ECOL-2000.
PCBs Waste Treatment Facility Authorized by SEMARNAT
60 SEMARNAT. Dirección General de Gestión Integral de Materiales y Actividades Riesgosas http://148.233.168.204/dgmic/bpc/Inf_tecnica/inf_tecnica.shtml
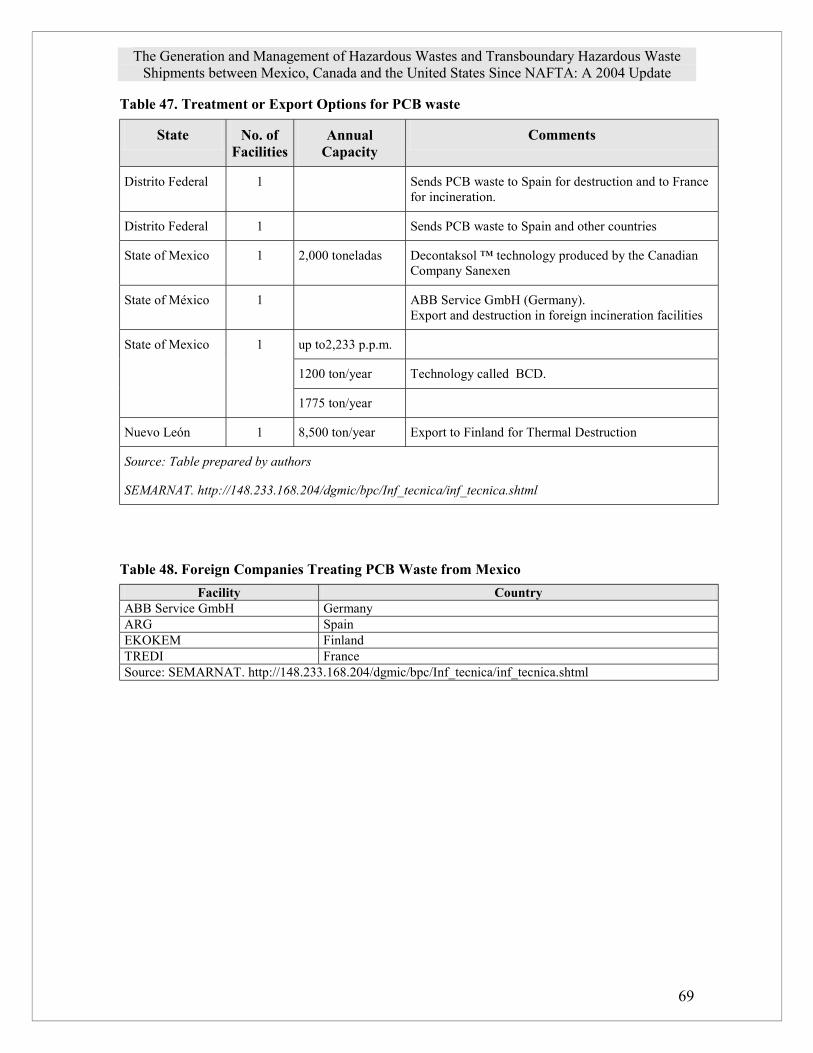
The Generation and Management of Hazardous Wastes and Transboundary Hazardous Waste Shipments between Mexico, Canada and the United States Since NAFTA: A 2004 Update
69
Table 47. Treatment or Export Options for PCB waste
State No. of Facilities
Annual Capacity
Comments
Distrito Federal 1 Sends PCB waste to Spain for destruction and to France for incineration.
Distrito Federal 1 Sends PCB waste to Spain and other countries
State of Mexico 1 2,000 toneladas Decontaksol ™ technology produced by the Canadian Company Sanexen
State of México 1 ABB Service GmbH (Germany). Export and destruction in foreign incineration facilities
up to2,233 p.p.m.
1200 ton/year Technology called BCD.
State of Mexico
1
1775 ton/year
Nuevo León 1 8,500 ton/year Export to Finland for Thermal Destruction
Source: Table prepared by authors
SEMARNAT. http://148.233.168.204/dgmic/bpc/Inf_tecnica/inf_tecnica.shtml
Table 48. Foreign Companies Treating PCB Waste from Mexico
Facility Country ABB Service GmbH Germany ARG Spain EKOKEM Finland TREDI France Source: SEMARNAT. http://148.233.168.204/dgmic/bpc/Inf_tecnica/inf_tecnica.shtml

The Generation and Management of Hazardous Wastes and Transboundary Hazardous Waste Shipments between Mexico, Canada and the United States Since NAFTA: A 2004 Update
70
F. Environmental Compliance Currently, some 33,800 individual facilities are subject to federal regulations and enforcement because of their potential to pollute, including: • 4,350 sources of emissions of air contaminants; • 28,000 large generators of hazardous wastes;
• 6,400 facilities engaged in the manufacture of highly risky or dangerous products, and
• 840 facilities which offer services related to hazardous waste management61.
These facilities – which make up the Inventory of Sources Subject to Federal Jurisdiction62 -- are further divided by size into the following categories. Table 49. Classification of Industries Subject to Federal Jurisdication by Number of Employees. Size
Sector (Classification by number of employees)
Industry Commercial Services
Micro 0 – 30 0 – 5 0 – 20
Small 31 – 100 6 – 20 21 – 50
Medium 101 – 500 21 – 100 51 – 100
Large 501 or greater 101 or greater 101 or greater
SEMARNAT.http://148.233.168.204/estadisticas_2000/compendio_2000/04dim_institucional/04_03_Cumplimiento_normatividad/index.shtml#superficie
PROFEPA, the enforcement arm of SEMARNAT, had a number of goals in 2003, including:
Increasing compliance of environmental laws and regulations by 40 percent;
Verifying that at least 50 percent of special measures required of facilities with lead emissions are met;
Reviewing nine thousand transboundary movements of hazardous wastes and materials in the ports of entry (bridges and rails) and maritime ports.
Inspecting and assuring compliance of 100% of the installations of PEMEX and its Subcontractors in the Oil Fields of Burgos (Tamaulipas, Coahuila, Nuevo Leon region)
61http://www.profepa.gob.mx/seccion.asp?sec_id=427&com_id=0 61”Las fuentes de jurisdicción federal son a) para el caso de emisiones a la atmósfera, los establecimientos industriales de los giros petrolero, petroquímico, químico, de pinturas y tintas, automotriz, de celulosa y papel, metalúrgico, del vidrio, de generación de energía eléctrica, del asbesto, del cemento, calero y de tratamiento de residuos peligrosos; b) para el caso de los residuos peligrosos, se agregan las unidades médicas, por ser generadoras de residuos peligrosos biológico infecciosos, y en impacto ambiental los poliductos. Se eliminan las obras nuevas o ampliaciones relativas a actividades industriales de bebidas, automotriz y del asbesto.”

The Generation and Management of Hazardous Wastes and Transboundary Hazardous Waste Shipments between Mexico, Canada and the United States Since NAFTA: A 2004 Update
71
A comparison of inspection rates between 1992 and 2002 indicates the amount of inspections, partial closures and complete closures undertaken by PROFEPA has declined substantially.
Table 50. Inspection and compliance results of industries, 1992 to 2002 Industry: August
1992 Jan-May
2002 May 2002
Other Industries 16341 272 51 Maquiladoras 7945 95 15 Northern Border States Total 24286 367 66 ZMCM 28840 343 65 Rest of Country 76986 2263 337 Mexico City and Nation Total 105826 2606 402 CFE 77 13 4 PEMEX 2991 67 9
Inspections
Para-Statal Companies Total 3768 80 13
All Maquiladoras 100 15 Other Industries 386 1 0 Maquiladoras 176 0 0 Northern Border States Total 562 1 0 ZMCM 773 3 0 Rest of Country 1480 13 2 Mexico City and Nation Total 2253 16 2 CFE 3 0 0 PEMEX 9 1 0
Partial Closures
Para-Statal Companies Total 12 1 0
All Maquiladoras 176 0 0 Other Industries 194 3 1 Maquiladoras 35 0 0 Northern Border States Total 229 3 1 ZMCM 70 1 0 Rest of Country 601 17 2 Mexico City and Nation Total 671 18 2 CFE 1 0 0 PEMEX 18 1 0
Total Closures
Para-Statal Companies Total 19 1 0
All Maquiladoras 0 0 Other Industries 13038 188 32 Maquiladoras 5844 57 10 Northern Border States Total 18882 245 42 ZMCM 22234 264 50 Rest of Country 57892 1612 238 Mexico City and Nation Total 80126 1876 288 CFE 584 10 4 PEMEX 2185 56 6
Minor Violations
Para-Statal Companies Total 2769 66 10
All Maquiladoras 60 10 Other Industries 2723 80 18 Maquiladoras 1890 38 5 Northern Border States Total 4613 118 23 ZMCM 5763 75 15 Rest of Country 17013 621 95 Mexico City and Nation Total 22776 696 110 CFE 189 3 0 PEMEX 779 9 3
No Violations
Para-Statal Companies Total 968 12 3
All Maquiladoras 40 5 Source: PROFEPA. http://www.profepa.gob.mx/seccion.asp?sec_id=211&com_id=0
While part of this could be explained by an extensive environmental auditing program by many companies which takes them out of the inspection regime, it still seems clear the amount of
The Generation and Management of Hazardous Wastes and Transboundary Hazardous Waste Shipments between Mexico, Canada and the United States Since NAFTA: A 2004 Update
72
enforcement occuring both in the border states and throughout the nation has declined in recent years. In particular, while inspections of maquiladoras in 1992 occurred with regularity, only 100 inspections of maquiladoras occurred between January and May of 2002 according to PROFEPA. G. Recent Legislative Changes in Mexico
1. New Laws In October of 2003, a new law – the General Law to Prevent and Manage Wastes (LGPIR) --was approved by the Fox Administration and went into effect on January 6 of 2004. While the law makes some important advances that should lead to better control of hazardous wastes – including better information made available to the public – non-governmental groups have serious reservations about its promotion of certain activities such as incineration and energy recycling given the experience of other countries with these practices (See below). In addition to the new law, new regulations –currently known as Proyecto de Modificaciones al Reglamento de la Ley para la Prevención y Gestión Integral de los Residuos (Regulations of the LGPIR) – were prepared and published for public comment on SEMARNAT’s website on June 17, 2004.63 Among other measures, the regulations would obligate SEMARNET to develop a series of plans, including one to remediate contaminated sites and a national waste basic diagnostic. It is these regulations – when finally adopted – along with resulting standards – which determine how the new law will be implemented. The General Waste Law makes some key changes to the way Mexico regulates hazardous wastes,64 including: Special Management Wastes. The General Waste Law creates and regulates a new category of “special management wastes,” including a number of end-of-life products, and imposes new responsibilities on producers of these wastes. The General Waste Law charges the 31 states and the Federal District with the actual implmentation of these special management wastes, which are derived from the rock mining (sand and gravel), health services, agriculture, forestry, poultry, farming, technology and automotive sectors. Other wastes which may become part of this new category include transportation wastes, wastewater treatment wastes, department stores and construction, demolition and maintenance wastes.65 In addition, those generating these wastes in significant quantities, as well as those importing, manufacturing or distributing these products must develop waste management plans, though the details of these plans have yet to be developed. Finally, a number of hazardous wastes must be managed similarl to “special management wastes,” including mercury and NiCad batteries, flourescent and mercury lamps and other components that contain mercury, cadimum or lead; used lubricating oils; spent organic solvents; catalytic converters; lead-based automotive accumulators; pharmaceuticals; pesticides and pesticide containers; PCBs; hazardous sludges from oil and gas production; and a number of types of medical, forensic and surgical waste.66 Again, waste management plans for these products must be developed by manufacturers, importers, exporters and distributors of these hazardous wastes. The regulations add specificity to these management plans, which would
63 Public comments can be made electronically. Details and a copy of the new regulations are available at http://www.semarnat.gob.mx/wps/portal/.cmd/cs/.ce/155/.s/6122/_th/902/_lp.4753/0/_lpid.4753/4759/_s.155/4759. 64 Maddie Kadas, “Mexico Adopts New Omnibus Waste Law with Producer Responsibility Requirements,” State Bar Texas Environmental Law Journal (Vol. 34), pp. 133- 136. 65 Ley General para la Prevención y Gestión Integral de los Residuos, arts. 5(xxx), 19 & 31. 66 Ibid, Article 31.

The Generation and Management of Hazardous Wastes and Transboundary Hazardous Waste Shipments between Mexico, Canada and the United States Since NAFTA: A 2004 Update
73
require much greater effort on the part of generators to document and consider the impacts of their waste streams. Remediation of contaminated sites. While the General Waste Law falls somewhat short of creating a comprehensive superfund program, it does create a site remediation program that will assign more responsibility to the generators of waste in such sites. The General Waste Law will assign clean-up and remediation responsibility to waste generators, while also imposing joint and several responsibility on land-owners and possessors of private property, and even consession-holders of public land. Under the General Waste Law and accompanying regulations, SEMARNAT is expected to create a report and come up with a list of contaminated sites that must be cleaned up, as well as a list of abandoned sites that could be remediated. While how those waste sites for which a responsible party can not be forced to pay clean-up is unclear, the proposed regulations do suggest that some funding could come from enforcement and resulting penalties.67 Risk-based Hazardous Waste Classification Standards. While the General Waste Law retains the current definitions of hazardous wastes based upon characteristics, it also allows the concept of “risk” to influence which chemicals must actually be managed as hazardous wastes. There are a number of risk factors which would determine the extent to which wastes would need to be transported, managed and treated as a hazardous wastes, but again until new regulations and standards are adopted it is difficult to tell if a significant amount of waste would be transferred out of the hazardous waste classification system. Hazardous Waste Standard Regulatory Flexibility. The General Waste Law makes a number of significant changes which decrease the regulation of hazardous wastes, including allowing generators to store waste on-site for six months without a permit; declassifying empty hazardous waste containers; and finally officially allowing the co-processing of hazardous waste for energy recovery, a practice which has been in existence for many years in Mexico without authorization in law. The new law makes a clear distinction between requirements for incineration facilities and co-processing facilities, essentially –under Article 164 of the proposed regulations – eliminating any requirements for authorization other than meeting emission limits adopted under a previous standard68. However, the Cemetn Industry is already asking for a change in those standards given the incentive in the New Law to co-process hazardous wastes. Land-Ban on Liquid Wastes. The General Waste Law also prohibits the land disposal of liquid or semisolid hazardous wastes that have not been treated, although again the exact treatment standards would have to be adopted. This is similar to the prohibition in U.S. law, which has led to dozens of treatment standards for liquid wastes. Exports and Imports of Wastes. While the new General Waste Law maintains the prohibition on imports of hazardous wastes for final disposal, the law does away with the requirement that
67 See Article 239, Proyecto de Modificaciones al Reglamento de la Ley para la Prevención y Gestión Integral de los Residuos (Modification Regulation Project of the General Waste Law), June 17, 2004. 68 See Article 164, Proyecto de Modificaciones al Reglamento de la Ley para la Prevención y Gestión Integral de los Residuos (Modification Regulation Project of the General Waste Law), June 17, 2004. (No serán incluidos en las resoluciones relativas a las autorizaciones para empresas prestadoras de servicios de incineración de residuos peligrosos las operaciones de co-procesamiento a que se refiere el artículo 63 de la Ley.)

The Generation and Management of Hazardous Wastes and Transboundary Hazardous Waste Shipments between Mexico, Canada and the United States Since NAFTA: A 2004 Update
74
maquiladoras repatriate all the waste they generate. Instead, waste that can be recycled can remain in Mexico, while waste that is intended for disposal must be sent out of the country.69
69 For example, Article 207 of the draft regulations state: Hazardous wastes generated in processes using inputs subject to the temporary import regiment can be recylced within the facilities where they are generated or through recycling service facilities authorized by SEMARNAT, according to these regulations and other applicable legislation (authors’ translation). Los residuos peligrosos generados en los procesos en los que se utilicen insumos sujetos al régimen de importación temporal, podrán ser reciclados dentro de las instalaciones en donde se generan o a través de las empresas de servicios autorizadas por la Secretaría, de conformidad con las disposiciones contenidas en el presente reglamento y otros ordenamientos aplicables.
General Law to Prevent and Manage Wastes (LGPYGIR)) The LGPYGIR does not promote the reduction or prevention of hazardous waste generation, clean production or alternative forms of recycling and treatment, but instead actively promotes the creation of a hazardous waste infrastructure based on incineration. The law weakens the Stockholm Convention (ratified by Mexico) which commits the country to reduce and eliminate – when possible – the sources of a variety of Persistent Organic Pollutants, including dioxins. More specifically, the law supports energy recycling – the use of hazardous wastes as an alternative fuel source for the cement and other industries. In fact, the new regulations do not establish the need for further authorizations for facilities to gain approval to co-process hazardous wastes as fuel as long as they meet emission limits.(see Article 164) Instead, many organizations called for a true pollution prevention law which would commit Mexico to look for ways to reduce waste rather than to send it off-site for burning.
Art. 2. In the formulation and implementation of the policies in the prevention, valorization and integrated management of the wastes to which this Law refers,……. the following principles will be observed:
Fr. VII. Public access to information, environmental education and training, to achieve pollution prevention and sustainable management of these wastes.
Comment: At present, it has been very difficult for civil organizations to obtain information about hazardous wastes. Similarly, at present the measures stipulated in : Chapter III. Social Participation. Arts. 35 and 36 and Chapter IV. Right to Information. Arts. 37,38 y39.
Fr. VIII. Final disposal of wastes is limited to only those wastes whose valorization or treatment is not economically viable, technologically feasible and environmentally adequate. Comment: To avoid disposal, the valorization of the wastes is promoted instead of avoiding its generation. Instead of promoting the reduction and prevention of waste generation from the source, it promotes the valorization of the wastes and its treatment when profits are generated. If this is the principle which guides national policy, it is clear that the economic value of the wastes will be prioritized over the health and environmental aspects.
Fr. XI. Clean production as a means to achieve sustainable development;
Comment: The final regulations must define clear incentives and policies to promote this type of production. In addition to these general concerns, the new law and proposed regulations provide no mechanism for public participation or even notice for new facilities proposing to treat hazardous wastes. Instead, decisions about whether to approve new facilities remain solely in the hands of the government.

The Generation and Management of Hazardous Wastes and Transboundary Hazardous Waste Shipments between Mexico, Canada and the United States Since NAFTA: A 2004 Update
75
In addition to the General Waste Law, in 2002, a new federal law was passed requiring government information to be accessible to the public. Called the Ley Federal de Transparencia y Acceso a la Información Pública Gubernamental (Federal Law for Transparency and Access to Public Government Information) and published in the DOF on June 7, 2002, the law gives citizens and even non-citizens the right to request information from governmental authorities and receive an answer to their request, either providing the information or a rationale for why the information can not be shared. The law is a significant improvement over past legislation guaranteeing access to government information and has already been used by citizens and NGOs to request environmental information.70
2. New Standards and Regulations
Since 2000, there have been a number of new Mexican Official Standards adopted or proposed in part to make up for some of the notable regulatory deficiencies in Mexico’s hazardous waste regulatory scheme. Some of the newly approved NOMs include: Modification of NOM-133-ECOL-2000. Published on March 5, 2003 in the DOF, this NOM establishes the limits and different management requirements for PCBs. NOM-EM-138-SEMARNAT-2002 (Previously known as NOM-EM-138-ECOL-2002) Establishes the maximum contamination limits for soils contaminated with hydrocarbons, and procedures for their restoration. NOM-040-SEMARNAT-2002 (Previously known as 040-ECOL-2002) Published on December 18, 2002, this NOM establishes the maximum emission limits of particulate matter for the cement industry, including fugitive emissions. It applies to both hazardous-waste burning and non-hazardous waste burning cement kilns and also establishing the percentage of “alternative fuels” that are allowed to be burned. In general, the NOM strengthens emission limits for cement operators while allowing a certain amount of hazardous wastes to be burned. However, the cement industry has asked that the standard be modified, to better reflect the incentive in the new General Waste Law (LGPYGIR) for the use of hazardous wastes as fuels. However, this process would likely take some 18 months to complete due to a moratorium on new regulations recently approved by the Fox Administration.71 Among those NOMs still in the proposed stage include: 70 Note: For the present work, we wanted to emphasize the importance that the right to know environmental information has, an issue which continues to be a difficult issue in Mexico. Government and industry still limit access to environmental information out of fear that the non-governmental and social organizations will not use the information appropriately. NGOs still suffer from the lack of confidence in their abilities by government and industry representatives, even though we are talking about a right not a privilege. Part of the information used in elaborating this report was obtained using the new Federal Law of Transparency and Access to Governmental Public Information (Ley Federal de Transparencia y Acceso a la Información Pública Gubernamental), which permits the public to solicit information to any governmental dependency. The CEC was another channel through which we were able to access information from SEMARNAT. 71 Information provided by Ing. Alfonso Ramírez Flores, Director of Hazardous Materials and Wastes, SEMARNAT, June 17, 2004.

The Generation and Management of Hazardous Wastes and Transboundary Hazardous Waste Shipments between Mexico, Canada and the United States Since NAFTA: A 2004 Update
76
• PROY-NOM-098-ECOL-2002, Incineration of Hazardous Wastes, maximum emission limits and design (DOF 27/06/03). This applies to incinerators but not to cement kilns burning hazardous wastes, which are instead regulated under NOM-040. • PROY-NOM-101-SEMARNAT-2003, Used oils and lubricants, management standards. • PROY-NOM-145-SEMARNAT-2003, Hazardous Waste Containment in Salt Domes. The public comment period for this proposed standard were completed in November, and are being analyzed. The proposed standard is likely to go back to a working group for further modifications. It is important to note in this last case, that many types of hazardous waste have been banned in the U.S. from disposal in salt domes because of their potential to migrate. Some states – such as Texas – have completely banned hazardous wastes from disposal in salt domes, though some oil production waste has been allowed to be deposited there. The other major change in Mexican regulation was the approval of an obligatory, and public Pollutant Release and Transfer Registry, known in Mexico as the Registro de Emisiones y Transferencia de Contaminantes (RETC). Approved in December of 2001 as an amendment to the LGEEPA, the RETC would be obligatory for all industries – including those under federal, state and municipal jurisdiction – required to fill out an Annual Operating Permit (COA). In 2001, the NOM Norma NMX-AA-118-SCFI-2001 was also published, which lists 104 toxic chemicals and compounds which would be reported under the RETC. However, this NOM is still voluntary and is not the final NOM for the RETC program. Finally, on June 3, 2004, new regulations guiding the creation of the annual RETC were published in the Diario Oficial.72 According to these new regulations, industries will be required to begin reporting their hazardous waste, wastewater discharge, and toxic releases as part of their annual operating “cedula”, between January and April of each year. Thus, in 2005, the obligatory reporting of this information would begin, allowing both the public and the industries themselves to know the amount and types of waste being generated, released and transferred, and begin waste minimization planning. The new regulations were an important victory for Mexican civil society and the right-to-know movement – as well as for the North American Commission for Environmental Cooperation – which for more than 10 years had been calling on Mexico to live up to its NAFTA obligations. The publicly-available and obligatory RETC could allow the public to know the quantities, sources and management of toxic and hazardous substances, and allow the government to properly design an environmental policy based on real data. For all of North America, it’s important that the registry can be compared with the existing reporting systems in Canada and the U.S. to establish trends of toxic wastes. Still, for this to happen, Mexico still must adopt the final standard – the NOM – which would establish which substances -- and at what levels -- must be reported. In the meantime, the Secretary of SEMARNAT will reach an agreement establishing what must be reported in 2005, and possibly in 2006, before a final NOM is established by June of 2006. It is likely that the 2001 NMX – which lists 104 chemicals and chemical compounds -- would be a starting point for this interim agreement. 72 SEMARNAT, Reglamento de la Ley General del Equilibrio Ecológico y la Protección al Ambiente en materia de Registro de Emisiones y Transferencia de Contaminantes, Diario Oficial, June 3, 2004.
The Generation and Management of Hazardous Wastes and Transboundary Hazardous Waste Shipments between Mexico, Canada and the United States Since NAFTA: A 2004 Update
77
V. Possible explanations of the Shifts in the US-Mexico Waste Traffic While U.S. and Mexican data differ substantially, the data suggests that imports of Electric Arc Furnace Dust and batteries to Mexico increased substantially in recent years, while exports from Mexico also increased as maquilas returned more of their wastes, and oil drilling led to a spike in oil drilling residues. What accounts for the likely increase in waste moving from the U.S. to Mexico and vice-versa? This section analyzes several possible explanations, including regulatory/policy changes, changes in waste generation, changes in the economic structure of the U.S and Mexico, and changes in the hazardous waste off-site management industry itself. It is important to emphasize that Mexico has maintained a ban on the import of hazardous wastes for final disposal which thus far appears to have prevented hazardous wastes from the U.S. from being sent to Mexico for incineration, cement burning and/or disposal in landfills. An exception may be used tires – a non-hazardous waste with hazardous characteristics -- which appear to have been imported for burning in some northern Mexican cement kilns. A. Regulatory/Policy Change As previously reported in 2001, differing regulatory standards on hazardous waste disposal in landfills was a likely factor in the increase of hazardous wastes from the U.S. to Canada, particularly in the late 1990s.73 More specifically, the implementation of Land Disposal Restriction in the U.S. may have made it cheaper to send wastes to Canada, which did not have similar restriction in place. This section summarizes recent changes at the federal level in both Mexico and the U.S. with an emphasis on those waste streams believed to be traded between the two countries.
1. Mexican Waste Regulations As reported in Section IV, Mexico did not make substantial changes to its regime for the import and export of hazardous wastes over the last several years. With the approval of the new General Waste Law regulating hazardous wastes, the ban on imports of hazardous wastes for storage and final disposal remains, although the law does give maquiladoras flexibility in recycling wastes within Mexico, rather than having to export them. Mexico did however pass a number of new standards, including new emission standards for the practice of burning hazardous waste streams in cement kilns and incinerators as well as for the treatment of PCB waste and contaminated soils. However, none of these standards have a direct impact on the type of waste imported into Mexico. There have been changes in wastes “subject to control” as Mexico has reviewed its tariffs and non-tariff barriers to waste products. Thus, the decision to deregulate the import of tires into Mexico – removing them off of the “subject to control” list – could lead some U.S. tires to find their way into Mexican landfills and even perhaps, cement kilns. The other major waste categories imported into Mexico – electric arc furnace dust, batteries and possibly electronic waste – are destined for recycling and reuse operations, though some disposal may ultimately result from their import. A major policy shift in Mexico which may have led to exports of oil drilling wastes was the decision to tighten up waste disposal requirements both on PEMEX and contractors. The decision has led to oil drilling residues and wastes having to be treated more adequately. The development
73 Canadian Institute for Environmental Law and Policy, Fronteras Comunes and TCPS, Generation and Management of Hazardous Waste Shipments between Mexico, Canada and the United States, 1990-2000, April 2001.

The Generation and Management of Hazardous Wastes and Transboundary Hazardous Waste Shipments between Mexico, Canada and the United States Since NAFTA: A 2004 Update
78
of the Burgos Gas Fields in Tamaulipas and Nuevo Leon and further exploration of oil fields in Tabasco appears to have increased drilling wastes which require treatment. In the 2001 and 2002 period, figures from the Mexican government suggest that hundreds of thousands of tons of oil drilling waste and oil-contaminated soils were authorized to be exported to the U.S. At the same time, a number of new facilities have been authorized for the thermal treatment of oil drilling wastes in Tabasco and other Mexican states, suggesting the authorizations for export may be temporary. Still, increased enforcement and regulatory changes in the petroleum industry in Mexico could in part explain increased authorizations for exporting gas and oil wastes. The other major export of hazardous waste from Mexico to the U.S. involve waste from the Maquiladora industry. While it is difficult to compare data due to changes in the reporting system, the new “Aviso de Retorno” system appears to have increased compliance with the return provisions of Mexican law. The changes incorporated into the General Waste Law could force some maquiladoras which are exporting waste to the U.S. for recycling to instead choose to recycle them in Mexico. However, because most waste sent to the U.S. from Mexico appears to be related to final disposal, in which Mexico lacks infrastructure, it is unlikely to have a significant impact overall.
2. US Federal Hazardous Waste Regulations After a series of new regulations in the middle and late 1990s intended to meet the Land Disposal Restrictions contained in the original and amended versions of RCRA, which made treatment standards tougher and increased the universe of what is considered hazardous waste, in the last few years, most new regulations have been aimed at offering regulatory relief and reduced paperwork. Several of these rules still have not been implemented or are in comment phase (see Table). The rationale behind many of these rules is nearly the same – that providing regulatory relief and incentives to some waste generators is likely to lead to recycling and reuse of hazardous materials, thus decreasing incineration, landfilling and other disposal practices. Table 51. Major new federal regulations and policy changes made in the U.S. Regulation or Policy Change
Effective Date Proposed or Implemented
Description Practical Effect if known
Definition of Solid Waste Toxicity Characteristic
Effective March 13, 2002
Provides some regulatory relief to hazardous waste recyclers from RCRA Subtitle C waste management requirements. The EPA deleted regulatory language that classified mineral processing characteristic sludges and by-products being reclaimed as solid wastes under RCRA’s hazardous waste management regulations. The agency also codified the decision that the TCLP may not be used to determine whether MGP waste is hazardous under RCRA
After increasing treatment standards on mineral processing waste going to landfills in the late 1990s under the LDR, these new regulations incentivize recycling of some of these wastes.
Hazardous Waste Identification Rule- Revisions to the Mixture and Derived-From Rules
August 14, 2002 These revisions excluded the mixtures and derivatives of wastes listed solely for the ignitability, corrosivity and/or reactivity characteristics as RCRA wastes. They also put a conditional exemption for “mixed waste” that is waste that is both hazardous and reactive.
Will cause some waste managed off-site to be treated on-site.
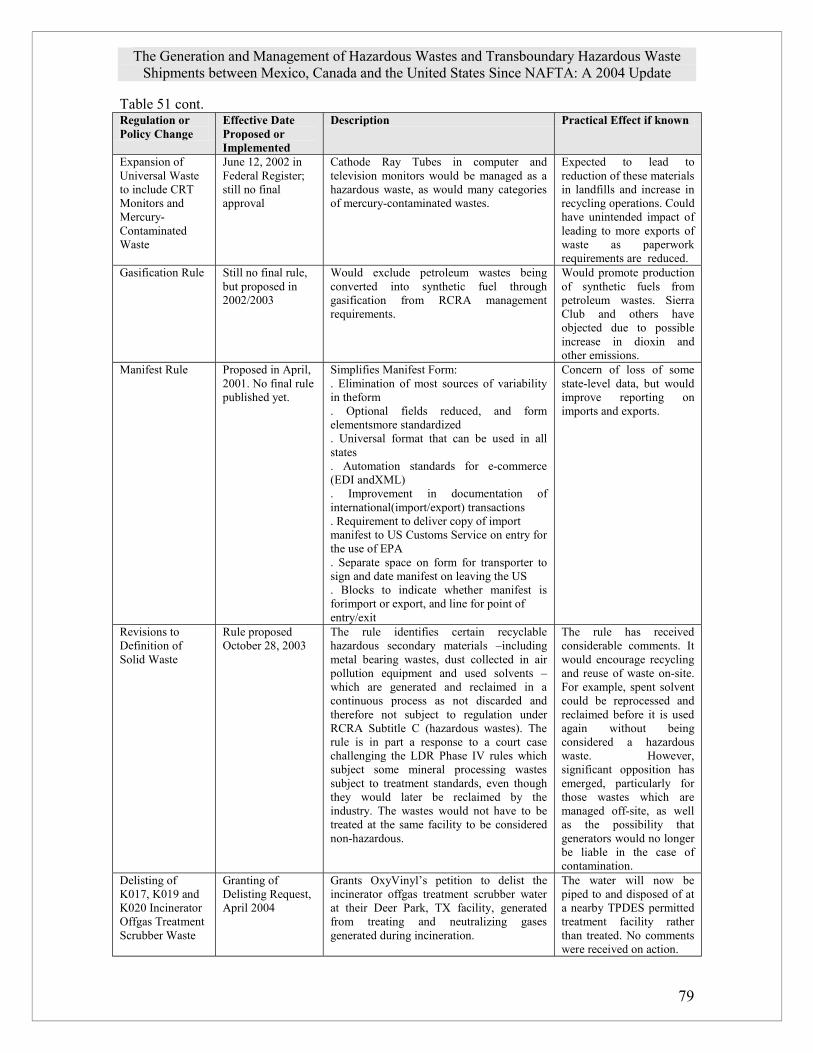
The Generation and Management of Hazardous Wastes and Transboundary Hazardous Waste Shipments between Mexico, Canada and the United States Since NAFTA: A 2004 Update
79
Table 51 cont. Regulation or Policy Change
Effective Date Proposed or Implemented
Description Practical Effect if known
Expansion of Universal Waste to include CRT Monitors and Mercury-Contaminated Waste
June 12, 2002 in Federal Register; still no final approval
Cathode Ray Tubes in computer and television monitors would be managed as a hazardous waste, as would many categories of mercury-contaminated wastes.
Expected to lead to reduction of these materials in landfills and increase in recycling operations. Could have unintended impact of leading to more exports of waste as paperwork requirements are reduced.
Gasification Rule Still no final rule, but proposed in 2002/2003
Would exclude petroleum wastes being converted into synthetic fuel through gasification from RCRA management requirements.
Would promote production of synthetic fuels from petroleum wastes. Sierra Club and others have objected due to possible increase in dioxin and other emissions.
Manifest Rule Proposed in April, 2001. No final rule published yet.
Simplifies Manifest Form: . Elimination of most sources of variability in theform . Optional fields reduced, and form elementsmore standardized . Universal format that can be used in all states . Automation standards for e-commerce (EDI andXML) . Improvement in documentation of international(import/export) transactions . Requirement to deliver copy of import manifest to US Customs Service on entry for the use of EPA . Separate space on form for transporter to sign and date manifest on leaving the US . Blocks to indicate whether manifest is forimport or export, and line for point of entry/exit
Concern of loss of some state-level data, but would improve reporting on imports and exports.
Revisions to Definition of Solid Waste
Rule proposed October 28, 2003
The rule identifies certain recyclable hazardous secondary materials –including metal bearing wastes, dust collected in air pollution equipment and used solvents – which are generated and reclaimed in a continuous process as not discarded and therefore not subject to regulation under RCRA Subtitle C (hazardous wastes). The rule is in part a response to a court case challenging the LDR Phase IV rules which subject some mineral processing wastes subject to treatment standards, even though they would later be reclaimed by the industry. The wastes would not have to be treated at the same facility to be considered non-hazardous.
The rule has received considerable comments. It would encourage recycling and reuse of waste on-site. For example, spent solvent could be reprocessed and reclaimed before it is used again without being considered a hazardous waste. However, significant opposition has emerged, particularly for those wastes which are managed off-site, as well as the possibility that generators would no longer be liable in the case of contamination.
Delisting of K017, K019 and K020 Incinerator Offgas Treatment Scrubber Waste
Granting of Delisting Request, April 2004
Grants OxyVinyl’s petition to delist the incinerator offgas treatment scrubber water at their Deer Park, TX facility, generated from treating and neutralizing gases generated during incineration.
The water will now be piped to and disposed of at a nearby TPDES permitted treatment facility rather than treated. No comments were received on action.

The Generation and Management of Hazardous Wastes and Transboundary Hazardous Waste Shipments between Mexico, Canada and the United States Since NAFTA: A 2004 Update
80
It is difficult to assess the overall impact of these adopted or proposed rules. In general, they exclude some wastes from being treated and managed as hazardous in an attempt to encourage on-site and off-site recycling. There is some concern that such deregulation could lead to further “sham” recycling, particularly if strong export controls are not in place. Still, these changes are too recent and are not likely to have impacted the imports and exports of hazardous wastes between the U.S. and Mexico. K061, for example, is still treated as a hazardous waste, even when shipped to metal recyclers and no exclusion from LDR treatment standards has been proposed under the proposed revisions to the solid waste definition.74 The effort to simplify the manifest form would actually improve reporting of exports and imports – as long as they were required to be manifested. In addition to these deregulation efforts, a number of new regulatory changes have actually increased treatment standards or emission standards in the U.S. at the federal level (see below). In addition, while not yet implemented, new emission standards for boiler and industrial furnaces are expected to toughen emission limits for the on and off-site burning of hazardous waste in industrial boilers and furnaces. Among new regulations proposed or implemented include:
Final Proposed Emissions Limits for Hazardous Waste Combustion Facilities, Including Boiler and Hydrochloric Acid Production Furnaces.75 April 2004. Following the adoption of interim emission limits in 2002, the EPA published proposed final emission limits for incinerators, cement kilns, light aggregate kilns (Phase I) as well as industrial boilers and hydrochloric acid production facilities (Phase II). If adopted, existing facilities would have up to three years to comply with these new standards. EPA estimates that some 150 facilities would be affected by this rule, costing them approximately $78 million per year. The EPA further estimates that two commercial incinerator systems, 32 to 34 on-site incinerator systems and between 22 and 25 boiler systems would be forced to leave the market due to failure to meet the standards. The vast majority of commercial incinerators and all cement kilns currently burning hazardous wastes would be able to meet the new standards. The total impact on the amount of waste burned would be less than four percent according to EPA analysis. The rule would result in a significant decrease in air emissions of 1,431 tons per year of chlorine and hydrogen chlorine, 21 tons per year of metal hazardous air pollutants, particulate matter of 1,542 tons per year and 4.7 grams per year of dioxins and furans.76 Interim Emission Limits for Hazardous Waste Combustion Facilities. April, 2002.
After legal action by both environmental and industry on its rules establishing new emissions limits for incinerators, cement kilns and other combustion facilities, the EPA adopted interim standards in April of 2002. While in practice the emission limits are similar to those initially proposed, there is some flexibility and a longer duration time to meet the standards. Still, the impact is largely the same: incinerators and cement kilns had to meet tougher emission standards by September of 2003. Chlorinated Aliphatics Production Waste. November 2000. The EPA listed two new
types of wastewater sludge as hazardous from the chlorinated aliphatics production industry. K174 and K175 result from the production of vinyl chlorides and ethylene dichlorides. The move will force some of this waste to be treated in hazardous waste management facilities.
74 See discussion on page 61562 of Federal Register, Vol. 68, No. 208, October 28, 2003, Proposed Rules on Revisions to the Definition of Solid Waste. 75 Proposed Rules, Federal Register (Vol. 69, No. 76), April 20, 2004. 76 Office of Solid Waste, U.S. EPA, Assessment of the Potential Costs, Benefits and Other Impacts of the Hazardous Waste Combustion MACT Replacement Standards: Proposed Rule, March 2004.

The Generation and Management of Hazardous Wastes and Transboundary Hazardous Waste Shipments between Mexico, Canada and the United States Since NAFTA: A 2004 Update
81
Inorganic Chemical Waste. 2001. The EPA listed three new hazardous waste chemicals, creating K176 (baghouse filters from antimony oxide production), K177 (slag from production of antimony oxide) and K178 (ferric acid from production of titanium dioxide).
So long as Mexico maintains a ban on imports of waste for disposal – providing this ban includes combustion in cement kilns and incinerators – these new emissions limits and newly listed hazardous wastes should not lead to an increase in imports or exports between the U.S. and Mexico. B. Changes in Hazardous Waste Industry As outlined previously, in the U.S. there has been a consolidation of the commercial hazardous waste industry, even as new treatment standards have caused more waste to be managed off-site. There have been a variety of factors in this consolidation including over-capacity in some types of treatment, financial weakness of particular companies like Safety Kleen and Philips Environmental Services which attempted to consolidate their operations, on-site treatment of some wastes and opposition by the public to certain kinds of hazardous waste facilities such as injection wells and landfills.77 Still, despite the ups and downs of the commercial hazardous waste industry, in general capacity and demand has remained relatively stable in the U.S., and the increasing exports of hazardous wastes to Mexico are not a reflection of weakness in the hazardous waste industry. In Mexico, the number of authorized facilities – as highlighted in the previous section – has continued to climb. It is possible that data from Mexican authorities suggesting that the amount of imported batteries has increased is due to new facilities being authorized to reclaim, recover or recycle Lead Acid or other batteries. Still, the major receiver of U.S. waste in Mexico – Zinc Nacional – has been in operation there for many years and has taken U.S. waste for more than a decade. Upgrades at the plant in the mid-1990s – in part a response to environmental problems – is one factor in its continued presence as a major importer of U.S. waste. C. U.S. Sectoral Economic Conditions The recent slow-down in the U.S. economy – particularly in the manufacturing sector – has not been reflected in the amount of waste reported as generated in 2001. Even with economic slowdowns, the number of computers, LAB and other consumer items like tires containing hazardous materials continues to increase since these items are generated by consumers. It is possible that the reduction in waste of the mini-mill steel industry is related to the economic downturn (see next section). While the slowdown in the U.S. economy has led to widespread job loss in some manufacturing and assembly plants in both the U.S. and Mexico, mainly in 2002, again the resulting downturn in waste generation does not appear to have occurred based on incomplete Mexican data.
77 Cary Perket, Treatment and Disposal Market Overview 2000, EI Digest, No. 1, 2000, pages 13 –22.

The Generation and Management of Hazardous Wastes and Transboundary Hazardous Waste Shipments between Mexico, Canada and the United States Since NAFTA: A 2004 Update
82
D. Changes in Waste Generation
1. U.S. Generation. Increases in waste generation are the single biggest factor in the continued export of U.S. wastes to Mexico. As steel mini-mills have come to dominate the U.S. steel production market, the amount of K061 waste continued to climb between 1993 and 1999.. The 2001 data indicates a major decline in waste generated and sent off-site, with a slight decline of waste sent to Mexico. While U.S. generators have a number of options – including treatment and landfilling, metal recovery at Horsehead facilities, pollution prevention through recycling of the dust, and a number of new processes to recover or create new products – sending the dust to Mexico continues to be a cost-effective option – particularly for mini-mills in the Southern United States. According to statistics of the United States Geological Society, steel production in the U.S. rose from 91.2 million tons to 97.4 million tons between 1994 and 2001. However, trends differed remarkably between the integrated steel industry – which utilizes mainly virgin iron ore in its oxygen furnaces – and the mini-mill recycled steel industry, which utilizes scrap steel in its electric arc furnaces. While integrated steel production actually declined over the period, production in mini-mills increased from 35.84 to 45.09 million metric tons.78 The figure below shows steel production and consumption in the U.S. between 1999 and 2003. Overall, there has been a slight decline in steel production and consumption, although most of this decline occurred during the recession in 2001. Despite this overall decline, steel production at mini-mills actually increased slightly between 1999 and 2003. In between there was a substantial decline in 2001, which corresponds to a dip in waste generation. Again, this suggests that steel production by minimills causes waste which must be treated. Figure 11. Total steel production and consumption in the U.S. at integrated steel mills and mini-mills, 1999 to 2003
020406080
100120140
1999 2000 2001 2002 2003
Mill
ion
Met
ric T
ons
Total Steel ProductionIntegrated Steel ProductionMini-mill ProductionTotal U.S. Consumption
Source: U.S. Geological Survey, Mineral Commodities Summaries, January 2004. In terms of both electronic waste and lead acid batteries, these discarded consumer items continue to be sold and discarded. As long as exports of these wastes to other countries are allowed, exports to Mexico will likely increase. While this report is not able to quantify the amount of E-waste that could be going to Mexico, it is likely it will increase without strong “take-back” provisions in U.S. law. Even the recent law adopted in California is unlikely to stem the tide of exports of this waste as long as there is an economic incentive to export the wastes. In fact, some have argued that it will actually facilitate the export of these wastes, whether to Mexico or other countries. Other consumer wastes with hazardous properties – such as tires and batteries – are also likely to be exported more frequently. 78 USGS, U.S. Geological Survey, Mineral Commodity Summaries, January 1999 and January 2003.

The Generation and Management of Hazardous Wastes and Transboundary Hazardous Waste Shipments between Mexico, Canada and the United States Since NAFTA: A 2004 Update
83
2. Mexico Waste Generation. Data from both Haztraks and the Mexican government suggests exports have increased from Mexico to the U.S., at least through 2001. The likely explanation is both an increase in waste generation as manufacturing output and oil production have increased in Mexico, better compliance with waste return rules required by Mexican law and the decision to authorize the export of gas and oil waste to the U.S. E. Summary The increase in exports to Mexico of K061 waste does not reflect a regulatory advantage of the metal recycler in Mexico due to lax enforcement or regulations, but is more likely instead a reflection of a growing waste stream in the U.S. due to increased steel production and better management and lower transport costs from the Southern U.S. to Mexico. Recent enforcement action in the U.S. against steel mini-mills could be one factor which led U.S. firms to better account for and manage this waste stream. There is currently insufficient information about LAB and E-waste to determine to what extent the export of these wastes are increasing to Mexico, although Mexican data certainly suggests an increase in batteries. More information is needed to determine if regulatory advantages for metal recyclers in Mexico or lax enforcement has led to exports of these waste streams. A significant problem is the lack of manifest data in the U.S. for these waste streams. Similarly, there is insufficient data on exports of tires, or to what extent they are being discarded, recycled or burned. A recent announcement by the Mexican government suggests that imports of tires will increase in the near future. Exports from Mexico to the U.S indicate that the major waste stream authorized for export are drilling wastes. Nonetheless, there is insufficient data in both U.S. and Mexican data systems to determine to what extent these exports are actually occuring or where they are going. Other wastes appear to mainly come from the Maquiladora industry and flow to a number of landfills and other TSDs in the U.S., mainly in Texas, California and Nevada. There remains significant data gaps, however, as the U.S. has abandoned the data system HAZTRAKS and the Mexican counterpart system still provides aggregated data.

The Generation and Management of Hazardous Wastes and Transboundary Hazardous Waste Shipments between Mexico, Canada and the United States Since NAFTA: A 2004 Update
84
VI. Changes in Canadian Generation, Management and Waste Shipments Since 2000 A. Hazardous waste management in Canada: An Introduction and Overview Information on total domestic hazardous waste generation and disposal in Canada is poor. There are no federal reporting requirements regarding total generation and disposal, and generation reporting requirements have only recently been established in one province – Ontario. Provincial hazardous waste manifesting systems only capture off-site transfers of wastes, but not on-site disposal. Estimates of total hazardous waste generation in Canada range from 2-5 million tonnes per year.79 The available provincial waste manifest data suggests an upwards trend in off-site disposal over the past decade.80 National Pollutant Release Inventory (NPRI) data for the 1995 – 2000 period indicates large increases in on-site land disposal of wastes, and in transfers of wastes off-site for further treatment. 81
Hazardous waste generators and commercial disposal facilities are overwhelmingly concentrated in Southwestern Ontario and Quebec. Hazardous waste import and export traffic, which is almost exclusively with the United States, is also concentrated in these regions. The traffic involves a relatively small number of commercial treatment, disposal and recycling facilities. The key facilities in Ontario and Quebec are highlighted in Tables 52 and 53. Table 52: Major hazardous waste treatment, disposal and recycling facilities in Ontario Facility Name Location Type Laidlaw Inc./Safety-Kleen Inc./Clean Harbors Inc
Corunna Landfill and Incinerator
Safety-Kleen Canada Inc. Breslau Waste oil and solvent reprocessing
Philip Environmental/Philip Services Corporation
Hamilton, various locations Waste processing, Metals recycling.
Table 53: Major hazardous waste treatment disposal and recycling facilities in Quebec Facility Name Location Type Stablex Ltd. Blainville Solidification and landfill Bennett St.Ambroise Incinerator Horizon Environmental Inc. Shawinigan Landfill Laidlaw Inc. Montreal Incinerator and landfill Noranda Horne Smelter Rouyn-Noranda Secondary metals smelter Horsk Hydro Becanncour Metals recycling Nova PB Inc., Ste-Catherine Battery Recycling.
79 See M.Winfield, Hazardous Waste Management in Ontario: A Report and Recommendations (Toronto: CIELAP, 1998), Chapter II. 80 Analyses of the Ontario waste manifest data for the years 1994, 1996, 1998 and 2000 show an increase in total manifested quantities from 1,280,674 tonnes in 1994 to 1,819585 tonnes in 1998, and then a slight decline to 1,729,158 tonnes in 2000. See C.Elwell, Ontario: Open for Toxics/Burning Hazardous Waste becomes a burning issue in Ontario (Toronto: CIELAP, 2003) Table 1. 81 Commission for Environmental Cooperation, Taking Stock 2000 (Montreal: CEC, 2003), Table 7-2.

The Generation and Management of Hazardous Wastes and Transboundary Hazardous Waste Shipments between Mexico, Canada and the United States Since NAFTA: A 2004 Update
85
Provincial governments are responsible for the approval and regulation of treatment, disposal and recycling facilities and regulate intra-provincial waste movements. Canada is a Party to the Basel Convention and a 1986 Canada-US Agreement on Transboundary Movement of Hazardous Wastes. Transboundary waste movements (international and interprovincial) are regulated by the federal government under the Canadian Environmental Protection Act, 1999 (CEPA 1999) via the Export/Import of Hazarodus Waste Regulations (EIHWR).82 B. Waste Flows (1999-2002) The figures in this section show the levels of imports and exports of hazardous wastes and hazardous recyclable materials to and from Canada between 1993 and 2002. As noted earlier, the waste import/export traffic is almost exclusively with the United States. Environment Canada’s Transboundary Waste Division provided the data for these figures on the basis of the amounts reported in manifests submitted in relation to transboundary waste movements.
1. Imports As illustrated in Figure 12, there was a steep rise in imports, particularly for disposal between 1993 and 1999, and then a rapid drop in total imports from a 1999 peak. The decline has been in imports for both disposal and recycling, with imports for disposal down to 230,000 tonnes in 2002 from 394,000 tonnes in 1999, a 42% decrease. Imports for recycling peaked in 1998, and then fell off, although not as dramatically as has been the case with imports of wastes for disposal. Figure 12: Canadian Imports of Hazardous Waste
Canadian Imports of Hazardous Waste
90000
190000
290000
390000
490000
590000
690000
790000
1993 1994 1995 1996 1997 1998 1999 2000 2001 2002
Tonn
es RecyclingDisposalTotal
82 See, the Canadian Environmental Protection Act 1999, Part 7, Division 8. For a detailed discussion of regulatory arrangements in Canada regarding hazardous wastes see Winfield, Hazardous Waste Management in Ontario, Chapter III.
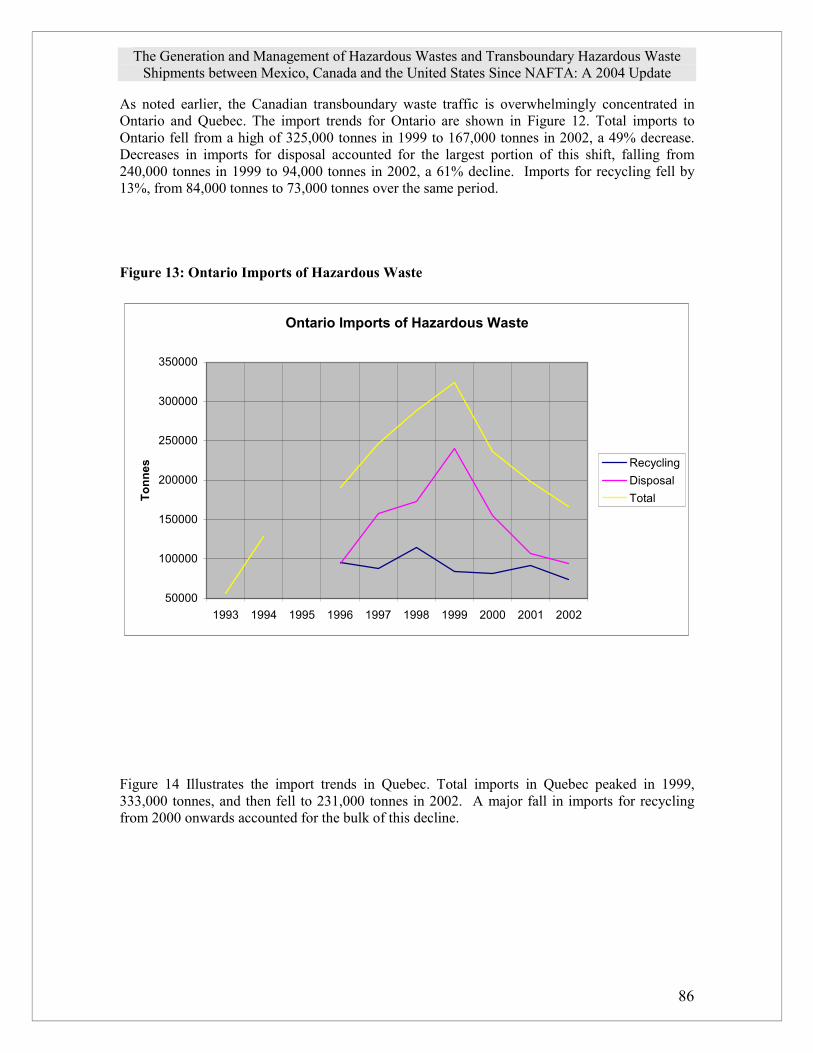
The Generation and Management of Hazardous Wastes and Transboundary Hazardous Waste Shipments between Mexico, Canada and the United States Since NAFTA: A 2004 Update
86
As noted earlier, the Canadian transboundary waste traffic is overwhelmingly concentrated in Ontario and Quebec. The import trends for Ontario are shown in Figure 12. Total imports to Ontario fell from a high of 325,000 tonnes in 1999 to 167,000 tonnes in 2002, a 49% decrease. Decreases in imports for disposal accounted for the largest portion of this shift, falling from 240,000 tonnes in 1999 to 94,000 tonnes in 2002, a 61% decline. Imports for recycling fell by 13%, from 84,000 tonnes to 73,000 tonnes over the same period. Figure 13: Ontario Imports of Hazardous Waste
Ontario Imports of Hazardous Waste
50000
100000
150000
200000
250000
300000
350000
1993 1994 1995 1996 1997 1998 1999 2000 2001 2002
Tonn
es RecyclingDisposalTotal
Figure 14 Illustrates the import trends in Quebec. Total imports in Quebec peaked in 1999, 333,000 tonnes, and then fell to 231,000 tonnes in 2002. A major fall in imports for recycling from 2000 onwards accounted for the bulk of this decline.

The Generation and Management of Hazardous Wastes and Transboundary Hazardous Waste Shipments between Mexico, Canada and the United States Since NAFTA: A 2004 Update
87
Figure 14: Quebec Imports of Hazardous Waste
Quebec Imports of Hazardous Waste
50000
100000
150000
200000
250000
300000
350000
1993 1994 1995 1996 1997 1998 1999 2000 2001 2002
Tonn
es RecyclingDisposalTotal
Exports As shown in figure 15, Canada’s total exports of hazardous wastes and recyclable materials have been increasing since 1996. This increase has been largely a result of increases in exports of materials for recycling. Exports for disposal have varied over time, but have remained within a historical range of between 50,000 and 100,000 tonnes per year. Figure 15: Canadian Exports of Hazardous Waste
Canadian Exports of Hazardous Waste
50000
100000
150000
200000
250000
300000
350000
400000
1993 1994 1995 1996 1997 1998 1999 2000 2001 2002
Tonn
es RecyclingDisposal Total

The Generation and Management of Hazardous Wastes and Transboundary Hazardous Waste Shipments between Mexico, Canada and the United States Since NAFTA: A 2004 Update
88
As shown in figure 16, Ontario’s total exports increased 55% from 124,000 tonnes to 192,000 tonnes between 1999 and 2002. Increases in exports for recycling accounted for the bulk of this shift. Exports for disposal underwent a modest increase over the same period, but remained within the limited range seen over time. Figure 16: Ontario Exports of Hazardous Waste
Ontario Exports of Hazardous Waste
0
50000
100000
150000
200000
250000
1993 1994 1995 1996 1997 1998 1999 2000 2001 2002
Tonn
es RecyclingDisposalTotal
As illustrated in figure 17, the trends with respect to exports from Quebec are different and more complex. Total exports peaked in 2000, and then fell significantly in 2001, particularly with respect to exports for recycling. Exports for both recycling and disposal rose again in 2002. Figure 17: Quebec Exports for Recycling.
Quebec Exports of Hazardous Waste
20000
30000
40000
50000
60000
70000
80000
90000
100000
110000
1993 1994 1995 1996 1997 1998 1999 2000 2001 2002
Tonn
es RecyclingDisposalTotal

The Generation and Management of Hazardous Wastes and Transboundary Hazardous Waste Shipments between Mexico, Canada and the United States Since NAFTA: A 2004 Update
89
3. Detailed Analysis
Although Environment Canada maintains a queryable database containing the information contained in notices and manifests provided the EIHWR, public access is not provided to this system. Rather, only aggregate total data is made publicly available on waste imports and exports, along with some information on the composition of the waste stream on the basis of broad categories of wastes.83 The only detailed analyses of Canadian manifest data available are those undertaken by the Canadian Institute for Environmental Law and Policy (CIELAP) of the 1994, 1998 and 2000 waste manifest data submitted under Ontario’s hazardous waste manifesting system.84 No comparable analyses are available of the federal or Quebec manifest data. The CEC provides analyses of the NPRI and Toxic Release Inventory (TRI) data related to waste transfers in its annual Taking Stock report. Finally, the U.S. EPA has been looking at annual exporter reports to look at where wastes are being exported, and for what type of management. All of these sources provide important information in understanding the shifts in waste import and export patterns between Canada and the United States. CIELAP Analyses of the Ontario Waste Manifest data The CIELAP analyses provide insights into the overall shifts in waste import and export patterns, particularly over the 1998-2000 period, where there was a transition from a pattern of rapidly increasing imports, to a rapid decline in imports for both disposal and recycling. As indicated in Table 55, the CIELAP analysis indicated a major decline (-40%) in imports to Ontario from the State of Michigan between 1998 and 2000. Table 55: Sources of Exports to Ontario 85 State 1998 2000 % Change Michigan 87,492 52,795 -40% New York 36,888 41,606 +13% Ohio 32,629 36,543 +12% New Jersey 19,941 17, 179 -14% The analysis also highlighted a major decline in imports for to the province’s one commercial hazardous waste landfill, operated by Laidlaw/Safety-Kleen/Clean Harbors in Corunna, as shown in Tables 56 and 57. 83 See http://www.ec.gc.ca/tmb/resilog/eng/resinews.htm 84 J.Yacoumidis, Ontario Open for Toxics: Hazardous waste disposal becomes a growth industry in Ontario (Toronto: Canadian Institute for Environmental law and Policy, June 200) and Elwell, Ontario: Open for Toxics: Hazardous waste disposal becomes a burning issue in Ontario. 85 From Yacoumidis, Ontario Open for Toxics: Hazardous waste disposal becomes a growth industry in Ontario , Table 30, and Elwell, Ontario: Open for Toxics: Hazardous waste disposal becomes a burning issue in Ontario, Table 30.

The Generation and Management of Hazardous Wastes and Transboundary Hazardous Waste Shipments between Mexico, Canada and the United States Since NAFTA: A 2004 Update
90
Table 56: Fates of Imports 86 Facility Type 1998 2000 % change Landfill 120,934 88,818 -26.6% Reclamation 49,831 48,244 -3.2% Incineration 32,978 35,800 +8.6% Transfer Station 17,818 8,021 -55% Transfer Station – processing
13,737 24,581 +79%
There were also significant changes in the import patterns. Particular types of wastes, especially the waste classes (other specified inorganics and other specified organics) covering wastes from air and water pollution control systems and waste screening and filtration, underwent major declines, as shown in Table 57. At the same time, imports of waste oils and sludges remained relatively stable. This is reflected in the stable pattern of waste imports reported to the province’s most significant commercial waste oil and solvent reprocessing facility, operated by Safetly-Kleen Canada Inc. in Breslau, as illustrated in Table 58. Table 57: Import Types87 Waste Type 1998 2000 %change Other specified inorganics
56,782 42,366 -25%
Transfer Station oil wastes
48,460 46,852 -3%
Other specified organics
32,489 22,274 -30.5%
Oil skimmings and sludges
24,775 24,058 -3%
Table 58: Receivers of Exports to Ontario88 Site 1998 2000 % change Safety-Kleen Corunna Landfill
120,934 88,818 -26.6%
Safety-Kleen Breslau Facility
49,831 48,244 -3.2%
Safety-Kleen Corunna Incinerator
32,978 35,800 +8.6%
Philip Services – Parkdale
7,464 11,234 +50%
Overall, the CIELAP analyses of the Ontario data highlight a decline in imports for disposal at the Laidlaw/Safety-Kleen/Clean Harbors landfill, particularly of wastes from air and water
86 Elwell, Ontario: Open for Toxics: Hazardous waste disposal becomes a burning issue in Ontario, Table 33. 87 From Elwell, Ontario: Open for Toxics: Hazardous waste disposal becomes a burning issue in Ontario, Table 37. 88 From Elwell, Ontario: Open for Toxics: Hazardous waste disposal becomes a burning issue in Ontario, Table 31.

The Generation and Management of Hazardous Wastes and Transboundary Hazardous Waste Shipments between Mexico, Canada and the United States Since NAFTA: A 2004 Update
91
pollution control systems and other waste treatment systems, while imports of waste oil and solvents have remained stable. Analyses undertaken for the CEC Taking Stock Report. Analyses of NPRI and TRI data undertaken by CEC in its annual Taking Stock report also provide important information regarding the shifts in waste flows, particularly with respect to recycling. The decline in imports to the Laidlaw/Safety-Kleen/Clean Harbors Inc. landfill in Ontario was confirmed in Taking Stock 2000 as well. 89 Most recently, the Taking Stock 2001 report showed that some 24.56 million kilograms of toxics were transferred from U.S. facilities to Canadian facilities in 2001, more than doubling the amount received in 2000.90 It is apparent that kilograms of toxics do not correspond to tonnes of hazardous wastes, since these TRI numbers suggest that there was a “recovery” in imports to Canada in 2001, while Canadian hazardous waste manifest data suggests the opposite. Most of this increase was related to a single facility in Detroit, Michigan – the Petro-Chem Processing Group/Solvent Distiller group – which sent millions of kilograms of xylenes and toluenes for energy recovery to various Canadian facilities. All told, more than 15 million kilograms of toxics were sent for energy recovery in 2001 virtually all of it to the Philip Services Parkdale Ave. North facility in Hamilton, Ontario. In contrast, transfers of metals to recycling decreased in each year from 1998 to 2001.91 As an example, while the Parkdale Ave. North unit of Philip Services was expanding its intake of toluene and xylenes for energy recovery, its metal recycling facilities on Centennial Parkway virtually shut its doors to U.S. waste in 2001.92 In terms of exports from Canada, the CEC’s analysis of toxics show that transfers rose from 25.7 million kilograms in 1998 to 35.6 million kilograms in 2000, and then declined slightly in 2001 to about 31 million kilograms.93 Most of the shifts in Canadian exports of toxics to the U.S. are related to the recycling of metals. For example, in 2001, some 24 of the 31.6 million kilograms received from Canadian facilities in 2001 involved the recycling of metals. By far the largest receiver of Canadian waste was the Horsehead Resource Development facility in Palmerton, Pennsylvania, although several other metal recyclers in Michigan, Ohio and Pennsylvania, as well as the Systech Environmental Corporation facility in Paulding, Ohio, which blends toluene and xylene for burning in cement kilns, received significant amounts of toxic chemicals.94 The CEC’s analyses suggest the large shifts in the Canadian import/exports for the purpose of recycling are largely related to metals. In particular, the 2000 Taking Stock report indicated a 25% increase in transfers of metals from Canada to the United States for recycling between 1998 and 2000,95 and a 42% decline in imports of metals from the United States to Canada for recycling over the same time period.96 The 2001 Taking Stock report confirmed these general trends. More specifically, reported transfers from Canada to the United States of zinc rose by 93%, of manganese by 106% and of copper by 15% between 1998-2001.97 Reported transfers of
89 CEC Taking Stock 2000 (Montreal: Commission for Environmental Cooperation, April 2003) Table 8-23 90 CEC Taking Stock 2001 (Montreal Commission for Environmental Cooperation, June 2004), Table 8-10. 91 CEC, Taking Stock 2001, Table 8-10. 92 CEC, Taking Stock 2001, Table 8-17. 93 CEC, Taking Stock 2001, Table 8-10 94 CEC, Taking Stock 2001, Tables 8-6 and 8-7. 95 CEC, Taking Stock 2000, Table 8-16. 96 CEC, Taking Stock 2000, Table 8-16. 97 CEC, Taking Stock 2001, Table 8-11.
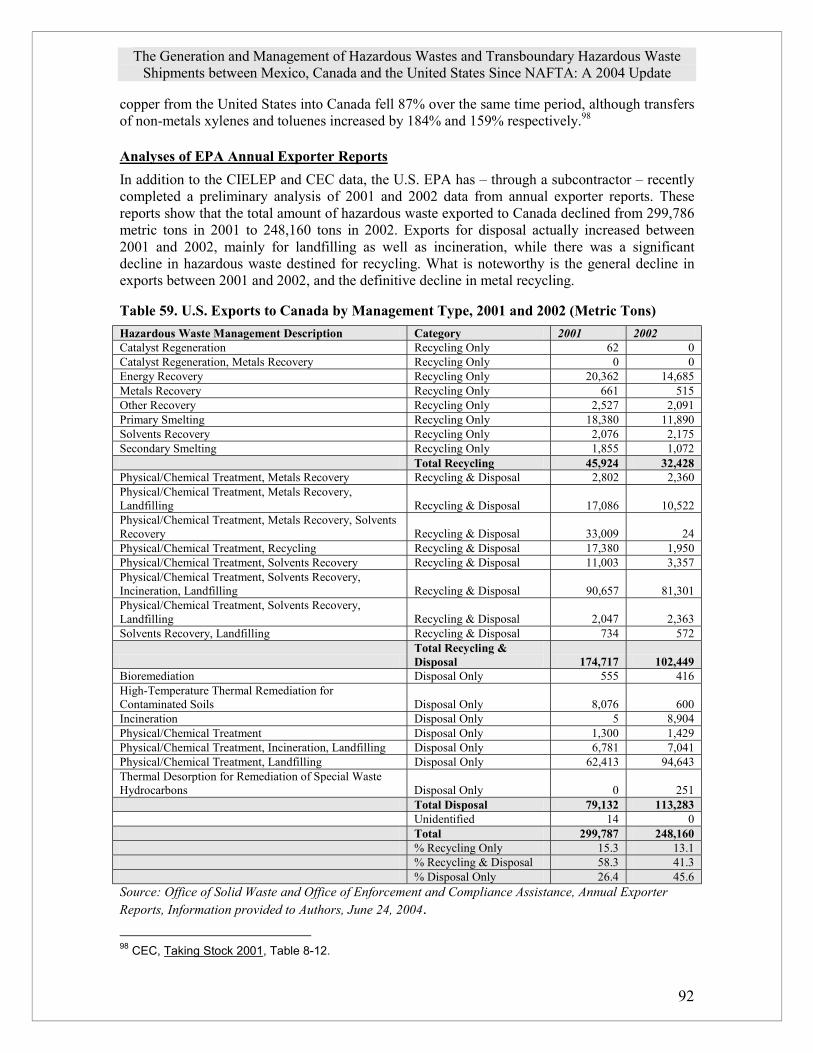
The Generation and Management of Hazardous Wastes and Transboundary Hazardous Waste Shipments between Mexico, Canada and the United States Since NAFTA: A 2004 Update
92
copper from the United States into Canada fell 87% over the same time period, although transfers of non-metals xylenes and toluenes increased by 184% and 159% respectively.98 Analyses of EPA Annual Exporter Reports In addition to the CIELEP and CEC data, the U.S. EPA has – through a subcontractor – recently completed a preliminary analysis of 2001 and 2002 data from annual exporter reports. These reports show that the total amount of hazardous waste exported to Canada declined from 299,786 metric tons in 2001 to 248,160 tons in 2002. Exports for disposal actually increased between 2001 and 2002, mainly for landfilling as well as incineration, while there was a significant decline in hazardous waste destined for recycling. What is noteworthy is the general decline in exports between 2001 and 2002, and the definitive decline in metal recycling.
Table 59. U.S. Exports to Canada by Management Type, 2001 and 2002 (Metric Tons) Hazardous Waste Management Description Category 2001 2002 Catalyst Regeneration Recycling Only 62 0 Catalyst Regeneration, Metals Recovery Recycling Only 0 0 Energy Recovery Recycling Only 20,362 14,685 Metals Recovery Recycling Only 661 515 Other Recovery Recycling Only 2,527 2,091 Primary Smelting Recycling Only 18,380 11,890 Solvents Recovery Recycling Only 2,076 2,175 Secondary Smelting Recycling Only 1,855 1,072 Total Recycling 45,924 32,428 Physical/Chemical Treatment, Metals Recovery Recycling & Disposal 2,802 2,360 Physical/Chemical Treatment, Metals Recovery, Landfilling Recycling & Disposal 17,086 10,522 Physical/Chemical Treatment, Metals Recovery, Solvents Recovery Recycling & Disposal 33,009 24 Physical/Chemical Treatment, Recycling Recycling & Disposal 17,380 1,950 Physical/Chemical Treatment, Solvents Recovery Recycling & Disposal 11,003 3,357 Physical/Chemical Treatment, Solvents Recovery, Incineration, Landfilling Recycling & Disposal 90,657 81,301 Physical/Chemical Treatment, Solvents Recovery, Landfilling Recycling & Disposal 2,047 2,363 Solvents Recovery, Landfilling Recycling & Disposal 734 572
Total Recycling & Disposal 174,717 102,449
Bioremediation Disposal Only 555 416 High-Temperature Thermal Remediation for Contaminated Soils Disposal Only 8,076 600 Incineration Disposal Only 5 8,904 Physical/Chemical Treatment Disposal Only 1,300 1,429 Physical/Chemical Treatment, Incineration, Landfilling Disposal Only 6,781 7,041 Physical/Chemical Treatment, Landfilling Disposal Only 62,413 94,643 Thermal Desorption for Remediation of Special Waste Hydrocarbons Disposal Only 0 251 Total Disposal 79,132 113,283 Unidentified 14 0 Total 299,787 248,160 % Recycling Only 15.3 13.1 % Recycling & Disposal 58.3 41.3 % Disposal Only 26.4 45.6 Source: Office of Solid Waste and Office of Enforcement and Compliance Assistance, Annual Exporter Reports, Information provided to Authors, June 24, 2004. 98 CEC, Taking Stock 2001, Table 8-12.
The Generation and Management of Hazardous Wastes and Transboundary Hazardous Waste Shipments between Mexico, Canada and the United States Since NAFTA: A 2004 Update
93
VII. Assessment/Explanation: Possible explanations of the Shifts in the US-Canada Waste Traffic Following the approach taken in the original TCPS, Proyecto Emisiones and CIELAP study on transboundary waste movements in North America, this section explores a number of potential explanations for the shifts in waste traffic seen from 1999 onwards. These include such factors as regulatory and policy changes in Canada and the United States, the establishment or removal of disposal capacity, changes in waste generation patterns, particularly among the key exporting jurisdictions, and changes in underlying economic conditions, such as shifts in economic growth, and in exchange rates. A. Regulatory/Policy Change The 2000 study on transboundary waste movements in North America completed by TCPS, Proyecto Emisiones and CIELAP highlighted the role of regulatory changes in explaining the rapid increase in waste exports from the United States to Canada in the 1993-1999 period. Specifically, these shifts occurred at a time when the United States was implementing major new rules under the Resource Conservation and Recovery Act, particularly with respect to the restriction of the land disposal of untreated wastes. At the same time, the governments of the key importing Canadian provinces, Ontario and Quebec, began to pursue aggressive policies of de-regulation with respect to hazardous waste management and the approval of hazardous waste disposal facilities. The following section examines the regulatory and policy changes that have occurred in the United States and the key Canadian jurisdictions involved in transboundary waste movements since 1999.
1. US Hazardous Waste Regulations As noted in section V, the general direction of regulatory initiatives in the US with respect to hazardous wastes over the past few years has been towards stronger rules. The implementation of MACT standards for hazardous waste combustion facilities under the Clean Air Act is particularly noteworthy in this regard as are the implementation of Land Disposal Restrictions for a variety of wastes. While there have been some recent efforts to ease paperwork and regulation for certain types of waste – including those being recycled -- these efforts have yet to be approved or implemented. For most waste streams, regulations and pollution control requirements have increased since the late 1990s. These changes would be expected to have provided incentives for increased exports to Canada, as they would increase the costs of waste disposal in the United States.
2. Canadian Federal Regulations A review of the Export/Import of Hazardous Waste Regulations (EIHWR) was initiated in 2001, following passage of a revised Canadian Environmental Protection Act in 1999. The revised Act includes explicit authority for federal environment minister to refuse to approve waste movements (international or interprovincial) if he or she believes that waste will not be managed in a manner that protects human health and the environment.99 Criteria for determining
99 Canadian Environmental Protection Act, 1999, s.185(2).

The Generation and Management of Hazardous Wastes and Transboundary Hazardous Waste Shipments between Mexico, Canada and the United States Since NAFTA: A 2004 Update
94
whether wastes will be managed in an appropriate way are to be defined through regulations made under the Act.100 There have been two rounds of national consultations on the revisions to the regulations since 2001. However, no actual changes to the regulations have been adopted to date. Draft revised regulations were published in the Canada Gazette for public comment in March 2004.101 A number of key themes have underlain Environment Canada’s proposals for the revised regulations. These include:102 • The separation (“de-coupling”) of the regulatory regimes for wastes and recyclables, with less
stringent requirements being applied to hazardous recyclable materials. • An emphasis on management processes, such as the presence of environmental management
systems on the part of receiving facilities, in the criteria for defining the environmentally sound management of wastes. Specific disposal/environmental performance requirements, such as exist in relation to land disposal or combustion facilities in the US, have not be proposed. In addition, Environment Canada has indicated that there will be no “derived from” rule103 in the new regulations.
• Commitments to improved public access to information, although no specific provisions have been proposed to date.
• E-waste has emerged as a major issue in the consultations. There are concerns, on one hand, regarding Canadian exports of electronic waste to China, potentially in contravention of Basel Convention, while on the other there are pressures from Canadian importers of e-waste for recycling purposes to relax the rules with respect to these imports.
The Canadian federal proposals have been criticized for taking a weak approach to the definition of environmentally sound management. The focus of these concerns has been the complete lack of specific operational or environmental performance requirements (e.g. operating or emission standards for combustion facilities). Rather Environment Canada’s proposals have focused exclusively on management process requirements, which as the existence of facility environmental management systems. The federal proposals have also been criticized for making inadequate provision for public access to information regarding waste movements, and placing an excessive emphasis on facilitating hazardous waste recycling, rather than promoting source reduction and pollution prevention.104 100 Canadian Environmental Protection Act, 1999, s.185(2). 101 Canada Gazette, Part I, March 20, 2004. 102 See Stratos Inc., “Proposed Revisions to the Export and Import of Hazardous Waste Regulations: Discussion Paper for Winter 2003 National Consultations” prepared for Environment Canada, December 2002. 103 Such rules require that once a waste is characterized as hazardous, it must continue to be handled and disposed of as hazardous, even if it is treated in a way that removes the hazard characteristics that caused it to be classified as hazardous. 104 See Canadian ENGO Comments on Proposed Revisions to the CEPA Export and Import of Hazardous Waste Regulations: A Response to the Discussion Paper for the Winter 2003 National Consultations and Background Paper for Drafting Instructions for the Proposed Regulations, Canadian Environmental Network May 2003
The Generation and Management of Hazardous Wastes and Transboundary Hazardous Waste Shipments between Mexico, Canada and the United States Since NAFTA: A 2004 Update
95
a. Ontario The 1995-1999 period was marked in Ontario by a strong focus on de-regulation in the areas of hazardous waste handling and disposal, and the approval of new facilities.105 A number of new or expanded disposal facilities were approved during this period, including:
• A major expansion of the Taro industrial non-hazardous waste landfill operated by Philip Services Corporation was approved in 1996. The facility was subsequently used to dispose of “treated” (i.e. solidified) hazardous wastes imported from the United States.
• A major expansion of the Laidlaw/Safety-Kleen/Clean Harbors Inc. landfill facility in Corunna was approved in 1997.
• New PCB incineration facilities were approved in Northumberland County in 1997 and in Cornwall in 1999. A further PCB incineration facility was proposed for Kirkland Lake. A facility to remove PCBs from electrical equipment was approved in Kirkland Lake in 1998.
Increasing public concern over the rapid increase in waste imports to Ontario from the United States, and the role of the relative weakness of the regulatory regime in Ontario compared to the United States in this increase in imports, prompted a significant shift in direction by the province from 1999 onwards. However, the actual changes to provincial regulations implemented to date have been limited. A number of differences in disposal standards for hazardous wastes between Ontario and the United States were identified as the key factor driving the dramatic increased in waste imports to Ontario from the early 1990s onwards. These included the following:106 • The lack of prohibitions on the land disposal of untreated wastes, similar to those that were
adopted in the United States throughout the 1990s, under the Resource Conservation and Recovery Act.
• The lack of comprehensive modern operating and emission standards for facilities that incinerate hazardous wastes or burn them as fuel. Such standards were adopted in the United States under the Clean Air Act in 1999.
• The lack of ‘mixing’ and ‘derived from’ rules as existed in the United States requiring that hazardous wastes continue to be treated as hazardous wastes even if they are diluted through mixing with other materials or have undergone some form of ‘treatment.’
In addition, shipping wastes to Canada for disposal allowed US waste generators to escape liability for environmental damage arising from improper waste handling and disposal under the US Comprehensive Environmental Response, Compensation and Liability Act. This is a result of the consideration that there are no mechanisms between Canada and the US to extend liability for environmental damage arising from the improper disposal of hazardous wastes in one country where the generator is in another. In November 2000, the province adopted similar definitions to the United States for hazardous wastes, including ‘mixing’ and ‘derived-from’ rules. The regulatory changes were introduced specifically in response to the import of hazardous wastes (metal cyanide solutions) from the
105 For a detailed discussion of this period see M.Winfield and G.Jenish, Ontario’s Environment and the ‘Common Sense Revolution:’ A Four-year Report (Toronto: Canadian Institute for Environmental Law and Policy, 1999), Part 3. 106 Texas Center for Policy Studies, CIELAP, The Generation and Management of Hazardous Wastes and Transboundary Hazardous Waste Shipments between Mexico, Canada and the United States 1990-2000, May 2001.

The Generation and Management of Hazardous Wastes and Transboundary Hazardous Waste Shipments between Mexico, Canada and the United States Since NAFTA: A 2004 Update
96
United States, their treatment via solidification using cement, and then disposal as non-hazardous wastes in an industrial non-hazardous waste landfill (the Taro facility in Stony Creek).107 The province also committed to introduce land disposal restrictions on hazardous waste, similar to those in place in the United States in December 2001.108 No action has been taken on this initiative to date. However, the adoption of land disposal restrictions was included in the platform of the new provincial government elected on October 2, 2003109 and draft regulations are expected to be released for public comment in the summer of 2004. The Canada-Wide Emission Standards for mercury and dioxins and furans110 were applied to the Clean Harbours incinerator in Corunna by the Ontario government in March 2003.111 The provincial government also committed to apply these standards to other hazardous waste incineration facilities in the province, although this has yet to be done. It is important to note that the Canada-Wide Standards only deal with mercury and dioxin and furan emissions, while the US standards, adopted in 1999, deal with a much wider range of pollutants. Requirements for annual registration of hazardous waste generators and reporting on the amounts of wastes disposed of were introduced in January 2002. This was intended to address the lack of information regarding on-site disposal of hazardous wastes. The province’s Environmental Commissioner112 and others have been critical of the quality and reliability of the information that the system will generate, and of the reporting exemptions for wastes that are to be ‘recycled.’113 No data has been made publicly available through the system to date. In his 2003 annual report to the provincial legislature, the Provincial Auditor noted that the new system to accept electronic submissions from waste generators, carriers and receivers was being used for less than 1% of hazardous waste movements. The Auditor also noted that the new system has few analysis and reporting capabilities. It could not, for example, produce summary reports of the generation and movement of hazardous waste, or generate reports that would highlight possible inspection candidates. 114 A system of modest charges for hazardous waste generators and shippers was also introduced in January 2002.115 However, the level of the charges116 is likely insufficient to provide incentives for waste reduction to waste generators. Finally, the environmental assessment for a proposed PCB incinerator in Kirkland Lake was rejected by the province as deficient in November 2002.117 The proponent has yet to re-submit the assessment. The facility had faced very strong local opposition. 107 See K.Clark and J.Yacoumidis, Ontario’s Environment and the ‘Common Sense Revolution:’ A Fifth year Report (Toronto: CIELAP, 2000), pp.49-51. 108 See EBR Registry Number PA01E0027 109 See Growing Strong Communities (Toronto: Ontario Liberal Party, November 2002), pg.8. 110 Canada-Wide Standards are standards developed under the auspices of the Canadian Council of Ministers of the Environment, and adopted by all provincial and territorial governments. Responsibility for implementation of the standards rests primarily with the provinces. See www.ccme.ca. 111 See EBR Registry Number IA00E1862 112 The Office of the Environmental Commissioner of Ontario is established under the Environmental Bill of Rights, 1993, with a mandate to report annually to the Legislative Assembly on the environmental performance of the provincial government. 113 ECO, 2001-2002 Annual Report, October 2002, pg.95. 114 See Provincial Auditor of Ontario, 2003 Annual Report of the Office of the Provincial Auditor of Ontario (Toronto: Queen’s Printer, 2003), section 3.08. 115 See EBR Registry Notice RA01E0003. 116 The charges are $5 per manifest, and $10 per tonne generated and transferred. 117 http://www.ene.gov.on.ca/envision/env_reg/ea/english/EAs/bennett.htm

The Generation and Management of Hazardous Wastes and Transboundary Hazardous Waste Shipments between Mexico, Canada and the United States Since NAFTA: A 2004 Update
97
b. Quebec As in Ontario, the government of Quebec moved to significantly relax its regulatory and approvals environment related to hazardous waste management and disposal in the late 1990s. During this period a number of new disposal facilities were approved and existing facilities expanded.118 In the result, Quebec witnessed an even larger growth in waste imports for disposal than Ontario, with imports peaking, as shown in figure 3, in 2001. In addition, a number of Quebec disposal facilities began to explicitly advertise themselves as providing liability relief for US waste generators.119 In response to public concerns over this situation, the Government of Quebec adopted regulations establishing design and operating standards for hazardous waste landfills, and imposing restrictions on the land disposal of contaminated soils in July 2001.120 The design and operating standards for disposal facilities include requirements for: • Clay and synthetic liners for landfills. • Leachate, gas and surface water collection and treatment systems. • Monitoring. • Final cover and closure.
The regulations also include prohibitions on the land disposal of contaminated soils containing higher than specified levels of contaminants, include metals, inorganic chemicals, chlorinated organic chemicals, phenols, chlorinated phenols, polyaromated hydrocarbons (PAHs), PCBs, pesticides, and dioxins and furans.
3. Conclusions It is unlikely that the policy changes in Canada and the United States since 1999 can account for the rapid decline of imports of waste into Canada for disposal, and rapid rise in exports for the purpose of recycling seen, over the past four years. The US hazardous waste rules have continued to be strengthened over the period in question. This would be expected to have encouraged increased exports to Canada for disposal, rather than resulting in their reduction. No significant changes have been made to the Canadian federal EIHWR since 1999. The adoption of contaminated soil disposal restrictions in Quebec in 2001 may account for some of the reduction in imports for disposal to that province from 2001 onwards. In Ontario the only regulatory change likely to affect imports has been the adoption of ‘mixing’ and ‘derived from’ rules in 2000. This may have affected some imports. However, it did not impact the receiving facility that shows the largest decline in imports, the Laidlaw/Safety-Kleen/Clean Harbors Canada Inc. hazardous waste landfill in Corunna. The application of the Canada-Wide Standards for dioxins, furans and mercury to the Clean Harbors incinerator in Corunna only occurred in March 2003, well after the decline in imports into Ontario for disposal began to take place.
118 These included the Bennett Environmental Inc. incinerator at St. Ambroise, and an expanion of the Stablex solidification facility in Blainville. See Jacott, Reed and Winfield, The Generation and Management of Hazardous Wastes in North America, pg.46. 119 M.Mittelstaedt, “Quebec dump wants contaminated U.S. soil,” The Globe and Mail June 25, 2001. 120 OC 843-2001, 27, June 2001.
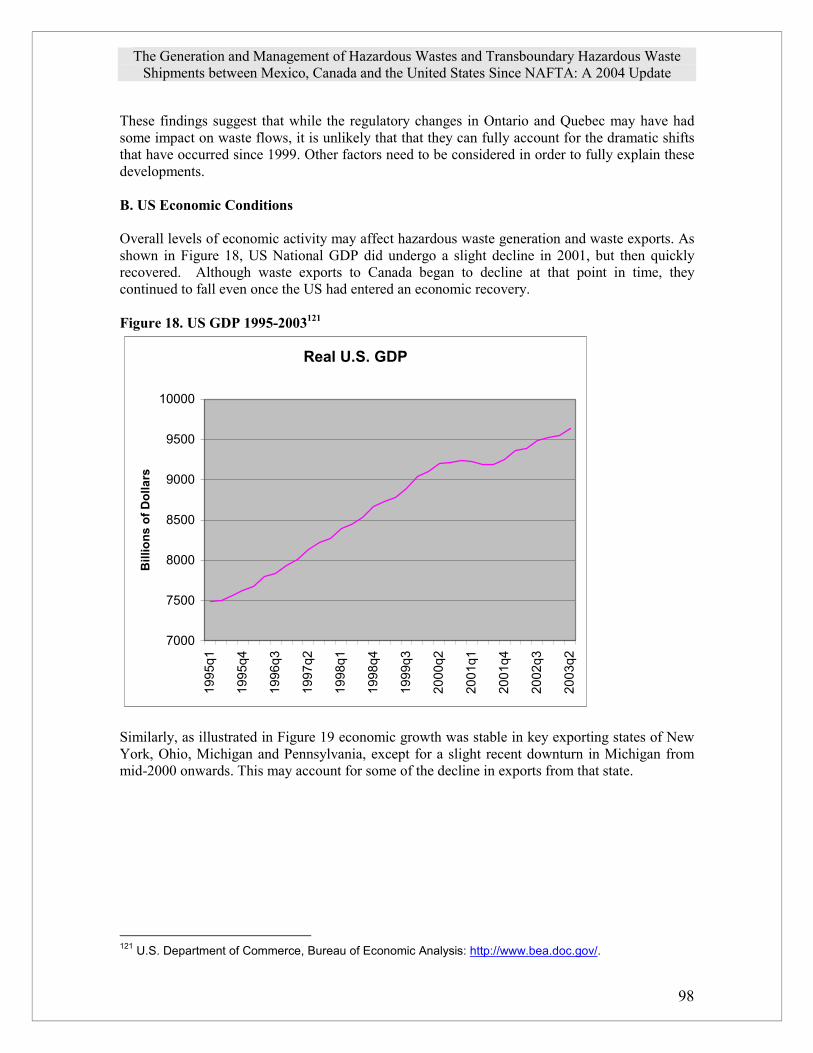
The Generation and Management of Hazardous Wastes and Transboundary Hazardous Waste Shipments between Mexico, Canada and the United States Since NAFTA: A 2004 Update
98
These findings suggest that while the regulatory changes in Ontario and Quebec may have had some impact on waste flows, it is unlikely that that they can fully account for the dramatic shifts that have occurred since 1999. Other factors need to be considered in order to fully explain these developments. B. US Economic Conditions Overall levels of economic activity may affect hazardous waste generation and waste exports. As shown in Figure 18, US National GDP did undergo a slight decline in 2001, but then quickly recovered. Although waste exports to Canada began to decline at that point in time, they continued to fall even once the US had entered an economic recovery. Figure 18. US GDP 1995-2003121
Real U.S. GDP
7000
7500
8000
8500
9000
9500
10000
1995
q1
1995
q4
1996
q3
1997
q2
1998
q1
1998
q4
1999
q3
2000
q2
2001
q1
2001
q4
2002
q3
2003
q2
Bill
ions
of D
olla
rs
Similarly, as illustrated in Figure 19 economic growth was stable in key exporting states of New York, Ohio, Michigan and Pennsylvania, except for a slight recent downturn in Michigan from mid-2000 onwards. This may account for some of the decline in exports from that state.
121 U.S. Department of Commerce, Bureau of Economic Analysis: http://www.bea.doc.gov/.

The Generation and Management of Hazardous Wastes and Transboundary Hazardous Waste Shipments between Mexico, Canada and the United States Since NAFTA: A 2004 Update
99
Figure 19: Gross State Product, Key Exporting States122
Gross State Product (millions of current dollars)
200,000
300,000
400,000
500,000
600,000
700,000
800,000
900,000
1995 1996 1997 1998 1999 2000 2001
MichiganNew YorkOhioPennsylvania
Shifts in exchange rates have sometimes been advanced as potential explanations for the changes in Canada-US waste flows. However, as illustrated in Figure 20, although exchange rate trends have sometimes correlated with waste trends, at other times the trends have moved in opposite directions. The decline in US waste exports to Canada, for example, began long before the recent rise in the value of the Canadian dollar.
122 U.S. Department of Commerce, Bureau of Economic Analysis: http://www.bea.doc.gov/.

The Generation and Management of Hazardous Wastes and Transboundary Hazardous Waste Shipments between Mexico, Canada and the United States Since NAFTA: A 2004 Update
100
Figure 20: CDN-US Exchange Rates and Waste Flows. 123
CDN-U.S. Exchange Rate and CDN Exports of Hazardous Wastes
0.6
0.62
0.64
0.66
0.68
0.7
0.72
0.74
0.76
0.78
0.8
1993
1994
1995
1996
1997
1998
1999
2000
2001
2002
2003
U.S
. Dol
lars
85000
185000
285000
385000
485000
585000
685000
785000
Tonn
es
Exchange RateRecyclingDisposalTotal
Finally, a review of US waste generation data indicates that total waste generation increased in the Canada-US Border states between 1995-2001. For example, if all Canada-US Border states are included, total waste generation increased from 13.6% to 22.5 percent of all waste generated in the U.S. over the time period. Excluding wastewaters, facilities located in the Canada-U.S. border states generated about 4.1 million tons of waste in 1995, while in 2001 facilities in those same states generated more than 8.3 million tons of hazardous wastes. A similar trend can be found for waste generated in the non-border states of New Jersey and Indiana – which have been exporters of waste to Canada -- where again, waste generation increased between 1995 and 2001. Similarly, there was also an increase in the amount of waste in the Canada – U.S. states shipped off-site and received. For example, between 1995 and 2001, TSD (Treatment, Storage and Disposal) facilities in these states reported a slight increase in the amount of waste received, from approximately 2.2 million tons in 1995 to 2.5 million tons in 2001, indicating that more waste was being treated within large states like Ohio, Michigan and New York rather than being shipped out of state. Interestingly, in 1999, off-site receipts of waste fell in several states such as Michigan, New York and Pennsylvania, but then increased significantly in 2001, possibly indicating that waste that was being shipped to Canada in 1999 was staying within the states in 2001. As an example, a major landfill in Belleville Michigan – the Michigan Disposal Facility – increased its receipts of hazardous wastes from some 95,534 tons to 203,703 tons between 1999
123 Data from the Bank of Canada http://www.bank-banque-canada.ca/en/exchange.htm

The Generation and Management of Hazardous Wastes and Transboundary Hazardous Waste Shipments between Mexico, Canada and the United States Since NAFTA: A 2004 Update
101
and 2001. In summary, the data from the U.S. Environmental Protection Agency on hazardous wastes indicates that waste generation in the Canada-US Border states increased over the time period, and that off-site shipments and receipts in the major states also increased even as exports to Canada decreased. In summary, none of the changes in waste generation or in general economic conditions in the United States can account for the major shifts in waste import/export patterns between Canada and the United States that took place over the 1999-2003 period. D. Economic Distress on Part of Key Importers
1. Ontario In 1998, facilities operated by two companies, Safety-Kleen Canada Inc., and Philip Enterprises/Environmental Services, accounted for 95% of the waste imports from the United States reported through the Ontario waste manifest system.124 Both firms suffered significant economic difficulties from 1999 onwards. Safety-Kleen Canada Inc. Laidlaw Inc., the long-term owner and operator of the Corunna landfill and incineration facility, acquired Safety-Kleen Ltd. in March 1998. In the fall of 1999, leaks of water and methane into one of the new cells of the Corunna landfill approved in 1996 resulted in the shut down of some areas of the facility for several months.125 Safetly-Kleen Inc. filed for bankruptcy in the United States in June 2000 following the revelation of accounting irregularities. This led to the bankruptcy of Laidlaw, now Safety-Kleen’s parent company, in June 2001. Suits and counter suits followed between Laidlaw and Safety-Kleen, with Laidlaw claiming $6.5 billion in damages from Safety Kleen, and Safety Kleen claiming $13.8 billion against Laidlaw. These suits were settled in July 2002 for $225 million in favour of Safetly-Kleen., allowing both firms to emerge from bankruptcy.126 Clean Harbors Inc., then acquired Safety-Kleen Chemical Services, including the Corunna landfill and incinerator in September 2002. 127
Philip Environmental Services. Philip Environmental Services declared bankruptcy in June 1999,128 following the revelation accounting irregularities, particularly with respect to the status of stocks of recycled metals the firm had stated that it held.129 The company’s operations had been disrupted from the time of these revelations in January 1998130 and the company remained in 124 Yacoumidis, Ontario: Open for Toxics, Table 31. The two firms accounted for 225,111 tonnes of the total of 235,495 tonnes reported as imported from the United States. The key receiving facilities were the Safety-Kleen Ltd. Corunna Landfill (120,934 tonnes); Safety Kleen Canada Ltd. Breslau Oil and Solvent Reprocessing Facility (49,831 tonnes); the Safety Kleen Ltd Corunna Incinerator (32,978 tonnes) and the Philip Environmental Services Corporation Parkdale Avenue processing facility in Hamilton (7,464 tonnes). 125 See Canadian Institute for Environmental Law and Policy, “Application for Review under the Environmental Bill of Rights: Hazardous Waste Management,” December 20, 1999. EBR Registry No.99EBR005.R. 126 Laidlaw Inc., “Laidlaw and Safety-Kleen Settle Disputes,” Canada Newswire, July 18, 2002. R.Blackwell, “Laidlaw to re-emerge with a clean slate,” The Globe and Mail June 9, 2003. 127Clean Harbors Inc., “Clean Harbors Completes Acquisition for Safety-Kleen’s Chemical Services Division, Secture $260 Million in Financing, Canada Newswire, September 11, 2002. 128 See P.Waldie, “Court gives Philip Services until September 15 to restructure,” The Globe and Mail, July 13, 1999 129 “Philip Update,” Hazmat Magazine, April/May 1999. See also J.McFarland, “Philip dumps management team,” The Globe and Mail, May 8, 1998. 130 See, J.MacFarland, “Philip shares plunge amid controversy,” The Globe and Mail, January 7, 1998.
The Generation and Management of Hazardous Wastes and Transboundary Hazardous Waste Shipments between Mexico, Canada and the United States Since NAFTA: A 2004 Update
102
difficulty until its reestablishment as a US company in April 2000. 131 Philip had emerged as a major importer and processor of recycled metals. The firm’s bankruptcy may explain the decline in imports of metals for recycling to Ontario, and the increase in exports. The dramatic decline in Philip Service’s role as an importer for metal recycling purposes between 1998 and 2001 was captured in the CEC’s 2001 Taking Stock report, with Philip’s two main metal recycling facilities reporting imports of 13,822 tonnes of TRI and NPRI listed substances for recycling in 1998 and only 13 tonnes in 2001.132 Importantly, in the same period, its energy recycling operation reported an increase in solvents like xylenes and toluenes from 691 tonnes to 14,639 tonnes over the same period.133 Philip’s role as a waste importer was also affected by adoption of a “derived-from” rule by Ontario in November 2000. This rule was intended to specifically block the firm’s practice of importing hazardous wastes, mixing them with cement so that they could pass the leachate tests through which wastes were designated as hazardous, and disposing of them in the firm’s Taro landfill.134 The US based Philip again sought bankruptcy protection, including its Canadian subsidiaries, in June 2003.135 Other changes in individual firm behaviour may also have affected the trends, particularly with respect to exports for recycling. Co-Steel Lasco, an electric arc furnace (EAF) steel mill in Whitby Ontario, shifted from disposal of its EAF dust in Canada to exports of the waste to the United States for recycling.136
2. Quebec
Detailed analyses of Quebec waste manifest data are not available, and therefore a detailed analysis of the underlying trends in waste imports and exports to and from that province is not possible. Imports of waste to Quebec for disposal began to fall off from their peak in 2001 onwards, suggesting that the adoption of restrictions on the land disposal of contaminated soil by the province in July 2001 may have impacted this traffic. The situation with respect to import and export trends for recycling is less clear, although there has been a steady decline in imports to Quebec from 2000 onwards. These CEC’s analyses for Taking Stock suggest that these shifts are largely related to imports and exports of metals. A year-long strike, beginning in June 2002 and running until May 2003 at Noranda Inc.’s Horne Smelter in Rouyn-Noranda, may have affected imports, as the facility has been a major recipient of waste metal imports for recycling.137 However, the facility’s imports of metals from the United States for recycling were in decline prior to the strike. The CEC’s Taking Stock 2001 analysis, for
131 “Philip emerges from bankruptcy protection” The Globe and Mail, April 18,. 2000. 132 CEC, Taking Stock 2001, Table 8-17. 133 CEC, Taking Stock 2001, Table 8-18. 134 See K.Clark and J.Yacoumidis, Ontario’s Environment and the ‘Common Sense Revolution:’ A Fifth Year Report (Toronto: CIELAP, 2000), Chapter 4. 135 “PSC receives debtor-in possession loan facility,” Hazardous Materials Management, June 8, 2003. 136 CEC, Taking Stock 2000, Table 6-17. 137 “COPPER PRODUCTION NEWS – Horne Smelter Seeks Profitability” Canadian Mining Journal, October 22, 2003.

The Generation and Management of Hazardous Wastes and Transboundary Hazardous Waste Shipments between Mexico, Canada and the United States Since NAFTA: A 2004 Update
103
example, indicates that imports of metals declined from 7,878 tonnes to 950 tonnes between 1998 and 2001.138 A second major Quebec-based receiver of metals imports for recycling, Norsk Hydro, also reported a major reduction in imports from 1998-2000, with its imports falling from 1,147 tonnes to 0.2 tonnes.139 Shifts in metals prices may be a significant factor in the trends with respect to imports and exports for recycling, particularly where margins are small, and transportation costs a significant consideration.140 The recent rise in gasoline and diesel prices may also discourage transfers of recycling wastes across borders. E. Future Trends Although the pattern of rapid approvals for new and expanded disposal facilities of the mid-1990s has subsided, proposals for new disposal facilities continue to come forward. Approval was granted, for example, in September 2003 for the construction of a hazardous waste incinerator in Belledune, New Brunswick.141 The facility’s approval permits the import of creosote and non-chlorinated hydrocarbon contaminated soil and requires that imported materials leave the province within three months or be incorporated into value added marketable products. 142 The approval is being appealed by local residents, as it may lead to large increase in imports into New Brunswick, which has previously seen very little transboundary waste traffic. There are no specific operating or emission standards for hazardous waste combustion facilities adopted by New Brunswick or the federal government. The only relevant standards of general application are the Canadian Council of Ministers of the Environment Canada Wide Standards for emissions of mercury and dioxins and furans for hazardous waste incinerators. The application of these standards to individual projects is, however, at the discretion of the provincial government approving the facility. An approval to operate has yet to be issued for the facility, although the approval to construct includes specific emission limits as detailed in Table 60. The requirements with respect to dioxins and furans and mercury do reflect the Canada-Wide Standards for incinerator emissions for these substances. With the exception of these three substances for which Canadian-wide standard exist, the proposed emission limits for the other contaminants are significantly above both the interim emission limits contained in the MACT standards in the U.S. as well as the proposed final MACT standards for newly built incinerators published in the U.S. Federal Registry April 20, 2004.143
138 CEC, Taking Stock 2001, Table 8-18. 139 CEC, Taking Stock 2001, Table 8-18. 140 See, Allan Robinson, “Noranda to cut production at Horne copper smelter,” The Globe and Mail October 16, 2003. 141 Communications New Brunswick, “Approval to construct issued to Bennett Environmental News Release, September 9, 2003. 142 New Brunswick Environment and Local Government Certificate of Determination – New Brunswick Environmental Impact Assessment Regulation File No.4561-3-897, January 17, 2003; New Brunswick Environment and Local Government Approval to Construct I-4128 September 9, 2003. 143 U.S. Federal Register (Vol. 69, No. 76), Proposed MACT Rules for Combustion Facilities, April 20, 2004, Table 2, P. 21210.
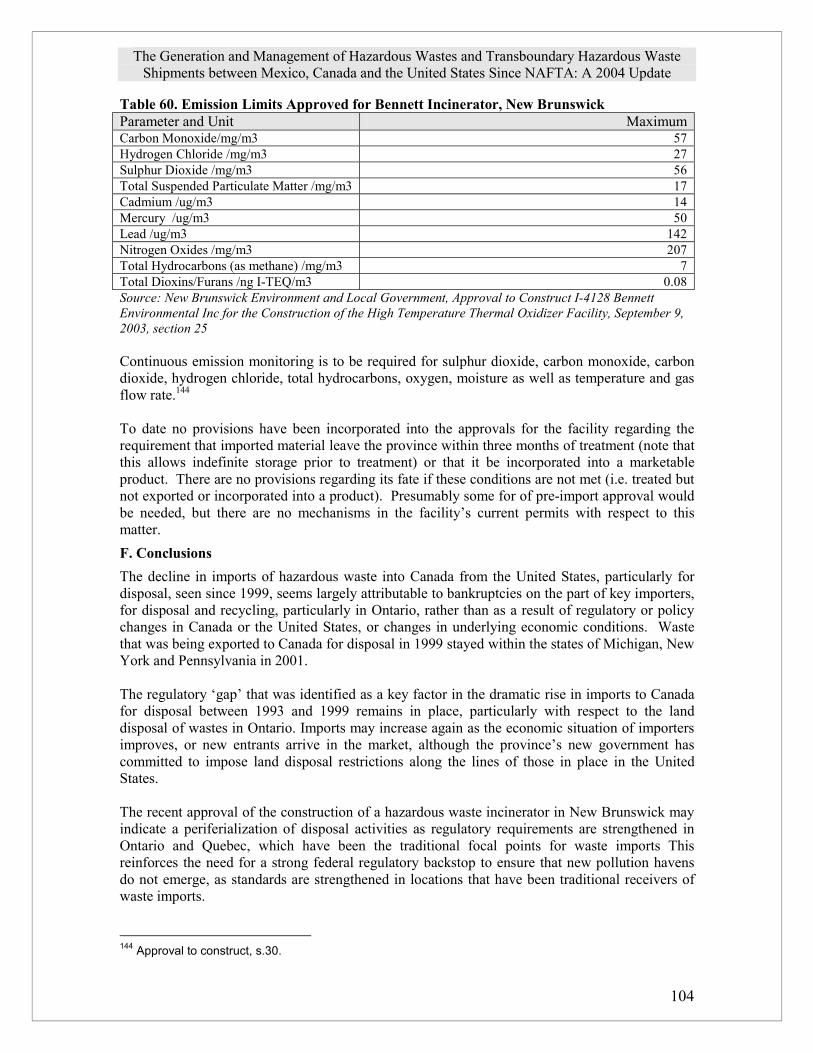
The Generation and Management of Hazardous Wastes and Transboundary Hazardous Waste Shipments between Mexico, Canada and the United States Since NAFTA: A 2004 Update
104
Table 60. Emission Limits Approved for Bennett Incinerator, New Brunswick Parameter and Unit Maximum Carbon Monoxide/mg/m3 57 Hydrogen Chloride /mg/m3 27 Sulphur Dioxide /mg/m3 56 Total Suspended Particulate Matter /mg/m3 17 Cadmium /ug/m3 14 Mercury /ug/m3 50 Lead /ug/m3 142 Nitrogen Oxides /mg/m3 207 Total Hydrocarbons (as methane) /mg/m3 7 Total Dioxins/Furans /ng I-TEQ/m3 0.08 Source: New Brunswick Environment and Local Government, Approval to Construct I-4128 Bennett Environmental Inc for the Construction of the High Temperature Thermal Oxidizer Facility, September 9, 2003, section 25 Continuous emission monitoring is to be required for sulphur dioxide, carbon monoxide, carbon dioxide, hydrogen chloride, total hydrocarbons, oxygen, moisture as well as temperature and gas flow rate.144 To date no provisions have been incorporated into the approvals for the facility regarding the requirement that imported material leave the province within three months of treatment (note that this allows indefinite storage prior to treatment) or that it be incorporated into a marketable product. There are no provisions regarding its fate if these conditions are not met (i.e. treated but not exported or incorporated into a product). Presumably some for of pre-import approval would be needed, but there are no mechanisms in the facility’s current permits with respect to this matter. F. Conclusions The decline in imports of hazardous waste into Canada from the United States, particularly for disposal, seen since 1999, seems largely attributable to bankruptcies on the part of key importers, for disposal and recycling, particularly in Ontario, rather than as a result of regulatory or policy changes in Canada or the United States, or changes in underlying economic conditions. Waste that was being exported to Canada for disposal in 1999 stayed within the states of Michigan, New York and Pennsylvania in 2001. The regulatory ‘gap’ that was identified as a key factor in the dramatic rise in imports to Canada for disposal between 1993 and 1999 remains in place, particularly with respect to the land disposal of wastes in Ontario. Imports may increase again as the economic situation of importers improves, or new entrants arrive in the market, although the province’s new government has committed to impose land disposal restrictions along the lines of those in place in the United States. The recent approval of the construction of a hazardous waste incinerator in New Brunswick may indicate a periferialization of disposal activities as regulatory requirements are strengthened in Ontario and Quebec, which have been the traditional focal points for waste imports This reinforces the need for a strong federal regulatory backstop to ensure that new pollution havens do not emerge, as standards are strengthened in locations that have been traditional receivers of waste imports.
144 Approval to construct, s.30.

The Generation and Management of Hazardous Wastes and Transboundary Hazardous Waste Shipments between Mexico, Canada and the United States Since NAFTA: A 2004 Update
105
VIII. Conclusions and Recommendations This report updates the 2001 CEC-supported report The Generation and Management of Hazardous Wastes and Transboundary Hazardous Waste Shipments between Mexico, Canada and the United States, 1990 – 2000. The principle and potentially disturbing finding of the previous report was the dramatic growth in US waste exports to Ontario and Quebec and, in the context of a weakened regulatory environment, a significant increase in disposal capacity in those provinces, as well as significant data gaps in tracking imports and exports in all three countries.
The present report found that U.S. exports to Canada in the past three years have actually declined. Rather than a reflection of the implementation of stricter regulations in Canada – which to a limited degree has occurred – the decline is likely the result of financial and management problems with the key importers of waste into Canada – Safety Kleen and Philips Environmental Services. With the sale in 2002 of much of Safety Kleen’s operations to Clean Harbors Inc, it remains to be seen to what extent U.S. exports to Canada will continue to rise. In fact, while imports overall to Canada did decline in the 1999 to 2003 period, data suggests that imports for some kinds of management services – like energy recycling and incineration – may have actually increased.
In fact, the regulatory gap that was identified as a key factor in the growth in imports to Canada from the United States for disposal between 1993 and 1999 remains in largely place, particularly at the federal level. The adoption of somewhat more stringent facility approval requirements and disposal standards in Ontario and Quebec, in the absence of strong federal standards, may also be having the effect of prompting disposal facility proponents to seek to establish new facilities in other provinces. The recent proposals for a thermal treatment facility in New Brunswick may be evidence of such a trend.
In addition, the report found that while the data is incomplete or inconsistent due to a number of factors, it appeared that exports of waste from the U.S. to Mexico – consisting mainly of Electric Arc Furnace dust from steel mini-mills, as well as Lead Acid Batteries and tires – increased between 1999 and 2002. (As an example of inconsistency, U.S. data indicates a significant decline between 1999 and 2001 in EAF dust sent to Mexico, while Mexican data suggests that imports of EAF dust hovered around 200,000 tons between 1999 and 2002). While the incompleteness of the data makes it difficult to surmise the reasons for this trend, it is most likely due to the continued economic health of an EAF dust recycler in Mexico, as well as the option to export LAB and tires to Mexico with minimal recordkeeping, at least on the U.S. side. This report was not able to determine to what extent electronic waste – of considerable concern in all three countries – is being shipped to Mexico in part because of loopholes in reporting requirements.
Exports have also likely increased from Mexico to the U.S. over the period, although again data issues prevent a definitive conclusion. Data from 2002 in the U.S.’s HAZTRAKS database suggests that Mexican industrial waste ends up either in non-hazardous landfills in New Mexico, Texas or Arizona or hazardous landfills in Texas, Nevada or California, while Mexican data on export authorizations suggest that the largest volume of waste being authorized is drilling waste, related to PEMEX activities in natural gas and oil field exploration in the Burgos Oil Fields. Additional research is needed to determine to what extent this export is actually occuring and where it is going.
A particular concern for the authors is the attempt at the federal level in all three countries to create a differential regulatory scheme for hazardous waste management for disposers versus “recyclers” of hazardous waste. While the authors recognize that recycling is often a prefered option over disposal options, the move to deregulate recycling may prevent the best option of all: preventing hazardous waste from being generated in the first place. The deregulation in reporting
The Generation and Management of Hazardous Wastes and Transboundary Hazardous Waste Shipments between Mexico, Canada and the United States Since NAFTA: A 2004 Update
106
and management for hazardous wastes that are recycled could also lead to an increase in exports and imports of such waste without proper controls. Examples of these changes include the move to change the definition of solid waste in the U.S. to exclude secondary recycled materials; the move in Mexico to deregulate some wastes previously “subject to control”, create “special management waste” and exempt some requirements for waste co-processed as fuel in cement kilns, and the move in Canada to create different regulatory standards for recycled wastes. While it is reasonable to create incentives for wastes to be reused rather than disposed of, in most cases it is not necessary to deregulate basic tracking mechanisms and standards, particularly for wastes that potentially cross borders.
This report also reconfirmed the significant data gaps on hazardous waste generation, management and transboundary shipments between the three countries. Specific concerns include:
Both Mexico and Canada appear to be still years away from having an accurate count of hazardous waste generated on a facility by facility basis, making it difficult to plan for needed infrastructure and help promote pollution prevention. Mexico now has more comprehensive national data on waste generation and waste disposal facilities than does Canada;
With approval of an obligatory and publicly accessible PRTR in Mexico in 2001, and significant support from the CEC, Mexico approved the actual regulations implementing such an information system in 2004; however, the actual standard detailing which chemicals will be reported and how the annual operating permits will be handled could take up to two years to develop;
While information on imports and exports of hazardous wastes from Mexico appears to have improved over the last three years, there continues to be a disconnect between what is actually “authorized” for import and export and what actually crosses the border;
While the U.S. EPA has some good information on import and export notices, these notices do not actually provide information on volumes or types of waste, at least in a pubicly-accessible form. Recent efforts to summarize annual export data submitted by primary exporters should be applauded.
While there is information in Mexico about facilities authorized to treat or manage hazardous wastes, there is little information about the amount of waste actually treated by these facilities;
While the U.S. has for several years required reporting of the generation of hazardous wastes, there appear to be significant gaps in the information, and budget cuts have prevented the most recent disaggregated data from being queried on-line;
Exemptions from reporting in U.S. law – under RCRA – for some types of recycling – including Lead Acid Batteries and some electronic waste -- as well as current proposals to make CRT monitors a “Universal” waste have led to a lack of manifest and export data on these wastes. These gaps are particularly worrisome given past problems with lead smelters in Mexico importing U.S. waste as well as with the well-evidenced problems of electronic wastes exported to China and other Asian countries;
The October 2003 U.S. EPA proposal to change the definition of solid waste, allowing secondary hazardous materials that are generated and managed in a continuous process within the same industry to be excluded from RCRA hazardous waste requirements,

The Generation and Management of Hazardous Wastes and Transboundary Hazardous Waste Shipments between Mexico, Canada and the United States Since NAFTA: A 2004 Update
107
could lead to problems in tracking off-site transport of hazardous wastes, particularly across borders.
While the U.S. EPA made some efforts to create a hazardous tracking system on its Southern Border, in 2003 funding was pulled from the HAZTRAKS database project, leaving the U.S. with no specific plan to track hazardous wastes imported from Mexico.
Because scrap and used tires have been put on and off a “subject to control” list in Mexico, it is likely that thousands of tons of tires are flowing to Mexico, either for illegal dumping or burning in cement kilns, but the exact amount is unknown. Recent proposals to allow for even more imports for the purpose of burning them in cement kilns is worrisome.
Finally, the report confirmed a general problem of enforcement of hazardous waste labeling, tracking and management across the borders. As an example, there are only minor, small scale programs at the Ports of Entry in the U.S. to inspect and enforce RCRA import and export regulations on hazardous wastes, even as the amount of traffic across the borders continues to grow. Only California appears to be dedicating significant amounts of state funds to this effort, while Texas, New Mexico and Arizona have backed away from prior commitments, due both to budget shortfalls and confusion about who is responsible in the wake of the terrorist attacks on the U.S. While the recent decision to open the U.S. to Mexican carrier trucks will lead to greater safety inspections, the Department of Transportation is focused on truck safety and proper registration, not on environmental issues like the Clean Air Act and RCRA. Given these data, policy and enforcement gaps, this report makes a number of short-term and long-term recommendations for both the governments and the North American Commission for Environmental Cooperation. These include:
In light of the recent Chapter 11 decisions regarding S.D.Myers, Metalclad and TECMED which we believe ultimately undermine the right of Parties to enforce their own environmental standards rules, the three Parties must again revisit NAFTA's Chapter 11 provisions. Appropriate changes must be made to safeguard the ability of Parties to set and maintain environmental standards and make environmental policy decisions which they regarding as necessary to protect the health and environment of their citizens.
Through the CEC, the three parties should reopen negotiations on transboundary environmental impact assessments, as mandated by NAFTA.
The CEC should continue to promote the interchange of successful experiences in North America of industries which have committed to and achieved source reduction and pollution prevention.
The CEC should facilitate the interchange and cooperation among governments, institutes, academics and industry of information and technologies which promote pollution prevention and the development and use of cleaner technologies.
The difficulty in tracking hazardous wastes across borders is a serious concern. All three countries should work to improve reporting and tracking of hazardous waste generation and disposal and strengthen the compatibility of their hazardous waste tracking systems. The 2003 decision by the Council to look into coordinating and improving these systems should continue.

The Generation and Management of Hazardous Wastes and Transboundary Hazardous Waste Shipments between Mexico, Canada and the United States Since NAFTA: A 2004 Update
108
The CEC should make a specific focus on electronic wastes, particularly as countries develop take-back legislation. The NAFTA countries – through the CEC – should assure that electronic wastes can be tracked to assure that exports from one country to another, or indeed outside the region, are being properly handled.
All three countries should agree on a system of common unique identifiers for facilities receiving transfers of PRTR listed substances in their national PRTR systems. This would facilitate the detailed analysis of transboundary transfers of PRTR substances, particularly as Mexico creates its own system.
Mexico should finalize its standards governing its obligatory Pollutant Release and Transfer Registry -- known in Mexico as the RETC -- particularly those parts detailing both toxic releases and hazardous waste generation. As part of this effort, Mexico should conduct and make publicly accessible a complete inventory of the types and volumes of hazardous wastes generated and treated in the country. This should help Mexico develop a true policy of source reduction and the promotion of clean technologies.
Mexican government officials must respect the right to environmental information and recognize the right to know the volumes, types and management of the waste generated by the industrial sector.
Mexico should conduct a full needs assessment of hazardous waste management capacity and shortages, including opportunities for source reduction and reuse. The new proposed regulations for the General Waste Law would obligate Mexico to produce a “Basic Diagnostic” of hazardous wastes, which could serve as a model for this assessment. The CEC could play a role in coordinating this effort.
Mexico should issue a definitive ruling that incineration and use of hazardous wastes as a fuel in cement kilns and other industrial furnaces is a disposal technology and therefore importation of hazardous wastes to such facilities is not permitted under Mexican law. This ban should include wastes “subject to control” such as scrap tires.
Mexico should amend its proposed regulations to the new hazardous waste law (LGPYGIR) to make sure that facilities proposing to co-process hazardous wastes as fuels – such as cement kilns – require the same authorization process – including risk assessments -- as other managers of hazardous waste, such as incinerators, rather than giving a blanket approval to such practices. This should include both liquid hazardous wastes and solid waste such as used scrap tires.
Mexico should reactivate and expand its SIRREP (Sistema de Rastreo de Residuos Peligrosos) which will allow it to know, inform and control the quantities and types of wastes moving across its borders. Providing information only on the number of authorizations or movements does not assure compliance with environmental legislation nor with integrated waste management methods.
Mexico should incorporate basic notice requirements and public participation mechanisms into its new regulations for the hazardous waste law for residents who could be impacted by new hazardous waste management facilities seeking permits or authorizations to operate;
Canada needs to establish regular national waste generation and disposal reporting requirements for hazardous waste generators, as well as a system to make the resulting information publicly available and accessible.

The Generation and Management of Hazardous Wastes and Transboundary Hazardous Waste Shipments between Mexico, Canada and the United States Since NAFTA: A 2004 Update
109
Canada should adopt standards for "environmentally sound disposal" of hazardous wastes, as per its obligations under the Basel Convention. These standards should be at least comparable to the U.S. RCRA standards for land disposal, and the RCRA/Clean Air Act MACT standards for hazardous waste incinerators and other facilities burning hazardous wastes as ‘fuel.’ Canada should incorporate “derived from” and “mixing” rules into its definitions of hazardous wastes within the Export/Import of Hazardous Waste Regulations made under the Canadian Environmental Protection Act 1999.
The U.S. should rescind or ammend RCRA regulations which exclude used batteries from export notification requirements to accurately track exports from the U.S. to Mexico and other countries.
The U.S. should put both its proposal to change the definition of Solid Waste – designed to reduce regulations for hazardous waste being recycled – on hold, particularly until a better system to track wastes across borders is put in place.
The U.S. should increase resources to border states to adequately inspect Ports of Entry for compliance with hazardous waste handling, transport and reporting requirements and increase cooperation between U.S. Customs and state, local and federal environmental authorities to track hazardous waste in a timely manner.
The U.S. must come up with an alternative to HAZTRAKS, which was canceled in 2003. If HAZTRAKS was a less than stellar system for tracking hazardous wastes, its absence only makes it apparent that the U.S. does not have a timely, complete system to track its imports and exports of hazardous and other potentially dangerous solid wastes.