Embed Size (px)
Citation preview
1 / 27
Chris Justice (UMD)
The GEO Global Agricultural Monitoring Initiative (GEOGLAM):
Overview
© GEO Secretariat
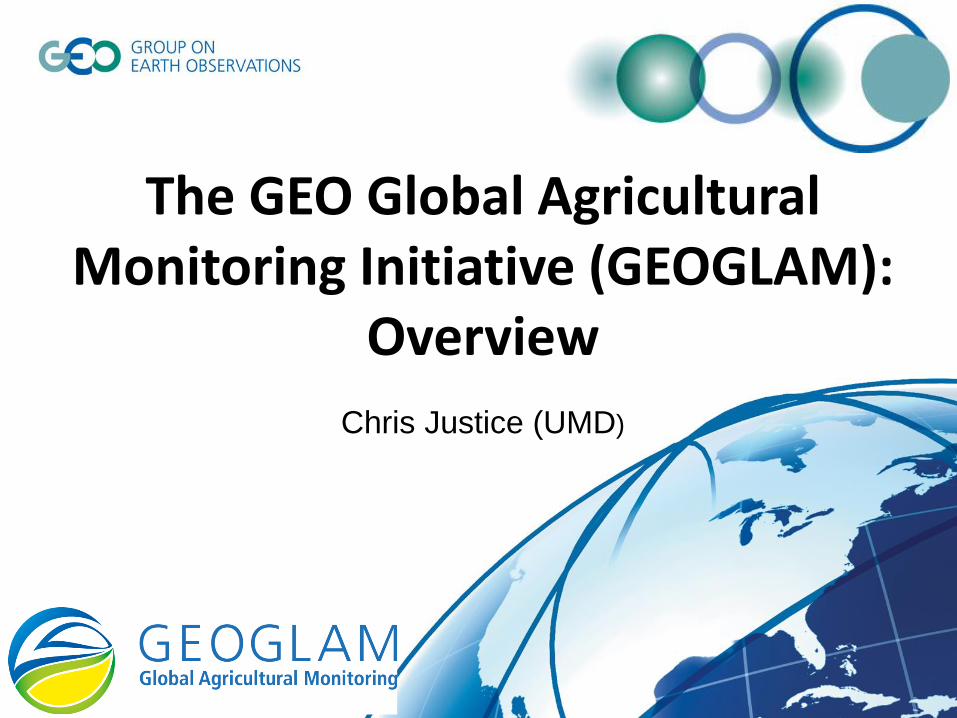
GEO the Group on Earth Observations an Intergovernmental Organization with 90 Members
and 67 Participating Organizations
U.S. Department of State, Washington DC. July 31, 2003
Led to the Establishment of a
Global Earth Observing System of Systems (GEOSS)
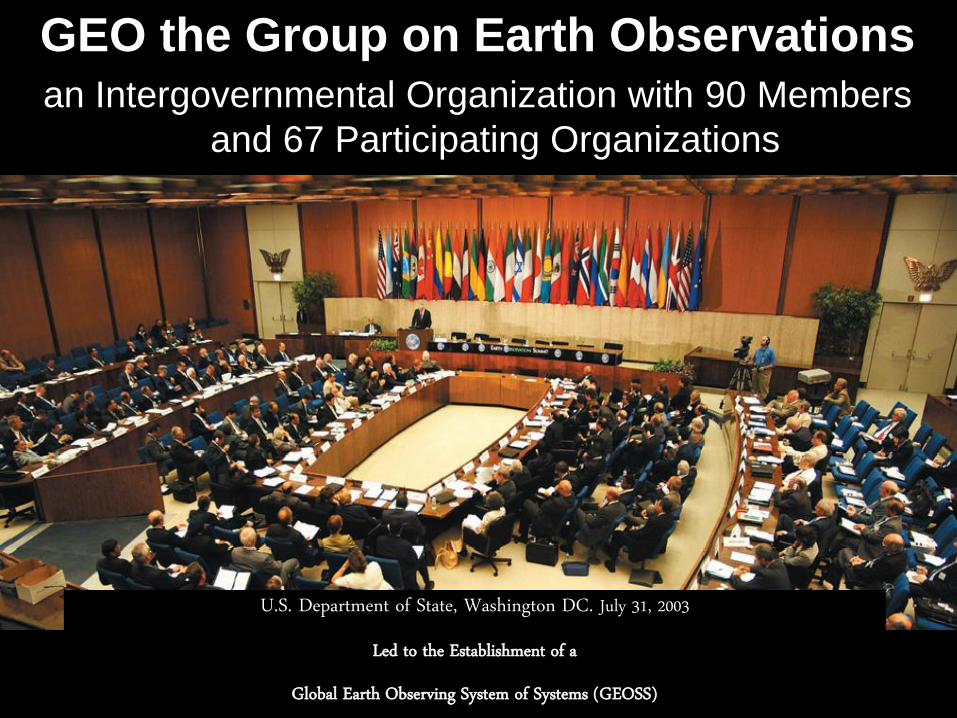
GEO is focused on societal benefit
Agriculture is one of the GEO societal benefit areas GEO provides an international framework for collaboration
GEOGLAM vision
…the use of coordinated,
comprehensive and sustained
Earth observations to inform
decisions and actions in agriculture
…through a system of agricultural
monitoring systems
Who We Are Open Community made up of international and national agencies
concerned with agricultural monitoring including ministries of Ag, space agencies, universities, and industry
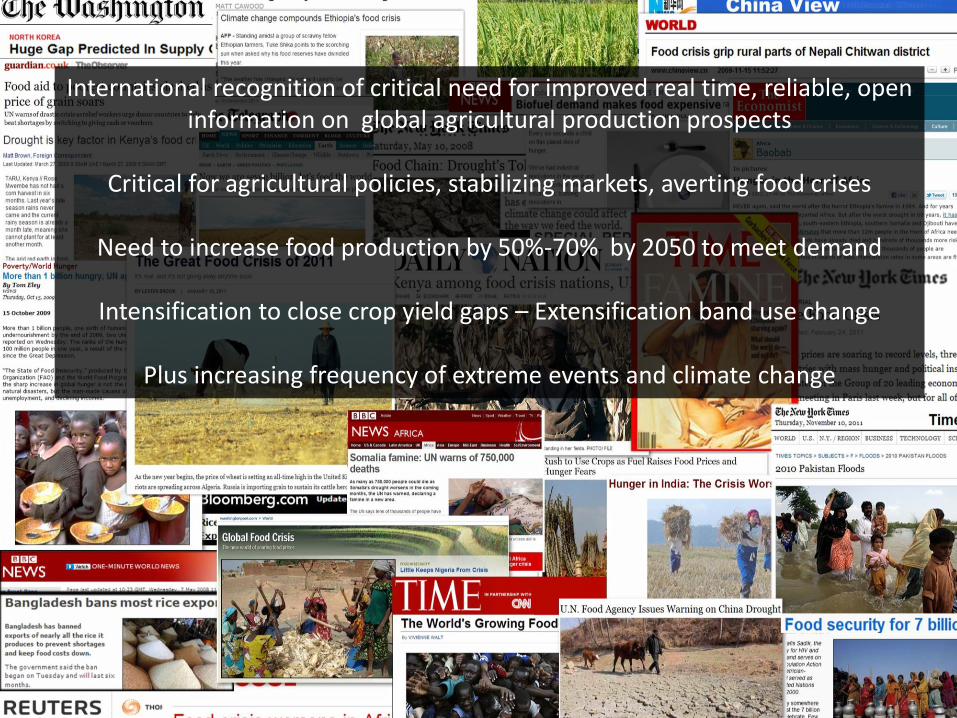
International recognition of critical need for improved real time, reliable, open information on global agricultural production prospects
Critical for agricultural policies, stabilizing markets, averting food crises
Need to increase food production by 50%-70% by 2050 to meet demand
Intensification to close crop yield gaps – Extensification band use change
Plus increasing frequency of extreme events and climate change
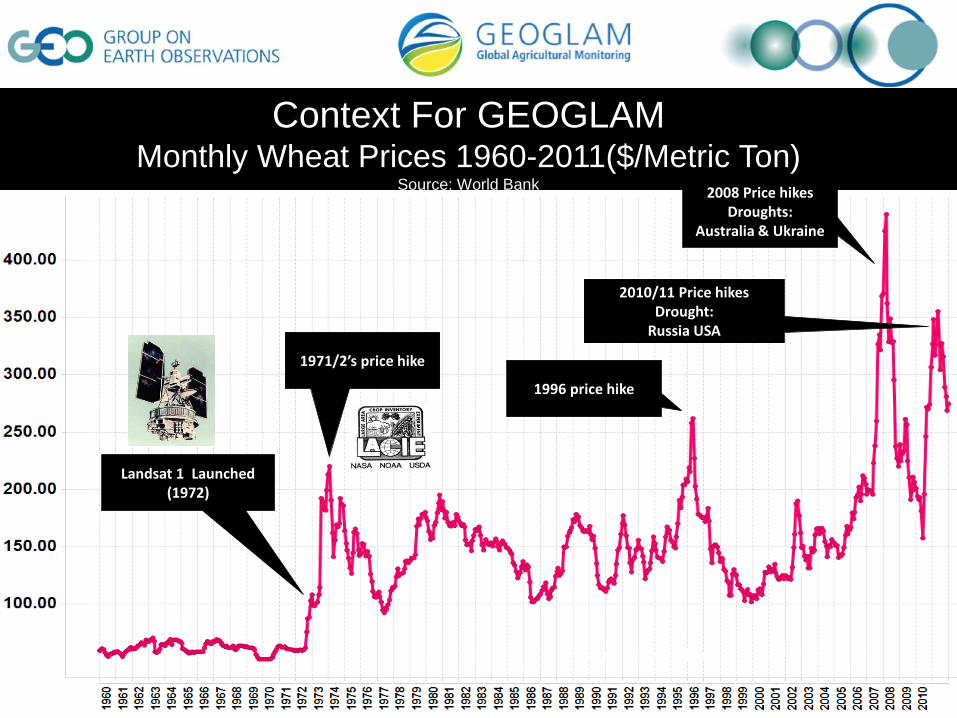
Nominal wheat price in US $/metric Ton
2010/11 Price hikes Drought:
Russia USA
Landsat 1 Launched (1972)
1971/2’s price hike
2008 Price hikes Droughts:
Australia & Ukraine
Context For GEOGLAM Monthly Wheat Prices 1960-2011($/Metric Ton)
Source: World Bank
1996 price hike
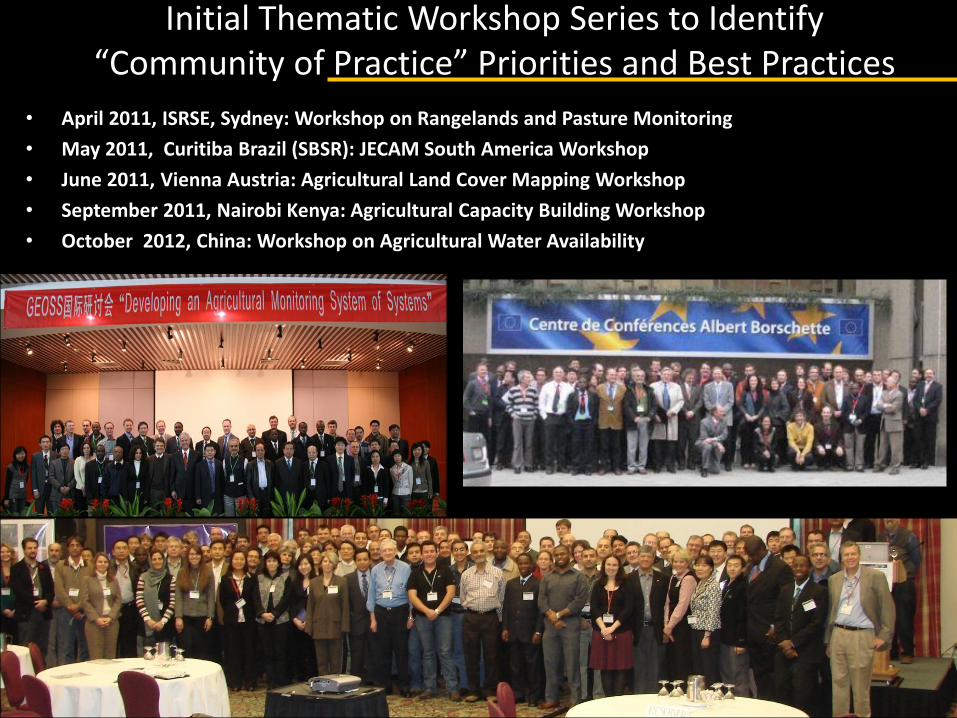
Initial Thematic Workshop Series to Identify “Community of Practice” Priorities and Best Practices
• April 2011, ISRSE, Sydney: Workshop on Rangelands and Pasture Monitoring
• May 2011, Curitiba Brazil (SBSR): JECAM South America Workshop
• June 2011, Vienna Austria: Agricultural Land Cover Mapping Workshop
• September 2011, Nairobi Kenya: Agricultural Capacity Building Workshop
• October 2012, China: Workshop on Agricultural Water Availability
Brussels 2010 – AGRISAT Workshop Beijing 2009 – System of Systems Components
Kananaskis 2009 - SAR to support Agriculture
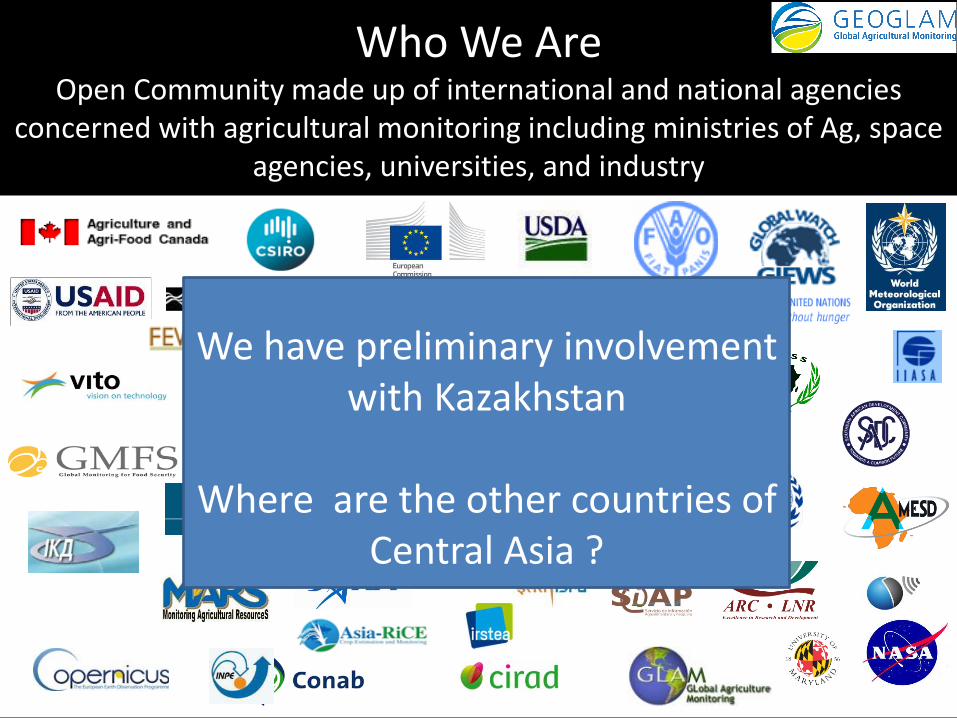
Who We Are Open Community made up of international and national agencies
concerned with agricultural monitoring including ministries of Ag, space agencies, universities, and industry
We have preliminary involvement with Kazakhstan
Where are the other countries of
Central Asia ?
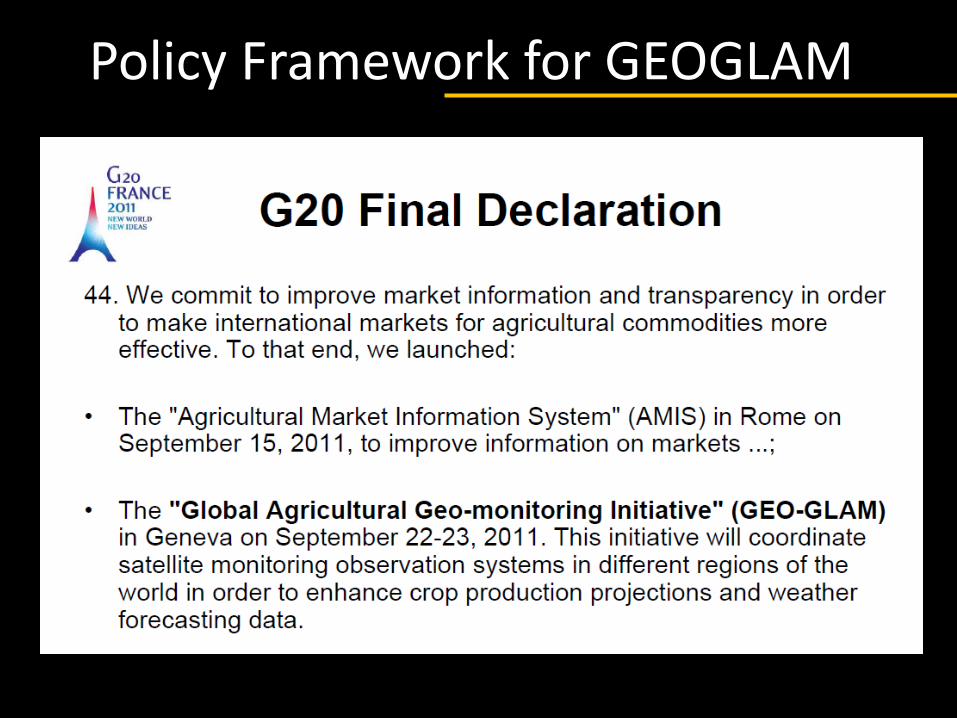
Policy Framework for GEOGLAM
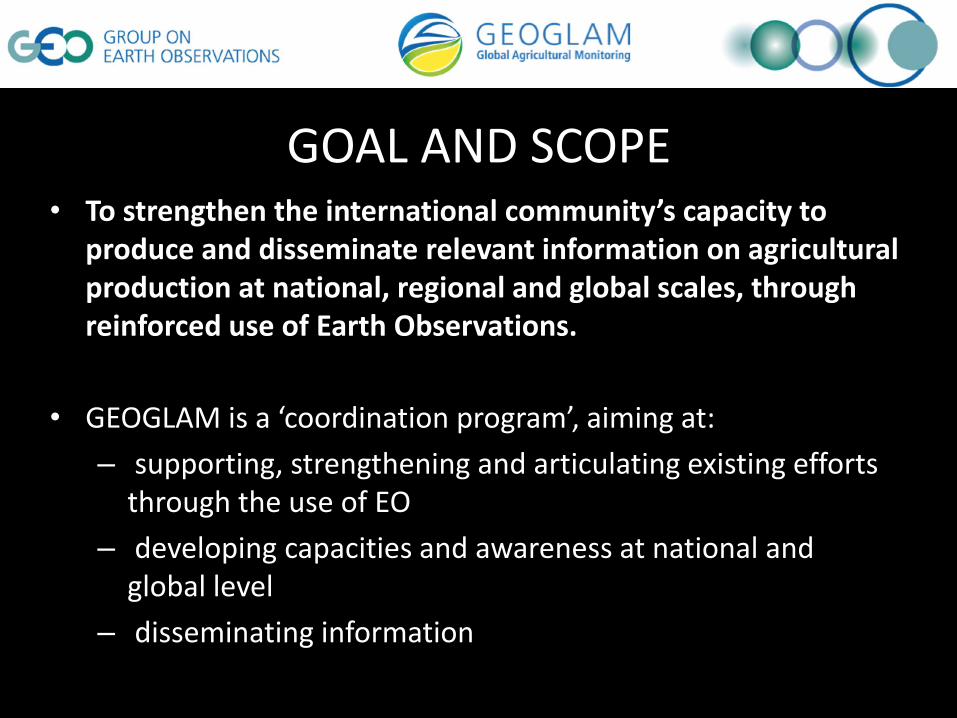
GOAL AND SCOPE • To strengthen the international community’s capacity to
produce and disseminate relevant information on agricultural production at national, regional and global scales, through reinforced use of Earth Observations.
• GEOGLAM is a ‘coordination program’, aiming at:
– supporting, strengthening and articulating existing efforts through the use of EO
– developing capacities and awareness at national and global level
– disseminating information
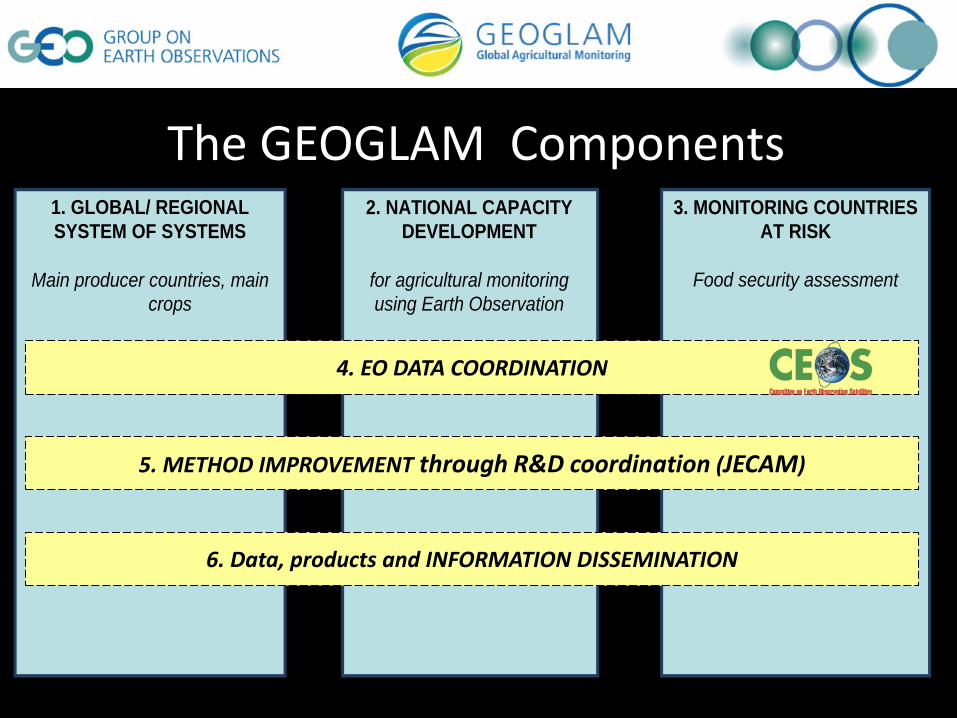
The GEOGLAM Components 1. GLOBAL/ REGIONAL
SYSTEM OF SYSTEMS
Main producer countries, main
crops
2. NATIONAL CAPACITY
DEVELOPMENT
for agricultural monitoring
using Earth Observation
3. MONITORING COUNTRIES
AT RISK
Food security assessment
6. Data, products and INFORMATION DISSEMINATION
5. METHOD IMPROVEMENT through R&D coordination (JECAM)
4. EO DATA COORDINATION
GEOGLAM Monthly Crop Monitor for AMIS
• Objective: develop consensus crop condition and prospects assessment in primary agricultural production areas highlighting potential hotspots of stress/bumper crops
– inputs from international and national agencies, based on evidence from satellite, weather, agromet, and national expert assessments
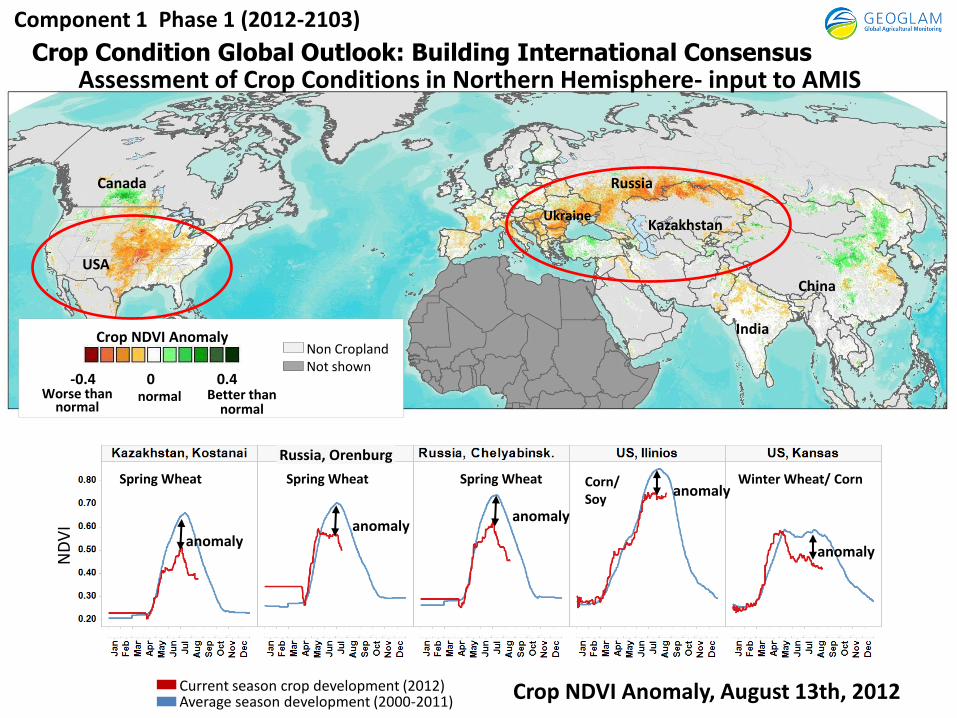
Assessment of Crop Conditions in Northern Hemisphere- input to AMIS
-0.4 0 0.4 Worse than
normal normal Better than
normal
Crop NDVI Anomaly
USA
Russia
Kazakhstan Ukraine
China
India
Canada
anomaly anomaly
Russia, Orenburg
anomaly
anomaly
anomaly
Spring Wheat Spring Wheat Spring Wheat Winter Wheat/ Corn Corn/ Soy
Current season crop development (2012) Average season development (2000-2011)
Non Cropland Not shown
ND
VI
Crop NDVI Anomaly, August 13th, 2012
Crop Condition Global Outlook: Building International Consensus
Component 1 Phase 1 (2012-2103)
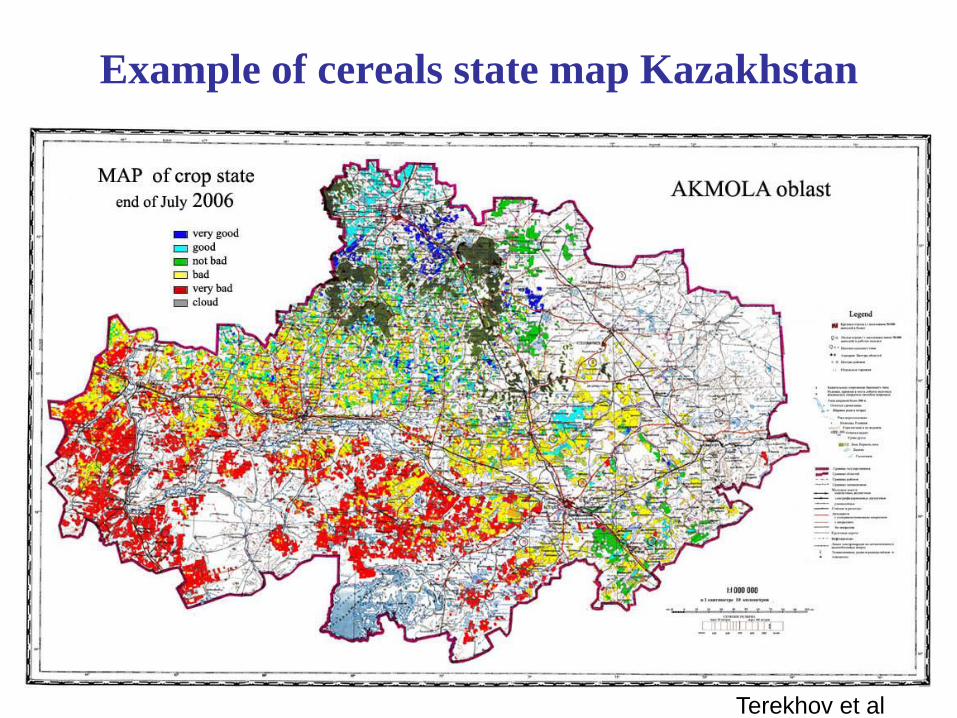
Example of cereals state map Kazakhstan
Terekhov et al
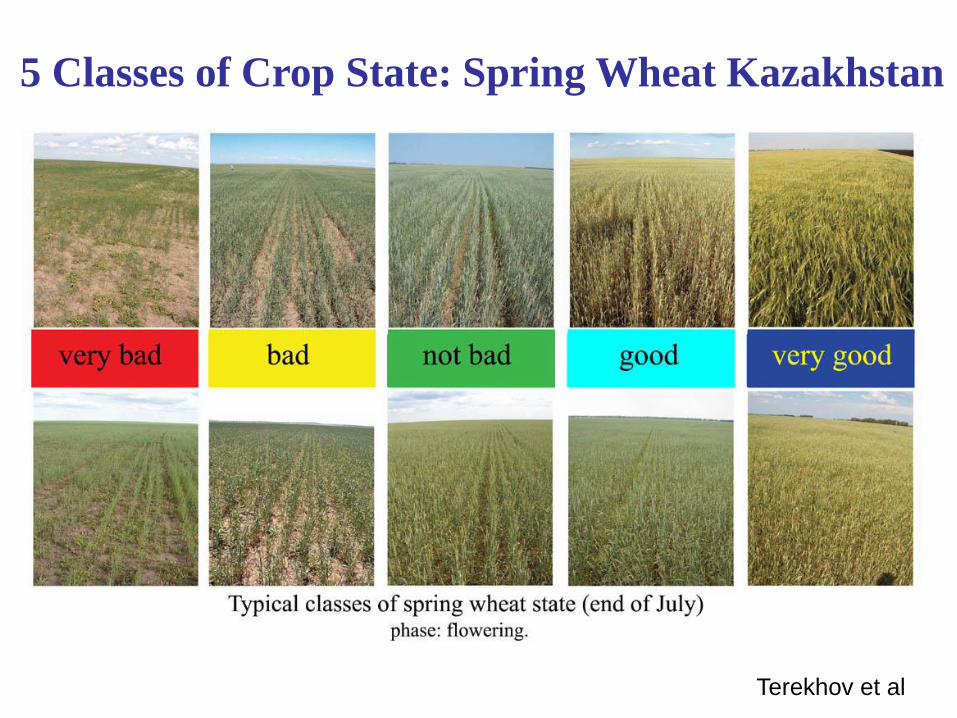
5 Classes of Crop State: Spring Wheat Kazakhstan
Terekhov et al
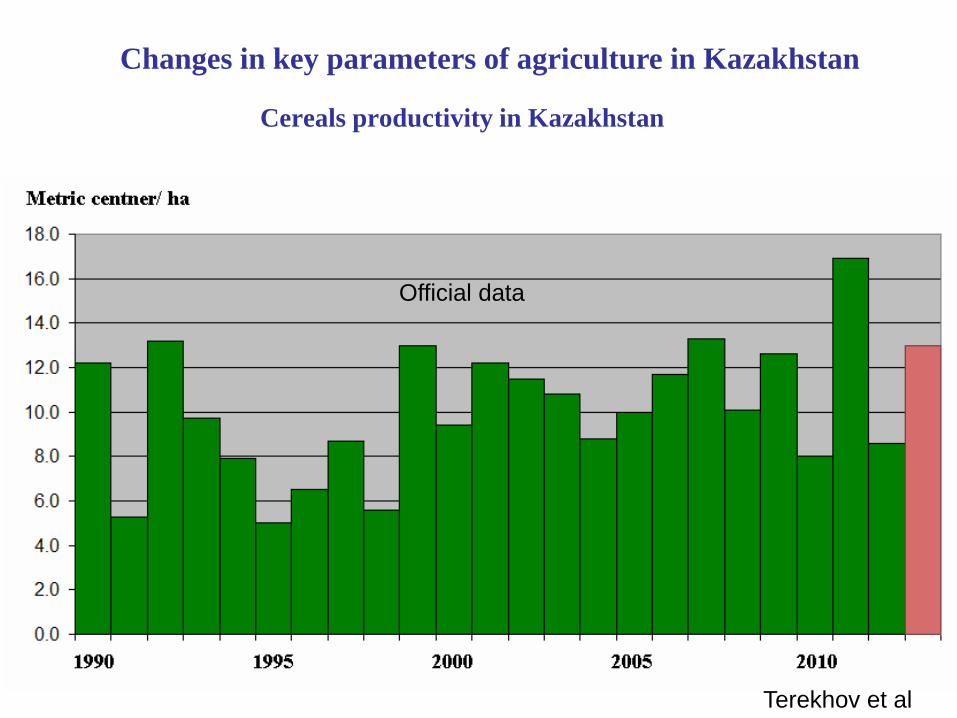
Changes in key parameters of agriculture in Kazakhstan
Cereals productivity in Kazakhstan
Official data
Terekhov et al
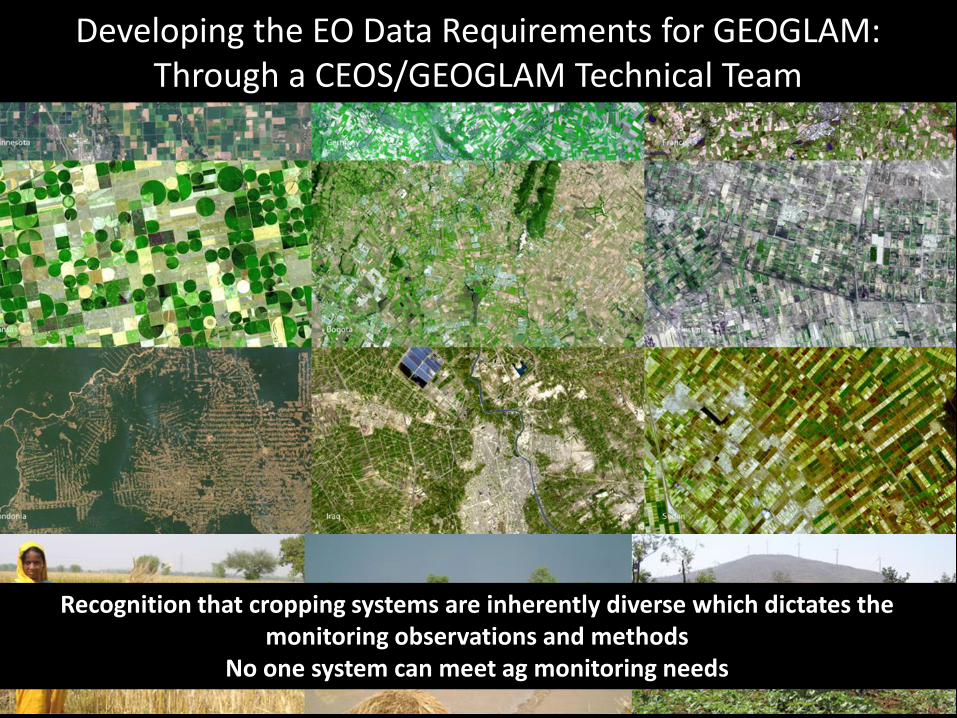
Recognition that cropping systems are inherently diverse which dictates the monitoring observations and methods
No one system can meet ag monitoring needs
Developing the EO Data Requirements for GEOGLAM: Through a CEOS/GEOGLAM Technical Team
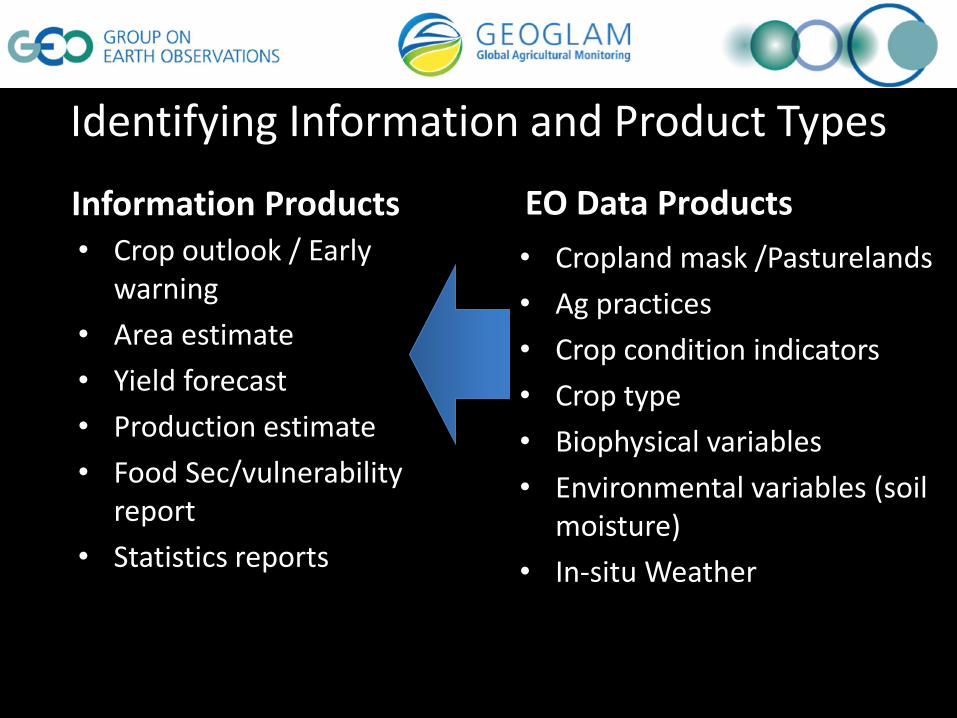
Information Products • Crop outlook / Early
warning
• Area estimate
• Yield forecast
• Production estimate
• Food Sec/vulnerability report
• Statistics reports
• Cropland mask /Pasturelands
• Ag practices
• Crop condition indicators
• Crop type
• Biophysical variables
• Environmental variables (soil moisture)
• In-situ Weather
EO Data Products
Identifying Information and Product Types
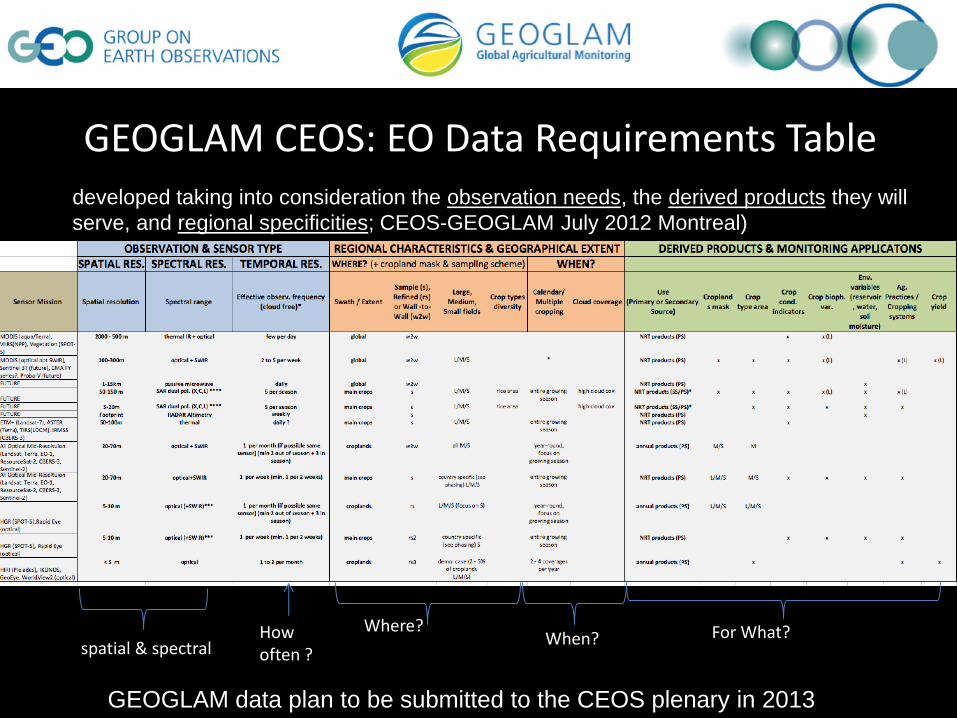
GEOGLAM CEOS: EO Data Requirements Table developed taking into consideration the observation needs, the derived products they will
serve, and regional specificities; CEOS-GEOGLAM July 2012 Montreal)
spatial & spectral How often ?
When? Where? For What?
GEOGLAM data plan to be submitted to the CEOS plenary in 2013
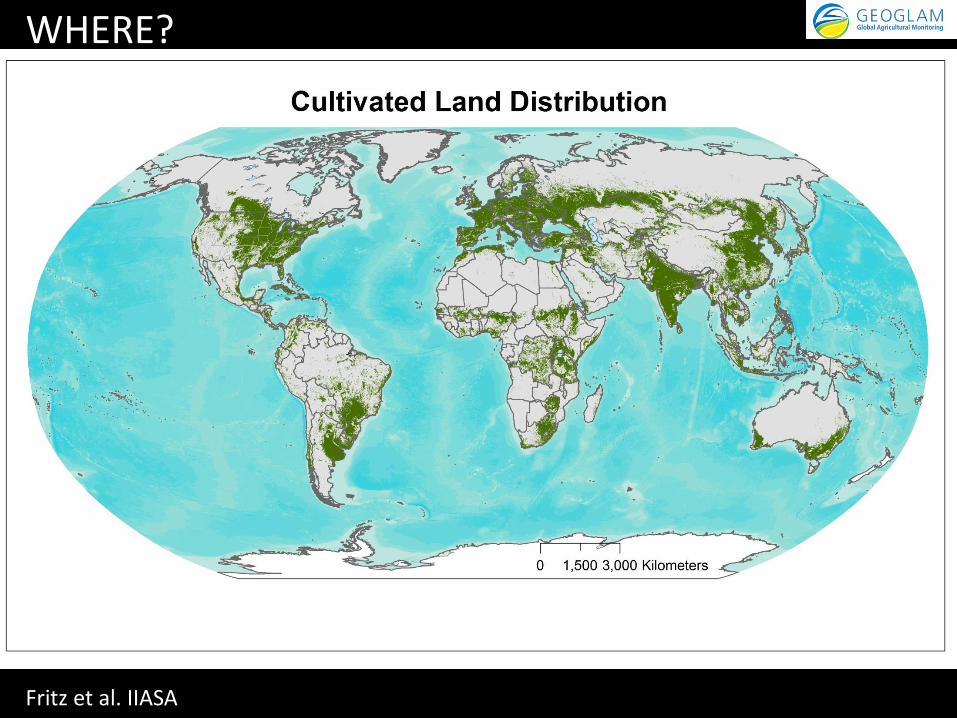
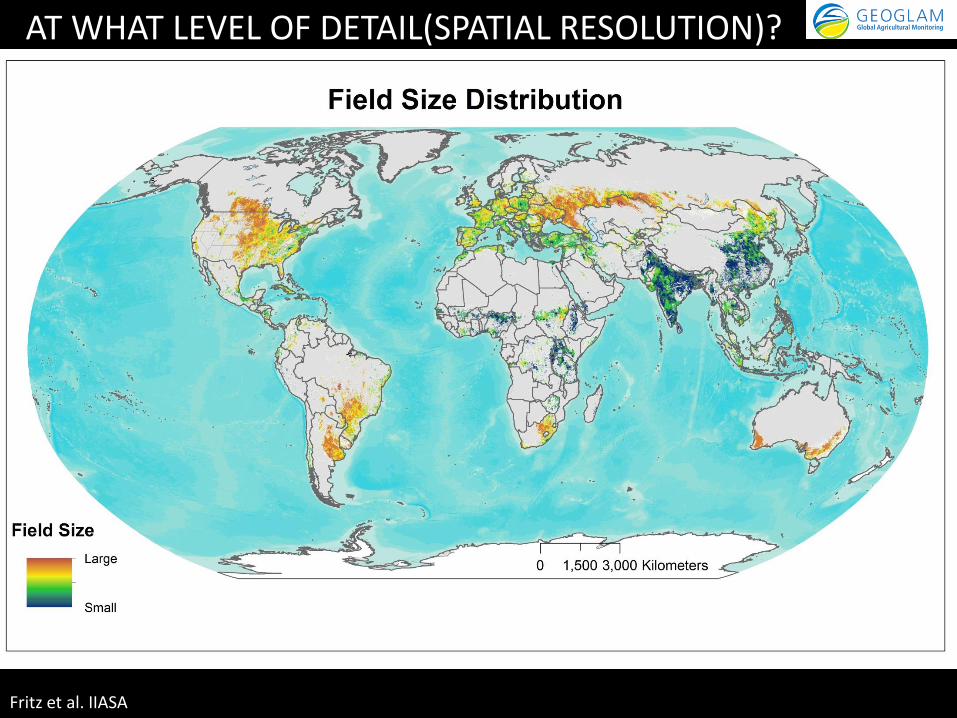
WHERE?
Fritz et al. IIASA
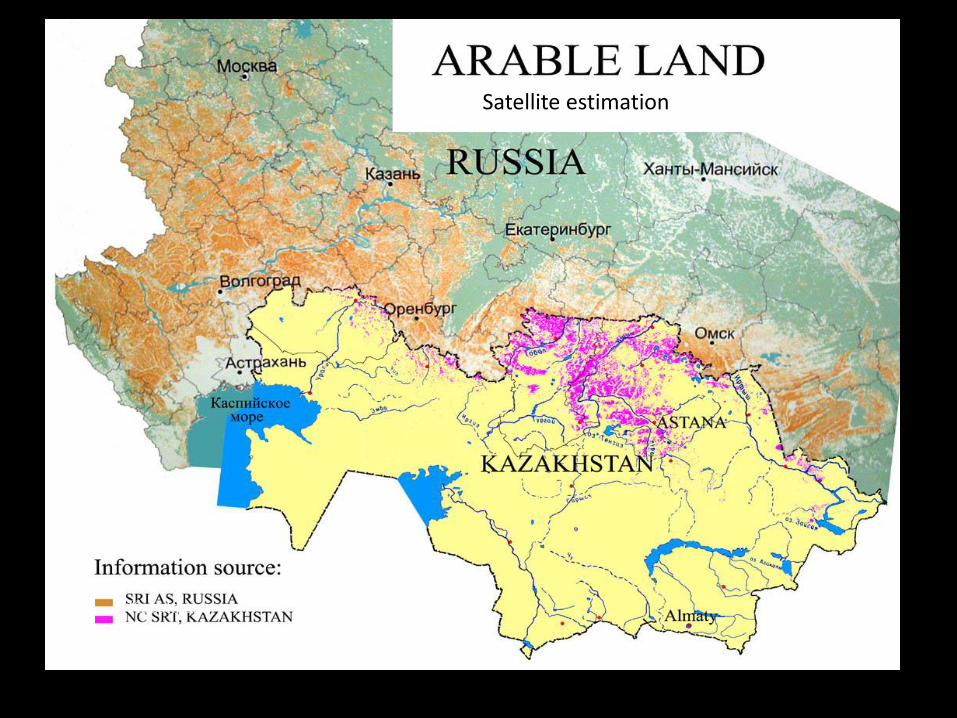
Satellite estimation
Kazakhstan
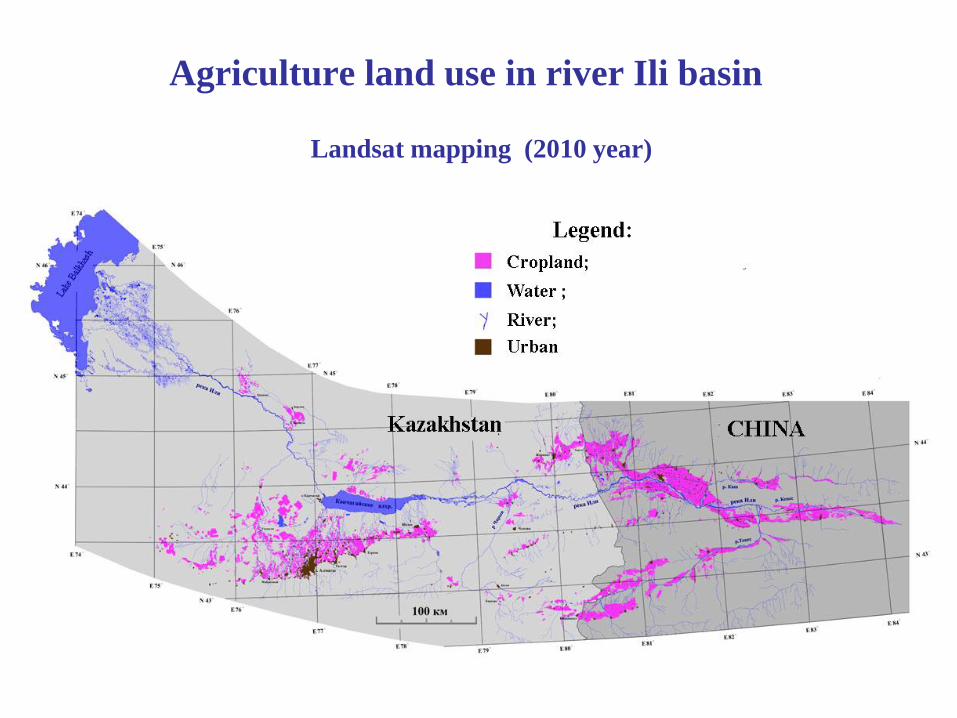
Agriculture land use in river Ili basin
Landsat mapping (2010 year)
Fritz et al. IIASA
AT WHAT LEVEL OF DETAIL(SPATIAL RESOLUTION)?
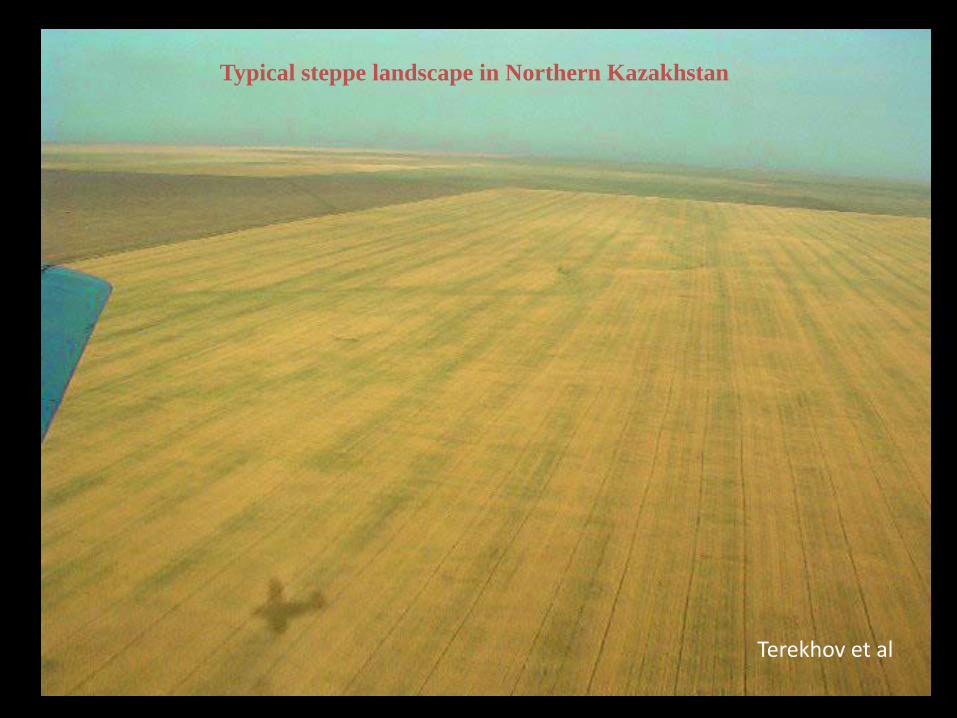
Typical steppe landscape in Northern Kazakhstan
Terekhov et al
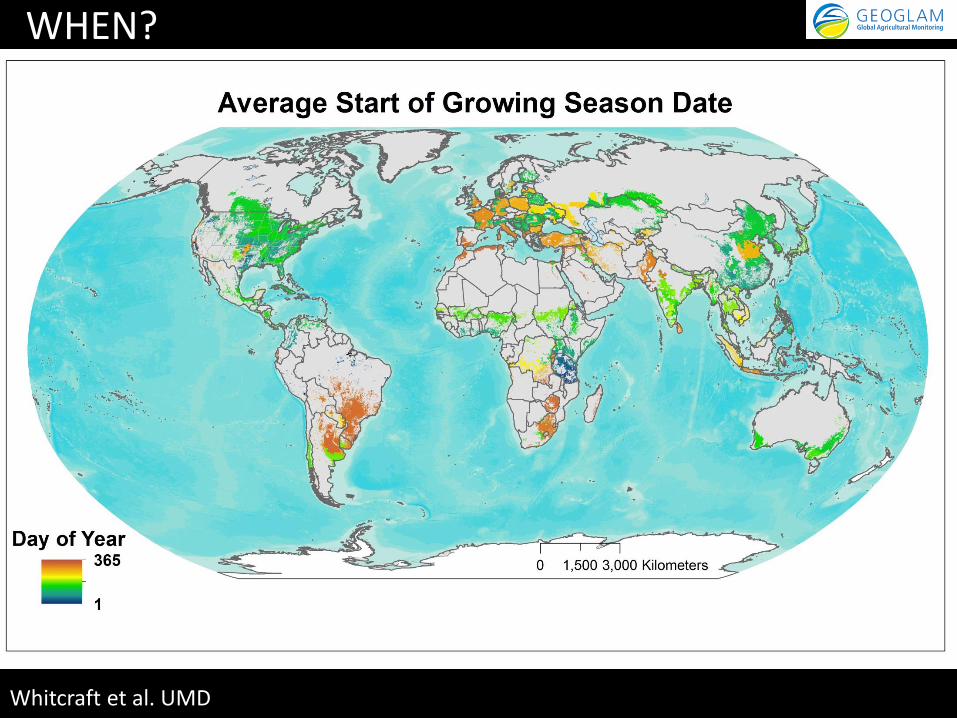
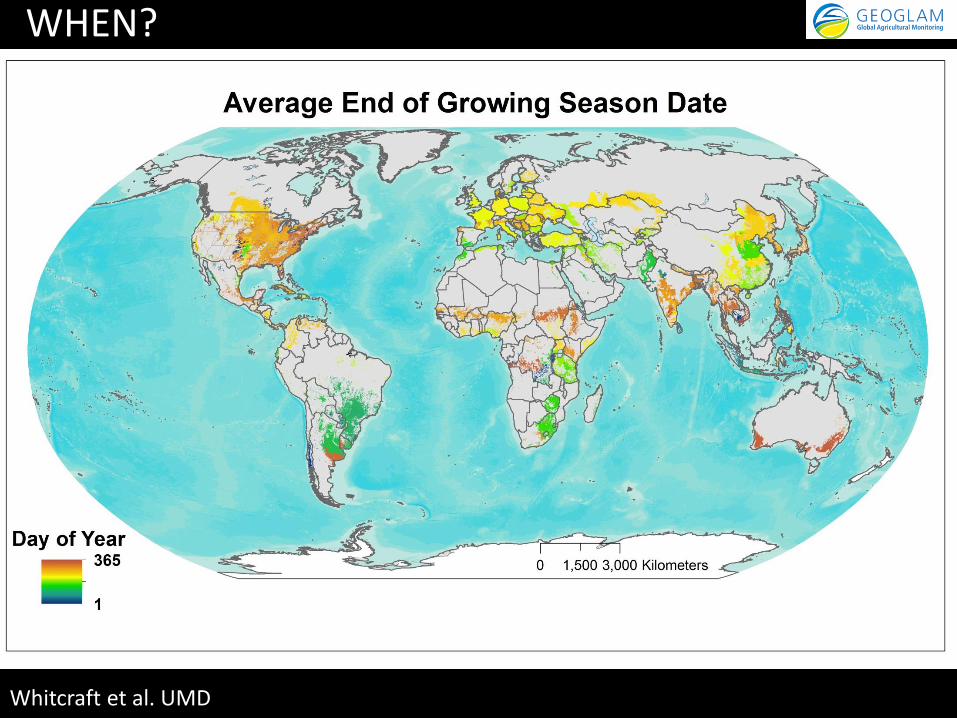
Whitcraft et al. UMD
WHEN?
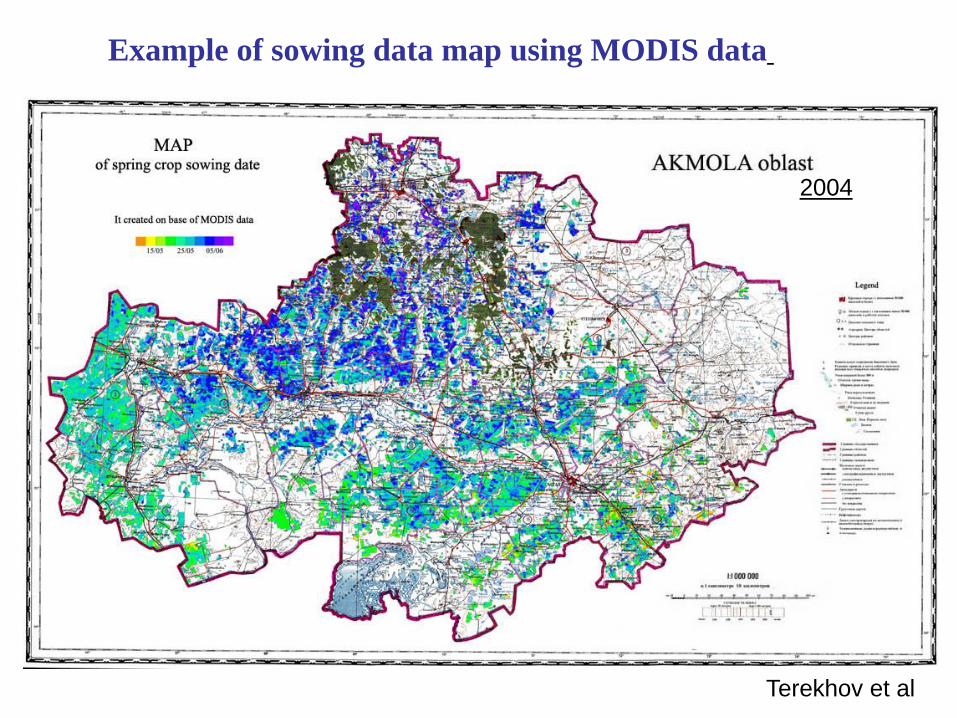
2004
Example of sowing data map using MODIS data
Terekhov et al
Whitcraft et al. UMD
WHEN?
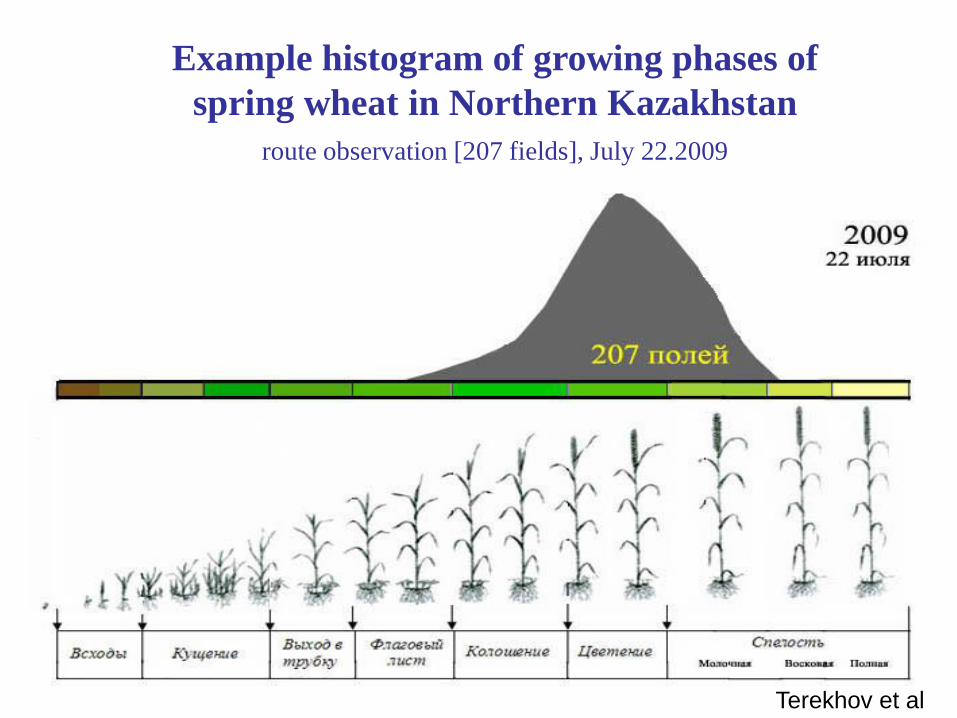
Example histogram of growing phases of
spring wheat in Northern Kazakhstan
route observation [207 fields], July 22.2009
Terekhov et al
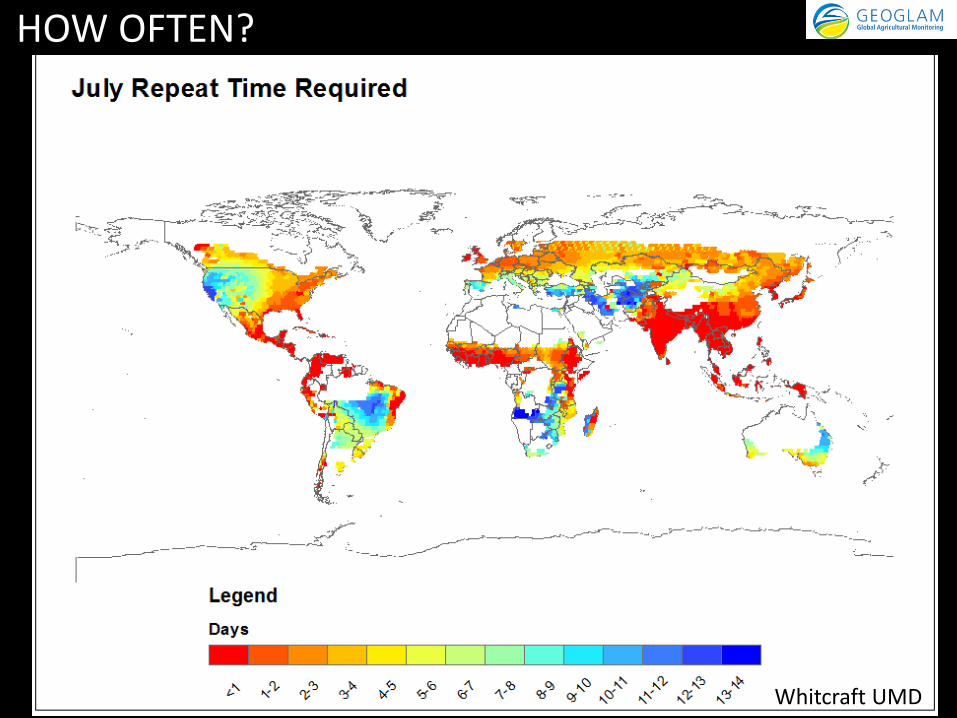
Whitcraft UMD
HOW OFTEN?
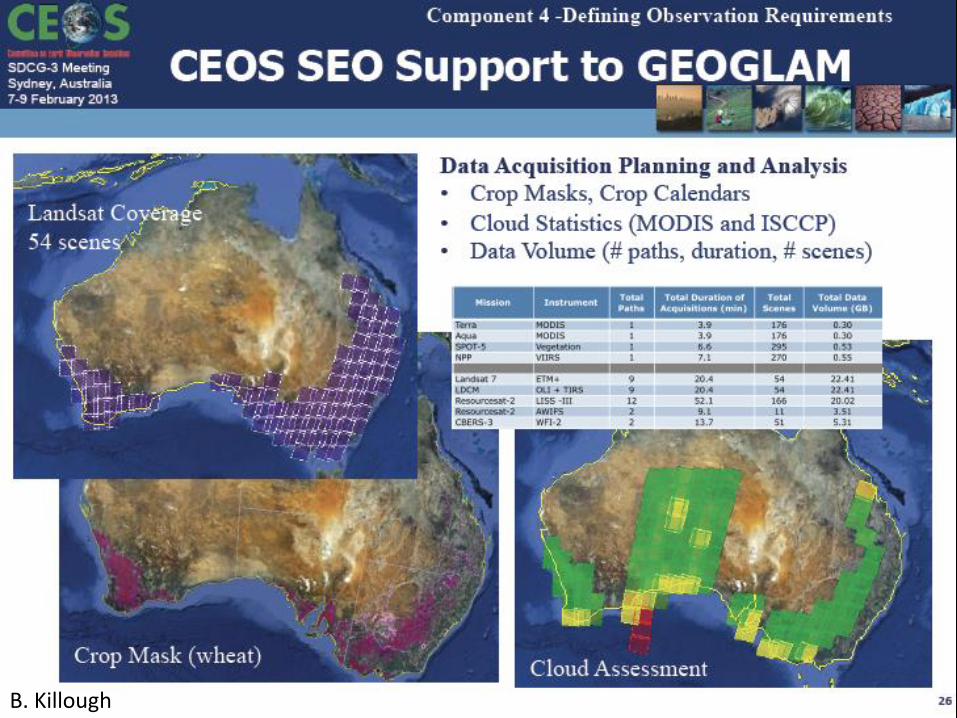
B. Killough
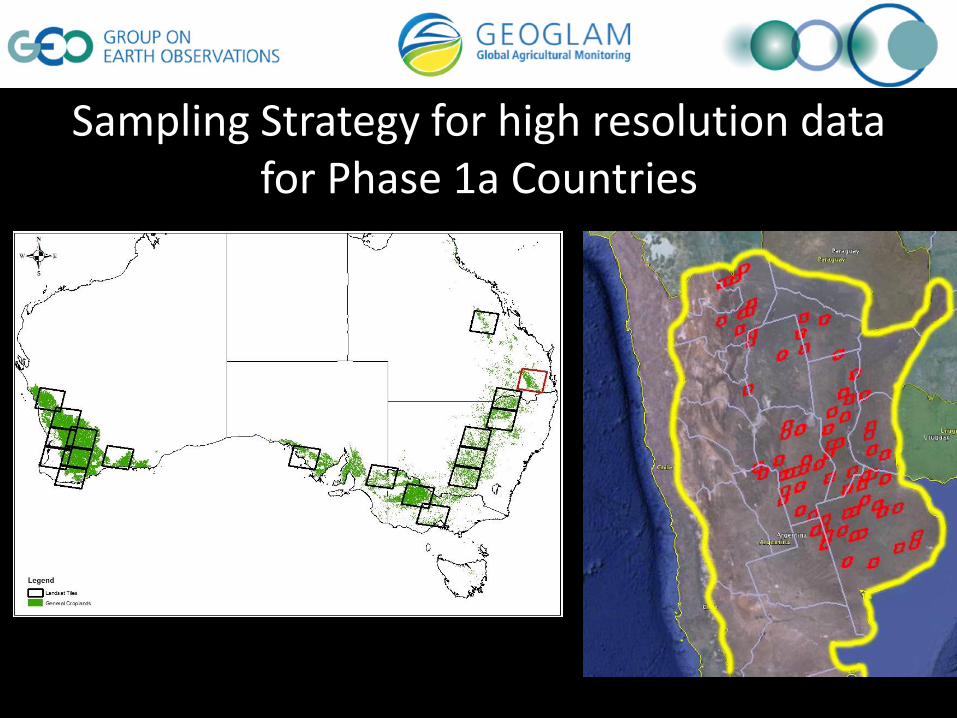
Sampling Strategy for high resolution data for Phase 1a Countries
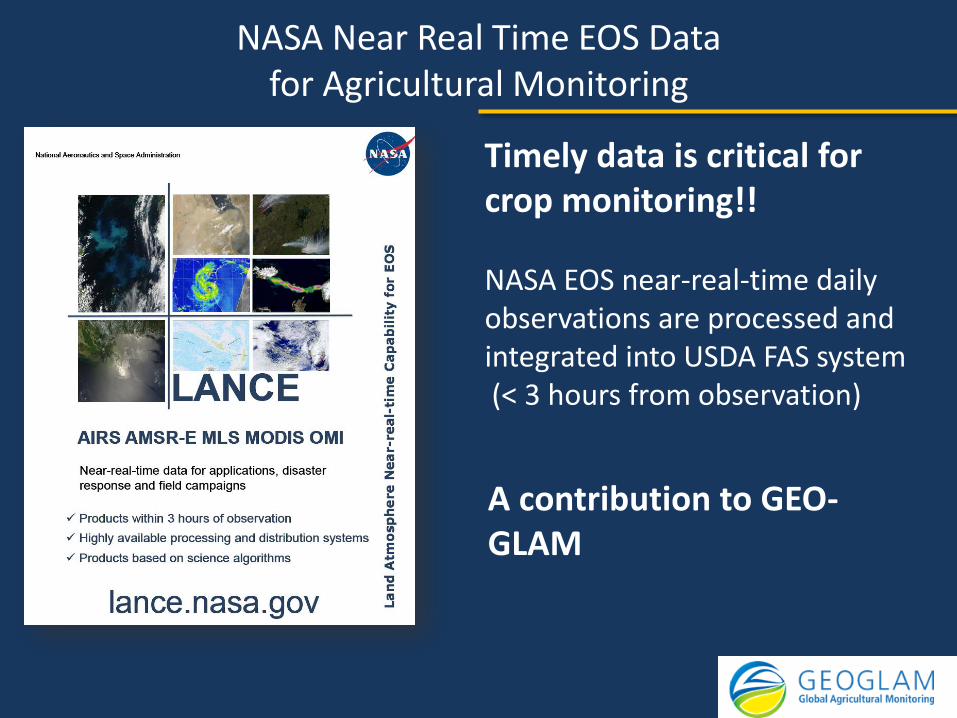
NASA Near Real Time EOS Data for Agricultural Monitoring
Timely data is critical for crop monitoring!! NASA EOS near-real-time daily observations are processed and integrated into USDA FAS system (< 3 hours from observation)
A contribution to GEO-GLAM
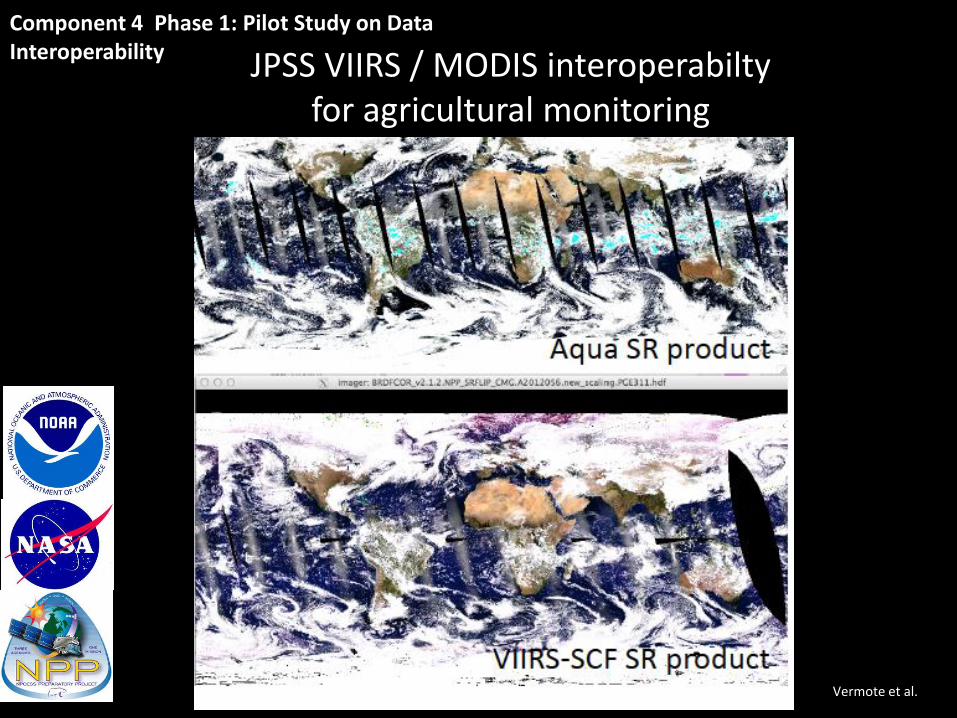
Vermote et al.
JPSS VIIRS / MODIS interoperabilty for agricultural monitoring
Component 4 Phase 1: Pilot Study on Data Interoperability
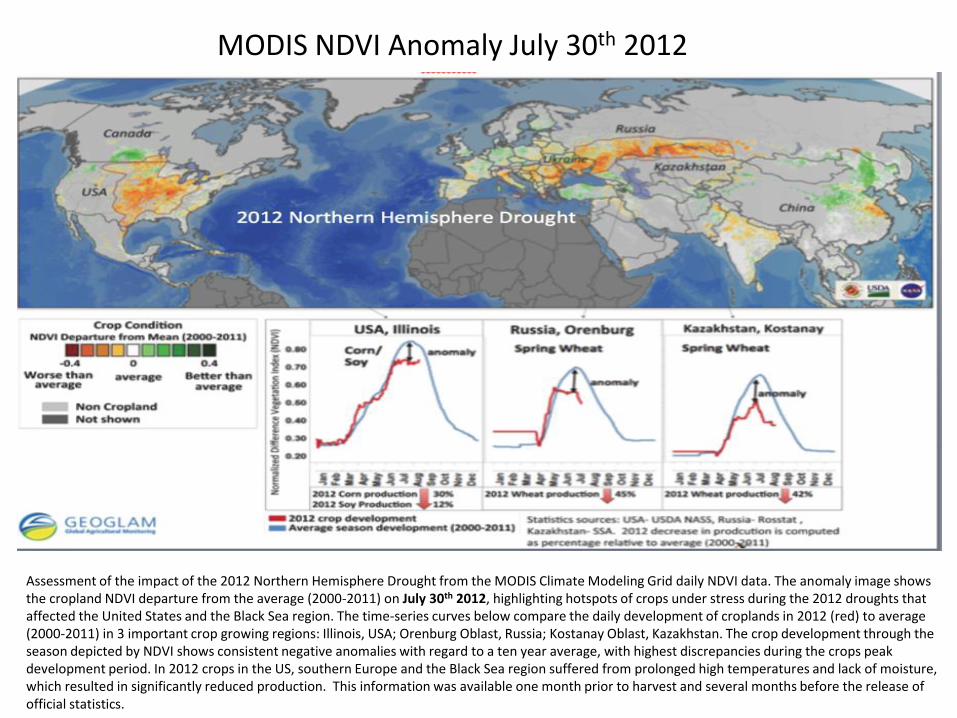
Assessment of the impact of the 2012 Northern Hemisphere Drought from the MODIS Climate Modeling Grid daily NDVI data. The anomaly image shows the cropland NDVI departure from the average (2000-2011) on July 30th 2012, highlighting hotspots of crops under stress during the 2012 droughts that affected the United States and the Black Sea region. The time-series curves below compare the daily development of croplands in 2012 (red) to average (2000-2011) in 3 important crop growing regions: Illinois, USA; Orenburg Oblast, Russia; Kostanay Oblast, Kazakhstan. The crop development through the season depicted by NDVI shows consistent negative anomalies with regard to a ten year average, with highest discrepancies during the crops peak development period. In 2012 crops in the US, southern Europe and the Black Sea region suffered from prolonged high temperatures and lack of moisture, which resulted in significantly reduced production. This information was available one month prior to harvest and several months before the release of official statistics.
MODIS NDVI Anomaly July 30th 2012
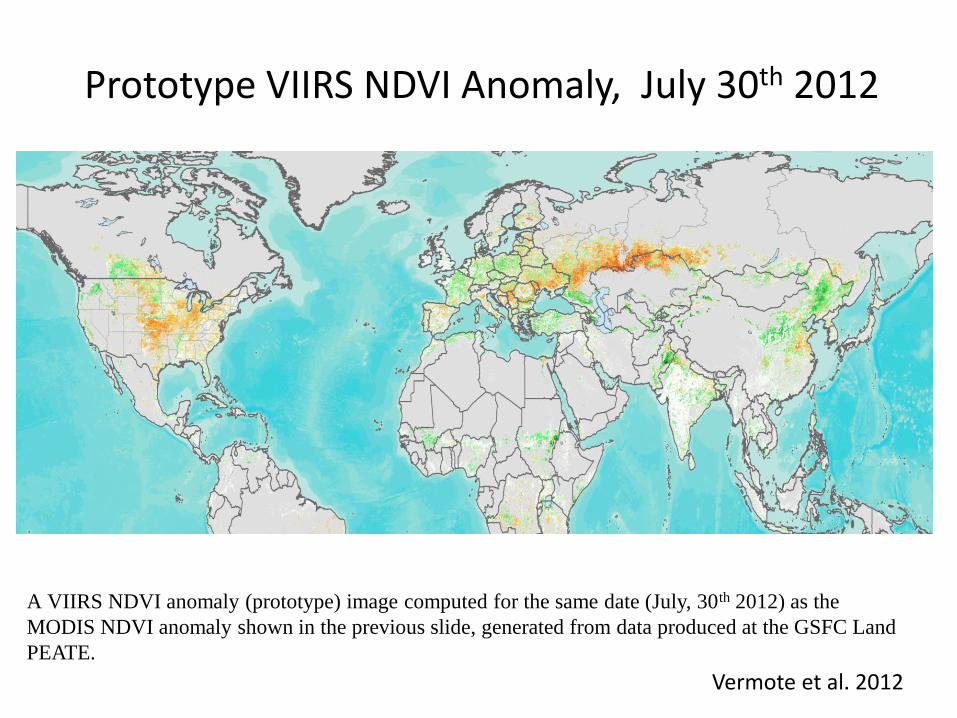
Prototype VIIRS NDVI Anomaly, July 30th 2012
A VIIRS NDVI anomaly (prototype) image computed for the same date (July, 30th 2012) as the
MODIS NDVI anomaly shown in the previous slide, generated from data produced at the GSFC Land
PEATE.
Vermote et al. 2012
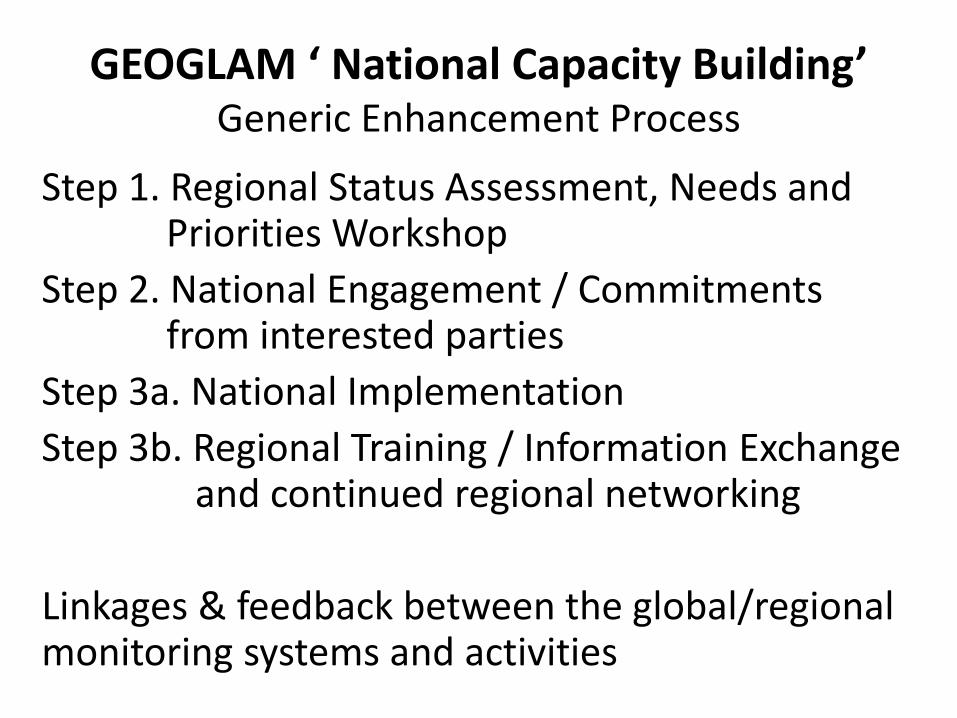
GEOGLAM ‘ National Capacity Building’ Generic Enhancement Process
Step 1. Regional Status Assessment, Needs and Priorities Workshop
Step 2. National Engagement / Commitments from interested parties
Step 3a. National Implementation
Step 3b. Regional Training / Information Exchange and continued regional networking
Linkages & feedback between the global/regional monitoring systems and activities
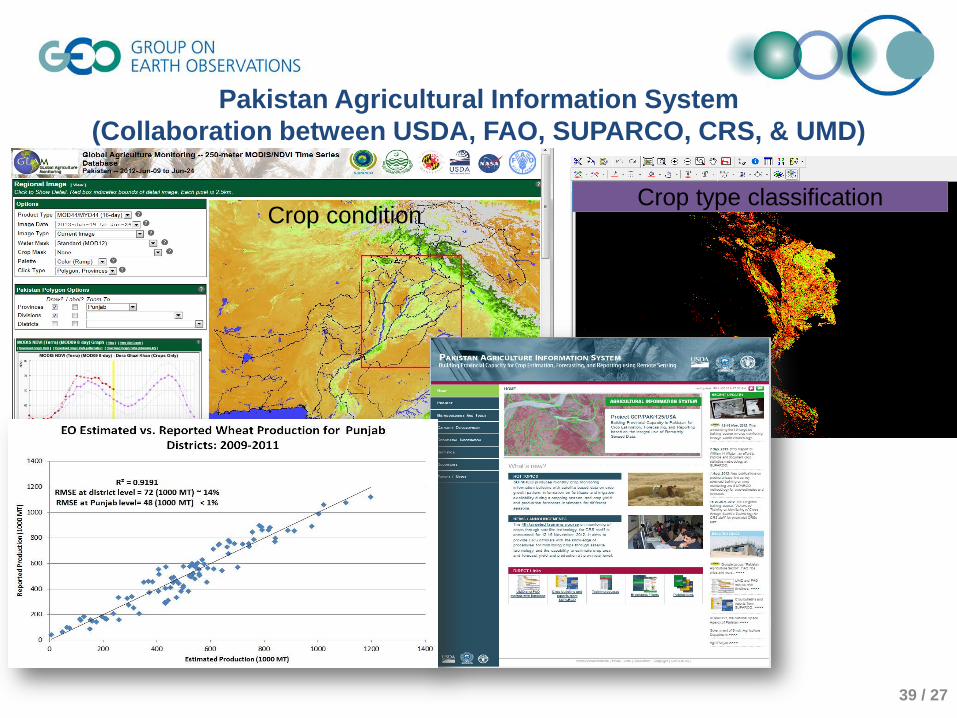
39 / 27
Crop type classification
Yield Forecasting
Crop condition
Pakistan Agricultural Information System
(Collaboration between USDA, FAO, SUPARCO, CRS, & UMD)
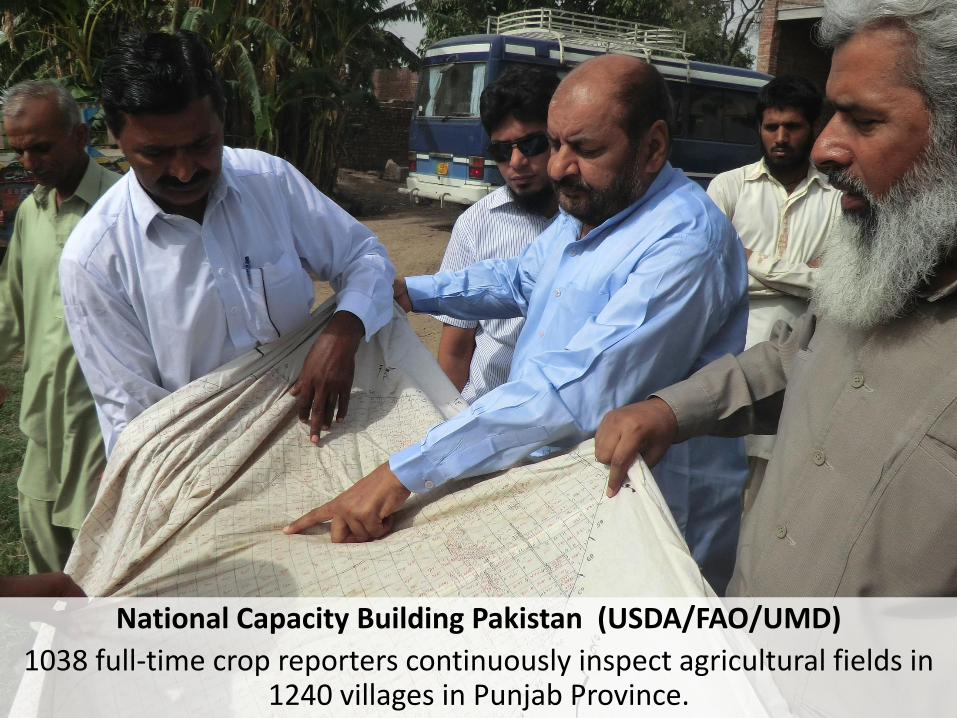
National Capacity Building Pakistan (USDA/FAO/UMD)
1038 full-time crop reporters continuously inspect agricultural fields in 1240 villages in Punjab Province.
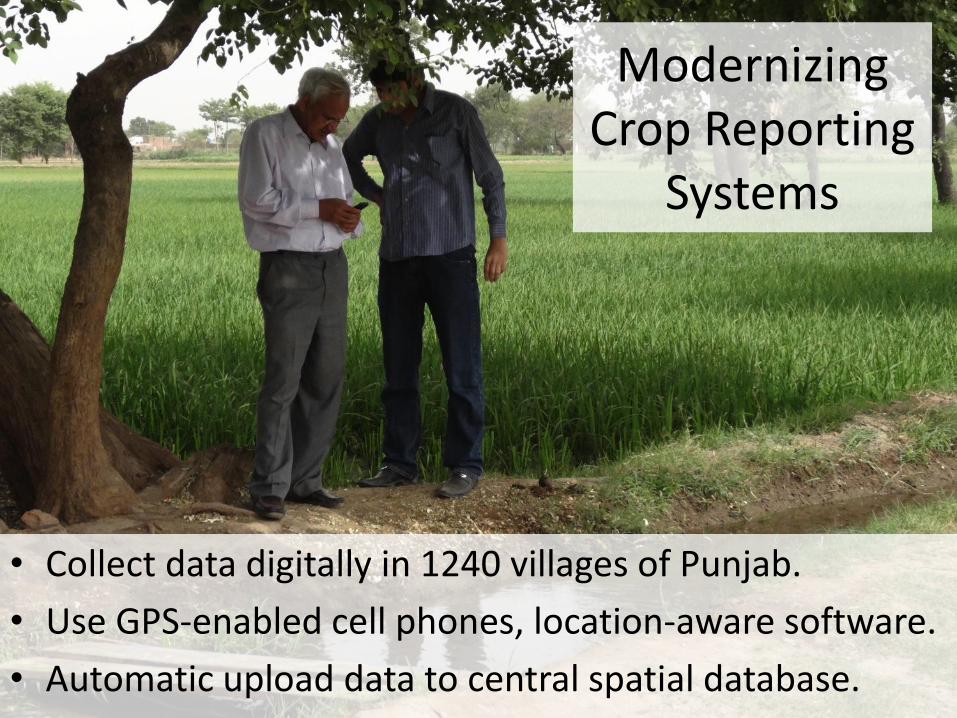
• Collect data digitally in 1240 villages of Punjab.
• Use GPS-enabled cell phones, location-aware software.
• Automatic upload data to central spatial database.
Modernizing Crop Reporting
Systems
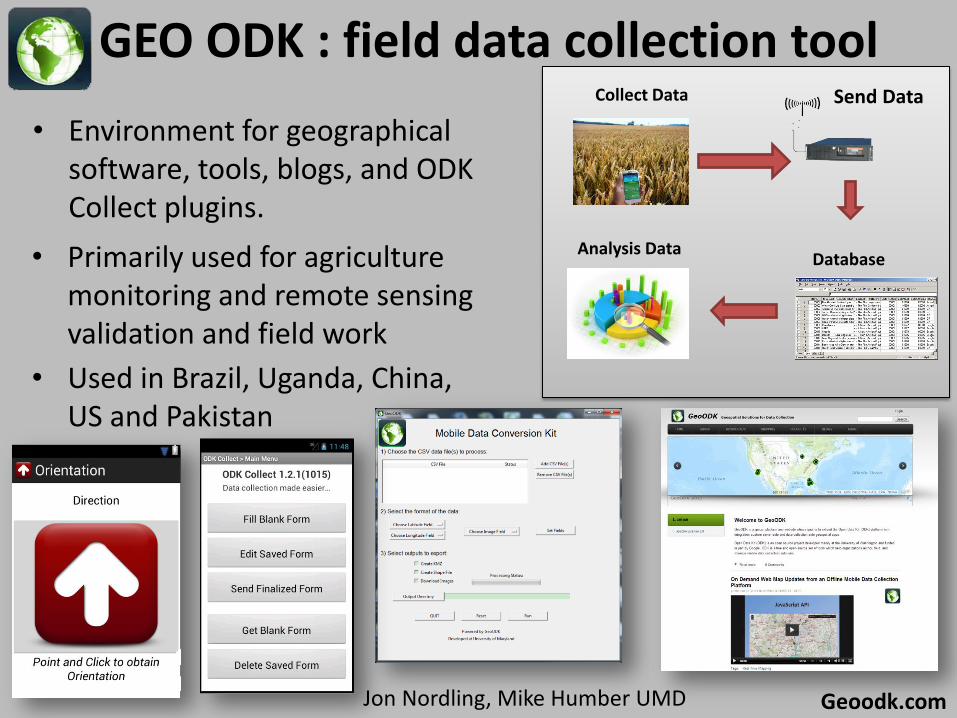
GEO ODK : field data collection tool
• Environment for geographical software, tools, blogs, and ODK Collect plugins.
Collect Data Send Data
Database Analysis Data • Primarily used for agriculture
monitoring and remote sensing validation and field work
• Used in Brazil, Uganda, China, US and Pakistan
Geoodk.com Jon Nordling, Mike Humber UMD
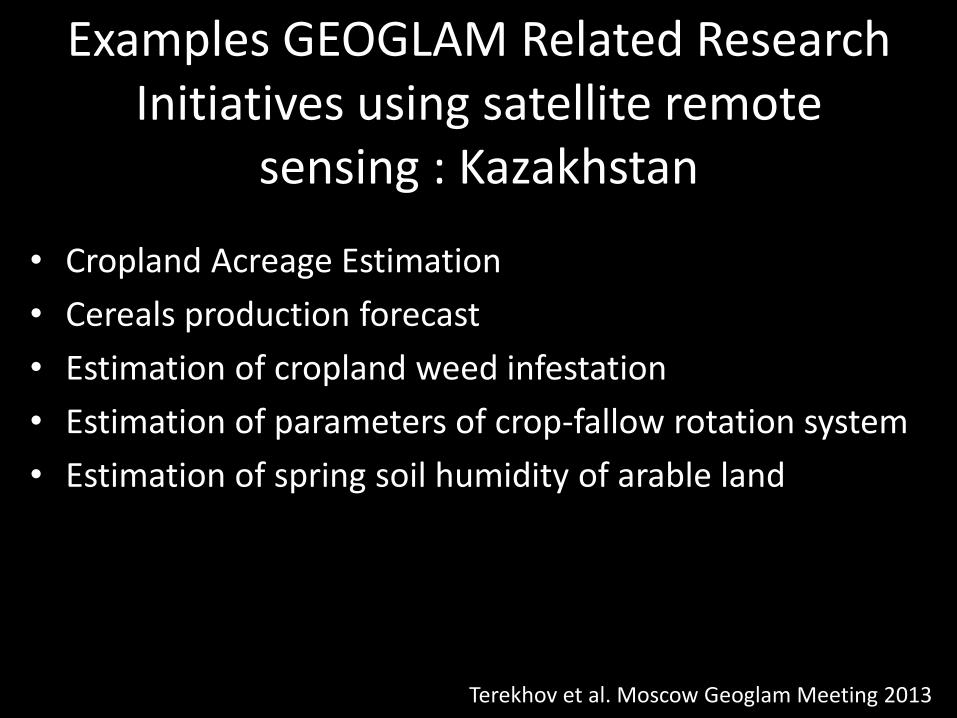
Examples GEOGLAM Related Research Initiatives using satellite remote
sensing : Kazakhstan
• Cropland Acreage Estimation
• Cereals production forecast
• Estimation of cropland weed infestation
• Estimation of parameters of crop-fallow rotation system
• Estimation of spring soil humidity of arable land
Terekhov et al. Moscow Geoglam Meeting 2013
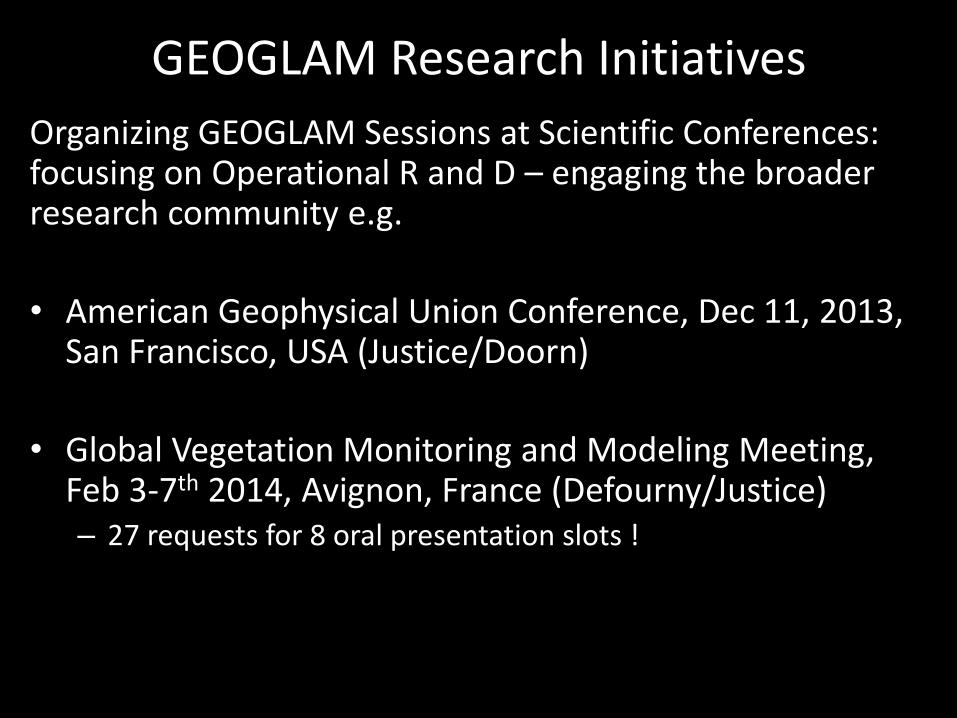
GEOGLAM Research Initiatives Organizing GEOGLAM Sessions at Scientific Conferences:
focusing on Operational R and D – engaging the broader research community e.g.
• American Geophysical Union Conference, Dec 11, 2013, San Francisco, USA (Justice/Doorn)
• Global Vegetation Monitoring and Modeling Meeting, Feb 3-7th 2014, Avignon, France (Defourny/Justice) – 27 requests for 8 oral presentation slots !
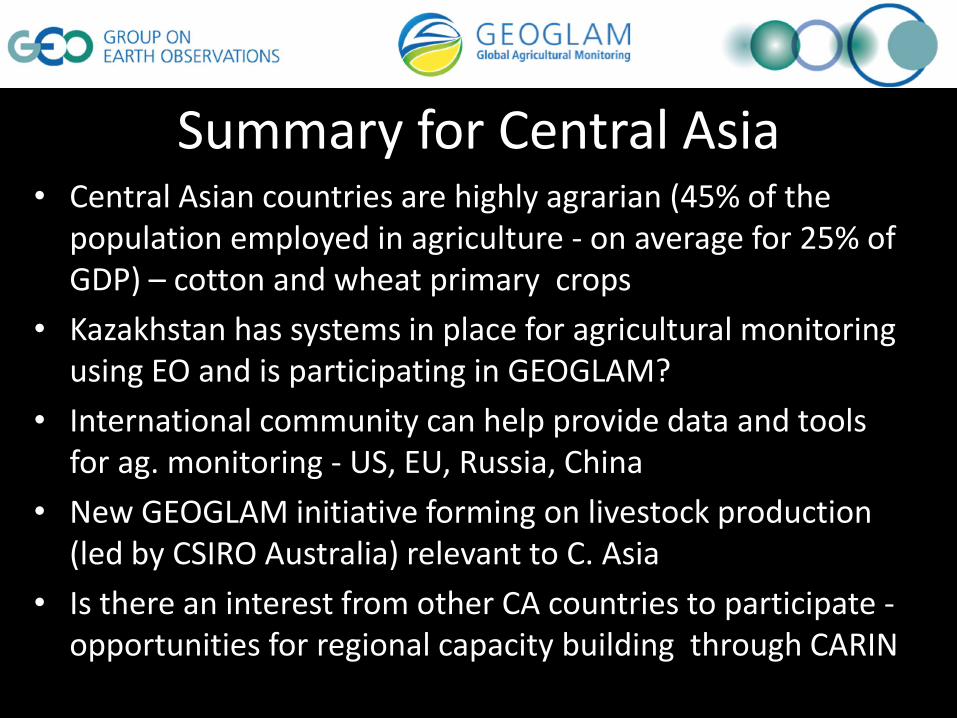
Summary for Central Asia • Central Asian countries are highly agrarian (45% of the
population employed in agriculture - on average for 25% of GDP) – cotton and wheat primary crops
• Kazakhstan has systems in place for agricultural monitoring using EO and is participating in GEOGLAM?
• International community can help provide data and tools for ag. monitoring - US, EU, Russia, China
• New GEOGLAM initiative forming on livestock production (led by CSIRO Australia) relevant to C. Asia
• Is there an interest from other CA countries to participate - opportunities for regional capacity building through CARIN
© GEO Secretariat
THANK YOU !