Embed Size (px)
Citation preview
8/15/2019 The German Machine Tool Industry in 2011
http://slidepdf.com/reader/full/the-german-machine-tool-industry-in-2011 1/84
Verein Deutscher Werkzeugmaschinenfabriken
Die deutsche Werkzeugmaschinen-
industrie im Jahr 2011The German Machine Tool Industry in 2011

8/15/2019 The German Machine Tool Industry in 2011
http://slidepdf.com/reader/full/the-german-machine-tool-industry-in-2011 2/84
3 Zukunftsfähigkeit der Hochtechnologieorientierung7 Aktuelle Situation und Perspektiven
17 Werkzeugmaschinen-Produktion29 Werkzeugmaschinen-Außenhandel
43 Stellung auf dem Weltmarkt59 Strukturdaten der Werkzeugmaschinenindustrie65 Statistischer Anhang, methodische Hinweise, VDW-Mitgliedsfirmen
3 Bright prospects for the future of high-tech orientation7 Current situation and perspectives
17 Machine tool production29 Foreign trade in machine tools43 Position on the world market59 Structural data of the machine tool industry65 Statistical appendix, methodical comments, VDW member companies
Titelseite: Beim Wälzschälen handelt es sich um ein innovatives Verfahren. Ein neu entwickeltes Werkzeugsystem erlaubt es, Wälzschälen auf Kegel radfräsmaschinen erfolgreichanzuwenden und garantiert eine produktive, prozesssichere und präzise Fertigungstechnologie insbesondere von Innenverzahnungen. Vorteile sind unter anderem eine bis zuzehnfach schnellere Bearbeitung im Vergleich zum Stoßen und hohe Bauteilqualität durch exakte Werkzeuge und dynamische Maschinen.
Front cover: Skiving is an innovative process. A newly developed tool system makes it possible to use skiving successfully on bevel gear cutting machines, and guaranteesproductive, stable and precise manufacturing technology, especially for internal gears. Benefits include up to ten-fold faster machining as compared with shaping along withhigh component quality through precise tools and dynamic machines.

8/15/2019 The German Machine Tool Industry in 2011
http://slidepdf.com/reader/full/the-german-machine-tool-industry-in-2011 3/84
1
Auftragsflut 2011 bis weit in 2012 wirksam, weltweiteIndustrie produktion und Investitionstätigkeit wenigerbeeinträchtigt, Hochtechnologieorientierung der Branchebleibt tragfähiges Modell
Nach 85 % Plus im Auftragseingang des Jahres 2010 legtdie auf deutsche Werkzeugmaschinen gerichtete Nach-frage um weitere 45% auf ein spektakuläres Volumen von16,7 Mrd. EUR zu! Das ehemals als kaum wiederholbaresRekordergebnis betrachtete Niveau 2007 wird souveränüberboten.
Primär ist es die Auslandsnachfrage, welche die erwähnteReferenz mit fast 2 Mrd. EUR Abstand distanziert und denentscheidenden Unterschied ausmacht. Zwar stehen die
Orders aus Europa für einen hohen zweistelligen Steiger-ungssatz, aber die Partizipation der über Jahrzehnte wich-tigsten Absatzregion am Gesamtwert der Auslandsbe-stellungen wird durch die Teilhabe Asiens sehr deutlichüberflügelt.
Folge ist Produktionsausweitung in 2011 um ein sattes Drittelgegenüber dem Referenzjahr auf über 13 Mrd. EUR. Trotz-dem bleibt es zu Jahresbeginn 2012 bei einer durchschnitt-lichen Reichweite der Auftragsbestände von 9 Monaten.Dieser Auftragsüberhang geht zurück auf stattliche Anteile
der durch lange Durchlaufzeiten geprägten kundenspezifi-schen Sondermaschinen sowie des Projektgeschäfts mitGroßanwendern am gesamten Auftragsvolumen 2011. Dieserwichtige Einfluss dürfte in Kombination mit anhaltendenFortschritten hinsichtlich der Eindämmung finanz- undrealwirtschaftlicher Risiken zu einem neuerlichen Produk-tionsplus deutscher Werkzeugmaschinenhersteller vonetwa 5 % führen. Vorhersagen für die weltweite Industrie-produktion und die international in den wichtigstenAbnehmer industrien unserer Branche getätigten Anlagein-vestitionen sind spürbar nach oben angepasst worden.Damit bewegt man sich deutlich über dem noch im Spät-herbst 2011 als Risikovariante durchgespielten Szenarium.
Im Halbjahresmuster des Auftragseingangs der deutschenWerkzeugmaschinenindustrie sind im laufenden Jahr über-proportionale Abstriche während der ersten 6 Monate undanschließend bereits in der 2. Jahreshälfte erfolgende Kon-solidierung vorgezeichnet. Hinsichtlich der Produktionsent-wicklung nehmen sich die Dinge umgekehrt aus: Hier giltnach einem weiteren starken 1. Halbjahr ein moderates
zweistelliges Minus als wahrscheinlich.
Flood of orders effective in 2011 and well into 2012, world -wide industrial production and investment activity lessimpaired, high-tech orientation of the sector remainsviable model
Following 85% growth in incoming orders in 2010, Germanmachine tools posted another 45% increase in demand,rising to a spectacular volume of EUR 16.7 billion! Consideredas a virtually unbreakable record result at the time, thelevel of 2007 was exceeded by a large margin.
Foreign demand, which outpaced the aforementioned ref-erence year by nearly EUR 2 billion, primarily made thedecisive difference. While orders from Europe – which hasbeen the most important consumption region for decades –
grew at a high two-digit rate, its participation as a share of the total value of foreign orders was very clearly outpacedby the Asian fraction.
As a consequence, production expanded by a full third rela-tive to the reference year to more than EUR 13 billion in2011. Nevertheless, the average range of order backlogs wasstill nine months at the start of 2012. That backlog arosefrom the ample shares of the total order volume in 2011which involved customer-specific special machines (char-acterised by long turnaround times) and project business
with major customers. This important factor, in combina-tion with continued progress in limiting finance risks andreal economy risks, should serve to increase German ma-chine tool manufacturers’ production by about another 5%.Predictions for worldwide industrial production have beenadjusted perceptibly upward together with plant and equip-ment investment activity in the major customer industriesof our sector. As a result, we are already well beyond thescenario which was still considered as the risk variant in thelate autumn of 2011.
The half-year pattern of incoming orders received by theGerman machine tool industry anticipates disproportion-ately high declines during the first six months of the current
year followed by consolidation activity in the second half.With regard to production trends, things will be the otherway round: Here a continued strong first half-year is likelyto be followed by a moderate two-digit decrease.
It is likely that emerging countries, and especially China,will become increasingly oriented towards higher qualityproducts which are potentially suitable for export. This will,
VorwortPreface
Programmstruktur und regionale Verteilungder Nachfrage sind Assets der Branche
Programme structure and regional distributionof demand are assets of the sector

8/15/2019 The German Machine Tool Industry in 2011
http://slidepdf.com/reader/full/the-german-machine-tool-industry-in-2011 4/84
in turn, raise the demands on manufacturing technology,thereby offering German manufacturers good opportunitiesto benefit disproportionately from the new procurementpractices.
This is also precisely the argumentation underlying a jointstudy by VDW and PricewaterhouseCoopers: While made-to-order special solutions and projects represent nearlyhalf of the production volume of the German machine toolindustry, its international competitors dedicate only about30% of their order volume to customisation of this type.
The current composition of German manufacturers’ port-folio of foreign orders will also have beneficial effects. Thisas a consequence of the weight of Asia – already a high 46%share and still growing – where significantly less reductionin machine tool consumption is also generally necessary,even during weaker periods.
The present publication aims to provide professional ana-lyses and consider industry trends of topical interest realis-tically within the expectations described and regardless of whether or not the reporting period offers attractive growthrates. The VDW considers its target audience to comprisemainly decision-makers from politics, the banking sector, at
trade union level, in the media landscape and in researchand teaching. The VDW’s regularly revised view of the worldmarket, which differs from ones based on other sources invarious respects, represents a traditional focal point of thisseries of brochures started in 1998.
Frankfurt am Main, April 2012German Machine Tool Builders’ AssociationEconomy and Statistics Division
Die in den Schwellenländern, hier insbesondere in China, zuerwartende Hinwendung zu höherwertigen, potenziellexportfähigen Erzeugnissen wird den Anspruch an Ferti-gungstechnologie nach oben verschieben und damit deut-
schen Herstellern gute Chancen bieten, vom verändertenBeschaffungsverhalten überproportional zu profitieren.
Bei exakt dieser Argumentation setzt auch eine gemeinsameStudie von VDW und PricewaterhouseCoopers an. Währendnämlich knapp die Hälfte des Produktionsvolumens derdeutschen Werkzeugmaschinenindustrie auf nachgefragteSonderlösungen und Projekte entfällt, bedient die interna-tionale Konkurrenz lediglich mit einem Wertanteil von etwa30% Auftragsvolumina derartigen Zuschnitts.
Günstig wird sich auch die gegebene Zusammensetzungder Auslandsorders deutscher Hersteller auswirken. Dies in-folge des mit derzeit 46% Anteil bereits hohen und weiterwachsenden Gewichts Asiens, mit den dort in aller Regelauch in schwächeren Phasen deutlich geringer erforder-lichen Abstrichen am Werkzeugmaschinenverbrauch.
Die vorliegende Publikation will sachlich unterrichten undaktuell diskutierte Branchenentwicklungen aufgreifen. Rea-listisch in den geschilderten Erwartungen und unabhängig
davon, ob der Berichtszeitraum attraktive Wachstumsratenbietet oder nicht. Als Zielgruppe sieht der VDW vornehmlichEntscheider aus der Politik, im Bankenbereich, auf Gewerk-schaftsebene, in der Presselandschaft oder in Forschungund Lehre. Die vom VDW regelmäßig überarbeitete und inverschiedener Hinsicht begründet von anderen Quellen ab-weichende Weltmarktbetrachtung bildet traditionell einenSchwerpunkt dieser 1998 begonnenen Broschürenreihe.
Frankfurt am Main, April 2012
Verein Deutscher Werkzeugmaschinenfabriken e. V. (VDW)Bereich Wirtschaft und Statistik
2

8/15/2019 The German Machine Tool Industry in 2011
http://slidepdf.com/reader/full/the-german-machine-tool-industry-in-2011 5/84
8/15/2019 The German Machine Tool Industry in 2011
http://slidepdf.com/reader/full/the-german-machine-tool-industry-in-2011 6/84
4
Zukunftsfähigkeit der Hochtechnologie-Orientierungder deutschen Werkzeugmaschinenindustrie
Der deutsche Werkzeugmaschinenbau ist als globaler
Technologieführer sehr gut positioniert und verfolgt denExport von Hochtechnologie im Sinne eines klar ausge-richteten Geschäftsmodells. Gleichzeitig verschieben sichdie internationalen Gravitationszentren der Nachfrage zu-gunsten der BRIC-Staaten und anderer Schwellenländer.Die Untersuchung des genannten Geschäftsmodells auf Nachhaltigkeit vor dem Hintergrund dieser schwerwie-genden Veränderungen sowie Ableitung von strategischenHandlungsempfehlungen sind Anliegen einer gemeinsamenUntersuchung von VDW und PricewaterhouseCoopers(PwC) gewesen. Ausgewählte Erkenntnisse haben diePartner des Projekts im Zuge der Mitgliederversammlungdes Verbands sowie einer Pressekonferenz im Rahmen derEMO Hannover 2011 vorgestellt. Das besondere Interessegerade solcher Mitgliedsfirmen, die Business-Pläne vor-legen und rechtfertigen sollen, belegt die Sinnhaftigkeitder Studie.
PwC hat in den vergangenen Jahren zahlreiche Projekteim Maschinen- und Anlagenbau durchgeführt. Entspre-chende Erfahrungen beziehen sich, neben der klassischen
Wirtschaftsprüfung, vor allem auf Transaktionsberatungbei Unternehmensübernahmen oder Restrukturierungs -vorhaben. Die Prüfungsgesellschaft treibt derzeit die Aus-weitung von Beratungskompetenzen auf zukunftsträchtigeTechnologiefelder voran. Motivation des VDW ist zumeinen das gezielte Aufgreifen hochaktueller strate-gischer Fragestellungen, zum anderen der während derWeltwirtschaftskrise oft formulierte Wunsch, der Verbandmöge dazu beitragen, das Verständnis für branchenspe-zifische Besonderheiten der mittelständischen Werkzeug-maschinenindustrie bei Finanzdienstleistern zu vertiefen.
Intensiv geführte Gespräche und ein Workshop mit Füh-rungskräften aus geografisch breit aufgestellten Unter-nehmensgruppen des Mitgliederkreises galten Szenarien-basierten Absicherungs- und Expansionsstrategien fürunterschiedliche Marktkontexte. Will heißen: sowohl fürHochlohnmärkte mit Sättigungstendenzen, als auch fürüberproportional wachsende Schwellenmärkte. Die zwi-schen April und September 2011 zusammengetragenenInformationen und Bewertungen haben eine Überprüfungund weitere Unterlegung durch Expertise im Zuge einerschriftlichen Intensivbefragung mit repräsentativemErgebnis erfahren.
Bright prospects for the future of the German machinetool industry’s high-tech orientation
German machine tool builders are very well positioned as
global technology leaders and export high-tech systemswithin the context of a clearly structured business model.At the same time, the international centres of gravity of demand are shifting in favour of the BRIC states and otheremerging countries. Against the background of theseserious changes, a joint study by the VDW and Pricewater-houseCoopers (PwC) was carried out to examine thesustainability of the business model mentioned aboveand to derive recommendations for strategic action. Theproject partners presented selected findings during thegeneral assembly of the association and at a press confer-ence in connection with the EMO Hannover 2011. The specialinterest shown particularly by member companies requiringto submit and justify business plans provides clear evidenceof just how meaningful the study is.
Over the years, PwC has carried out a large number of projects in machinery and plant construction. Along withclassic auditing services, relevant experience also primarilyinvolves transaction consulting in company takeovers orrestructuring projects. The audit firm is currently expand-
ing its consulting competence to include seminal technol-ogy fields. The motivation of the VDW was two-fold: first,to focus attention on a highly topical strategic question,and second, to address the request often expressed duringthe global economic crisis that the association should helpgive financial service providers a deeper understanding of industry-specific particularities relative to medium-sizecompanies in the machine tool industry.
Intensive meetings and a workshop with managers froma broad geographic spectrum of member corporations
generated valid scenario-based risk management andexpansion strategies for different market contexts. Thatmeans both for high-salary markets which are showingsigns of saturation and also for emerging markets whichare growing at disproportionately high rates. The infor-mation and assessments compiled between April andSeptember 2011 were reviewed and further refined throughexpertise as part of an intensive written survey withrepresentative results.

8/15/2019 The German Machine Tool Industry in 2011
http://slidepdf.com/reader/full/the-german-machine-tool-industry-in-2011 7/84
Zukunftsfähigkeit der HochtechnologieorientierungBright prospects for the future of high-tech orientation
5
Wertmäßig knapp die Hälfte des Produktionsvolumens
deutscher Werkzeugmaschinenhersteller geht auf Nach-frage zurück, die sich auf kundenspezifische Sonderma-schinen und Projektgeschäft richtet, während lediglichetwa 30 % der Weltnachfrage auf Spitzentechnologieabzielt. Der globale Marktanteil der Branche in Deutsch-land bewegte sich in den letzten Jahren nahe der 20 Prozent- Marke. In Westeuropa und Russland hält man sehr hoheAnteile von 38 % bzw. 24 %, in China, dem Leitmarktschlechthin, sind es beachtliche 9 % und in Brasilienund Italien jeweils 8 %.
Für 2015 ist in Westeuropa, den USA und dem Einzugs-gebiet der BRIC-Staaten ein durchschnittliches jährlichesWachstum von fast 18 % zu erwarten, vorausgesetzt dieaktuelle Staatsschulden-Krise in Europa und in den USAeskaliert nicht weiter. Impulse ergeben sich für die primärtechnologiegetriebenen westeuropäischen Märkte sowiedie auf Modernisierung des bestehenden Maschinenparksangewiesenen USA aus Nachholeffekten mit Blick auf dentiefen Fall 2008/2009. In China und Indien treibt anhaltendüberproportionales Wachstum dieser Volkswirtschaften
breit angelegte Industrie- und Infrastrukturinvestitionen.Der brasilianische Markt ist durch die Automobilindustriedominiert. Im Vorfeld sportlicher Großveranstaltungenstehen Infrastrukturvorhaben bedeutender Dimension an.In Russland werden Investitionen in die Grundstoffgewin-nung zunehmend durch solche in die verarbeitendeIndustrie flankiert. Steigende Konsumfähigkeit der Be-völkerung verlangt nach höherwertigen Produkten, wassteigende Ansprüche an die Fertigungstechnik auslöst.
Technologiesegmentmix begünstigt deutsches Angebot
Der deutsche Werkzeugmaschinenbau wird sich in dennächsten Jahren im Spannungsverhältnis zwischen einerdie eigene Position stärkenden Verschiebung im Tech-nologiesegmentmix zugunsten von Mid Tech sowie HighTech und längerfristigen Unsicherheitsfaktoren bewegen,wie Fachkräftemangel, technologischer Konvergenz asia-tischer Wettbewerber oder technologischem Wandel inHaupt-Anwenderindustrien. Hinzu tritt die Tatsache, dasssich die Wertschöpfung der Branche entsprechend ihremExportmodell noch zu ganz überwiegendem Teil in Deutsch-land konzentriert. Local-Content-Anforderungen oder dieprotektionistische Nutzung anderer handelspolitischer„Stellschrauben“ können rasch zu Friktionen führen.
In terms of value, customer-specific special machines and
project business represent nearly half of the total produc-tion volume of Germany’s machine tool manufacturers,while advanced technology comprises only about 30% of world demand. In recent years, Germany’s share of theglobal market has fluctuated near the 20% mark. WesternEurope and Russia maintain very high shares of 38% and24%, respectively; the undisputed leading market Chinahas a respectable 9%, and Brazil and Italy hold 8% each.
In Western Europe, the USA and the catchment area of theBRIC states, average growth of nearly 18% is expected in2015, provided the current public debt crisis in Europe andthe USA does not escalate further. Catch-up effects in thewake of the steep declines in 2008 / 2009 give impetus tothe primarily technology-driven markets of Western Europeand also in the USA, which must modernise its existingmachine base. The national economies in China and Indiacontinue to grow at disproportionately high rates, therebydriving broad-based investments in industry and infrastruc-ture. The Brazilian market is dominated by the automotiveindustry. In advance of upcoming major athletic events,
infrastructure projects of significant scope are in the works.In Russia, investments in raw material extraction are in-creasingly flanked by their counterparts in the processingindustries. Growth in the buying power of the populationis increasing the demand for high-quality products, there-by necessitating enhancements in manufacturing tech-nology.
Combination of technology segments favoursGerman offering
In the years ahead, German machine tool constructionwill have to strike a dynamic balance between a technologysegment mix which is shifting (to the benefit of its ownposition) in favour of mid-tech and high-tech on the onehand, and longer term uncertainty factors on the other –such as the lack of skilled labour, the technological con-vergence of Asian competitors, or technological changesin major user industries. It is also true that, in accordancewith its export model, the value creation of the sectorremains concentrated to a very large extent in Germany.Local content requirements or the protectionist use of other trade policy “adjustment screws” can rapidly createfriction.
Zur Ausgangslage:Export von Hochtechnologie ist Erfolgsmodell!
Starting point:Exporting high technology is a successful model!

8/15/2019 The German Machine Tool Industry in 2011
http://slidepdf.com/reader/full/the-german-machine-tool-industry-in-2011 8/84
6
Die ausschließlich für Mitgliedsunternehmen von VDWund Fachverband Werkzeugmaschinen und Fertigungs-systeme verfügbare Studie greift dieses Szenarium in Formvon Handlungsoptionen auf, die einer vierstufigen Stra-
tegie folgen: Absicherung des High-Tech-Segments inKernmärkten, Durchdringung des High-Tech-Segmentsin BRIC-Märkten, Eintritt in das Mid-Tech-Segment derBRIC-Märkte und schließlich Durchdringung von MidTech in den Kernmärkten. Jede Stufe wird durch einenMaßnahmenkatalog vertieft.
Prinzipiell handelt es sich um zwei Untersuchungsmodule:eine ausführlich kommentierte Fassung der während derMitgliederversammlung vorgestellten Erkenntnisse, idealfür die Führungs- und Leitungsebene, sowie eine deutlichbreitere Backup-Version mit zusätzlichem Tabellen- undGrafikmaterial für die unmittelbar befasste Arbeitsebene.
The study, which is exclusively available for member com-panies of the VDW and the Sector Association Machine Toolsand Manufacturing Systems, casts this scenario in theform of action options as part of a four-pronged strategy:
consolidation of the high-tech segment in core markets,penetration of the high-tech segment in BRIC markets,entry into the mid-tech segment of the BRIC markets and,finally, penetration of mid-tech in the core markets. A listof actions develops each of these elements in detail.
There are two main analytical modules: a fully commentedsummary of the findings presented during the generalmeeting, which is ideal for the management and executivelevels, and a much broader back-up version with additionaltables and diagrams for the working level directly concerned.

8/15/2019 The German Machine Tool Industry in 2011
http://slidepdf.com/reader/full/the-german-machine-tool-industry-in-2011 9/84
Aktuelle Situation und PerspektivenCurrent situation and perspectives
Individuelle Prozesslösungen für die multifunktionale Werkstückfertigung: Drehen, Hartdrehen, Rotationsdrehen, Unrund-Feindrehen,Endenbearbeitung, Bohren, Gewinden, Fräsen, Schleifen, Finishen, Induktionshärten. Im Mittelpunkt steht die Entwicklung eines komplettenSystems bei uneingeschränkter Prozessbeherrschung. Die Komplett-Werkstückbearbeitung durch Verfahrensintegration in einemArbeitsraum bietet maximale Flexibilität, hohe Qualität, geringere Stückkosten und größtmögliche Effizienz.
Individual process solutions for multifunctional workpiece manufacturing: turning, hard turning, rotational turning, out-of-round precisionturning, end machining, boring, thread-cutting, milling, grinding, finish cutting and induction hardening. At the centre of it all is thedevelopment of a complete system capable of handling an unlimited range of processes. Complete workpiece machining through processintegration in a single workspace provides tremendous flexibility, high quality, low piece costs and maximum efficiency.

8/15/2019 The German Machine Tool Industry in 2011
http://slidepdf.com/reader/full/the-german-machine-tool-industry-in-2011 10/84

8/15/2019 The German Machine Tool Industry in 2011
http://slidepdf.com/reader/full/the-german-machine-tool-industry-in-2011 11/84
0
100
120
3-Monats-Durchschnitte: %-Veränderung zum Vorjahr (nominal)
%
3 monthly averages: %-change to previous year (nominal)
80
60
40
20
-80
-60
-40
-20
02 03 04 05 06 07 08 09 10 11
140
Situation/PerspektivenSituation/Perspectives
9
Anteile am gesamten Ausfuhrvolumen stehen sich Asienund Europa in bislang nicht gekannter Weise mit jeweils45 % Quote auf Augenhöhe gegenüber!
Parallel zum noch geschwächten Inlandsverbrauch 2010,wo ohne Berücksichtigung von Dienstleistungen nochmals10 % Minus auf 6,9 Mrd. EUR zu verbuchen sind, verbleibtauch der deutsche Werkzeugmaschinenimport mit 7 %Abschlag und 2,8 Mrd. EUR im negativen Bereich. Dertraditionellen Struktur noch folgend, decken europäischeKonkurrenten mit über 70 % Anteil einen Großteil desEinfuhrvolumens ab, wobei allerdings Lieferverflechtungenzwischen deutschen Führungsgesellschaften und ihrenTochterfirmen im Ausland eine wesentliche Rolle spielen.
Im Dezember 2010 liegt die Anzahl der Beschäftigten imWerkzeugmaschinenbau am Standort Deutschland mitrund 63.800 Personen um etwas mehr als 3% unter demJahresendstand 2009 (damals –8%). Hatte der Auslastungs-gradder Kapazitäten im Oktober 2009 bei nur mehr 67%gelegen, notiert die Branche im gleichen Monat desaktuellen Referenzjahres 2010 mit 86 %. Erwartungsgemäßähnliche Tendenz zeigt auch der Auftragsbestand: DemNiveau von 5,5 Monaten in 2009 stehen im Oktober 2010schon fast 8 Monate Reichweite gegenüber.
Still weakened in 2010, domestic consumption lost another10% excluding services (EUR 6.9 billion), while machinetool imports to Germany also remained in the negative
range with a 7% decline (EUR 2.8 billion). Maintaining thetraditional structure, European competitors covered a largepart of the import volume with more than a 70% share,whereby supply link-ups between leading German com-panies and their local subsidiaries abroad played a major role.
In December 2010, the number of employees in machinetool construction in Germany (slightly over 63,800 people)was somewhat more than 3% below the level at the endof 2009 (which was –8% at the time). If the utilisation of capacities was still only 67% in October of 2009, the indus-
try posted 86% utilisation in the same month of the cur-rent reference year of 2010. As expected, the order backlogalso demonstrated a similar tendency: The level of 5.5 monthsin 2009 contrasted with a range of nearly eight monthsalready in October 2010.
Auftragseingang der deutschen WerkzeugmaschinenindustrieOrder intake of the German machine tool industry
Quelle: VDMASource: VDMA

8/15/2019 The German Machine Tool Industry in 2011
http://slidepdf.com/reader/full/the-german-machine-tool-industry-in-2011 12/84
02 03 04 05 07 08 09
70
75
100
0 2 0 3 04 0 5 0 6 07 0 8 0 9
4
5
6
7
8
9
Kapazitätsauslastung (%)*Capacity utilization (%)*
Auftragsbestand (Monate)Order backlog (months)
10 11
10
10 11
95
90
85
80
65
60
06
10
Auftragseingang 2011 stößt in historisch einmaligeDimensionen vor
Der Auftragseingang deutscher Werkzeugmaschinenher-steller legt im Jahresverlauf 2011 um weitere 45 % auf ein Volumen von spektakulären 16,7 Mrd. EUR zu! Dasbislang als einsames Rekordniveau betrachtete Ergebnis2007 wird nicht allein wieder erreicht, sondern übertroffen.Allerdings ergibt sich im Quartalsmuster der Nachfragemit zunehmend stärkeren Referenzwerten 2010 deutlichabnehmende Entwicklungsdynamik. Während für die1. Jahreshälfte, mit 130 % Plus im 1. Vierteljahr und 83 %Zuwachs im 2. Quartal, noch eine satte wertmäßige Ver-doppelung verbucht werden darf, steht das 3. Vierteljahrfür noch 29 % Wachstum und das Schlussquartal kommtmit 6% Minus erstmals auf ein moderat negatives Ergebnis.
Die Differenzierung der Bestelltätigkeit nach Inlands- undAuslandsorders unterstreicht trotz sehr ähnlicher prozen-tualer Wachstumsbeiträge zuvor nicht vorstellbare Höhenin der Auslandsnachfrage (11,2 Mrd. EUR), selbst gegenüberextremer Ausweitung wie in 2007. Man distanziert dieseReferenz mit fast 2 Mrd. EUR Abstand. Die Inlandskompo-nente der Nachfrage 2011 steuert im Volumen 5,5 Mrd. EUR
bei und hält entsprechend deutlichen Abstand zum vor-stehend erwähnten Level 2007.
Incoming orders in 2011 take on uniquely historicdimensions
Over the course of 2011, German machine tool manufac-turers’ incoming orders increased by another 45%, reach-ing the spectacular volume of EUR 16.7 billion! Previouslyconsidered as a record which could never be repeated, the2007 result was not only attained again, but exceeded.However, in the quarterly pattern of demand with increas-ingly strong reference values in 2010, the dynamic rate of development was clearly diminishing. With a 130% increasein the first quarter and 83% growth in the second quarter,the full double in total value could be posted for the firsthalf of the year. There was only 29% growth in the thirdquarter, however, and the final quarter’s 6% decline markedthe first moderately negative result.
Despite very similar percentage growth rates, the differ-entiation of order activity according to domestic andforeign orders underscores the previously unimaginablescale of foreign demand (EUR 11.2 billion), even by compari-son with huge expansion as experienced in 2007. Thatbenchmark was outdistanced by nearly EUR 2 billion. Thedomestic component of demand contributed a volume of
EUR 5.5 billion in 2011 with a similarly unequivocal distancefrom the aforementioned level of 2007.
Kapazitätsauslastung und Auftragsbestand der deutschen WerkzeugmaschinenindustrieCapacity utilization and order backlog of the German machine tool industry
* Okt. 11 = 95,5 %,Jan. 12 = 95,6 %Quellen: Ifo-Institut, VDMA* Oct. 11 = 95.5%,Jan. 12 = 95.6%Sources: Ifo institute, VDMA

8/15/2019 The German Machine Tool Industry in 2011
http://slidepdf.com/reader/full/the-german-machine-tool-industry-in-2011 13/84
Situation/PerspektivenSituation/Perspectives
11
Nach wirtschaftsgeografischen Regionen untergliedert,ergibt sich für die Nachfrage aus Europa gegenüber der
aus Asien zwar ein überproportional hoher Steigerungs-satz von 43%, die Ablösung Europas als wichtigste Absatz-region (38% Anteil bezogen auf die Auslandsorders ins-gesamt) ist indessen angesichts von fast 46% Teilhabe imFalle Asiens bereits vollzogen! Das Nachfragevolumen ausAmerika hat sich um 44 % aufstocken lassen, der Anteil istum knapp einen Prozentpunkt auf 15,6 % angestiegen.
Die Betrachtung der nachfragestärksten Auslandskundenzeigt folgendes Bild: Der „Steigflug“ von durch China er-teilten Orders ist schlicht ohne Beispiel, das hervorragendeErgebnis 2010 lässt sich um ein weiteres Drittel überbieten,und das für die USA als Nummer 2 im Ranking verbuchteVolumen wird mit fast Faktor 4 distanziert. Im asiatischenRaum fungieren ferner Indien, Korea und Taiwan alsWachstumsmotoren. Auch die Nachfrage aus Japan legtum ein reichliches Fünftel zu. Abgesehen vom kraftvollanziehenden Aufkommen der in starkem Maße automobilgetriebenen „Klassiker“ wie Frankreich, Italien und Groß-britannien wird Europa durch hochdynamische Entwick-lungen im Osten gestützt, sprich: erneut durch Automotive
Business in Russland, Ungarn, Tschechien und der Slowakei.Der fokussierte Blick auf Amerika zeigt die USA und denNAFTA-Standort Mexiko, welcher ebenfalls den Absatz-
Broken down according to geo-economic regions, Europe’s43% growth in demand was disproportionately high versus
that of Asia, but the mantle of the biggest consumptionregion had already passed from Europe (38% share of totalforeign orders) to Asia, with its share of nearly 46%. Thedemand volume from the Americas increased by 44% whileits world share rose by barely one percentage point to 15.6%.
Analysis of the foreign customers with the highest demandshowed the following picture: The take-off and continuedclimb in orders placed by China simply has no precedent.The outstanding result of 2010 was exceeded by one thirdagain, and the volume posted for second-ranked USA wasoutdistanced by a factor of four. India, South Korea andTaiwan also served as growth engines in Asia. And Japanesedemand increased by a full fifth as well. Besides burgeoningdemand from the “classic” markets largely fuelled by theautomotive sector – including France, Italy and GreatBritain – support also came in the form of highly dynamicdevelopment in Eastern Europe: once again from the auto-motive business in Russia, Hungary, the Czech Republic andSlovakia. Turning the focus to the Americas, the lead pos-itions were held by the USA and its NAFTA partner Mexico,
which also reflected the sales boom in the internationalautomotive industry and took advantage of structurallyinduced procurement measures promoting the develop-
Wichtige Zahlen der deutschen WerkzeugmaschinenindustrieKey figures of the German machine tool industry
Mrd.EURBill.EUR %-Veränderung%-Change2007 2008 2009 2010 2011 2009/08 2010/09 2011/10
ProduktionProduction 12,6 14,2 10,2 9,9 13,1 –28 –3 +33Spanende MaschinenCutting machines 7,1 8,2 5,6 5,1 7,1 –31 –10 +41Umformende MaschinenForming machines 2,4 2,5 2,1 2,1 2,6 –15 –2 +23Teile, ZubehörParts, accessories 2,3 2,5 1,6 1,9 2,4 –36 +14 +27Installationen, Reparaturen etc.Installation, repairs etc. 0,9 0,9 0,8 0,9 1,1 –15 +10 +21AuftragseingangOrder intake 16,0 13,7 6,2 11,5 16,7 –55 +85 +45InlandDomestic 6,7 5,6 2,2 3,8 5,5 –61 +75 +46AuslandForeign 9,3 8,1 4,1 7,7 11,2 –50 +90 +45(ohne Installation, Reparaturenexcl. installation, repairs)Produktion Production 11,8 13,3 9,4 9,0 12,1 –29 –4 +34– Export – Exports 7,8 8,2 6,0 6,1 7,9 –26 +1 +31+ Import + Imports 3,3 3,7 2,1 2,0 2,8 –43 –7 +42= Inlandsverbrauch= Domestic consumption 7,4 8,8 5,5 4,9 6,9 –37 –10 +41Exportquote (%)Export quota (%) 65,9 61,9 64,3 67,5 66,0Importquote (%)Import quota (%) 45,4 42,4 38,7 40,4 40,7BeschäftigteEmployment 66 369 70 839 69 614 64 10865 877 –1,7 –7,9 +2,8Kapazitätsauslastung (%)Capacity utilization (%) 93,6 94,7 72,6 75,4 93,8Auftragsbestand (Monate)Order backlog (months) 7,5 8,7 6,2 7,1 9,3
Daten 2011 teilweise geschätztHinweise:– Daten beziehen sich auf Werkzeugmaschinen inklusive Teile/Zubehör– Auftragseingang: Hochrechnung auf Basis Verbandsstatistik– Beschäftigte, Kapazitätsauslastung, Auftragsbestand: JahresdurchschnitteQuellen: Statistisches Bundesamt, Ifo-Institut, VDMA, VDW
Data 2011 partly estimatedNote:– Figures include parts/accessories– Order intake: projection based on associations’ statistics– Employment, capacity utilization, order backlog: average of yearSources: German Statistical Office, Ifo-Institute, VDMA, VDW

8/15/2019 The German Machine Tool Industry in 2011
http://slidepdf.com/reader/full/the-german-machine-tool-industry-in-2011 14/84
12
boom in der internationalen Automobilindustrie wider-spiegelt und von strukturell induzierten Beschaffungs-maßnahmen für z. B. energieeffizientere Motoren- und
Getriebekonzepte profitiert, sowie natürlich das aufstre-bende Brasilien und Argentinien in den Spitzenpositionen.
Bei quartalsweise relativ gleich verteilten Wachstumsbei-trägen, die den hohen Auslastungsgrad der Firmen undabnehmende Kapazitätsspielräume signalisieren, stehenschließlich für das gesamte Jahr 2011 sage und schreibe
33% Produktionsplus auf 13,1 Mrd. EUR zu Buche (erneuteinschließlich Teile/Zubehör und Dienstleistungen). In der„Netto-Betrachtung“ allein für die Maschinenfertigungsind es 35 % Plus. Hinter der Rekordausbringung desJahres 2008 bleibt die Branche insgesamt um etwa 8 %zurück, wobei aber Hersteller spanender Werkzeugma-schinen bereits den unmittelbaren Anschluss herstellenkönnen.
In der Gegenüberstellung der Ergebnisse für spanendeund umformende Technologien kommen die unterschied-lichen Beschaffungsmodalitäten zum Ausdruck. In demSinne nämlich, dass sich die überproportionale Dynamikim spanenden Bereich stärker in konjunkturellem Zusam-
ment of more energy efficient engines and transmissionconcepts, for example – together with the ambitious Braziland Argentina, of course.
Relatively constant quarterly growth rates were indicativeof companies’ consistently higher utilisation and dimin-ishing flexibility in terms of capacity. Believe it or not, theyultimately accounted for a 33% increase in production toEUR 13.1 billion for the full year 2011 (once again includingparts and accessories, and services). In the “net analysis”
for machinery production alone, there was a 35% increase.Overall the sector remained about 8% behind the recordoutput of 2008, whereby manufacturers of metal-cuttingmachine tools already came within striking distance.
A comparison of the results for metal-cutting and metal-forming technologies reflects their different procurementmodalities. Which is to say that the disproportionatelydynamic activity in the metal-cutting sector, with itsmuch broader market segment orientation, primarilyfollowed the general economic climate. By contrast, themetal-forming sector is driven to a large extent by (heavyduty) press construction. As a result it is closely tied to theprocurement activity of the automotive industry, so its
2011 = VDW-SchätzungHinweis: Ab 1995 Werteverfügbar für Installation,ab 2002 zusätzlich fürReparatur/InstandhaltungQuellen: StatistischesBundesamt, VDW, VDMA2011 = VDW estimateNote: since 1995 figuresavailable for installation,since 2002 additionallyfor repair/maintenanceSources: German StatisticalOffice, VDW, VDMA
Werkzeugmaschinen-Produktion DeutschlandMachine tool production Germany
Maschinen MachinesTeile, Zubehör Parts, accessoriesInstallation, Reparatur/Instandhaltung Installation, repair/maintenance
92 93 94 95 96 97 98 99 00 01 02 03 04 05 06 07 08
Mrd.eur Bill.eur
0
3
6
9
12
15
09 10 11
Auftragsflut des Jahres 2011 lässt sichhinsichtlich der Umsetzung im Produktionswertnur mit Zeitversatz bändigen
The overwhelming flood of orders in 2011cannot be converted into production valuewithout a time delay

8/15/2019 The German Machine Tool Industry in 2011
http://slidepdf.com/reader/full/the-german-machine-tool-industry-in-2011 15/84
Situation/PerspektivenSituation/Perspectives
13
menhang mit deutlich bereiterer Aufstellung nach Bran-chen versteht, während der durch den (Groß-)Pressenbaugeprägte umformende Bereich eng dem Beschaffungs-verhalten der Automobilindustrie folgt, entsprechende
Pro jekte sehr lange Durchlaufzeiten haben und sich dieRealisierung von Auftragsvolumen in Produktion und Um-satz oft „paukenschlagartig“ und das jeweilige Berichts jahrüberschreitend vollziehen kann. Auch der mit Umformtech-nik verbundene positive Basiseffekt – man arbeitet bereits2010 fast wieder auf Vor jahresniveau – bremst Zuwachsein.Speziell die Blechbearbeitungmit und ohne Laserverwen-dung hat im Gegensatz zum projektorientierten Pressen-bau 2010 für schnellen Durchsatz gesorgt.
Der Werkzeugmaschinenexport setzt seinen Wachstums-kurs im 4. Quartal 2011 gebremst, aber mit Zuwachs umein Fünftel souverän fort. Das Jahresergebnis steht fürkraftvolles Plus von 31% auf ein Volumen von 7,9 Mrd. EUR,gleicht den Einbruch aus dem Krisenjahr 2009 im Konzertmit 2010 fast vollständig aus und kommt somit direkt anden Rekordwert 2008 heran. Treibsätze für das Ausfuhr-wachstum 2011 sind mit 57% Steigerungssatz das Amerika-geschäft und die mit 29 % Plus (nach +22% im Referenzjahr)notierende Dynamik Asiens. Zwar legt auch der europäischeMarkt um 25% zu, doch läuft sein Anteil am Gesamtexport
von 45% in 2010 auf aktuell 43% zurück. Asien hingegenhält seinen Anteil von 41 % konstant. Amerika weitet seinePartizipation von 12% auf knapp 15% aus. Für China alleinesind im aktuellen Berichtsjahr 34 % Zuwachs und ein mo-derat ausgebauter Anteil von 29% am gesamten Ausfuhr-volumen deutscher Herstellerfirmen zu konstatieren. DieStellung als zweitgrößter Markt können die USA mit 66%Plus und einem Anteilsgewinn von 2 Punkten auf 9% aus-bauen. Trotz gegenüber 2010 vergleichsweise schmalemZuwachs um 11 % steht Russland für die drittstärkste Auf-nahmefähigkeit für deutsche Werkzeugmaschinen, noch
vor der klassischen europäischen Kundschaft in der Schweiz,Frankreich und Italien.
Wegen der im Universalmaschinenbereich eingefordertenkurzen Lieferzeiten, hauptsächlicher Lost-Order-Grund fürdie voll ausgelastete Branche in Deutschland, partizipiertder Werkzeugmaschinenimport 2011 mit 42 % Plus auf rund 2,8 Mrd. EUR (ohne Dienstleistungen) voll am Inlands-verbrauch, der sich auf 6,9 Mrd. EUR beläuft. Der auf euro-päische Konkurrenz entfallende Anteil sinkt von fast 72 %im Vorjahr auf 68 %, die Teilhabe Asiens nimmt hingegenvon 22 % auf wenig unter 26% zu. Im Falle der Schweiz(alleine 32% Anteil), Italiens (Partizipation von knapp 8%),Tschechiens und Polens (gemeinsamer Anteil von gut 7 %)
projects typically have very long turnaround times and thecontract volumes it realises as production and turnoverwith great “fanfare” often extend beyond the year currentlyunder review. And the basic positive effect underlying
metal-forming technology – already in 2010 work wasproceeding almost at the level of the previous year again –also inhibited growth. Unlike the project-oriented pressconstruction, sheet-metal machining, with and withoutthe use of lasers, provided particularly rapid throughput.
In the fourth quarter of 2011, machine tool exports continu-ed to grow at a somewhat slower pace, increasing by asolid 20% nevertheless. The results over the course of the
year increased by an impressive 31% to a volume of EUR7.9 billion. Together with 2010, this compensated completelyfor the collapse from the crisis year of 2009, thereby closelyapproaching the 2008 record value. The driving forcesbehind export growth in 2011 comprised trade with theAmericas (+57%) and the dynamic activity in Asia (+29%,following a 22% increase in the reference year). The Euro-pean market also grew by 25%, but its share of total worldexports fell from 45% in 2010 to its current level of 43%.Asia, on the other hand, maintained its 41% share. TheAmericas extended their share from 12% to nearly 15%. Onits own, China posted 34% growth and a moderately higher
29% share of the total volume exported by German manu-facturers in the current reporting year. As the second lar-gest market, the USA was able to extend its position with+66% and a two-point gain in world share to 9%. Despitecomparatively modest 11% growth over 2010, Russia repre-sented the third strongest absorption capacity for Germanmachine tools, still ahead of the traditional Europeancustomer base in Switzerland, France and Italy.
Due to the short delivery times demanded by the universalmachine sector – the primary reason for lost orders in
Germany, where the sector was operating at full capacity –the 42% increase in machine tool imports to about EUR 2.8billion in 2011 (without services) was used exclusively tosupport domestic consumption, which totalled EUR 6.9billion. The share corresponding to the European competi-tors fell from nearly 72% in the previous year to 68%, whileAsia’s share rose from 22% to just below 26%. In the caseof Switzerland (a 32% share all to itself), Italy (nearly an 8%share), the Czech Republic and Poland (common share of afull 7%), mention should once again be made of the supplylink-ups between leading German companies and localsubsidiaries. Following a 12% increase in 2010, the volumeof rapidly deliverable universal machines imported fromJapan increased by 55% in the current reporting year, and

8/15/2019 The German Machine Tool Industry in 2011
http://slidepdf.com/reader/full/the-german-machine-tool-industry-in-2011 16/84
14
ist erneut auf Lieferverflechtungen deutscher Führungs-gesellschaften mit dortigen Tochterfirmen zu verweisen.Der Import schnell lieferbarer Universalmaschinen ausJapan steigt nach 12% Zunahme 2010 im aktuellen
Berichts jahr um 55% und erreicht einen Anteil von knapp13 % an der Gesamteinfuhr. Koreanische, taiwanesische undchinesische Standardmaschinen aus dem Basissegment,vielfach über den Handel re-exportiert, legen gegenüber2010 jeweils über 80% bzw. im letztgenannten Fall um 52 %zu und realisieren gemeinsam einen im Vergleich mit demReferenzjahr gleichgebliebenen Anteil von 12%.
Branche geht selbstbewusst ins Geschäftsjahr 2012,weiteres Produktionsplus vorgezeichnet
Natürlich ist die Vorausschau wegen des gerade in letzterZeit sehr heftig auftretenden Korrekturbedarfs bei denPrognosegrundlagen ein heikles Unterfangen. Es herrschennach wie vor, trotz eingeläuteter Entspannung in dergestörten Kreditversorgung ganzer Volkswirtschaften,unsichere Erwartungen. Die Abschätzung der Aufnahme-fähigkeiten wichtiger Märkte für Investitionsgüter bleibtüberlagert durch den sorgenvollen Blick auf das weltweiteFinanzsystem. Die Prognose an sich bewegte sich währendder vergangenen drei Jahre in einem denkbar ungünstigen,
weil stark volatilen Umfeld. Trendverschiebungen imVerlauf der globalen Bruttoinlandsprodukte, der Industrie-produktionen und insbesondere Anlageinvestitionen inHaupt-Anwenderindustrien führender Märkte bleiben auf der Tagesordnung.
Ausgelöst durch die am aktuellen Rand fühlbaren finanz-und realwirtschaftlichen Konsolidierungstendenzen dürftensich das Produktionsgeschehen und der Invest aber stabilerals erwartet entwickeln. Weltweite Industrieproduktionund Investitionstätigkeit sind vom Prognosepartner des
VDW, der britischen WirtschaftsforschungsgesellschaftOxford Economics, im Frühjahr des laufenden Jahres vonStagnation bzw. lediglich 3% Steigerungsrate auf knapp 4%Plus bzw. 7% Zuwachs neu justiert worden. Entsprechendbewegten sich diese Sätze deutlich über dem noch im Spät-herbst 2011 als Risikovariante durchgespielten Szenarium.
Im Halbjahresmuster des Auftragseingangs deutscherWerkzeugmaschinenhersteller sind im laufenden Jahrüberproportionale Abstriche während der ersten 6 Monateund anschließende Konsolidierung in der 2. Jahreshälftevorgezeichnet. In Sachen deutscher Werkzeugma -schinenproduktion dürfte sich die Entwicklung imJahresverlauf naturgemäß umgekehrt ausnehmen: Hier
their share of total imports was just below 13%. SouthKorean, Taiwanese and Chinese standard machines fromthe basic segment, in many cases re-exported through thetrade, increased more than 80% over 2010 – +52% in the
case of the latter – and achieved together a 12% share, whichremained constant relative to the reference year.
The industry heads into the business year 2012 withconfidence – further increase in production anticipated
The frequent need to correct basic data underlying prog-noses in recent times has made predicting the futurerather difficult, of course. Uncertainty continues to reigndespite initial relief in the disrupted credit supply of entirenational economies. Estimations of the absorption capaci-ties of major markets for investment goods remain over-shadowed by worrisome prospects for the global financesystem. During the past three years, prognoses themselvesinvolved the least favourable conditions imaginable – whichis to say, highly volatile ones. Shifting trends in global GDPdevelopment and industrial production and especially withregard to equipment investments in the major user indus-tries of leading markets are still on the agenda.
Currently on the margins, however, there are perceptible
consolidation tendencies in finance and real economy. Theproduction activity and investment they induce should bestabler than once feared. In the spring of the current year,the VDW’s prognosis partner, the British economic researchinstitute Oxford Economics, readjusted its assessments of global industrial production and investment activity fromstagnation and a mere 3% growth rate, respectively, tonearly +4% and 7% growth, respectively. So these rateshave already risen well above the scenario which was stillconsidered as the risk variant in the late autumn of 2011.
The half-year pattern of incoming orders received by Ger-man machine tool manufacturers anticipates dispropor-tionately high declines during the first six months of thecurrent year followed by consolidation activity in thesecond half. Regarding German machine tool production,the development over the course of the year should natur-ally turn out the other way round: Here a continued strongfirst half-year is likely to be followed by a moderate one-digit decrease. The composition of its portfolio of foreignorders will effectively support the sector in Germany. Thisis because of the weight of Asia, which is high and stillgrowing, and the much lower loss of momentum in machinetool consumption required here in 2012 (–5%). Moreover,the Chinese (and now the Indians as well) see a growing

8/15/2019 The German Machine Tool Industry in 2011
http://slidepdf.com/reader/full/the-german-machine-tool-industry-in-2011 17/84
Situation/PerspektivenSituation/Perspectives
15
darf nach dem noch starken 1. Halbjahr ein moderateseinstelliges Minus als wahrscheinlich gelten. Für die Branchein Deutschland stützend wird sich die Zusammensetzungihrer Auslandsorders auswirken. Dies wegen des hohen
und weiter wachsenden Gewichts Asiens und der hier mit5% Minus deutlich geringer erforderlichen Dynamikverlusteim Werkzeugmaschinenverbrauch 2012. Hinzu tritt die auschinesischer Sicht (letztlich auch aus indischem Blickwinkel)notwendige Hinwendung zu hochwertigen, potentziellexportfähigen Erzeugnissen, was den Anspruch an Ferti-gungstechnologien nach oben verschiebt. Deutsche Her-steller haben gute Chancen, überproportional an solchenTrends zu partizipieren. Der hohe Auftragsbestand vondeutlich über 9 Monaten wird die „Nachfragedelle“ imÜbergangsjahr 2012 ebenfalls ein gutes Stück einebnen.
VDW und Oxford Economics haben ihre Prognose für dieProduktion 2012 der deutschen Werkzeugmaschinen-industrie deshalb auf 5% Plus gesetzt. Die gesamte durch-schnittliche Auftragsreichweite darf nicht als über dieBranche gleich verteilt unterstellt werden. Insofernmarkiert eine um 5 % gesteigerte Ausbringung aus Sichtvon Universalmaschinenherstellern im Volumengeschäfteine außerordentlich fordernde Marke. Andererseits wirdder hohe Anteil kundenspezifischer Sonderanlagen und
des Projektgeschäfts mit langen Durchlaufzeiten amgesamten Auftragseingangsvolumen 2011 (45 % Plus) starkdurchschlagen. Diese firmenkonjunkturellen Unter-scheidungsmerkmale hat der VDW in seinerÖffentlichkeitsarbeit wiederholt unterstrichen.
need for high-quality, potentially exportable products, andthis is raising the standards of manufacturing technologyfurther. German manufacturers are well positioned tobenefit disproportionately from such trends. The high order
backlog (well over nine months) will also go a long waytowards smoothing the “demand dip” during the transition
year of 2012.
For this reason, the VDW and Oxford Economics have settheir prognosis for the production of the German machinetool industry in 2012 to +5%. It would be a mistake to assumethat the overall average order backlog is evenly distributedthroughout the industry. In that respect, 5% more outputwould be an extraordinarily challenging target from theperspective of universal machine manufacturers in thevolume business. On the other hand, the high share of cus-tomised special units and of project business with longturnaround times will heavily penetrate the overall volumeof 2011 incoming orders (+45%). In its public relations work,the VDW has repeatedly stressed these distinguishingcharacteristics with regard to the economic conditions of companies.

8/15/2019 The German Machine Tool Industry in 2011
http://slidepdf.com/reader/full/the-german-machine-tool-industry-in-2011 18/84

8/15/2019 The German Machine Tool Industry in 2011
http://slidepdf.com/reader/full/the-german-machine-tool-industry-in-2011 19/84
Werkzeugmaschinen-Produktion Machine tool production
Maximale Zerspanleistungen und Schnittgeschwindigkeiten durch den Einsatz von hochproduktiven Werkzeugen mit Wendeschneid-platten-Technologie auf einer Wälzfräsmaschine.
Maximum metal removal rates and cutting speeds through the use of high productivity tools with tipped tool insert technology on a gear hobbing machine.

8/15/2019 The German Machine Tool Industry in 2011
http://slidepdf.com/reader/full/the-german-machine-tool-industry-in-2011 20/84
18
Referenz für aktuelle Bewertungen: 2010 läuft wegenNachfrageboom aus Asien deutlich besser als zuJahresbeginn erwartet
Der typische Zeitversatz zwischen wieder hochlaufenderProduktion beim Kunden und nachfolgendem Invest inneue Anlagen bleibt 2010 weitgehend aus oder erweistsich doch als in bislang nicht gekannter Weise verkürzt.Weder für das ansatzlose Auftreten und die Intensität desNachfrageausfalls zu Krisenbeginn im Herbst 2008 undwährend des frühen Jahresverlaufs 2009 noch hinsichtlichdes nicht minder unmittelbaren und drastischen Anzie-hens der Orders 2010 gibt es Vorbilder in der Branchenhis-torie. Beim extremen Steigungswinkel der Bestelltätigkeitim Referenzjahr dieser Publikation spielen natürlich dieTiefe der zuvor erreichten Talsohle und vergleichsweisebescheiden gewordene Volumina der betreffenden Aggre-gate eine nicht unwesentliche Rolle. Im Frühjahr 2010wird der dynamische Aufschwung und die Extrapolierbar-keit dieser Entwicklung auf den weiteren Jahresverlauf mitvorsichtiger Skepsis gesehen. Die Möglichkeit des Auftre-tens eines inzwischen „legendär“ gewordenen V-förmigenKonjunkturmusters gilt zu diesem Zeitpunkt als eherunrealistisch.
Dann aber kommt die deutsche Werkzeugmaschinenin-dustrie Quartal für Quartal in den Genuss zweistelligerZuwächse im Auftragseingang. Im 2. Halbjahr 2010 notierenmehrere Monate mit sogar dreistelligem Plus, das 4. Quar-tal verdoppelt den Referenzwert nahezu, und im Gesamt-
jahr 2010 darf ein um 85% höherer Auftragswert verbuchtwerden. Getrieben ist diese Entwicklung zunächst vorallem durch die Auslandsnachfrage, insbesondere ausChina, Südkorea und Indien. Diese Länder haben die Krisedeutlich schneller abgeschüttelt, sind frühzeitig auf denWachstumspfad zurückgekehrt und unterstützen somit
initial die Erholung des Werkzeugmaschinenbaus inDeutschland. Der Aufschwung in der Auslandsnachfragegewinnt danach zügig an Breite. Während der ersten dreiQuartale 2010 verzeichnen praktisch alle Regionen zwei-stellige Zuwächse, Südamerika und Südostasien glänzendreistellig.
Schon im August 2010 stehen erstmals wieder „schwarze“Umsatzresultate zu Buche! Bis Jahresende erfreut sich dieBranche Monat für Monat zweistelliger Zuwächse. Schließ-lich zeigt der Produktionswert im gesamten Jahresverlauf
Reference for current assessments: 2010 results areconsiderably better than expected at the start of theyear due to boom in demand from Asia
The typical time lag between the re-launch of productionat the customer and their subsequent investment in newequipment remained largely absent in 2010, or certainlyturned out to be far shorter than ever before. No historicalmodels from the industry exist for the sudden emergenceand intensity of the loss in demand at the start of the crisisin the autumn of 2008 and during the early part of 2009 –nor do models exist for the no less immediate and drasticrise in orders in 2010. The depth of the preceding valleyand the volumes of the aggregates concerned, which hadbecome relatively modest, played a significant role in theextremely steep increase in order activity in the reference
year of this publication, of course. In the spring of 2010,the dynamic recovery and the validity of extrapolating thatdevelopment to the rest of the year were met with cautiousscepticism. The possibility of experiencing what has mean-while become a “legendary” V-shaped economic curve wasconsidered rather unrealistic at that point in time.
But then, quarter after quarter, the German machine toolindustry enjoyed two-digit growth rates in incoming orders.
Several months during the second half of 2010 even postedthree-digit increases, and the reference value was nearlydoubled in the fourth quarter. The sector finished 2010with an 85% higher order value for the year. This trend wasdriven primarily by demand from abroad, especially fromChina, South Korea and India. These countries shook off the effects of the crisis much faster than the others. Theyreturned to a path of growth early, thereby providing initialsupport for the recovery of machine tool construction inGermany. The upswing in demand from abroad broadenedrapidly thereafter. During the first three quarters of 2010,
practically every region posted two-digit growth rates.South America and Southeast Asia outshined the restwith three-digit performance.
In terms of turnover, results already started to be in theblack again by August of 2010. By the end of the year, thesector was enjoying two-digit growth rates month aftermonth. Ultimately the production value over the courseof 2010 still posted a slight 3% loss relative to 2009. Thehealthy expansion of output was supported by metal-forming technology, which represented about 30% of the
Contrary to past experience, turnover alsobegan to increase much sooner
Auch der Umsatz dreht entgegen frühererErfahrungen viel schneller ins Plus

8/15/2019 The German Machine Tool Industry in 2011
http://slidepdf.com/reader/full/the-german-machine-tool-industry-in-2011 21/84
ProduktionProduction
19
2010 noch ein schmales Minus von 3 % im Vergleich mit2009. Gestützt wird die sich gut entwickelnde Ausbringungdurch die Umformtechnik, die für etwa 30% des Geschäftsmit Werkzeugmaschinen steht. Besonders positiv hebt
sich dabei die Blechbearbeitung ab, die im Gegensatz zurstark projektorientierten Pressentechnik wesentlich kürzereDurchlaufzeiten realisieren kann. Dies treibt die Produkti-onsleistung hier wieder fast auf Vorjahresniveau. Die Zer-spanungstechnik indessen notiert noch mit 7% im Minus.
Produktionsvolumen 2011 bricht sämtliche Rekorde
Nicht umsonst ist in Übersichtskapitel 2 bereits auf tradi-tionell hohe Anteile kundenspezifisch ausgelegter Sonder-maschinen bzw. des Projektgeschäfts, in beiden Fällen mitlangen Durchlaufzeiten verbunden, am gesamten Auftrags-eingang deutscher Werkzeugmaschinenhersteller hinge-wiesen worden. So ist dies insbesondere auch in 2010 derFall – und: für den gesamten Jahresverlauf ergibt sich einum 85 % über 2009 notierender Auftragseingang. ImOktober 2010 verfügt der deutsche Werkzeugmaschinen-bau bereits wieder über durchschnittlich fast 8 MonateReichweite der Auftragsbestände. Es liegt also auf der Hand,dass ein ganz erheblicher Anteil der insgesamt eingegan-genen Bestellungen erst in 2011 produktiv bzw. umsatz-
wirksam werden kann. Derart hoher Auftragsüberhangund anhaltend florierende laufende Orders im Berichts- jahr 2011 selbst (+45 %) führen zu Produktionswachstumvon 41% im reinen Maschinengeschäft während des 1. Halb-
jahres, von 38% im 3. Vierteljahr und somit leicht nachvoll-ziehbar auch von fast 40% über die ersten drei Quartale2011.
Nach Blick auf die monatlich vom VDMA durchgeführte,als Trendaussage gut taugliche Fortschreibung der Um-satzindizes für Oktober bis Dezember 2011 lässt sich die
Ausbringung des gesamten Jahres 2011 guten Gewissensmit 35 % Plus im Maschinengeschäft bzw. 33% Plus auf hochgerechnet 13,1 Mrd. EUR Volumen einschließlichTeile/Zubehör und Dienstleistungen beziffern.
VDW und Oxford Economics avisieren weiteresProduktionsplus 2012
Für den Ausblick auf 2012 relevant ist die Feststellung, dasssich der Auftragsbestand im Oktober 2011, trotz zum gleichenZeitpunkt 96 % Kapazitätsauslastung, nach wie vor beideutlich über 9 Monaten bewegt! Der Personalstandnotiert im Dezember 2011 mit rund 67.700 Beschäftigtenreichlich 6% über Vorjahresmonat. Ausgelöst durch die
machine tool business. One particularly positive highlighthere was the sheet-metal machining segment, which, unlikethe highly project-oriented press technology, was able toachieve significantly shorter turnaround times. This drove
the production performance here almost back up to thelevel of the previous year. Cutting machine tools, however,still posted a 7% decline.
Production volume in 2011 breaks all records
The overview chapter 2 has already indicated – and withgood reason – that the incoming orders received by Germanmachine tool manufacturers traditionally include a highshare of special machines designed according to customerspecifications, and also a high share of project business,both of which involve long turnaround times. This wasalso the case in 2010 in particular – and over the courseof the entire year, incoming orders exceeded the level of 2009 by 85%. In October of 2010, German machine toolconstruction had already established an average orderbacklog of nearly eight months again. So it goes withoutsaying that a very significant share of the total ordersreceived could not become productive or affect turnoveruntil 2011. An order backlog of this amplitude and continu-ously flourishing open orders in the reporting year 2011
itself (+45%) led to a 41% increase in production in the puremachinery business during the first half of the year, a 38%increase in the third quarter, and therefore also an easilycomprehensible increase of nearly 40% over the course of the first three quarters of 2011.
The continued sales indices that the VDMA prepares on amonthly basis are well suited for predicting trends. In viewof their figures for October through December 2011, thetotal output for 2011 can be estimated in good consciencewith a 35% increase for the machine business alone, and
with a 33% increase including parts and accessories, andservices to a projected volume of EUR 13.1 billion.
VDW and Oxford Economics predict a further increasein production in 2012
Regarding the prospects for 2012, it is appropriate to notethat although production was operating at 96% of capacityat the time, the order backlog in October 2011 remainedwell over nine months! With some 67,700 employees, staff-ing in December 2011 was a full 6% higher than in the samemonth of the previous year. Currently on the margins,however, there are perceptible consolidation tendenciesin finance and real economy. The production activity and

8/15/2019 The German Machine Tool Industry in 2011
http://slidepdf.com/reader/full/the-german-machine-tool-industry-in-2011 22/84
20
Spanende Werkzeugmaschinen*Metal cutting machine tools*
Umformende Werkzeugmaschinen*Metal forming machine tools*
Mrd.eur
Bill.eur
92 93 94 95 96 97 98 99 00 01 02 03 04 05 06 07 08
0
1
2
3
4
5
6
7
8
9
09 10 11
am aktuellen Rand fühlbaren finanz- und realwirtschaft-lichen Konsolidierungstendenzen dürften sich Produktions-geschehen und Invest stabiler als zuvor angenommen
entwickeln. Weltweite Industrieproduktion und Investiti-onstätigkeit sind vom Prognosepartner des VDW, derbritischen Wirtschaftsforschungsgesellschaft OxfordEconomics, deutlich über den Ansätzen liegend justiertworden, die noch im Spätherbst 2011 für ein Risiko-Szena-rium galten. Entsprechend konnte die aktuellste Voraus-schau für die Produktion 2012 der deutschen Werkzeug-maschinenindustrie auf 5 % Plus gesetzt werden. Eineausführlichere Herleitung dieses neuen Eckwertes findetsich gegen Ende des vorangegangenen Kapitels „AktuelleSituation und Perspektiven“.
Internationale Präsenz der Branche
Zunehmend weniger Sinn macht es auch für die Werkzeug-maschinenindustrie, alleine auf Datenmaterial für denStandort Deutschland abzustellen. Schließlich steht dieAuslandsproduktion deutscher Hersteller mit Blick aufdie Gesamtleistungsfähigkeit der Branche mittlerweilefür weit mehr als einen „Added Value“. Die Abschätzungder Auslandsproduktion wirft verschiedene Probleme auf.
So muss alles außen vor bleiben, was als Umsatz im deut-schenStammhaus fakturiert und somit bereits an natio-nale statistische Behörden gemeldet worden ist. Ferner
investment they induce should be stabler than initiallyassumed. The VDW’s prognosis partner, the British economicresearch institute Oxford Economics, has adjusted its assess-
ments of global industrial production and investmentactivity well above the estimates which were still consid-ered as a risk scenario in the late autumn of 2011. As a result,the production of the German machine tool industry isnow projected to increase by 5% in 2012. A complete deri-vation of this new benchmark appears at the end of theprevious chapter “Current situation and perspectives”.
International presence of the sector
It is becoming less and less useful to gear analyses to dataconcerning Germany alone. This also applies in connectionwith the machine tool industry. After all, in view of theoverall capacity of the sector, German manufacturers’ pro-duction abroad stands for far more than just an “addedvalue”. The analysis of production abroad raises a series of issues. For instance, all sales invoiced by the German headoffice – and thereby previously reported to national statis-tical authorities – must be excluded from consideration.Furthermore, the significance of components and modulesprovided from abroad and of basic machines supplied from
Germany that are then customised abroad and recordedthere separately as sales must be sufficiently clarified.
2011 = VDW-Schätzung* ohne Teile, ZubehörQuellen: StatistischesBundesamt, VDW, VDMA2011 = VDW estimate* excluding parts,accessoriesSources: German StatisticalOffice, VDW, VDMA
Produktion spanender und umformender Werkzeugmaschinen in DeutschlandProduction of metal cutting and forming machine tools in Germany

8/15/2019 The German Machine Tool Industry in 2011
http://slidepdf.com/reader/full/the-german-machine-tool-industry-in-2011 23/84
21
Deutsche Werkzeugmaschinen-Produktion nach Technologien (Mio. eur )German machine tool production by technologies (mill. eur )
%-Anteil %-Veränd. %-Anteil %-Veränd.%-Share %-Change
Jan.–Sept.%-Share %-Change
2007 2008 2009 2010 2010 2010/09 2010 2011 2011 2011/10Laser-, Ionen- und UltraschallmaschinenLaser-, ion beam-, ultrasonic machines
480 469 231 264 2,7 +14 192 253 2,8 +32
ErodiermaschinenElectrical discharge machines
75 74 46 56 0,6 +20 23 29 0,3 +28
Bearbeitungszentren, Flexible SystemeMachining centres, flexible systems
1 542 1 913 1 269 1 081 10,9 –15 6201 137 12,7 +83
Mehrwege-, TransfermaschinenUnit construction machines, transfer machines
465 564 516 453 4,6 –12 345 398 4,4 +15
Drehmaschinen, DrehzentrenTurning machines, turning centres
1 370 1 565 1 062 960 9,7 –10 606 1 011 11,3 +67
Bohr-, Ausbohrmaschinen, komb. Ausbohr- und FräsmaschinenDrilling machines, boring machines, boring-milling machines
188 215 146 162 1,6 +11 109 126 1,4 +16
FräsmaschinenMilling machines 996 1 086 703 668 6,8 –5 456 555 6,2 +22Schleif-, Hon-, Läpp- und PoliermaschinenGrinding, honing, lapping and polishing machines
1 120 1 226 853 710 7,2 –17 405 689 7,7 +70
Verzahnmaschinen, ZahnfertigbearbeitungsmaschinenGear cutting and finishing machines
543 748 619 528 5,3 –15 379 385 4,3 +2
Säge- und TrennmaschinenSawing and cutting-off machines
238 268 145 149 1,5 +3 95 143 1,6 +50
Sonstige spanende WerkzeugmaschinenOther metal cutting machine tools
71 86 50 51 0,5 +0 28 34 0,4 +18
Spanende WerkzeugmaschinenMetal cutting machine tools
7 089 8 214 5 642 5 080 51,4 –10 3 257 4 759 53,1 +46
Schmiedemaschinen und Hämmer (einschl. Pressen)Forging machines and hammers (incl. presses)
88 160 232 299 3,0 +29 217 190 2,1 –12
Biege-, Abkant- und Richtmaschinen (einschl. Pressen)Bending, folding and straightening machines (incl. presses)
505 543 409 384 3,9 –6 260 324 3,6 +25
Scheren, Lochstanzen, Ausklinkmaschinen (einschl. Pressen)Shearing, punching, notching machines (incl. presses)
446 432 328 341 3,5 +4 243 318 3,6 +31
Andere PressenOther presses
623 605 562 578 5,8 +3 412 514 5,7 +25
Drahtbe- und -verarbeitungsmaschinenWire working machines
286 299 211 184 1,9 –13 125 176 2,0 +41
Sonstige umformende WerkzeugmaschinenOther metal forming machine tools
403 462 382 300 3,0 –22 212 313 3,5 +48
Umformende WerkzeugmaschinenMetal forming machine tools
2 352 2 501 2 125 2 086 21,1 –2 1 468 1 835 20,5 +25
Werkzeugmaschinen insgesamtTotal machine tools
9 441 10 715 7 767 7 166 72,5 –8 4 7256 594 73,6 +40
Teile und ZubehörParts and accessories
2 328 2 537 1 623 1 851 18,7 +14 1 2901 630 18,2 +26
Installation, Reparatur, Instandhaltung von WerkzeugmaschinenInstallation, repair, maintenance of machine tools
855 925 788 865 8,8 +10 612 736 8,2 +20
Werkzeugmaschinen inkl. Teile und Zubehör,Installation, Reparatur, InstandhaltungMachine tools incl. parts and accessories,
12 624 14 178 10 177 9 881 100,0 –3 6 6278 961 100,0 +35
installation, repair, maintenance
vorläufigQuellen: Statistisches Bundesamt, VDW, VDMA
preliminarySources: German S tatistical Office, VDW, VDMA
ProduktionProduction
8/15/2019 The German Machine Tool Industry in 2011
http://slidepdf.com/reader/full/the-german-machine-tool-industry-in-2011 24/84
22
muss die Bedeutung aus dem Ausland beigestellter Kompo-nenten und Baugruppen bzw. aus Deutschland gelieferterRumpfmaschinen, die im Ausland veredelt werden unddort separat als Umsatz anfallen, hinreichend geklärt sein.
Die geografische Orientierung am global tätigen Großan-wender Automobilindustrie hat zum Aufbau von Produkti-onsstätten vor allem in Westeuropa (Frankreich, Großbri-tannien, Italien, Österreich, Schweiz), Osteuropa (Tschechien,Polen), den USA und Brasilien geführt. Auch in LändernAsiens, wo die Volksrepublik China die Entwicklung domi-niert, gibt es bereits Standorte mit noch bescheidener, aberkräftig wachsender Ausbringung. Hier steht das Engage-ment noch eher am Anfang, wird aber künftig insbeson-dere in China, wegen verschärfter Local-Content-Anforde-rung und dem gezielten Zurückdrängen von Einfuhrenzugunsten der Eigenproduktionen, zu intensivieren sein.Nahezu alle großen Werkzeugmaschinenhersteller unter-halten einen oder mehrere Produktions- bzw. Montage-standorte im Ausland. Vor dem Hintergrund des mittel-ständischen Charakters der Branche (mehr als die Hälfteder Betriebe beschäftigt höchstens 250 Mitarbeiter) stößtProduktionsverlagerung an finanzielle und personelleGrenzen.
Einmal abgesehen von mehreren hundert Vertriebs- undServiceniederlassungen bzw. Repräsentanzen deutscherWerkzeugmaschinenhersteller in aller Welt, dürften derzeitweniger als 20 deutsche Unternehmensgruppen kompletteAnlagen im Ausland produzieren. Zuletzt sind 51 Produkti-onsstätten in 13 Ländern ermittelt worden. Mit rund 1,1 Mrd.EUR Volumen im Jahr 2010 hat der Teilnehmerkreis einerentsprechenden VDW-Erhebung das in 2009 erzielte Er-gebnis knapp gehalten. Auffällig dabei ist die Heterogenitätder Firmenergebnisse: Während verschiedene meldendeUnternehmen Zuwächse im zweistelligen Bereich ver-
zeichnen, notieren 8 Melder mit teilweise schmerzlichenRückgängen im ebenfalls zweistelligen Bereich.
Der Auslandsanteil, gemessen an der weltweiten Werk-zeugmaschinenproduktion im Teilnehmerkreis, notiert2010 ähnlich wie im Referenzjahr mit 28 %. Dabei stehtEuropa in Bezug auf die regionale Struktur der Auslands-standorte mit 61% Anteil (2009: 62%) und 670 Mio. EURProduktionsvolumen an der Spitze, vor Nordamerika, mitwieder ausgeweitetem Abstand gefolgt von Südamerika(Brasilien) und schließlich den rasant aufschließenden Län-dern Asiens als dritter Region der Triade. Mit Blick auf dieTechnologien entfallen rund 580 Mio. EUR auf spanendeVerfahren, die somit 53 % des insgesamt im Ausland
Geographical alignment to the automotive industry, amajor consumer segment with global operations, has ledto the establishment and expansion of production facilitiesmainly in Western Europe (France, Great Britain, Italy, Austria
and Switzerland), Eastern Europe (Czech Republic and Po-land), the USA and Brazil. Also in Asian countries, wherethe Peoples Republic of China is dominating development,there are already locations where output is still modestbut growing rapidly. Although commitment here tends tobe in its early stages, it will intensify in the future, particu-larly in China, due to heightened local content requirementsand specifically targeting import barriers favouring domes-tic production. Nearly every major machine tool manufac-turer operates one or more production facilities or assem-bly plants abroad. Inasmuch as the sector is predominatedby medium-sized companies (more than half of the busi-nesses employ 250 people or less), financial and staffingconstraints limit production outsourcing.
Apart from several hundred sales and service subsidiariesor branch offices of German machine tool manufacturersthroughout the world, there are probably less than 20German corporations producing complete units abroad atthis time. Recently, 51 production sites in 13 countries wereidentified. With a volume of about EUR 1.1 billion in 2010,
the companies that participated in a related VDW surveybarely maintained the result they achieved in 2009. Theheterogeneous character of the company results herewas striking: While various companies reported two-digitgrowth, eight businesses reported sometimes painfullosses also in the two-digit range.
In 2010, production abroad as a share of worldwide machinetool production was, at 28%, similar among participantsto that of the reference year. Europe led here with regardto the regional structure of foreign locations with a 61%
share (2009: 62%) and a production volume of EUR 670million. Second place North America was followed – at agreater distance again – by South America (Brazil), andfinally by the rapidly encroaching countries of Asia as thethird region of the triad. With regard to technologies, metal- cutting processes accounted for about EUR 580 million,which represented 53% of the total production value gen-erated abroad. Production abroad by manufacturers of metal-forming machines (EUR 510 million) declined muchmore than that of companies specialised in cuttingmachinery.

8/15/2019 The German Machine Tool Industry in 2011
http://slidepdf.com/reader/full/the-german-machine-tool-industry-in-2011 25/84
23
erzielten Produktionswerts reklamieren können. Die Aus-landsproduktion der Hersteller umformender Anlagen(510 Mio. EUR) ist gegenüber der Entwicklung bei denauf Zerspanung spezialisierten Firmen deutlich gesunken.
Spanende und umformende Technologie:Andere Kundenstruktur prägt unterschiedlicheNachfrageverläufe
Als im Zeitablauf üblicherweise recht konstant dürfen dieBeiträge beider Aggregate zur deutschen Werkzeugma-schinenproduktion gelten. Im Zeitraum Januar bis Sep-tember 2011 belaufen sich diese Anteile auf „klassische“72% (4,8 Mrd. EUR) und 28% (1,8 Mrd. EUR). Die für Oktoberbis Dezember ausgewiesene Umsatzentwicklung gemäßVDMA-Indexstatistik (das letzte Vierteljahr der amtlichenProduktionsstatistik liegt noch nicht vor) belegt allerdings,dass die Realisierung von Auftragsvolumen im Umsatzdes Schlussquartals 2011 bei den Herstellern von Umform-technik mit deutlich überproportionaler Dynamik verläuft.Alle Wertangaben beziehen sich hier, wie oben schon aus-geführt, allein auf Werkzeugmaschinen. Die Differenzbe-träge gegenüber den an anderer Stelle genannten Gesamt -volumina verstehen sich als Wert von Teilen und Zubehörbzw. als Umsätze in Dienstleistungen.
Der oft auftretende Phasenversatz zwischen dem Beschaf-fungsverhalten der Automobilindustrie, mit lange vorge-planten Projekten und strategischer Ausrichtung, und derviel stärker konjunkturabhängigen Nachfrage im Mittel-stand kann zu recht unterschiedlichen Verläufen in derProduktionsentwicklung bei umformenden (Großpressen!)und spanenden Werkzeugmaschinen führen.
Das Produktionsgeschehen 2010 belegt dies, mit 8 % Minusfür spanende/abtragende Technologien und lediglich
2 % Minus im Ergebnis für die Umformtechnik. Die erstendrei Quartale 2011 sind weniger geeignet, einen stützen-den Einfluss der Umformtechnik zu unterstreichen. Ins-gesamt 40% Produktionswachstum steht im Bereich derUmformtechnik eine Ausweitung um 25 % gegenüber.Dabei sorgt der zweite Kernbereich der Umformtechnik,die Blechbearbeitung mit und ohne Lasereinsatz, fürüberproportional ausgeprägte Impulse.
Mit technologischem Strukturwandel oder Gefälle in derInnovationsfähigkeit hat der eingeschränkte oder aucheinmal gänzlich ausbleibende Gleichschritt der beidengroßen Werkzeugmaschinenaggregate nichts zu tun!
Metal-cutting and metal-forming technologies: customerstructure variant affects different demand patterns
As usual over time, the two elements of German machine
tool production made essentially constant contributionsto earnings. During the period from January to September2011 they assumed the “classic” proportions of 72% (EUR4.8 billion) and 28% (EUR 1.8 billion). For October throughDecember, however, the turnover trend listed according toVDMA index statistics (the last quarter of official productionstatistics has not been released yet) confirms that themanufacturers of metal-forming machinery clearly demon-strated disproportionately high momentum in the realisa-tion of order volume as turnover in the final quarter of 2011. As already indicated above, all values here relate tomachine tools only. The differences versus the total volumeslisted elsewhere comprise the value of parts and acces-sories or as sales relative to services.
The procurement behaviour of the automotive industry –with its projects planned well in advance and its strategicorientation – often differs sharply from the demand of small and medium-sized companies, which is far moredependent on economic conditions. The resulting phaseshift can create rather different production development
patterns with metal-forming (large-scale presses!) andmetal-cutting machine tools.
Production activity in 2010 confirmed this with an 8% de-crease for metal-cutting/EDM technologies and only a2% decline in the result for metal-forming machinery. Thefirst three quarters of 2011 were less apt to underscoremetal-forming technology’s supportive effect. There was40% production growth in the metal-forming machineryarea overall as compared with 25% expansion. Sheet-metalmachining (with and without the use of lasers), the second
core area of metal-forming technology, provided dispro-portionately strong momentum here.
The partial or even total dissimilarity in performancebetween the two major machine tool segments hasnothing to do with structural transformation of technol-ogy or diminished innovative capacity!
ProduktionProduction

8/15/2019 The German Machine Tool Industry in 2011
http://slidepdf.com/reader/full/the-german-machine-tool-industry-in-2011 26/84
24
Volumenstärkste Sektoren unter den spanenden bzw.abtragenden Werkzeugmaschinen sind in der Kumulationder ersten drei Quartale 2011 die Bearbeitungszentren/flexib -len Systeme (Produktionswert von 1,14 Mrd. EUR, gegen-über 620 Mio. EUR in der Referenzperiode des Vorjahres)sowie das Technologiefeld der Drehmaschinen/Drehzen-tren (1,0 Mrd. EUR bzw. 606 Mio. EUR im Vergleichszeit-raum 2010). Zwischen Januar und September 2011 gefolgtvon der Schleiftechnik (689 Mio. EUR), von Fräsmaschinen(555 Mio. EUR) und Verzahnmaschinen (385 Mio. EUR).
Die Ausweitung etablierter Einsatzfelder bzw. Diversifizie-rung in neue Anwendungsgebiete spiegelt sich in verstärk-ter Auflösung klassischer Unterscheidungen in Dreh-, Fräs-,Schleif- und Laserbearbeitung wider. Kombinierte Verfah-ren liegen im Trend. Es gilt, Prozessketten zu verkürzen,hochdynamische Lösungen anzustreben und somit Pro-duktivität zu steigern. Andererseits ist die Teilsubstitutionvon Transferlinien/Mehrwegemaschinen durch verketteteBearbeitungszentren als Plädoyer für mehr Flexibilität undRekonfigurierbarkeit anstelle hoher Ausbringungsmengen,
die aber in den Schwellenländern durchaus ebenfallsgefordert bleiben können, zu interpretieren.
Bei Laseranlagen für die Materialbearbeitung ließ sich derProduktionswert zwischen 2004 und 2008 um rund 54 %steigern. Wegen unspezifischer Definition der betreffen-den Meldepositionen in der amtlichen Statistik wird diesnur sehr eingeschränkt bewusst. Wirklich aussagefähig
sind hier allein die Eigenerhebungen des Verbandes. Mitzunehmender industrieller Verbreitung gerade des volu-menstarken Laserschneidens hat sich auch die Lasermate-rialbearbeitung der internationalen Nachfragekrise 2009nicht entziehen können. Man realisiert gegenüber derallgemeinen Werkzeugmaschinenindustrie (–28 %) sogardeutlich überproportionale Einbußen im Produktionswertvon mehr als 50%, weil wegen schnellerer Durchlaufzeitenin den Herstellerfirmen solcher Systeme eine Pufferwir-kung durch hohen Auftragsbestand weitgehend entfällt.Allerdings bedeutet dies in Aufschwungphasen wie 2010auch schnellere Realisierbarkeit der Orders im Umsatz bzw.Produktionswert. So ist das Wachstum in 2010 tatsächlichin der Lage, den schweren Umsatzeinbruch des Vorjahres
The two metal-cutting / EDM machine tool sectors whichposted the highest cumulative volume over the first threequarters of 2011 were the machining centres / flexiblesystems segment (production value of EUR 1.14 billionversus EUR 620 million during the reference period of theprevious year) and the technology field of lathes / turningcentres (EUR 1.0 billion and EUR 606 million in the com-parison period, respectively). From January through Sep-tember 2011, these were followed by grinding technology(EUR 689 million), milling machines (EUR 555 million)and gear-cutting machines (EUR 385 million).
Expansion of established application areas and diversifi-cation into new ones reflected the accelerated pace withwhich the classic differentiations among turning, milling,grinding and laser machining are melting away. The trendfavoured combined methods that shorten process chainsand work to achieve highly dynamic solutions, therebyincreasing productivity. On the other hand, the partial useof interlinked machining centres as a substitute for trans-fer lines or multi-station transfer machines could be seen
as a plea for greater flexibility and re-configurability ratherthan high outputs, which might well remain in demand inthe emerging countries, however.
Between 2004 and 2008, the production value of laserinstallations for the machining of materials rose by about54%. Owing to the classification’s vague definition in of-ficial statistics, this has generally gone unnoticed. Only
the association’s own surveys are truly meaningful for thispurpose. With strong volumes buoyed in particular by theincreasing industrial penetration of laser-cutting, the laser- machining of materials was also unable to withstand theinternational crisis in demand in 2009. Relative to the de-cline in the general machine tool industry (–28%), the morethan 50% downturn in production value here was evendisproportionately heavy, because the more rapid turn-around times in companies that manufacture such systemslargely eliminated the buffer effect that a high order back-log would have provided. Nevertheless, this also translatesinto an ability to convert orders into turnover and produc-tion value faster during recovery phases such as 2010. Inthis way, the sudden growth in 2010 was actually more
Bearbeitungszentren, das Drehen, Schleifen,Fräsen und die Blechbearbeitung dominierendie Strukturen nach Fertigungsverfahren
Musterbeispiele für erfolgreiche Diversifikation –Erschließung neuer Einsatzbereiche Perfect examples of successful diversification –
development of new application areas
Machining centres, turning, grinding, milling andsheet-metal machining dominate the structuresaccording to manufacturing processes

8/15/2019 The German Machine Tool Industry in 2011
http://slidepdf.com/reader/full/the-german-machine-tool-industry-in-2011 27/84
25
Aktuelle technologische TrendsCurrent technological trends
Hochleistungsprozesse High-performance processesHochleistungsbearbeitung: High-performance machining:Reduzierung der Bearbeitungszeit durch Steigerung der Schnitt- und Vorschub- Reduction of machining time by increase of cutting speeds. The basis of this isgeschwindigkeiten. Grundlage hierfür sind neue Maschinenkonzepte sowieconstituted by new machine concepts as well as powerful components and cuttingleistungsstarke Komponenten und Schneidstoffe. materials.Trockenbearbeitung/Minimalmengenschmierung: Dry machining / minimum quantity lubrication:Reduzierung von bzw. Verzicht auf Kühlschmierstoffe bei der Zerspanung zurReduction or elimination of coolants in machining in order to reduce environmentalVerringerung der Umweltbelastung und der Produktionskosten. and cost burdens.Hartbearbeitung: Hard machining:Zerspanung, insbesondere Feinbearbeitung, gehärteter Werkstoffe mit definierterCutting and specifically finish machining of hardened materials by means of a defineSchneide (Drehen, Fräsen, Bohren). cutting edge (turning, milling, drilling, boring).Hybride Prozesse Hybrid processesUnterstützung von Bearbeitungsprozessen durch Zusatzenergie, z. B. ultraschall- oderSupport of machining processes through additional energy, e. g. ultrasonic or laser-laserunterstützende Verfahren. based processes.Mikrobearbeitung Micro processing
Spanende und nichtspanende Bearbeitungsverfahren zum Erzeugen miniaturisierterMetal-cutting and non-metal-cutting processes for generation of miniaturisedWerkstücke, zum Teil mit Geometrieabmessungen im Mikrometer- und Oberflächencomponents, partially having geometric dimensions in the micron and surfacesim Nanometerbereich. in the nano range.Laser-Materialbearbeitung Lasers in material processingLaser-Strahlquellen: Laser beam sources:Höhere Leistungsklassen, Miniaturisierung, Flexibilitätssteigerung durch neuartigeHigher output, miniaturisation, increased flexibility by means of new beam control,Strahlführungen, Diodenlaser, Scheibenlaser, Faserlaser. diode lasers, disc lasers, fibre lasers.Laser-Anlagen: Laser systems:Schneidsysteme mit höchster Prozessdynamik, kompakte und gut integrierbareCutting systems with extremely high process dynamics, compact and easy-to-integratMarkier- und Beschriftungssysteme, innovative Lösungen für das Schweißen, Mikro-marking and inscribing systems, innovative solutions for welding, micro processing,und Kurzpulsbearbeitung. ultra short pulse processing.Komplettbearbeitung/Prozesskettenverkürzung Complete machining / shortening of process chainsIntegration verschiedener Bearbeitungsverfahren wie Drehen, Fräsen, Verzahnen,Integration of various machining processes such as turning, milling, gear cutting,Schleifen in einer Maschine zur Fertigbearbeitung des Werkstückes. grinding in a single machine to finish the workpiece in one set-up.
Rekonfigurierbare Fertigungssysteme Reconfigurable manufacturing systemsStückzahl- und Technologieflexibilität bezüglich neuer Teilespektren zur lebens-Flexible piece numbers and technology facilitate new ranges of parts fordaueroptimierten Nutzung investitionsintensiver Anlagen. lifetime-optimised utilisation of investment-intensive plants.Direktantriebe Direct drivesLinear- und Torquemotoren mit hoher Dynamik und einfachem Aufbau zur unmittel- Highly dynamic linear and torque motors of simple construction for direct generationbaren Erzeugung linearer und rotatorischer Bewegungen. of linear and rotary movements.Rapid Prototyping Rapid prototypingSchnelle Realisierung von Prototypen und Vorserien neuer Produkte zur Geometrie-Rapid realisation of prototypes and preproduction series of new products forund Funktionsprüfung. geometrical and functional testing.Faserverbundwerkstoffe Composite technologyBearbeitungsverfahren für Faserverbundwerkstoffe zur Realisierung von Manufacturing processes for the realisation of lightweight construction potentialLeichtbaupotenzialen. with fibre-compound materials.Steuerungen Control systemsInnovative Steuerungen halten mit den wachsenden Anforderungen Schritt.Innovative control systems are keeping up with growing requirements.Dezentralisierung, Ferndiagnose über Internet, Fehlererkennung bis zur Ebene der Feld-Decentralisation, remote diagnostics via internet, error detection up to the levelgeräte (z. B. Sensoren, Aktoren) kennzeichnen die zukünftigen Herausforderungen.of field equipment (such as sensors, actuators) are characterising future challenges.Durchgängige CAX-Verfahrensketten Continuous CAX process chainsLeistungsstarke CAD-CAM-Kopplungen sowie die entsprechende Anbindung an dieContinuous process chains from the digital product model data to the finishedCNC sind die Voraussetzungen für durchgängige Verfahrensketten von digitalencomponent require powerful CAD-CAM interfaces and the corresponding integrationProduktmodelldaten bis zum fertigen Bauteil. in the CNC system.Simulation/Virtual Reality/Augmented Reality Simulation / virtual reality / augmented realityLeistungsfähige Werkzeuge und Rechnerunterstützung helfen Konstrukteuren undEfficient tools and computer-aided systems are helping designers and developersEntwicklern bei der Schaffung genauer und wirtschaftlicher Fertigungssysteme sowiein creating precise and economic manufacturing systems as well as planningder Planung leistungsfähiger Produktionsprozesse für die Zukunft. powerful production processes for the future.Energie- und Ressourceneffizienz Energy and resource efficiencyEnergie- und ressourceneffiziente Werkzeugmaschinen dienen als Grundlage fürMachine tolls that make efficient use of energy and resources serve as a basis forökologisch verbesserte Produkte. ecologically enhanced products.
ProduktionProduction

8/15/2019 The German Machine Tool Industry in 2011
http://slidepdf.com/reader/full/the-german-machine-tool-industry-in-2011 28/84
26
sprungartig mehr als auszugleichen! Das Jahr 2011 stehtdann für weitere Erhöhung des Volumens in der Größen-ordnung von fast einem Viertel.
Laserschneidanlagen für die Flexible Blechbearbeitungstehen nach wie vor für den größten Umsatzanteil. DieNachfrage hinsichtlich Laserschneiden dreidimensionalerBauteile aus Blech, insbesondere von Rohren und Profilen,steigt 2010 ebenfalls zweistellig an. In 2011 ist hier erneutein mittleres einstelliges Plus möglich. HerausragendesApplikationsbeispiel ist ferner das Laserschweißen nicht-linearer Nähte und maßgeschneiderter Baugruppen (Tai-lored Blanks) im Leichtbau der Automobilindustrie. DasRemote-Schweißen, also Laser-Schweißprozesse über deut-lich größere Abstände zum Werkstück im freien Raum,ermöglicht spektakuläre Investitionskostensenkung undTaktzeitverkürzung. Die Fertigung von Airbag- oder Abgas-komponenten sowie die Bearbeitung von Getriebe- undKupplungselementen sorgen ebenso für Wachstum. Hinzutritt in jüngerer Zeit massiv die Mikromaterialbearbeitungbzw. Feinstbearbeitung mit Laser, ein Feld in dem sich lau-fend – Werkstoff- und Anwenderbranchen-übergreifend –viel versprechende Neuapplikationen ergeben. Aktuellqualifizieren sich Laseranlagen als effizienzsteigerndeerste Wahl für das Schneiden, Markieren, Kantenisolieren/
Randentschichten oder Strukturieren von Solarmodulenin der Photovoltaikindustrie. Die Erzeugung von ultrakurzgepulstem, hochenergetischem Laserlicht, z. B. zur Verän-derung von Materialgefügen, und der Direkteinsatz vonDiodenlasern sorgen für komplementäre Anwendungenmodernsten Zuschnitts. Das Potenzial von Faserlasernnimmt im Rahmen geeigneter Einsatzfälle weiter zu.
In der Umformtechnik spielen Pressen und Blechbearbei-tungsmaschinen wertmäßig die bedeutendste Rolle. Dieinnerhalb der Europäischen Union erfolgte Vereinheitli-
chung der für die Produktionsstatistik gültigen Nomen-klaturen hat dazu geführt, dass beide Begriffe statistischnicht mehr klar gegriffen werden können.
Pressen stehen 2010 für ein Produktionsvolumen von rund578 Mio. EUR bzw. für 514 Mio. EUR in den ersten drei Quar-talen 2011, wobei Pressentechnik zum Teil noch über andereVerfahren wie das Stanzen und Abkanten mit erfasst ist.Über 725 Mio. EUR beträgt der Produktionswert 2010 beiAnlagen für die Blechbearbeitung (Januar bis September2011: 642 Mio. EUR). Schwerpunktmäßig stehen die Grup-pen Scheren, Lochstanzen, Ausklinkmaschinen bzw. Biege-,Abkant- und Richtmaschinen für diesen Bereich. Interes-sante Verfahrenskombinationen stellen das Laserschneiden
than able to compensate for the previous year’s steepdecline in turnover. And then 2011 brought further recov-ery with something on the order of nearly one third morevolume.
Laser-cutting machines used in the flexible machining of sheet metal continued to account for the biggest share of sales. Demand relative to the laser-cutting of three-dimen-sional sheet-metal components – especially pipes andprofile sections – also posted a two-digit increase in 2010.This segment managed to achieve another medium-sizedsingle-digit increase in 2011. Another application area thatillustrates this point extremely well is the laser-welding of non-linear seams and made-to-measure components(tailored blanks) used in lightweight construction for theautomotive industry. Remote welding, i.e. laser-weldingprocesses performed in an open workspace and at mark-edly greater distances from the workpiece, made it poss-ible to achieve spectacular reductions in investment costsand cycle times. The fabrication of components for airbagassemblies or exhaust systems and the machining of gearand clutch elements also provided growth. Moreover, theindustry has recently seen a massive amount of micro-material machining by means of lasers – a field wherepromising new developments are constantly emerging
across the full spectrum of materials and applications.Laser machines currently represent the photovoltaic in-dus try’s system of choice for improving efficiency in cutting,marking, edge insulation / deletion and structuring oper-ations used in the production of solar modules. The gen-eration of ultra-short pulsed, high-energy laser light – toalter the microstructure of materials, for example – andthe direct use of diode lasers make it possible to producestate-of-the-art blanks for complementary applications.The potential of fibre lasers continues to increase in thecontext of suitable application cases.
In metal-forming technology, presses and sheet-metalmachining centres generated the largest share of value.Owing to the standardisation of the official nomenclatureused to track production statistics within the EuropeanUnion, the statistical weight of these two classificationsis no longer entirely clear.
Presses represented a production volume of some EUR 578million in 2010 and EUR 514 million in the first three quar-ters of 2011. Some press technology was still classifiedunder other processes here, however, such as punchingand edging. The production value for sheet-metal machin-ing was more than EUR 725 million in 2010 (January to

8/15/2019 The German Machine Tool Industry in 2011
http://slidepdf.com/reader/full/the-german-machine-tool-industry-in-2011 29/84
27
und Umformen in einem Blechbearbeitungszentrum sowiedie kombinierte Laser-/Ultraschallbearbeitung dar, wosich im Falle hochharter, spröder Werkstoffe bei gleich-zeitig extremen Präzisionsanforderungen neue Möglich-
keiten eröffnen. Auch lasergestützte Wärmebehandlungzur Verbesserung der Spanbarkeit von Sonderwerkstoffengehört prinzipiell in diese Reihe.
Innovationsfähigkeit ist bestimmenderWettbewerbsfaktor
Der Begriff „Innovationsfähigkeit“ lässt sich zweifach inter-pretieren. Zum einen wird darauf abgestellt, dass die Werk-zeugmaschinenindustrie selbst in der Lage ist, Tauglichkeitund Potenziale neuer Materialien und Technologien in denMarkt zu tragen. Zum anderen ist das Vermögen gemeint,oft zitierte „Product Innovation by End-Users“ aufzugreifenund selbst in neue, für den harten industriellen Alltagtaugliche Maschinenkonzepte umzusetzen.
Dass deutsche Werkzeugmaschinenhersteller in beidenFällen Erstklassiges leisten und erfolgreich sind, belegendie durch umfangreiches Zahlenmaterial gestützten Bei-träge in vorliegender Broschüre. Verschiedene Technologien,die früher nur in sogenannten High-End-Unternehmen
der Großindustrie als realisierbar bzw. beherrschbar er-schienen, sind heute in zahlreichen kleineren und mittel-ständischen Betrieben des Maschinenbaus implementiert.
Traditioneller Höhepunkt der ungeraden Messejahre undinternational bedeutendste Ausstellung für Technologieder Metallbearbeitung ist die EMO mit AustragungsortHannover oder Mailand. Nach vier Jahren Pause fand diese
unbestrittene Weltleitmesse vom 19. bis 24. September 2011(wie es auch mit Blick auf die Folgeveranstaltung 2013 derFall sein wird) wieder in Hannover statt.
Für die Bewertung der EMO Hannover 2011 bietet sich derVergleich mit der vorangegangenen Veranstaltung 2007an. Von 2.037 Ausstellern auf 175.300 m2 belegter Stand-fläche fühlten sich rund 139.000 Besucher angesprochen.Vom gegenüber 2007 weniger spektakulären Besuch zeigtesich kaum ein Aussteller beeindruckt. Das Investitionsklimaerwies sich als anhaltend gut und die auf der EMO disku-tierten Beschaffungsmaßnahmen und Projekte warensehr konkret. Erfreulicherweise ist es gelungen, die hoheInternationalität sicher zu halten bzw. sogar moderat
September 2010: EUR 642 million). Shearing, punching andnotching machines are the flagships of this sector alongwith bending, folding and straightening machines. Certainparticularly attractive processing combinations permit
laser-cutting and forming on a sheet-metal machiningcentre or combine laser and ultrasound machining, wherethe need to meet extreme precision requirements in thecase of ultra-hard, brittle materials is opening up newopportunities. Laser-based heat treatment to improve themachinability of special materials primarily falls under thiscategory as well.
Innovative capacity is a defining competitive factor
The term “innovative capacity” can be interpreted in twoways. First it expresses the machine tool industry’s ownability to market the potential of suitable new materialsand technologies. At the same time it also means examiningideas which emerge through the oft-mentioned processof “product innovation by end users” and turning theminto practical machine concepts suited to the hard realitiesof everyday industrial routine.
Supported by extensive statistical evidence, the articles inthis brochure suggest that German machine tool manu-
facturers are doing a first-class job and achieving successin both respects. Various technologies which previouslyappeared achievable or manageable only in major “high-end” industrial companies have now been implementedin a large number of small and medium-sized machine-building firms.
The traditional highpoint of uneven trade fair years and
the world’s leading exhibition for metalworking technologyis the EMO, which is held either in Hannover or in Milan.After a four-year hiatus, this undisputed world leaderamong trade fairs was scheduled to run from 19 until24 September 2011 in Hannover again (as will also be thecase for the subsequent event in 2013).
To assess EMO Hannover 2011, comparisons with the pre-vious event in 2007 are useful. Some 139,000 visitors weresolicited by 2,037 exhibitors occupying 175,300 m2 of standarea. Although the traffic was less spectacular than in 2007,the exhibitors barely took notice. The investment climateturned out to be consistently healthy, and the procurementactivities and projects discussed at the EMO were very
VDW-Messen EMO Hannover und METAVofferieren umfassende Technologieschaufenster
ProduktionProduction
The VDW trade fairs EMO Hannover and METAVoffer comprehensive technology showcases

8/15/2019 The German Machine Tool Industry in 2011
http://slidepdf.com/reader/full/the-german-machine-tool-industry-in-2011 30/84

8/15/2019 The German Machine Tool Industry in 2011
http://slidepdf.com/reader/full/the-german-machine-tool-industry-in-2011 31/84
Werkzeugmaschinen-AußenhandelForeign trade in machine tools
Hochproduktives Bearbeiten von einfachen und komplexen Stangendrehteilen mit einem hochinnovativen 8-spindligen CNC-Mehr -spindeldrehautomat. Das Maschinenkonzept ist frontoffen gestaltet und gewährleistet somit höchste Prozesssicherheit. Durch diegroße Bandbreite adaptierbarer Technologien und der vorzüglichen Rüst- und Bedienbarkeit ergibt sich ein hohes Maß an Flexibilität,wodurch eine hohe Investitionssicherheit über die Nutzungsdauer sichergestellt ist. Die Anwendungsgebiete dieses 8-Spindlers sindvielschichtig – von der Automobilindustrie bis zur Medizintechnik – und belegen, dass auch hochkomplexe Werkstücke wirtschaftlichbearbeitet werden können.
High productivity machining of simple and complex parts turned from bar stock with a highly innovative 8-spindle CNC multi-spindleturning machine. The machine concept features an open front, which helps guarantee maximum process reliability. The wide range of adaptable technologies and the machine’s advantageous operability and retooling capabilities make it extremely flexible, thereby protectingthe investment over the life of the machine. The application areas of this 8-spindle unit span many domains – from the automotiveindustry to medical technology – and prove that even highly complex workpieces can be machined cost-effectively.

8/15/2019 The German Machine Tool Industry in 2011
http://slidepdf.com/reader/full/the-german-machine-tool-industry-in-2011 32/84
30
Kräftiger Exportschub in 2011
Nach der tiefen Wirtschafts- und Finanzkrise 2009 erholtsich die Werkzeugmaschinennachfrage schneller und kräf-
tiger als erwartet. Die Aufträge ziehen in 2010, von niedrigerBasis kommend, wieder kräftig an. Gemäß Daten des VDW- Prognosepartners Oxford Economics steigen die weltweiteIndustrieproduktion 2010 um 9,6% (2009: –8,4%) und dieInvestitionen wichtiger Kundensegmente um 9,5% (2009:–15,3 %). Die Werkzeugmaschinenexporte reagieren wieüblich mit einem Zeitversatz auf die zunehmende Order-tätigkeit. Der hohe Anteil von High-End-Maschinen, kunden-spezifischen Lösungen und Projektgeschäft in der deutschenWerkzeugmaschinenbranche erfordert eine entsprechendeDurchlaufzeit von der Hereinnahme des Auftrags bis zurRealisierung im Umsatz, die im Durchschnitt bei circa dreiQuartalen liegt. Das vierte Quartal 2010 bringt somit erst-mals ein kräftiges Ausfuhrplus. In der Jahresbilanz liegendie Exporte 2010 aber mit +1 % und 6,1 Mrd. EUR Volumennur leicht über dem schwachen Vorjahreswert.
Das Jahr 2011 steht voll im Zeichen des Aufschwungs. Die
Bestelltätigkeit ausländischer Abnehmer zieht weiterkräftig an und die Auslandsorders erreichen ein neueshistorisches Rekordniveau. Die globale Industrieproduktionwächst zwar mit 4,2 % nicht mehr so stark wie noch imVor jahr. Viele Branchen sind aber wieder stark ausgelastetund aufgrund der gestiegenen Zuversicht in die wirt-schaftliche Entwicklung bereit, ihre Investitionen erheblichauszuweiten. Nach der Krise, die teilweise regelrechteInvestitionsstopps hervorrief, besteht nun erheblicherNachholbedarf. Dies spiegelt sich in einem Anstieg derweltweiten Investitionen von 12,8 % wider. Die deutschen
Werkzeugmaschinenausfuhren erhalten einen kräftigenSchub. Sie bleiben 2011 durchgängig auf Wachstumskursund erreichen mit einem Plus von 31% ein Niveau von gut7,9 Mrd. EUR. Die krisenbedingten Verluste sind damit fastschon wieder wettgemacht. Das Rekordniveau aus 2008von 8,2 Mrd. EUR ist in Reichweite. Der Anteil der Exportean der Produktion beträgt 66% und belegt die hohe Bedeu-tung der weltweiten Märkte für die deutsche Branche,die hinter Japan den Vize-Exportweltmeister stellt.
Während die Exporte 2010 noch rein vom Asiengeschäftgestützt werden, trägt die Triade nun insgesamt zum Wachs-tum bei. Treiber 2011 ist mit plus 57% aber eindeutig dasAmerikageschäft. Auch der europäische Markt wächst um
Strong export boom in 2011
After the serious economic and financial crisis of 2009,the demand for machine tools recovered faster and stronger
than expected. Starting from a low benchmark, orderspicked up again dramatically in 2010. According to datafrom VDW’s prognosis partner Oxford Economics, globalindustrial production in 2010 rose by 9.6% (2009: –8.4%)and investments in the major customer segments increasedby 9.5% (2009: –15.3%). As usual, machine tool exportsreacted with a time delay relative to the increasing orderactivity. The high share of high-end machines, customer-specific solutions and project business in the Germanmachine tool sector requires a corresponding turnaroundtime between taking the order and realising the turnover –a process which takes about three quarters to completeon average. The fourth quarter of 2010 therefore usheredin a strong increase in exports. But the balance sheet for2010 posted an export volume of +1% and EUR 6.1 billion,which was only slightly above the weak value of the pre-vious year.
In 2011 all signs pointed towards recovery. The order activityof foreign customers increased dramatically again andforeign orders reached a new historic record level. Globalindustrial production grew by 4.2%, which was no longerquite as strong as in the previous year. But productioncapacity was severely strained again in many industrialsectors, which were now ready to expand their investmentssignificantly in view of the increasing confidence in theeconomic trends. After the crisis, which had caused invest-ment to stop cold in some cases, there was considerableneed to make up for lost ground. This was reflected in a
12.8% increase in investment worldwide. The Germanmachine tool exporters experienced a strong surge. Theyremained on a consistent growth path throughout 2011,attaining a 31% increase and a full EUR 7.9 billion. As aresult, they made up nearly all of the ground that had beenlost due to the crisis. The record level of EUR 8.2 billionwhich had been set in 2008 was once again within grasp.Exports represented 66% of production and underscored
just how important the worldwide markets were to thesector in Germany, which was vice-champion exporterbehind Japan.
Need to make up for lost ground as result of theglobal economic and financial crisis of 2009
Nachholbedarf an Investitionen als Folge derweltweiten Wirtschafts- und Finanzkrise 2009

8/15/2019 The German Machine Tool Industry in 2011
http://slidepdf.com/reader/full/the-german-machine-tool-industry-in-2011 33/84
31
92 93 94 95 96 97 98 99 00 01 02 03 04 05 07 0806
ExportExports
ImportImports
Mrd.eur Bill.eur
0
1
2
3
4
5
6
7
8
9
09 10 11
AußenhandelForeign trade
25 %, verliert aber im Vergleich zu 2008 enorm an Bedeu-tung. Der Anteil am Gesamtexport sinkt von 59% auf aktuell 43 %. Die dynamische Wachstumsregion Asien
setzt ihren Kurs unbeirrt fort und legt um 29 % zu. Der An-teil Asiens an den Gesamtausfuhren erhöht sich seit 2008von 25% auf 41%. Mit weitem Abstand präsentiert sich Chinaals größter Absatzmarkt, der für einen Zuwachs von 34%und einen Anteil von 29% steht. Ihre Stellung als zweit-größter Markt können die USA mit plus 66 % und einemAnteil von 9% eindrucksvoll ausbauen. Trotz einer vergleichs -weise geringen Dynamik von nur 11% bleibt Russland dritt-größter Markt vor den klassischen europäischen Abneh-merländern Schweiz, Frankreich und Italien.
Die Staatsschuldenkrise in der Eurozone stellt das größteRisiko für die Werkzeugmaschinenkonjunktur dar. Auchwenn sich die Ausstrahlung auf die Weltwirtschaft ent-gegen großer Befürchtungen in Grenzen hält, wird Europain 2012 eher bremsen, dies gilt insbesondere für die Nach-frage aus den südeuropäischen Ländern. Die Hoffnungenruhen einmal mehr auf Asien beziehungsweise den Schwel-lenmärkten als Wachstumsmotor. Aber auch die Nachfrageaus Amerika, insbesondere den USA, dürfte aus heutigerSicht weiter im Aufwärtstrend bleiben. Insgesamt erwar-tet der VDW eine Wachstumsberuhigung des Auslandsge-schäfts, die sich mit einem Rückgang der Auslandsordersim 4. Quartal 2011 von 7 % auch andeutet. Die Minusratenhalten sich aber in Grenzen und setzen auf hohem Niveau
While exports had still been supported purely by the Asianbusiness in 2010, the entire triad then began to contributeto growth. With a 57% increase, however, business with
the Americas was clearly the driver in 2011. The Europeanmarket also grew by 25%, but its impact declined tremen-dously relative to 2008. Its share of total exports fell from59% to the current level 43%. The dynamic growth regionof Asia continued on its course undeterred, increasing by29%. Since 2008, the Asian share of total exports has in-creased from 25% to 41%. China was the largest customermarket by a large margin, having posted 34% growth andaccounting for a 29% share. The USA managed to consoli-date its position as the second largest market with a 66%increase and an impressive 9% share. Despite a relatively
modest momentum of just 11%, Russia remained the thirdlargest market ahead of the classic European clientcountries Switzerland, France and Italy.
The public debt crisis in the eurozone presented the singlegreatest risk to the economic health of the machine toolindustry. Although, contrary to the worst fears, the reper-cussions for the global economy remained muted, Euro-pean growth will probably tend to slow down in 2012 –especially regarding demand from the countries of south-ern Europe. Hope is turning once again towards Asiaand the emerging markets as growth engines. And fromtoday’s vantage point, it appears that the demand fromthe Americas – especially the USA – is also likely to continue
Hinweis: EinschließlichTeile, ZubehörQuellen: StatistischesBundesamt, VDW, VDMANote: including parts,accessoriesSources: German StatisticalOffice, VDW, VDMA
Deutscher Werkzeugmaschinen-Export und -ImportGerman machine tool exports and imports

8/15/2019 The German Machine Tool Industry in 2011
http://slidepdf.com/reader/full/the-german-machine-tool-industry-in-2011 34/84
32
FrankreichFrance
ChinaChina
ItalienItaly
RusslandRussia
ÖsterreichAustria
SüdkoreaSouth Korea
USAUSA
PolenPoland 0
200
400
600
800
1 000
1 200
1 400
Mio.eur Mill.eur 2007 2008
2 303
723
376
360
331
290
263
263
211
205
1 716
437
340
267
208
263
204
217
174
183
2009 2010 2011
1 600
1 800
2 000
2 200
2 400
SchweizSwitzerland
IndienIndia
ChinaChina
SchweizSwitzerland
USAUSA
RusslandRussia
auf. Die Monate Januar und Februar 2012 belegen mit einemüberraschenden leichten Plus von 1 % die grundsätzlichweiterhin gute wirtschaftliche Lage. Auch gestützt auf
die hohen Auftragsbestände dürfte daher in 2012 einnochmaliges Exportplus von 7% erzielbar sein. Dies würdedann mit 8,5 Mrd. EUR ein Übertreffen der bisherigenRekordmarke 2008 bedeuten.
Die folgende tiefer gehende Betrachtung der Absatzmärkte,gegliedert nach großen geografischen Regionen, sowieder Einfuhren nach Deutschland basiert auf den vorliegen-den Daten für das Gesamtjahr 2011. Ausführliches Zahlen-material enthält der statistische Anhang. In diesen Tabel-len sind die Gesamtwerte in „Werkzeugmaschinen“ sowie
„Teile/Zubehör für Werkzeugmaschinen“ unterschieden.Dies erlaubt eine differenziertere Betrachtungsweise derDaten. Auf der Ausfuhrseite sind die Zahlen für „Teile/Zubehör“ bspw. ein Indiz für Ersatzteillieferungen oderfür die Lieferung von Baugruppen/Komponenten, die inProduktions- und Montagestätten vor Ort eingehen (z. B.Markt und zugleich Standort USA). Auf der Einfuhrseitesind sie unter anderem ein Hinweis auf Outsourcingakti-vitäten wie den Bezug von Maschinengehäusen oderGussteilen (z. B. aus Tschechien oder Polen). Der Anteil vonTeile/Zubehör am Gesamtwert beträgt für die Ausfuhr ca.15%, für die Einfuhr ca. 24%. Insgesamt besteht im Zeitalterder Globalisierung und weltweiten Verflechtungen eineTendenz zu steigenden Handelsströmen (export- und
its upward trend. Overall the VDW expects the rate of growthin foreign business to slow – a slowdown which was alsopresaged by the 7% reduction in foreign orders in the
fourth quarter of 2011. The negative rates of growth willremain modest, however, and start from a high level. With –contrary to expectations – a slight increase of 1%, themonths of January and February 2012 serve as proof of what basically continues to be a good economic situation.Supported also by the high order backlogs, therefore,another 7% increase in exports should be achievable in 2012.With EUR 8.5 billion, this would then exceed the previousrecord set in 2008.
The following is a thorough examination of the markets
based on the data now available for the whole of 2011. It isarranged according to major geographical regions alongwith imports to Germany. The “Statistical appendix” pro-vides complete numerical data. The total values listed inthese tables differentiate between “Machine tools” and“Parts/accessories for machine tools”. This permits a moresophisticated analysis of the data. On the export side thefigures for “Parts/accessories”, for example, are evidenceof deliveries of spare parts or for the delivery of modules/components that are received into production and assem-bly facilities on site (e.g. market and location USA at thesame time). On the import side they are, inter alia, anindication of outsourcing activities, such as the procure-ment of machine housings or castings (e.g. from the Czech
Hinweis: EinschließlichTeile, ZubehörQuellen: StatistischesBundesamt, VDMA, VDW Note: including parts,accessoriesSources: German StatisticalOffice, VDMA, VDW
Deutscher Werkzeugmaschinen-Export: wichtigste AbsatzmärkteGerman machine tool exports: major customer markets
Top-10 -Absatzmärkte 2011 Entwicklung der Top-4 -Märkte (Mio.eur )Top 10 customer markets 2010 Development of the top 4 markets (mill.eur )

8/15/2019 The German Machine Tool Industry in 2011
http://slidepdf.com/reader/full/the-german-machine-tool-industry-in-2011 35/84
33AußenhandelForeign trade
importseitig). Sei es, dass von Deutschland aus Basisma-schinen oder Komponenten an Auslandsstandorte geliefertwerden oder ausländische Wettbewerber europäische Ver-triebszentralen in Deutschland unterhalten, die Maschinen
importieren, diese zum Teil aber wieder in umliegendeAbsatzmärkte weiterexportieren.
Europa wächst wieder kräftiger, bleibt aber vonRekordmarken weit entfernt
Noch in 2010 hinkt Europa als Absatzregion mit einemMinus von 12 % hinterher. Im aktuellen Jahr 2011 investierenauch die europäischen Kunden wieder kräftiger. Die deut-schen Werkzeugmaschinenausfuhren steigen um einViertel. Europa, hier als Exportmarkt, also ohne Deutschlanddefiniert, bleibt mit einem Anteil von 42,7% zwar wichtigs-ter Absatzraum. Der Vorsprung vor Asien mit 41,2% schmilztaber deutlich dahin. Seit 2008 ist der europäische Anteilum 16 Prozentpunkte gesunken. Diese Anteilsverluste ge-hen gleichermaßen auf das Konto West- und Osteuropas.
Schweiz, Frankreich, Italien und Österreich sind die größtenwesteuropäischen Märkte und belegen im Gesamtratingder Absatzländer die Ränge 4 bis 8. Im italienischen Marktschwächt ab Mitte 2010 das Auslaufen des sogenannten
Tremonti-Gesetzes zur steuerlichen Förderung von Inves-titionen in maschinelle Anlagen die Nachfrage. Die Exportenach Italien, das im Zusammenhang mit der Staatsschul-denkrise besonders im Fokus steht, steigen 2011 mit 10 %deutlich unterproportional zum gesamten europäischenMarkt. Im Vergleich zum Spitzenjahr 2008 müssen diedeutschen Hersteller einen herben Einbruch ihrer Exporteum über 43 % konstatieren. Die schwierige Situation inItalien belegt auch die Auftragslage der heimischen Werk-zeugmaschinenhersteller, die in 2011 einen Rückgang ihrerinländischen Aufträge um gut 10 % hinnehmen müssen.
Am drastischsten ablesbar ist die Staatschuldenkrise er-wartungsgemäß an den Exporten nach Griechenland, dieim aktuellen Jahr um über 60% auf nur noch 4 Mio. EURVolumen einbrechen. In 2008 lag der Ausfuhrwert noch bei29 Mio. EUR. Allerdings spielt Griechenland als Absatzmarktmit einem Anteil an den Gesamtexporten von weniger alseinem halben Prozentpunkt nur eine sehr untergeordneteRolle. Die Türkei gehört zu den wachstumsstarken europä-ischen Märkten. Auf einen satten Zuwachs in 2010 von40% folgt ein nochmaliges Exportplus von 27%. Das Landist mittlerweile immerhin zwölftgrößter Absatzmarkt.
Republic or Poland). Parts / accessories as a share of thetotal value amounts to some 15% for exports and about24% for imports. In the era of globalisation and worldwideinterconnections, the flow of trade is generally increasing
(both on the export and import sides), whether this involvesbasic machines or components supplied from Germanyto foreign locations or foreign competitors who maintainEuropean sales offices in Germany, import machines andthen re-export some of them to nearby markets.
Europe grows stronger again, but remains farbelow record levels
In 2010, Europe was still limping along behind the rest of the world as a consumer region with –12% growth. In the
year under review (2011), European customers also invest-ed heavily again: German machine tool exports grew by25%. With a 42.7% share, Europe was still the biggest salesregion (defined as an export market here, i.e. excludingGermany). But the margin by which it led Asia (41.2% share)narrowed significantly. The European share has fallenby 16 percentage points since 2008. Western and EasternEurope accounted for this declining share in equal measure.
Switzerland, France, Italy, and Austria are the biggest West-
ern European markets, occupying ranks 4 through 8 inthe overall rating of customer nations. Beginning frommid-2010, the demand in the Italian market was weakenedby the expiration of the so-called “Tremonti Act” whichhad been providing tax incentives for investments in mech-anical equipment. Exports to Italy, which was subject toparticularly heavy scrutiny in connection with the publicdebt crisis, grew by 10% in 2011: This was clearly a dispro-portionately low rate relative to the European market as awhole. As compared with the peak year of 2008, the Germanmanufacturers bitterly saw their exports decline by more
than 43%. The difficult situation in Italy was also confirmedby the order backlog in 2011 of the domestic machine toolmanufacturers there, which had to endure a full 10% de-cline in their domestic orders. As expected, exports toGreece offered the most dramatic manifestation of thepublic debt crisis: They collapsed by more than 60% in thecurrent year, leaving behind a volume of just EUR 4 millionwhere there had still been an export value of EUR 29 millionin 2008. As a market whose share of total exports amountedto less than one half of one percentage point, however,Greece played only a very marginal role. Turkey was one of the strongest growing European markets. On the heels of an ample 40% growth rate in 2010, it increased exports byanother 27%. Even so, the country has meanwhile becomethe twelfth largest market.
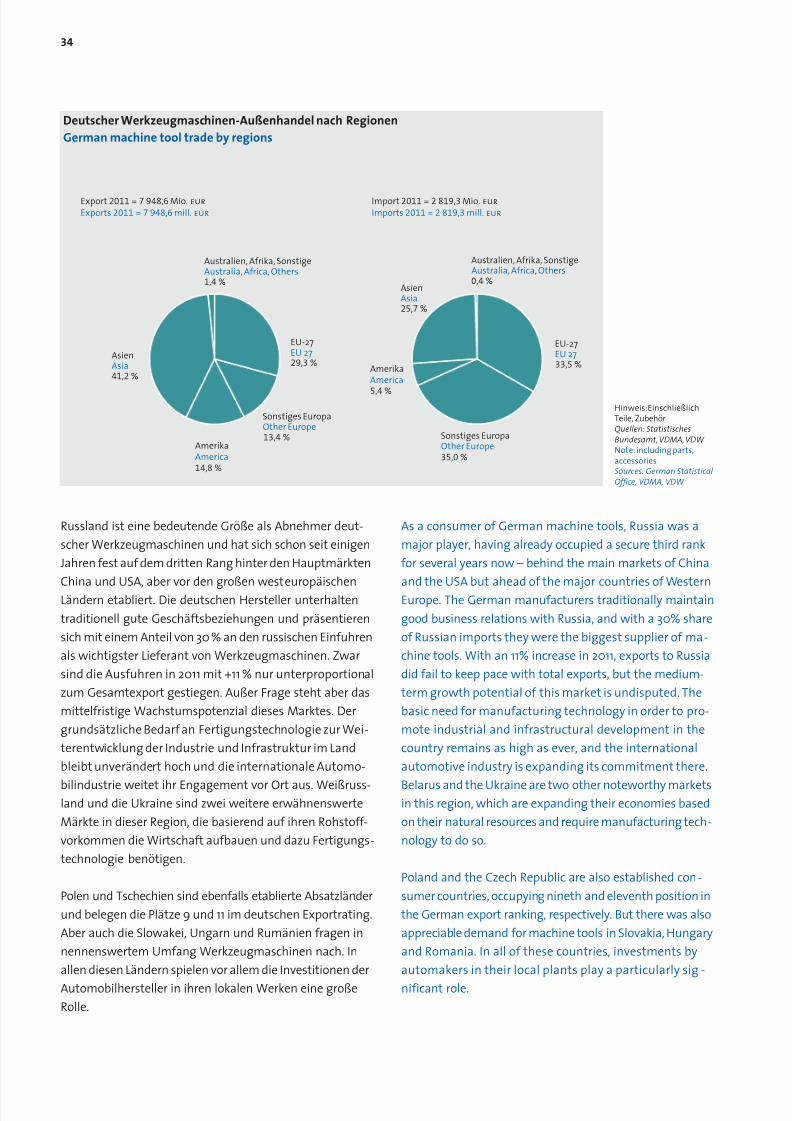
8/15/2019 The German Machine Tool Industry in 2011
http://slidepdf.com/reader/full/the-german-machine-tool-industry-in-2011 36/84
34
Australien, Afrika, SonstigeAustralia, Africa, Others1,4 %
AsienAsia41,2 %
AmerikaAmerica14,8 %
Sonstiges EuropaOther Europe
Sonstiges EuropaOther Europe
13,4 %
EU-27EU 2729,3 %
Export2011 = 7 948,6 Mio.eur
Exports2011 = 7 948,6 mill.eur
EU-27EU 2733,5 %
35,0 %
AsienAsia25,7 %
Australien, Afrika, SonstigeAustralia, Africa, Others0,4 %
Import 2011 = 2 819,3 Mio.eur
Imports 2011 = 2 819,3 mill.eur
AmerikaAmerica5,4 %
Russland ist eine bedeutende Größe als Abnehmer deut-scher Werkzeugmaschinen und hat sich schon seit einigenJahren fest auf dem dritten Rang hinter den Hauptmärkten
China und USA, aber vor den großen westeuropäischenLändern etabliert. Die deutschen Hersteller unterhaltentraditionell gute Geschäftsbeziehungen und präsentierensich mit einem Anteil von 30% an den russischen Einfuhrenals wichtigster Lieferant von Werkzeugmaschinen. Zwarsind die Ausfuhren in 2011 mit +11 % nur unterproportionalzum Gesamtexport gestiegen. Außer Frage steht aber dasmittelfristige Wachstumspotenzial dieses Marktes. Dergrundsätzliche Bedarf an Fertigungstechnologie zur Wei-terentwicklung der Industrie und Infrastruktur im Landbleibt unverändert hoch und die internationale Automo-
bilindustrie weitet ihr Engagement vor Ort aus. Weißruss-land und die Ukraine sind zwei weitere erwähnenswerteMärkte in dieser Region, die basierend auf ihren Rohstoff-vorkommen die Wirtschaft aufbauen und dazu Fertigungs-technologie benötigen.
Polen und Tschechien sind ebenfalls etablierte Absatzländerund belegen die Plätze 9 und 11 im deutschen Exportrating.Aber auch die Slowakei, Ungarn und Rumänien fragen innennenswertem Umfang Werkzeugmaschinen nach. Inallen diesen Ländern spielen vor allem die Investitionen derAutomobilhersteller in ihren lokalen Werken eine großeRolle.
As a consumer of German machine tools, Russia was amajor player, having already occupied a secure third rankfor several years now – behind the main markets of China
and the USA but ahead of the major countries of WesternEurope. The German manufacturers traditionally maintaingood business relations with Russia, and with a 30% shareof Russian imports they were the biggest supplier of ma-chine tools. With an 11% increase in 2011, exports to Russiadid fail to keep pace with total exports, but the medium-term growth potential of this market is undisputed. Thebasic need for manufacturing technology in order to pro-mote industrial and infrastructural development in thecountry remains as high as ever, and the internationalautomotive industry is expanding its commitment there.
Belarus and the Ukraine are two other noteworthy marketsin this region, which are expanding their economies basedon their natural resources and require manufacturing tech-nology to do so.
Poland and the Czech Republic are also established con-sumer countries, occupying nineth and eleventh position inthe German export ranking, respectively. But there was alsoappreciable demand for machine tools in Slovakia, Hungaryand Romania. In all of these countries, investments byautomakers in their local plants play a particularly sig-nificant role.
Hinweis: EinschließlichTeile, ZubehörQuellen: StatistischesBundesamt, VDMA, VDW Note: including parts,accessoriesSources: German StatisticalOffice, VDMA, VDW
Deutscher Werkzeugmaschinen-Außenhandel nach RegionenGerman machine tool trade by regions
8/15/2019 The German Machine Tool Industry in 2011
http://slidepdf.com/reader/full/the-german-machine-tool-industry-in-2011 37/84

8/15/2019 The German Machine Tool Industry in 2011
http://slidepdf.com/reader/full/the-german-machine-tool-industry-in-2011 38/84
36
dabei die ungeheure Dominanz Chinas zu beachten. Alleine70% des Exports nach Asien von insgesamt 3,3 Mrd. EURgehen in das Reich der Mitte.
Die immens gestiegene Bedeutung Chinas lässt sich ander Entwicklung im Zeitablauf festmachen. In 2000 standdas Land noch für weniger als 4 % der deutschen Werk-zeugmaschinenausfuhren, mittlerweile sind es mit 29 %Anteil mehr als das Siebenfache. Das Absatzvolumen liegtmit 2,3 Mrd. EUR mehr als dreimal so hoch wie das deszweitgrößten Marktes USA (723 Mio. EUR).
Mit einem Anteil von knapp 37 % am gesamten Weltver-brauch von Werkzeugmaschinen ist China der alles domi-nierende Markt. Dahinter steht ein ungebrochener Boomder chinesischen Wirtschaft, die in 2011 zwar nicht mehrzweistellig, aber mit 9,2 % immer noch sehr stark wächst.Dabei entwickelt sich die Industrieproduktion mit einemPlus von 13,8 % im Vergleich zur Gesamtwirtschaft mitnoch stärkerer Dynamik. Die weitere Entwicklung dereigenen industriellen Basis ist erklärtes politisches Zielund wird auch für die Zukunft die herausragende Bedeu-tung dieses Marktes festigen. Auch wenn Prognosen fürdas chinesische Bruttoinlandsprodukt in den nächstenJahren mit Raten zwischen 8 % und 9 % einen Dynamikver-
lust sehen, bleibt das Wachstum im weltwirtschaftlichenVergleich stark. Hinzu kommt das hohe Engagement aus-ländischer Firmen, die über Direktinvestitionen Produk-tionskapazitäten im Land auf- bzw. weiter ausbauen. DieBedeutung Chinas lässt sich beispielhaft am für die Werk-zeugmaschinenindustrie so wichtigen Kundensegment,der Automobilindustrie, festmachen. Am weltweiten Out-put von 80,3 Mio. Einheiten hält China mit 18,4 Mio. pro-duzierten Pkw und Nutzfahrzeugen nach Angaben desdeutschen Automobilverbandes VDA einen imposantenAnteil von 23% und ist weltweit unangefochten größter
Produzent vor den USA (8,7 Mio.), Japan (8,4 Mio.) undDeutschland (6,3 Mio.).
Zur Beurteilung des chinesischen Marktes gehören aberauch die durch die Politik enorm geförderten Anstrengungen,die technologische Wettbewerbsfähigkeit der eigenenWerkzeugmaschinenindustrie zügig zu erhöhen. Der zu-nehmende Wegfall von Steuer- und Zollerleichterungenfür Importe dient ebenfalls zur Stützung der Eigenent-wicklung.
Weitere größere Absatzmärkte Asiens sind Indien (3,3 %Anteil und Rang 8 im Exportrating), Südkorea (2,6%, Rang 10)und Japan (1,4%, Rang 18).
The immense increase in the importance of China can bestbe appreciated by examining the development over time.In 2000, the country still accounted for only less than 4%of German machine tool exports; by the end of 2010, that
share had grown to 29% – a more than seven-fold increase.At EUR 2.3 billion, the sales volume exceeded that of thesecond largest market, the USA (EUR 723 million), by afactor of more than three.
Consuming nearly 37% of machine tool production world-wide, China is the market which dominates everything.Underpinning this situation is the uninterrupted boomin the Chinese economy: Although it no longer grew ata two-digit rate in 2011, its 9.2% growth remained verystrong – whereby industrial production developed witheven greater momentum (13.8%) than the overall economy.Continued progression in the development of its ownindustrial base is a declared political objective and willanchor the extraordinary significance of this market alsofor the future. Even if prognoses for the Chinese GDPranging between 8% and 9% anticipate a somewhat slowermomentum in the coming years, growth remains relativelystrong on the global economic scale. Moreover, highlycommitted foreign companies are using direct investmentsto establish and expand production capacities in the coun-
try. Clearly an important customer segment for the ma-chine tool industry, the automotive industry illustratesthe significance of China well. The worldwide output of passenger cars and commercial vehicles totalled 80.3 millionunits in all. According to the German Association of theAutomotive Industry (VDA), China produced an impressive23% share of that total (18.4 million units), making it theworld’s undisputed leading producer ahead of the USA(8.7 million units), Japan (8.4 million units) and Germany(6.3 million units).
But any assessment of the Chinese market must also con-sider the government’s highly subsidised efforts to quicklyboost the technological competitiveness of its own ma-chine tool industry. The increasing trend towards graduallyeliminating tax breaks and raising customs barriers onimports also serves to support local development.
Other major Asian markets included India (ranked number8 in exports with a 3.3% share), South Korea (number 10with 2.6%) and Japan (number 18 with 1.4%).
India was the second biggest Asian market after China.Following restrained activity in the previous year, Germanexports rose by a full 20% again in 2011. The country

8/15/2019 The German Machine Tool Industry in 2011
http://slidepdf.com/reader/full/the-german-machine-tool-industry-in-2011 39/84
37AußenhandelForeign trade
Deutscher Werkzeugmaschinen-Export und -Import: 15 wichtigste Abnehmer-/LieferländerGerman machine tool exports and imports: 15 most important countries of destination/originExport Maschinen Teile Gesamt Import Maschinen Teile GesamtExports Machines Parts Total Imports Machines Parts Total
Mio.EUR Mio.EUR %-Ant. %-VR Mio.EUR Mio.EUR %-Ant. %-VRMill.EUR Mill.EUR %-Sha. %-Ch. Mill.EUR Mill.EUR %-Sha. %-Ch.
20111. ChinaChina 2 142 161 2 303 29,0 +34 1. SchweizSwitzerland 714 185 899 47,7 +322 . USAUSA 602 121 723 9,1 +66 2. JapanJapan 317 39 356 55,3 +133. RusslandRussia 327 49 376 4,7 +11 3. ItalienItaly 146 71 217 28,4 +84. SchweizSwitzerland 216 144 360 4,5 +35 4. Tschech. Rep.Czech Rep. 94 49 142 10,7 +55. FrankreichFrance 271 60 331 4,2 +59 5. USAUSA 95 35 130 26,1 +56. ItalienItaly 241 50 290 3,7 +10 6. ÖsterreichAustria 87 33 120 8,7 +47. ÖsterreichAustria 201 62 263 3,3 +29 7. ChinaChina 87 25 112 52,4 +48. IndienIndia 233 30 263 3,3 +21 8. SüdkoreaSouth Korea 104 8 112 85,9 +49. PolenPoland 179 32 211 2,7 +21 9. TaiwanTaiwan 91 11 102 87,8 +4
10. SüdkoreaSouth Korea 185 20 205 2,6 +12 10. NiederlandeNetherlands 61 16 76 73,2 +311.Tschech. Rep.Czech Rep.. 153 49 201 2,5 +43 11.FrankreichFrance 51 21 72 26,4 +312. TürkeiTurkey 168 22 190 2,4 +27 12. SpanienSpain 55 8 64 50,5 +213. BrasilienBrazil 143 40 182 2,3 +26 13. PolenPoland 18 44 62 39,0 +214. Verein. KönigreichUnited Kingd. 126 28 153 1,9 –5 14. TürkeiTurkey 50 6 56 84,9 +215. MexikoMexico 114 22 136 1,7 +45 15. Verein. KönigreichUnited Kingd. 34 7 41 –11,4 +1
SonstigeOthers 1 494 267 1 761 22,2 +28 SonstigeOthers 137 121 258 42,5 +9GesamtTotal 6 793 1 155 7 949 100,0 +31 GesamtTotal 2 141 679 2 819 42,2 +100
20101. ChinaChina 1 566 150 1 716 28,2 +32 1. SchweizSwitzerland 452 156 609 30,7 +82 . USAUSA 319 118 437 7,2 +4 2. JapanJapan 203 26 229 11,6 +123. RusslandRussia 298 42 340 5,6 –7 3. ItalienItaly 111 58 169 8,5 –314. SchweizSwitzerland 156 111 267 4,4 –4 4. Tschech. Rep.Czech Rep. 92 37 129 6,5 –155. ItalienItaly 215 49 263 4,3 –10 5. ÖsterreichAustria 85 26 110 5,6 +116. IndienIndia 194 23 217 3,6 –1 6. USAUSA 65 38 103 5,2 +127. FrankreichFrance 156 52 208 3,4 –13 7. ChinaChina 56 17 74 3,7 +21
8. ÖsterreichAustria 149 55 204 3,3 –35 8. SüdkoreaSouth Korea 53 7 60 3,0 +159. SüdkoreaSouth Korea 166 17 183 3,0 +10 9. FrankreichFrance 41 15 57 2,9 –7
10. PolenPoland 146 28 174 2,9 +1 10. TaiwanTaiwan 47 7 54 2,7 –2411.Verein. KönigreichUnited Kingd.. 126 36 162 2,7 +12 11.Verein. KönigreichUnited Kingd. 39 8 47 2,4 –1512. TürkeiTurkey 129 21 150 2,5 +40 12. PolenPoland 11 33 45 2,2 –3313. BrasilienBrazil 118 26 144 2,4 +21 13. NiederlandeNetherlands 34 10 44 2,2 –2314. Tschech. Rep.Czech Rep. 108 33 141 2,3 +24 14. SpanienSpain 36 6 42 2,1 –5815. NiederlandeNetherlands 80 23 103 1,7 +5 15. TürkeiTurkey 26 4 30 1,5 –7
SonstigeOthers 1 149 229 1 378 22,6 –18 SonstigeOthers 92 89 181 9,1 –12GesamtTotal 5 075 1 012 6 087 100,0 +1 GesamtTotal 1 442 540 1 983 100,0 –7
20091. ChinaChina 1 223 77 1 300 21,6 +13 1. SchweizSwitzerland 444 119 563 26,5 –502 . USAUSA 330 91 421 7,0 –40 2. ItalienItaly 190 55 245 11,6 –24
3. RusslandRussia 317 51 367 6,1 –30 3. JapanJapan 182 23 204 9,6 –584. ÖsterreichAustria 263 50 313 5,2 –31 4. Tschech. Rep.Czech Rep. 113 39 152 7,2 –215. ItalienItaly 253 40 293 4,8 –43 5. SpanienSpain 92 9 101 4,8 –76. SchweizSwitzerland 198 82 279 4,6 –31 6. ÖsterreichAustria 70 29 100 4,7 –377. FrankreichFrance 188 50 239 4,0 –35 7. USAUSA 61 31 92 4,3 –498. IndienIndia 206 14 220 3,6 –26 8. TaiwanTaiwan 67 4 72 3,4 –449. SchwedenSweden 157 16 173 2,9 –19 9. PolenPoland 33 34 67 3,2 –9
10. PolenPoland 148 24 172 2,9 –40 10. ChinaChina 46 15 61 2,9 –4111.SüdkoreaSouth Korea 153 13 167 2,8 +3 11. FrankreichFrance 42 19 61 2,9 –4012. MexikoMexico 142 11 153 2,5 –18 12. NiederlandeNetherlands 44 13 58 2,7 –2513. Verein. KönigreichUnited Kingd. 118 27 145 2,4 –33 13. Verein. KönigreichUnited Kingd. 40 15 55 2,6 –6114. BrasilienBrazil 98 21 119 2,0 –31 14. SüdkoreaSouth Korea 39 13 52 2,5 –5515. JapanJapan 98 20 118 2,0 +9 15. TürkeiTurkey 27 6 33 1,5 –58
SonstigeOthers 1 319 235 1 554 25,8 –37 SonstigeOthers 124 82 206 9,7 –37
GesamtTotal 5 212 821 6 033 100,0 –26 GesamtTotal 1 615 506 2 121 100,0 –43
Hinweise: %-Ant. = Prozentanteil, %-VR = prozentuale Veränderung zum VorjahrQuellen: Statistisches Bundesamt, VDW, VDMA
Note: %-Sha. = per cent share, %-Ch. = percental change to previous yearSources: German Statistic al Office, VDW, VDMA

8/15/2019 The German Machine Tool Industry in 2011
http://slidepdf.com/reader/full/the-german-machine-tool-industry-in-2011 40/84
38
Indien hält die Position als zweitwichtigster asiatischerMarkt hinter China. Die deutschen Ausfuhren steigen nachverhaltenem Vorjahr in 2011 wieder um gut ein Fünftel an.Mittelfristig gehört das Land zwar zu den vielversprechen-
den Wachstumsmärkten, beispielsweise weil der Motori-sierungsgrad der Bevölkerung gering und der Nachholbe-darf somit hoch ist. Gesamtwirtschaftliche Prognosen für2012 zeigen aber eine vorübergehende Wachstumsab-schwächung mit 6,1 % für das Bruttoinlandsprodukt und3,4 % für die Industrieproduktion. Erst in den Folgejahrenwird wieder eine höhere Wachstumsdynamik erwartet.
Die Ausfuhren nach Südkorea, für deutsche Werkzeugma-schinenhersteller die Nummer 3 in Asien, bleiben in derKrise 2009 ebenfalls stabil und schwenken 2010 und 2011mit +10 % bzw. +12 % wieder auf den Wachstumspfad ein.Wichtige Abnehmersektoren neben der Automobilindus-trie sind der Schiffbau und die Stahlindustrie.
Die Folgen der Tsunami- und Kernreaktorkatastrophe imMärz 2011 hat die japanische Industrie zwar wieder schnellüberwunden. Sie hinterlassen aber dennoch deutliche Spu-
ren in den Wirtschaftsdaten für das Gesamtjahr. Brutto-inlandsprodukt und Industrieproduktion sinken um 0,7%bzw. 3,5 %. Japans Werkzeugmaschinenhersteller erhaltenaus dem Inland auch wieder mehr Aufträge, das Plus be-trägt 36%. Dennoch profitiert die Branche weit mehr vomAuslandsgeschäft, das wieder näher an alte Rekordmarkenherankommt, während die Inlandsnachfrage davon nochweit entfernt ist. Trotz dieser schwierigen Rahmenbedin-gungen kann die deutsche Werkzeugmaschinenbrancheihre Lieferungen nach Japan in 2011 um gut 20 % erhöhen.Traditionell gilt Japan als ein eher abgeschotteter Markt
mit einer niedrigen Importquote von ca. 10 %. DeutscheHersteller sind mit ihrem hochtechnologischen undspezialisierten Angebot seit vielen Jahren aber wichtigerausländischer Lieferant. Denn nicht im von japanischenHerstellern stark besetzten Standardmaschinenbereich,sondern nur mit Technologie, die vor Ort nicht zur Verfügungsteht, kann man in diesem Markt punkten.
Hohe Zuwächse verbucht die deutsche Branche 2011 imASEAN-Raum, der 4,2 % der Exporte nach Asien ausmachtund um 56% zulegt. Der positive Nachfragetrend gilt durch-gängig für die größeren Märkte Singapur, Thailand undMalaysia, aber auch für Vietnam und Indonesien.
represents one of the promising growth markets in themedium term. One factor underlying that potential, forexample, is the low rate of motor vehicle ownership amongthe general population, which creates high pent-up de-
mand. Overall economic prognoses for 2012, however,show temporarily weaker growth at a rate of 6.1% for theGDP and 3.4% for industrial production. More dynamicgrowth is then expected to resume in the following year.
Exports to South Korea, the number 3 destination in Asiafor German machine tool manufacturers, also remainedstable during the crisis of 2009, pivoting back to the pathof growth again with +10% and +12% in 2010 and 2011, re-spectively. Along with the automotive industry, key customersegments here included shipbuilding and the steel industry.
Japanese industry rapidly overcame the consequences of the dramatic tsunami and nuclear reactor catastrophe of March 2011, but their effects were clearly apparent in theeconomic data for the full year. GDP and industrial pro-duction fell by 0.7% and 3.5%, respectively. Japanese ma-chine tool manufacturers received more domestic orders
again – there was a 36% increase. But the sector benefitedmuch more from foreign business, which approachedearlier record levels again, while domestic demand re -mained far behind them. Despite these difficult conditions,the German machine tool industry managed to increaseits supply to Japan by a full 20% in 2011. Japan is tradition-ally considered to be a rather isolated market with alow import rate of about 10%. With their high-technology,specialised offering, however, German manufacturers havelong been major foreign suppliers. Because one cannotcompete in this market with the standard machines that
are so prevalent among Japanese manufacturers, one mustoffer technology that cannot be obtained locally.
In 2011, the German sector posted high growth in the ASEANregion, which represented 4.2% of the exports to Asia andincreased by 56%. The demand trend was consistentlypositive for the larger markets of Singapore, Thailand andMalaysia, and also for Vietnam and Indonesia.
Exportzuwächse nach Japan trotz dramatischerNatur- und Atomkatastrophe
Increased exports to Japan despitedramatic natural and nuclear catastrophe

8/15/2019 The German Machine Tool Industry in 2011
http://slidepdf.com/reader/full/the-german-machine-tool-industry-in-2011 41/84
39
Mio.eur Mill.eur 2007 2008 2009 2010 2011
ItalienItaly
Tschech. Rep.Czech Rep.
SchweizSwitzerland
SüdkoreaSouth Korea
FrankreichFrance
JapanJapan
ItalienItaly
Tschech. Rep.Czech Rep.
SchweizSwitzerland
0
200
400
600
800
1000
1200899
356
217
142
130
120
112
112
102
76
609
229
169
129
103
110
74
60
54
44
JapanJapan
ÖsterreichAustria
USAUSA
ChinaChina
TaiwanTaiwan
AußenhandelForeign trade
Der Nahe und Mittlere Osten stehen für 5% der Asienex-porte. Das sogenannte „Recycling der Petrodollars“, also dieNutzungder Deviseneinnahmen aus dem Erdölgeschäft
für Investitionen in Infrastruktur- und Industrieprojekte,hat die Bedeutung von Ländern wie Saudi-Arabien oderden Vereinigten Arabischen Emiraten in den letztenJahren steigen lassen.
Deutschlands Einfuhren steigen um über 40%
Deutschland ist weltweit hinter China und den USA dritt-größter Importeur von Werkzeugmaschinen. Circa 40 %des Marktvolumens werden über Einfuhren abgedeckt. ImVerlauf des Jahres 2010 zeigen die Einfuhren wieder eine
klare Erholungstendenz, bleiben im Gesamtergebnis abernoch mit 7 % im Minus. Umso kräftiger fällt dafür das Wachs-tum 2011 aus. Ein Importplus von 42% spiegelt die im euro-päischen Vergleich sehr gute Verfassung der deutschenWirtschaft wider. Deutschland profitiert als exportstarkeNation vom starken Wachstum der Schwellenmärkte, vorallem Chinas, und kommt 2011 schneller und kräftiger ausder Krise als seine europäischen Nachbarn. Die Gesamt-wirtschaft wächst um 3,1%, der Output der Industrie sogarum gut 7,7%. Die Inlandsaufträge der deutschen Werkzeug-maschinenhersteller nehmen um 46% zu. Dennoch bleibtdas Importvolumen mit 2,8 Mrd. EUR noch deutlich umein Viertel unter der bisherigen Rekordmarke von 2008(3,7 Mrd. EUR).
The Near East and the Middle East accounted for 5% of theexports to Asia. The so-called “recycling of petrodollars” –i.e. the use of foreign currency revenues from the oil busi-
ness for investments in infrastructural and industrial pro- jects – raised the stature of countries such as Saudi Arabiaand the United Arab Emirates in recent years.
Germany’s imports increase by more than 40%
Germany was the world’s third biggest importer of machinetools after China and the USA. Approximately 40% of themarket volume was covered by imports. While importsexhibited a clear recovery trend over the course of 2010,their overall result nevertheless remained negative with
a 7% decrease. That made the growth in 2011 stand outthat much more. A 42% increase in imports reflected theexcellent health of the German economy relative to therest of Europe. As a heavily export-oriented country, Ger-many benefited from the strong growth of the emergingmarkets – especially China – and recovered from the crisisfaster and stronger in 2011 than its European neighboursdid. The overall economy grew by 3.1%, and industrial out-put even grew by a full 7.7%. German machine tool manu-facturers received 46% more domestic orders than they didin the previous year. At EUR 2.8 billion, however, the importvolume still remained well below (-25%) the previous recordlevel from 2008 (EUR 3.7 billion).
Hinweis: EinschließlichTeile, ZubehörQuellen: StatistischesBundesamt, VDMA, VDW Note: including parts,accessoriesSources: German StatisticalOffice, VDMA, VDW
Deutscher Werkzeugmaschinen-Import: wichtigste LieferländerGerman machine tool imports: major supplier countries
Top-10 -Lieferländer 2011 Entwicklung der Top-4 -Lieferländer (Mio.eur )Top 10 supplier countries 2010 Development of the top 4 supplier countries (mill.eur )

8/15/2019 The German Machine Tool Industry in 2011
http://slidepdf.com/reader/full/the-german-machine-tool-industry-in-2011 42/84
40
Given the high level achieved and the weak overall econ-omic environment, there are signs of a slowdown in 2012.Domestic orders for machine tools also indicate a similartendency, having shown no growth since the fourth quarter
of 2011. Taking into account the buffer effect of order back-logs, a high single-digit increase in imports should berealistic with regard to 2012.
Traditionally, Switzerland was by far the biggest foreignprovider on the German market. Nearly 32% of all importsoriginated from this neighbouring country. This was surelyalso related to the fact that Swiss machine tools, muchlike their German counterparts, stand for ultra-moderntechnology and high precision. Switzerland was also char-acterised by a highly specialised production structure,however. Its sales in Germany were dominated by laser,EDM and grinding technology. As mentioned above, how-ever, group-related supply involvements with Germancompanies also partly serve to explain these imports.
With a growth rate of 55%, Japan consolidated its positionas the second most important supplier and accounted fora 12.6% share of all imports. It should also be borne in mindthat Japanese machines too arrive onto the German marketvia European transplants and distribution centres (e.g.
Great Britain, the Netherlands and Belgium). The particularemphasis of Japanese providers essentially lies in theirproduction line machine business, such as CNC machiningcentres and CNC lathes. This amplifies their sensitivityto economic fluctuations, during both downturns andupswings.
With a 7.7% share, Italy’s machine tool manufacturers werethe third biggest foreign suppliers on the German market.The Czech Republic (5.1%) and the USA (4.6%) followed infourth and fifth place, respectively.
Another general remark on the interpretation of the importdata: A certain level of caution is advisable and caveatssimilar to those listed for exports at the beginning of thischapter apply. In this age of globalisation and internation-al financial link-ups between groups of companies, theinterpretability of the cross-border flows of goods has itslimits. German machine tool corporations own produc-tion and assembly facilities in a number of countries. Thisalso partly explains imports from Switzerland, the CzechRepublic, Poland, Great Britain and Italy, for example. TheVDW estimates that about one fifth of the total importvolume is traceable to this. The contention that the vol-ume of trade has been inflated is also supported by the
Für 2012 zeichnet sich angesichts des erreichten hohenNiveaus und des schwächeren gesamtwirtschaftlichenUmfelds eine Beruhigung ab. Dies zeigen auch die inlän-dischen Werkzeugmaschinenorders, die seit dem vierten
Quartal 2011 keine weiteren Zuwächse mehr aufweisen.Bezogen auf 2012 dürfte daher unter Berücksichtigungder Pufferwirkung von Auftragsbeständen ein hoch ein-stelliges Importplus realistisch sein.
Die Schweiz ist traditionell mit Abstand größter ausländi-scher Anbieter auf dem deutschen Markt. Knapp 32% dergesamten Einfuhren stammen aus dem Nachbarland. Dieshängt sicherlich auch damit zusammen, dass SchweizerWerkzeugmaschinen wie deutsche für modernste Techno-logie und hohe Präzision stehen. Allerdings ist die Schweizauch durch eine sehr spezialisierte Produktionsstrukturgeprägt. Der Absatz in Deutschland wird dominiert vonLaser-, Erodier- und Schleiftechnik. Wie oben erwähntstehen hinter diesen Einfuhren aber auch konzerninterneLieferverflechtungen mit deutschen Firmen.
Japan festigt mit einem Zuwachs von 55% seine Stellungals zweitwichtigster Lieferant und steht für 12,6 % Anteilam Gesamtimport. Ferner ist zu berücksichtigen, dass ja-panische Maschinen auch über europäische Transplants
bzw. Vertriebszentralen (z. B. Großbritannien, Niederlande,Belgien) auf den deutschen Markt kommen. Der besondereSchwerpunkt der japanischen Anbieter liegt grundsätzlichim Serienmaschinengeschäft wie CNC-Bearbeitungszentrenund CNC-Drehmaschinen. Damit ist die Abhängigkeit vonkonjunkturellen Schwankungen stärker ausgeprägt, sowohlim Auf- als auch im Abschwung.
Italiens Werkzeugmaschinenhersteller sind mit 7,7% Anteildrittgrößter ausländischer Anbieter auf dem deutschenMarkt. Auf den Plätzen 4 und 5 folgen Tschechien (5,1 %)
und die USA (4,6 %).
Noch ein grundsätzlicher Hinweis zur Interpretation derEinfuhrdaten. Hier ist gewisse Vorsicht angebracht und esgelten ähnliche Einschränkungen, wie sie zu Beginn diesesKapitels für den Export angeführt sind. Im Zeitalter derGlobalisierung und internationaler Konzernverflechtungenhat die Interpretierbarkeit der grenzüberschreitendenWarenströme ihre Grenzen. Deutsche Werkzeugmaschi-nenkonzerne besitzen in einer Reihe von Ländern Produk-tions- und Montagestätten. Einfuhren beispielsweise ausder Schweiz, Tschechien, Polen, Großbritannien und Italienerklären sich zum Teil auch vor diesem Hintergrund. Ver-bandsschätzungen gehen davon aus, dass ca. ein Fünftel

8/15/2019 The German Machine Tool Industry in 2011
http://slidepdf.com/reader/full/the-german-machine-tool-industry-in-2011 43/84
AußenhandelForeign trade
41
der Importe darauf zurückzuführen ist. Auch folgendeÜberlegung spricht für eine Aufblähung des Handelsvo-lumens. Ausländische Wettbewerber unterhalten europä -ische Vertriebszentralen in Deutschland und importieren
Maschinen, die zum Teil aber wieder in umliegende Absatz-märkte weiterexportiert werden.
following logic: Foreign competitors maintain Europeandistribution centres in Germany and import machines,but some of those machines are then re-exported tonearby markets.

8/15/2019 The German Machine Tool Industry in 2011
http://slidepdf.com/reader/full/the-german-machine-tool-industry-in-2011 44/84

8/15/2019 The German Machine Tool Industry in 2011
http://slidepdf.com/reader/full/the-german-machine-tool-industry-in-2011 45/84
Stellung auf dem WeltmarktPosition on the world market
Auf den zwei Haupt-Schleifspindeln dieser Schärfmaschine können verschiedenste Schleifscheiben flexibel, je nach Anwendungsbedarf,eingesetzt werden. Dies ermöglicht eine besonders präzise und wirtschaftliche Bearbeitung von Sägen für die Stahlbearbeitung.
The two main grinding spindles of this sharpening machine can be fitted with an extremely wide range of grinding discs according to thespecific requirements of the application. This flexibility permits particularly precise and cost-efficient machining of saws used in steel machining operations.

8/15/2019 The German Machine Tool Industry in 2011
http://slidepdf.com/reader/full/the-german-machine-tool-industry-in-2011 46/84
44
Datenbasis der Weltstatistik
Zur Erstellung der Weltstatistik nutzt der VDW unterschied-lichste Informations- und Datenquellen. Ziele dabei sind
eine möglichst konsistente Einbindung der Weltdaten indas gesamte statistische Berichtswesen des Verbandesund der Aufbau plausibler Zeitreihen. Datenquellen sindamtliche Statistiken, nationale Werkzeugmaschinenver-bände, das europäische Statistikamt Eurostat und wo not-wendig auch VDW-Abschätzungen. Endgültige Daten liegenbis 2010, teilweise auch schon für 2011 vor. Basis der vor-läufigen Daten für das Jahr 2011 ist unter anderem auchdie jährliche Umfrage des US-Fachmagazins „Metalwor-king Insiders’ Report“(Gardner Publications). Hier meldendie internationalen Verbände vorläufige Daten für dasgerade abgelaufene Jahr und revidierte Daten für das Vor-
jahr. In vielen Fällen weicht der VDW aber auch von denErgebnissen der Umfrage ab, soweit aus anderen Quellenplausiblere Daten bzw. Abschätzungen vorliegen.
Wesentliche Datenbasis ist das ausführliche internationaleBerichtswesen des VDW, das detaillierte Daten bis auf Maschinenebene enthält. Grundlage hierfür sind die Export-und Importstatistiken von über 40 Ländern, die mit hohemDetaillierungsgrad in der Datenbank des VDMA (Verband
Deutscher Maschinen- und Anlagenbau) eingepflegt sind.Ursprungsquelle sind die offiziellen amtlichen Außenhan-delsdaten der einzelnen Länder. Die Vorzüge der Nutzungdieser Datenbasis liegen auf der Hand: eine einheitlichedurchgängige Quelle, frühere Verfügbarkeit, weniger feh-lerbehaftet, deutlich mehr Länder im Zugriff und eine ver-tiefte Selektierbarkeit für die Mitgliedsunternehmen desVerbandes, die primär an Marktforschung für das eigeneMaschinenprogramm interessiert sind.
Abweichungen vom amtlichen Zahlenmaterial, nämlich
durch Rückgriff auf Verbandsdaten, sind alleine im Fall dervolumenmäßig bedeutsamen Außenhandelsnationen Japanund USA zugelassen worden. Die USA verfügen (in welt-weiter Alleinstellung) über statistische Möglichkeiten,ihre Export- und Importergebnisse von Gebraucht- und„Billigmaschinen“ zu bereinigen. Der japanische Verbandlegt gesteigerten Wert auf die Bereinigung seiner Außen-handelsdaten von Gebrauchtmaschinen und Ausrüstungenfür die Halbleitertechnik.
Um ein hohes Maß an Vergleichbarkeit der im Nationen-Ranking verwendeten Daten sicherzustellen, verstehensich alle Angaben „ohne Teile und Zubehör“. Neben derBeschränkung auf Komplettmaschinen ist hinsichtlich
Database of worldwide statistics
The VDW uses an extremely wide range of informationand data sources to generate its worldwide statistics. It
aims to achieve the most consistent integration possibleof global data into the statistical reporting of the assoc-iation and to construct plausible time sequences. Data sour-ces include officially published statistics, national machinetool associations, Eurostat (the European statistics office),and, where necessary, also VDW estimates. Definitive dataare available through 2010 – and in some cases also al-ready for 2011. Among other things, the provisional datafor 2011 are also based on the annual survey of the USspecialist publication Metalworking Insiders’ Report (GardnerPublications). It reports the international associations’provisional data for the year just completed along withadjusted data for the previous year. In many cases, however,the VDW also diverges from the results of the survey wheremore plausible data or estimates are available from othersources.
The data are essentially based on the comprehensive inter-national reporting system of the VDW, which contains de-tailed data down to the machine level. That system relieson more than 40 countries’ highly detailed export/import
statistics, which are entered into the database of the VDMA(Verband Deutscher Maschinen- und Anlagenbau, or GermanEngineering Federation). The original sources of those dataare the officially published export data of the individualcountries. The advantages of relying on those data areobvious: a uniformly consistent source, earlier availability,higher reliability, access to far more countries, and enhancedselectivity for VDW member companies primarily interestedin market research pertaining to their own machine range.
Deviations from the official figures, specifically by resort-
ing to the use of association data, have been permittedonly in the case of export trading nations Japan and theUSA, which are significant in terms of volume. The USA isthe only country in the world with the statistical means tofilter out second-hand and “cheap and simple” machinesfrom its import and export results. The Japanese assoc-iation places increasing emphasis on the elimination of used machines and equipment for the semi-conductorindustry from its export data.
In order to ensure high comparability among the data usedin the national rankings, all data provided are “without partsand accessories”. Along with the limitation on completemachines and with regard to the German figures, the

8/15/2019 The German Machine Tool Industry in 2011
http://slidepdf.com/reader/full/the-german-machine-tool-industry-in-2011 47/84
45WeltmarktWorld market
der deutschen Zahlen auch das Dienstleistungsgeschäftherausgerechnet worden. Entsprechend liegen die resul-tierenden Angaben unter den Wertansätzen bei rein na -
tionaler Betrachtung. Bezogen auf das Jahr 2011 beträgt dieWertdifferenz gegenüber dem Aggregat inklusive genannterUmsatzkomponenten rund 26 %. Der VDW hat die LänderPolen, Slowakei, Ungarn, Bulgarien und Slowenien schon2007 in den Kernberichtskreis aufgenommen. Die Produk-tionszahlen verstehen sich als grobe VDW-Schätzungen.Basis sind Daten vom europäischen Statistikamt Eurostat,die aber teilweise älter und auch nicht vollständig sind.Dieser Versuch einer Abschätzung versteht sich als „konti-nuierlicher Verbesserungsprozess“, der sich insbesondereauch auf Kommentare von VDW-Mitgliedsfirmen stützen
möchte.
Die Aussagekraft chinesischer Produktionsdaten ist immerwieder lebhaft diskutiert und das Volumen als unrealistischhoch kritisiert worden. Detaillierte VDW-Recherchen zei-gen, dass die chinesischen Daten einen hohen Anteil ein -fachster Maschinen enthalten, die einen sinnvollen Länder-vergleich im Weltmaßstab verzerren. Daher hat sich derVerband entschlossen, in seinen Publikationen sachlichbegründete, im Zeitablauf nachvollziehbare und regelmäßigzu überprüfende Abschläge auf chinesische Produktions-und Exportdaten vorzunehmen. Nach Angaben des chine-sischen Werkzeugmaschinenverbandes CMTBA lag derAnteil NC-gesteuerter Maschinen am Produktionswert
services business has also been deducted. Accordingly,the resulting data are below the raw amounts otherwisereported from a strictly national perspective. With regard
to 2011, the difference in value compared to the aggregate,including the turnover components mentioned, is around26%. The VDW has included the countries Poland, Slovakia,Hungary, Bulgaria and Slovenia in its core reporting circlesince 2007. The production figures are to be construed asrough VDW estimates, and are based on data from theEuropean statistics office, Eurostat. Some of those dataare old, however, and they are also incomplete. Consideredas a “continuous improvement process”, this attempt atestimation welcomes support, particularly in form of comments from VDW member companies.
The meaningfulness of Chinese production data remainsa perennial topic of animated discussion and the volumehas been severely criticised as unrealistic. Detailed VDWresearch indicates that the Chinese data include a highproportion of the simplest machines, which distort anyuseful comparison among countries on a global scale. Forthis reason the association has decided to subject the Chi-nese production and export data which the VDW uses inits publications to factually justified, chronologically docu-mented and regularly reviewed reductions. According toinformation provided by the Chinese machine tool associ-ation CMTBA, numerically controlled machines represented51.9% of the total production value in 2010.
92 93 94 95 00 01 02 06 07 08 0903 04 0597 98 9996
0
10
20
30
40
50
60
0
15
30
45
60
75
90
10 11
26,7 23,6 22,9 27,0 29,3 33,6 33,5 33,7 41,1 39,7 33,0 32,0 35,5 41,5 46,0 51,4 54,3 37,6 48,2 62,4
Hinweis: Ohne Teile,Zubehör; 2011 =SchätzungQuelle: VDW Note: excluding parts,accessories; 2011 =estimateSource: VDW
Welt-Produktion WerkzeugmaschinenWorld machine tool production
Mrd.eur Bill.eur Mrd. US-$Bill. US-$

8/15/2019 The German Machine Tool Industry in 2011
http://slidepdf.com/reader/full/the-german-machine-tool-industry-in-2011 48/84
46
2010 bei 51,9 %. Dies stellt oftmals aber auch einfachereTechnologie dar. Der konventionelle Bereich besteht zumüberwiegenden Teil aus Maschinen einfachster Machart,sehr wohl auch für den nicht-industriellen Einsatz. Auch
erscheint es als fraglich, ob hinter den ausgewiesenenDaten durchgängig Werkzeugmaschinen in einem engerenSinne stehen. Für das Bohren ist beispielsweise Aufblähungdes Volumens durch handgeführte Maschinen nicht aus-zuschließen. Im Falle von zwei Dritteln der konventionellenTechnik handelt es sich um Maschinen mit einem Wert
unter 10 Tsd. EUR. Der VDW hat sich daher entschlossen,die Produktionsdaten auf Basis der Recherchen zu berei-nigen. Einbezogen wird die komplette NC-Technologie so-wie ein Drittel des konventionellen Bereichs, der ansonstenstark von Billigstmaschinen beeinflusst ist. Der Weiterent-wicklung der technologischen Wettbewerbsfähigkeit wirddurch Einbezug der steigenden NC-Durchdringung Rech-nung getragen. So ist der NC-Anteil 2007 bis 2010 von 45,0auf 51,9 % angestiegen. Die VDW-Methode führt in 2011 zueiner Bereinigung des von chinesischer Seite veröffent-
lichten Produktionswertes um 32% von 21,3 auf 14,6 Mrd.EUR. Mit gleichem Prozentsatz wird auch der Exportwertgekürzt, die Importdaten bleiben hingegen unverändert.Rechnerisch ergibt sich damit eine Reduzierung deschinesischen Marktvolumens um 21 % von 29,1 auf 22,9Mrd. EUR. Der VDW wird seine Recherchen auch in derZukunft fortführen, um den Grad der notwendigen Berei-nigung laufend zu überprüfen.
Aus Gründen der Gleichbehandlung hat der VDW auchdie Produktionsdaten anderer wichtiger Herstellerländer
anhand des skizzierten Verfahrens überprüft. Mit strengbetrachtet notwendiger Bereinigung zwischen 0 % und5 % ergibt sich sogar für Indien eine in der Praxis vernach-lässigbare Größenordnung. Chinesische Produktionsdatenbilden somit in nennenswertem Umfang internationalnicht vergleichbare Technologie ab. Nähere Einzelheiten,auch hinsichtlich weiterer Zweifelsfälle wie Taiwan oderRussland, wo mangels hinreichend detaillierter Produk-tionsdaten keine Bereinigung unter gesicherten Voraus-setzungen möglich ist, aber auch die Größenordnungennicht annähernd der Tragweite chinesischer Einflüsse ent-sprechen, finden sich in den „Methodischen Hinweisenzur Weltstatistik“ im Rahmen des durch ausführliche Tabel-len gestützten Statistischen Anhangs dieser Publikation.
Often this also includes simpler technology, however. Theconventional segment largely comprises the simplest of machinery, and most certainly also includes equipmentintended for non-industrial applications. It also appears
questionable whether all of the data provided representconsistent machine tools in the stricter sense of the term.In drilling equipment, for example, nothing can guaranteewith any certainty that the volume has not been inflatedby manually operated machines. Two thirds of the con-
ventional technology involves machines with a value of less than EUR 10,000. For this reason, the VDW decided toadjust the production data based on the research. It con-siders all NC technology plus one third of the conventionalarea, which is otherwise heavily influenced by the leastexpensive “cheap and simple” machines. The further de-velopment of technological competitiveness is taken intoaccount by considering the increasing penetration of NC.From 2007 to 2010, for example, the share of NC rosefrom 45.0% to 51.9%. In 2011, the production value pub-lished by the Chinese was adjusted downward by 32%from EUR 21.3 billion to EUR 14.6 billion as a result of the
VDW methodology. The export value was also reduced bythe same percentage, while import data remained un -changed. This results in a 21% reduction in the Chinesemarket volume – from EUR 29.1 billion to EUR 22.9 billion.The VDW will also carry on its research in the future, inorder to continuously monitor the required degree of adjustment.
For reasons of equal treatment, the VDW also used themethodology described here to study the production dataof other major manufacturing countries. With required
adjustments of between 0% and 5% at most, even Indiadeviated by a practically negligible order of magnitude.To a considerable degree, therefore, Chinese productiondata represent technology that cannot be compared onan international basis. For further details, also relative toother dubious cases such as Taiwan or Russia, where ad-
justments cannot be carried out under reliable conditionsdue to the lack of sufficiently detailed production data,but where the order of magnitude also does not even beginto approach that of China, please refer to the “Methodicalcomments on worldwide statistics” within the frameworkof the comprehensive tabular supporting data in the“Statistical appendix” to this publication.
Unfiltered Chinese data risk falsifying any usefulcomparison among countries on a global scaleSinnvoller Ländervergleich im Weltmaßstab
droht ohne Bereinigung der chinesischenDaten verloren zu gehen

8/15/2019 The German Machine Tool Industry in 2011
http://slidepdf.com/reader/full/the-german-machine-tool-industry-in-2011 49/84
WeltmarktWorld market
47
Weltproduktion steigt 2011 auf einen neuen Rekordwert
Die Weltproduktion von Werkzeugmaschinen setzt in 2011ihren steilen Wiederaufstieg aus dem Krisenjahr 2009 fort.Mit einem Plus von 30% erreicht sie mit 62,4 Mrd. EURVolumen (ohne Teile und Zubehör) ein neues historisches
Rekordniveau. Der bisherige Spitzenwert aus 2008 mit54,3 Mrd. EUR wird deutlich überschritten. Die wichtigenAbnehmerbranchen, angeführt von der Automobil- undZulieferindustrie, haben nach dem tiefen Einbruch in derWirtschafts- und Finanzkrise einen hohen Nachholbedarf und kehren wieder auf den Investitionspfad zurück.
Auf Dollar-Basis (aktuell 86,9 Mrd. US-Dollar) ergibt sichvor dem Hintergrund von 5% Aufwertung des Euro gegen-über der US-Währung ein noch stärkeres Plus von 36%.Bei vergleichenden internationalen Betrachtungen ineiner Währung, hier dem Euro, spielen Wechselkurseffektenatürlich eine Rolle. Die tatsächliche Performance einesLandes spiegelt sich realistisch allein auf Basis der natio-
World production reaches a new record in 2011
In 2011, world production of machine tools continuedits steep recovery from the crisis year of 2009. With a30% increase, volume reached an historic record level of EUR 62.4 billion (excluding parts and accessories). This
was well above the previous peak value of EUR 54.3 billionin 2008. In the wake of the severe losses incurred duringthe economic and financial crisis, the major client sectorsneed to make up for a great deal of lost ground. With theautomotive industry and its components supplier seg-ment leading the way, they are returning to the path ofinvestment.
In view of the 5% rise in the value of the euro versus theUS currency, the increase was even greater: 36% on a dollarbasis (USD 86.9 billion at that time). In comparative inter-national analyses in one currency – in this case, the euro –exchange rate effects play a role, of course. The actual per-formance of any country is realistically reflected only on
40
60
80
100
120
03 05 07 09 11
+7,1
+5,0
+1,5
+1 ,2
+0,6
+0,3
-0,2
-1,7
-2,7
-4,5
-10,7
Verein. Königreich (£)United Kingdom
Taiwan (NT$)Taiwan
Tschechische Rep. (Kc )Czech Republic
China (RMB.¥)China
Schweiz (sfr)Switzerland
Japan (¥)Japan
140
04 06 08 1002
+36 %+28 % +30 %
Indien (iR)India
USA (US-$)USA
Russland (Rbl)Russia
Südkorea (Won)South Korea
Brasilien (R$)Brazil
160
180
Entwicklung des Euro Welt-Produktion Werkzeugmaschinen (2005 = 100)Development of the Euro World machine tool production (2005 = 100)
Veränderung des Euro2011 zu 2010 gegenüber ... konstante Wechselkurse constant exchange ratesChange of Euro2011 to 2010 against ... € laufende Wechselkurse € current exchange rates
US-$ laufende WechselkurseUS-$ current exchange rates
Erläuterung:Orange Kurve: Entwicklung der Welt-Produktion unter Annahme konstanterWechselkurse (Basis 2005). Die Entwicklung wird also ohne wechselkurs-verzerrende Einflüsse dargestellt (Welt-Produktion 2011/10: +28 %).Dunkelgrüne Kurve: Umrechnung mit laufenden Wechselkursen in Euro(Welt-Produktion 2011/10: +30 %).Hellgrüne Kurve: Umrechnung mit laufenden Wechselkursen in US-Dollar(Welt-Produktion 2011/10: +36 %).Explanation:Orange line: development of world production assuming constant exchangerates (base 2005). The development is thus shown without distortinginfluences due to exchange rates (world production 2011/10: +28%).Dark-green line: converting to Euro at current exchange rates(world production 2011/10: +30%).Light-green line: converting to US-Dollar at current exchange rates(world production 2011/10: +36%).

8/15/2019 The German Machine Tool Industry in 2011
http://slidepdf.com/reader/full/the-german-machine-tool-industry-in-2011 50/84
48
nalen Währung wider. Beim Vergleich des aktuellen Be richts - jahres 2011 mit dem Vorjahr sind daher, neben der er wähntenAufwertung gegenüber dem US-Dollar, insbesondere auchder starke Zugewinn des Euro gegenüber der indischen
Rupie (7,1 %) sowie die kräftigere Abwertung zum japani-schen Yen (–4,5 %) sowie zum Schweizer Franken (–10,7 %)zu berücksichtigen. Eine Berechnung der Weltproduktionauf Basis konstant gehaltener Wechselkurse führt zu einemetwas geringeren Plus in 2011 von 28%. Dies vor allem, dadie Zugewinne Japans dann nicht durch die Yen-Aufwer-tung rechnerisch noch verstärkt werden.
Treiber der Produktionsentwicklung ist Asien, das mit plus33% den stärksten Zuwachs verbucht und seinen Anteil ander Weltproduktion auf 58,3% ausbaut. Japan legt mit +46%
am kräftigsten zu. Aufgrund des hohen Anteils von Hightech-Produkten und Großaufträgen mit längeren Durchlauf-zeiten verlor Europa 2010 mit einem Produktionsminus von2 % noch an Boden. In 2011 können die europäischenHersteller ihren Output mit +28 % wieder kräftig ausweitenund stehen für genau 35 % Anteil am Weltvolumen. Diegrößte Dynamik weist Deutschland mit +35% auf, wogegensich beispielsweise Italien (+18 %) und Spanien (+20%)vergleichsweise schwächer entwickeln. Die Schweiz wächstzwar in Euro gerechnet um 38 %, in eigener Währung abernur um 23%. Amerika hinkt im Weltvergleich als Produzentmit 13 % Plus und einem um einen Punkt reduzierten Welt-anteil von 6,7% allerdings sichtbar hinterher. Während dieUSA um 19% zulegen (in Dollar um 25%) verharrt Brasilienin Stagnation.
the basis of its local currency. So in comparing the currentreporting year of 2011 to the previous year, in addition toits above-mentioned rise against the dollar, the euro’s stronggains versus the Indian rupee (7.1%) and its steep declines
versus the Japanese yen (–4.5%) and the Swiss franc (–10.7%)in particular must also be taken into account. A calculationof world production in 2011 based on a constant exchangerate results in a somewhat smaller increase of 28%. This isprimarily because Japan’s growth is then no longer math-ematically amplified by the increase in the value of the yen.
Driving this production trend is Asia, which posted thestrongest growth (+33%) and expanded its share of world-wide production to 58.3%. Japan gained the most ground,with a 46% increase. Due to the high share of high-tech
products and major orders with longer turnaround times,Europe lost more ground in 2010 with a 2% decline in pro-duction volume. In 2011, European manufacturers wereable to expand their output again significantly with a28% increase and represented exactly 35% of world volume.Among the countries of Europe, Germany exhibited themost dynamic growth (+35%), while development in Italy(+18%) and Spain (+20%) was relatively weak pace bycomparison. Switzerland grew by 38% when converted toeuros, but by only 23% in its own currency. As comparedwith the rest of the world, the Americas limped along asa producer with 13% growth and lost one percentage pointof the world share (6.7%). While the USA increased by19% (or by 25% on a dollar basis), Brazil remained mired instagnation.
+29
+18
+35
+19
+25
+39 (¥)
+20 ( Won)
+23 (NT$)
+38
+23 (sfr)+20+20 (€ )
+1 3
+13 (€ )
Produktion in Mio.eurProduction in mill.eur
Euro Euro
%-Veränderung 2011/10%-Change 2011/10
nationale Währung national currency
637721Österreich
Austria
+30 (RMB.¥)
+18 (€ )
632757Spanien
Spain
USAUSA
2 4911 810
2 9892 518
TaiwanTaiwan 3 077
3 851
SüdkoreaSouth Korea
4 0523 393
ItalienItaly
4 4803 789
DeutschlandGermany
9 7007 166
JapanJapan
13 1839 044
China*China* 11 262
14 568
2011 2010
+46
SchweizSwitzerland
+35 (€ )
+19+25 (US-$)
* VDW-Bereinigung umeinfachste Maschinen(vgl. Anhang, methodischeHinweise, z. B. 2011 um32,0%)Quellen: VDW, VDMA,nationale Verbände,Gardner Publications
* VDW correction for“cheap and simple”machines (see appendix,methodical comments,e.g. 2011 by 32.0%)Sources: VDW, VDMA,national associations,Gardner Publications
Werkzeugmaschinen-Produktion: Top-10-Länder weltweitMachine tool production: top 10 countries worldwide

8/15/2019 The German Machine Tool Industry in 2011
http://slidepdf.com/reader/full/the-german-machine-tool-industry-in-2011 51/84
WeltmarktWorld market
49
Im Weltrating der Produzentenländer behauptet Chinaauch nach Bereinigung um einfachste Technologie denSpitzenplatz. Mit einem Plus von 29 % erzielt das Reich derMitte ein Produktionsvolumen von 14,6 Mrd. EUR und einen
Weltanteil von 23,3%. Unbereinigt läge der Produktionswertbei 21,3 Mrd. EUR. Rang 2 halten Japans Werkzeugmaschinen -hersteller, die mit plus 46 % (auf Yen-Basis 39%) kräftigzulegen und für 13,2 Mrd. EUR Produktionswert bzw. 21,1%Anteil stehen. Die japanische Branche kann die wirtschaft-lichen Folgen der dramatischen Tsunami- und Kernreak-torkatastrophe vom März 2011 schnell überwinden. Miteinem Zuwachs um 35% auf 9,7 Mrd. EUR erhöht Deutsch-land als Drittplatzierter seinen Anteil leicht auf 15,5 %. Diedrei größten Herstellernationen vereinen somit 60 % derWeltproduktion auf sich. Die Reihenfolge der Top 3 verän-
dert sich im Vergleich zu 2010 also nicht, Japan rückt abernäher an China heran.
Die starke Stellung Japans im Länderrating wird aber auchbegünstigt durch die anhaltende Aufwertung des Yen.Seit 2007 hat der Yen 45% an Wert gegenüber dem Eurogewonnen. Dies bringt natürlich im Exportgeschäft Wett-bewerbsnachteile mit sich, führt aber bei vergleichendenLänderbetrachtungen rechnerisch auch zu einem in Eurogemessenen höheren Produktionswert. Der zweitgrößteeuropäische Produzent Italien liegt mit 4,5 Mrd. EUR und7,2% Anteil weltweit auf Rang 4, entwickelt sich aber mitplus 18 % deutlich unter dem Weltmaßstab.
In the world ranking of the producing countries, China cameout on top even after filtering out the simplest technology.With a 29% increase, the Middle Kingdom achieved aproduction volume of EUR 14.6 billion and a world share
of 23.3%. Before adjustments, the production value wasEUR 21.3 billion. Japan’s machine tool manufacturers occu-pied second place with a hefty increase of +46% (or +39% ona yen basis). It posted a production value of EUR 13.2 billion,which represents a 21.1% share of the world total. The ma-chine tool industry in Japan rapidly overcame the eco-nomic consequences of the dramatic tsunami and nuclearreactor catastrophe of March 2011. With 35% growth toEUR 9.7 billion, third-place Germany increased its worldshare slightly to 15.5%. Taken together, the three largestmanufacturer nations therefore represent 60% of the
total world production. So the order of the Top 3 was thesame as in 2010, but Japan did move closer to China.
Japan’s strong position in the country ranking was alsofavoured by the continuously increasing value of the yen.The yen has gained 45% in value against the euro since2007. This is a competitive disadvantage in the exportbusiness, of course, but in comparative analyses amongcountries it also mathematically results in a higher pro-duction value measured in euros. With EUR 4.5 billion anda 7.2% world share, Europe’s second biggest producer,Italy, ranked fourth in the world. At 18% growth, however,it lagged well behind the global pace.
Top-5-Produzenten (Mrd.EUR)Top 5 producers (bill.EUR)
Top-5-Verbraucher (Mrd.EUR)Top 5 consumers (bill.EUR)
Sonstige 16,44 Mrd.EUROthers 16.44 bill. EUR26,3 %
Südkorea 4,05 Mrd.EURSouth Korea 4.05 bill.EUR6,5 %
Italien 4,48 Mrd.EURItaly 4.48 bill.EUR7,2 % Deutschland 9,7 Mrd.EUR
Germany 9.7 bill.EUR15,5 %
Japan 13,18 Mrd.EURJapan 13.18 bill. EUR21,1 %
Sonstige 20,54 Mrd.EUROthers 20.54 bill. EUR32,9 %
Deutschland 5,47 Mrd. EURGermany 5.47 bill.EUR
8,8 %
China* 22,92 Mrd.EURChina* 22.92 bill.EUR36,7 %
Japan 4,75 Mrd. EURJapan 4.75 bill.EUR7,6 %
China* 14,57 Mrd. EURChina* 14.57 bill.EUR23,3 %
USA 3,69 Mrd.EURUSA 3.69 bill.EUR5,9 %
Südkorea 5,05 Mrd.EURSouth Korea 5.05 bill. EUR8,1 %
* VDW-Bereinigung umeinfachste Maschinen(vgl. Anhang, methodischeHinweise, z. B. 2011 Produk-tion und Export um 32,0 %=> Verbrauch um 21,0 %)Hinweis: Ohne Teile,Zubehör; 2011 =Schätzungen;VDW- Annahme:Welt-Produktion =Welt-VerbrauchQuellen: VDW, VDMA,nationale Verbände,Gardner Publications* VDW correction for “cheapand simple” machines (seeappendix, methodical com-ments, e.g. 2011 productionand exports by 32.0% =>consumption by 21.0%)Note: excluding parts, ac-cessories; 2011 = estimates;VDW assumption:world production =world consumptionSources: VDW, VDMA,nation al associations,Gardner Publications
Welt-Produktion und -Verbrauch von WerkzeugmaschinenWorld machine tool production and consumption
Welt-Produktion = Welt-Verbrauch 2011: 62,42 Mrd.EURWorld production = world consumption 2011: 62.42 bill.EUR

8/15/2019 The German Machine Tool Industry in 2011
http://slidepdf.com/reader/full/the-german-machine-tool-industry-in-2011 52/84
50
Die asiatischen Hersteller Südkorea und Taiwan folgendicht auf und verbuchen Anteile von 6,5% und 6,2% fürsich. Mit deutlicherem Abstand platzieren sich die US-Hersteller auf Rang 7 (Anteil 4,8 %) und die Schweiz auf
Rang 8 (Anteil 4,0%). Hielten sich die Vereinigten Staaten2009 noch in den Top 5, so hat sich der Positionswechsel
mit Südkorea und Taiwan schon ein Jahr später nichtmehr abwenden lassen. Im Vergleich zur letzten Ausgabevorliegender Publikation gilt zu beachten, dass der US-Verband seine Datenbasis hinsichtlich der Produktionkomplett umgestellt hat. Näheres hierzu findet sich inden methodischen Hinweisen des Statistischen Anhangs.
Nach Rang 8 klafft eine große Lücke zu weiteren Produzen-tenländern. Die Top 10 komplettieren Spanien und Öster-reich mit Anteilen von jeweils 1,2%. Es folgen mit nichtallzu großem Abstand Frankreich, Indien und Brasilien. Beiletzteren beiden fällt auf, dass sie mit +8 % (in indischerRupie allerdings +16%) und –1 % klar die Weltperformanceverfehlen.
Japan Nummer 1 in der Zerspanung, China führtin der Umformtechnik
Weltweit steht die Zerspanung in 2011 für ein Produktions-volumen von 45,6 Mrd. EUR und die Umformtechnik für16,8 Mrd. EUR. Die Anteile belaufen sich auf 73% versus27 %, eine Relation, die sich im Zeitablauf mit leichtenSchwankungen als relativ stabil erweist. Im aktuellenBerichtsjahr ist der Zuwachs bei spanenden Maschinen(+30%) jedoch etwas stärker ausgeprägt als im umfor-menden Bereich (+27 %). Der Anteil der Zerspanung am
gesamten Produktionsergebnis liegt für Japan mit 89 %,gültig für 2011, im Vergleich zu den wichtigsten Wettbe-werbern am höchsten. Es folgen die Schweiz mit einemZerspanungsanteil von 84% und Taiwan mit 80%. Deutsch-land liegt bei 74%, ähnlich ist die Quote auch in denUSA (73%), China (70%) und Südkorea (69%). LediglichItalien weist eine „ausgeglichene“ Produktionsstrukturmit jeweils 50% Anteil für beide Segmente auf.
Im Rating der Produktionsergebnisse für spanende Werk-zeugmaschinen wird China (bereinigt 10,2 Mrd. EUR, 22,4 %Anteil) von der Branche in Japan (11,7 Mrd. EUR, 25,7 %) auf Rang 2 verwiesen, die Platzierungen gegenüber 2010 dre-
The Asian manufacturers South Korea and Taiwan wereclose at Italy’s heels, posting 6.5% and 6.2% world shares,respectively. More clearly outdistanced, US manufacturersranked seventh (4.8% share) and Switzerland ranked eighth
(4.0% share). The United States still ranked among the Top 5in 2009, but one year later it could no longer prevent SouthKorea and Taiwan from taking over its position. As com-
pared with the previous issue of this publication, it shouldbe noted that the US association has completely changedits database relative to production. Further informationon this is available in the “Methodical comments” of the“Statistical appendix”.
A large gap separates the eighth rank from the remainingproducing countries. Spain and Austria complete the Top 10with 1.2% each. France, India and Brazil follow at relativelyshort intervals. The performance of the last two fell con-spicuously short relative to the rest of the world with +8%(albeit +16% in Indian rupees) and –1%.
Japan number 1 in the cutting sector, China leads in
metal-forming technology
Worldwide, the cutting sector represented a productionvolume of EUR 45.6 billion in 2011 while metal-cuttingaccounted for EUR 16.8 billion. That 73%-to-27% ratio fluc-tuated slightly but proved relatively stable over time. Inthe current reporting year, however, growth in metal-cuttingmachines (+30%) was more pronounced than in the metal-forming sector (+27%). Among the major competitors,Japan had the highest metal-cutting machine output as ashare of its total production result in 2011. It was followed
by Switzerland with an 84% metal-cutting share and Tai-wan with 80%. In Germany the share was 74%, which alsobarely differed from the USA (73%), China (70%) and SouthKorea (69%). The only country with a “balanced” productionstructure was Italy, with a 50% share for both segments.
In the ranking of the production results for metal-cuttingmachine tools, China (EUR 10.2 billion and a 22.4% shareafter adjustment) was relegated to second place by thatsegment in Japan (EUR 11.7 billion, 25.7%) – their 2010positions were simply interchanged. German and Japanesemanufacturers demonstrated comparably dynamic growth,with +41% and +40% (on a yen basis), respectively. With a
Stronger yen favours Japan’s positionin the world ranking
Yen-Aufwertung begünstigt Japans Stellungim Welt-Rating

8/15/2019 The German Machine Tool Industry in 2011
http://slidepdf.com/reader/full/the-german-machine-tool-industry-in-2011 53/84

8/15/2019 The German Machine Tool Industry in 2011
http://slidepdf.com/reader/full/the-german-machine-tool-industry-in-2011 54/84
52
schon fast deklassiert, und dies trotz VDW-Bereinigungder Daten (unbereinigtes Volumen: 6,4 Mrd. EUR).Deutschland stellt mit 2,6 Mrd. EUR und 15,2 % Anteil denVize-Weltmeister. Die deutsche Umformtechnik kann zwar
mit +23 % das Wachstumstempo der Zerspanungskolle-gen nicht mithalten (+41 %). Aufgrund des hohen Anteilsvon Projektgeschäft, insbesondere in der Pressentechnologie,weist die Umformtechnik aber auch einen weniger schwan-kenden Konjunkturverlauf aus und war beispielsweise inder Krise 2009 bei weitem nicht so tief gefallen. Italienstellt den weltweit drittgrößten Produzenten umformen-der Maschinen mit einem starken Fokus auf dem Sektorder Biegetechnik. Das Produktionsvolumen beläuft sichauf 2,3 Mrd. EUR, der Anteil auf 13,6%. Noch in 2008 lagItalien vor Deutschland in führender Position und fiel dannaber im Folgejahr auf den dritten Rang zurück. Japan wirdmit 1,5 Mrd. EUR und 8,7% Anteil auf den vierten Rang ver-wiesen. Auf Platz 5 folgt Südkorea mit einem Output von1,3 Mrd. EUR (Anteil 7,5 %). Die Ränge 5 bis 10 nehmen dieUSA (4,7%), Taiwan (4,6 %), Schweiz (2,3%), Türkei (2,1%)und Österreich (2,0%) ein.
Japan stellt den Export-Champion 2011
Bezogen auf den Kreis von 34 Berichtsländern, der in der
VDW-Weltstatistik durchgängig Produktions-, Export-,Import- und damit auch Verbrauchsdaten ausweist, ergibtsich ein „Weltexportvolumen“ in 2011 von 32,8 Mrd. EUR.Gegenüber 2010 entspricht dies einem Anstieg um 32%.
Mit 8,2 Mrd. EUR Ausfuhrvolumen in 2011 baut Japan seineStellung als Export-Weltmeister weiter aus. Der Anteil amglobalen Werkzeugmaschinenexport liegt bei knapp 25%.Die deutschen Hersteller stehen mit 6,8 Mrd. EUR Export-wert und einem Anteil von 20,7% auf Platz 2. Die Führungs-position ging 2010 an Japan verloren, das natürlich sehr
stark von der hohen Dynamik der „vor der Haustür liegen-den“ asiatischen Märkte, hier insbesondere China, profi-tiert. Beide Länder zusammengenommen dominiereneindrucksvoll das weltweite Exportgeschehen. Mit Abstandvervollständigen Italien (3,1 Mrd. EUR, 9,4% Anteil), Taiwan(2,9 Mrd. EUR, 8,9%) und die Schweiz (2,2 Mrd. EUR, 6,8%)die Top-5-Exportländer. Nach Südkorea und den USA belegtChina Rang 8 auf Basis des bereinigten Exportvolumensvon 1,2 Mrd. EUR. Die chinesischen Hersteller verfügen nochnicht über hinreichend verzweigte Vertriebslinien für hoch-wertige und somit exportfähige Anlagen und stehen ak-tuell für bescheidene 3,6% Anteil an der globalen Ausfuhr.Der sehr große und dynamische Heimatmarkt nimmt über
have been adjusted downward by the VDW (unfilteredvolume: EUR 6.4 billion). With EUR 2.6 billion and a 15.2%share, Germany was the world vice-champion. The 23%growth in Germany’s metal-forming technology sector did
not permit it to keep pace with its metal-cutting counter-part (+41%). Its high proportion of project business –especially in press technology – does also stabilise its eco-nomic fluctuations, however, and has protected it from fargreater losses (during the crisis of 2009, for example). Italywas the world’s third largest producer of metal-formingmachines with a strong focus on the bending technologysector. Its production volume was EUR 2.3 billion whichrepresented a 13.6% share of the world total. As late as 2008,Italy was still in first place ahead of Germany, but then itfell to third place in the following year. With EUR 1.5 billionand an 8.7% share of the world’s metal-forming technologyproduction, Japan was relegated to fourth place. It wasfollowed by fifth-ranked South Korea with an output of EUR 1.3 billion (7.5% share). Ranks 5 through 10 were heldby the USA (4.7%), Taiwan (4.6%), Switzerland (2.3%), Turkey(2.1%) and Austria (2.0%), respectively.
Japan is the export champion in 2011
Based on the 34 countries covered in this report, for which
the VDW world statistics have consistent production, ex-port, and import data and therefore also consumption data,the “world export volume” in 2011 was EUR 32.8 billion. Thisrepresents a 32% increase over 2010.
With EUR 8.2 billion export volume in 2011, Japan extendedits lead as export world champion. Its share of global ma-chine tool exports was nearly 25%. German manufacturersranked second with EUR 6.8 billion export value and a 20.7%share. The lead position was lost to the Japanese in 2010,who naturally took full advantage of the highly dynamic
Asian markets situated right at their doorstep – especiallyChina in this case. Taken together, the two countries domi-nated the worldwide export activity to an impressive ex-tent. Lagging well behind them, Italy (EUR 3.1 billion, 9.4%share), Taiwan (EUR 2.9 billion, 8.9%) and Switzerland(EUR 2.2 billion, 6.8%) rounded out the list of the Top 5export countries. After South Korea and the USA, Chinaranked number 8 based on the adjusted export volume of EUR 1.2 billion. For high quality (and therefore exportable)machinery, Chinese manufacturers still lacked adequatelybranched distribution channels. They represented a modest3.6% share of global exports during the reporting period.Their very large and dynamic domestic market consumed

8/15/2019 The German Machine Tool Industry in 2011
http://slidepdf.com/reader/full/the-german-machine-tool-industry-in-2011 55/84
WeltmarktWorld market
53
more than 90% of the total production. This results in anextremely small 8% share of exports for China’s producers.The Swiss machine tool industry exported 89% of its
production, a ratio which is traditionally very high.Taiwan (76% export ratio), Germany (70%) and Italy (69%)were also heavily export-oriented. In contrast, South Koreaand the USA demonstrated a stronger tendency to servetheir own domestic markets: Their export ratios (41% and45%, respectively) were much lower than those of theother countries.
China absorbs 37% of the world’s production
The parameters “production” and “exports” highlight the
manufacturers’ perspective – i.e., they indicate the majorcentres where machine tools are produced. “Imports” and“consumption” on the other hand, describe the market side– where machine tools are primarily purchased and used.Consumption here is determined mathematically as pro-duction minus exports plus imports, and can also be referredto as market volume. The VDW sets production equal toconsumption on the world level by definition, which meansthat the worldwide volume of machine tools produced and“consumed” in 2011 was EUR 62.4 billion. This also logicallyinfers the equivalence of world exports and world imports(2011: EUR 32.8 billion).
90% der kompletten Produktion auf. Dies entspricht einemäußerst niedrigen Exportanteil von 8% für Chinas Produ-zenten. Eine traditionell sehr hohe Exportquote von 89%
kennzeichnet die Werkzeugmaschinenindustrie in derSchweiz. Auch Taiwan (Exportquote 76 %), Deutschland(70 %) und Italien (69%) weisen eine starke Exportorien-tierung auf. Südkorea und die USA bedienen hingegenstärker den eigenen Markt, die Ausfuhrquote ist im inter-nationalen Vergleich mit 41% und 45 % deutlich niedriger.
China absorbiert 37 % des Weltverbrauchs
Die Größen Produktion und Export beleuchten die Her-stellerseite – wo liegen also die wesentlichen Zentren der
Erzeugung von Werkzeugmaschinen? Import und Verbrauchbeschreiben dagegen die Marktseite – wo werden Werk-zeugmaschinen vor allem gekauft und eingesetzt? DerVerbrauch wird dabei rechnerisch ermittelt aus Produktionminus Export plus Import und kann auch als Marktvolu-men bezeichnet werden. Der VDW setzt definitorisch auf Weltebene Produktion und Verbrauch gleich, das heißt,das weltweite Volumen an produzierten und „verbrauch-ten“ Werkzeugmaschinen beträgt in 2011 62,4 Mrd. EUR.Dies bedeutet sinnvollerweise auch eine Gleichsetzungvon Weltexport und Weltimport (2011: 32,8 Mrd. EUR).
5 679
5 075
2 462
2 218
1 555
1 266
1 176
955
48 4
484
8 174
6 793
3 092
2 909
2 221
1 653
1 346
1 185
660
627
7 127
1 911
1 442
1 089
883
714
706
912
526
691
9 541
3 107
2 141
1 286
1 180
1 006
912
844
790
786
USAUSA
DeutschlandGermany
ItalienItaly
SchweizSwitzerland
TaiwanTaiwan
China*China*
SpanienSpain
FrankreichFrance
USAUSA
ItalienItaly
DeutschlandGermany
China*China*
2011 2010 2011 2010
Export in Mio. EURExports in mill. EUR
Import in Mio. EURImports in mill. EUR
JapanJapan
SüdkoreaSouth Korea
BelgienBelgium
SüdkoreaSouth Korea
IndienIndia
MexikoMexico
BrasilienBrazil
RusslandRussia
* VDW-Bereinigung desExportvolumens umeinfachste Maschinen(vgl. Anhang, methodischeHinweise, z. B. 2011 um32,0 %)Hinweis: Ohne Teile,Zubehör; 2011 =SchätzungenQuellen: VDW, VDMA,nationale Verbände,Gardner Publications* VDW correction of theexport volume for “cheap
and simple” machines(see appendix, methodicalcomments, e.g. 2011 by32.0%)Note: excluding parts,accessories; 2011 =estimatesSources: VDW, VDMA,national associations,Gardner Publications
Werkzeugmaschinen-Export und -Import: Top-10-Länder weltweitMachine tool exports and imports: top 10 countries worldwide

8/15/2019 The German Machine Tool Industry in 2011
http://slidepdf.com/reader/full/the-german-machine-tool-industry-in-2011 56/84

8/15/2019 The German Machine Tool Industry in 2011
http://slidepdf.com/reader/full/the-german-machine-tool-industry-in-2011 57/84
WeltmarktWorld market
55
vergleichsweise schwach und erreicht nur ca. 60% desNiveaus der guten Jahre 2007 bzw. 2008. Mit 2,2 Mrd. EURVerbrauch erzielt das Land einen Weltanteil von 3,5 %.Auf den Plätzen 7, 8 und 10 beweisen die drei BRIC-Märkte
Indien (1,7 Mrd. EUR, 2,7%), Brasilien (1,6 Mrd. EUR, 2,5 %)und Russland (1,1 Mrd. EUR, 1,7%) ihre in den letzten Jahrenerheblich gestiegene Bedeutung als Nachfrager von Werk-zeugmaschinen. Dazwischen schiebt sich Taiwan aufPosition 9 (1,5 Mrd. EUR, 2,4%).
Auch als Importeur dominiert China das weltweite Gesche-hen, im Vergleich zum Verbrauch allerdings in etwas ge-ringerem Ausmaß. Mit 9,5 Mrd. Einfuhrwert absorbiert dieVolksrepublik 29,1 % des weltweiten Importaufkommens.Die Importquote liegt aktuell bei 42%, hat sich aber seit2007 sehr spürbar um 15 Prozentpunkte reduziert einklarer Beleg für die aus industriepolitischen Gründenangestrebte zunehmende Versorgung des Marktes durchEigenproduktion (originär chinesische Hersteller, Trans-plants, Joint Ventures). Zu den Maßnahmen zählen dieStärkung größerer Unternehmenseinheiten, eine weitere
Erhöhung der eigenen technologischen Wettbewerbs-fähigkeit, aber auch die Rückführung von Zoll- und Um-satzsteuerpräferenzen bei der Einfuhr technologischhochstehender Investitionsgüter.
Nummer 2 in der Importrangliste sind die USA mit 3,1 Mrd.EUR und 9,5 % Weltanteil. Der recht hohe Einfuhranteilliegt aktuell bei 65%. Deutschland selbst belegt mit Ein-fuhren in der Höhe von 2,1 Mrd. EUR und 6,5% Anteil dendritten Rang (Importquote ca. 40%). Auf Position 4 folgtSüdkorea, das für 1,3 Mrd. EUR Werkzeugmaschinen im-
portiert, allerdings mit seinen lokalen Herstellern immer-hin 65 % des Marktes selbst bedient. In den Top 10 folgendann Indien, Brasilien, Mexiko, Russland, Frankreich undItalien. Mit Ausnahme von natürlich Italien und teils auchBrasilien decken diese Länder ihren Bedarf sehr stark überausländische Technologie ab. Die Einfuhrquoten bewegensich in einer Bandbreite von 70% (Indien) bis 93% (Mexiko.)
Korea, which took fifth place with EUR 3.7 billion and a5.9% share. The next country in line, Italy, grew at a rela-tively weak 8% rate and reached only about 60% of thelevel it achieved during the good years of 2007 and 2008.
With a consumption of EUR 2.2 billion, the country repre-sented a 3.5% world share. In ranks 7, 8 and 10, the three BRICmarkets India (EUR 1.7 billion, 2.7%), Brazil (EUR 1.6 billion,2.5%) and Russia (EUR 1.1 billion, 1.7%) provided proof thattheir demand for machine tools has considerably increasedin recent years. Taiwan jockeyed for position among themin ninth place (EUR 1.5 billion, 2.4%).
China dominated worldwide activity also as an importer,albeit to a somewhat lesser degree than as a consumer.With EUR 9.5 billion in imports, the People’s Republic ab-sorbed 29.1% of the world’s import volume. The importratio during the period under review was 42%, but it hasfallen by a very considerable 15 percentage points since2007. This is a clear indication of China’s intentions (forreasons of industrial politics) to supply more of the domes-tic market through its own production capacities (original
Chinese companies, transplants and joint ventures). Themeasures taken have included not only strengtheninglarger business units and further enhancing the country’sown technological competitiveness, but also rolling backcustoms and sales tax relief for importers of technologicallyadvanced capital goods.
Number 2 on the list of importing countries was the USAwith EUR 3.1 billion and a 9.5% world share. The import ratioduring the period under review was rather high (65%). WithEUR 2.1 billion in imports and a 6.5% world share, Germany
itself occupied third place (import ratio: about 40%). SouthKorea followed in fourth place with EUR 1.3 billion in ma-chine tool imports, while its local manufacturers still served65% of the domestic market themselves. Rounding outthe Top 10, it was then followed by India, Brazil, Mexico,Russia, France and Italy. With the exception of Italy, of course,and also Brazil to some extent, these countries relied veryheavily on foreign technology to cover their needs. Theimport ratios ranged from 70% (India) to 93% (Mexico).
China setzt auf zunehmende Versorgungdurch Eigenproduktion
China increasingly relies on supply fromits own production

8/15/2019 The German Machine Tool Industry in 2011
http://slidepdf.com/reader/full/the-german-machine-tool-industry-in-2011 58/84
56
0
360
720
1 080
1 440
1 800
0
50
100
150
200
250
0
1 400
2 800
4 200
5 600
7 000
0
2
4
6
8
10
1 800
0,0
2,5
5,0
7,5
10,0
12,5
0
1,3
2,6
3,9
5,2
6,5
0
10
Japan (Mrd. Yen) Japan (bill. Yen) Deutschland (Mrd. EUR) Germany (bill. EUR)
Italien (Mrd. EUR) Italy (bill. EUR) China (Mrd. RMB.¥ )* China (bill. RMB.¥ )*
Südkorea (Mrd. Won) South Korea (bill. Won) USA (Mrd. US-$)USA (bill. US-$)
Produktion Production Verbrauch Consumption
02 03 04 05 06 07 08 09 10 11 02 03 04 05 06 07 08 09 10 11
02 03 04 05 06 07 08 09 10 11 02 03 04 05 06 07 08 09 10 11
02 03 04 05 06 07 08 09 10 11 02 03 04 05 06 07 08 09 10 11
* VDW-Bereinigung umeinfachste Maschinen(vgl. Anhang, methodischeHinweise, z. B. 2011 Produk-tion und Export um 32,0 %=> Verbrauch um 21,0 %)Hinweis: Ohne Teile,Zubehör; 2011 =SchätzungenQuellen: VDW, VDMA,nationale Verbände* VDW correction for“cheapand simple”machines (see appendix,methodical comments,e.g. 2011 production andexports by 32.0% =>consumption by 21.0%)Note: excluding parts,accessories; 2011 =estimatesSources: VDW, VDMA,national associations
Werkzeugmaschinen-Produktion und -Verbrauch ausgewählter Länder (in nationaler Währung)Machine tool production and consumption of selected countries (in national currency)
Maßstab für die tatsächliche Performance
Wie schon eingangs erläutert spiegelt sich die Entwicklungder nationalen Werkzeugmaschinenindustrien allein inDarstellungen wider, die in jeweils eigener Währungerzielte Jahresergebnisse im mittelfristigen Volumenver-gleich zeigen und somit die Einordnung im Zeitablauf ermöglichen. Verzerrungen durch den Wechselkurs sind
Yardstick for actual performance
As already mentioned at the outset, the growth of localmachine tool industries can only be visualised in diagramsthat show annual results achieved in the relevant homecurrency comparing volume over the medium-term andthereby making it possible to present a chronologicalframework. Exchange rate effects are thereby excluded.

8/15/2019 The German Machine Tool Industry in 2011
http://slidepdf.com/reader/full/the-german-machine-tool-industry-in-2011 59/84
WeltmarktWorld market
57
damit ausgeschlossen. Unsere in dieser Weise strukturiertenCharts zeigen dies exemplarisch für die sechs größtenMärkte bzw. Produzentenländer.
Dies sei am Beispiel Japan verdeutlicht. Die Entwicklungauf Yen-Basis zeigt offensichtlich, dass der japanischeMarkt mit großen Schwierigkeiten zu kämpfen hat undnoch deutlich, nämlich um 38%, unter dem 2006 erzieltenRekordlevel verharrt. Auch die Produktion kommt nochnicht an das Spitzenniveau heran. Eine Darstellung inEuro würde hier fälschlicherweise neue Rekordstände inder Produktion suggerieren.
Ein ähnliches Verlaufsmuster gilt für Italien, das marktseitig satte 40% vom bisherigen Höchststand entferntist. Deutschland und die USA bleiben im Verbrauch um24 % bzw. 19% unter dem jeweiligen nationalen Rekord-niveau. China und Südkorea eilen hingegen stetig zu neuenHöchstständen. Nur das einzigartige Krisenjahr 2009bildet eine Ausnahme und bedeutet für China marktbezo-gen Stagnation (nicht in der Produktion!) und für Südkoreaeinen schärferen Einbruch in der Entwicklung.
Structured in this way, our charts illustrate this for the sixlargest markets and producing countries.
Japan is a good example. On a yen basis, the trend clearly
shows that the Japanese market had serious difficultiesto contend with and that it obviously remained miredwell below (–38%) the record level attained in 2006.Production also continued to fall short of the peak level.Presenting these data in euros would erroneously suggestnew record levels of production.
Following a similar curve, Italy’s market was a full 40%below its all-time high. In terms of consumption, Germanyand the USA remained 24% and 19% below their respectivenational record levels. China and South Korea, by contrast,hurdled continuously towards new all-time highs. Theunique crisis year of 2009 constituted the only exception.For China it meant market-related (but not production-related) stagnation and for South Korea it triggered asteep decline in development.

8/15/2019 The German Machine Tool Industry in 2011
http://slidepdf.com/reader/full/the-german-machine-tool-industry-in-2011 60/84

8/15/2019 The German Machine Tool Industry in 2011
http://slidepdf.com/reader/full/the-german-machine-tool-industry-in-2011 61/84
Strukturdaten der WerkzeugmaschinenindustrieStructural data of the machine tool industry
Auf einem hochdynamischen 5-achsigen Bearbeitungszentrum werden mittels Tannenbaumnutfräsern und einem trochoidalenFräsverfahren Beschaufelungsnuten an einem FanDisk hergestellt . FanDisks finden ihren Einsatz im Bereich der Energieerzeugung.Vorteile dieses Verfahrens sind die Erhöhung der Standzeit bei einer sehr hohen Oberflächengüte. Des Weiteren entfällt das Vorfräsen,die Prozesssicherheit wird erhöht und das Verfahren ist eine kostengünstige Alternative zum Räumen.
On a highly dynamic 5-axis machining centre, pine-tree groove cutters and a trochoidal milling process are used to cut blade mounting grooves in a FanDisk. FanDisks are used in power generation applications. Benefits of this method include longer tool life and very highsurface quality. It also eliminates the need for pre-milling, increases process reliability and represents a cost-effective alternative toclearing operations.

8/15/2019 The German Machine Tool Industry in 2011
http://slidepdf.com/reader/full/the-german-machine-tool-industry-in-2011 62/84

8/15/2019 The German Machine Tool Industry in 2011
http://slidepdf.com/reader/full/the-german-machine-tool-industry-in-2011 63/84
StrukturdatenStructural data
61
Sinne (Verbandsschätzung) stehen 474 Betriebe nach Zähl-muster des Statistischen Bundesamtes gegenüber. Diesesbezieht allerdings deutlich mehr kleinere Anbieter von Teilenund Zubehör für Werkzeugmaschinen ein.
Detaillierte Aussagen zur Branchenstruktur lassen sichanhand von Ergebnissen aus der Verbandsstatistik treffen.Die für 2011 ermittelten Kennzahlen sind näherungsweiseauf die Branche insgesamt übertragbar. Danach beschäf-
tigten 2011 etwa 57 % der Unternehmen höchstens 250Mitarbeiter, erwirtschafteten 18% (Vorjahr: knapp 19 %) desgegenüber 2010 um 33% gestiegenen Produktionswertsund stehen für ebenfalls 18% (2010: 20 %) des Beschäftigten-potenzials. 24% der Anbieter (2010 ebenfalls 24 %) rangierenim Betriebsgrößenbereich zwischen mehr als 250 und maxi-mal 500 Mitarbeitern, erzielen 25% (2010: 26%) des Gesamt-produktionswerts und beschäftigen knapp 26% der Mitar-beiter im Industriezweig (2010: knapp 27%). Etwa 19% derFirmen beschäftigen nominell mehr als 500 Personen (da-von eine wachsende Zahl mit über 1.000 Beschäftigten) und
konzentrieren auf sich knapp 58% des Produktionswertsund 56 % der „Workforce“. Die nähere Betrachtung zeigt,dass sich die Anzahl dieser „Main Players“ letztlich auf 15Firmenkonglomerate reduziert. Der ausgewiesene Prozent-satz (besagte 19%) geht nämlich auf die Erfassung einzelner,im Rahmen von Unternehmensgruppen selbstständigoperierender Tochterfirmen zurück.
Gegenüber der vorherigen Erhebung zeigt diese Struktur,dass die beiden „unteren“ Betriebsgrößenklassen ihrenaturgemäß eher bescheidenen Anteile am Produktionswertder Branche knapp gehalten haben. Auch innerhalbder beiden „mittleren“ Größenklassen gab es kaum Ver-schiebungen. Die Anzahl der Betriebe im Segment bis
throughout Germany in the narrower sense of the term(as estimated by the association) contrasts with the 474businesses listed according to the methodology used by theGerman Federal Office for Statistics. The latter figure, how-ever, includes significantly more smaller manufacturers of parts and accessories for machine tools.
More detailed conclusions on sector structure can be drawnfrom the results listed in the association’s statistics. The key
indicators determined for 2011 can be approximately extra-polated to the industry as a whole. They report that about 57%of the companies employed a maximum of 250 staff. Thosecompanies generated 18% (2010: nearly 19%) of total produc-tion value, which increased by 33% versus the previous year.They also represented 18% of the employment potential(2010: 20%). Some 24% of manufacturers (2010: likewise24%) ranged in size from more than 250 up to a maximum of 500 employees. They achieved 25% (2010: 26%) of the totalproduction value and employed nearly 26% of the personnelin this industrial sector (2010: nearly 27%). About 19% of the
companies employed more than 500 people (including agrowing number of companies with more than 1,000employees) and those companies generated nearly 58% of the gross value of production with 56% of the workforce.Closer observation reveals that these key players ultimatelyboiled down to 15 conglomerates. The percentage listed (i.e.the 19% mentioned above) actually derives from the regis-tration of individual, independently operating subsidiarieswithin the framework of corporate groups.
Compared to the previous survey, this structure reveals thatboth of the “lower” company size classifications barelymaintained their earlier shares of the sector’s productionvalue, which are naturally rather modest. Nor were there
Regionale Verteilung der deutschen Werkzeugmaschinenindustrie (%-Anteile)*Geographical distribution of the German machine tool industry (%-shares)*BundeslandGerman laender Betriebe Companies BeschäftigteEmployment ProduktionProduction
2009 2010 2011 2009 2010 2011 2009 2010 2011
Baden-WürttembergBaden-Württemberg 44,7 42,5 42,9 49,6 48,8 49,3 49,3 50,8 54,4Nordrhein-WestfalenNorth Rhine-Westphalia 16,3 17,7 18,1 14,0 16,9 15,6 17,3 20,3 16,9BayernBavaria 13,0 13,3 14,3 21,0 19,8 21,0 19,4 16,7 17,4ThüringenThuringia 6,5 7,1 7,6 5,5 5,3 5,6 4,7 4,8 4,7HessenHesse 6,5 5,3 5,7 2,3 1,9 1,9 2,2 1,4 1,3SachsenSaxony 4,9 5,3 5,7 4,2 3,8 4,0 4,3 2,8 3,0SonstigeOthers 8,1 8,8 5,7 3,5 3,4 2,6 2,9 3,1 2,4GesamtTotal 100,0 100,0 100,0 100,0 100,0 100,0 100,0 100,0 100,0
vorläufig/preliminary* auf Basis der Meldungen von Mitgliedsfirmen des VDW und des Fachverbandes Werkzeugmaschinen im VDMA* based on reports from member companies of VDW and VDMA section Machine Tools

8/15/2019 The German Machine Tool Industry in 2011
http://slidepdf.com/reader/full/the-german-machine-tool-industry-in-2011 64/84

8/15/2019 The German Machine Tool Industry in 2011
http://slidepdf.com/reader/full/the-german-machine-tool-industry-in-2011 65/84
Automobil- und Zulieferindustrie*Automotive industry and components supplier*36,6 %
MaschinenbauMechanical engineering29,8 %
ElektroindustrieElectrical industry
4,4 %
SonstigeOthers3,1 %
Sonstiger Fahrzeugbau, SchiffbauOther vehicles, shipbuilding
4,2 %
Feinmechanik und OptikPrecision mechanics and optics2,6 %
Luft- und RaumfahrtAerospace
2,8 %Lohnarbeit
Job shops3,0 %
Metallerzeugung und -bearbeitung,Metallerzeugnisse
Metals, metal products13,5 %
63StrukturdatenStructural data
Kundenstrukturen: Marktforschung belegt die besondereBedeutung der Automobilindustrie und des Maschinenbaus
Der Ansatz des Verbandes zielt hier auf die Verteilung derJahresproduktion nach Anwendergruppen im In- und Aus-land ab. Eine kurzfristig angelegte Untersuchung solcherArt (zweijähriger Turnus, Erhebung für das Jahr 2011 steht2012 an) ist in qualitativer Hinsicht besonders stichproben-abhängig. Je nach Programm- und Kundenstruktur derFirmen im Melderkreis schlägt unterschiedliches Beschaf-fungsverhalten der Abnehmer voll durch. Während kleinereund mittelständische Kunden aus dem Maschinenbau undder Elektroindustrie, je nach konjunkturellem Barometer-stand und individuell gehandhabten Regeln kaufmännischer
Vorsicht, Investitionsvorhaben strecken oder vertagen, kannder Anteil relativ konjunkturautonomer Projekte der Groß-industrie sehr hoch ausfallen. Das flächendeckend durch-schlagende Krisenjahr 2009 hat derartige Strukturen einStück weit nivelliert. Wäre diese Untersuchung für 2010anzustoßen gewesen, hätte enorm dynamisch anspringendeInvestitionstätigkeit der Automobilindustrie die Dominanzautomobiler Anwendungen noch klarer bestätigt.
Ein Problem besteht in unscharfen Branchenabgrenzungen:Wo endet Autoelektronik, deren Hersteller als Automobil-zulieferer deklariert sind, und was gehört unter das Label„Elektroindustrie“? Gleiches gilt für den Bereich der Herstel-lung von Metallerzeugnissen (siehe Zulieferer von Schlössern
Customer structures – market research confirms the specialsignificance of the automotive industry and mechanicalengineering
The association’s approach here examines the distributionof annual production within Germany and abroad accord-ing to user groups. The quality of a near-term study of thiskind (two-year cycle, survey for 2011 being carried out in 2012)is particularly dependent on random samples. The productrange and customer structure of the individual companiessurveyed can exaggerate the effect of customers’ variousprocurement practices. Smaller and medium-sized customers in the electrical and electronics industry and themechanical engineering sector tend to stretch or postpone
investment projects in line with economic indicators andindividually implemented principles of commercial pru-dence. As a result, the less economy-sensitive projects of the larger corporations can have a very strong impact. Withits shattering effect throughout the industry, the crisis yearof 2009 levelled out such structures to some extent. Hadthis study been undertaken for 2010, the tremendouslydynamic leap in the investment activity of the automotiveindustry would have confirmed the dominance of automo-tive applications even more clearly.
The lack of clear boundaries between segments poses a prob- lem: Where does the “automotive electronics” sector – wheremanufacturers are considered as automotive suppliers – end,
* Automobilindustrie:19,4 %, Zulieferer: 17,2 %Quelle: VDW-Verbands -statistik* Automotive industry:19.4%, Componentssupplier: 17.2%Source: VDW association’sstatistics
Abnehmerbranchen der deutschen WerkzeugmaschinenindustrieCustomer branches of the German machine tool industry
Prozentuale Verteilung des Produktionswertes2009 Percental distribution of the production value2009

8/15/2019 The German Machine Tool Industry in 2011
http://slidepdf.com/reader/full/the-german-machine-tool-industry-in-2011 66/84
64
und Beschlägen). Der Verband priorisiert die bei den Werk-zeugmaschinenherstellern gebräuchliche Sprachregelung.Unter Marktforschungsaspekten erklärtes Ziel ist es, dieBedeutung besonders volumenstarker Anwenderindustrien,
wie z. B. des Automobil- oder Maschinenbaus, in ihrerGesamtheit darzustellen.
Die Automobilindustrie inklusive ihrer Systemlieferantenund Zulieferer baut selbst im Krisenjahr 2009 ihre Stellungals wichtigste Abnehmerbranche mit einem wertmäßigenAnteil von 36,6% aus. Im Vergleich zu 2007 bedeutet dieseine Steigerung um sechs Prozentpunkte. WesentlicheUrsache hierfür ist der Absatzmarkt China, der in der welt-weiten Rezession als Stabilitätsanker wirkt und von anhal-tender Investitionsdynamik gerade im Automobilsektorgeprägt ist. Der Maschinenbau als zweitgrößter Kunde mitseinen vielfältigen Teilbranchen hält einen gegenüber 2007stabilen Anteil von knapp 30%. Innerhalb des Maschinen-baus stellt der Werkzeugmaschinenbau selbst die größteTeilbranche. Weitere wichtige Segmente sind Antriebs-technik, Verfahrenstechnik/Energiewirtschaft, Stanzwerk-zeuge/Formenbau sowie Kraftmaschinen/Turbinen.
Nach den Hauptkunden Automobilindustrie und Maschinen-bau, die zusammen für zwei Drittel des Absatzes stehen,
spielen die Metallerzeugung- und -bearbeitung (Anteil: 8,2%;vor allem Stahlproduktion, Walzwerke) sowie die Herstel-lung von Metallerzeugnissen (5,3 %; z. B. Stahl-/Leichtmetall-bau, Press-/Stanz-/Drehteile, Kesselbau, Drahtwaren sowieunterschiedlichste Metallwaren) eine wichtige Rolle. Zuden weiteren bedeutenden Kundengruppen zählen Elektro-technik (4,4 %), sonstiger Fahrzeugbau (4,2%, inkl. Schienen-fahrzeuge, Schiffbau), Lohnarbeit (3,0%), Luft- und Raumfahrt(2,8%) sowie Feinmechanik/Optik (2,6%; inkl. Medizintechnik).
Eine tendenziell andere Gewichtung ergibt sich bei der
Betrachtung des stückzahlmäßigen Absatzes. Hier führtder Maschinenbau mit einem Anteil von knapp 32%, dieAutomobilindustrie und ihre Zuliefersparten folgen mit 27%.Dies erklärt sich mit dem höheren Anteil des Projektge-schäfts beim Kunden Automobilindustrie, charakterisiertdurch den Einsatz von werkstückspezifischen Sonder-maschinen und komplexen Fertigungslinien.
and what actually belongs under the “electrical and elec-tronics industry” heading? The same applies for the metalproducts manufacturing sector (cf. locks and fittings sup-pliers). The association favours the terminology typically
used by machine tool suppliers. From a market research pers-pective, the declared objective is to indicate the significanceof particularly high-volume user industries like the automo-tive industry or mechanical construction in their entirety.
Even in the crisis year of 2009, the automotive industry to-gether with its component and system suppliers reinforcedits position as the largest client sector with a value share of 36.6%. This represents an increase of six percentage pointsover 2007. The main reason for this rise was the Chinese mar-ket, which is having a stabilising effect during the worldwiderecession and is characterised by a constant investment mo-mentum, especially in the automotive sector. As the secondlargest customer sector together with its many differentsub-segments, machinery construction maintained a nearly30% share, which was stable relative to 2007. Within machin-ery construction, machine tool construction itself representsthe single biggest sub-segment. Other major segmentsinclude drive system technology, process engineering/energymanagement, mould and die making, and power machinery/turbines.
Taken together, these two main customer segments – theautomotive industry and machinery construction – representtwo thirds of all sales. They are followed by metal productionand metalworking (8.2% share, above all steel production androlling mills) and the manufacture of metal products (5.3%share, e.g. steel / lightweight metal construction, pressed/punched/turned parts, boiler construction, wire products andan extremely wide range of metal goods), which also play animportant role. The other important customer categoriesinclude electrical technology (4.4%), other vehicle construc-
tion (4.2%, including rail vehicles and shipbuilding), wagelabour (3.0%), aerospace (2.8%) and precision mechanics/optics (2.6%, including medical technology).
Viewing performance-based unit sales tends to weight theresults differently. In that case, machinery construction leadswith a share of nearly 32%, while the automotive industry andits supplier segments follow with 27%. This can be explainedby the higher share of project business with the automotiveindustry customer segment, which is characterised by the useof workpiece-specific special machines and complex assemblylines.

8/15/2019 The German Machine Tool Industry in 2011
http://slidepdf.com/reader/full/the-german-machine-tool-industry-in-2011 67/84
Statistischer Anhang, methodische Hinweise, VDW-MitgliedsfirmenStatistical appendix, methodical comments, VDW member companies
CBN-Hochgeschwindigkeitsschleifen von Außen-, Innendurchmesser sowie Planschulter an Getriebewellen in einer Einspannung. Dankvollautomatisiertem Schleifprozess kann die Ausbringungsmenge auf mehrere hunderttausend Getriebewellen pro Jahr gesteigertwerden. Hochwertige Maschinenkomponenten wie hydrostatische Rundführungen sorgen für hohe Qualitäten am Endprodukt undtragen dazu bei, die Lebensdauer moderner Getriebe zu verlängern.
CBN high-speed grinding of outer and inner diameters along with flat shoulders on transmission shafts in a single clamping. The fully automated grinding process makes it possible to raise the output to several hundred thousand transmission shafts per year. Sophisticated machine components such as hydrostatic guides ensure high-quality end products and help extend the service life of modern transmissions.

8/15/2019 The German Machine Tool Industry in 2011
http://slidepdf.com/reader/full/the-german-machine-tool-industry-in-2011 68/84
67 Historische Zeitreihen der deutschen Werkzeugmaschinenindustrie68 Werkzeugmaschinen-Produktion und -Außenhandel Deutschlands nach Maschinengruppen69 Deutscher Werkzeugmaschinen-Import nach Ländern und Regionen70 Deutscher Werkzeugmaschinen-Export nach Ländern und Regionen
72 Welt-Werkzeugmaschinen-Statistik74 Jahresdurchschnittskurse des Euro74 Methodische Hinweise zur Weltstatistik
67 Historical time series of the German machine tool industry68 German machine tool production and trade by machinery groups69 German machine tool imports by countries and regions70 German machine tool exports by countries and regions72 World machine tool statistics74 Annual average rates of the Euro74 Remarks on the methodology for world statistics

8/15/2019 The German Machine Tool Industry in 2011
http://slidepdf.com/reader/full/the-german-machine-tool-industry-in-2011 69/84

8/15/2019 The German Machine Tool Industry in 2011
http://slidepdf.com/reader/full/the-german-machine-tool-industry-in-2011 70/84

8/15/2019 The German Machine Tool Industry in 2011
http://slidepdf.com/reader/full/the-german-machine-tool-industry-in-2011 71/84
AnhangAppendix
69
Deutscher Werkzeugmaschinen-Import nach Ländern und RegionenGerman machine tool imports by countries and regions
Maschinen (Mio.EUR) Teile, Zubehör (Mio.EUR) Gesamt (Mio.EUR) Gesamt (%-Ant.) Gesamt (%-VR)Machines (mill.EUR) Parts, accessories (mill.EUR) Total (mill.EUR) Total (%-share) Total (%-change)
2009 2010 2011 2009 2010 2011 2009 2010 2011 2010 2011 2010 2011GesamtimportTotal imports 1 615,2 1 442,42 140,7 505,6 540,4 678,6 2 120,9 1 982,8 2 819,3 100,0 100,0 –7 +42FrankreichFrance 42,2 41,1 50,6 18,7 15,5 20,9 60,9 56,6 71,5 2,9 2,5 –7 +26Belgien/Lux.Belgium/Lux. 11,7 11,8 12,5 7,2 4,4 6,5 19,0 16,2 18,9 0,8 0,7 –15 +17NiederlandeNetherlands 44,3 34,0 60,5 13,3 10,1 15,9 57,6 44,2 76,5 2,2 2,7 –23 +73ItalienItaly 190,0 110,8 146,3 55,4 58,4 71,0 245,4 169,2 217,3 8,5 7,7 –31 +28Verein. KönigreichUnited Kingdom 39,6 38,8 33,9 15,1 7,8 7,4 54,7 46,7 41,3 2,4 1,5 –15 –11IrlandIreland 2,2 1,1 0,8 0,2 0,3 0,4 2,4 1,3 1,1 0,1 0,0 –45 –15DänemarkDenmark 6,8 7,7 8,3 4,9 4,2 6,2 11,7 12,0 14,5 0,6 0,5 +2 +21SpanienSpain 92,4 35,9 55,3 8,8 6,4 8,3 101,2 42,3 63,6 2,1 2,3 –58 +50SchwedenSweden 12,2 8,0 6,5 7,0 8,9 9,3 19,2 16,8 15,8 0,8 0,6 –12 –6FinnlandFinland 7,4 5,3 5,2 1,8 2,1 1,6 9,2 7,4 6,8 0,4 0,2 –20 –8ÖsterreichAustria 70,5 84,7 86,8 29,2 25,7 33,1 99,7 110,4 120,0 5,6 4,3 +11 +9PolenPoland 32,7 11,3 18,1 34,1 33,3 43,8 66,8 44,6 61,9 2,2 2,2 –33 +39
Tschech. Rep.Czech Rep. 113,3 91,8 93,5 38,8 36,9 48,9 152,0 128,7 142,4 6,5 5,1 –15 +11SlowakeiSlovakia 10,5 13,8 19,2 5,8 8,9 16,0 16,2 22,8 35,3 1,1 1,3 +40 +55UngarnHungary 1,2 0,9 1,3 7,0 9,3 16,2 8,2 10,2 17,5 0,5 0,6 +25 +72RumänienRomania 2,3 2,5 1,6 5,0 3,3 5,6 7,4 5,8 7,2 0,3 0,3 –21 +23BulgarienBulgaria 3,6 3,3 5,2 3,5 2,2 2,3 7,1 5,5 7,4 0,3 0,3 –23 +35SlowenienSlovenia 1,9 5,2 8,6 11,4 7,6 12,1 13,3 12,8 20,6 0,6 0,7 –4 +61SonstigeOthers 3,4 0,4 1,9 1,5 2,0 1,9 4,9 2,4 3,8 0,1 0,1 –52 +61EU-27EU 27 688,3 508,4 616,0 268,6 247,3 327,6 956,9 755,7 943,6 38,1 33,5 –21 +25SchweizSwitzerland 444,3 452,4 714,2 118,5 156,3 184,6 562,8 608,7 898,9 30,7 31,9 +8 +48TürkeiTurkey 26,9 26,0 49,8 5,7 4,2 6,1 32,6 30,2 55,9 1,5 2,0 –7 +85RusslandRussia 3,2 2,5 1,9 1,0 0,4 0,6 4,2 2,8 2,5 0,1 0,1 –33 –12KroatienCroatia 11,2 6,5 6,8 2,2 2,9 5,6 13,5 9,4 12,4 0,5 0,4 –31 +32SonstigeOthers 4,2 3,8 3,8 5,4 6,6 12,7 9,7 10,4 16,6 0,5 0,6 +8 +59Sonstiges EuropaOther Europe 489,9 491,2 776,6 132,9 170,3 209,6 622,8 661,5 986,2 33,4 35,0 +6 +49
EuropaEurope 1 178,2 999,6 1 392,6 401,5 417,6 537,2 1 579,6 1 417,21 929,8 71,5 68,4 –10 +36AfrikaAfrica 3,3 1,0 1,8 2,4 1,2 0,9 5,7 2,2 2,7 0,1 0,1 –61 +23USAUSA 61,0 65,1 95,5 30,7 38,1 34,7 91,7 103,2 130,1 5,2 4,6 +12 +26KanadaCanada 4,4 2,9 1,7 1,2 0,9 0,5 5,6 3,7 2,2 0,2 0,1 –33 –41Nord-AmerikaNorth America 65,3 68,0 97,2 32,0 38,9 35,1 97,3 106,9 132,3 5,4 4,7 +10 +24Mittel-AmerikaMiddle America 3,1 0,3 0,3 0,3 0,3 0,4 3,4 0,5 0,7 0,0 0,0 –85 +38BrasilienBrazil 6,9 1,9 13,0 5,1 13,9 7,0 12,0 15,7 20,0 0,8 0,7 +31 +27SonstigeOthers 1,3 0,0 0,0 0,1 0,0 0,0 1,3 0,1 0,1 0,0 0,0 –96 +46Süd-AmerikaSouth America 8,2 1,9 13,0 5,1 13,9 7,0 13,4 15,8 20,1 0,8 0,7 +18 +27AmerikaAmerica 76,7 70,1 110,5 37,4 53,1 42,6 114,1 123,2 153,1 6,2 5,4 +8 +24Naher/Mittlerer OstenNear/Middle East 2,0 0,7 0,3 1,4 2,2 2,6 3,4 2,8 2,9 0,1 0,1 –16 +2IndienIndia 3,6 1,6 4,6 3,2 3,5 6,5 6,8 5,1 11,2 0,3 0,4 –25 +119SonstigeOthers 0,0 0,0 0,0 0,0 0,0 0,2 0,0 0,0 0,2 0,0 0,0 +18 +492Zentral-/Süd-AsienCentral/South Asia 3,6 1,7 4,6 3,2 3,5 6,7 6,8 5,1 11,3 0,3 0,4 –25 +121ThailandThailand 8,9 4,6 11,3 0,3 0,5 0,5 9,3 5,0 11,8 0,3 0,4 –46 +135SingapurSingapore 6,1 3,6 11,8 1,6 0,9 0,8 7,7 4,6 12,6 0,2 0,4 –41 +177ChinaChina 45,8 56,2 87,0 15,2 17,4 25,1 61,0 73,6 112,1 3,7 4,0 +21 +52SüdkoreaSouth Korea 39,2 52,9 104,0 13,2 7,4 8,0 52,4 60,3 112,1 3,0 4,0 +15 +86JapanJapan 181,7 203,0 317,3 22,7 26,3 39,0 204,4 229,4 356,3 11,6 12,6 +12 +55TaiwanTaiwan 67,3 46,8 91,1 4,5 7,3 10,7 71,7 54,2 101,7 2,7 3,6 –24 +88SonstigeOthers 1,1 0,2 1,7 1,0 1,4 1,8 2,1 1,7 3,5 0,1 0,1 –19 +107Ost-/SO-AsienEast/Southeast Asia 350,1 367,3 624,2 58,5 61,3 85,9 408,6 428,6 710,1 21,6 25,2 +5 +66AsienAsia 355,7 369,7 629,2 63,1 66,9 95,2 418,8 436,6 724,3 22,0 25,7 +4 +66Australien/OzeanienAustralia/Oceania 1,4 2,1 6,0 1,3 1,6 1,4 2,7 3,6 7,4 0,2 0,3 +37 +104Sonstige LänderOther countries 0,0 0,0 0,5 0,0 0,0 1,4 0,0 0,0 1,9 0,0 0,1EU-27EU 27 688,3 508,4 616,0 268,6 247,3 327,6 956,9 755,7 943,6 38,1 33,5 –21 +25Nicht-EU-LänderNon-EU countries 926,9 934,0 1 524,7 237,0 293,1 351,0 1 164,0 1 227,21 875,7 61,9 66,5 +5 +53
Hinweise: Warennummern des Außenhandels: Maschinen = 8456 – 8463(ohne 845691, 845699 30/50), 847940, Teile/Zubehör = 846693, 846694;%-Ant. = Prozentanteil, %-VR = prozentuale Veränderung zum VorjahrQuellen: Statistisches Bundesamt, VDW, VDMA
Note: foreign trade tariff codes: machines = 8456 – 8463(excl. 845691, 845699 30/50), 847940, parts/accessories = 846693, 846694;%-Change = percental change to previous yearSources: German Statistical Office, VDW, VDMA
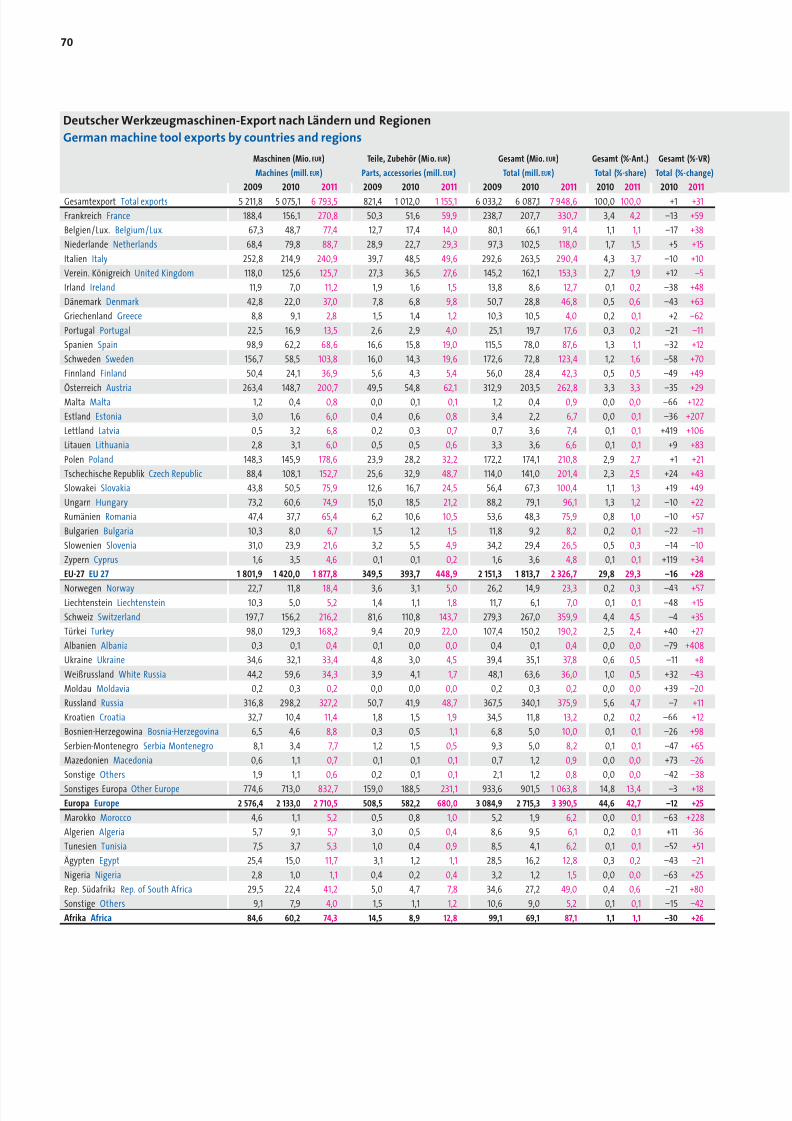
8/15/2019 The German Machine Tool Industry in 2011
http://slidepdf.com/reader/full/the-german-machine-tool-industry-in-2011 72/84
70
Deutscher Werkzeugmaschinen-Export nach Ländern und RegionenGerman machine tool exports by countries and regions
Maschinen (Mio.EUR) Teile, Zubehör (Mio.EUR) Gesamt (Mio.EUR) Gesamt (%-Ant.) Gesamt (%-VR)Machines (mill.EUR) Parts, accessories (mill.EUR) Total (mill.EUR) Total (%-share) Total (%-change)
2009 2010 2011 2009 2010 2011 2009 2010 2011 2010 2011 2010 2011GesamtexportTotal exports 5 211,8 5 075,16 793,5 821,4 1 012,01 155,1 6 033,2 6 087,17 948,6 100,0 100,0 +1 +31FrankreichFrance 188,4 156,1 270,8 50,3 51,6 59,9 238,7 207,7 330,7 3,4 4,2 –13 +59Belgien/Lux.Belgium/Lux. 67,3 48,7 77,4 12,7 17,4 14,0 80,1 66,1 91,4 1,1 1,1 –17 +38NiederlandeNetherlands 68,4 79,8 88,7 28,9 22,7 29,3 97,3 102,5 118,0 1,7 1,5 +5 +15ItalienItaly 252,8 214,9 240,9 39,7 48,5 49,6 292,6 263,5 290,4 4,3 3,7 –10 +10Verein. KönigreichUnited Kingdom 118,0 125,6 125,7 27,3 36,5 27,6 145,2 162,1 153,3 2,7 1,9 +12 –5IrlandIreland 11,9 7,0 11,2 1,9 1,6 1,5 13,8 8,6 12,7 0,1 0,2 –38 +48DänemarkDenmark 42,8 22,0 37,0 7,8 6,8 9,8 50,7 28,8 46,8 0,5 0,6 –43 +63GriechenlandGreece 8,8 9,1 2,8 1,5 1,4 1,2 10,3 10,5 4,0 0,2 0,1 +2 –62PortugalPortugal 22,5 16,9 13,5 2,6 2,9 4,0 25,1 19,7 17,6 0,3 0,2 –21 –11SpanienSpain 98,9 62,2 68,6 16,6 15,8 19,0 115,5 78,0 87,6 1,3 1,1 –32 +12SchwedenSweden 156,7 58,5 103,8 16,0 14,3 19,6 172,6 72,8 123,4 1,2 1,6 –58 +70FinnlandFinland 50,4 24,1 36,9 5,6 4,3 5,4 56,0 28,4 42,3 0,5 0,5 –49 +49
ÖsterreichAustria 263,4 148,7 200,7 49,5 54,8 62,1 312,9 203,5 262,8 3,3 3,3 –35 +29MaltaMalta 1,2 0,4 0,8 0,0 0,1 0,1 1,2 0,4 0,9 0,0 0,0 –66 +122EstlandEstonia 3,0 1,6 6,0 0,4 0,6 0,8 3,4 2,2 6,7 0,0 0,1 –36 +207LettlandLatvia 0,5 3,2 6,8 0,2 0,3 0,7 0,7 3,6 7,4 0,1 0,1 +419 +106LitauenLithuania 2,8 3,1 6,0 0,5 0,5 0,6 3,3 3,6 6,6 0,1 0,1 +9 +83PolenPoland 148,3 145,9 178,6 23,9 28,2 32,2 172,2 174,1 210,8 2,9 2,7 +1 +21Tschechische RepublikCzech Republic 88,4 108,1 152,7 25,6 32,9 48,7 114,0 141,0 201,4 2,3 2,5 +24 +43SlowakeiSlovakia 43,8 50,5 75,9 12,6 16,7 24,5 56,4 67,3 100,4 1,1 1,3 +19 +49UngarnHungary 73,2 60,6 74,9 15,0 18,5 21,2 88,2 79,1 96,1 1,3 1,2 –10 +22RumänienRomania 47,4 37,7 65,4 6,2 10,6 10,5 53,6 48,3 75,9 0,8 1,0 –10 +57BulgarienBulgaria 10,3 8,0 6,7 1,5 1,2 1,5 11,8 9,2 8,2 0,2 0,1 –22 –11SlowenienSlovenia 31,0 23,9 21,6 3,2 5,5 4,9 34,2 29,4 26,5 0,5 0,3 –14 –10ZypernCyprus 1,6 3,5 4,6 0,1 0,1 0,2 1,6 3,6 4,8 0,1 0,1 +119 +34EU-27EU 27 1 801,9 1 420,01 877,8 349,5 393,7 448,9 2 151,3 1 813,72 326,7 29,8 29,3 –16 +28
NorwegenNorway 22,7 11,8 18,4 3,6 3,1 5,0 26,2 14,9 23,3 0,2 0,3 –43 +57LiechtensteinLiechtenstein 10,3 5,0 5,2 1,4 1,1 1,8 11,7 6,1 7,0 0,1 0,1 –48 +15SchweizSwitzerland 197,7 156,2 216,2 81,6 110,8 143,7 279,3 267,0 359,9 4,4 4,5 –4 +35TürkeiTurkey 98,0 129,3 168,2 9,4 20,9 22,0 107,4 150,2 190,2 2,5 2,4 +40 +27AlbanienAlbania 0,3 0,1 0,4 0,1 0,0 0,0 0,4 0,1 0,4 0,0 0,0 –79 +408UkraineUkraine 34,6 32,1 33,4 4,8 3,0 4,5 39,4 35,1 37,8 0,6 0,5 –11 +8WeißrusslandWhite Russia 44,2 59,6 34,3 3,9 4,1 1,7 48,1 63,6 36,0 1,0 0,5 +32 –43MoldauMoldavia 0,2 0,3 0,2 0,0 0,0 0,0 0,2 0,3 0,2 0,0 0,0 +39 –20RusslandRussia 316,8 298,2 327,2 50,7 41,9 48,7 367,5 340,1 375,9 5,6 4,7 –7 +11KroatienCroatia 32,7 10,4 11,4 1,8 1,5 1,9 34,5 11,8 13,2 0,2 0,2 –66 +12Bosnien-HerzegowinaBosnia-Herzegovina 6,5 4,6 8,8 0,3 0,5 1,1 6,8 5,0 10,0 0,1 0,1 –26 +98Serbien-MontenegroSerbia Montenegro 8,1 3,4 7,7 1,2 1,5 0,5 9,3 5,0 8,2 0,1 0,1 –47 +65MazedonienMacedonia 0,6 1,1 0,7 0,1 0,1 0,1 0,7 1,2 0,9 0,0 0,0 +73 –26SonstigeOthers 1,9 1,1 0,6 0,2 0,1 0,1 2,1 1,2 0,8 0,0 0,0 –42 –38Sonstiges EuropaOther Europe 774,6 713,0 832,7 159,0 188,5 231,1 933,6 901,51 063,8 14,8 13,4 –3 +18EuropaEurope 2 576,4 2 133,0 2 710,5 508,5 582,2 680,0 3 084,9 2 715,33 390,5 44,6 42,7 –12 +25MarokkoMorocco 4,6 1,1 5,2 0,5 0,8 1,0 5,2 1,9 6,2 0,0 0,1 –63 +228AlgerienAlgeria 5,7 9,1 5,7 3,0 0,5 0,4 8,6 9,5 6,1 0,2 0,1 +11 -36TunesienTunisia 7,5 3,7 5,3 1,0 0,4 0,9 8,5 4,1 6,2 0,1 0,1 –52 +51ÄgyptenEgypt 25,4 15,0 11,7 3,1 1,2 1,1 28,5 16,2 12,8 0,3 0,2 –43 –21NigeriaNigeria 2,8 1,0 1,1 0,4 0,2 0,4 3,2 1,2 1,5 0,0 0,0 –63 +25Rep. SüdafrikaRep. of South Africa 29,5 22,4 41,2 5,0 4,7 7,8 34,6 27,2 49,0 0,4 0,6 –21 +80SonstigeOthers 9,1 7,9 4,0 1,5 1,1 1,2 10,6 9,0 5,2 0,1 0,1 –15 –42AfrikaAfrica 84,6 60,2 74,3 14,5 8,9 12,8 99,1 69,1 87,1 1,1 1,1 –30 +26

8/15/2019 The German Machine Tool Industry in 2011
http://slidepdf.com/reader/full/the-german-machine-tool-industry-in-2011 73/84
71AnhangAppendix
Maschinen (Mio.EUR) Teile, Zubehör (Mio.EUR) Gesamt (Mio.EUR) Gesamt (%-Ant.) Gesamt (%-VR)Machines (mill.EUR) Parts, accessories (mill.EUR) Total (mill.EUR) Total (%-share) Total (%-change)
2009 2010 2011 2009 2010 2011 2009 2010 2011 2010 2011 2010 2011USAUSA 330,4 318,5 602,3 90,7 118,4 121,0 421,1 436,9 723,4 7,2 9,1 +4 +66KanadaCanada 23,5 29,3 60,6 7,2 6,5 7,6 30,7 35,8 68,2 0,6 0,9 +17 +90Nord-AmerikaNorth America 353,9 347,8 662,9 97,9 124,9 128,6 451,8 472,7 791,6 7,8 10,0 +5 +67MexikoMexico 142,0 75,0 114,4 10,7 18,9 21,5 152,7 93,8 135,9 1,5 1,7 –39 +45SonstigeOthers 3,1 3,0 3,1 0,5 0,4 0,4 3,6 3,4 3,5 0,1 0,0 –6 +2Mittel-AmerikaMiddle America 145,1 78,0 117,5 11,2 19,3 21,9 156,3 97,3 139,4 1,6 1,8 –38 +43KolumbienColumbia 5,7 4,6 4,5 0,3 0,2 0,4 6,0 4,8 4,9 0,1 0,1 –20 +2VenezuelaVenezuela 1,6 6,4 3,2 1,1 2,3 0,3 2,7 8,7 3,5 0,1 0,0 +216 –60PeruPeru 4,0 2,9 2,8 0,6 0,7 1,4 4,6 3,6 4,2 0,1 0,1 –22 +16BrasilienBrazil 98,2 118,4 142,6 21,0 25,9 39,8 119,2 144,3 182,4 2,4 2,3 +21 +26ChileChile 2,8 2,1 6,2 0,5 0,8 1,1 3,3 2,9 7,3 0,0 0,1 –12 +153ArgentinienArgentina 5,5 8,3 41,1 1,8 1,6 1,3 7,3 10,0 42,4 0,2 0,5 +37 +326SonstigeOthers 3,6 5,3 2,3 0,2 0,6 0,5 3,8 5,8 2,8 0,1 0,0 +53 –52
Süd-AmerikaSouth America 121,3 148,1 202,7 25,6 32,0 44,7 146,9 180,1 247,4 3,0 3,1 +23 +37AmerikaAmerica 620,3 573,9 983,1 134,7 176,1 195,2 755,0 750,0 1 178,3 12,3 14,8 –1 +57IranIran 22,3 31,9 20,8 3,1 4,8 3,8 25,4 36,7 24,6 0,6 0,3 +44 –33IsraelIsrael 12,6 16,0 21,9 2,9 3,8 2,3 15,5 19,8 24,2 0,3 0,3 +28 +22Saudi-ArabienSaudi Arabia 23,4 28,4 43,4 5,3 4,0 3,4 28,7 32,4 46,8 0,5 0,6 +13 +44VA EmirateUnited Arab Emirates 22,3 17,0 26,4 2,8 1,7 1,8 25,1 18,7 28,2 0,3 0,4 –26 +51SonstigeOthers 22,2 20,3 38,0 2,2 1,6 1,7 24,4 21,8 39,7 0,4 0,5 –10 +82Naher/Mittlerer OstenNear/Middle East 102,8 113,6 150,5 16,3 15,8 13,0 119,1 129,4 163,5 2,1 2,1 +9 +26KasachstanKazakhstan 12,5 3,3 7,0 1,8 0,5 0,5 14,3 3,7 7,4 0,1 0,1 –74 +100UsbekistanUsbekistan 4,1 13,2 5,0 0,1 0,0 0,2 4,2 13,2 5,2 0,2 0,1 +216 –61IndienIndia 205,6 193,7 232,8 14,3 23,3 29,8 219,9 216,9 262,6 3,6 3,3 –1 +21SonstigeOthers 2,9 6,5 4,5 0,1 0,4 0,5 3,1 6,9 5,1 0,1 0,1 +125 –27Zentral-/Süd-AsienCentral/South Asia 225,2 216,6 249,3 16,3 24,2 31,0 241,5 240,8 280,3 4,0 3,5 –0 +16ThailandThailand 19,6 17,6 30,9 1,8 2,0 2,6 21,4 19,6 33,5 0,3 0,4 –8 +71
VietnamVietnam 7,3 15,5 16,6 0,3 0,4 2,5 7,7 15,9 19,1 0,3 0,2 +108 +20IndonesienIndonesia 4,6 7,5 10,2 0,6 0,7 1,3 5,2 8,2 11,5 0,1 0,1 +56 +41MalaysiaMalaysia 17,3 13,4 30,1 1,1 1,7 2,4 18,4 15,1 32,5 0,2 0,4 –18 +115SingapurSingapore 16,0 23,4 33,6 1,9 2,8 3,5 17,9 26,2 37,1 0,4 0,5 +46 +42PhilippinenPhilippines 3,4 3,2 2,6 0,4 0,7 0,6 3,9 3,9 3,3 0,1 0,0 +2 –17ChinaChina 1 223,1 1 566,22 141,8 77,4 149,9 161,0 1 300,5 1 716,12 302,8 28,2 29,0 +32 +34SüdkoreaSouth Korea 153,2 166,2 185,0 13,4 16,8 20,1 166,6 183,0 205,1 3,0 2,6 +10 +12JapanJapan 98,1 78,2 97,4 20,3 16,2 17,5 118,4 94,4 114,8 1,6 1,4 –20 +22TaiwanTaiwan 25,9 54,7 51,0 8,2 7,6 5,9 34,2 62,3 56,9 1,0 0,7 +82 –9HongkongHong Kong 12,3 10,4 6,8 1,1 2,0 2,0 13,4 12,4 8,8 0,2 0,1 –7 –29SonstigeOthers 0,8 1,5 2,8 0,5 0,1 0,1 1,3 1,6 3,0 0,0 0,0 +19 +89Ost-/SO-AsienEast/Southeast Asia 1 581,7 1 957,72 608,7 127,3 201,0 219,7 1 709,0 2 158,72 828,4 35,5 35,6 +26 +56AsienAsia 1 909,7 2 288,03 008,5 159,8 240,9 263,6 2 069,5 2 528,9 3 272,2 41,5 41,2 +22 +29Australischer BundAustralia 19,1 17,8 15,4 3,6 3,5 3,3 22,7 21,3 18,7 0,4 0,2 –6 –12NeuseelandNew Zealand 1,2 2,1 1,7 0,2 0,4 0,2 1,4 2,5 1,8 0,0 0,0 +80 –27SonstigeOthers 0,4 0,0 0,0 0,0 0,0 0,0 0,4 0,0 0,0 0,0 0,0 –96 –65Australien/OzeanienAustralia/Oceania 20,7 19,9 17,0 3,9 3,9 3,5 24,5 23,8 20,5 0,4 0,3 –3 –14Sonstige LänderOther countries 0,1 0,0 0,0 0,0 0,0 0,0 0,1 0,0 0,0 0,0 0,0EU-27EU 27 1 801,9 1 420,01 877,8 349,5 393,7 448,9 2 151,3 1 813,72 326,7 29,8 29,3 –16 +28Nicht-EU-LänderNon-EU countries 3 409,9 3 655,14 915,7 472,0 618,3 706,2 3 881,9 4 273,45 621,9 70,2 70,7 +10 +32NAFTANAFTA 495,9 422,8 777,3 108,6 143,7 150,1 604,5 566,6 927,4 9,3 11,7 –6 +64MERCOSURMERCOSUR 105,8 135,4 187,3 24,0 30,2 41,4 129,8 165,7 228,7 2,7 2,9 +28 +38ASEANASEAN 68,4 80,9 126,2 6,3 8,4 13,0 74,6 89,3 139,2 1,5 1,8 +20 +56
Hinweise: Warennummern des Außenhandels: Maschinen = 8456 – 8463(ohne 845691, 845699 30/50), 847940, Teile/Zubehör = 846693, 846694;%-Ant. = Prozentanteil, %-VR = prozentuale Veränderung zum VorjahrQuellen: Statistisches Bundesamt, VDW, VDMA
Note: foreign trade tariff codes: machines = 8456 – 8463(excl. 845691, 845699 30/50), 847940, parts/accessories = 846693, 846694;%-Change = percental change to previous yearSources: German Statistical Office, VDW, VDMA

8/15/2019 The German Machine Tool Industry in 2011
http://slidepdf.com/reader/full/the-german-machine-tool-industry-in-2011 74/84
72
Welt-Werkzeugmaschinen-Statistik (Mio. eur , ohne Teile/Zubehör)World machine tool statistics (mill. eur , excluding parts/accessories)
Quellen: Nationale statistische Ämter, Nationale Werkzeugmaschinenhersteller-Verbände,Metalworking Insiders’ Report (Gardner Publications), CECIMO (Dachverband der europäi-schen Werkzeugmaschinenhersteller-Verbände), VDMA, VDW
Sources: National Statistical Offices, National Machine Tool Builders’ Associations,Metalworking Insiders’ Report (Gardner Publications), CECIMO (European Committee of the National Machine Tool Builders’ Associations), VDMA, VDW
Produktion %-Veränderung Export %-VeränderungProduction %-Change Exports %-Change
2007 2008 2009 2010 2011 2011/10* 2007 2008 2009 2010 2011 2011/10*DeutschlandGermany 9 441 10 715 7 767 7 1669 700 +35 +35 € 6 688 7 013 5 212 5 0756 793 +34 +34 €FrankreichFrance 839 872 401 500 669 +34 +34 € 615 574 386 390 485 +24 +24 €BelgienBelgium 299 341 265 225 270 +20 +20 € 757 923 488 484 627 +30 +30€NiederlandeNetherlands 370 350 266 240 288 +20 +20 € 333 372 250 300 388 +29 +29 €ItalienItaly 5 330 5 352 3 770 3 7894 480 +18 +18 € 2 969 3 206 2 399 2 4623 092 +26 +26 €Verein. KönigreichUnited Kingdom 641 520 316 383 472 +23 +25£ 699 641 405 472 545 +15 +17 £IrlandIreland – – – – – – – 23 20 15 12 10 –12 –12 €DänemarkDenmark 86 163 52 54 65 +20 +20 € 98 102 64 67 81 21 21 €GriechenlandGreece – – – – – – – 20 14 13 11 16 +44 +44 €PortugalPortugal 53 56 45 50 53 +6 +6 € 38 33 34 33 37 +13 +13 €SpanienSpain 1 048 1 057 745 623 757 +20 +20 € 584 722 538 484 660 +36 +36 €SchwedenSweden 178 196 174 157 188 +20 +14 skr 173 163 139 122 154 +26 +20 skrFinnlandFinland 239 205 110 102 120 +18 +18 € 182 151 96 83 118 +42 +42 €
ÖsterreichAustria 651 839 645 637 721 +13 +13 € 588 700 491 582 620 +7 +7 €SchweizSwitzerland 2 585 2 738 1 556 1 8102 491 +38 +23 sfr 2 215 2 272 1 317 1 5552 221 +43 +28 sfrNorwegenNorway – – – – – – – 13 14 15 12 11 –7 –9 nkrSlowenien2 Slovenia2 80 74 48 51 63 +25 +25 € 50 38 35 34 47 +36 +36 €KroatienCroatia 60 78 62 40 48 +20 +22 K 27 25 22 12 15 +23 +26 KSerbienSerbia – – – – – – – 8 18 14 7 13 +71 –TürkeiTurkey 391 442 316 419 480 +15 +34 € 316 350 256 288 296 +3 +20€Polen2 Poland2 224 201 143 136 177 +30 +34 ZI 149 145 144 103 139 +35 +39 ZITschech. Rep.Czech Rep. 494 654 433 372 446 +20 +17 Kc 532 599 428 415 514 +24 +20 KcSlowakei2 Slovakia2 45 85 45 47 75 +60 +60 € 89 98 53 61 93 +52 +52 €Ungarn2 Hungary2 26 25 16 19 20 +10 +12 Ft 18 17 12 15 16 +8 +9 FtRumänienRomania 38 30 26 22 33 +50 +51 US-$ 57 73 50 46 59 +30 +30 US-$Bulgarien2 Bulgaria2 58 51 27 30 37 +25 +25Lw 47 48 22 25 32 +31 +31LwUkraine1 Ukraine1 – – – – – – – 40 54 49 32 – – –
RusslandRussia 296 287 145 165 189 +14+20 US-$ 96 76 46 44 45 +2 +7 US-$USAUSA 3 578 3 522 2 462 2 5182 989 +19+25 US-$ 1 209 1 287 886 1 1761 346 +14+20 US-$KanadaCanada 486 439 311 412 459 +11+12 kan$ 170 190 127 139 133 –5 –4 kan$MexikoMexico 121 112 95 125 88 –30 –27 US-$ 29 28 26 31 22 –30 –27 US-$BrasilienBrazil 845 876 512 632 627 –1 –1 US-$ 88 108 88 50 83 +67 +66 US-$ArgentinienArgentina 24 25 19 22 23 +6 +11 US-$ 7 10 15 13 11 –10 –5 US-$Iran1 Iran1 – – – – – – – – – – – – – –IsraelIsrael – – – – – – – 49 37 25 31 – – –Saudi-Arabien1 Saudi Arabia1 – – – – – – – – – – – – – –VA Emirate1 UA Emirates1 – – – – – – – – – – – – – –IndienIndia 517 463 305 580 629 +8 +16 iR 76 110 104 98 118 +21 +30 iRChina3 China3 4 565 6 256 7 467 11 26214 568 +29+30 RMB.¥ 709 883 668 897 – – –SüdkoreaSouth Korea 3 514 2 973 1 977 3 3934 052 +19+20 Won 1 325 1 298 869 1 266 – – –JapanJapan 10 893 10 876 5 331 9 04413 183 +46 +39 ¥ 5 444 5 780 3 028 5 918 – – –
TaiwanTaiwan 3 272 3 269 1 628 3 0773 851 +25+23 NT$ 2 530 2 479 1 221 2 216 – – –ThailandThailand – – – – – – – 174 153 67 181 262 +44 +46 BVietnam1 Viet Nam1 – – – – – – – – – – – – – –Philippinen1 Philippines1 – – – – – – – – – – – – – –MalaysiaMalaysia – – – – – – – 141 97 38 98 132 +35 +35 RMIndonesienIndonesia – – – – – – – 15 13 12 72 – – –SingapurSingapore – – – – – – – 171 185 87 179 – – –HongkongHong Kong – – – – – – – 14 24 12 19 – – –AustralienAustralia 131 111 111 85105 +24 +16 $A 77 70 56 57 71 +24 +16 $ASüdafrikaSouth Africa – – – – – – – 9 17 14 16 28 +74 +81 RWelt-Produktion (Mrd.EUR)World production (bill.EUR)
51,4 54,3 37,6 48,2 62,4 +30
EuropaEurope 23,5 25,3 17,4 17,021,8 +28AmerikaAmerica 5,1 5,0 3,4 3,7 4,2 +13AsienAsia 22,9 23,9 16,8 27,436,4 +33
Welt-Produktion (Mrd. US-$)World production (bill. US-$)
70,5 79,8 52,4 63,9 86,9 +37

8/15/2019 The German Machine Tool Industry in 2011
http://slidepdf.com/reader/full/the-german-machine-tool-industry-in-2011 75/84
AnhangAppendix
73
Import %-Veränderung Verbrauch %-VeränderungImports %-Change Consumption %-Change
2007 2008 2009 2010 2011 2011/10* 2007 2008 2009 2010 2011 2011/10*DeutschlandGermany 2 692 2 964 1 615 1 4422 141 +48 +48 € 5 446 6 666 4 170 3 5335 047 +43 +43 €FrankreichFrance 940 998 591 526 790 +50 +50 € 1 164 1 296 606 636 974 +53 +53 €BelgienBelgium 829 878 455 446 588 +32 +32 € 372 296 232 187 231 +23 +23 €NiederlandeNetherlands 395 383 208 257 380 +48 +48 € 432 361 224 197 280 +42 +42 €ItalienItaly 1 403 1 470 642 691 786 +14 +14 € 3 764 3 616 2 013 2 0182 175 +8 +8 €Verein. KönigreichUnited Kingdom 840 660 374 421 556 +32 +34 £ 782 539 284 332 484 +46 +48 £IrlandIreland 49 49 18 28 35 +27 +27 € – – – – – – –DänemarkDenmark 187 157 76 54 66 +23 +23 € 174 218 64 41 51 +23 +23 €GriechenlandGreece 90 110 63 40 16 –60 –60€ – – – – – – –PortugalPortugal 80 95 70 70 81 +15 +15 € 95 118 80 87 97 +11 +11 €SpanienSpain 477 444 207 210 228 +9 +9 € 940 778 414 358 325 –9 –9 €SchwedenSweden 363 356 271 165 229 +39 +32 skr 367 389 306 200 264 +32 +25 skrFinnlandFinland 151 210 104 65 85 +31 +31 € 207 263 118 84 87 +4 +4 €
ÖsterreichAustria427 526 332 305
393 +29+29 €
489 665 487 360 494+37 +37 €
SchweizSwitzerland 560 605 415 389 539 +39 +24 sfr 930 1 072 654 643 809 +26 +12 sfrNorwegenNorway 152 175 92 60 85 +42 +38 nkr – – – – – – –Slowenien2 Slovenia2 118 138 70 74 89 +21 +21 € 149 175 83 90 106 +18 +18 €KroatienCroatia 67 58 48 36 36 –1 +1 K 100 110 88 65 69 +7 +10 KSerbienSerbia 61 54 18 21 35 +65 – – – – – – – –TürkeiTurkey 722 706 356 522 739 +42 +66 € 797 798 416 653 923 +41 +66 €Polen2 Poland2 459 555 343 292 335 +15 +18 Zl 534 611 342 325 373 +15 +18 ZlTschech. Rep.Czech Rep. 463 490 211 210 344 +64 +60 Kˇc 426 544 216 166 276 +66 +61 KˇcSlowakei2 Slovakia2 203 201 114 106 202 +90 +90 € 159 189 106 92 184 +100 +100 €Ungarn2 Hungary2 223 182 100 100 114 +14 +16 Ft 232 192 104 104 119 +14 +16 FtRumänienRomania 275 265 179 131 246 +87+89 US-$ 256 222 155 108 220 +104+106 US-$Bulgarien2 Bulgaria2 74 85 46 36 43 +20 +20 Lw 85 88 50 41 48 +18 +18 LwUkraine1 Ukraine1 142 223 81 83 – – – – – – – – – –
RusslandRussia 823 1 178 769 844 912 +8 +13 US-$ 1 023 1 390 868 9651 056 +9+15 US-$USAUSA 3 119 3 314 1 622 1 9113 107 +63+71 US-$ 5 487 5 549 3 198 3 2534 750 +46+53 US-$KanadaCanada 689 605 388 459 437 –5 –4 kan$ 1 005 854 572 732 764 +4 +5 kan$MexikoMexico 1 124 969 657 706 912 +29+33 US-$ 1 217 1 053 726 800 978 +22+26 US-$BrasilienBrazil 481 844 643 7141 006 +41+41 US-$ 1 238 1 612 1 067 1 2961 550 +20+19 US-$ArgentinienArgentina 1 115 170 101 94 132 +41+48 US-$ 132 185 105 103 144 +40 +47 US-$Iran1 Iran1 134 106 117 213 – – – – – – – – – –IsraelIsrael 168 154 67 81 – – – – – – – – – –Saudi-Arabien1 Saudi Arabia1 99 163 130 124 – – – – – – – – – –VA Emirate1 UA Emirates1 159 192 145 131 – – – – – – – – – –IndienIndia 1 083 1 305 859 8831 180 +34 +43 iR 1 524 1 658 1 060 1 3651 690 +24 +33 iRChina3 China3 5 126 5 127 4 215 7 1279 541 +34+34 RMB.¥ 8 990 10 456 10 994 17 43422 924 +31+32 RMB.¥SüdkoreaSouth Korea 985 907 812 1 0891 286 +18+19 Won 3 174 2 581 1 920 3 2163 686 +15+15 WonJapanJapan 574 504 322 329 465 +41 +35 ¥ 5 907 5 600 2 625 3 6945 474 +48 +41 ¥
TaiwanTaiwan 532 515 231 524 576 +10 +8 NT$ 1 274 1 305 639 1 3831 518 +10 +8 NT$ThailandThailand 753 783 518 9471 263 +33 +35 Bt – – – – – – –Vietnam1 Viet Nam1 169 260 199 277 – – – – – – – – – –Philippinen1 Philippines1 101 96 76 129 – – – – – – – – – –MalaysiaMalaysia 465 454 297 565 511 –10 –10 RM – – – – – – –IndonesienIndonesia 213 364 238 356 – – – – – – – – – –SingapurSingapore 325 304 201 275 – – – – – – – – – –HongkongHong Kong 421 336 178 379 – – – – – – – – – –AustralienAustralia 274 264 226 227 278 +22 +14 $A 328 305 281 255 312 +23 +15 $ASüdafrikaSouth Africa 221 200 168 181 194 +7 +12 R – – – – – – –
Hinweis: 2011 = geschätzt; Verbrauch = Produktion – Export + Import*Erste Zahl= Veränderungsrate auf Basis Euro/Zweite Zahl= Veränderungsrate auf
Basis nationaler bzw. gemeldeter Währung1 Importe: VDW-Berechnungen anhand der Exporte wichtiger Länder
2 Produktion: grobe VDW-Schätzung3 Produktion und Export: VDW-Bereinigung (vgl. methodische Erläuterungen,z. B. 2011 um 32,0 % => Verbrauch 2011 um 21,0 %)Unbereinigte Chinadaten 2011 (Mio. EUR): Produktion = 21 330 (+29 %),Export = 1 735 (+24 %), Verbrauch = 29 135 (+31 %)
Wechselkurse und methodische Hinweise siehe nächste Seite
Note: 2011 = estimated; consumption = production – exports + imports*First number= change rate based on euro/second number = change rate based on
national resp. reported currency1 Imports: VDW calculations based on the exports of major countries
2 Production: rough VDW estimate3 Production and exports: VDW correction (see methodical comments;e.g. 2011 by 32.0% => consumption 2011 by 21.0%)Uncorrected Chinese data 2011 (mill. EUR): production = 21 330 (+29%),exports = 1 735 (+24%), consumption = 29 135 (+31%)
Exchange rates and methodical comments see next page
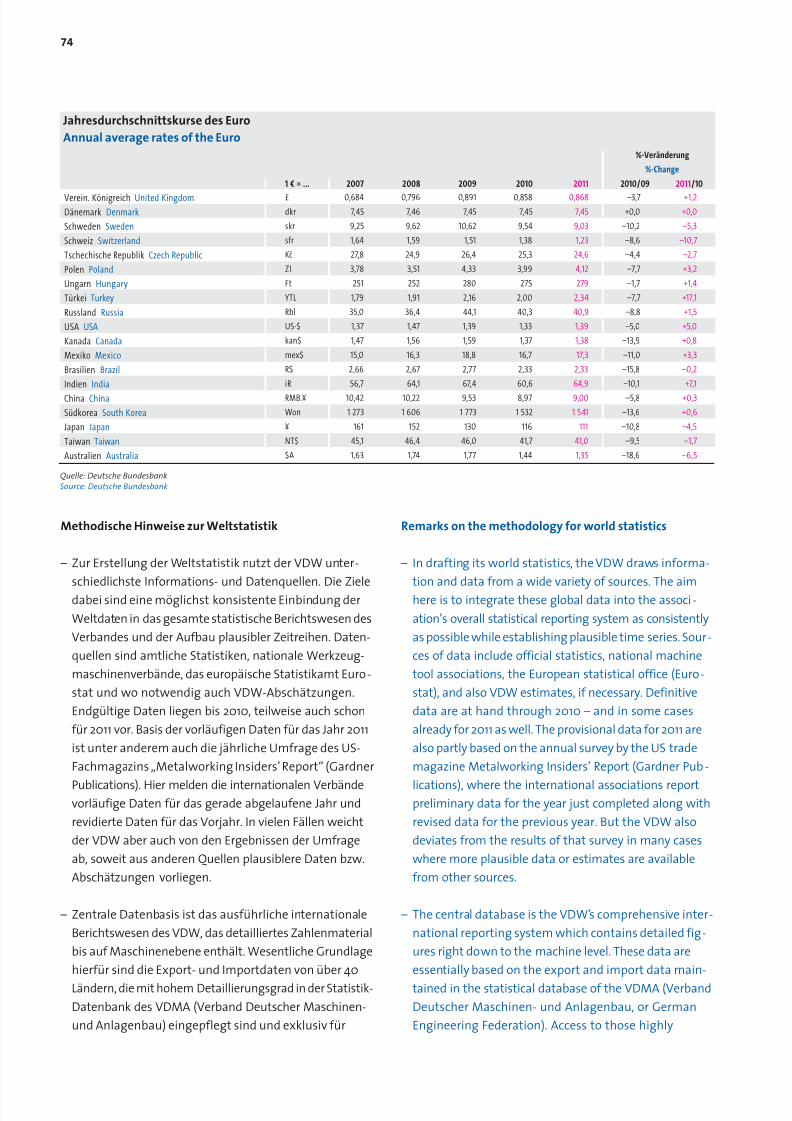
8/15/2019 The German Machine Tool Industry in 2011
http://slidepdf.com/reader/full/the-german-machine-tool-industry-in-2011 76/84
Methodische Hinweise zur Weltstatistik
– Zur Erstellung der Weltstatistik nutzt der VDW unter-
schiedlichste Informations- und Datenquellen. Die Zieledabei sind eine möglichst konsistente Einbindung derWeltdaten in das gesamte statistische Berichtswesen desVerbandes und der Aufbau plausibler Zeitreihen. Daten-quellen sind amtliche Statistiken, nationale Werkzeug-maschinenverbände, das europäische Statistikamt Euro-stat und wo notwendig auch VDW-Abschätzungen.Endgültige Daten liegen bis 2010, teilweise auch schonfür 2011 vor. Basis der vorläufigen Daten für das Jahr 2011ist unter anderem auch die jährliche Umfrage des US-Fachmagazins „Metalworking Insiders’ Report“ (Gardner
Publications). Hier melden die internationalen Verbändevorläufige Daten für das gerade abgelaufene Jahr undrevidierte Daten für das Vorjahr. In vielen Fällen weichtder VDW aber auch von den Ergebnissen der Umfrageab, soweit aus anderen Quellen plausiblere Daten bzw.Abschätzungen vorliegen.
– Zentrale Datenbasis ist das ausführliche internationaleBerichtswesen des VDW, das detailliertes Zahlenmaterialbis auf Maschinenebene enthält. Wesentliche Grundlagehierfür sind die Export- und Importdaten von über 40Ländern, die mit hohem Detaillierungsgrad in der Statistik-Datenbank des VDMA (Verband Deutscher Maschinen-und Anlagenbau) eingepflegt sind und exklusiv für
Remarks on the methodology for world statistics
– In drafting its world statistics, the VDW draws informa-
tion and data from a wide variety of sources. The aimhere is to integrate these global data into the associ-ation’s overall statistical reporting system as consistentlyas possible while establishing plausible time series. Sour-ces of data include official statistics, national machinetool associations, the European statistical office (Euro-stat), and also VDW estimates, if necessary. Definitivedata are at hand through 2010 – and in some casesalready for 2011 as well. The provisional data for 2011 arealso partly based on the annual survey by the US trademagazine Metalworking Insiders’ Report (Gardner Pub-
lications), where the international associations reportpreliminary data for the year just completed along withrevised data for the previous year. But the VDW alsodeviates from the results of that survey in many caseswhere more plausible data or estimates are availablefrom other sources.
– The central database is the VDW’s comprehensive inter-national reporting system which contains detailed fig-ures right down to the machine level. These data areessentially based on the export and import data main-tained in the statistical database of the VDMA (VerbandDeutscher Maschinen- und Anlagenbau, or GermanEngineering Federation). Access to those highly
74
Jahresdurchschnittskurse des EuroAnnual average rates of the Euro
%-Veränderung%-Change
1 € = ... 2007 2008 2009 2010 2011 2010/09 2011/10
Verein. KönigreichUnited Kingdom £ 0,684 0,796 0,891 0,858 0,868 –3,7 +1,2DänemarkDenmark dkr 7,45 7,46 7,45 7,45 7,45 +0,0 +0,0SchwedenSweden skr 9,25 9,62 10,62 9,54 9,03 –10,2 –5,3SchweizSwitzerland sfr 1,64 1,59 1,51 1,38 1,23 –8,6 –10,7Tschechische RepublikCzech Republic Kc 27,8 24,9 26,4 25,3 24,6 –4,4 –2,7PolenPoland ZI 3,78 3,51 4,33 3,99 4,12 –7,7 +3,2UngarnHungary Ft 251 252 280 275 279 –1,7 +1,4TürkeiTurkey YTL 1,79 1,91 2,16 2,00 2,34 –7,7 +17,1RusslandRussia Rbl 35,0 36,4 44,1 40,3 40,9 –8,8 +1,5USAUSA US-$ 1,37 1,47 1,39 1,33 1,39 –5,0 +5,0KanadaCanada kan$ 1,47 1,56 1,59 1,37 1,38 –13,9 +0,8MexikoMexico mex$ 15,0 16,3 18,8 16,7 17,3 –11,0 +3,3BrasilienBrazil R$ 2,66 2,67 2,77 2,33 2,33 –15,8 –0,2 IndienIndia iR 56,7 64,1 67,4 60,6 64,9 –10,1 +7,1ChinaChina RMB.¥ 10,42 10,22 9,53 8,97 9,00 –5,8 +0,3SüdkoreaSouth Korea Won 1 273 1 606 1 773 1 532 1 541 –13,6 +0,6JapanJapan ¥ 161 152 130 116 111 –10,8 –4,5TaiwanTaiwan NT$ 45,1 46,4 46,0 41,7 41,0 –9,5 –1,7AustralienAustralia $A 1,63 1,74 1,77 1,44 1,35 –18,6 –6,5
Quelle: Deutsche BundesbankSource: Deutsche Bundesbank

8/15/2019 The German Machine Tool Industry in 2011
http://slidepdf.com/reader/full/the-german-machine-tool-industry-in-2011 77/84
AnhangAppendix
75
Mitgliedsfirmen zur Verfügung stehen. Ursprungsquellesind die offiziellen amtlichen Außenhandelsdaten dereinzelnen Länder. Der VDW nutzt primär diese eigeneDatenbasis. Die Vorteile liegen u. a. in der Nutzung einer
durchgängigen Quelle·einer einheitlichen Abgrenzungdes Werkzeugmaschinensektors sowie der Bildung einerkonsistenten Zeitreihe. In zwei Fällen, USA und Japan,haben wir uns allerdings entschieden, den Angaben derVerbände zu folgen, die eine erhebliche Bereinigung ihrerAußenhandelsdaten vornehmen, um aus ihrer Sicht zusinnvolleren Verbrauchsdaten zu kommen (vgl. Anmer-kungen zu diesen Ländern).
– Obwohl die nationalen Verbände i. d. R. auch auf amtlichesZahlenmaterial bei der Meldung der Export-/Importdaten
zurückgreifen, gibt es bezogen auf die GesamtsummeWerkzeugmaschinen teilweise Abweichungen zu denVDW-Daten. Dafür kann es unterschiedliche Gründegeben, z. B. eine etwas andere Abgrenzung des Werkzeug-maschinensektors (Einbezug von Teile/Zubehör oderMaschinen für die Halbleiterbearbeitung) oder einunterschiedlicher Datenstand (z. B. Berücksichtigungvon Revisionen).
– Die Produktionsdaten stammen weiterhin in den meisten
Fällen direkt von dem jeweiligen nationalen Verband.Im Gegensatz zu den international einheitlich syste-matisierten Außenhandelsdaten stehen hier nur wenigealternative Quellen mit entsprechender Aussagekraftzur Verfügung. Die Verbände nutzen ihrerseits überwie-gend die amtlichen Daten ihres Landes. Es ist aber auchdenkbar, dass in manchen Ländern Verbände eigeneErhebungen oder Abschätzungen einbeziehen, wennkein entsprechendes offizielles Zahlenmaterial vorliegt.
– Soweit möglich sind alle Angaben exklusive Teile/Zubehör,
beziehen sich also auf komplette Werkzeugmaschinen!In manchen Fällen sind allerdings Zweifel angebracht,ob die Produktionsdaten nicht auch Teile, Komponentenoder gar Werkzeuge etc. enthalten. Dazu gehören bspw.Niederlande und Brasilien.
– Die Abgrenzung des Bereichs Werkzeugmaschinenorientiert sich international am sogenannten HS, dem”Harmonisierten System für Außenhandelsstatistiken”.Dem Bereich Werkzeugmaschinen (für die Metallbear-beitung) entsprechen die Warencodes 8456 bis 8463(ohne Teile/Zubehör).
detailed data, which cover more than 40 countries, isavailable exclusively to member companies. The infor-mation originally derives from the official foreign tradedata of the individual countries. The VDW relies primarily
on this in-house database. The advantages lie inter aliain the usage of a consistent source, the standardiseddemarcation of the machine tool sector, and the map-ping of a consistent time series. In two cases, however –USA and Japan – we have decided to use the data pro-vided by the associations which adjust their foreign tradefigures considerably in order to generate what theyconsider to be more meaningful consumption data(cf. remarks concerning these countries).
– Although national associations also generally rely onofficial figures when reporting import/export data,some of their data relating to machine tool totals differsfrom that of the VDW. There can be various reasons forthis: somewhat different demarcations of the machinetool sector (inclusion of parts/accessories or semicon-ductor processing equipment), for example, or differentrevision levels (e.g. taking adjustments/corrections intoaccount).
– In most cases, production data continue to originate
directly from the relevant national association. Unlikeforeign trade data, production data do not follow aninternationally standardised system and the numberof available sources of correspondingly meaningful infor-mation is limited. For their part, the national associationslargely use the official data of their respective countries,whereby some may include their own surveys or esti-mates in cases where no corresponding official figuresare available.
– Wherever possible, all figures exclude parts/accessories,
i.e., they refer to complete machine tools. In some cases,however, there is reason to suspect that production fig-ures might also include parts, components, or even tools,etc. Examples of this include the Netherlands and Brazil.
– The demarcation of the machine tool sector is gearedinternationally to the so-called HS, the “HarmonisedSystem for Foreign Trade Statistics”. Product codes 8456through to 8463 (excluding parts/accessories) corres-pond to the machine tool sector (for metalworking).

8/15/2019 The German Machine Tool Industry in 2011
http://slidepdf.com/reader/full/the-german-machine-tool-industry-in-2011 78/84
76
– Die Auswahl der aufgeführten Länder orientiert sichdaran, möglichst die weltweite Werkzeugmaschinen-produktion abzudecken. Dies ist auch in hohem Aus-maß erreicht. Der VDW weist auch Produktionszahlen
für die Länder Polen, Slowakei, Ungarn, Bulgarien undSlowenien aus. Die Volumina verstehen sich als sehrgrobe VDW-Abschätzungen. Basis dafür sind Daten vomeuropäischen Statistikamt Eurostat, die aber teilweiseälter und auch nicht vollständig sind.
– Während sich die Herstellung von Werkzeugmaschinenauf eine überschaubare Länderzahl konzentriert, ist derEinsatz, also der Verbrauch, natürlich weltweit auf vieleLänder verteilt. Dennoch steht der aufgeführte Länder-kreis auch für den überwiegenden Teil des weltweitenWerkzeugmaschinenverbrauchs. Die Größe „Verbrauch“wird rein rechnerisch ermittelt mit der Formel „Produk-tion – Export + Import“. Teilweise ist dies problematisch,da Produktionsdaten auf der einen und Export-/Import-daten auf der anderen Seite aus verschiedenen Statistik-systemen stammen (vgl. z. B. Anmerkungen weiter untenfür „Japan, umformende Maschinen“). In den Außen -handels datensind auch Gebrauchtmaschinen oderteilweise Re-Exporte/-Importe enthalten bzw. mancheLänder sind in ihrer Funktion als Handelsdrehscheibe
bis zu einem gewissen Grad nur Durchgangsländer fürWerkzeugmaschinen (z. B. Belgien, Niederlande, Singa-pur, Hongkong).
– Im Falle einiger Länder, für die keine Produktionszahlenverfügbar sind, wurden wenigstens die entsprechendenExport- und Importdaten ausgewiesen. Nicht in allenFällen liegen aber die Original-Außenhandelsdaten vor(in der Welttabelle mit der Zahl „1“ gekennzeichnet). Hierwurden die Importe (als Indiz für die Aufnahmefähigkeitdes Marktes) vom VDW anhand der Exporte von mehr
als 40 Berichtsländern in das betreffende Land berechnet.
– Die Berechnung der Weltsumme erfolgte nur für die Pro-duktion, da auf Weltebene die Produktion gleich demVerbrauch sein sollte. Als Referenzgröße für das Welt-volumen ist die Produktion statistisch besser geeignetals der „künstlich“ errechnete „Verbrauch“.
– Umrechnungen erfolgten mit den jeweiligen Jahres-durchschnittskursen zum Euro (vgl. Wechselkurstabelle).
– The list of countries aims to cover the worldwide produc-tion of machine tools as far as possible. And to a largeextent, this goal has also been achieved. The VDW alsolists production figures for Poland, Slovakia, Hungary,
Bulgaria and Slovenia. These volumes represent veryrough VDW estimates based on data from the Europeanstatistical office Eurostat. Some of these data are old,however, and they are also incomplete.
– Whereas machine tool manufacture is concentrated ina limited number of countries, the use – in other words,the consumption – of those machine tools is of coursedistributed among many countries around the world.Nevertheless, the group of countries listed also representsthe largest share of world machine tool consumption.The parameter “consumption” is calculated on a purelymathematical basis using the formula “production –exports + imports”. In some cases this gives rise to prob-lems, as production data and export/import data arederived from different statistical systems (cf. remarkson “Japan’s forming technology” below, for example).The international trade figures also include used ma-chines and some re-exports and re-imports, whereby cer-tain countries essentially function as a trade hub and insome respects serve as little more than a transit country
for machine tools (e.g. Belgium, the Netherlands, Singa-pore, Hong Kong).
– In the case of certain countries for which productionfigures are unavailable, at least the relevant export andimport data have been reported. The original foreigntrade figures are not always available in every case,however (indicated with “number 1” in the world table).In this case, the VDW used the export figures providedby more than 40 reporting countries to calculate theimports by the country in question (as an indication of
the market’s absorption capacity).
– The world total is calculated for production only because,at a global level, production should equal consumption.Production figures are better suited as reference valuesfor world volume than the “artificially” calculated“consumption”.
– Figures have been converted to the euro using the rele-vant exchange rates averaged over the year (cf. table of exchange rates).

8/15/2019 The German Machine Tool Industry in 2011
http://slidepdf.com/reader/full/the-german-machine-tool-industry-in-2011 79/84
AnhangAppendix
77
Anmerkungen zu einzelnen Ländern
Niederlande: In den niederländischen Produktionszahlensind vermutlich Teile/Zubehör enthalten.
USA:In den USA wurde vom Statistikamt der sogenannte„Curren t Industrial Report“ zur Erfassung der Produktioneingestellt. Der US -Verband AMT musste daher auf eineneue amtliche Quelle, den „An nual Survey of Manufactu-rers “ umsteigen. Dadurch haben sich die P roduktionsdatenauch rückwirke nd teils erheblich geändert.
Kanada: Die Produktionsdaten Kanad as sind ebenfalls oftDiskussionsgegenstand, da es keine detaillierte n achprüf-bare Quelle gibt. Auf Anregung des VDW hatte der US-Verband AMT vor einiger Zeit intensivere Recherchen fürKanada durchgeführt. Die abgeschätzten Daten basierenauf der Identifizierung kanadischer Werkzeugmaschinen-firmen und deren Umsätzen, die zu einer Branchenproduktionaggregiert wurden. Dies ist somit zum jetzigen Zeit punktdie bestverfügbare Quelle. Die Zeitreihe ist ent sprechendangepasst.
Mexiko: Die grob geschätzten Pro duktionsdaten ent-stamme n dem World Survey des „Metalwork ing Insiders‘
Report”.
Brasilien: Der brasilianische Verband ABIM AQ meldet dieProduktionsdaten inklusive Teile/Zubehör.
Indien: Für Indien meldete der zuständige Verband IMTMAbisher Daten, basierend auf Erhebungen im Mitgliederkreis.Nun bezieht der Verband über Schätzungen auch die Pro-duktion von Firmen ein, die sich nicht an diesen Erhebungenbeteiligen. Der Produktionsw ert erhöht sich dadurchbetr ächtlich um ca. 70 %, z. B. für 2010 von 344 auf 580
Mio. EUR. Der VDW hat seine Zeitreihen entsprechendangepasst.
China: Die Aussagekraft der chinesischen Produk tions -daten ist immer wieder stark diskutiert und das Volumenals unrealistisch hoch kritisiert wo rden. Detaillierte Re -cherchen des VDW haben ergeben, dass in 200 9 ca. 51,5 %des Produktionswertes NC-gesteuerte Maschinen sind,die aber auch teilweise äußerst einfache Technologie be -inhalten. Der NC-Anteil ist nach vorläufigen Angaben in2010 höchstens konstant geblieben. Der konventionelleBereich besteht zu einem überwiegenden Teil aus Ma -schinen einfachster Machart, zum Teil auch für den nicht-industriellen Einsatz. Auch ist fraglich, ob es sich bei den
Remarks on specific countries
The Netherlands: The production figures for the Nether-lands probably include parts/accessories.
USA:In the USA, the census bureau has terminated theso-called “Current Industrial Report” programme whichwas designed to record production data. As a result, theUS association AMT had to switch to a new official source,the “Annual Survey of Manufacturers”. This caused con-siderable changes in some of the production data, alsoretroactively.
Canada: Canadian production data are also a frequentsubject of discussion, as there are no detailed, verifiablesources. At the suggestion of the VDW, the US associationAMT carried out extensive research for Canada some timeago. The estimates were based on the identification of Canadian machine tool companies and their turnover,which were then aggregated into a production figure forthe sector. That makes this the best available source at themoment. The time series has been adjusted accordingly.
Mexico: The rough production estimates are drawn fromthe world survey of the Metalworking Insiders’ Report.
Brazil: The Brazilian association ABIMAQ reports productionfigures that include parts/accessories.
India: For India, the responsible association IMTMA previ-ously reported data based on surveys of its members. Nowthe association also includes production figures fromcompanies which do not participate in those surveys. Thisraises the production value considerably: by about 70%,e.g. from EUR 344 million to EUR 580 million in 2010. TheVDW has adjusted its time series accordingly.
China: The validity of Chinese production data is a peren-nially controversial topic and the volume has been severelycriticised as unrealistic. Detailed VDW research has revealedthat while numerically controlled machine tools representapprox. 51.5% of the production value in 2009, some of those machines also employ extremely simple technology.According to provisional data, the NC share remainedconstant at best in 2010. The conventional segment largelycomprises the simplest of machinery, including equipmentintended for non-industrial applications as well. It is alsodoubtful whether the figures reported consistently pertainto machine tools in the genuine sense of the term (con-tamination by manually operated drills, etc.). The VDW’s

8/15/2019 The German Machine Tool Industry in 2011
http://slidepdf.com/reader/full/the-german-machine-tool-industry-in-2011 80/84
78
gemeldeten Daten durchgängig um Werkzeugmaschinenim eigentlichen Sinne handelt (Verunreinigung durch hand-geführte Bohrmaschinen etc.). Basis der VDW-Recherchenbezüglich konventioneller Maschinen ist das vom chinesi-
schen Verband CMTBA veröffentlichte „China Machine Tool& Tool Industry Yearbook“. Darin sind ca. 80 % des vomCMTBA veröffentlichten spanenden Produktionsvolumensabgedeckt, wobei hier sicherlich firmenbezogen von einer„Positivauswahl“ zu sprechen ist. Nach dieser Erhebung(Datenstand 2009) haben spanende NC-Maschinen einenDurchschnittswert von 36 Tsd. EUR, konventionelle von6 Tsd. EUR. Vom erfassten konventionellen (also nicht NC-gesteuerten) Produktionsvolumen entfallen 41 % auf Dreh-maschinen mit einem Durchschnittswert von 8 Tsd. EUR,7 % auf Fräsmaschinen (4 Tsd. Euro) und 9 % auf Bohr-maschinen (3 Tsd. EUR). Die Umformtechnik ist in demHandbuch zu ca. 50 % abgedeckt. Konventionelle Umform-maschinenstehen für einen Durchschnittswert von 9 Tsd.EUR. Mechanische Pressen mit einem Durchschnittswertvon 7 Tsd. EUR haben alleine einen Anteil von 68 %. Bezo-gen auf alle Werkzeugmaschinen lässt sich sagen, dasses sich bei zwei Drittel der konventionellen Technik umMaschinen mit einem Wert unter 10 Tsd. EUR handelt.
Insgesamt verzerren die chinesischen Daten einen sinn-
vollen Ländervergleich im Weltmaßstab. Der VDW hat sichdaher entschlossen, die Produktionsdaten auf Basis derRecherchen zu bereinigen. Einbezogen wird die kompletteNC-Technologie sowie ein Drittel des konventionellenBereichs, der ansonsten stark von Billigstmaschinen be-einflusst ist. Der Weiterentwicklung der technologischenWettbewerbsfähigkeit wird durch Einbezug der steigen-den NC-Durchdringung Rechnung getragen. So ist derNC-Anteil von 2007 bis 2010 von 45,0 auf 51,9% ange-stiegen. Die VDW-Methode führt in 2011 zu einer Bereini-gung des Original-Produktionswertes um 32 % von
21,3 auf 14,6 Mrd. EUR. Mit gleichem Prozentsatz wird auchder Exportwert gekürzt, die Importdaten bleiben hinge-gen unverändert. Rechnerisch ergibt sich damit eine Redu-zierung des chinesischen Marktvolumens um21 % von 29,1 auf 22,9 Mrd. EUR. Der VDW wird seine Re-cherchen auch in der Zukunft fortführen, umden Grad der notwendigen Bereinigung laufend zuüberprüfen.
Im Sinne der Gleichbehandlung hat der VDW auch dieProduktionsdaten anderer wichtiger Herstellerländer mitder gleichen Methodik überprüft. Das klare Ergebnis: Dienotwendige Bereinigung läge je nach Land bei null bismaximal fünf Prozent (übrigens sogar auch für den Produ-
research relative to conventional machinery is based on the“China Machine Tool & Tool Industry Yearbook” publishedby the Chinese association CMTBA. It covers approx. 80%of the production volume for cutting machines reported
by the CMTBA, which undoubtedly reflects a form of “positive discrimination” towards specific companies.According to that survey (with data updated through2009), the average metal-cutting NC machine is valuedat EUR 36,000 and the average conventional machine isvalued at EUR 6,000. Of the conventional (i.e. non-NC)machines reported, 41% of the production volume corres-ponds to lathes with an average value of EUR 8,000, 7%are milling machines (EUR 4,000), and 9% are drill presses(EUR 3,000). The yearbook covers about 50% of formingtechnology. Conventional forming technology averagesEUR 9,000 per machine. Mechanical presses averagingEUR 7,000 per machine represent a 68% share of the totalon their own. Taking together all machine tools as a whole,it is estimated that two thirds of the conventional tech-nology involves machines valued at less than EUR 10,000.
Overall, the Chinese data distort any useful comparisonamong countries on a worldwide scale. For this reason,the VDW decided to adjust the production data based onthe research. It considers all NC technology and one third
of the conventional area, which is otherwise heavily influ-enced by “cheap and simple” machines. The further devel-opment of technological competitiveness is taken intoaccount by including the increasing penetration of NC. Inthe period from 2007 to 2010, for example, the share of NC grew from 45.0% to 51.9%. In 2011, the VDW methodol-ogy has adjusted the original production value downwardby 32% from EUR 21.3 billion to EUR 14.6 billion. Exportshave also been reduced by the same percentage, whileimports remain unchanged. This reduces China’s marketvolume by 21% from EUR 29.1 billion to EUR 22.9 billion.
The VDW will also continue its research in the future, inorder to continuously monitor the degree of adjustmentrequired.
In the interest of equal treatment, the VDW also used thesame methodology to study the production data of othermajor manufacturing countries. The clear result showedthat the required adjustments for various countries rangedfrom 0% to a maximum of 5% (and by the way, that evenincluded India), which is to say, a negligible amount. Thisconfirms that a considerable portion of the Chinese pro-duction data represents technology in a form that cannotbe compared on a global scale. And China’s size itself wouldcause the unfiltered data to distort global prognoses. But

8/15/2019 The German Machine Tool Industry in 2011
http://slidepdf.com/reader/full/the-german-machine-tool-industry-in-2011 81/84
79
zent Indien). Also eine zu vernachlässigende Größenord-nung. Dies belegt, dass die chinesischen Produktionsdatenin nennenswertem Umfang eine im Weltmaßstab nichtvergleichbare Technologie abbilden. Und allein aufgrund
der Größe Chinas hätten die unbereinigten Daten einenverzerrenden Einfluss auf die Weltaussagen. Einen – gerade-zu naheliegenden – Zweifelsfall gibt es jedoch noch. Auchdie Daten Taiwans scheinen durch Billigmaschinen starkbeeinflusst. Allerdings sind die zur Verfügung stehendentaiwanesischen Produktionsdaten nicht detailliert genugund lassen keine gesicherten Aufschlüsse zu. Im spanen-den Bereich liegt der NC-Anteil bei knapp 77 %, also deut-lich höher als in China. Die wenigen verfügbaren Daten ausder Umformtechnik werfen jedoch Fragen auf. Hierergeben sich beim Vergleich der Stückzahlen und Wertan-gaben sehr geringe Durchschnittswerte. Allerdings lässtsich aus den groben Daten nicht ableiten, wie viel sinnvol-lerweise anrechenbare Technologie (im Sinne der Verwend-barkeit im industriellen Einsatz) mit welchem Wertanteilenthalten sein könnte. Der VDW hat daher auf eine Berei-nigung bei Taiwan verzichtet, auch weil die Größenordnungim Weltmaßstab bei weitem nicht den Einfluss hätte wieim Falle Chinas.
Japan, spanende Werkzeugmaschinen: Der japanische Ver-
band für spanende Werkzeugmaschinen (JMTBA) veröf-fentlicht in seinen Publikationen in der Regel Produktions-daten des METI (Ministry of Economy, Trade and Industry),die allerdings nur Firmen mit mehr als 50 Beschäftigteneinbeziehen. Die in die Weltstatistik gemeldeten Datenbeinhalten auch eine Schätzung für kleinere Firmen. DasProduktionsvolumen wird dadurch um ca. 11 % erhöht(z. B. 2010: Produktion spanend, Firmen > 50 Beschäftigte:7,18 Mrd. EUR, inkl. kleiner Firmen: 7,97 Mrd. EUR).
Japan, umformende Maschinen: Der japanische Verband
für Umformtechnik JFMA folgt nun der Methodik, die derVerband für spanende Technologie JMTBA schon längernutzt. Die bisherigen Produktionsdaten bezogen nur Fir-men ab 50 Beschäftigten ein. Der JFMA schätzt jetzt einenAnteil für kleinere Firmen hinzu (z. B. 2010: Produktion um-formend, Firmen > 50 Beschäftigte: 0,96 Mrd. EUR, inkl.kleiner Firmen: 1,07 Mrd. EUR). Die Zeitreihe ist entspre-chend angepasst.
Südkorea: Viele Veröffentlichungen des südkoreanischenVerbandes KOMMA beziehen sich auf die Produktion derMitgliedsfirmen. In die Weltstatistik meldet der VerbandWerte für die Gesamtbranche auf Basis amtlicher Statistiken.
there is yet another cause for doubt – practically next door.The data from Taiwan also appear to be heavily influencedby “cheap and simple” machines. As the available Taiwaneseproduction data do not offer sufficient detail, however,
they cannot be used to draw any unequivocal conclusions.In cutting machinery, the share of NC is nearly 77% of thetotal, i.e. considerably higher than in China. The limiteddata available from metal-forming technology raise ques-tions, however. Comparing quantities and value data heregenerates very low average values. But these rough datado not indicate how much technology could reasonablybe grouped together (in the sense of applicability in in-dustrial operations) under which share of value. For thisreason, the VDW chose not to adjust the Taiwanesefigures – and also because data of this magnitude wouldhave nowhere near as much effect as they would in thecase of China.
Japan – cutting machine tools: In its publications, theJapanese Machine Tool Builders’ Association (JMTBA) gen-erally reports production data from the METI (Ministryof Economy, Trade and Industry). These data exclude com-panies with less than 50 employees, however. The datareported in the world statistics also contain an estimate forsmaller firms. This raises the production volume by some
11% (e.g. 2010: cutting machine production companies> 50 employees: EUR 7.18 billion; including smaller com-panies: EUR 7.97 billion).
Japan – forming machines: The Japanese Forming Machin-ery Association (JFMA) is now using the same method-ology which the Japanese Machine Tool Builders’ Asso-ciation (JMTBA) has been using for quite some time already.The previous production data only included companieswith 50 employees or more. The JFMA now also includesa share for smaller companies (e.g. 2010: forming machine
production companies > 50 employees: EUR 0.96 billion;including smaller companies: EUR 1.07 billion). The timeseries has been adjusted accordingly.
South Korea: Many of the figures published by the SouthKorean association KOMMA refer to the production of itsmember companies. In world statistics, the associationreports values for the entire sector based on officialstatistics.
AnhangAppendix

8/15/2019 The German Machine Tool Industry in 2011
http://slidepdf.com/reader/full/the-german-machine-tool-industry-in-2011 82/84

8/15/2019 The German Machine Tool Industry in 2011
http://slidepdf.com/reader/full/the-german-machine-tool-industry-in-2011 83/84
MAG IAS, MosbachMAG IAS, OffenburgMAG IAS, TaunussteinMAG MODUL, ChemnitzMAIER, WehingenMAKINO, HamburgMANNESMANN, A., RemscheidMATEC, KöngenMAUSER, Oberndorf MIKRON, RottweilMIKSCH, GöppingenMONFORTS, MönchengladbachNEFF, KarlsruheNILES, BerlinNILES-SIMMONS, ChemnitzNOMOCO, Sundern
OVERBECK, HerbornPEISELER, RemscheidPOWER AUTOMATION, PleidelsheimPROFILATOR, WuppertalPROFIROLL, Bad DübenRATTUNDE, LudwigslustRAUSCH, HaanRÖDERS, SoltauSAMAG, SaalfeldSCHAUDT MIKROSA, LeipzigSCHIESS, AscherslebenSCHLEGEL & VOLK, Frankfurt am Main
SCHNEEBERGER, Höfen/EnzSCHULER PRESSEN, GöppingenSCHULER PRESSEN, WeingartenSCHULER SMG, WaghäuselSCHÜTTE, ALFRED H., KölnSCHÜTTE SCHLEIFTECHNIK, KölnSCHÜTTE SERVICECENTER, KölnSCHWÄBISCHE WERKZEUGMASCHINEN, Schramberg-WaldmössinSEIDLER, Neuss-HolzheimSHW WERKZEUGMASCHINEN, Aalen-WasseralfingenSIEMENS, ErlangenSKF, SchweinfurtSMS MEER, MönchengladbachSTARRAGHECKERT, ChemnitzTRAUB, ReichenbachTRUMPF, DitzingenTRUMPF VERTRIEB+SERVICE, DitzingenUNITECH, ChemnitzVOLLMER, Biberach/RißWALDRICH COBURG, CoburgWALTER, TübingenWEILER, EmskirchenWEISSER, St. GeorgenWEMA VOGTLAND, PlauenWOLTERS, RendsburgZF Friedrichshafen, FriedrichshafenZIERSCH, IlmenauZIMMER & KREIM, Brensbach
Stand: April 2012
VDW-Mitgliedsfirmen/VDW member companiesALFING KESSLER, AalenALZMETALL, Altenmarkt/AlzBAUST, LangenfeldBECKHOFF, VerlBENZINGER, Pforzheim-BüchenbronnBIHLER, HalblechBLOHM JUNG, GöppingenBLOHM JUNG, HamburgBOSCH REXROTH, Lohr am MainCHIRON, TuttlingenCITIZEN, EsslingenDECKEL MAHO, PfrontenDECKEL, MICHAEL, WeilheimDESCH, ArnsbergDISKUS, DietzenbachDITTEL, Landsberg
DÖRRIES SCHARMANN, MönchengladbachEIMA, FrickenhausenELHA, Hövelhof EMAG LEIPZIG, LeipzigEMAG SALACH, SalachEMCO MAGDEBURG, MagdeburgFISCHER, KARL EUGEN, BurgkunstadtFORST, SolingenFORTE, WinterbachFRÖMAG, FröndenbergG.D.W., HerzogenaurachGEHRING, Ostfildern
GEIBEL & HOTZ, Homberg/OhmGILDEMEISTER, BielefeldGLEASON-HURTH, MünchenGLEASON-PFAUTER, LudwigsburgGÖCKEL, DarmstadtGROB, MindelheimHAMUEL, MeederHEIDENHAIN, TraunreutHELLER, NürtingenHELMERDING, Bad OeynhausenHERMLE, GosheimINDEX, EsslingenINNSE BERARDI, AlbershausenJUNKER, NordrachKAPP, CoburgKEHREN, Hennef KESEL, KemptenKESSLER, Bad BuchauKLINGELNBERG, HückeswagenKOEPFER, FurtwangenKÖRBER SCHLEIFRING, HamburgKUGLER, SalemLASCO, CoburgLEISTRITZ, NürnbergLICON, LaupheimLIEBHERR, KemptenMAG Europe, GöppingenMAG IAS, EislingenMAG IAS, Göppingen

8/15/2019 The German Machine Tool Industry in 2011
http://slidepdf.com/reader/full/the-german-machine-tool-industry-in-2011 84/84