Embed Size (px)
Citation preview

The Gibbs Phase Rule • The phase rule allows one to determine the
number of degrees of freedom (F) or variance of a chemical system. This is useful for interpreting phase diagrams. F = 2 + C - P
Where F is the number of degrees of freedom, C is the number of chemical components and P is the number of phases in the system. The
number two is specified because this formulation assumes that both T and P can be varied.

Thermodynamics of Solutions
• Phases: Part of a system that is chemically and physically homogeneous, bounded by a distinct interface with other phases and physically separable from other phases.
• Components: Smallest number of chemical entities necessary to describe the composition of every phase in the system.
• Solutions: Homogeneous mixture of two or more chemical components in which their concentrations may be freely varied within certain limits.

Mole Fractions
where XA is called the “mole fraction” of component A in some phase.
If the same component is used in more than one phase, Then we can define the mole fraction of component A in phase i as
For a simple binary system, XA + XB = 1
XA!
nA
n"=
nA
(nA
+ nB
+ nC
+!),
XA
i

Phase Rule Significance for Phase Diagrams • For two dimensional phase diagrams:
– Stability fields: Areas (T-P, T-X, P-X space) where a phase or phase assemblage (more than one phase) is stable.
– Equilibrium boundary lines: These define the limits of stability fields. These represent values of parameters where phases in adjacent fields coexist.
– Triple points: Points where equilibrium boundary lines meet. All phases in the adjacent stability fields must coexist.

Silica Phase Diagram and Phase Rule Single Component System: F = 2 + C - P = 3 - P
Stability Field P = 1; F = 2; divariant
Boundary Line Triple Point P = 2; F = 1;
univariant P = 3; F = 0; invariant
From Swamy et al., 1994

Wet and Dry Melting Relations for Albite
From Burham & Davis, 1974; Boettcher et al., 1982
Dry Melting Curve
Water Saturated Melting Curve
Water Undersaturated Melting Curves (2, 5, & 8 kbar)

Binary Phase Relations - Definitions • Liquidus line: the line that represents the locus of
depressed freezing points as a second component is added to the system. Solid phases are not stable at temperatures above those defined by the liquidus line or surface.

Di-An Binary Eutectic Phase Diagram
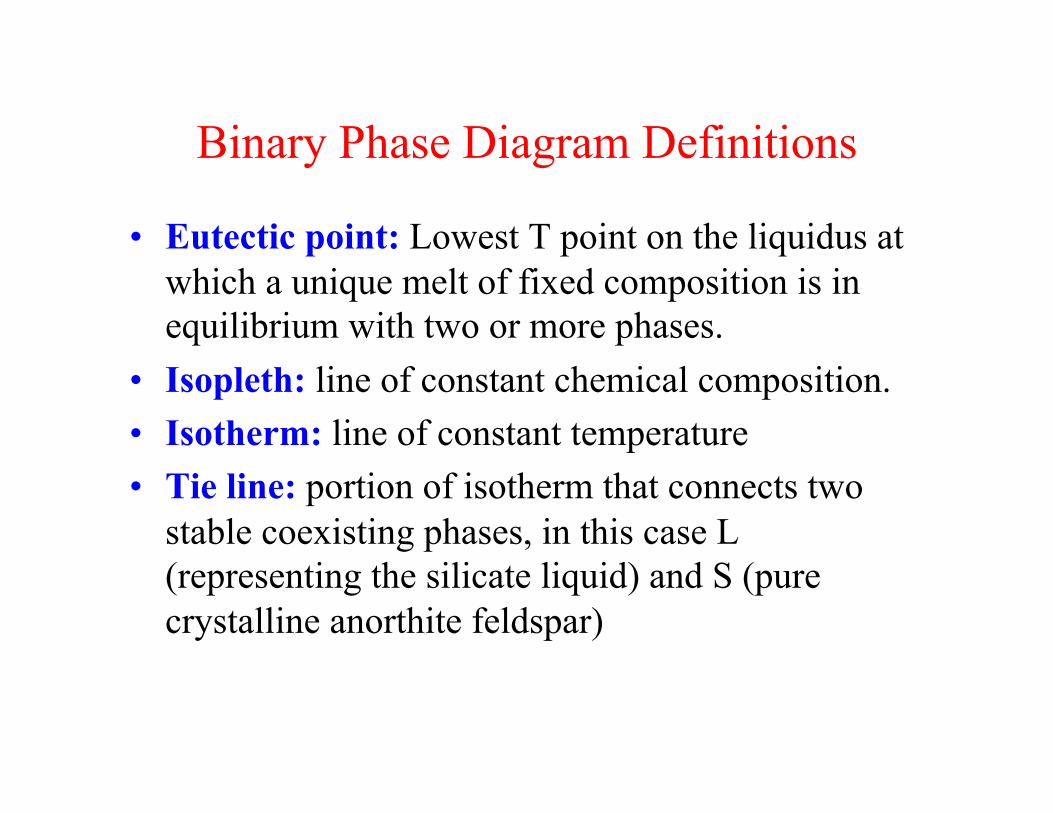
Binary Phase Diagram Definitions • Eutectic point: Lowest T point on the liquidus at
which a unique melt of fixed composition is in equilibrium with two or more phases.
• Isopleth: line of constant chemical composition. • Isotherm: line of constant temperature • Tie line: portion of isotherm that connects two
stable coexisting phases, in this case L (representing the silicate liquid) and S (pure crystalline anorthite feldspar)

The Lever Rule Follows directly from the Law of Conservation of Mass. Allows one to calculate either algebraically or graphically the modal abundance of each phase at every temperature.
MASS OF LIQUID MASS OF SOLID
BULK COMPOSITION
L =y
(x + y)
S =x
(x + y)

Equilibrium vs. Fractional Crystallization Equilibrium Crystallization: crystals continuously react and re-equilibrate with the melt at P-T-X conditions change. Melt-xtal reactions are reversible.
Fractional Crystallization: Crystals are immediately isolated, removed, or fractionated from the residual melt so that no further reactions can occur. Melt-xtal reactions are irreversible.

Binary Phase Loop with Solid Solution
liquidus solidus

Plagioclase Differentiation Mechanisms
Gabbro - Plane Polarized Light Plagioclase zoning
Crystal Settling zoned plag
Perthitic pyroxene

Hawaiian Basalt Phase Relations at 1 atm
From Wright & Okamura, 1977
Temperatures measured in borehole
1170°C
1130°C
1075°C
1020°C

Generalized Basalt Phase Diagram
From Green, 1982