Embed Size (px)
Citation preview
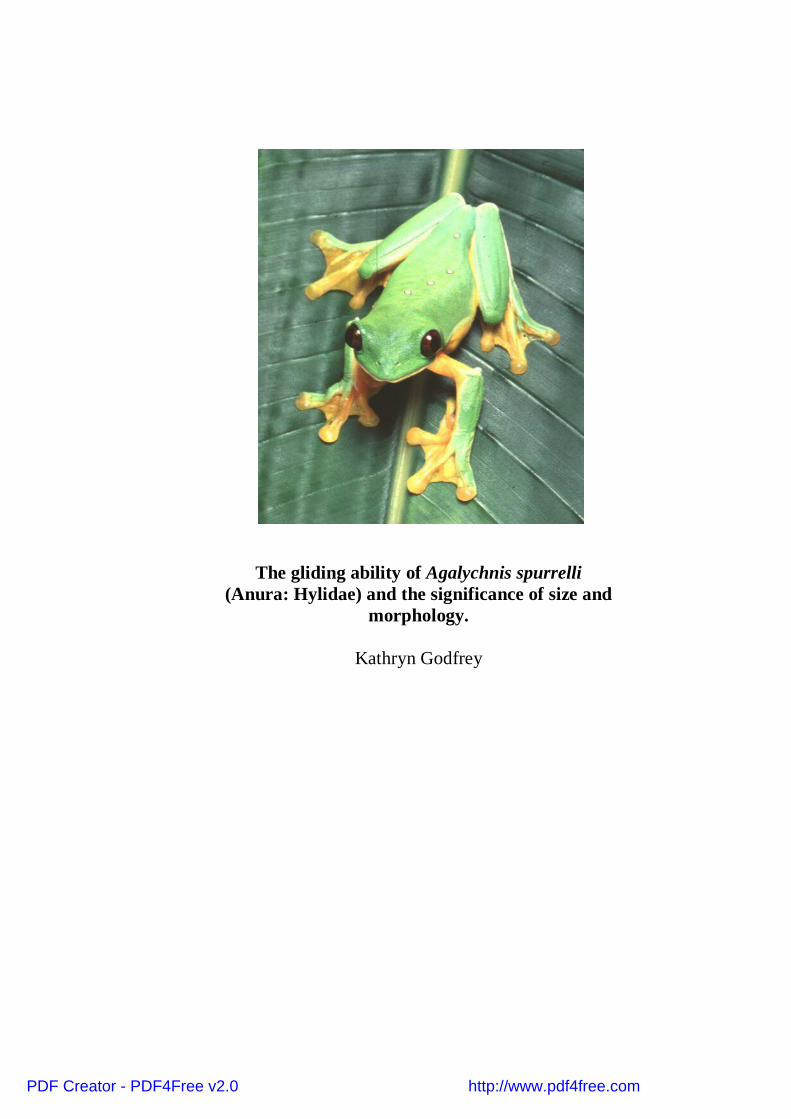
The gliding ability of Agalychnis spurrelli(Anura: Hylidae) and the significance of size and
morphology.
Kathryn Godfrey
PDF Creator - PDF4Free v2.0 http://www.pdf4free.com
- 1 -
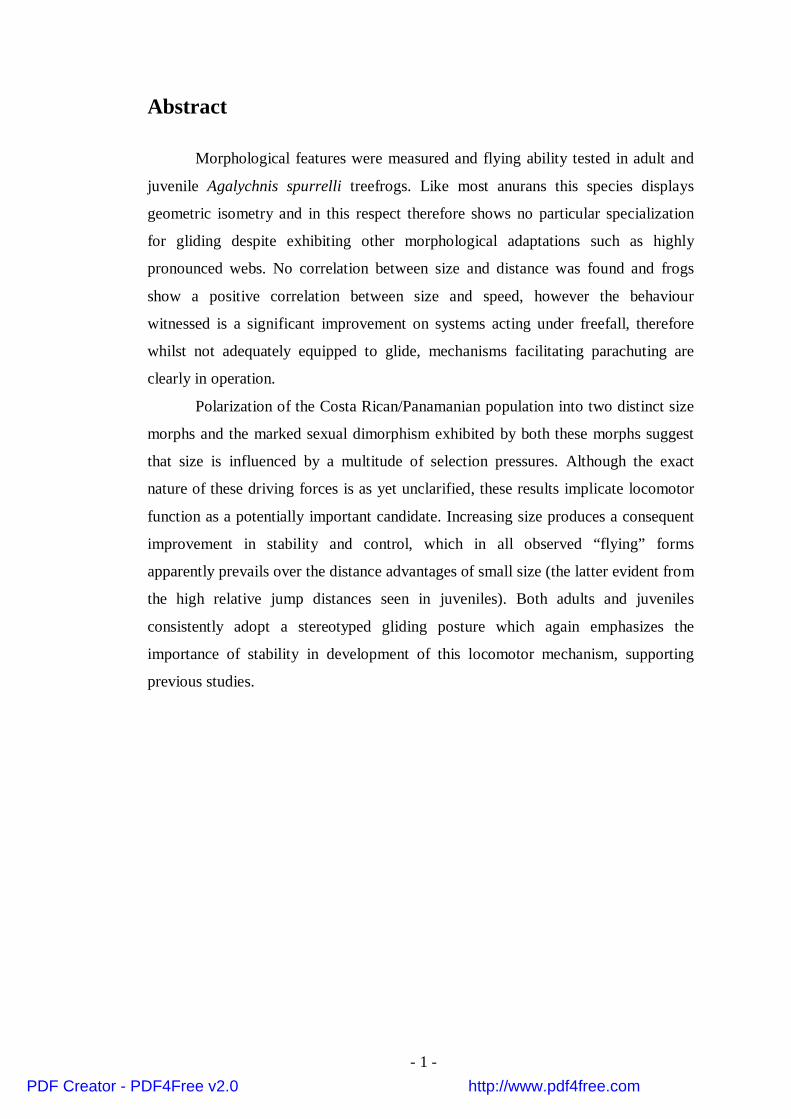
Abstract
Morphological features were measured and flying ability tested in adult and
juvenile Agalychnis spurrelli treefrogs. Like most anurans this species displays
geometric isometry and in this respect therefore shows no particular specialization
for gliding despite exhibiting other morphological adaptations such as highly
pronounced webs. No correlation between size and distance was found and frogs
show a positive correlation between size and speed, however the behaviour
witnessed is a significant improvement on systems acting under freefall, therefore
whilst not adequately equipped to glide, mechanisms facilitating parachuting are
clearly in operation.
Polarization of the Costa Rican/Panamanian population into two distinct size
morphs and the marked sexual dimorphism exhibited by both these morphs suggest
that size is influenced by a multitude of selection pressures. Although the exact
nature of these driving forces is as yet unclarified, these results implicate locomotor
function as a potentially important candidate. Increasing size produces a consequent
improvement in stability and control, which in all observed “flying” forms
apparently prevails over the distance advantages of small size (the latter evident from
the high relative jump distances seen in juveniles). Both adults and juveniles
consistently adopt a stereotyped gliding posture which again emphasizes the
importance of stability in development of this locomotor mechanism, supporting
previous studies.
PDF Creator - PDF4Free v2.0 http://www.pdf4free.com
- 2 -
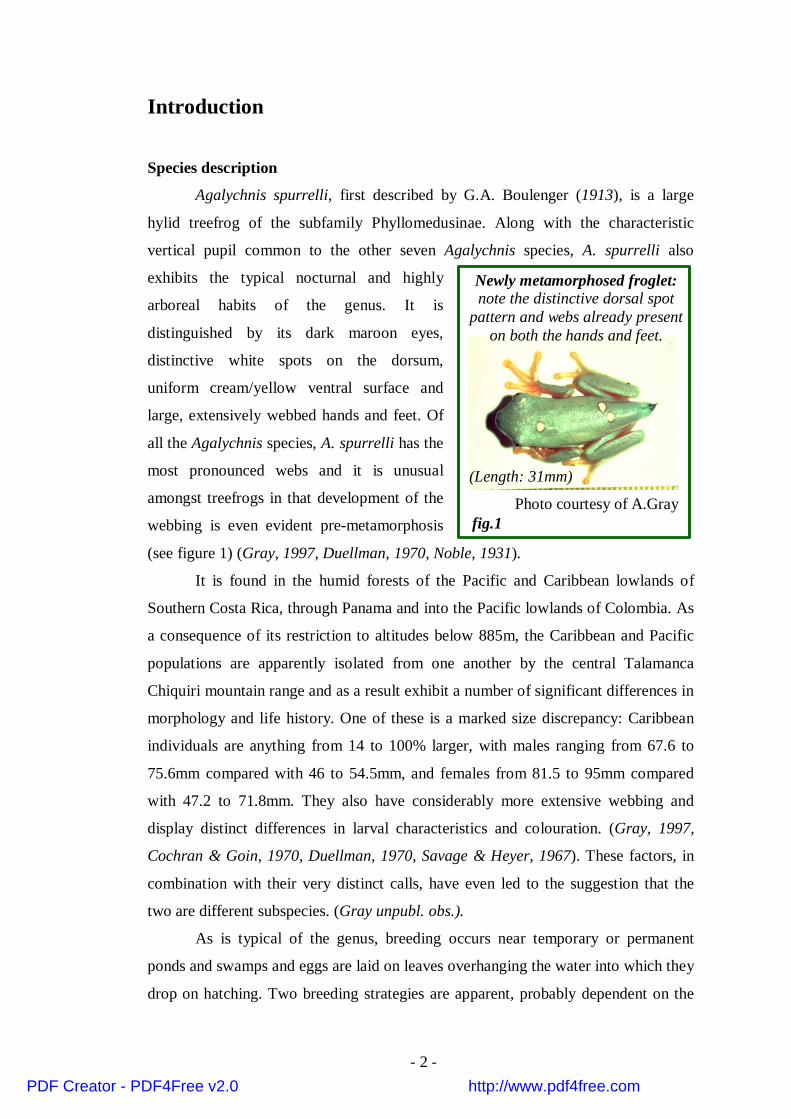
Newly metamorphosed froglet:note the distinctive dorsal spot
pattern and webs already presenton both the hands and feet.
(Length: 31mm)
Photo courtesy of A.Grayfig.1
Introduction
Species description
Agalychnis spurrelli, first described by G.A. Boulenger (1913), is a large
hylid treefrog of the subfamily Phyllomedusinae. Along with the characteristic
vertical pupil common to the other seven Agalychnis species, A. spurrelli also
exhibits the typical nocturnal and highly
arboreal habits of the genus. It is
distinguished by its dark maroon eyes,
distinctive white spots on the dorsum,
uniform cream/yellow ventral surface and
large, extensively webbed hands and feet. Of
all the Agalychnis species, A. spurrelli has the
most pronounced webs and it is unusual
amongst treefrogs in that development of the
webbing is even evident pre-metamorphosis
(see figure 1) (Gray, 1997, Duellman, 1970, Noble, 1931).
It is found in the humid forests of the Pacific and Caribbean lowlands of
Southern Costa Rica, through Panama and into the Pacific lowlands of Colombia. As
a consequence of its restriction to altitudes below 885m, the Caribbean and Pacific
populations are apparently isolated from one another by the central Talamanca
Chiquiri mountain range and as a result exhibit a number of significant differences in
morphology and life history. One of these is a marked size discrepancy: Caribbean
individuals are anything from 14 to 100% larger, with males ranging from 67.6 to
75.6mm compared with 46 to 54.5mm, and females from 81.5 to 95mm compared
with 47.2 to 71.8mm. They also have considerably more extensive webbing and
display distinct differences in larval characteristics and colouration. (Gray, 1997,
Cochran & Goin, 1970, Duellman, 1970, Savage & Heyer, 1967). These factors, in
combination with their very distinct calls, have even led to the suggestion that the
two are different subspecies. (Gray unpubl. obs.).
As is typical of the genus, breeding occurs near temporary or permanent
ponds and swamps and eggs are laid on leaves overhanging the water into which they
drop on hatching. Two breeding strategies are apparent, probably dependent on the
PDF Creator - PDF4Free v2.0 http://www.pdf4free.com

- 3 -
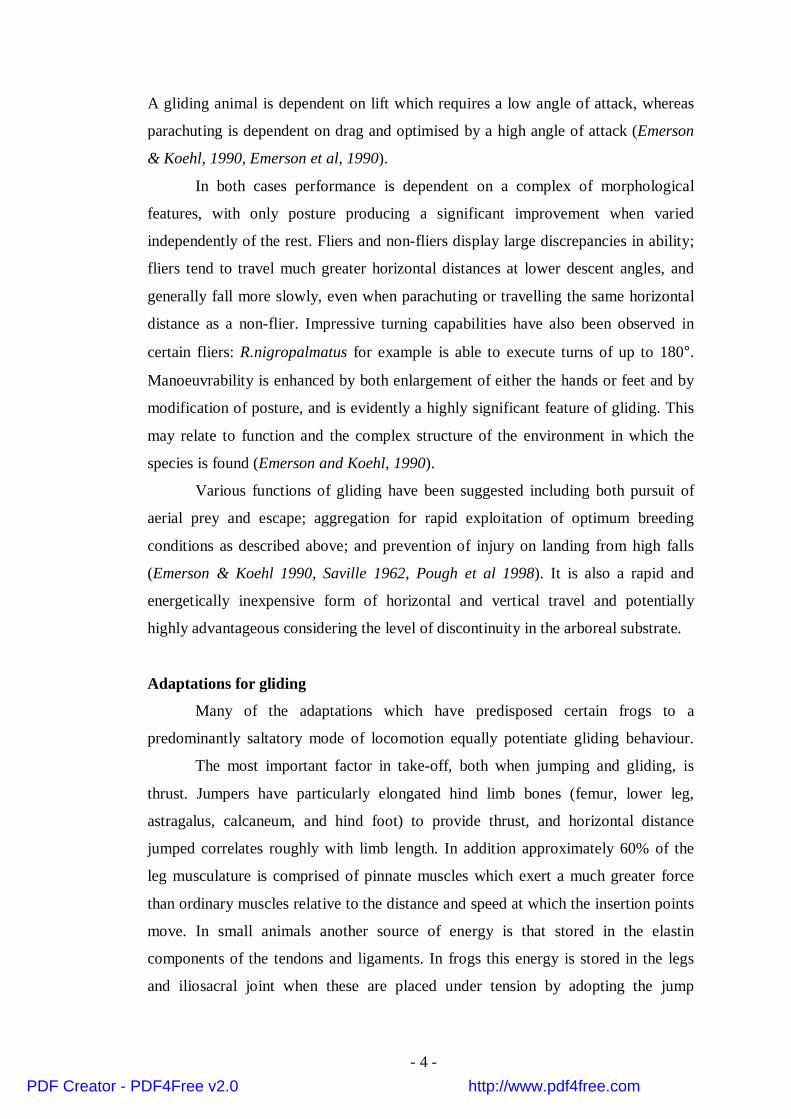
mg
Drag
Lift
glideangle
Bodyaxis
attackangle
á
ø
Gliding:Weight is supported primarily by lift.Angle of attack (ø) and glide angle(α) are both small (α <45º)v = (2mg / ρCLA1/2)where v = velocity, mg = weight,ρ= air resistance, CL = coefficient oflift, (N.B. CD = coefficient of drag),and A = area
(horizontal)
Lift
Drag
mg
Bodyaxis
descentangle
attackangle
ø
á
Parachuting:Weight is supported primarily by drag.Angle of attack (ø) and descent angle(α) are both large (α > 45º)v = (2mg / ρCDA)1/2
(horizontal)
Reproduced from Emerson and Koehl, (1990) with additionalinformation from Alexander, (1982) and Oliver, (1951).fig.2
Comparison between gliding and parachuting.
descentpath
descentpath
permanency of the water supply. “Prolonged breeding” occurs at permanent sites and
involves constant, relatively low densities, particularly of males. “Explosive
breeding” has been observed at temporary water sources (Scott & Starrett, 1974). It
involves rapid aggregation of huge numbers of frogs (an estimated 13000 at one
pond approximately 50m by 70m) and frenetic (“scramble”) competition for partners.
It is primarily during these breeding aggregations that parachuting/gliding have been
observed in this species. The behaviour enables rapid aggregation of individuals
from different levels in the canopy up to 10m and above, with the densest
congregations occurring at 1.5 to 3m above water level. During descent females in
particular have been observed to alter their course by at least 35°, gliding down
towards the pool then turning at a height of about 2m and steering onto the bank.
Gliding behaviour
Gliding was first reported by Wallace in the morphologically similar Old
World Rhacophorid species Rhacophorus nigropalmatus, (as cited by Saville, 1962),
and parachuting was subsequently described by Cott (1926) in Hyla venulosa (now
Phrynohyas venulosa). Oliver (1951) later defined gliding and parachuting in terms
of angle of descent (see figure 2).
PDF Creator - PDF4Free v2.0 http://www.pdf4free.com
- 4 -
A gliding animal is dependent on lift which requires a low angle of attack, whereas
parachuting is dependent on drag and optimised by a high angle of attack (Emerson
& Koehl, 1990, Emerson et al, 1990).
In both cases performance is dependent on a complex of morphological
features, with only posture producing a significant improvement when varied
independently of the rest. Fliers and non-fliers display large discrepancies in ability;
fliers tend to travel much greater horizontal distances at lower descent angles, and
generally fall more slowly, even when parachuting or travelling the same horizontal
distance as a non-flier. Impressive turning capabilities have also been observed in
certain fliers: R.nigropalmatus for example is able to execute turns of up to 180°.
Manoeuvrability is enhanced by both enlargement of either the hands or feet and by
modification of posture, and is evidently a highly significant feature of gliding. This
may relate to function and the complex structure of the environment in which the
species is found (Emerson and Koehl, 1990).
Various functions of gliding have been suggested including both pursuit of
aerial prey and escape; aggregation for rapid exploitation of optimum breeding
conditions as described above; and prevention of injury on landing from high falls
(Emerson & Koehl 1990, Saville 1962, Pough et al 1998). It is also a rapid and
energetically inexpensive form of horizontal and vertical travel and potentially
highly advantageous considering the level of discontinuity in the arboreal substrate.
Adaptations for gliding
Many of the adaptations which have predisposed certain frogs to a
predominantly saltatory mode of locomotion equally potentiate gliding behaviour.
The most important factor in take-off, both when jumping and gliding, is
thrust. Jumpers have particularly elongated hind limb bones (femur, lower leg,
astragalus, calcaneum, and hind foot) to provide thrust, and horizontal distance
jumped correlates roughly with limb length. In addition approximately 60% of the
leg musculature is comprised of pinnate muscles which exert a much greater force
than ordinary muscles relative to the distance and speed at which the insertion points
move. In small animals another source of energy is that stored in the elastin
components of the tendons and ligaments. In frogs this energy is stored in the legs
and iliosacral joint when these are placed under tension by adopting the jump
PDF Creator - PDF4Free v2.0 http://www.pdf4free.com
- 5 -
position (Calow & Alexander, 1973). In Agalychnis the sacral diapophyses are
broadly expanded and enveloped in a wide external ligament which runs from one
ilium to the other superficially to the dorsal back musculature (known as a type I
iliosacral joint complex) This allows considerable movement of the ilia in the
horizontal plane thereby providing thrust (Emerson, 1982, Griffiths, 1963). Pelvic
sliding is restricted in the vertical plane however (Emerson, 1978), which
presumably contributes to maintenance of balance by preventing rotation.
Streamlining is maintained by continued extension of the limb extensors even after
full contraction and take off. This may also therefore contribute to maintenance of
posture and balance in flight.
The importance of reducing the force with which the body hits the landing
surface is augmented in gliding due to the greater heights involved. All anurans have
a greatly reduced skeleton: the ribs have become vestigial as a result of the massive
development of the ventral abdominal musculature and in Agalychnis species are lost
altogether. The vertebral column is short and rigid as a result of compression of the
notochord by inward bending of the invertebral discs during metamorphosis, and is
strengthened against the muscles involved in jumping by the urostyle (Macbride
1932). The limb girdles, which articulate with the vertebral column via moveable
diapophyses, are sturdy and well-ossified for dissipation of the compressive force
transferred on to them on landing. (Pough et al, 1998, Zug, 1993, Emerson 1984).
Strong jumpers tend to have moderately short scapulae and forelimbs with large
forefeet for shock absorption. The chest and abdomen are also probably involved in
shock absorption (Zug, 1972).
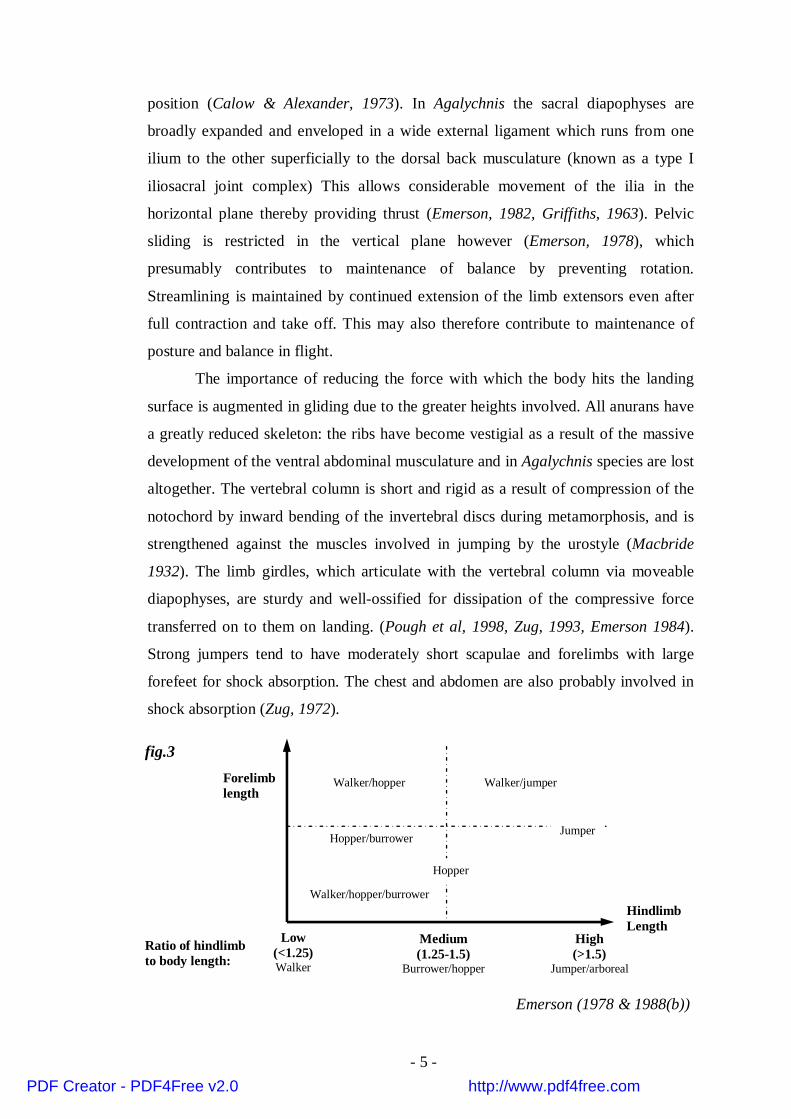
Forelimblength
HindlimbLength
Walker/hopper
Hopper/burrower
Walker/hopper/burrower
Hopper
Jumper
Walker/jumper
Ratio of hindlimbto body length:
Low(<1.25)Walker
Medium(1.25-1.5)
Burrower/hopper
High(>1.5)
Jumper/arboreal
Emerson (1978 & 1988(b))
fig.3
PDF Creator - PDF4Free v2.0 http://www.pdf4free.com
- 6 -
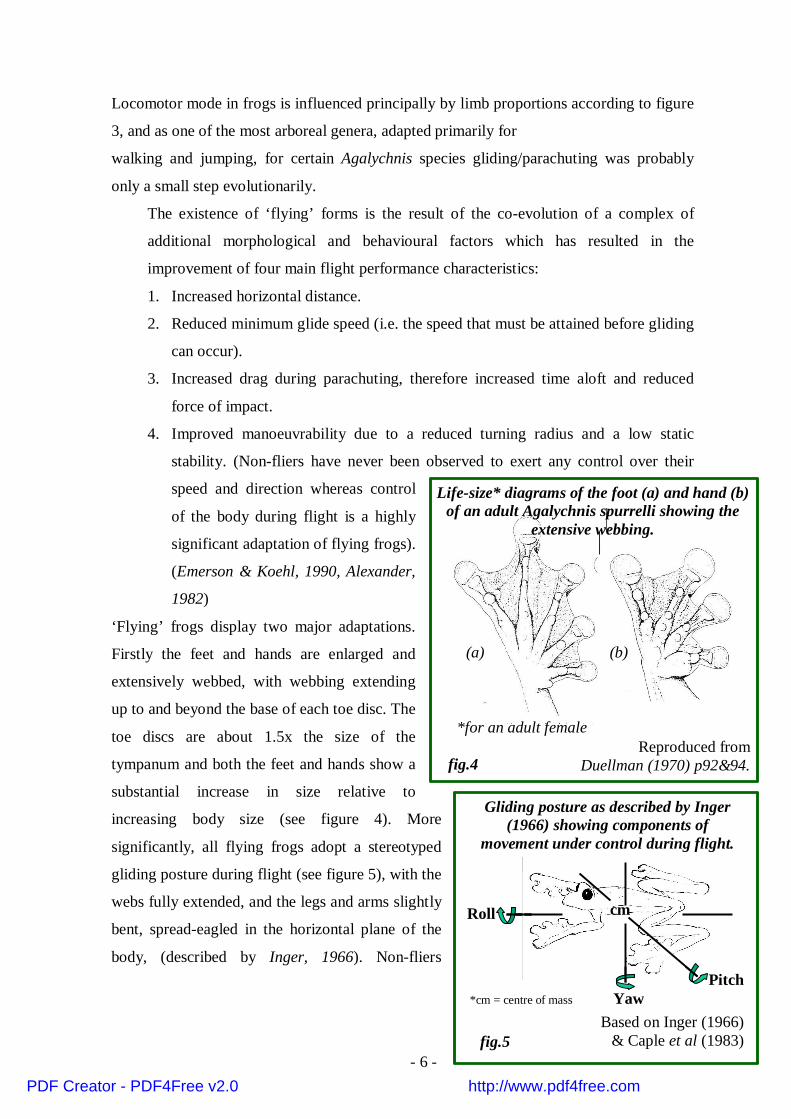
Life-size* diagrams of the foot (a) and hand (b)of an adult Agalychnis spurrelli showing the
extensive webbing.
(a) (b)
*for an adult femaleReproduced from
Duellman (1970) p92&94.fig.4
Roll
PitchYaw
cm
*cm = centre of mass
Gliding posture as described by Inger(1966) showing components of
movement under control during flight.
Based on Inger (1966)& Caple et al (1983)fig.5
Locomotor mode in frogs is influenced principally by limb proportions according to figure
3, and as one of the most arboreal genera, adapted primarily for
walking and jumping, for certain Agalychnis species gliding/parachuting was probably
only a small step evolutionarily.
The existence of ‘flying’ forms is the result of the co-evolution of a complex of
additional morphological and behavioural factors which has resulted in the
improvement of four main flight performance characteristics:
1. Increased horizontal distance.
2. Reduced minimum glide speed (i.e. the speed that must be attained before gliding
can occur).
3. Increased drag during parachuting, therefore increased time aloft and reduced
force of impact.
4. Improved manoeuvrability due to a reduced turning radius and a low static
stability. (Non-fliers have never been observed to exert any control over their
speed and direction whereas control
of the body during flight is a highly
significant adaptation of flying frogs).
(Emerson & Koehl, 1990, Alexander,
1982)
‘Flying’ frogs display two major adaptations.
Firstly the feet and hands are enlarged and
extensively webbed, with webbing extending
up to and beyond the base of each toe disc. The
toe discs are about 1.5x the size of the
tympanum and both the feet and hands show a
substantial increase in size relative to
increasing body size (see figure 4). More
significantly, all flying frogs adopt a stereotyped
gliding posture during flight (see figure 5), with the
webs fully extended, and the legs and arms slightly
bent, spread-eagled in the horizontal plane of the
body, (described by Inger, 1966). Non-fliers
PDF Creator - PDF4Free v2.0 http://www.pdf4free.com
- 7 -
occasionally adopt this position, but tend to leave the legs fully extended in the taking off
position.
In addition, R.nigropalmatus, which is thought to be the most proficient
anuran parachutist, has prominent skin flaps around the edge of the body and the
outer edges of the limbs. These are not present in A. spurrelli. Certain Rhacophorids
also display a reduction in weight relative to body length which improves the aero-
dynamicity by decreasing the wing-loading (Liem 1970).
Consideration of these factors independently highlights their marked
nonadditivity, i.e. the overall improvement resulting from modification of these
characteristics is much greater than the sum of the individual effects, emphasizing
their synergism. Almost as crucial as the interplay of morphological factors is the
interaction between morphology and size. This in itself is not remarkable; the
paradox is that although size is the most important determinant of drag, the
performance of large animals is significantly poorer than predicted whilst that of
animals smaller than 25mm (particularly in terms of horizontal distance) is distinctly
superior to that predicted. This therefore implies that gliding forms are most likely to
be small whereas actually they are, in all groups, the largest representatives
(Emerson & Koehl, 1990), and typically between 75mm (e.g.Boophis species) and
100mm (e.g. Rhacophorus species) (Liem 1970 and see below).
Effects of size
‘Flying’ behaviour has evolved independently in a couple of species of New
World Hylids e.g. Hyla miliaria, (Duellman 1970), and several genera of Old World
Rhacophoridae: Rhacophorus in Malaysia; Boophis in Madagascar; and Polypedates
in Southern China and the Philippines, (Liem 1970). The recurrence of
morphological variants in different family groups is a common phenomenon in
anurans which do not exhibit the increase in morphological diversity with taxonomic
level typical of most animal groups (Emerson, 1988(b), Zug, 1978). This was
initially thought to be a restriction imposed by the reduction of the anuran skeleton;
however it is now generally held that the primary constraint is actually locomotor
mode. Having evolved principally as jumping organisms, all frogs tend to have very
similar morphologies despite their wide variation in ecologies.
Frogs are a fairly unique model for the study of variation in locomotor
function with size as they maintain a fairly constant body shape over a wide size
PDF Creator - PDF4Free v2.0 http://www.pdf4free.com
- 8 -
range. Hill’s model suggests that geometrically similar animals (such as frogs)
should perform similarly regardless of size, for example, small frogs, whose muscles
produce rapid acceleration over a short period of time should be able to jump as far
as large animals whose muscles produce only slow acceleration, but have longer in
which to do so. Intraspecifically, nearly all frogs exhibit strong external geometric
isometry. The only exceptions are the newly metamorphosed frogs of a few species
which undergo a period of allometric growth. This geometric isometry restricts speed
of movement and jump distance with increasing size because relatively more power
is required to produce the same acceleration. This would place large frogs at a
disadvantage, as predator evasion is largely dependent on speed. However, frogs do
jump further with increasing size despite decreasing relative jump distance (i.e.
distance/bodyweight). Some species even manage to maintain constant acceleration
with increasing size. Velocity increases with the distance through which the
propulsive force acts which explains the slight positive correlation between hind leg
length and jump distance, however this is not usually sufficient to account for the
pronounced allometry in jumping performance (Emerson, 1978, Bennet-Clark, 1977
and Alexander, 1971).
Frogs are also unusual in that, intraspecifically, muscle mass, particularly that
of the hind legs, scales isometrically, whereas most other animals violate Hill’s
model in this respect. The best possible explanations for the non-isometric scaling of
muscular activity are therefore increased recruitment of muscle fibres in large frogs
or different proportions of muscle types. Certainly the increasing energetic cost of
maintaining constant acceleration requires increasing morphological specialisation
and the severity of this metabolic cost is reflected in the low stamina of large frogs
(Bennet & Licht, 1974).
PDF Creator - PDF4Free v2.0 http://www.pdf4free.com

- 9 -
The aims of this study are therefore to explore the interplay between morphology and
size in relation to gliding ability, specifically:
• To investigate the relationships between different morphological
characteristics of A. spurrelli to ascertain whether or not they conform to
Hill’s model.
• To determine how flying performance varies with changing size.
• To investigate the level of sexual dimorphism within the species and its
effects on flying performance.
• To determine whether or not this species is capable of gliding according to
the definition provided by Oliver (1951), and to investigate its proficiency
with respect to other “flying” frogs.
• To study the growth of juveniles from the newly-metamorphosed tadpole
stage, and in particular the development of the specific characteristics
associated with gliding behaviour.
Methods.
Part 1. The adults.
The Animals:
Ten male and ten female adult Agalychnis spurrelli were selected from a
group maintained in captivity at Manchester Museum under simulated natural
conditions, originally collected in 2000 from a wild (Caribbean-type) Costa Rican
population by A.R. Gray.
Morphological measurements:
A few days prior to the experiment the dimensions of each frog were
measured as described below and the distinctive dorsal spot pattern was drawn for
identification purposes.
• SVL (snout to vent length) was measured using Digimax digital callipers
whilst the frogs were resting on a flat surface.
• Leg length was measured using Digimax digital callipers from the top of
the leg to the tip of the longest toe (the middle toe).
PDF Creator - PDF4Free v2.0 http://www.pdf4free.com
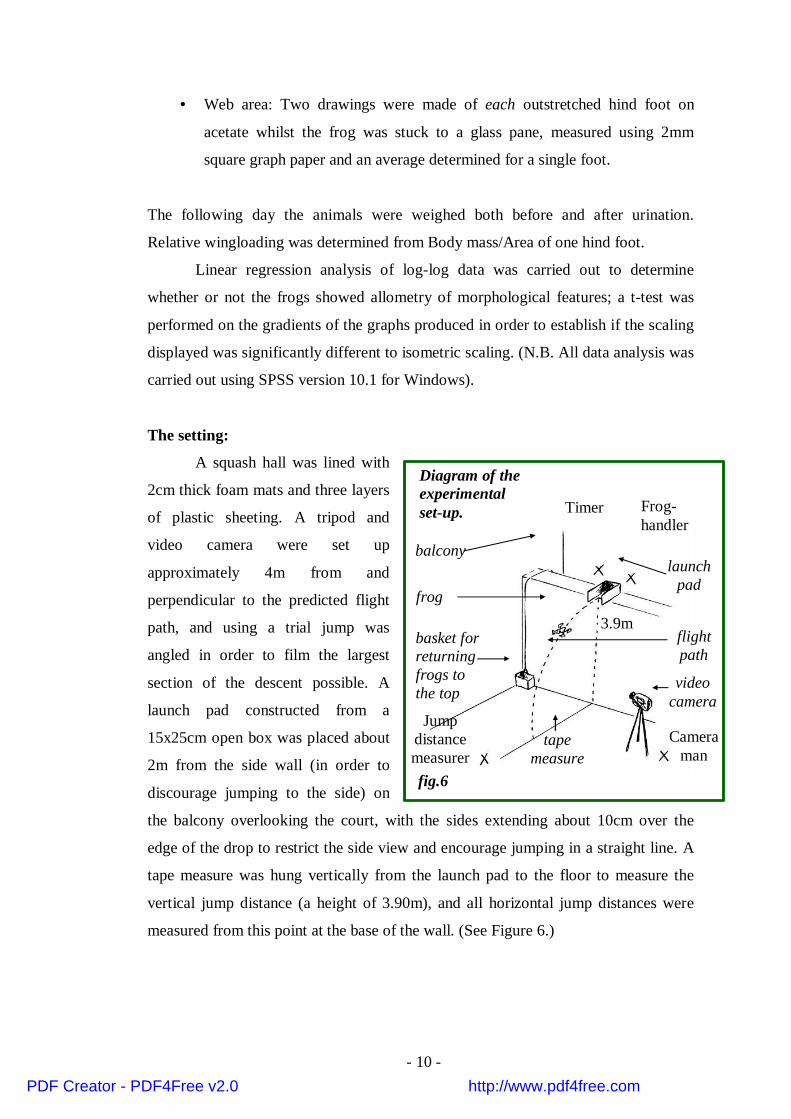
- 10 -
Timer Frog-handler
Cameraman
Jumpdistancemeasurer
3.9m
balcony
basket forreturningfrogs tothe top
frog
tapemeasure
videocamera
launchpad
Diagram of theexperimentalset-up.
flightpath
fig.6
• Web area: Two drawings were made of each outstretched hind foot on
acetate whilst the frog was stuck to a glass pane, measured using 2mm
square graph paper and an average determined for a single foot.
The following day the animals were weighed both before and after urination.
Relative wingloading was determined from Body mass/Area of one hind foot.
Linear regression analysis of log-log data was carried out to determine
whether or not the frogs showed allometry of morphological features; a t-test was
performed on the gradients of the graphs produced in order to establish if the scaling
displayed was significantly different to isometric scaling. (N.B. All data analysis was
carried out using SPSS version 10.1 for Windows).
The setting:
A squash hall was lined with
2cm thick foam mats and three layers
of plastic sheeting. A tripod and
video camera were set up
approximately 4m from and
perpendicular to the predicted flight
path, and using a trial jump was
angled in order to film the largest
section of the descent possible. A
launch pad constructed from a
15x25cm open box was placed about
2m from the side wall (in order to
discourage jumping to the side) on
the balcony overlooking the court, with the sides extending about 10cm over the
edge of the drop to restrict the side view and encourage jumping in a straight line. A
tape measure was hung vertically from the launch pad to the floor to measure the
vertical jump distance (a height of 3.90m), and all horizontal jump distances were
measured from this point at the base of the wall. (See Figure 6.)
PDF Creator - PDF4Free v2.0 http://www.pdf4free.com
- 11 -
The experiment:
Frogs were encouraged to jump by stroking their hind legs, tapping their vent,
or tapping the box behind them. Each was made to jump four times in succession,
each time being returned to the top of the wall using a basket tied to a piece of string.
Whilst not involved in the experiment the frogs were kept in two clear plastic tanks,
(males and females separated for convenience). The tanks were lined with wet tissue,
and kept shaded. Jumps were timed using a stopwatch and the horizontal distance
jumped was measured from the wall to the centre of the frog on landing. General
motivation and behaviour were noted along with posture in jumping, turning in flight
and jumping to one side. Following each jump frogs were checked for signs of stress
such as rapid breathing and colour change. All pregnant females were noted and
experiments on one individual were terminated due to the large number of eggs she
was carrying, although she did not appear unduly stressed. All jumps were recorded
in order (irrespective of whether they were discounted for any reason) due to the
progressive improvement noted in some frogs’ jump distances.
The main section of each flight (excluding the initial jump) was filmed using
an SVHS camcorder; playing the flight back frame by frame enabled the paths to be
plotted on acetates. From these the angles of the linear section of the flight path were
calculated, and filming of a metre scale bar in line with the main light direction
enabled calculation of velocity.
Linear regression analysis on log-log data was again performed to determine
if performance is affected by size. Male and female results were compared using
independent samples T-tests to establish the significance of the apparent sexual
dimorphism in terms of performance. Data were compared with those of previous
studies.
Part 2: The juveniles.
In August 2001, following the previous experiment, three successive broods
of eggs were laid by three different test frogs (the first two batches being laid within
one month of one another). Their development was followed up to metamorphosis
into froglets, and once the entire first and second batches had absorbed their tails
they were weighed, their body lengths measured, and their spot patterns recorded. Of
PDF Creator - PDF4Free v2.0 http://www.pdf4free.com
- 12 -
the 72 juveniles, the development of the 30 most distinctively patterned was then
followed by recording their mass and snout to vent length every four weeks for
sixteen weeks. After thirteen weeks a similar experiment to that described above was
carried out to investigate their flying performance for comparison with the adults.
For this the entire group of (by this stage) 68 frogs were tested. The length of each
was measured prior to testing by placing them on a ruler. The first 30 were made to
jump twice to establish whether improvement was occurring inindividuals. As no
conclusive evidence of this was found the remainder were only made to jump once.
The methods and experimental conditions to which they were subjected were
identical to those described in Part 1 except that the juveniles were not filmed due to
their small size.
Data were averaged to determine mean development rates in terms of mass
and length. Log-log plots of body length against time and jump distance were
produced and linear regression analyses carried out to establish the existence of any
relationships within the data. Jump data averages were used to determine relative
jump distance for comparison with the adults.
Results
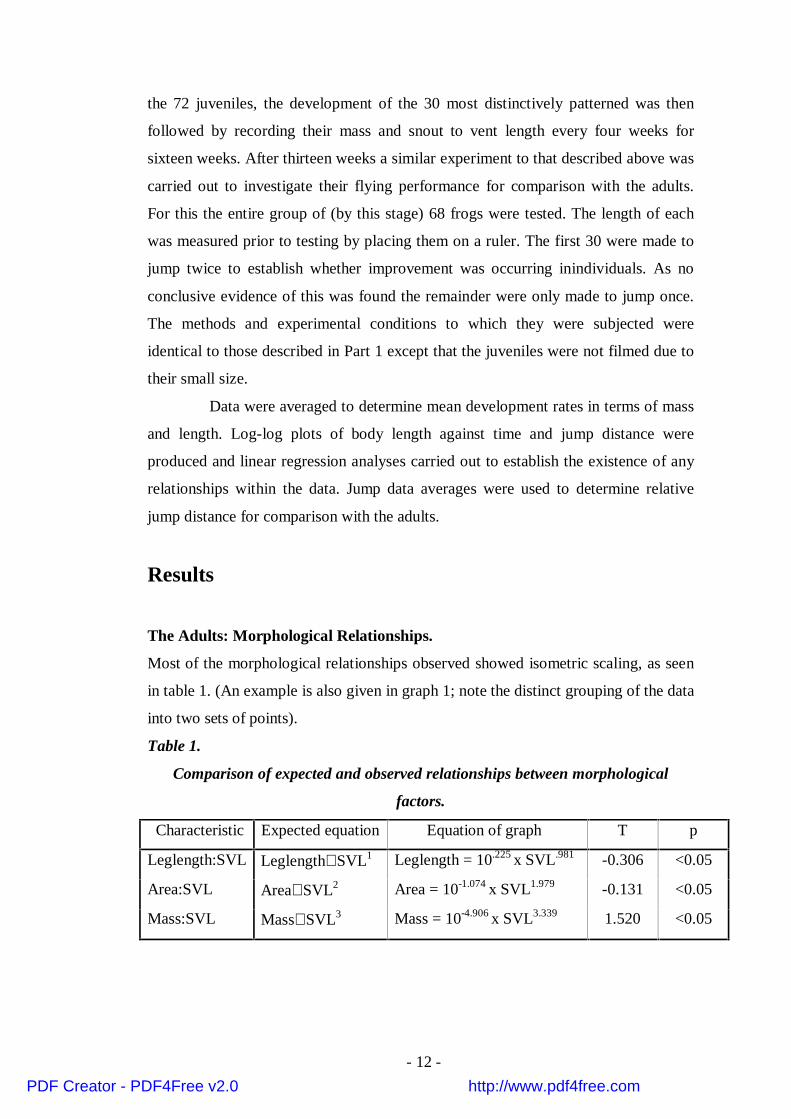
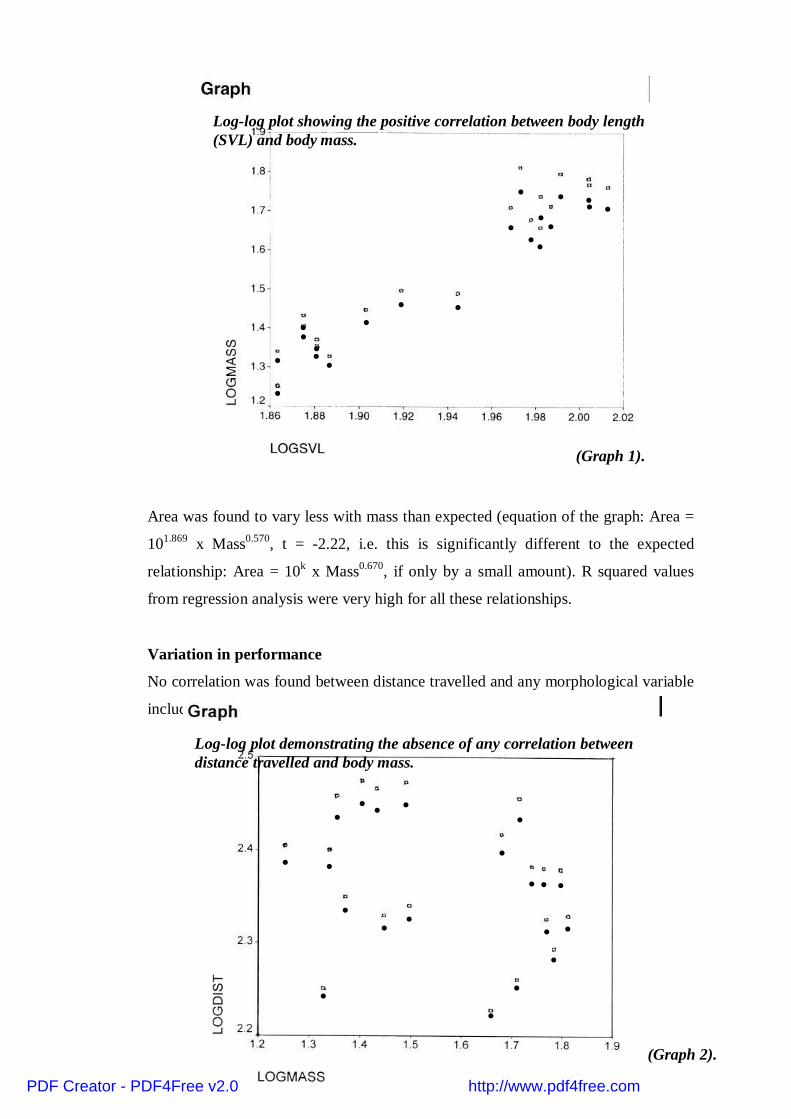
The Adults: Morphological Relationships.
Most of the morphological relationships observed showed isometric scaling, as seen
in table 1. (An example is also given in graph 1; note the distinct grouping of the data
into two sets of points).
Table 1.
Comparison of expected and observed relationships between morphological
factors.
Characteristic Expected equation Equation of graph T p
Leglength:SVL Leglength∝SVL1 Leglength = 10.225 x SVL.981 -0.306 <0.05
Area:SVL Area∝SVL2 Area = 10-1.074 x SVL1.979 -0.131 <0.05
Mass:SVL Mass∝SVL3 Mass = 10-4.906 x SVL3.339 1.520 <0.05
PDF Creator - PDF4Free v2.0 http://www.pdf4free.com
- 13 -
Area was found to vary less with mass than expected (equation of the graph: Area =
101.869 x Mass0.570, t = -2.22, i.e. this is significantly different to the expected
relationship: Area = 10k x Mass0.670, if only by a small amount). R squared values
from regression analysis were very high for all these relationships.
Variation in performance
No correlation was found between distance travelled and any morphological variable
including relative wingloading. (See graph 2).
•
•
•
•
•
•
•
•
••
•
••
•
•
•• •• •
Log-log plot showing the positive correlation between body length(SVL) and body mass.
•• •
•
••
•
•
•
••
•
•
••
•
•
•
•
•
Log-log plot demonstrating the absence of any correlation betweendistance travelled and body mass.
(Graph 1).
(Graph 2).
PDF Creator - PDF4Free v2.0 http://www.pdf4free.com
- 14 -
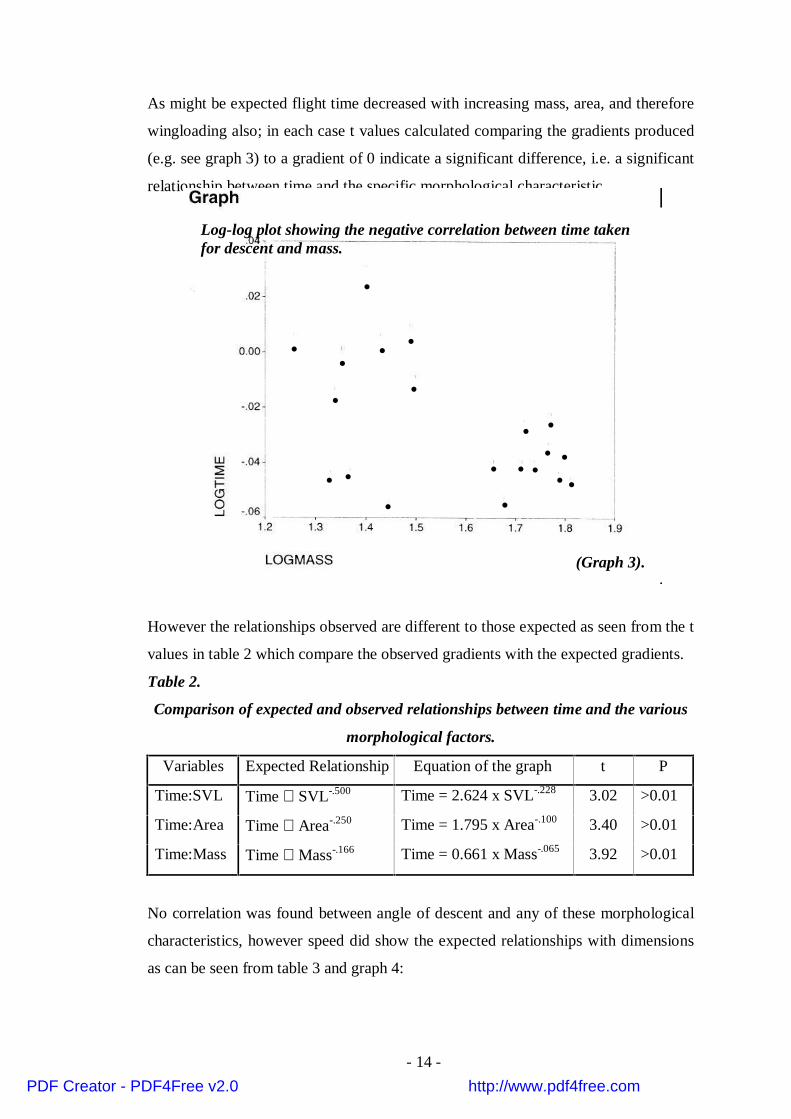
As might be expected flight time decreased with increasing mass, area, and therefore
wingloading also; in each case t values calculated comparing the gradients produced
(e.g. see graph 3) to a gradient of 0 indicate a significant difference, i.e. a significant
relationship between time and the specific morphological characteristic.
However the relationships observed are different to those expected as seen from the t
values in table 2 which compare the observed gradients with the expected gradients.
Table 2.
Comparison of expected and observed relationships between time and the various
morphological factors.
Variables Expected Relationship Equation of the graph t P
Time:SVL Time ∝ SVL-.500 Time = 2.624 x SVL-.228 3.02 >0.01
Time:Area Time ∝ Area-.250 Time = 1.795 x Area-.100 3.40 >0.01
Time:Mass Time ∝ Mass-.166 Time = 0.661 x Mass-.065 3.92 >0.01
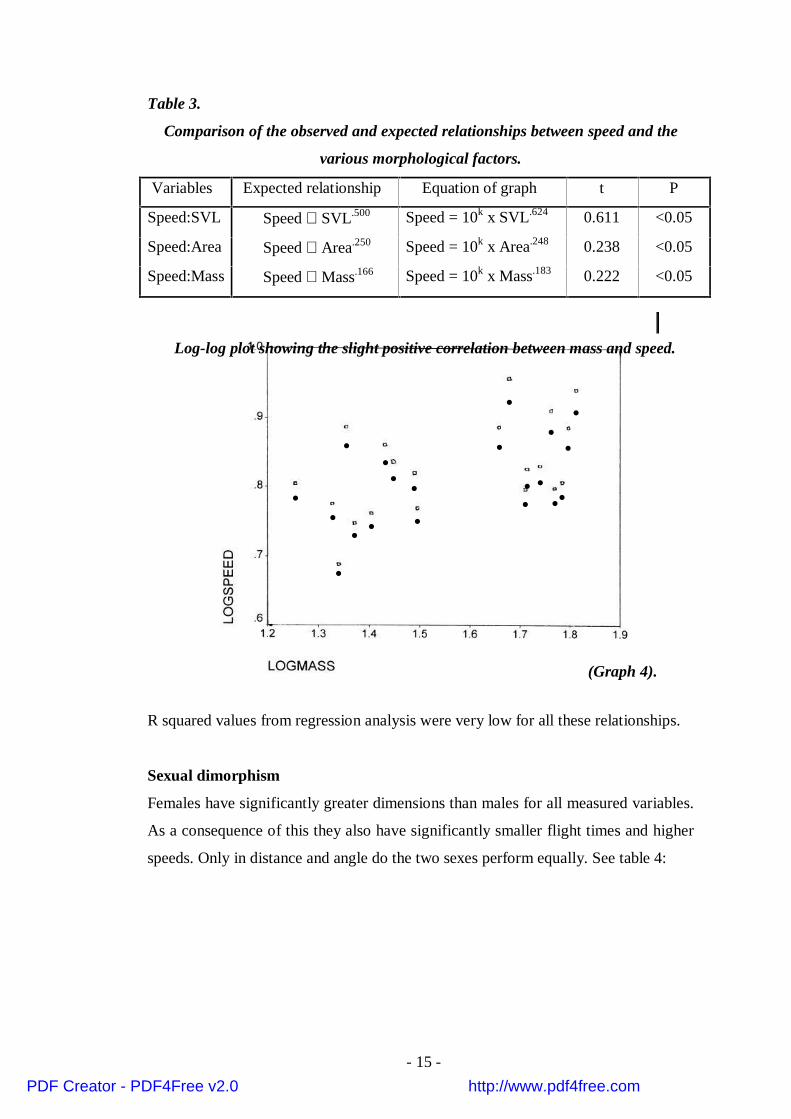
No correlation was found between angle of descent and any of these morphological
characteristics, however speed did show the expected relationships with dimensions
as can be seen from table 3 and graph 4:
•••
•
•
•
•
•
• • • •
••
•••
•
••
Log-log plot showing the negative correlation between time takenfor descent and mass.
(Graph 3).
PDF Creator - PDF4Free v2.0 http://www.pdf4free.com
- 15 -
Table 3.
Comparison of the observed and expected relationships between speed and the
various morphological factors.
Variables Expected relationship Equation of graph t P
Speed:SVL Speed ∝ SVL.500 Speed = 10k x SVL.624 0.611 <0.05
Speed:Area Speed ∝ Area.250 Speed = 10k x Area.248 0.238 <0.05
Speed:Mass Speed ∝ Mass.166 Speed = 10k x Mass.183 0.222 <0.05
R squared values from regression analysis were very low for all these relationships.
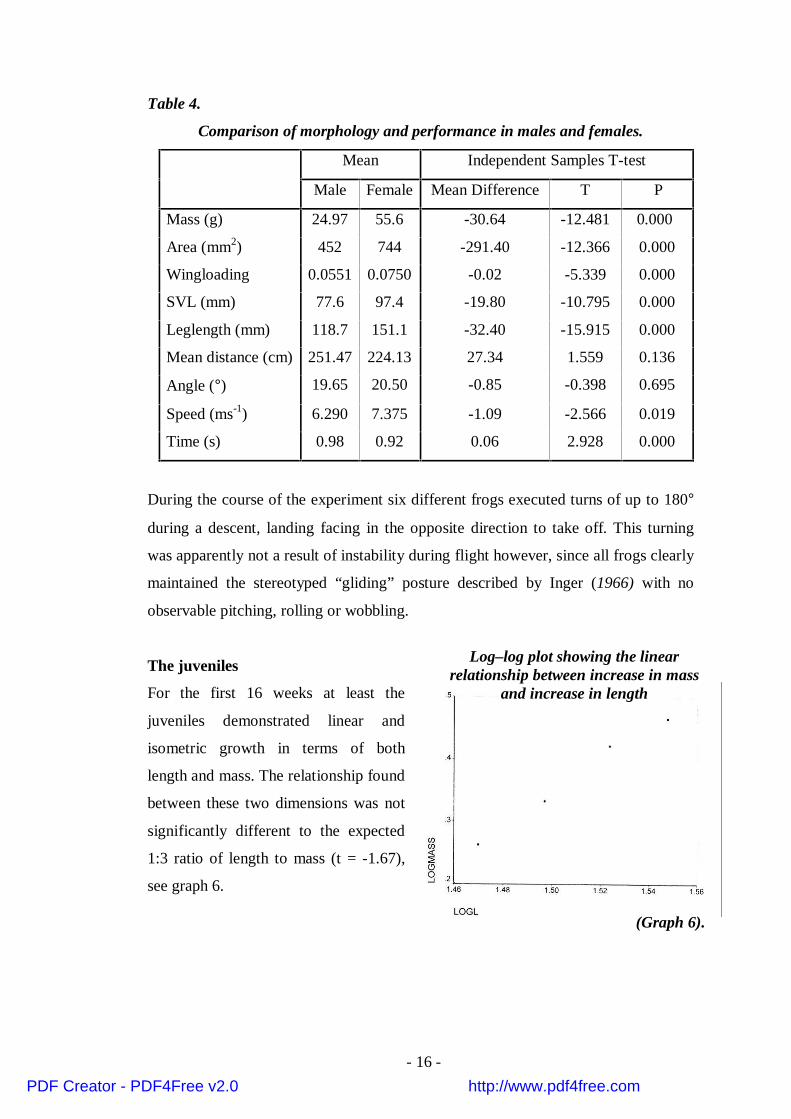
Sexual dimorphism
Females have significantly greater dimensions than males for all measured variables.
As a consequence of this they also have significantly smaller flight times and higher
speeds. Only in distance and angle do the two sexes perform equally. See table 4:
••
••
• •
•
• • •
•
•
•
•
•• ••
•
•
Log-log plot showing the slight positive correlation between mass and speed.
(Graph 4).
PDF Creator - PDF4Free v2.0 http://www.pdf4free.com
- 16 -
Log–log plot showing the linearrelationship between increase in mass
and increase in length
Table 4.
Comparison of morphology and performance in males and females.
Mean Independent Samples T-test
Male Female Mean Difference T P
Mass (g) 24.97 55.6 -30.64 -12.481 0.000
Area (mm2) 452 744 -291.40 -12.366 0.000
Wingloading 0.0551 0.0750 -0.02 -5.339 0.000
SVL (mm) 77.6 97.4 -19.80 -10.795 0.000
Leglength (mm) 118.7 151.1 -32.40 -15.915 0.000
Mean distance (cm) 251.47 224.13 27.34 1.559 0.136
Angle (°) 19.65 20.50 -0.85 -0.398 0.695
Speed (ms-1) 6.290 7.375 -1.09 -2.566 0.019
Time (s) 0.98 0.92 0.06 2.928 0.000
During the course of the experiment six different frogs executed turns of up to 180°
during a descent, landing facing in the opposite direction to take off. This turning
was apparently not a result of instability during flight however, since all frogs clearly
maintained the stereotyped “gliding” posture described by Inger (1966) with no
observable pitching, rolling or wobbling.
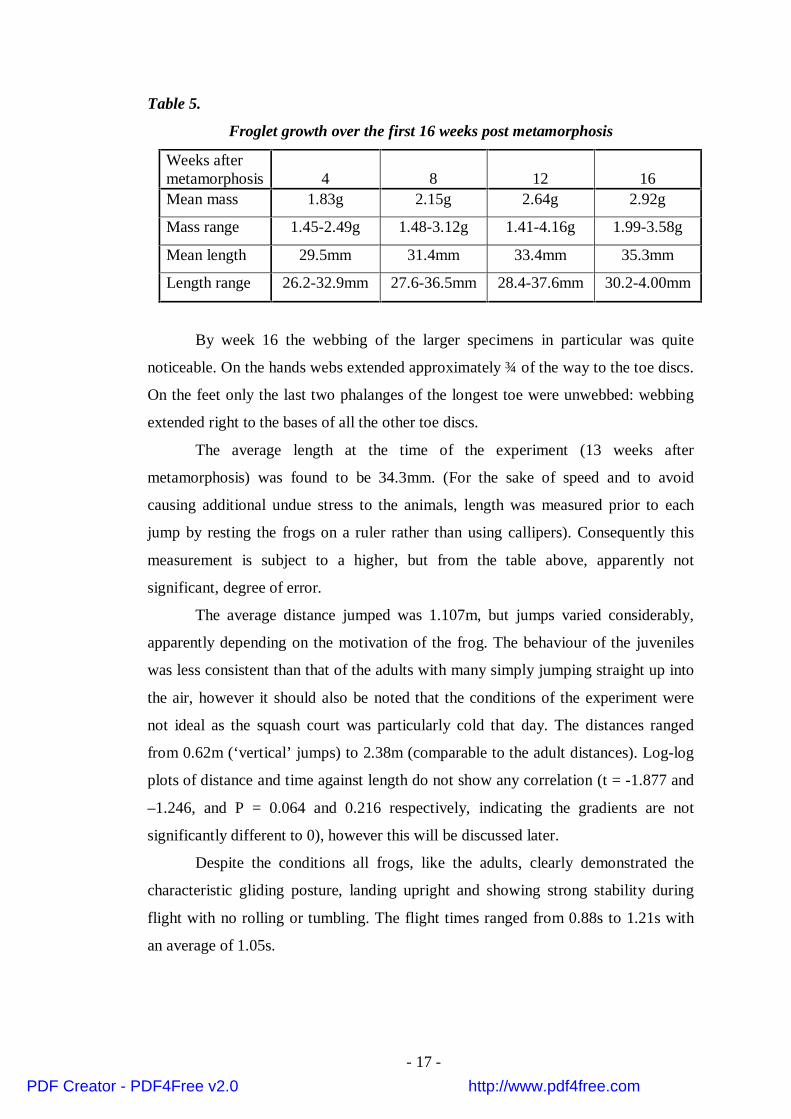
The juveniles
For the first 16 weeks at least the
juveniles demonstrated linear and
isometric growth in terms of both
length and mass. The relationship found
between these two dimensions was not
significantly different to the expected
1:3 ratio of length to mass (t = -1.67),
see graph 6.
(Graph 6).
PDF Creator - PDF4Free v2.0 http://www.pdf4free.com
- 17 -
Table 5.
Froglet growth over the first 16 weeks post metamorphosis
Weeks aftermetamorphosis 4 8 12 16Mean mass 1.83g 2.15g 2.64g 2.92g
Mass range 1.45-2.49g 1.48-3.12g 1.41-4.16g 1.99-3.58g
Mean length 29.5mm 31.4mm 33.4mm 35.3mm
Length range 26.2-32.9mm 27.6-36.5mm 28.4-37.6mm 30.2-4.00mm
By week 16 the webbing of the larger specimens in particular was quite
noticeable. On the hands webs extended approximately ¾ of the way to the toe discs.
On the feet only the last two phalanges of the longest toe were unwebbed: webbing
extended right to the bases of all the other toe discs.
The average length at the time of the experiment (13 weeks after
metamorphosis) was found to be 34.3mm. (For the sake of speed and to avoid
causing additional undue stress to the animals, length was measured prior to each
jump by resting the frogs on a ruler rather than using callipers). Consequently this
measurement is subject to a higher, but from the table above, apparently not
significant, degree of error.
The average distance jumped was 1.107m, but jumps varied considerably,
apparently depending on the motivation of the frog. The behaviour of the juveniles
was less consistent than that of the adults with many simply jumping straight up into
the air, however it should also be noted that the conditions of the experiment were
not ideal as the squash court was particularly cold that day. The distances ranged
from 0.62m (‘vertical’ jumps) to 2.38m (comparable to the adult distances). Log-log
plots of distance and time against length do not show any correlation (t = -1.877 and
–1.246, and P = 0.064 and 0.216 respectively, indicating the gradients are not
significantly different to 0), however this will be discussed later.
Despite the conditions all frogs, like the adults, clearly demonstrated the
characteristic gliding posture, landing upright and showing strong stability during
flight with no rolling or tumbling. The flight times ranged from 0.88s to 1.21s with
an average of 1.05s.
PDF Creator - PDF4Free v2.0 http://www.pdf4free.com
- 18 -
Sources of experimental error.
The greatest errors incurred were in timing as a result of the difficulty in
predicting take off. Errors were also incurred in measuring the areas of the webs,
mostly due to the low level of frog cooperation whilst tracing them. However in both
these cases it is likely that the degree of error is fairly consistent throughout the
experiment. Another source of error was the variation in mass before and after
urination. This is of particular significance in the juveniles as it accounts for a
relatively much larger proportion of the total mass. We would not therefore expect to
observe any correlation between mass and any performance variable, especially over
such a restricted size range.
There is a strong possibility that the behaviour observed does not represent
the frogs’ maximum capability due to the absence of strong motivational cues or
visual stimuli and the general unnaturalness of the conditions, including the low
temperature. However the data are still valid in terms of general trends, behavioural
observations, and for facilitating comparison between studies.
Discussion
Morphological relationships
The observed isometric scaling of morphological features supports the
concept that frogs follow Hill’s model, but at the same time implies a lack of
adaptation for gliding. As flatter objects have better aerodynamicity, one might
expect allometric scaling giving a gradient significantly smaller than 3 for the log-log
graph of mass versus body length, however this is not observed. In fact the reverse is
true and the value obtained is significantly greater than 3 indicating a complete
absence of adaptation. This contrasts with observations by Liem (1970) of
Rhacophorus nigropalmatus which display the expected allometric scaling in
adaptation for gliding, although the extent of this adaptation is not known due to the
absence of published data on their morphology.
PDF Creator - PDF4Free v2.0 http://www.pdf4free.com

- 19 -
Effects of morphology on performance
As in Bishop’s and McKay’s experiments (1999) with the sister species
Agalychnis calcarifer, no correlation was found between horizontal distances
travelled and any morphological factor. This may relate to the function of this
behaviour, indicating that absolute jump distance has been a more significant
selection pressure in its development than relative jump distance. From the
frequently opportunistic nature of the species’ breeding strategy it seems likely that
the primary function of parachuting is in rapid aggregation to exploit a temporary
water source as in the smaller, non-webbed sister species A. saltator. Indeed it may
also be that the structure of the habitat in which they live would not permit gliding
long distances. The decrease in time with size and wing loading does not follow the
expected ratio for an animal fully adapted to gliding. However the fact that the
gradient of the graph is also significantly different to 0 shows that some
compensatory mechanism is at work preventing the animals from simply free-falling.
The absence of any correlation between angle of descent and any
morphological features reflects the lack of correlation with distance. The large angles
to the horizontal confirm that these animals are parachuting rather than gliding.
Although the height from which they were launched was not very great and therefore
potentially insufficient to allow gliding to occur, the speeds reached indicated that
many frogs were nearing terminal velocity at which point gliding is technically
possible. However the frogs showed no indication of a change towards gliding
thereby implying that this species is capable only of parachuting. This contradicts the
assertion by Pough et al (1998) that both R. nigropalmatus and A. spurrelli can glide
at angles of 18°to the horizontal, but supports Scott and Starrett’s conclusion (1974)
that A. spurrelli is a parachutist.
The relationships observed between speed and morphological dimensions
were very close to those expected for gliding or parachuting animals, confirming
once again that despite exhibiting no particular adaptation for gliding they perform
considerably better than if under free fall conditions.
PDF Creator - PDF4Free v2.0 http://www.pdf4free.com
- 20 -
The low R squared values for all the performance analyses indicate that the
variables under study are not the only factors influencing performance and a
considerable amount of variation is due to a combination of other factors which have
not been tested, probably largely a consequence of varying take-off speed.
Predictably only the morphological relationships showed high R squared values.
Sexual dimorphism
The pronounced sexual dimorphism is evident in the graphs as the scatter of
data in virtually all the variables shown (with the exception of relative wingloading)
shows fairly clear division into two groups representing the two sexes. Females are
considerably larger than males in all the dimensions studied, although the two still
conform to Hill’s model of isometric scaling. As a consequence of this size
discrepancy females fly significantly faster than males resulting in significantly
shorter flight times. No significant difference is seen in horizontal distance travelled
however (although females have a slightly lower mean value), which again
emphasizes the lack of correlation between size and horizontal distance overall. The
size discrepancy may therefore relate more closely to breeding strategy, for example
whilst in amplexus females would require significantly larger hands and feet to
maintain a grip on a leaf in order to compensate for the additional weight of the male.
There was also some evidence of a difference in motivational state of males
and females. Generally males required much less encouragement to jump and
jumped increasingly willingly as the trial progressed, whereas females were
reluctant, regardless of how many times they had jumped previously. The only three
exceptions to this were the three females carrying eggs which jumped very willingly:
possibly because the escape instinct was enhanced in these animals as a result of
their condition. A commonly observed behaviour was urination on take off.
Urination is frequently witnessed as an alarm response; however in this case it may
serve a dual function in improving flight performance. Observation of the distance
and speed at which urine is ejected suggest potential propulsive capabilities.
Although no experimental verification of this was attempted, frogs were weighed
prior to and following urination and urination was found to produce an average 11%
weight loss in adults and up to 25.5% in juveniles. In terms of propulsion this is a
considerable mass of liquid, however even if the purpose were not propulsion the
PDF Creator - PDF4Free v2.0 http://www.pdf4free.com

- 21 -
reduction in weight would produce a significant reduction in wingloading and
slowing of the descent. Therefore it seems likely that at least in one respect this
mechanism improves flying performance.
Behavioural observations
Improvement in performance over the course of the trial was a fairly general
trend (in the adults) with eleven out of the twenty frogs (seven male) showing a
gradual improvement in jump angle, and ten (five of each sex) showing a gradual
improvement in horizontal distance. This may be evidence of learning, or growing
accustomed to the height from which they are jumping. It is not known how much (if
any) calculation of height is carried out in the natural habitat prior to jumping,
although this substrate probably provides more visual cues on which to base any
assumptions than the (virtually bare) squash court. Certainly many frogs were
observed to aim for a particular target (e.g. the camera, side wall or measurer),
although best attempts were made to maintain a forward direction by blinkering the
view of the sides from the launch pad. In the event most frogs jumped in a more or
less straight line perpendicular to the wall.
Turning behaviour observed in a few individuals did not appear to result from
any kind of instability during flight with all frogs rigidly maintaining the stereotyped
“gliding” posture. Gliding and parachuting are thought to require active stabilization
as the low aerodynamicity of the frog shape produces low passive stability. Evidence
suggests that inherent instability is actually advantageous in facilitating more rapid
turning ability and lower minimum speeds (Maynard-Smith, 1952) and that unstable
flyers and gliders actually evolved from more primitive, passively stable ones once
they developed a certain degree of active control over their bodies during flight.
Studies involving other species suggest that posture is extremely influential in the
control of static stability, having a far more significant effect than morphology.
(Postural changes exaggerate radial asymmetry deflecting air around the body in
directions other than that parallel to the direction of travel, producing deviation from
the straight path). This in itself appears to emphasize the importance of
manoeuvrability in the evolution of this locomotor type: the bent limb position
adopted by all “flying” frogs studied improves parachuting performance by
increasing drag and significantly improves stability and control of flight, yet it is
favoured above other postures which produce a significant increase in horizontal
PDF Creator - PDF4Free v2.0 http://www.pdf4free.com

- 22 -
distance by providing greater lift (Emerson & Koehl 1990, Emerson et al 1990).
General observation of these frogs in captivity has highlighted their proficiency in
manoeuvring, supporting the theory that this rather than horizontal distance has been
the driving force in development of this behaviour.
The juveniles
As the test conditions were identical in both experiments, comparison with
the adults is possible in terms of relative jump distance. This statistic indicates an
impressive performance by the juveniles with a relative jump distance of 41cm g-1
compared to 10 cm g-1 for the males and 4cm g –1 for the females. The log-log plots
of distance against length show no clear correlation, but given the small size range
involved this is unsurprising. However, the large number of results mask a small
number of particularly long jumps performed by the largest individuals (≈40mm) in
the group. These suggest that the maximum achievable distance may increase with
size to a certain maximum value, (quite probably one which had not been attained at
the time of the experiment), at which point further mass increase then enters the
pronounced negative correlation with distance as witnessed. This is also apparently
supported by Scott and Starrett’s data which imply a relative jump distance
intermediate between the juveniles and the adult males in this experiment (as befits
their size) however the absence of any mass measurements prevent direct
comparison. There may be a sudden improvement in jumping performance at a
particular size, relating to other developmental changes occurring at this stage, for
example an increase in muscle mass as opposed simply to an increase in bulk. (It is
known that some species exhibit a phase of uncharacteristic allometric growth).
Comparison of mass increase with length increase shows that the juvenile group as a
whole had not undergone any allometric growth within the first 16 weeks of
development. The primary question then concerns the selective forces driving the
evolution of size beyond that which optimises this mode of locomotion. During a
number of flights juveniles were apparently observed using their forefeet as air
brakes, a behaviour not observed in the adults. The function of this is naturally
speculative, but most probably relates to postural control since posture was rigidly
and consistently maintained during all tests. If so this once again highlights the
significance of stability and the benefits of larger size for control. Alternatively the
PDF Creator - PDF4Free v2.0 http://www.pdf4free.com

- 23 -
problem may be viewed from the reverse angle, taking into account Bennet and
Licht’s studies of the negative correlation between stamina and size (1974) and the
suggested use of gliding simply as an energetically inexpensive mode of travel
(Norberg, 1981); i.e. gliding/parachuting as a means of travel may permit
exploitation of the advantages of large size whilst avoiding the usual compromise in
speed, or the expensive physiological adaptations otherwise required in
compensation.
Comparison with other studies.
Although statistical comparison with other studies is not possible due to the
different experimental conditions, a basic comparison of the results is still of some
use. Comparison with Scott and Starrett’s data for Pacific coast specimens (1974)
highlights the significant size discrepancy between these and the Caribbean forms.
The two sets of data correlate well in terms of proportions emphasizing the
adherence to Hill’s model seen in this species as a whole. This morphological
investigation shows that the Caribbean specimens have both larger feet with respect
to body length and also more extensive webbing between the digits, (webbing in
some Pacific forms studied only extends as far as the penultimate phalanges, whereas
that in Caribbean forms extends at least to the base of the toe pads and on some toes
right to the centre of the disc), (Gray, unpubl. data, Duellman, 1970). Yet gliding
ability also appears to scale fairly uniformly. This therefore prompts the question as
to what has driven the divergence in size on the opposite coasts as adaptation to
enhance parachuting performance in one or another population is evidently not a
factor. The observation of breeding aggregations involving several thousand
individuals in a very small area prompts speculation as to the influence of density-
dependent factors. This draws on findings by Rose (1960) that growth of tadpoles in
certain Rana species is inversely proportional to density and that, even more
significantly, certain individuals within a population are able to produce a water-
borne growth retarding factor which inhibits the growth of conspecifics in the
immediate vicinity. Although the existence of this behaviour has not been
investigated in this particular species, the possibility of a similar mechanism acting
under conditions involving explosive breeding is a feasible one, especially if the size
discrepancy between the two coasts is mirrored by a discrepancy in the predominant
breeding strategy.
PDF Creator - PDF4Free v2.0 http://www.pdf4free.com

- 24 -
Comparison with Emerson’s data for R. nigropalmatus and other
Rhacophorids (1990) show that the former at least are considerably more proficient
parachutists achieving much greater glide distances and lower glide angles. These are
similar in body length, but have more extensive webbing (between 50 and 120%
more than A. spurrelli), (Inger 1966), and differences in body form: A. spurrelli do
not have the characteristic body flaps seen in some Rhacophorus species and
possibly have a much higher bodyweight to body length ratio. These results suggest
that body form is of considerably greater significance than suggested by Emerson’s
results, which serves to emphasize once again the high levels of nonadditivity of
morphological characteristics brought to light in those experiments. Despite better
gliding performances in Rhacophorus (R. nigropalmatus is capable of true gliding),
the same bias is seen in A. spurrelli towards adaptation for improved
manoeuvrability above improved horizontal distance.
ConclusionLike the majority of anurans A. spurrelli conforms to Hill’s model of
geometric similarity with all dimensions scaling isometrically. Pronounced sexual
dimorphism is observed, however its effects on performance are relatively minor,
accounting only for a slight weight-related correlation with speed. Although not
capable of true gliding and distinctly less proficient a flyer than R. nigropalmatus,
this species does show parachuting behaviour. Parachuting is facilitated by the
enlarged and extensively webbed feet and hands, however a large number of other
factors synergistically influence performance, for which it is impossible to test
individually. Of these probably the most significant factor is posture. A. spurrelli
consistently adopts the characteristic gliding posture as described by Inger (1966),
and evidence suggests that the principle purpose of this stance is to improve stability
and control, with the implication that this, rather than distance has been the driving
factor behind evolution of this locomotor type.
There is great potential for further study in this area, particularly concerning
determination of size and, relating to this, the factors producing the observed
geographical size dimorphism in the species. This would probably require a thorough
investigation of behaviour in the natural environment and analysis of the different
ecological factors influencing the two populations.
PDF Creator - PDF4Free v2.0 http://www.pdf4free.com

- 25 -
Acknowledgements
I would like to thank Andrew Gray and Michael Kelly for their invaluable support,
assistance, information and encouragement throughout the project and for providing
the frogs. Thanks also go to the staff at the McDougal Sports Centre for their
cooperation with very bizarre requests. Finally, many thanks to Dr. Roland Ennos for
all his advice and enthusiasm.
ReferencesAlexander, R.McN. 1971 “Size And Shape Studies In Biology (29) 59pages
Arnold, London
Alexander, R.McN. 1982 “Locomotion Of Animals” p54-61 Chapman and
Hall, New York
Bennet, A.F. and Licht, P. 1974 “Anaerobic metabolism during activity in
amphibians” Comp. Biochem. Physiol. A 48 319-327
Bennet-Clark, H.C. 1977 “Scale Effects Of Animal Locomotion” pages185-
201 Acadenic Press. New York
Bishop, K.L. 1999 Abstract. Amer. Zool. 39(5) 501
Boulenger, G.A. 1913 “On a collection of batrachians and reptiles made by
Dr.H.G.F. Spurrell, F.Z.S., in the Choco, Colombia” Proc. Zool. Soc. LXVIII 1019-
1046
Calow, L.J. and Alexander, R.McN. 1973 “A mechanical analysis of the
hind leg of a frog (Rana temporaria)” Lond. J. Zool. 171 293-321
Caple, G., Balda, R.P. and Willis, W.R. 1983 “The physics of leaping
animals and the evolution of preflight” Amer. Nat. 121(4) 455-475
Cochran, D.M. and Goin, C.J. 1970 “Frogs of Colombia” Bull.
Smithsonian Institution U.S. Nat. Mus. 288 149-151
PDF Creator - PDF4Free v2.0 http://www.pdf4free.com

- 26 -
Cott, H.B. 1926 “Observations on the life habits of some batracians and
reptiles from the Lower Amazon and a note on some mammals from Marajo Island”
Proc. Zool. Soc. Lond. 4 1159-1178
Duellman, W.E. 1970 “The Hylid frogs of Middle America” Monograph
Mus. Nat. Hist. Uni. Kansas vol.1 90-95 & 124-130
Emerson, S.B. 1978 “Allometry and jumping in frogs: helping the twain to
meet.” Evolution 32 551-564
Emerson, S.B. 1982 “Frog post-cranial morphology: identification of a
functional complex” Copeia 603-613
Emerson, S.B. 1984 “Morphological variation in frog pectoral girdles:
testing alternatives to a traditional adaptive explanation” Evolution 38 376-388
Emerson, S.B. 1988(b) “Convergence and morphological constraint in frogs:
variation in post-cranial morphology” Fieldiana: Zool. (New Series) 43 1-19
Emerson, S.B. and Koehl, M.A.R. 1990 “The interaction of behavioural and
morphological change in the evolution of a novel locomotor type: ‘flying’ frogs”
Evolution 44(4) 1931-1946
Emerson, S.B., Koehl, M.A.R. and Travis, J. 1990 “Functional complexes
and additivity in performance – A test case with ‘flying’ frogs” Evolution 44(4)
2153-2157
Ennos, A.R. 1999 “Statistics And Data Handling Skills In Biology” Addison
Wesley Longman Ltd 144 pages
Gray, A.R. 1997 “Observations on the biology of Agalychnis spurrelli from
the Caribbean lowlands of Costa Rica” J. Int. Herpet. Soc. 22(2) 61-70
Griffiths, I. 1966 “The phylogeny of the salienta” Biol. Rev. 38 241-292
Inger, R.F. 1966 “The systematics and zoogeography of the amphibia of
Borneo” Fieldiana: Zool. 52 1-402
Liem, S.S. 1970 “The morphology, systematics and evolution of the Old
World treefrogs (Rhacophoridae and Hyperoliidae)” Fieldiana: Zool. 57 1-145
MacBride E.W. 1932 “Recent work on the development of the vertebral
column” Biol.Rev. 7 108-148
Maynard-Smith, J. 1952 “The importance of the nervous system in the
evolution of animal flight” Evolution 6 127-129
McKay, M. 1999 Abstract. Amer. Zool. 39(5) 614
PDF Creator - PDF4Free v2.0 http://www.pdf4free.com
- 27 -
Noble, G.K.1931 “The Biology Of The Amphibia” 577pages McGraw-Hill
Book Company, Inc. London
Norberg, U.M. 1985 “Evolution of vertebrate flight: An aerodynamic model
for the transition from gliding to active flight” Amer. Nat. 126 303-327
Oliver, J.A. 1951 “Gliding in amphibians and reptiles with a remark on
arboreal adaptation in the lizard Anolis carolinensis carolinensis”. Amer. Nat. 85
171-176
Pough, F.H. Andrews, R.M. Cadle, J.E. Crump, M.L. Savitzky, A.H.
Wells, K.D. “Herpetology” 2nd ed. 612pages Prentice Hall ltd. London
Rose, S.M. 1960 “Feedback mechanisms on growth control: possible stunting
resulting from high density populations”. Ecol. 41 188-199
Savage, J.M. and Heyer, W.R. 1967 “Variation and distribution in the
treefrog genus Phyllomedusa in Costa Rica, Central America” Bietr. Neotrop. Fauna
5 111-131
Saville, D.B.O. 1962 “Gliding and flight in the vertebrates” Amer. Zool. 2
161-166
Scott, N.L. and Starrett, A. 1974 “An unusual breeding aggregation of frogs
with notes on the ecology of Agalychnis spurrelli (Anura: Hylidae) Bull. South.
Calif. Acad. Sci. 73(2) 86-94
Zug, G.R. 1972 “Anuran locomotion: structure and function. Preliminary
observations on the relationship between jumping and osteometrics in the
appendicular axial skeleton” Copeia 613-624
Zug, G.R. 1978 “Anuran locomotion - structure and function: Jumping
performance of semiaquatic, terrestrial, and arboreal frogs” Smithsonian
Contributions to Zoology 276 1-31
Zug, G.R. 1993 “Herpetology” 527pages Academic Press Inc. London
PDF Creator - PDF4Free v2.0 http://www.pdf4free.com