Embed Size (px)
Citation preview

Appendix C - Risk Assessment
The GLMRIS Report
USACE01/06/2014


January 2014
RISK ASSESSMENTS CONTENTS GLMRIS Assessment Approach for Characterizing the Risks of Adverse Impact from the Movement through the CAWS and Establishment of Aquatic Nuisance Species in the Great Lakes and Mississippi River Basins .................................................................................. C‐1 Risk of Adverse Impacts from the Movement through the CAWS and Establishment of Aquatic Nuisance Species in the Great Lakes and Mississippi River Basins – Volume I ........... C‐47 Risk of Adverse Impacts from the Movement through the CAWS and Establishment of Aquatic Nuisance Species in the Great Lakes and Mississippi River Basins – Volume II .......... C‐469

January 2014


Prepared by I. Hlohowskyj, M. Grippo, J. Hayse, and L. Fox, Environmental Science Division, Argonne National Laboratory, and C. Yoe, HydroPlan LLC. Work by Argonne National Laboratory was supported under Military Interdepartmental Purchase Request W81G6621049856 from the U.S. Department of Defense, Department of the Army, Corps of Engineers Chicago District, through U.S. Department of Energy contract DE-AC02-06CH11357.
About Argonne National Laboratory Argonne is a U.S. Department of Energy laboratory managed by UChicago Argonne, LLC, under contract DE-AC02-06CH11357. The laboratory's main facility is outside Chicago at 9700 South Cass Avenue, Argonne, Illinois 60439. For information about Argonne, see www.anl.gov.

January 2014
C‐iii
CONTENTS Acronyms .................................................................................................................................. C‐vi 1 Introduction ..................................................................................................................... C‐1 1.1 Background ............................................................................................................. C‐1 1.2 GLMRIS Study Area ................................................................................................. C‐1 1.3 Risk Assessment Goals and Objectives ................................................................... C‐2 2 GLMRIS Risk Assessment Approach ................................................................................. C‐3 2.1 Definition of Risk in the GLMRIS Program .............................................................. C‐4 2.2 Qualitative vs. Quantitative Risk Assessment ......................................................... C‐4 2.3 Uncertainty ............................................................................................................. C‐5 3 GLMRIS Risk Assessment Methodology .......................................................................... C‐5 3.1 Identification of the ANS of Concern ...................................................................... C‐7 3.1.1 ANS Problem Formulation .......................................................................... C‐7 3.1.2 The CAWS Pathways ................................................................................... C‐8 3.1.2.1 Pathway 1: Wilmette Pumping Station to Brandon Road Lock and Dam ............................................................................... C‐8 3.1.2.2 Pathway 2: Chicago River Controlling Works to Brandon Road Lock and Dam ..................................................................... C‐10 3.1.2.3 Pathway 3: Calumet Harbor to Brandon Road Lock and Dam .... C‐11 3.1.2.4 Pathway 4: Indiana Harbor and Canal to Brandon Road Lock and Dam ............................................................................... C‐13 3.1.2.5 Pathway 5: Burns Small Boat Harbor to Brandon Road Lock and Dam ............................................................................... C‐13 3.1.3 Problem Statements ................................................................................... C‐13 3.1.4 Risk Hypotheses and Questions .................................................................. C‐15 3.2 ANS Establishment Assessment .............................................................................. C‐16 3.2.1 Probability of Establishment ....................................................................... C‐16 3.2.2 Probability Ratings ...................................................................................... C‐17 3.2.3 Probability Element Definitions and Assumptions ..................................... C‐18 3.2.3.1 Probability of Pathway ................................................................. C‐18 3.2.3.2 Probability of Arrival .................................................................... C‐18 3.2.3.3 Probability of Passage .................................................................. C‐19 3.2.3.4 Probability of Colonization .......................................................... C‐20 3.2.3.5 Probability of Spread ................................................................... C‐20 3.2.3.6 Probability of Establishment ........................................................ C‐20 3.2.4 Time Period of the Establishment Assessments ......................................... C‐21 3.2.5 Uncertainty Ratings ..................................................................................... C‐21

January 2014
C‐iv
CONTENTS (Cont.) 3.2.6 Estimating the Probability of Establishment ............................................. C‐22 3.2.6.1 Probability of Establishment ........................................................ C‐22 3.3 ANS Consequences Assessment ............................................................................. C‐24 3.3.1 Consequence Elements ............................................................................... C‐24 3.3.2 Consequence Ratings .................................................................................. C‐25 3.3.3 Consequence Definitions and Assumptions ............................................... C‐26 3.3.3.1 Environmental Consequences ..................................................... C‐26 3.3.3.2 Economic Consequences ............................................................. C‐29 3.3.3.3 Social/Political Consequences ..................................................... C‐30 3.3.4 Consequence Uncertainty Ratings .............................................................. C‐34 3.3.5 Estimating the Overall Consequences of Establishment ............................ C‐34 3.3.5.1 Estimating Overall Consequences ............................................... C‐34 3.4 Estimating Risk of Adverse Impacts ........................................................................ C‐37 3.4.1 Evaluating ANS‐Specific Risks ..................................................................... C‐37 3.4.2 Evaluating Pathway‐Specific Risks .............................................................. C‐41 3.5 Pathway Risk Management .................................................................................... C‐42 3.6 References .............................................................................................................. C‐43
FIGURES 1 GLMRIS Study Area ....................................................................................................... C‐1 2 Focus Area I: Chicago Area Waterway System ............................................................ C‐2 3 GLMRIS ANS Risk Assessment Process ......................................................................... C‐6 4 CAWS Pathway 1: Wilmette Pumping Station to Brandon Road Lock and Dam ......... C‐10 5 CAWS Pathway 2: Chicago River Controlling Works to Brandon Road Lock and Dam ................................................................................................................ C‐11 6 CAWS Pathway 3: Calumet Harbor to Brandon Road Lock and Dam .......................... C‐12 7 CAWS Pathway 4: Indiana Harbor and Canal to Brandon Road Lock and Dam ........... C‐14 8 CAWS Pathway 5: Burns Small Boat Harbor to Brandon Road Lock and Dam ............ C‐15

January 2014
C‐v
TABLES 1 Aquatic Nuisance Species Occurring in Either the Mississippi River or Great Lakes Basins to be Evaluated for Risk of Adverse Impacts ................................. C‐9 2 Hypothetical Example of a Quantitative Probability Assessment of Establishment .... C‐22 3 Hypothetical Example of a Qualitative Probability Assessment of Establishment ....... C‐23 4 Example Environmental Consequences Matrix ............................................................ C‐28 5 Example Economic Consequences Matrix .................................................................... C‐31 6 Example Social/Political Consequences Matrix ............................................................ C‐33 7 Determination of Overall Consequence Level of ANS Establishment .......................... C‐35 8 Example of Overall Consequence Level Determination ............................................... C‐36 9 Comparative Risk Matrix Showing the Multiplicative Method, the ANS Task Force, and an Alternative Additive Method to Determine the Overall ANS Risk Level ....................................................................................................................... C‐38 10 Example of a Risk Matrix Conforming to the Principles of Weak Consistency ............. C‐39 11 GLMRIS Multiplicative Method to Determine the Overall ANS Risk Level ................... C‐39 12 Hypothetical Example of ANS‐Specific Pathway Risk Levels ........................................ C‐41 13 Example of Overall Pathway Risk Ranking .................................................................... C‐42

January 2014
C‐vi
ACRONYMS ANS aquatic nuisance species ANSTF Aquatic Nuisance Species Task Force APHIS Animal Plant Health Inspection Service CAWS Chicago Area Waterway System CRCW Chicago River Controlling Works CSSC Chicago Sanitary and Ship Canal EPA U.S. Environmental Protection Agency GL Great Lakes GLMRIS Great Lakes Mississippi River Interbasin Study MR Mississippi River NRC National Research Council RMM risk management measure USACE U.S. Army Corps of Engineers WRDA Water Resource Development Act

C‐1 January 2014
1 INTRODUCTION 1.1 BACKGROUND The Water Resources Development Act of 2007 (WRDA) directs the U.S. Army Corps of Engineers (USACE) to conduct a study to determine the range of options and technologies available to prevent aquatic nuisance species (ANS) transfer through aquatic pathways between the Great Lakes (GL) and Mississippi River (MR) Basins. For the purposes of GLMRIS, the term prevent means to reduce the risk to the maximum extent possible, because it may not be technologically feasible to achieve an absolute solution. To fulfill this authority, USACE is conducting the Great Lakes and Mississippi River Interbasin Study (GLMRIS). 1.2 GLMRIS STUDY AREA The GLMRIS study area encompasses the U.S. portions of the GL and MR Basins (Fig. 1). A number of known and potential surface water connections between the two basins occur along the basins’ shared 2,414‐km (1,500‐mi) shared boundary, which runs from northern Minnesota through the Great Lakes states to western New York (Fig. 1). The USACE is conducting GLMRIS along two concurrent tracks: Focus Area I and Focus Area II. Focus Area I addresses ANS transfer that may occur through the Chicago Area Waterway System (CAWS) (Fig. 2), which is the only hydraulically permanent connection between the two basins. The CAWS is a highly
FIGURE 1 GLMRIS Study Area

C‐2 January 2014
FIGURE 2 Focus Area I: Chicago Area Waterway System
utilized, continuous, man‐made connection between the basins, and represents the most significant likelihood for potential ANS transfer. Focus Area II addresses surface water connections between the basins that may occur outside of the CAWS. 1.3 RISK ASSESSMENT GOALS AND OBJECTIVES The GLMRIS Program is conducting risk assessments for 35 ANS that may currently be found in one or the other of the two basins, and for which an initial concern of between‐basin transfer

C‐3 January 2014
has been identified. As previously mentioned, the GLMRIS Program conducted a risk assessment to identify the potential risk of current and future ANS establishment and associated adverse impacts. The results of the risk assessment were used in the identification and evaluation of potential control measures for reducing, to the maximum extent possible, the risk of interbasin ANS transfer via surface water connections between the basins. While the risk assessment characterized the risks of each ANS undergoing interbasin transfer, becoming established in the new basin, and adversely impacting the new basin and its resources, the risk assessment was not intended to provide a definitive estimation of risks associated with each ANS. Per WRDA, the USACE is responsible not for addressing the current abundance and distribution of ANS and developing policies and methods for controlling and reducing populations of established ANS, but rather for identifying measures for controlling interbasin ANS transfer between the two basins. In support of this responsibility, the GLMRIS risk assessment will be used to categorize and rank the ANS on the basis of:
• Likelihood of becoming established in a new basin;
• Potential for successfully undergoing interbasin transfer; and
• Potential for adversely impacting environmental, economic, and social resources and services.
The ANS identified as having the highest potentials for establishment, interbasin transfer, and undesirable impacts will then serve as the focus of the FS with regard to identifying and evaluating potential measures for controlling interbasin transfer of these species. For Focus Area I (the CAWS), the risk assessment will also characterize and rank the five pathways (Fig. 2) with regard to the number of high‐risk ANS that could successfully use each pathway for successful interbasin transfer.
2 GLMRIS RISK ASSESSMENT APPROACH The USACE GLMRIS Risk Assessment Team held a two‐day workshop, January 24–25, 2012, to develop its risk assessment approach. Workshop participants included risk assessors, ecologists, and other subject matter experts from USACE, Argonne National Laboratory, and HydroPlan, LLC. The risk assessment approach adopted by the GLMRIS Program follows a phased approach: (1) Problem Formulation; (2) Analysis; and (3) Risk Characterization. The Problem Formulation phase identifies the issues that require risk management for which the risk assessments provide scientifically defensible support. During the Analysis phase, both the effects of exposure and the levels of exposure are identified. The final phase is Risk Characterization, in which the results of the Analysis phase are used to evaluate the likelihood of adverse effects occurring, given the level of exposure and the effects considered. The aspects of each phase as they relate to the GLMRIS risk assessments are discussed later in detail.

C‐4 January 2014
Methods for assessing the risk posed by invasive species are wide ranging but fall within two basic groups, quantitative (e.g., statistical) and qualitative (e.g., ranking based on expert opinion). When faced with a shortage of empirical data that would be required to populate a statistical model, using a synthesis of available information and expert judgment (Pheloung et. al. 1999), to screen and identify species that pose a risk to uninvaded domains, has been a popular method of qualitative risk assessment (Benke et. al. 2011; Powell 2004; Parker et. al. 2007). The GLMRIS risk assessment method uses an approach in which risk is evaluated in terms of the probability of establishment and consequence of establishment. This method is patterned primarily on the long established Generic Nonindigenous Aquatic Organisms Risk Analysis Process developed by the Risk Assessment and Management Committee of the Aquatic Nuisance Species Task Force (ANSTF 1996). Similar methods for ANS risk assessments in the Great Lakes have been used by Fisheries and Oceans Canada (Canadian Council of Fisheries and Aquaculture Ministers, 2002; Cudmore et al. 2012) and the U.S. Department of Agriculture (USDA 2004). The GLMRIS risk assessment approach is also consistent with the U.S. Environmental Protection Agency Framework for Ecological Risk Assessment (EPA 1992) and Guidelines for Ecological Risk Assessment (EPA 1998), and is conceptually similar to the National Research Council (NRC) paradigm for human health risk assessment (NRC 1983). 2.1 DEFINITION OF RISK IN THE GLMRIS PROGRAM Risk may be defined as the expected likelihood of an undesirable outcome occurring as the result of exposure to a stressor that can induce an adverse response. Thus, risk is a function of the level of exposure to a stressor that may occur and the effects that may be incurred with exposure to the stressor. Therefore, risk may be simply expressed as: Risk of adverse impacts = Exposure to the stressor + Effects of the exposure A stressor can take many forms. It could be physical (e.g., high temperature, high noise) or chemical (e.g., a pollutant) in nature. A stressor may also be biological, such as a disease agent or an ANS. 2.2 QUALITATIVE VS. QUANTITATIVE RISK ASSESSMENT Quantitative risk assessments provide numerical inputs and outputs to characterize the level of risk associated with a particular scenario or condition. Input data collected from project‐specific studies and available scientific literature are employed in models to provide numeric estimates of expected risk levels. While quantitative risk assessments are preferred, such assessments are also the most difficult to conduct, requiring specially designed studies to provide needed numerical inputs as well as the development of quantitative models for predicting risk levels. Depending on the focus and scale of the risk assessment, it is often not possible to design and conduct quantitative risk assessments in the time frame needed to support decision‐making.

C‐5 January 2014
In such cases, qualitative risk assessments are employed for characterizing risks. One of the most common approaches of qualitative risk assessment employed in ecological risk assessment is the weight‐of‐evidence approach. In such an approach, the available information (e.g., data) is examined, and an overall determination is made based on the conclusions that the majority of the data appears to support. An overall risk characterization, which may be expressed in relative qualitative terms such as “high” and “low,” may then be identified based on the “weight of evidence” provided from the available data. It is this latter approach that has been adopted for use in the GLMRIS risk assessments. Definitions of the qualitative risk levels used in the GLMRIS risk assessments are provided later in this report. 2.3 UNCERTAINTY One of the major issues with either form of risk assessment is that of uncertainty. While the assessment provides a characterization of the risk, there will always be some level of uncertainty associated with the characterization. In general, uncertainty has three sources: (1) natural variability, (2) incomplete knowledge, and (3) human error, with the latter two representing the greatest sources of uncertainty in the GLMRIS risk assessments. The characterization of ANS‐related risks relies exclusively on the evaluation and interpretation of existing scientific information by the GLMRIS Risk Assessment Team, and the amount of information available varies widely among the ANS being evaluated. For some ANS, there may only be a single published study, while for others there may be several dozen published studies. The risk assessments conducted under the GLMRIS Program include identification of the qualitative level of uncertainty related to incomplete knowledge; uncertainly levels are defined later in this report. Because the GLMRIS risk assessments rely on available information and studies developed by others, the greatest source of human error within the risk assessments is associated with the interpretation of the available information and the subsequent assignment of probability and risk levels. Different risk assessors may review the same set of data and come up with different interpretations, especially in a weight‐of‐evidence approach. To address this uncertainty (i.e., differences among risk assessors), all interpretations of existing data and resultant estimates of probability and risk are reviewed by the GLMRIS Risk Assessment Team, differences of professional opinion are discussed, and a “final” probability or risk rating is assigned only after consensus is reached among all members of the Risk Assessment Team.
3 GLMRIS RISK ASSESSMENT METHODOLOGY For each of ANS evaluated under the GLMRIS Program, the risk assessment is based on two components: (1) the probability of an ANS entering and becoming successfully established in a new basin and (2) the consequences of that establishment on ecological, economic, and social aspects of the new basin’s environment. These components together allow for the estimation of the risk of adverse impacts occurring as a result of the establishment of a “new” ANS (each basin currently includes previously established ANS) in a new basin. This may be depicted by the following risk model:

C‐6 January 2014
Risk (likelihood) of adverse impacts
occurring as a result of the establishment of ANS X in Basin Y
=
Probability of ANS X becoming established in Basin Y (Basin Y becomes
exposed to ANS X)
The consequences of ANS X becoming
established in Basin Y (the effects to Basin Y of exposure to ANS X)
The following sections describe in detail how this model is used in the evaluation of each ANS in order to characterize risks of adverse impacts. Figure 3 illustrates the risk assessment process adopted by the GLMRIS Program.
FIGURE 3 GLMRIS ANS Risk Assessment Process

C‐7 January 2014
3.1 IDENTIFICATION OF THE ANS OF CONCERN 3.1.1 ANS Problem Formulation As previously discussed, there is concern that should one or more of the ANS that are currently present in either the GL or MR Basins successfully transfer between the basins using one or more pathways (such as those in the CAWS), any of a variety of undesired environmental, economic, and social impacts could be incurred. A screening analysis was performed by the GLMRIS Natural Resources Team to identify ANS of concern for potential interbasin transfer through the CAWS pathways (Veraldi et al. 2011). The analysis cataloged known aquatic nuisance species currently present within the GL and MR Basins, and served to identify which ANS underwent GLMRIS risk assessments. The screening analysis is summarized below. In the screening analysis, the Natural Resources Team first conducted a literature search to identify all ANS reported from the MR and GL Basins. This search included the available published scientific literature, reports from federal and state natural resource agencies and ANS programs, along with personal communications between GLMRIS Team members and ANS researchers. This effort identified 254 ANS as being present in the two basins. Next, each of the 254 species was examined with regard to:
• Its current occurrence within one or both basins;
• The presence of any environmental or physiological constraints that could affect movement of an ANS from its current location; and
• Mechanisms by which the species could be transported (aquatic vs.
nonaquatic transport mechanisms. Only species occurring in a single basin, that have no obvious constraints for movement between the basins, and which could be transported along surface water pathways were retained. On the basis of this evaluation, only 118 of the 254 ANS were identified as of potential concern and appropriate for further evaluation by the GLMRIS Program (Veraldi et al. 2011). Each of the 118 species was then further evaluated with regard to its proximity to an “unoccupied” basin and the potential for successful entry into the currently unoccupied basin. This evaluation relied on informal professional judgment by the Natural Resources Team, with each of the 118 species receiving a High, Medium, or Low ranking of the potential to successfully transfer to a new basin (Veraldi et al. 2011). Through this evaluation, 39 ANS were identified as of concern for GLMRIS Focus Area I (CAWS) (Veraldi et al. 2011). Subsequent evaluation of these 39 species identified 5 species as being present in both basins, and these were removed from further consideration for the risk assessment. Of the remaining 35 species
C‐8 January 2014
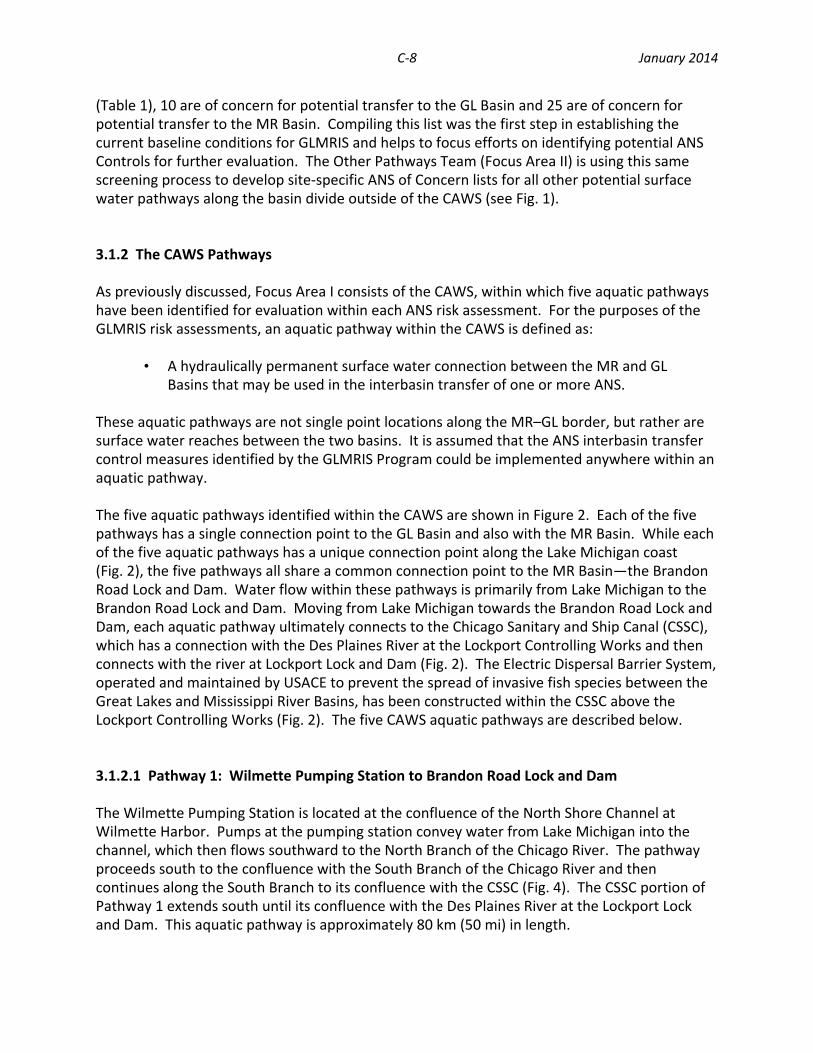
(Table 1), 10 are of concern for potential transfer to the GL Basin and 25 are of concern for potential transfer to the MR Basin. Compiling this list was the first step in establishing the current baseline conditions for GLMRIS and helps to focus efforts on identifying potential ANS Controls for further evaluation. The Other Pathways Team (Focus Area II) is using this same screening process to develop site‐specific ANS of Concern lists for all other potential surface water pathways along the basin divide outside of the CAWS (see Fig. 1). 3.1.2 The CAWS Pathways As previously discussed, Focus Area I consists of the CAWS, within which five aquatic pathways have been identified for evaluation within each ANS risk assessment. For the purposes of the GLMRIS risk assessments, an aquatic pathway within the CAWS is defined as:
• A hydraulically permanent surface water connection between the MR and GL Basins that may be used in the interbasin transfer of one or more ANS.
These aquatic pathways are not single point locations along the MR–GL border, but rather are surface water reaches between the two basins. It is assumed that the ANS interbasin transfer control measures identified by the GLMRIS Program could be implemented anywhere within an aquatic pathway. The five aquatic pathways identified within the CAWS are shown in Figure 2. Each of the five pathways has a single connection point to the GL Basin and also with the MR Basin. While each of the five aquatic pathways has a unique connection point along the Lake Michigan coast (Fig. 2), the five pathways all share a common connection point to the MR Basin—the Brandon Road Lock and Dam. Water flow within these pathways is primarily from Lake Michigan to the Brandon Road Lock and Dam. Moving from Lake Michigan towards the Brandon Road Lock and Dam, each aquatic pathway ultimately connects to the Chicago Sanitary and Ship Canal (CSSC), which has a connection with the Des Plaines River at the Lockport Controlling Works and then connects with the river at Lockport Lock and Dam (Fig. 2). The Electric Dispersal Barrier System, operated and maintained by USACE to prevent the spread of invasive fish species between the Great Lakes and Mississippi River Basins, has been constructed within the CSSC above the Lockport Controlling Works (Fig. 2). The five CAWS aquatic pathways are described below. 3.1.2.1 Pathway 1: Wilmette Pumping Station to Brandon Road Lock and Dam The Wilmette Pumping Station is located at the confluence of the North Shore Channel at Wilmette Harbor. Pumps at the pumping station convey water from Lake Michigan into the channel, which then flows southward to the North Branch of the Chicago River. The pathway proceeds south to the confluence with the South Branch of the Chicago River and then continues along the South Branch to its confluence with the CSSC (Fig. 4). The CSSC portion of Pathway 1 extends south until its confluence with the Des Plaines River at the Lockport Lock and Dam. This aquatic pathway is approximately 80 km (50 mi) in length.

C‐9 January 2014
TABLE 1 Aquatic Nuisance Species Occurring in Either the Mississippi River or Great Lakes Basins to be Evaluated for Risk of Adverse Impacts
Taxonomic Category Common Name Scientific Name
Current Basin Inhabited
Virus Viral Hemorrhagic Septicemia Novirhabdovirus sp. GL Protozoa Testate amoeba Psammonobiotus communis GL Testate amoeba Psammonobiotus dziwnowi GL Testate amoeba Psammonobiotus linearis GL Algae Cryptic algae Cyclotella cryptica GL Grass kelp Enteromorpha flexuosa GL Red algae Bangia atropurpurea GL Diatom Stephanodiscus binderanus GL Bryozoans Freshwater bryozoan Lophopodella carteri GL Molluscs Greater European peaclam Pisidium amnicum GL European fingernail clam Sphaerium corneum GL European stream valvata Valvata piscinalis GL Crustaceans Scud Apocorophium lacustre MR Fishhook waterflea Cercopagis pengoi GL Water flea Daphnia galeata galeata GL Bloody red shrimp Hemimysis anomala GL Parasitic copepod Neoergasilus japonicas GL Harpacticoid copepod Schizopera borutzkyi GL Fish Northern snakehead Channa argus MR Skipjack herring Alosa chrysochloris MR Inland silverside Menidia beryllina MR Black carp Mylopharyngodon piceus MR Bighead carp Hypophthalmichthyes nobilis MR Silver carp Hypophthalmichthys molitrix MR Blueback herring Alosa aestivalis GL Threespine stickleback Gasterosteus aculeatus GL Ruffe Gymnocephalus cernuus GL Sea lamprey Petromyzon marinus GL Tubenose goby Proterorhinus semilunaris GL Plants Marsh dewflower Murdannia keisak MR Cuban bullrush Oxycaryum cubense MR Dotted duckweed Landoltia punctata MR Swamp sedge Carex acutiformis GL Reed sweetgrass Glyceria maxima GL Water chestnut Trapa natans GL

C‐10 January 2014
FIGURE 4 CAWS Pathway 1: Wilmette Pumping Station to Brandon Road Lock and Dam
3.1.2.2 Pathway 2: Chicago River Controlling Works to Brandon Road Lock and Dam The Chicago River Lock and Controlling Works are located at the mouth of the Chicago River in downtown Chicago. Water flow in this pathway is from the Controlling Works west toward the CSSC. Some flow into Lake Michigan occurs when, as a result of runoff from heavy precipitation events, the Chicago River Controlling Works (CRCW) lock is opened to reduce potential flooding within the Chicago River. The pathway extends approximately 2.4 km (1.5 mi) west from its mouth to the confluence of the North and South Branches of the river (Fig. 5). At this

C‐11 January 2014
FIGURE 5 CAWS Pathway 2: Chicago River Controlling Works to Brandon Road Lock and Dam
confluence, Pathway 2 proceeds south along the South Branch to Brandon Road Lock and Dam along the same route as Pathway 1. Pathway 2 is approximately 56 km (35 mi) in length. 3.1.2.3 Pathway 3: Calumet Harbor to Brandon Road Lock and Dam Calumet Harbor is located on Lake Michigan at the mouth of the Calumet River (Fig. 6). From the harbor, Pathway 3 proceeds along the Calumet River to its confluence with the Grand Calumet River, and flow is away from the lake. The pathway then proceeds west to the

C‐12 January 2014
FIGURE 6 CAWS Pathway 3: Calumet Harbor to Brandon Road Lock and Dam
confluence with the Little Calumet River and then along the Cal‐Sag Channel (Calumet‐Saganashkee Channel) to the CSSC. The pathway then continues onwards to Brandon Road Lock and Dam along the identical route as Pathways 1 and 2. Pathway 3 is approximately 74 km (46 mi) in length.

C‐13 January 2014
3.1.2.4 Pathway 4: Indiana Harbor and Canal to Brandon Road Lock and Dam Indiana Harbor and Canal is an artificial waterway that connects Lake Michigan in East Chicago, Indiana, with Grand Calumet River to the south (Fig. 7). In this portion of the pathway, water flow is into Lake Michigan. Pathway 4 proceeds west along the Grand Calumet River to its confluence with the Little Calumet River, where river flow changes and is now toward the Des Plaines River, and then along the Cal‐Sag Channel to the CSSC and south to Brandon Road Lock and Dam. From the confluence of the Calumet River with the Grand Calumet River, this pathway is identical to Pathway 3. This pathway is approximately 72 km (45 mi) in length. 3.1.2.5 Pathway 5: Burns Small Boat Harbor to Brandon Road Lock and Dam Burns Small Boat Harbor is located on Lake Michigan, and is connected to the Little Calumet River by Burns Ditch (Fig. 8). Water flow within Burns Ditch is into Lake Michigan. Pathway 5 then proceeds west along the Little Calumet River, where water flow changes direction toward the Des Plaines River, to the Cal‐Sag Channel, then to the CSSC, and ultimately to Brandon Road Lock and Dam. From the confluence of the Little and Grand Calumet Rivers to Brandon Road Lock and Dam, this aquatic pathway is identical to that of Pathways 3 and 4. This pathway is approximately 80 km (50 mi) in length. 3.1.3 Problem Statements For the 35 ANS identified as possibly using the CAWS for interbasin transfer, the following set of problem statements were developed:
1. A number of ANS currently occur only in either the GL or the MR Basins.
2. Some ANS introductions have caused economic, environmental, or social impacts in the basins where they have become established, and the transfer of some ANS (those only currently occurring in one basin or the next) between the MR and GL Basins may be expected to also result in economic, environmental, and/or social impacts.
3. The CAWS artificially connects the GL and MR Basins and provides a potential
means of ANS transfer between the two basins.
4. Additional ANS transfer between the basins may also occur at locations outside of the CAWS.

C‐14 January 2014
FIGURE 7 CAWS Pathway 4: Indiana Harbor and Canal to Brandon Road Lock and Dam

C‐15 January 2014
FIGURE 8 CAWS Pathway 5: Burns Small Boat Harbor to Brandon Road Lock and Dam
3.1.4 Risk Hypotheses and Questions Based on the problem statements, the following risk hypothesis was identified for Focus Area I (the CAWS):
The CAWS represents a set of viable aquatic pathways through which an ANS may transfer from the basin in which it currently resides to the receiving basin. Once an ANS has successfully moved through the aquatic pathway and entered

C‐16 January 2014
the receiving basin, it will become established and spread, and eventually cause a variety of economic, environmental, and/or social impacts.
Questions associated with this risk hypothesis and to be addressed by the risk assessment are:
1. Which ANS are the most likely to use the CAWS to successfully transfer between the MR and GL Basins?
2. How suitable are each of the individual CAWS pathways for allowing an ANS
to transfer from one basin to the other?
3. Following interbasin transfer, which ANS are most likely to become established and ultimately spread within the receiving basin?
4. What may be the economic, environmental, and social consequences, should
an ANS become established in the receiving basin? The answers to these questions will identify (1) the potential of successful interbasin transfer and establishment of each of the 35 ANS; (2) the nature of the environmental, economic, and social consequences of establishment; (3) the risk of adverse impacts of each ANS becoming established; and (4) the level of interbasin transfer (in terms of number of ANS) that each of the five CAWS aquatic pathways could support. These results will also serve to identify the ANS and CAWS aquatic pathways that will be the focus of the GLMRIS in identifying approaches for preventing or reducing interbasin transfer of the ANS. Both establishment and consequences assessments will be conducted to evaluate the hypothesis and answer the associated risk questions. 3.2 ANS ESTABLISHMENT ASSESSMENT 3.2.1 Probability of Establishment The establishment assessment addresses the highlighted term of the risk model:
Risk (likelihood) of adverse impacts
occurring as a result of the establishment of ANS X in Basin Y
=
Probability of ANS X becoming established in Basin Y (Basin Y becomes
exposed to ANS X)
The consequences of ANS X becoming
established in Basin Y (the effects to Basin Y of exposure to ANS X)
This term examines the probability that an ANS will successfully transfer from one basin to the other using one or more of the CAWS aquatic pathways and become established in the new basin. The probability of establishment is determined as follows: Pestablishment = Ppath Parrival Ppassage Pcolonize Pspread

C‐17 January 2014
where:
Ppath = Probability that a complete aquatic pathway is available for interbasin transfer;
Parrival = Probability that the ANS will arrive at the pathway from its
current distribution within a specified time;
Ppassage = Probability that the ANS can successfully move through the aquatic pathway from one basin to the other;
Pcolonize = Probability that the ANS can establish a colony in the newly
invaded basin;
Pspread = Probability that the ANS can spread to elsewhere in the new basin; and
Pestablishment = Probability of the ANS becoming established in the new basin.
3.2.2 Probability Ratings For the establishment assessment (see Section 3.2.6), each of the probability elements is assigned one of the following qualitative likelihood ratings:
High = The event (e.g., successful passage through a pathway) will almost certainly occur;
Medium = The event is likely to occur, but it is not certain;
Low = The event will likely not occur, but is possible; and
None = The event is certain not to occur (it is impossible).
The application of these ratings to each probability element is described in Section 3.2.3. Note that these probability elements are multiplicative, and thus Pestablishment takes on the lowest probability rating of the other probability elements. For example, if the lowest qualitative rating for any of the five non‐Pestablishment probability elements is Medium, then the likelihood rating for Pestablishment would be Medium. Alternately, if the lowest rating were Low, then Pestablishment would be Low.

C‐18 January 2014
3.2.3 Probability Element Definitions and Assumptions For each of the probability elements except the probability of arrival, it is assumed that sufficient numbers of an ANS are present so that the probability of an event is not affected by ANS abundance, and that these individuals are present at all times. For example, it is reasonable to assume that the more individuals attempting interbasin transfer, and the more often interbasin transfer is attempted, the more likely at least some attempts will be successful. The GLMRIS risk assessment assumes that Ppath, Ppassage, Pcolonize, and Pspread are density‐independent. Estimation of the probability of arrival, Parrival, considers the abundance as well as the reproductive capacity of each ANS, as these two factors, together with distance to a pathway entrance, affect the probability of an ANS reaching a pathway (see definition of Parrival presented below). For each of the probability elements for establishment, the risk assessment assumes that each ANS will be attempting that element at all times. 3.2.3.1 Probability of Pathway (Ppath) This element assessed the likelihood of a complete aquatic pathway existing that links the two basins together. A complete aquatic pathway was defined as a continuous surface water connection between the two basins. The probability of the pathway being complete will depend on the frequency, timing, and duration of a surface water connection between the two basins, irrespective of the presence of barriers (physical or chemical) that may be present. The following are examples of how the ratings could be assigned. A rating of High may be assigned if there is surface water connecting the basins year‐round (i.e., a hydraulically permanent connection). A rating of Medium may be assigned if the surface water connection occurs only in spring (i.e., the hydraulic connection only occurs seasonally). A Low rating may be assigned if a surface water connection occurs infrequently (i.e., the hydraulic connection occurs only during precipitation‐related flooding events). There are five complete pathways identified for the CAWS (Section 3.1.2). 3.2.3.2 Probability of Arrival (Parrival) For this element, the ANS must be able to arrive at the entrance to the pathway from its current location. The probability is based on the ability of the ANS to move from its current location to the entrance of the pathway, which in turn will be affected by (1) the distance the ANS will have to travel to reach the entrance to the pathway, (2) the type of mobility exhibited by the ANS (e.g., active swimmer, passive transport by water currents; transport by barge and ship traffic), (3) the presence of any barriers (e.g., dams) between its current location and the pathway entrance that may impede arrival, and (4) the availability of suitable habitat that can support the species not only as it travels to the pathway entrance from its current location but also at the pathway entrance. Note that items 1–3 have an inherent time component, as the ANS‐specific combination of these three items will directly affect how quickly a specific ANS will reach a CAWS entrance. For example, suppose an ANS is currently present along the eastern shore of Lake Michigan. The probability of arrival of this ANS at CAWS Pathway 1 (Section 3.1.2.1) will depend on: (1) the distance of the ANS from the Wilmette Pumping

C‐19 January 2014
Station (the GL entrance to the pathway), (2) the mobility of the ANS and its ability to move from the eastern shore of the lake to the western shore where the pumping station is located, (3) the presence of any barriers between the pumping station and the eastern shore of the lake that could impede movement of the ANS, and (4) the availability of suitable habitat that would support travel of the ANS between the pumping station and the eastern shore of the lake. A rating of High may be assigned for an ANS that is a highly mobile active swimmer and is already close to the pathway entrance. Alternately, a rating of Medium may be assigned for the same species if it is far from the pathway entrance (e.g., 161 km [100 mi]) and there are numerous physical barriers such as dams between the current location of the ANS and the pathway entrance. A Low rating may be appropriate for an ANS that is distant from the pathway entrance and has very low mobility and numerous barriers are present between the pathway entrance and the current ANS location. 3.2.3.3 Probability of Passage (Ppassage) This element is associated with the ability of an ANS to successfully pass through the pathway from one basin to the other. There are two underlying assumptions for this element: (1) a complete pathway exists and (2) the ANS has successfully arrived at the entrance to the pathway. To successfully pass through the pathway, environmental conditions within the pathway must be suitable for that species (e.g., water quality, habitat, temperature, depth). For example, there may be areas of very shallow water that could affect passage by large fish species but not by smaller ones or by biota such zooplankton or algae. Similarly, areas within a pathway where poor water quality occurs (low dissolved oxygen, high temperatures) may limit or prevent species with low tolerance to poor water quality conditions. An ANS must also be able to overcome any physical barriers (e.g., dams) that may be present, not only within the pathway but also at the entrance to and exit from the pathway. The probability of passage also depends on the mobility of the ANS and its ability to move from the pathway entrance in one basin to its exit in the other basin. For example, each of the 35 ANS must be able to move at least 48 km (30 mi) in order to successfully pass through any of the five CAWS pathways. Species with low or passive mobility (e.g., gastropods, tubificid worms) may not be as readily able to travel such distances as would more mobile species (e.g., skipjack herring, silver carp). For species with low or passive mobility (such as snails), successful passage through a pathway will be strongly time dependent, with the probability of passage becoming more likely with time (Section 3.2.4). Such species might not be expected to successfully pass through a pathway in one generation, and suitable habitat would likely be needed at multiple locations within a pathway to allow low‐mobility species to become established and slowly pass through the CAWS over several generations. For this element, a High rating may be assigned for an ANS that is very mobile, suitable environmental conditions that support passage are present within the pathway, and no physical barriers exist that could block passage. A Medium rating may be appropriate if the ANS has the ability to pass through the pathway and there are no physical barriers, but poor water quality

C‐20 January 2014
conditions (e.g., low dissolved oxygen levels) are present (such as during certain times of the year). 3.2.3.4 Probability of Colonization (Pcolonize) This element considers the likelihood that should an ANS enter a new basin, it will establish a self‐sustaining colony. This probability element assumes that the ANS has successfully arrived at and passed through an existing complete pathway in sufficient numbers that successful reproduction may occur. For successful colonization to occur, suitable habitat for the ANS must be present in the vicinity of the pathway in the receiving basin (at least close enough that the ANS can reach the habitat). Suitable habitat is defined as habitat that provides conditions (such as suitable water quality) for survival of all life stages and that supports successful reproduction. A High rating may be assigned for this element if suitable habitat is located adjacent to a pathway exit or occurs within a distance that an ANS could readily cross in order to access the habitat. If suitable habitat occurs within the new basin but is located relatively far from the pathway exit (e.g., wetland habitats along the Wisconsin shore of Lake Michigan north of the Wilmette Pumping Station of CAWS 1) and the invading ANS has limited mobility, then a rating of Medium may be appropriate for this element. Finally, if the invading ANS has a very limited ability for long distance travel (such as a gastropod) and the nearest suitable habitat occurs well away from the pathway exit, then Pcolonize may be rated as Low. 3.2.3.5 Probability of Spread (Pspread) The probability of spread considers the likelihood that an ANS, assuming that it has established a self‐sustaining colony in the new basin, will spread to other suitable habitats and thus expand its distribution within that basin. The likelihood of spread depends on the dispersal abilities of the ANS and on the distribution of suitable habitat within the new basin. For example, a rating of High may be appropriate if suitable habitat is widely distributed throughout the receiving basin and the ANS is a mobile species that may be expected to easily access those habitat areas. Alternately, if the ANS has limited mobility (such as a gastropod) and suitable habitat is widely scattered throughout the new basin at distances well away from the initial colonization location, Pspread could be rated as Low. 3.2.3.6 Probability of Establishment (Pestablishment) This term represents the overall probability that a particular ANS will become established within the receiving basin as a result of interbasin transfer along a specified aquatic pathway (e.g., one of the CAWS pathways).

C‐21 January 2014
3.2.4 Time Period of the Establishment Assessments The GLMRIS risk assessment evaluates potential establishment over four time steps encompassing a 50‐year time period:
Time 0 (T0) = Potential for establishment based on the current distribution of the ANS;
Time 10 (T10) = Potential for establishment 10 years from present time;
Time 25 (T25) = Potential for establishment 25 years from present time; and
Time 50 (T50) = Potential for establishment 50 years from now.
The use of these time steps is intended to capture changes in the distribution of ANS species that may occur during a time step, and thus affect the likelihood of establishment. For example, a highly mobile ANS that may be present in the MR Basin but is 161 km (100 mi) or more from the CAWS may have a Low Pestablishment rating at T0. However, because of its mobility, the ANS may be able to reach the CAWS within 10 years and certainly would be expected to do so within 25 years. As a result, a Pestablishment rating of Medium may be appropriate for T10 and High for T25. 3.2.5 Uncertainty Ratings Each of the probability elements used to estimate the overall probability of establishment will be accompanied by an uncertainty rating which reflects the confidence that is placed on the probability rating. The uncertainty rating is based on the amount and quality of scientifically defensible data that was used to develop the probability rating. As discussed earlier, a primary uncertainty associated with the GLMRIS risk assessment approach is that of ANS‐specific data availability. The less data available to support the probability rating, the greater the uncertainty associated with that probability. The characterization of uncertainty is important because it helps decision‐makers and the public place the risk estimate in perspective and supports informed decision‐making. The establishment assessment approach employs four levels of uncertainty:
High = There are little or no data available and the probability rating (as well as all assumptions used to develop that rating) are based on best professional judgment;
Medium = There are some good data but also some significant data gaps such
that the probability rating is based on a mixture of ANS‐specific data, data from similar species, anecdotal data, and professional judgment;

C‐22 January 2014
Low = There are good ANS‐specific data available (e.g., peer‐reviewed, ANS‐specific scientific publications and reports), and no significant data gap are known; and
None = All relevant facts are known, and there is no uncertainty.
These uncertainty levels provide an understanding of how confident the risk assessors were in the rating provided for each of the probability elements considered in estimating the probability of establishment, ranging from low confidence for a High uncertainty rating, to high confidence for probability elements with a Low uncertainty rating. 3.2.6 Estimating the Probability of Establishment 3.2.6.1 Probability of Establishment As described in Section 3.2.1, the probability of an ANS becoming established in a new basin is the product of a number of other probability elements, as follows: Pestablishment = Ppath Parrival Ppassage Pcolonize Pspread In a quantitative probabilistic risk assessment, each of the individual probability elements would be assigned a numerical probability value ranging from 0 (no likelihood of occurrence) to 1.0 (100% likelihood of occurrence). These would then be multiplied together to provide the probability of ANS establishment. Table 2 provides an example of how such a numerical probability could be calculated for four ANS. Note that for each ANS, the probability of establishment is much smaller than the lowest probability value for any individual probability element used in the calculation. In this example, only ANS A is indicated as having a greater than 10% probability of becoming established.
TABLE 2 Hypothetical Example of a Quantitative Probability Assessment of Establishment
Probability Element
ANS
Probability of Pathway
Probability of Arrival
Probability of Passage
Probability of Colonization
Probability of Spread
Probability of Establishment
A 1.0 0.8 0.9 0.5 0.3 0.11 B 1.0 0.4 0.2 0.5 0.7 0.03 C 1.0 0.7 0.1 0.5 0.4 0.01 D 1.0 0.2 0.5 0.5 0.1 0.01

C‐23 January 2014
While the GLMRIS risk assessment approach is qualitative rather than quantitative (see Section 2.2), the probability of ANS establishment is conducted in a similar manner. Recall that in the establishment assessment, each probability element is assigned a qualitative probability value of High, Medium, Low, or None (Section 3.2.2). In a quantitative assessment, the individual values would be multiplied together, with the resulting value always being much less than any of the single element probability values. In the GLMRIS qualitative assessment, it is not possible to multiply together the non‐numerical probability ratings. Instead, the smallest individual probability element rating is selected as the overall probability of establishment. Table 3 illustrates how the qualitative probability of establishment was calculated.
TABLE 3 Hypothetical Example of a Qualitative Probability Assessment of Establishment
Probability Element
ANS
Probability of Pathway
Probability of Arrival
Probability of Passage
Probability of Colonization
Probability of Spread
Probability of Establishment
A Medium Low High High Low Low B High High High Low High Low C Medium High High Medium Medium Medium D High Low Medium Medium Low Low
Regardless of the values of the individual probability elements, the overall probability of establishment will be the rating of the lowest rated element. In the example above, the probability of each element for ANS B is High except for one element, colonization. The colonization probability is Low, and as this is the lowest probability of any of the establishment elements, the overall probability of establishment is also Low. A Low probability means that the ANS will colonize but be not likely to become established. It should be noted that this qualitative approach provides a much more conservative (i.e., higher) estimate of the probability of establishment than would the quantitative approach. In the quantitative approach, because the probability elements are multiplicative, the overall probability of establishment may be as much as an order of magnitude or more lower than any single element probability. In the quantitative approach, a similar decrease in the probability value is not possible. No uncertainty rating was assigned for the overall probability of establishment rating because there is no objective way to characterize overall uncertainty for an aggregate rating.

C‐24 January 2014
3.3 ANS CONSEQUENCES ASSESSMENT In the GLMRIS risk model, the resources that are of concern and are to be protected from the consequences of ANS establishment are the ecological, economic, and social resources of the GL and MR Basins. The consequences assessment addresses the highlighted term of the GLMRIS risk model:
Risk (likelihood) of adverse impacts
occurring as a result of the establishment of ANS X in Basin Y
=
Probability of ANS X becoming established in Basin Y (Basin Y becomes
exposed to ANS X)
The consequences of ANS X becoming
established in Basin Y (the effects to Basin Y of exposure to ANS X)
This term identifies the consequences that could be incurred should a new ANS become established in either the Great Lakes or Mississippi River Basins. An underlying assumption of the consequence assessment is that the ANS has successfully entered and become established within the new basin, and the consequence rating given to an ANS will be irrespective of any time‐step considerations. 3.3.1 Consequence Elements The consequence assessment qualitatively considers three categories of consequences: environmental, economic, and social. The overall consequences from the establishment of a new ANS are estimated as:
Overall Consequences
= Environmental Consequences
+ Economic
Consequences +
Social/Political Consequences
where:
Environmental Consequences = Effects on ecosystem structure and function, including effects on resident species, populations, communities, and habitats.
Economic Consequences = Effects on economic activities, such as changes
in employment, unemployment, and earnings; changes in labor force and income.
Social/Political Consequences = Perceived effects on leisure, recreation or
subsistence activities, as well as changes in regulatory requirements.
Overall Consequences = Qualitative combination of all environmental,
economic, and social consequences.

C‐25 January 2014
Each of these consequence categories is discussed in detail in Section 3.3.3. 3.3.2 Consequence Ratings For each ANS‐specific consequence assessment, it is assumed that the ANS has successfully become established in the new basin. In addition, any consequences that may be associated with the new establishment will be either “localized” or “widespread.” The term “localized” means that the potential spatial extent of any indicated consequences may be limited in the new basin due to the specific biotic and abiotic (e.g., physical, chemical, and/or climatological) habitat requirements and the relatively limited availability and distribution of suitable habitat (i.e., the habitat for the ANS occurs in disjunct and widely separated locations). In contrast, “widespread” means that the potential spatial extent of consequences may occur throughout the basin due to the general availability of suitable habitat for the ANS throughout the basin (e.g., in large contiguous patches or in numerous locations throughout the basin). With these assumptions, each of the three consequence categories will be assigned one of the following qualitative ratings:
High (H) = High consequence rating due to the larger number of consequence categories affected, the nature and severity of the consequences, and the broader spatial extent of the consequences.
Medium (M) = Medium consequence rating due to the number of consequence
categories affected, the nature and severity of the consequences, and the spatial extent of the consequences.
Low (L) = Low consequence rating due to the lower number of
consequence categories affected, the lesser nature and severity of the consequences, and the more localized extent of the consequences.
None (N) = No consequences are anticipated.
These ratings are broad and flexible in their application, and the selection of High, Medium, or Low consequences will be subjective. An assigned rating will be based on the amount of consequence information that is available for that ANS (or closely related species), the interpretations of that information by the GLMRIS Risk Assessment Team, and the thresholds selected to distinguish among the consequence levels. If more specific thresholds are identified (i.e., through input from stakeholders), these will be incorporated into the assignment of the ratings. As such, there is no checklist of conditions to establish an H, M, L, N rating for each consequence category. The application of these ratings requires the Risk Assessment Team to judge or otherwise differentiate between None, Low, Medium, and High consequence ratings, and consequence

C‐26 January 2014
distinctions will differ not only by ANS but also according to the location and spatial extent of the ANS establishment. 3.3.3 Consequence Definitions and Assumptions 3.3.3.1 Environmental Consequences In the GLMRIS risk assessment approach, environmental consequences are considered to be those associated with changes in ecosystem structure and function. Ecosystem structure refers to biota (at the species, population, and community levels, including biodiversity) and habitats, as well as environmental conditions (e.g., water quality), that are present prior to the new ANS establishment. Ecosystem function refers to the role that a species plays or a habitat provides, such as nutrient cycling, food, and shelter. For example, amphipods provide a valuable food source for many fish species, while submerged vegetation may provide nursery habitat for larval and juvenile fish. The establishment of an ANS in a new basin could result in both direct and indirect impacts to ecosystem structure and function. With direct impacts, the ANS directly affects biota or habitats. For example, the ANS may feed on resident species A, and establishment of the ANS could result in a reduction or loss of species A as a result of predation. Or the ANS could outcompete resident species A for food or nutrients and replace species A in the local community. Indirect impacts occur only as a result of a direct impact. For example, the direct impact of the establishment of an ANS may be the conversion of a wetland plant community from a diverse assemblage of plants to a plant community dominated exclusively by the ANS species. Indirect impacts in this example could include, in part, the loss of nesting habitat for wetland birds and the loss of food resources by waterfowl. In light of the qualitative nature of this assessment, the environmental consequences of ANS establishment in a new basin will be qualitatively assessed largely on the basis of the types of potential direct effects to ecosystem structure and function that could result following establishment. Indirect effects are much more difficult to predict, especially with little to no empirical evidence of past invasion history. The majority of the ANS evaluated by the GLMRIS risk assessments have not been studied, and as such, there is no clear evidence of the types of indirect effects that may occur as a result of their establishment into “new” ecosystems. Identifying changes in ecosystem function is more difficult than is the identification of changes in ecosystem structure. While information is relatively available for characterizing the presence and distribution of resident biota and habitats within each basin, as well as for characterizing the environmental conditions within the basins, much less information is available regarding ecosystem function and the roles of resident biota in specific ecosystem functions (such as nutrient cycling). Even less information is available for most of the ANS on how they might affect structure and/or functions within newly invaded ecosystems.

C‐27 January 2014
For the assessment of environmental consequences, the potential for affecting ecosystem structure and/or function will be determined qualitatively and in an unweighted manner. Because of the general absence of species‐specific information, the characterization of environmental consequences will draw on the professional judgment of the GLMRIS Risk Assessment Team together with extrapolations of possible consequences that have been reported in the scientific literature for similar biota in other basins. To assess the environmental consequences of ANS establishment, each ANS will be evaluated with respect to its potential to affect one or more ecosystem structure and function categories. To determine the level of potential environmental consequences for each ANS, the Risk Assessment Team will carefully consider (1) the number of ecosystem categories that may be affected following establishment, (2) the nature and severity of the potential ecosystem effects as suggested by the scientific literature, and (3) the spatial extent of where those effects might be realized following establishment of the ANS in the new basin. The evaluation does not quantify the magnitude of any consequences. Each ANS will be evaluated on each ecosystem category, and a qualitative determination will be made as to whether the ANS could or could not affect the category. Environmental categories to be considered include:
• Nutrient cycling;
• Productivity;
• Food web dynamics;
• Competition and/or predation;
• Habitat quality and quantity;
• Biodiversity; and
• Interaction with species listed under the Endangered Species Act. The more categories identified as being potentially affected, the greater the likelihood for environmental consequences to be realized from ANS establishment. Each category identified as possibly affected will then be further examined with regard to the nature and severity of any possible effects. The environmental consequences assessment will also consider the potential spatial extent where ecosystem structure and function could be affected, although no attempt will be made to quantify the magnitude of any potential effects. For example, an ANS that may become widespread within a new basin and affect a number of ecosystem categories may be characterized as having a higher level of potential environmental consequences than an ANS with a very limited distribution in the new basin. Table 4 provides a hypothetical example illustrating how environmental consequence ratings will be determined. In this example, both ANS A and C are indicated as potentially affecting a

C‐28 January 2014
TABLE 4 Example Environmental Consequences Matrix (• indicates a potential to affect the category)
Potentially Affected Ecosystem Structure
and Function
Ecosystem Function
Ecosystem Structure
ANS Nutrient Cyclinga
Productivityb
Food W
eb Dynam
icsc
Competition and/or
Predationd
Habitat Quality and
Quantitye
Biodiversityf
ESA‐Listed Speciesg
Spatial Exten
t of
Potential
Environmen
tal
Consequen
ces
A • • • • • • Localized
B • • • Widespread
C • • • • • • Widespread
D • • • Localized
a ANS establishment may disrupt nutrient cycling.
b ANS establishment may disrupt primary or secondary productivity through a decrease or loss of primary producers and/or consumers.
c ANS establishment may alter food webs, affecting food resources, prey abundance, and energy flow between trophic levels.
d ANS establishment may result in decreased abundance and/or reduced distribution of one or more resident species through competition or predation.
e ANS establishment may reduce quality and/or availability of important habitats.
f ANS establishment may alter species composition of communities, including loss or reduction in abundance of resident species.
g ANS establishment may adversely impact one or more species listed as threatened or endangered, or habitat designated as critical, under the Endangered Species Act.
number of ecosystem structure and function categories. In addition, ANS C may become widespread throughout the new basin because of the amount of potentially suitable habitat available for the ANS in the new basin, and thus any environmental consequences may similarly be widespread. In contrast, consequences from ANS A would be much more localized and limited in their spatial distribution, again based on the amount of potentially available habitat for ANS A. Thus, an environmental consequences rating of High may be assigned to ANS C while a rating of Medium might be assigned to ANS A. Both ANS B and D are indicated to affect fewer ecosystem structure and function categories than the other species. However, potential consequences from ANS B could be widespread (because of widespread habitat for this ANS),

C‐29 January 2014
while those from ANS D could be localized. In these cases, ANS B may be assigned a Medium rating, while ANS D may receive a Low rating. 3.3.3.2 Economic Consequences For the economic consequences assessment, each ANS will be evaluated for its potential to affect one or more of the following economic categories:
• Loss of consumer surplus;
• Decrease in coastal property values;
• Reduction in charter boat activity;
• Reduction in recreational fishery activity;
• Reduction in commercial fisheries;
• Reduction in service industry;
• Maintenance of water quality;
• Maintenance of water withdrawal structures; and
• Vessel maintenance. Effects on some categories will be dependent on effects occurring to other categories. For example, establishment of an ANS may result in the collapse of a recreationally important fishery, which in turn may affect the charter boat industry, recreational fishing, and the service sectors that supply lodging, food, and fishing equipment supplies that support the charter boat and recreational fishing activities. The assignment of qualitative economic consequence levels for an ANS will be based on: (1) the number of economic categories potentially affected by ANS establishment; (2) the nature and severity of potential effects for each category; and (3) the spatial extent of where economic consequences may be realized following establishment. The determination of economic consequences does not consider any costs of control or mitigation procedures that may be implemented into a response to ANS establishment, nor does it attempt to quantify the magnitude of any economic consequences. The greater the number of categories identified as potentially affected by the ANS, the greater the likelihood of economic consequences following establishment of that ANS. As done for the environmental consequences assessment, the economic consequences assessment will take into account the spatial extent of the possible consequences. Depending on the ANS being evaluated, some economic consequences may be relatively localized, being centered on the

C‐30 January 2014
habitats where the ANS may become established. Alternately, if an ANS becomes widespread, its economic consequences may be expected to also be more widespread. For example, an ANS that replaces a recreationally important fish species (e.g., one of the salmonids) in the Great Lakes could adversely affect recreational fisheries and associated industries (e.g., charter boats, fishing gear supplies) throughout the basin and have a high level of economic consequence. Table 5 illustrates how the economic consequences assessment approach will be used to assign economic consequence ratings. In this example, ANS D is identified as potentially affecting several economic categories. However, because of a relatively low amount of suitable habitat, ANS D may be expected to have a limited distribution in the new basin, and on that basis the economic consequences identified for this ANS would likely be localized and limited in their spatial distribution. Thus, an economic consequences rating of Medium may be assigned to ANS D. In comparison, ANS B is indicated as potentially affecting fewer economic categories, but because suitable habitat for this species is widespread throughout the basin, the spatial extent of the possible consequences could be widespread. This ANS could receive a High consequences rating. Both ANS A and C are identified as affecting relatively few economic categories (Table 5). However, because of a greater availability of suitable habitat, ANS A could become widespread and affect water quality, and thus affect costs of treating drinking water supplies throughout the basin. On this basis, ANS A may receive a Medium rating. In contrast, because of limited suitable habitat, ANS C would be expected to have a limited distribution within the new basin. Potential economic consequences of this ANS would be associated only with property values and would be localized. In this case, ANS C may receive a Low rating. 3.3.3.3 Social/Political Consequences For the purpose of the GLMRIS risk assessments, social consequences were considered to be perceived effects on leisure or recreational opportunities. Political consequences are associated with the potential implementation of new regulations to address prevention or control of ANS establishment. Social/political consequences may result if an ANS becomes established in a new area and subsequently affects the perceived quality of leisure or recreational opportunities, and political consequences could result if ANS effects result in regulatory changes. For example, an area of shoreline may provide opportunities for swimming, fishing, and camping. If an algal ANS becomes established along that shore and undergoes blooms in the summer that result in large mats of algae along the shore and unpleasant odors, the area may become less desirable for swimming, fishing, and camping. To control the spread of this ANS, new regulations may be developed and implemented that would require the hulls of all recreational vessels be washed to remove any attached algae prior to placement of the vessels into a new water body.

C‐31 January 2014
TABLE 5 Example Economic Consequences Matrix (• indicates a potential to affect the category)
Economic Categories
ANS Loss of Consumer Surplus a
Loss of Personal
Wealth
Loss of Jobs and Income
Increased Cost of Operation and Maintenance
Decrease in Coastal
Property Values
b
Red
uction in
Charter
Boat Activityc
Red
uction in
Recreational Fishery
Activityd
Red
uction in
Commercial Fisheriese
Red
uction in
Service
Industryf
Water Qualityg
Water W
ithdrawal
Structuresh
Ship M
aintenance
i
Spatial Exten
t of
Potential Economic
Consequen
ces
A • • • Widespread
B • • • • • Widespread
C • • Localized
D • • • • • • • Localized
a ANS establishment may result in loss of consumer surplus.
b ANS establishment may result in a decrease in values of properties along shoreline areas.
c ANS establishment may reduce charter boat activity due to a decrease in recreational fish abundance.
d ANS establishment may reduce boat and shoreline recreational fishing recreational fishing due to a decrease in recreational fish abundance.
e ANS establishment may reduce commercial catch as a result of a decrease in commercial fish abundance.
f ANS establishment may reduce service industry jobs and income if recreational and commercial activities are reduced.
g ANS establishment may affect water quality; require increased water treatment.
h ANS establishment may reduce effectiveness of water withdrawal structures; require increased maintenance.
i ANS establishment may result in increased hull fouling, requiring increased maintenance.

C‐32 January 2014
For the evaluation, each ANS was examined for its potential for perceived effects on leisure or recreational opportunities provided by the environment in the following categories:
• Swimming,
• Fishing,
• Beach activities,
• Hunting, and
• Recreational boating. In addition, ANS establishment will also be evaluated for its potential to result in regulatory changes associated with the control or prevention of ANS establishment. The more leisure or recreational opportunities that are perceived to be affected and the greater the potential for new regulations being enacted, the greater the likelihood of social/political consequences for that ANS. Each social/political category identified as possibly affected by ANS establishment will be further examined with regard to the nature and severity of any possible effects to that category. As with the evaluations of both environmental and economic consequences, the qualitative evaluation of social/political consequences will also consider the spatial extent of where people may perceive leisure and recreational opportunities as being affected by ANS establishment, as well as any temporal aspects of the consequences. The social/political consequences assessment does not attempt to quantify the magnitude of any social or political consequences. Depending on the ANS being evaluated, consequences may be localized or widespread. For example, an algal ANS may become widespread throughout the Great Lakes, where it could exhibit extensive algal blooms in late summer. During such events, the water may develop an unpleasant odor and color and thus affect the desire of people to swim or fish those waters. In this case, the social consequences could be widespread, but would occur only seasonally and during a relatively short time. If the blooms were linked to high nutrient levels, regulations requiring reductions in nutrient releases to the affected water body may be developed and implemented. Thus, overall social/political consequences could be widespread for this ANS. Table 6 provides a hypothetical example of how this approach will be used. In this example, ANS A is identified as potentially affecting the public perception of the quality of multiple leisure or recreational opportunities and incurring a potential political response. However, because of a limited distribution of suitable habitat for this species in the new basin, the potential consequences would be expected to be localized and thus limited in their spatial distribution. For this ANS, a rating of Medium may be assigned on the basis of a limited spatial extent of possible consequences. In contrast, ANS C is also indicated as potentially affecting the public perception of a variety of leisure or recreational opportunities (Table 6). But because this species may become more widely distributed (because of greater habitat availability) than ANS A, the spatial extent of

C‐33 January 2014
TABLE 6 Example Social/Political Consequences Matrix (• indicates a potential to affect a perceived leisure or recreational opportunity or potentially result in new regulations being developed)
ANS
Activity
New
Regulatory Req
uirem
ents
Spatial Exten
t of Potential
Social/Political Consequen
ces
Swim
minga
Fishingb
Beach Activitiesc
Huntingd
Recreational Boatinge
A • • • • • LocalizedB • WidespreadC • • • • • WidespreadD Localized
a Swimming = Reduces desire to swim due to unpleasant
odor, water color, excessive vegetation growth, etc.
b Fishing = Reduced desire to fish because of unpleasant odor, water color, excessive vegetation growth, etc.
c Beach Activities = Reduced desire for recreational beach use because of unpleasant odor, water color, excessive vegetation growth, etc.
d Hunting = Reduces desire to hunt or reduces availability of suitable hunting areas.
e Recreational Boating = Reduced desire for fishing, canoeing, sailing, waterskiing, and other boat‐based recreation.
potential consequences of ANS C could be widespread within the new basin. Thus, ANS C could receive a High consequences rating. In contrast, ANS B is indicated to have fewer consequences than either ANS A or ANS C, and thus a rating of Low may be appropriate. However, if the establishment of ANS B significantly affects perceived recreational fishing opportunities, a rating of Medium or High may be more appropriate. The latter example shows the challenges in assigning ratings to not only the social/political consequences, but also to the other consequence categories.

C‐34 January 2014
3.3.4 Consequence Uncertainty Ratings Each consequence assessment will be accompanied by an uncertainty rating which reflects the confidence placed on the assessment. The uncertainty rating will be based on the amount and quality of scientifically defensible data used to identify the consequence components and to support the consequence determination. As discussed earlier, the primary uncertainty associated with the GLMRIS risk assessment approach was that of ANS‐specific data availability. The less data available, the greater the uncertainty associated with the assessment. The uncertainty ratings for the consequence assessments are:
High = There is little to no concrete evidence available, or there is a very broad range in the nature and the severity of the consequences, and may include extreme consequences.
Medium = There are some good supporting data but also still some major data
gaps, or there is a broad range in the nature and severity of the consequences, but no extreme consequences have been identified.
Low = Good supporting data are available, data gaps are not significant, or
there is a limited range of possible consequences.
None = Adequate data are available to fully support the consequence determination.
High uncertainty expresses little to no confidence in the rating, and indicates that the consequence determination was largely unsupported by direct or indirect data and was based predominantly on professional judgment. Medium uncertainty indicates some confidence in the rating, while a Low uncertainty rating indicates a high degree of certainty in the consequence determination. When uncertainty is rated None, the assessors are certain. A High consequence rating with a High uncertainty indicates that the likelihood of the indicated consequence is uncertain and highly speculative. Alternately, a High consequence rating combined with a Low uncertainty rating indicates that the indicated consequences are very likely to be incurred if an ANS were to become established. 3.3.5 Estimating the Overall Consequences of Establishment 3.3.5.1 Estimating Overall Consequences The overall consequences of an ANS becoming established will be qualitatively estimated through a combined consideration of the environmental, economic, and social/political consequences identified during the consequences assessment:
Overall Consequences
= Environmental Consequences
+ Economic
Consequences +
Social/Political Consequences

C‐35 January 2014
Note that consequences are not multiplicative. Thus, one or more of the consequence categories can be zero (e.g., None), but as long as at least one category has nonzero consequences, there may be consequences of the ANS establishment. In the GLMRIS risk assessment approach, the consequence categories are not equally weighted; environmental and economic consequences are qualitatively weighted more heavily than social/political consequences. Table 7 identifies the overall consequence ratings that were assigned to an ANS based on the combination of individual consequence element ratings.
TABLE 7 Determination of Overall Consequence Level of ANS Establishment
Consequence Scenarioa
Overall Consequence Element
Overall Consequence Rating Levelb
Environmental Consequence Rating Levelb
Economic Consequence Rating Levelb
Social/Political Consequence Rating Levelb
1 H H, M, L, or N H, M, L, or N H 2 H, M, L, or N H H, M, L, or N H 3 M M H, M, L, or N M 4 M, L, or N M, L, N H M 5 M L or N M, L, or N M 6 M, L, or N M M, L, or N M 7 L or N L or N M L 8 L L or N L or N L 9 L or N L L or N L 10 N N L L 11 N N N N
a The consequence scenario refers to a possible combination of consequence
element ratings.
b H = High; M = Medium; L = Low; N = None.
A High overall consequence will be assigned if:
• The environmental or economic consequence element rating is High, regardless of the ratings of the other elements (Table 7, Scenarios 1 and 2).
A Medium overall consequence rating will be assigned if either:
• The environmental and economic elements are both Medium and regardless of the social/political element rating (Scenario 3);

C‐36 January 2014
• The social/political consequence element is rated as High and the environmental and economic elements have a Medium or lower rating (Scenario 4);
• The environmental consequence element is rated Medium, the economic
consequence rating is Low or None, and the social/political consequence element rating is Medium or less (Scenario 5); or
• The economic consequence element is rated Medium, the environmental
consequence rating is Medium or less, and the social/political consequence element rating is Medium or less (Scenario 6).
A Low overall consequence rating will be assigned in all cases in which each of the environmental and economic consequence elements are rated as Low or None and the social/political consequence element rating is Medium or less (Scenarios 7–10). A consequence rating of None will be assigned if all of the consequence elements are rated as None (Scenario 11). Table 8 presents an example of overall consequence rating. In this example, ANS B and C would receive overall High consequence ratings on the basis of a High rating for either environmental or economic consequences. A Medium rating would be given to ANS B based on the Medium ratings for both environmental and economic consequences. For ANS D, the overall Medium rating is based on the Medium rating for economic consequences.
TABLE 8 Example of Overall Consequence Level Determination
ANS
Environmental Consequence Rating Level
Economic Consequence Rating Level
Social/Political Consequence Rating Level
Consequence Scenarioa
Overall Consequence Rating Level
A Medium Medium High 3 Medium B Medium High Medium 2 High C High Low High 1 High D Low Medium None 6 Medium
a See Table 7 for scenarios.
No uncertainty rating was assigned for the overall consequence of establishment rating because there is no objective way to characterize overall uncertainty for an aggregate rating.

C‐37 January 2014
3.4 ESTIMATING RISK OF ADVERSE IMPACTS 3.4.1 Evaluating ANS‐Specific Risks In qualitative risk assessment, there are two general methods for combining the probability of establishment with the consequence rating to derive a final overall risk rating: multiplicative and additive. As discussed below, both approaches differ in their assumptions and how they strike a balance between environmental protection and being overly conservative in assigning risk. The multiplicative method defines risk as the probability that a certain species will establish within a new domain multiplied by the negative consequences once established (USDA 2004). Thus the overall risk of adverse impacts from the establishment of an ANS is determined as:
Risk of adverse impacts occurring as a result of the establishment of an
ANS
= Probability of an ANS becoming established
The consequences of an ANS becoming
established
An alternative to the multiplicative method of deriving an overall risk rating is the additive approach. Under this additive approach the overall risk of adverse impacts from the establishment of an ANS is determined as:
Risk of adverse impacts occurring as a result of the establishment of an
ANS
= Probability of an ANS becoming established
+ The consequences of an ANS becoming
established
Unlike the multiplicative approach, the additive method does not determine the overall risk rating using the lowest rating in the formula. The additive approach attempts to take into consideration the uncertainties associated with the complexities of biological systems, inadequacies in the empirical evidence, and expert bias (Maguire 2004 and Hulme 2012). Table 9 shows the alternative multiplicative and additive methods for combining establishment and consequence into a final risk rating. The multiplicative method for determining overall risk strictly follows the logic that consequence cannot occur without establishment and if establishment is likely to occur, the risk is largely determined by the consequence. In addition to the multiplicative approach, there are two potential additive approaches (Table 9). The first additive approach was used by the Aquatic Nuisance Species Task Force for their risk assessment process (ANSTF 1996). Under this method, only an ANS with a low probability of establishment and a low consequence rating would receive an overall risk rating of low. This approach is highly conservative and even species with a low consequence rating could have an overall medium risk rating if it has a high probability of establishment. The second additive approach (Alternative Additive Method) is less conservative than the ANS Task Force Method because the consequence rating alone is weighted more heavily than the establishment probability in determining the final risk rating (Table 9). For example, a medium risk level

C‐38 January 2014
TABLE 9 Comparative Risk Matrix Showing the Multiplicative Method, the ANS Task Force (ANSTF 1996), and an Alternative Additive Method to Determine the Overall
ANS Risk Levela
Risk
Scenario Probability of Establishment
Consequence of Establishment
Overall Risk Using
Multiplicative Method
Overall Risk Using Alternative Additive Method
Overall Risk Using ANS Task Force Additive Method
1 H H H H H 2 M H M H H 3 H M M M H 4 M M M M M 5 L H L M M 6 H L L L M 7 M L L L M 8 L M L L M 9 L L L L L 10 H, M, or L N N N N
a H = High; M = Medium; L = Low; N = None.
would be assigned if the probability of establishment is low but the consequence rating for the ANS is high. This approach reduces the chance of underestimating actual risk posed by a high consequence species by accounting for error in estimating the probability of establishment. The multiplicative and additive approaches can be represented in risk matrix, which is commonly used in qualitative risk assessment to illustrate how the probability of establishment and consequence are combined into a final risk rating (Table 10). Ideally, a qualitative risk matrix approximates a quantitative risk matrix such that a high qualitative matrix risk score represents, in reality, a quantitatively higher risk than a low matrix risk score (Cox 2008). Cox (2008) uses the term “weak consistency” to describe this underlying conformity between the qualitative risk matrix and an underlying quantitative model. To meet this goal of weak consistency, the structure of the risk matrix should follow certain rules (Cox 2008). An example of such a rule is that no high risk cell in the risk matrix should touch a low risk cell because it would represent a discontinuous jump in risk as opposed to the progressive increase in risk one would expect with a quantitative model. Similarly, Cox (2008) argues that a risk matrix satisfying weak consistency will have low risk in all cells in the bottom row and all cells on the left‐most column. The risk matrix shown in Table 10 conforms to Cox’s rules of weak consistency.

C‐39 January 2014
TABLE 10 Example of a Risk Matrix Conforming to the Principles of Weak Consistency
Consequence
Establishment L M H
H L M H
M L M M
L L L L
As Cox (2008) demonstrates, risk matrices based on the additive methods violate the assumptions of weak consistency, while the risk matrix based on the multiplicative method conforms to Table 10. Consequently, the multiplicative method best approximates a quantitative risk analysis. Therefore, the GLRMIS risk assessment process used the multiplicative approach to determine the overall risk of an ANS. The multiplicative method of determining overall risk is similar to that used by the U.S. Department of Agriculture Animal and Plant Health Inspection Service in their weed risk assessment (USDA 2004). Table 11 identifies the risk ratings that will be assigned to each ANS based on its probability of becoming established in a new basin and the overall level of consequences that could result from that establishment.
TABLE 11 GLMRIS Multiplicative Method to Determine the
Overall ANS Risk Levela
Risk
Scenario
Probability of Establishment
Consequence of Establishment
CAWS Risk Level
1 H H H2 M H M3 H M M4 M M M5 L H L6 H L L7 M L L8 L M L9 L L L10 H, M, or L N N
a H = High; M = Medium; L = Low; N = None.

C‐40 January 2014
A High CAWS risk level will be assigned if:
• The probability of establishment and the overall consequences are both rated High (Scenario 1).
A Medium CAWS risk level will be assigned if either:
• The probability of establishment is High and the overall consequences are Medium (Scenario 3);
• Both the probability of establishment and the consequence ratings are
Medium (Scenario 4); or
• The probability of establishment is Medium but the consequence rating is High (Scenario 2).
A Low CAWS risk level will be assigned if either:
• The probability of establishment is rated either High or Medium and the consequence rating is Low (Scenarios 6, and 7, respectively);
• The probability of establishment is Low and the consequence rating is
Medium or High (Scenario 5 and 8); or
• Both the probability of establishment and the consequences are Low (Scenario 9).
In the event that no consequences are identified (see Section 3.3.5), then a CAWS risk rating of None will be assigned. Although the GLRMIS multiplicative method was used to determine the final list of medium and high risk ANS, this list could differ significantly if the additive methods described above were used to derive an ANS risk rating. Therefore, a sensitivity analysis was performed to compare the composition of the final lists of medium a high risk species generated by the three different methods. No uncertainty rating was assigned for the probability of establishment rating or the overall consequence of establishment rating because there is no objective way to characterize overall uncertainty for an aggregate rating. Consequently, no uncertainty rating was assigned to the risk of adverse impacts.
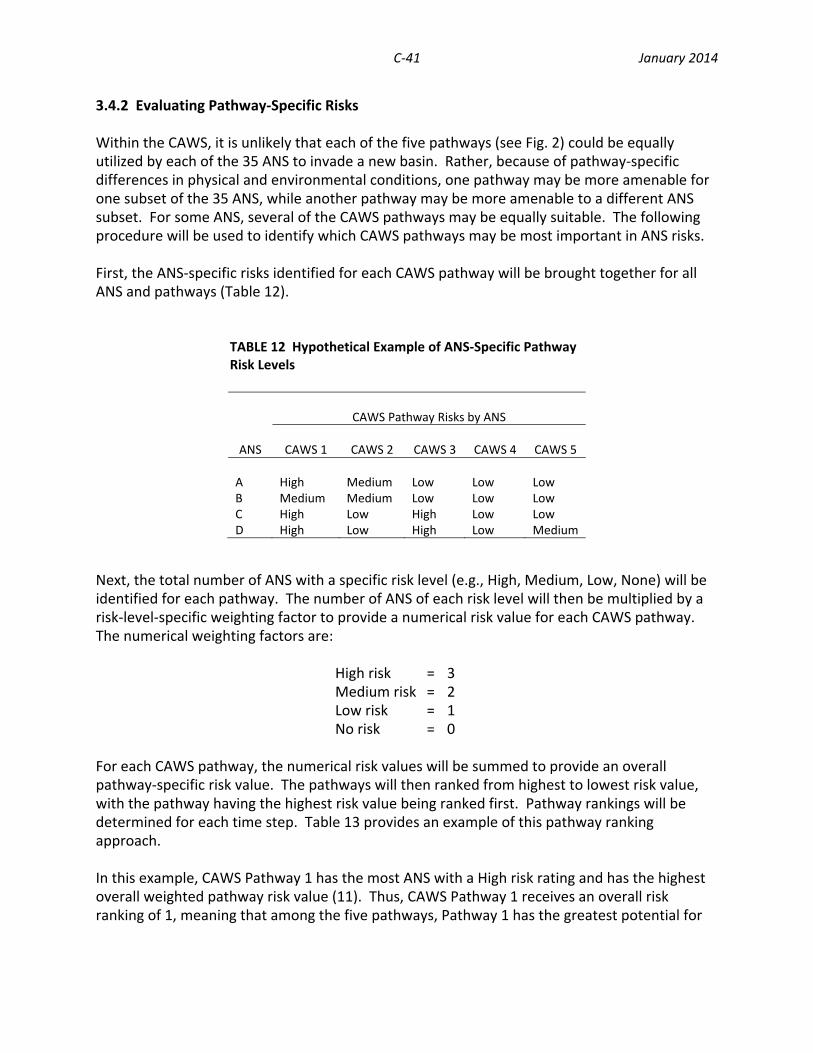
C‐41 January 2014
3.4.2 Evaluating Pathway‐Specific Risks Within the CAWS, it is unlikely that each of the five pathways (see Fig. 2) could be equally utilized by each of the 35 ANS to invade a new basin. Rather, because of pathway‐specific differences in physical and environmental conditions, one pathway may be more amenable for one subset of the 35 ANS, while another pathway may be more amenable to a different ANS subset. For some ANS, several of the CAWS pathways may be equally suitable. The following procedure will be used to identify which CAWS pathways may be most important in ANS risks. First, the ANS‐specific risks identified for each CAWS pathway will be brought together for all ANS and pathways (Table 12).
TABLE 12 Hypothetical Example of ANS‐Specific Pathway Risk Levels
CAWS Pathway Risks by ANS
ANS
CAWS 1 CAWS 2 CAWS 3 CAWS 4 CAWS 5 A High Medium Low Low LowB Medium Medium Low Low LowC High Low High Low LowD High Low High Low Medium
Next, the total number of ANS with a specific risk level (e.g., High, Medium, Low, None) will be identified for each pathway. The number of ANS of each risk level will then be multiplied by a risk‐level‐specific weighting factor to provide a numerical risk value for each CAWS pathway. The numerical weighting factors are: High risk = 3 Medium risk = 2 Low risk = 1 No risk = 0 For each CAWS pathway, the numerical risk values will be summed to provide an overall pathway‐specific risk value. The pathways will then ranked from highest to lowest risk value, with the pathway having the highest risk value being ranked first. Pathway rankings will be determined for each time step. Table 13 provides an example of this pathway ranking approach. In this example, CAWS Pathway 1 has the most ANS with a High risk rating and has the highest overall weighted pathway risk value (11). Thus, CAWS Pathway 1 receives an overall risk ranking of 1, meaning that among the five pathways, Pathway 1 has the greatest potential for

C‐42 January 2014
TABLE 13 Example of Overall Pathway Risk Ranking
Number of ANS per Pathway by Risk Level
Risk Ranking‐
High Risk Ranking‐Medium
Risk Ranking‐Low
Risk Ranking‐None
CAWS Pathway N
o. A
NS
Weighted
Risk Valuea
No. A
NS
Weighted
Risk Valuea
No. A
NS
Weighted
Risk Valuea
No. A
NS
Weighted
Risk Valuea
Total Weighted ANS Risk Value
Overall Pathway Risk
Ranking
1 3 9 1 2 0 0 0 0 11 12 0 0 2 4 2 2 0 0 6 33 2 6 0 0 2 2 0 0 8 24 0 0 0 0 4 4 0 0 4 55 0 0 1 2 3 3 0 0 5 4
a Weighting factors: High = 3; Medium = 2; Low = 1; None = 0.
one or more ANS to use the pathway to become established in a new basin and cause adverse impacts. 3.5 PATHWAY RISK MANAGEMENT The risk assessment will provide the following determinations for each of the 35 ANS and five CAWS pathways:
1. The probability of each ANS transferring from one basin to a new basin and become established.
2. The nature and extent of potential environmental, economic, and
social/political consequences, and an overall level of consequences, that could be incurred with the establishment of each ANS in a new basin.
3. The risk of adverse impacts from the interbasin transfer and subsequent
establishment of each ANS.
4. A ranking of the five CAWS pathways in terms of each pathway’s potential for supporting ANS interbasin transfer and the risk of adverse impacts occurring as a result of those transfers.
The ANS and pathways determined to pose high risks will be the immediate focus of risk management. Similarly, ANS and pathways receiving a Medium risk ranking will also undergo risk management consideration. Pathways and ANS with Low or None risk ratings will be considered to represent minimal risks, and these ANS and associated pathways will be

C‐43 January 2014
considered as not of immediate concern, and no immediate risk management considerations will be required for these species. However, it may be appropriate to monitor these ANS and pathways, as these have the potential to move up into a higher risk level in the future. 3.6 REFERENCES ANSTF (Aquatic Nuisance Species Task Force). 1996. Generic Nonindigenous Aquatic Organisms Risk Analysis Review Process. Risk Assessment and Management Committee, Washington, DC. Benke, K. K., Steel, J. L. and J. E. Weiss. 2011. Risk assessment models for invasive species: uncertainty in rankings from multi‐criteria analysis. Biological Invasions, 13:239‐253. Canadian Council of Fisheries and Aquaculture Ministers, National Code on Introductions and Transfers of Aquatic Organisms. 2002. Available at: www.dfo‐mpo.gc.ca/science/enviro/ais‐eae/code/prelim‐eng.htm Cox, L. A. 2008. What wrong with risk matrices? Risk Analysis, 28:497‐512. Cudmore, B., Mandrak, N. E., Dettmers, J., Chapman, D.C., and Kolar, C. S. 2012. Binational ecological risk assessment of bigheaded carps (Hypophthalmichthys spp.) for the Great Lakes basin. DFO Can. Sci. Advis. Sec. Res. Doc. 2011/114. Daehler, C. C., Denslow, J. S., Ansari, S. and H. Kuo. 2004. A risk‐assessment system for screening out invasive plants from Hawaii and other Pacific Islands. Conservation Biology, 18:360‐368. EPA (U.S. Environmental Protection Agency). 1992. Framework for Ecological Risk Assessment. EPA/630/R‐92/001. Risk Assessment Forum, Washington, DC. EPA. 1998. Guidelines for Ecological Risk Assessment. EPA/630/R‐95/002F. Risk Assessment Forum, Washington, DC. Hulme, P. E. 2012. Weed risk assessment: a way forward or a waste of time? Journal of Applied Ecology, 49:10‐19. Maguire, L. A. 2004. What can decision analysis do for invasive species management? Risk Analysis, 24:859‐868. NRC (National Research Council). 1983. Risk Assessment in the Federal Government: Managing the Process. National Academy Press, Washington, DC. Parker, C., Caton, B. P. and L. Fowler. 2007. Ranking nonindigenous weed species by their potential to invade the United States. Weed Science, 55:386‐397.

C‐44 January 2014
Pheloung, P. C., Williams, P. A. and S. R. Halloy. 1999. A weed risk assessment model for use as a biosecurity tool evaluating plant introductions. Journal of Environmental Management, 57:239‐251. Powell, M. R. 2004. Risk assessment for invasive plant species. Weed Technology, 18:1305‐1308. USDA (U.S. Department of Agriculture. 2004. Weed‐Initiated Pest Risk Assessment Guidelines for Qualitative Assessments. Analyst, U.S. Department of Agriculture Animal and Plant Health Inspection Service Plant Protection and Quarantine Service Center for Plant Health Science and Technology Plant Epidemiology and Risk Analysis Laboratory, Raleigh, NC. Veraldi, F. M., K. Baerwaldt, B. Herman, S. Herleth‐King, M. Shanks, L. Kring, & A. Hannes. 2011. Alien Species of Concern and Dispersal Risk for the Great Lakes and Mississippi River Interbasin Study. U.S. Army Corps of Engineers, Chicago District, Chicago, IL.