Embed Size (px)
Citation preview
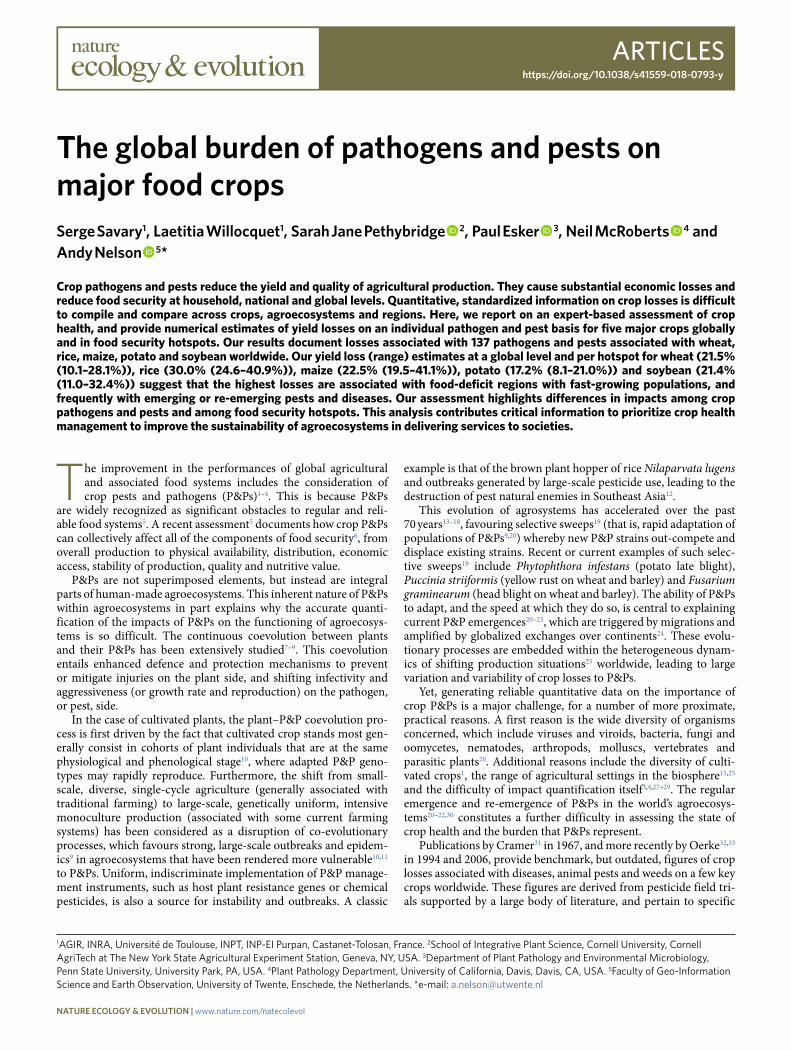
Articleshttps://doi.org/10.1038/s41559-018-0793-y
1AGIR, INRA, Université de Toulouse, INPT, INP-EI Purpan, Castanet-Tolosan, France. 2School of Integrative Plant Science, Cornell University, Cornell AgriTech at The New York State Agricultural Experiment Station, Geneva, NY, USA. 3Department of Plant Pathology and Environmental Microbiology, Penn State University, University Park, PA, USA. 4Plant Pathology Department, University of California, Davis, Davis, CA, USA. 5Faculty of Geo-Information Science and Earth Observation, University of Twente, Enschede, the Netherlands. *e-mail: [email protected]
The improvement in the performances of global agricultural and associated food systems includes the consideration of crop pests and pathogens (P&Ps)1–4. This is because P&Ps
are widely recognized as significant obstacles to regular and reli-able food systems5. A recent assessment5 documents how crop P&Ps can collectively affect all of the components of food security6, from overall production to physical availability, distribution, economic access, stability of production, quality and nutritive value.
P&Ps are not superimposed elements, but instead are integral parts of human-made agroecosystems. This inherent nature of P&Ps within agroecosystems in part explains why the accurate quanti-fication of the impacts of P&Ps on the functioning of agroecosys-tems is so difficult. The continuous coevolution between plants and their P&Ps has been extensively studied7–9. This coevolution entails enhanced defence and protection mechanisms to prevent or mitigate injuries on the plant side, and shifting infectivity and aggressiveness (or growth rate and reproduction) on the pathogen, or pest, side.
In the case of cultivated plants, the plant–P&P coevolution pro-cess is first driven by the fact that cultivated crop stands most gen-erally consist in cohorts of plant individuals that are at the same physiological and phenological stage10, where adapted P&P geno-types may rapidly reproduce. Furthermore, the shift from small-scale, diverse, single-cycle agriculture (generally associated with traditional farming) to large-scale, genetically uniform, intensive monoculture production (associated with some current farming systems) has been considered as a disruption of co-evolutionary processes, which favours strong, large-scale outbreaks and epidem-ics9 in agroecosystems that have been rendered more vulnerable10,11 to P&Ps. Uniform, indiscriminate implementation of P&P manage-ment instruments, such as host plant resistance genes or chemical pesticides, is also a source for instability and outbreaks. A classic
example is that of the brown plant hopper of rice Nilaparvata lugens and outbreaks generated by large-scale pesticide use, leading to the destruction of pest natural enemies in Southeast Asia12.
This evolution of agrosystems has accelerated over the past 70 years13–18, favouring selective sweeps19 (that is, rapid adaptation of populations of P&Ps9,20) whereby new P&P strains out-compete and displace existing strains. Recent or current examples of such selec-tive sweeps19 include Phytophthora infestans (potato late blight), Puccinia striiformis (yellow rust on wheat and barley) and Fusarium graminearum (head blight on wheat and barley). The ability of P&Ps to adapt, and the speed at which they do so, is central to explaining current P&P emergences20–23, which are triggered by migrations and amplified by globalized exchanges over continents24. These evolu-tionary processes are embedded within the heterogeneous dynam-ics of shifting production situations25 worldwide, leading to large variation and variability of crop losses to P&Ps.
Yet, generating reliable quantitative data on the importance of crop P&Ps is a major challenge, for a number of more proximate, practical reasons. A first reason is the wide diversity of organisms concerned, which include viruses and viroids, bacteria, fungi and oomycetes, nematodes, arthropods, molluscs, vertebrates and parasitic plants26. Additional reasons include the diversity of culti-vated crops1, the range of agricultural settings in the biosphere15,25 and the difficulty of impact quantification itself3,4,27–29. The regular emergence and re-emergence of P&Ps in the world’s agroecosys-tems20–22,30 constitutes a further difficulty in assessing the state of crop health and the burden that P&Ps represent.
Publications by Cramer31 in 1967, and more recently by Oerke32,33 in 1994 and 2006, provide benchmark, but outdated, figures of crop losses associated with diseases, animal pests and weeds on a few key crops worldwide. These figures are derived from pesticide field tri-als supported by a large body of literature, and pertain to specific
The global burden of pathogens and pests on major food cropsSerge Savary1, Laetitia Willocquet1, Sarah Jane Pethybridge 2, Paul Esker 3, Neil McRoberts 4 and Andy Nelson 5*
Crop pathogens and pests reduce the yield and quality of agricultural production. They cause substantial economic losses and reduce food security at household, national and global levels. Quantitative, standardized information on crop losses is difficult to compile and compare across crops, agroecosystems and regions. Here, we report on an expert-based assessment of crop health, and provide numerical estimates of yield losses on an individual pathogen and pest basis for five major crops globally and in food security hotspots. Our results document losses associated with 137 pathogens and pests associated with wheat, rice, maize, potato and soybean worldwide. Our yield loss (range) estimates at a global level and per hotspot for wheat (21.5% (10.1–28.1%)), rice (30.0% (24.6–40.9%)), maize (22.5% (19.5–41.1%)), potato (17.2% (8.1–21.0%)) and soybean (21.4% (11.0–32.4%)) suggest that the highest losses are associated with food-deficit regions with fast-growing populations, and frequently with emerging or re-emerging pests and diseases. Our assessment highlights differences in impacts among crop pathogens and pests and among food security hotspots. This analysis contributes critical information to prioritize crop health management to improve the sustainability of agroecosystems in delivering services to societies.
NATuRE EcoLogy & EvoLuTioN | www.nature.com/natecolevol

Articles NaTure eCOlOgy & evOluTiON
geographic regions of the world. This approach generated estimates for aggregated groups of P&Ps (‘pathogens’, including fungi, chrom-ista and bacteria, ‘viruses’, ‘animal pests’, including insects and mites, and ‘weeds’). However, the pesticide trial approach may have draw-backs34 with respect to several dimensions of representativeness: over time (trials focused on a particular P&P for a limited period of time); over space (trials often conducted in experimental stations, rather than farm contexts); of scale (for example, very small experi-mental plots); of specificity (for example, the contrast between ‘treated’ and ‘non-treated’ yield performance without quantitative causation by specific P&Ps); and of injury (for example, artifi-cially amplified dynamics of injuries). The global burden of P&Ps on major food crops, its variation over time and among agroeco-systems, and the individual contributions of specific P&Ps to this burden, thus remain poorly quantified.
The present work concerns five major crops worldwide—wheat, rice, maize, potato and soybean—which contribute 18.3, 18.9, 5.4, 2.2 and 3.3% of the global human calorie intake (2013 estimates), respectively35. Our approach to assessing the global burden of P&Ps on these major food crops is based on a short-duration (three-month) survey36 targeted to a large, yet clearly identified, global community of crop health experts mostly belonging to the International Society for Plant Pathology (ISPP; see Methods). We designed a very simple survey questionnaire (see Methods) so that respondents provided answers that would: (1) be rapid; (2) elicit accurate, categorized responses on crop losses, both in terms of loss magnitude and loss frequency over successive growing seasons; (3) correspond to a specific P&P × crop combination using a pre-set list of P&Ps for each crop, but also providing all of the flexibil-ity required to name other P&Ps of the respondent’s choice; (4) be georeferenced; and (5) enable recognition of individual contribu-tions, as confirmed by each respondent. The assembled data were analysed in two directions. The first was to produce estimates of crop losses on a crop × P&P × location basis, to be later aggregated on a crop or food security hotspot basis, and then globally, using national and global agricultural statistics. The second was to analyse and interpret, within crops, or across crops and globally, the asso-ciations between crop losses, crop yields, climates, food security hotspots and the emergence status of key P&Ps.
Here, we report the results from an online survey conducted to obtain expert assessments of crop losses for wheat, rice, maize, potato and soybean as five major crops across the world. The survey protocol documented a series of variables (Table 1): crop; P&P name (disease or pest name); reported loss magnitude and frequency; climate; food security hotspot; emergence status; and national average (2010–2014) crop yields and associated quartiles.
ResultsOur survey generated 989 responses from 219 experts (Supplementary Table 1) in 67 countries over the main produc-ing regions of the world for the five crops, with good coverage (Supplementary Fig. 1) of the main food security hotspots (United States Midwest and Canada (USM&C); South Brazil, Paraguay, Uruguay and Argentina (SB&A); Northwest Europe (NWE); West Asia and North Africa (WANA); Sub-Saharan Africa (SSA); main-land China (China); the Indo-Gangetic Plain (IGP); and Southeast Asia (SEA)). These responses documented a total of 137 P&Ps on the 5 considered crops (Supplementary Table 2). The collective responses to the survey questionnaire yielded a good association between the number of responses per country and the production per country in each of the five crops (Supplementary Fig. 2), reflect-ing the robustness of the data structure generated by the survey. The responses from the survey represented countries that account for a total of 83, 94, 79, 69 and 95% of the global production for wheat, rice, maize, potato and soybean, respectively (based on the average production of the crops over 2010–201435). The survey therefore
represents a substantial fraction of the production of the 5 crops over the world (84% across all 5 crops).
Synthesis of the responses, combined with national yield statis-tics, led to global crop loss estimates per crop of 21.5, 30.0, 22.6, 17.2 and 21.4% caused by combined P&Ps on wheat, rice, maize, potato and soybean, respectively (Fig. 1). However, these overall estimates mask the very large differences that were found in the lev-els of crop losses among different food security hotspots (Fig. 1 and Supplementary Table 3). Considering food production per person, our results suggest that crop losses can be comparatively lower in hotspots generating large production and surpluses (for example, USM&C and SB&A), whereas crop losses can be very high in food-insecure hotspots (for example, SSA and the IGP) (Fig. 1).
Very large variation in crop losses caused by specific P&Ps was also found (Fig. 2 and Supplementary Table 3). Of the 31 P&Ps reported in wheat (Supplementary Table 2), 8 (leaf rust, Fusarium head blight (FHB)/scab, tritici blotch, stripe rust, spot blotch, tan spot, aphids and powdery mildew) caused losses higher than 1% globally. In rice, 26 P&Ps were reported, 7 of which (sheath blight, stem borers, blast, brown spot, bacterial blight, leaf folder and brown plant hopper) caused global losses higher than 1%. In maize, 38 P&Ps were reported, 6 of which (Fusarium and Gibberella stalk rots, fall armyworm, northern leaf blight, Fusarium and Gibberella ear rots, anthracnose stalk rot and southern rust) caused global losses higher than 1%. In potato, 17 P&Ps were reported, 4 of which (late blight, brown rot, early blight and cyst nematode) caused global losses higher than 1%. In soybean, 25 P&Ps were reported, 7 of which (cyst nematode, white mould, soybean rust, Cercospora leaf blight, brown spot, charcoal rot and root knot nematodes) caused global losses higher than 1%. The relative importance of P&Ps also varied strongly, depending on the food security hotspot being con-sidered (Fig. 2 and Supplementary Table 3).
These estimates were based on crop loss magnitudes and fre-quency of loss occurrences reported by experts (Table 1). Detailed univariate and multivariate analyses showed the consistency of the collected data and identified patterns of associations (Supplementary Tables 4–6, Fig. 3 and Supplementary Fig. 3).
The frequencies of responses pertaining to very low, low, moder-ate, high and very high loss magnitudes were 15.4, 37.2, 33.8, 11.5 and 2.1%, respectively. A majority of responses (70%) indicated that losses are ‘chronic’ (that is, occur every growing season), fol-lowed by ‘frequent’ (every other growing season (15%)), ‘infrequent’ (1 season in 5 (9%)) and ‘rare’ (less frequent than 1 season in 5 (6%)). In addition to crop loss estimates, we also analysed the mul-tivariate associations between reported losses, their frequencies, the nature of crops, food security hotspots, climates, levels of crop per-formances and a number of emerging P&Ps.
Considering the overall data for 5 crops globally, very strong and significant associations (Supplementary Table 4) were found between loss magnitude and crop (χ2 = 57.7; 12 d.f.; P < 0.001), loss magnitude and hotspot (χ2 = 165.2; 24 d.f.; P < 0.001) and hotspot and crop (χ2 = 596.6; 32 d.f.; P < 0.001). The multidimensional pattern of association between these variables was explored using cor-respondence analysis (Fig. 3). Correspondence analysis37–41 is a multivariate method that enables assessment and interpretation of multiple associations among qualitative or (categorized) quantita-tive variables, using a χ2 metric. A clear path of increasing levels of reported loss magnitudes, from very low to high (combining the two levels high and very high) is displayed. Along this path, maize and soybean are predominantly associated with a low loss magni-tude, while potato is strongly associated with a high loss magnitude. Rice appears to be predominantly associated with a low or moderate loss magnitude, while wheat (positioned near the origin of the axes) is not linked to any particular level of loss magnitude. Projection of the hotspot variable onto the framework of Fig. 3 indicates that USM&C and SB&A are associated with (1) maize and soybean and
NATuRE EcoLogy & EvoLuTioN | www.nature.com/natecolevol

ArticlesNaTure eCOlOgy & evOluTiON
(2) a very low loss magnitude, while SEA is associated with (1) rice and (2) a range of loss magnitudes, dominated by low or moderate magnitudes. China, the IGP and, to a greater extent, NWE (posi-tioned near the origin of the axes) are not associated with particular crops or specified levels of loss magnitude. Emerging P&Ps (Table 1 and Supplementary Table 2) for which associations cannot reliably be tested owing to a low frequency of reports were nevertheless pro-jected onto the framework of Fig. 3. Four broad patterns emerge: a first group of emerging P&Ps appears associated with extreme levels (low or high) of loss magnitude; a second is associated with high loss magnitude; a third corresponds to moderate-to-low loss mag-nitude; and a fourth cannot be linked with any particular level of loss magnitude.
Analyses of contingency tables (Supplementary Table 4) and correspondence analyses (Supplementary Fig. 3 and Supplementary Tables 5 and 6) were also performed on data pertaining to each of the five crops, using the yield quartile as a measure of agricultural performance. Similar associations among variables were found in these crop-specific analyses: (1) a negative association between increasing crop performance and loss magnitude; (2) a linkage between the humid tropics and high loss magnitude; and (3) an overall linkage of high loss magnitude with SSA (in all five crops), and with the IGP (in rice, maize and potato). Correspondence
analyses (Supplementary Fig. 3) summarize these similar patterns of associations along explicit paths of increasing loss magnitude. These analyses highlight the association between emerging P&Ps and high loss magnitude (for example, wheat blast in wheat; fall armyworm, maize lethal necrosis and striga in maize; brown rot in potato; and soybean rust in soybean).
DiscussionThis study provides numerical estimates for the yield losses caused by 137 individual P&Ps on 5 major crops worldwide. It also indi-cates that global crop losses caused by P&Ps range between 17 and 23% for all five crops, except rice, for which the estimate is 30%. These estimates are within the same range as the global estimates for losses to P&Ps reported by Oerke32, using a completely differ-ent approach for the 2001–2003 period: 21% in wheat, 27% in rice, 21% in maize, 32% in potato and 19% in soybean. This suggests that the range 20–30% is fairly robust in representing losses to P&Ps globally, and also that no major changes in crop health occurred between 2001–2003 and 2017, when this global survey on crop losses was conducted.
Our results (Figs. 1 and 2 and Supplementary Table 3) highlight the large variation in crop health patterns and associated crop losses across global food security hotspots. It appears that crop losses are
Table 1 | List and characteristics of the variables used in the analysis.
variable namea variable typeb variable meaning (remarks) variable classes (categorical)
variable classes (numerical)
Crop Cardinal Crop name Wheat; rice; maize; potato; soybean
None
Disease or pest name Cardinal Name of a disease or pest Many names of diseases (causal pathogens) or pests (see Supplementary Table 2)
None
Loss magnitude Ordinal Crop loss magnitude, corresponding to one of the pre-set classes for crop loss of the survey questionnaire, or expressed as the percentage of crop losses corresponding to the median of each crop loss class
(1) Very low(2) Low(3) Moderate(4) High(5) Very high
0.5%3.0%12.5%40.0%80.0%
Loss frequency Ordinal Frequency of occurrence, corresponding to one of the pre-set classes of occurrence in the survey questionnaire, or expressed as the fraction of seasons of occurrence for each class of frequency
(1) Chronic(2) Frequent(3) Infrequent(4) Rare
1.00.50.20.1
Frequency × magnitude Continuous numerical Loss frequency × loss magnitude
Climate Cardinal Climate codes derived from the Köppen–Geiger map52,53
Arid; humid continental; equatorial; Mediterranean; monsoon; oceanic; subtropics; humid tropics
Hot spot Cardinal Food security hotspots USM&C; SB&A; NWE; WANA; SSA; China; IGP; SEA
Emergence status Cardinal Emerging or re-emerging P&Psc
Yield Continuous numerical (kg ha−1)
Mean yield of each crop (2010–2014), corresponding to the country of the response35
None None
Yield quartiles Ordinal Categories of average yields for each crop according to quartiles
Yield Q1Yield Q2Yield Q3Yield Q4
Very lowLowMediumHigh
aVariables characterizing responses, where each response pertains to one disease or pest affecting one of the five crops considered. bCardinal data correspond to qualitative variables with modalities that do not correspond to a rank or order, such as crop names, names of diseases and pests, climatic zones or regions of the world. Ordinal data correspond to qualitative data represented by successive grades (for example, successive levels of crop loss magnitude or successive quartiles in a yield distribution). Ordinal data can be represented by categorical classes or numerical classes, while continuous numerical data correspond to quantitative continuous variables, such as crop yield. cSome of the reported P&Ps were considered emerging on the basis of their recent expansion (geographical, or in terms of host range) or recent genetic evolution20–22.
NATuRE EcoLogy & EvoLuTioN | www.nature.com/natecolevol

Articles NaTure eCOlOgy & evOluTiON
Wheat Rice Maize Potato Soybean
NWE
SB&A
1
10
100
1,000
Pro
duct
ion
per
pers
on (
kg)
World
0
10
20
30
40
Yie
ld lo
ss (
%)
1
10
100
1,000
Pro
duct
ion
per
pers
on (
kg)
0
10
20
30
40
Yie
ld lo
ss (
%)
1
10
100
1,000
Pro
duct
ion
per
pers
on (
kg)
0
10
20
30
40
Yie
ld lo
ss (
%)
SSA
WANA IGP
SEA
China
USM&C
NWEUSM&C
SB&A
SSA
SEAIGP
CHINAWANA
Fig. 1 | global variations in crop losses and production. The top left chart shows global losses and production for wheat, rice, maize, potato and soybean. The other charts are specific to each food security hotspot. The upper portion of each chart shows the kilograms of crop production per person (2010–2014 averages) on a log10 scale. The lower portion shows the percentage yield losses across all reported P&Ps. Food security hotspot charts only show losses where there were sufficient survey responses to estimate the loss. The grey dots represent the world averages per crop. The global map shows the location of the eight food security hotspots (data from ref. 54). Above-average crop losses were found for: wheat (25.7%), rice (31.3%) and (maize 30.1%) in SSA; rice (40.9%), maize (41.1%) and potato (21.0%) in the IGP; wheat (28.1%) and rice (32.2%) in China; soybean (32.4%) in SB&A; and wheat (24.9%) in NWE. However, lower than average crop losses were recorded for: wheat (17.9%), maize (21.3%) and potato (8.1%) in USM&C; wheat (10.1%) and potato (12.6%) in WANA; and wheat (16.6%) in the IGP.
NATuRE EcoLogy & EvoLuTioN | www.nature.com/natecolevol

ArticlesNaTure eCOlOgy & evOluTiON
frequently lower in hotspots that generate food surpluses (NWE, USM&C and SB&A, except for soybean; Fig. 1) and higher in hotspots located in food-insecure regions (the IGP and SSA; Fig. 1). This finding concurs with the overall multiple correspondence analysis of responses (Fig. 3), where SSA and WANA are frequently associated with reported high loss magnitudes, and SEA, CHINA and the IGP are frequently associated with reported moderate loss magnitudes. Such associations are further documented in the crop-specific multiple correspondence analyses (Supplementary Fig. 3), where, for example, SSA is associated with reported high loss mag-nitudes in wheat, rice, maize and soybean. In contrast, USM&C is consistently associated with reported very low loss magnitudes for all four crops (wheat, maize, potato and soybean) of that hotspot. Yield quartiles, which may be taken as indicators of levels of agri-cultural intensification and management, were incorporated in the crop-specific multiple correspondence analyses (Supplementary Fig. 3) of associations between losses, yield, climate, food security hotspots and key pests. In all five analyses, very low and/or low yield quartiles were associated with high reported crop losses, and very high and/or high yield quartiles were associated with very low reported crop losses, reflecting the high χ2 values of the asso-ciated (yield quartile × loss magnitude) contingency tables (57.9, 30.3, 45.5, 35.8 and 44.6 for wheat, rice, maize, potato and soybean, respectively; 9 d.f. and P < 0.001 in all cases; Supplementary Table 4). These consistent associations suggest a linkage between: crop losses and production situations42 (that is, the biophysical and socioeco-nomic context where a crop is grown25); reduced crop losses and
favourable production situations (where crop health management is perhaps more efficient); and increased crop losses and less favour-able production situations (where crop health management is less effective). The consistency of linkages (Supplementary Table 4) and similarity of association patterns (Fig. 3, Supplementary Tables 5 and 6 and Supplementary Fig. 3) further support the overall robust-ness of the dataset generated by the survey.
The variation in species of P&Ps occurring in different hotspots of course reflects environmental (climatic, social and economic) differences, but the variation in patterns of crop losses across food security hotpots reflects a variation in the harmfulness of P&P inju-ries to the standing crops25, which in turn depends on the produc-tion situations. Thus, the observed pattern of crop losses suggests successive levels of efficiency in crop health management across hotspots, and correspondingly variable scope for improvement.
Crop loss information reflects the failures in managing crop health, but also the successes accomplished. Crop loss informa-tion therefore constitutes a yardstick for past advances and future progress43. Our results thus provide a basis for research and policy prioritization of crop health management, by considering the main groups of P&Ps derived from the survey. A first group includes P&Ps that chronically cause large crop losses globally, or at least in some of the main food security hotspots. These P&Ps are also reported in a large body of literature across the world for their impacts (Supplementary Table 2 and Supplementary References). These P&Ps are frequently reported towards the tops of the heat maps in Fig. 2 (that is, they cause the largest global crop losses).
Aggregate sheath spot
Hoja blanca
Stem rot
White grubs
Black bug
Rice weevil
Narrow brown leaf spot
Grassy stunt
Bakanae
Yellow mottle
Bacterial sheath rot
Kernel smut
Rice sheath mite
Stripe
Rice tungro
Ragged stunt
Sheath rot
False smut
Bacterial panicle blight
Brown plant hopper
Leaf folder
Bacterial blight
Brown spot
Blast
Stem borers
Sheath blight
Rice
Head smut
Crazy top
Anthracnose leaf blight
Black maize beetle
African boll worm
Cutworm
Mediterranean corn borer
Eyespot
Mal de rio cuarto
Root knot nematodes
Maize spotted stem borer
Common smut
Brown stripe downy mildew
Asian corn borer
Maize lethal necrosis
Sorghum and Rajasthandowny mildew
Striga
Banded leaf and sheathblight
African corn borer
European stem borer
Diplodia rot
Silk fly
Corn stunt
Tar spot
Maize streak
White spot
Southern leaf blight
Bacterial stalk rot
Common rust
Gray leaf spot
Diabrotica
Southern rust
Anthracnose stalk rot
Fusarium andGibberella ear rots
Northern leaf blight
Fall armyworm
Fusarium andGibberella stalk rots
Maize
Armyworm
Cylindrocladium rot
Alternaria leaf spot
Stem canker
Phyllosticta leaf spot
Downy mildew
Pythium damping- off
Reniform nematode
Anthracnose
Phomopsis seed decay
Frogeye leaf spot
Spider mites
Target spot
Soybean mosaic
Rhizoctonia rot andblight
Fusarium wilt and rot
Sudden death
Phytophthora root and stemrot
Root knot nematodes
Charcoal rot
Brown spot
Cercospora leaf blight
Soybean rust
White mould
Cyst nematode
Soybean
Zebra chip
Groundnut ringspot
Aphids
Canker and black scurf
Leaf worm
Slugs
Leaf miner
Colorado potato beetle
Common scab
Potato leaf hopper
Apical leaf curl
Verticillium wilt
Powdery scab
Cyst nematode
Early blight
Brown rot
Late blight
Potato
0
2.5
5.0
7.5
10.0
Yield loss (%)
Loose smut
Sclerotium foot and root
Black point
Fusarium seedling blight
Spindle streak mosaic
Leafminer
Heterodera avenae
Heterodera filipjevi
Russian wheat aphid
False armyworm
Pratylenchus neglectus
Wheat streak mosaic
Wheat blast
Aster yellows
Soilborne wheat mosaic
Pratylenchus thornei
Rhizoctonia bare patch
Sharp eye spot
Army worm
Crown and root rot
Stem rust
Nodorum blotch
BYD
Powdery mildew
Aphids
Tan spot
Spot blotch
Stripe rust
Tritici blotch
FHB/scab
Leaf rust
Wheat
Global
USM&C
SB&ANW
EChin
a
IGP
WANA
SSAGlob
al
China
SEAIG
PSSA
Global
USM&C
SB&AIG
PSSA
Global
USM&C
NWE
IGP
WANA
SSASSA
SB&AUSM
&C
Global
Fig. 2 | crop losses per pest or pathogen. Heat maps show the percentage yield losses per crop for each P&P (Supplementary Table 3). Losses are ranked globally, and are not shown when no or insufficient survey responses were received. Wheat crop losses are highest as a result of: tan spot (4.30%) and FHB/scab (3.20%) in USM&C; tan spot (6.79%) and wheat blast (3.52%) in SB&A; FHB/scab (8.75%) in China; spot blotch (7.29%) in the IGP; and stem rust (8.89%) in SSA. Rice crop losses are highest as a result of: sheath blight (8.75%) and stem borers (8.75%) in China; sheath blight (7.06%) and blast (5.89%) in SEA; brown spot (5.86%) and bacterial blight (8.51%) in the IGP; and yellow mottle (4.33%) in SSA. Maize crop losses are highest as a result of: Fusarium and Gibberella stalk rots (4.54%) and fall armyworm (4.34%) in USM&C; fall armyworm (4.34%) and Fusarium and Gibberella stalk rots (4.15%) in SB&A; southern rust (7.87%) and Fusarium and Gibberella stalk rots (5.84%) in the IGP; and fall armyworm (6.25%) and African corn borer (4.01%) in SSA. Potato crop losses are highest as a result of: late blight (3.24%) and cyst nematode (3.13%) in NWE; late blight (8.08%), apical leaf curl (3.65%) and brown rot (3.65%) in the IGP; late blight (4.90%) and brown rot (3.75%) in WANA; and late blight (4.18%) and brown rot (3.87%) in SSA. Soybean crop losses are highest as a result of: cyst nematode (9.31%) and white mould (4.11%) in USM&C; and soybean rust (6.65%) and cyst nematode (5.24%) in SB&A.
NATuRE EcoLogy & EvoLuTioN | www.nature.com/natecolevol

Articles NaTure eCOlOgy & evOluTiON
They include: leaf rust and tritici blotch in wheat; sheath blight, stem borers and blast in rice; Fusarium and Gibberella stalk rots in maize; late blight in potato; and cyst nematode and white mould in soybean. For this group, global efforts to deliver more efficient and sustainable management tools, such as varieties with durable resistance, are needed. A second group includes P&Ps that chroni-cally cause large crop losses in specific food security hotspots. These P&Ps would correspond to some of the top P&Ps ranked in Fig. 2 in specific food security hotspots, such as: spot blotch in the IGP, tan spot in SB&A, and FHB in China and SB&A for wheat; bacterial blight and brown spot in the IGP and rice yellow mottle in SSA for rice; southern rust in the IGP and striga in SSA for maize; brown rot in the IGP, WANA and SSA for potato; and soybean rust in SB&A for soybean. For this group, efforts similar to those in the previous group are required, but at the regional scale in hotspots affected by the P&Ps. Improved host plant resistance again constitutes a primary instrument for managing P&Ps in this second group. However, we note that this improvement faces the challenge of simultaneously addressing the many abiotic limiting factors that are pervasive in the considered hotspots44–47. A third group includes emerging P&Ps that are associated with large increases in crop losses in specific food security hotspots. Emerging P&Ps correspond to some of the top-ranked P&Ps in Fig. 2, or to P&Ps that stand out with high crop losses in specific food security hotspots (Fig. 2 and Supplementary Table 3). Examples are wheat blast in the IGP and stem rust of wheat in SSA, false smut of rice in the IGP, and fall armyworm and lethal necrosis virus disease in maize in SSA. For this group, urgent action is needed to contain P&Ps based on the available knowledge of the biology of the P&P, while efforts to generate long-term solutions, such as varietal resistance, need to be undertaken rapidly to deliver efficient management tools as soon as possible.
This analysis provides an overall assessment of the quantitative losses associated with individual P&Ps on five key food crops in the world. It allows ranking of the impacts of P&Ps globally, as well as regionally, thus incorporating large differences in agroecosystems15
and production situations25. As in the medical sciences48, assessing the burden of P&Ps in the plant sciences constitutes an important step forwards, in providing the basis for policies and long-term research priorities, as well as a better qualification of the impacts of emerging P&Ps in the world’s agroecosystems20–22,30. The global sur-vey of experts, which provided the basis for these estimates, appears to have generated robust results, which may be combined with field experimental and large-scale survey data3,4, as well as repetition and expansion of the survey to other crops.
MethodsWe designed an online survey for crop health experts to obtain expert assessments (Supplementary Fig. 4 and Supplementary Notes 1 and 2) of crop losses for five major crops across the world. We cleaned and standardized the survey responses, associated the responses with additional variables based on their geographic location (Supplementary Fig. 1) and characterized each reported P&P (Supplementary Table 2). We used contingency tables and chi-squared tests to examine and interpret patterns of association (for example, to assess the association between loss magnitude and climate (Supplementary Table 4)). Correspondence analyses (Supplementary Tables 5 and 6) provided graphical summaries of these associations (Fig. 3 and Supplementary Fig. 3). Crop losses were estimated globally and for eight food security hotspots, first by individual P&P and then combined (Figs. 1 and 2 and Supplementary Table 3).
Questionnaire design and survey. Our data come from an online, worldwide survey (Supplementary Fig. 4) of crop health experts carried out between 1 November 2016 and 31 January 2017 (Supplementary Notes 1 and 2) and hosted at http://globalcrophealth.org. The participants were crop health experts and the survey was crop driven (that is, we explicitly requested inputs on diseases or pest injuries affecting one of the five considered crops, which we refer to as P&Ps). For each of the five crops (wheat, rice, maize, potato and soybean), experts were asked to record the following information: (1) approximate location where the P&P occurred (recorded by placing a marker on an interactive Google Map interface; the location was recorded at the third administrative level (that is, including country, state/province and county/municipality names that were later geocoded to geographic coordinates)); (2) P&P name, from a list of ten per crop or as a free text entry for P&Ps not in the list (Supplementary Fig. 4 and Supplementary Table 2); (3) frequency of losses (recorded as: does not occur; every season; every other season; one season in five; or less frequent than one season in five); (4) level of yield losses (recorded as: < 1%; 1–5%; 5–20%; 20–60%; or > 60%); (5) name of
Maize
Potato
Rice
Soybean
Wheat
(1) Very low
(2) Low
(3) Moderate
(4) High
–1
0
1
0 1 2
bMaize and soybean are often associatedwith very low loss magnitudes
Potato is often associatedwith high loss magnitudes
Rice is often associated with lowor moderate loss magnitudes
(1) Very low
(2) Low
(3) Moderate
(4) High
China IGP
NWE
SB&A
SEA
SSA
USM&C
WANA
–1
0
1
0 1 2
c
SSA and WANA are often associatedwith high loss magnitudes
SEA, China and the IGP are oftenassociated with low ormoderate loss magnitudes
Maize
Potato
Rice
Soybean
Wheat
(1) Very low
(2) Low
(3) Moderate
(4) High
Bacterialpanicle blight
Brown rot
Fall armyworm
False smut
Maize lethalnecrosis
Soybean rust
Stem rust
Striga
Stripe rust
Wheat blast
China IGP
NWE
SB&A
SEA
SSA
USM&C
WANA
–1
0
1
0 1 2
Dimension 1
Dim
ensi
on 2
Loss magnitudeCropFood security hotspotKey pest
a
(1) Very low
(2) Low
(3) Moderate
(4) High
Bacterialpanicle blight
Brown rot
Fall armyworm
False smut
Maize lethalnecrosis
Soybean rust
Stem rust
Striga
Stripe rust
Wheat blast
–1
0
1
0 1 2
dEmerging P&Ps associated withextremes: high or very low loss magnitudes
Emerging P&Ps associated withhigh loss magnitudes
Emerging P&Ps associated withmoderate or low loss magnitudes
Emerging P&Ps associatedwith any loss outcome
Fig. 3 | Associations between losses, crops, food security hotspots and key pests. Each panel is a correspondence analysis map based on all of the survey responses. a, Associations for all of the active variables (loss magnitude and crop) and supplemental variables (food security hotspot and emerging P&Ps, or ‘key pests’) in the correspondence analysis. b–d, Associations between loss magnitude and each variable in turn (crop (b), food security hotspot (c) and key pest (d)), with annotations in grey to help interpretation of the associations.
NATuRE EcoLogy & EvoLuTioN | www.nature.com/natecolevol

ArticlesNaTure eCOlOgy & evOluTiON
expert (optional); (6) email address (optional); and (7) home institute (optional). The survey (http://globalcrophealth.org) was conducted for three months between 1 November 2016 and 31 January 2017.
The questions were designed to be quick and easy to complete, and a respondent was encouraged to submit more than one unique assessment. The survey recorded expert assessments of losses—hence the broad ranges for the frequency and level of losses. The geographic location of the assessment represented the centre of an area of interest (which could be a district, province or country) where the P&Ps had consistent patterns over time and space. The survey was not meant to replace field data for a specific crop, area and time, but rather to provide a unique source of collective knowledge on the status of crop health globally.
The survey was launched by the ISPP (Supplementary Notes 1 and 2). The invitation to participate in the survey was first sent to the ISPP mailing list (over 2,500 members registered on the ISPP mailing list were thus emailed directly). There are 63 national or regional scientific societies affiliated with the ISPP, which allowed a large coverage over countries producing the 5 crops addressed in the survey. The survey was announced in the ISPP November 2016 newsletter49, which was circulated to the ISPP mailing list and further circulated to the 63 national or regional ISPP societies (over 26,000 members). This allowed a large coverage over countries producing the five crops addressed in the survey. The survey was also promoted through a number of crop health mailing lists and Nature36.
We took several steps to reach a large coverage of experts and generate a high response rate. We recorded the total number of responses per crop × country/region combination on a weekly basis and used this to identify combinations where the response rate was lower than we would expect. We used this information to provide monthly updates in the ISPP newsletters in December 2016 and January 201750,51 that documented the responses to date, to encourage further responses, both in general and by specific crop × country/region combinations where additional responses were desirable (based on our weekly tracking of responses). Thus, all recipients of the ISPP newsletter received the survey update three times over the duration of the survey. We further emailed 87 specific crop health experts in countries where at least 1 of the 5 crops was grown extensively and in countries that hosted Consultative Group on International Agricultural Research institutes with mandates for the 5 crops. In total, 30% of the experts we emailed individually provided responses to the survey.
The removal of duplicate submissions, and standardization of the survey responses, resulted in a database of 989 records where a P&P was reported to occur, based on information from 219 crop health experts in 67 countries. These are reported and referenced in Supplementary Table 1.
Respondents were given the option to submit their data anonymously, or to opt in to provide their name and affiliation for acknowledgement in subsequent publications (Supplementary Table 1). Only 31 of the 989 responses (3.1%) were provided anonymously. In addition to the information provided in the online survey, further communications with respondents via ISPP newsletters and email restated the intention to publish reports on the outcome of the survey and to acknowledge survey respondents, satisfying the conditions of informed consent.
Characteristics of the survey responses. We associated additional variables with the survey responses by using their geographic location to associate them with: (1) climate, based on a Köppen–Geiger climate classification52,53; (2) food security, based on whether the reported country54 was within one of eight food security hotspots, defined here as globally important sinks and/or sources of food16,18 based on production and consumption figures for the five crops (2010–2014)35; (3) productivity, based on the mean yield of the crop (2010–2014) corresponding to the country of the response35; and (4) relative productivity, based on the average yield for each crop according to quartiles (Table 1).
The initial climate classification was used to check whether the reported geographic location of a P&P was consistent with literature on its extent1 or the extent of the host crop55 (Supplementary Fig. 1). As a result, the geographic locations of 54 (or 5.5%) of the responses were relocated to the most appropriate Köppen–Geiger climate class within the same country. This relocation only affected the climate class assigned to each survey response.
Reported P&Ps. Each survey response pertained to one P&P occurring on one of the five crops considered, and corresponded to an individual observation of crop loss magnitude and crop loss frequency. The responses were reviewed, duplicate entries removed, and common and scientific names standardized. Diseases were named according to their preferred common name1, and the scientific or Latin name of the causal pathogen. Animal pests were named according to their preferred common and Latin names. In a few cases, the same pathogens were associated with different common disease names, because of differences in symptoms. Nematodes were listed according to Latin names, which were also used in the analyses (as common names for nematodes are not specific enough). Virus diseases were listed by common names and the associated scientific names.
Characterization of P&Ps. Some of the reported P&Ps may be considered emerging, given their expansion (geographical, or in terms of host range) or recent genetic evolution20–22. These key pests were noted in the database with specific references regarding their emerging nature (Table 1).
Losses caused by P&Ps depend on: (1) their spatial extent (characterized by their ability to disperse or persist56); and (2) the diversity of host crops in terms of their vulnerability at the landscape scale (characterized by the deployment of resistance genes and use of pesticides). Spatial extent and diversity were assessed for P&Ps from the literature and used to derive correction factors (in brackets) for yield loss estimates. These two parameters were defined on a P&P basis and were the same for a given P&P across the world. In a few cases, where ecological features or disease management varied importantly across food security hotspots, the correction factors were made specific to hotspots (Supplementary Table 2).
Dispersal and persistence are two major ecological features of P&Ps: the former enables spread to new locations, while the latter enables survival in those locations10,57–60. We derived three categories of spatial extent for pathogens with an analogy to the conceptual framework of Heesterbeek and Zadoks30 for continental pandemics: focal (0.1; that is, zero-order30 extent, for P&Ps with a strongly restricted dispersal ability/half-distance gradient parameter61 in the order of 0.01 to < 0.1 m and/or limited ability for persistence and/or a restricted host range); local (0.3; that is, first-order30 extent, for P&Ps with a short-range dispersal ability/half-distance gradient parameter61 in the order of > 0.1 to < 10 m and/or moderate-to-strong ability for persistence and/or a limited host range); and general (0.7; that is, second-order30 extent, for P&Ps with a long-range dispersal ability/half-distance gradient parameter61 in the order of > 10 m and/or strong ability for persistence and/or a wide host range).
The ability of a P&P to disperse or persist cannot alone predict actual levels of crop injury; the levels of crop injury also depend on the diversity of host crops in terms of their vulnerability at the landscape scale58. This is a reflection of two main, man-made factors: the deployment of resistance genes and the use of pesticides. We derived two diversity categories. Heterogeneous (0.5; that is, the occurrence of regular applications of pesticides that have actual effects on dynamics and injuries, or the presence of effective host plant resistances to diseases or pests that have significant effects on dynamics and injuries); and uniform (1.0; that is, no regular pesticide use, and no deployment of host plant resistance genes with significant effects of dynamics and injuries).
Contingency table analysis of survey responses. Because the fraction of reports of ‘very high’ loss magnitude was very low (2.1%), this category was merged with the ‘high loss’ magnitude in all analyses. Patterns of association between paired variables were examined through contingency tables (Supplementary Table 4). Levels of association were tested with chi-squared tests37,38,62 (Supplementary Table 4). Interpretations of associations between paired variables were based on dual frequency distributions of cases in contingency tables. Chi-squared values based on sparse frequencies (where the expected values were smaller than 5 in over one-fifth of cells in a contingency table) were not considered valid39,40,62,63. In these cases, new contingency tables were created where adjacent classes of the same variable were combined, enabling valid hypothesis testing.
The contingency tables of loss frequency with loss magnitude, crop, climate and yield did not exhibit clear patterns, and we decided to focus our multivariate analyses between loss and other variables on loss magnitude, and to exclude loss frequency (Supplementary Table 4). All contingency table analyses and chi-squared tests were performed with Systat 13 (ref. 63).
Correspondence analyses of survey responses. Correspondence analyses were performed to permit a multivariate, non-parametric analysis (Supplementary Tables 5 and 6) and visualization (Fig. 3 and Supplementary Fig. 3) of multiple associations between the following categorical variables: loss magnitude and crops, climate and yield. The nature of food security hotspots and emerging P&Ps were also included in the analyses.
Our general approach was to first conduct (multiple) correspondence analyses37–41 on a set of active variables for which strong and significant chi-squared values were found in the associated contingency tables. This corresponds to a hypothesis test with as few active variables as possible. The outcome was a series of factorial axes, which provided an acceptable two-dimensional ordering of the classes representing these active variables. We then projected a limited set of supplementary variables on the obtained factorial axes. This second step enabled the analysis of patterns of associations between active and additional variables.
Specifically, a first (simple) correspondence analysis was performed on the overall dataset, using the levels of loss magnitude and type of crop as active variables. We used this framework to project associations of food security hotspots and emerging P&Ps as supplementary variables. We then performed multiple correspondence analyses for each crop, where the level of loss magnitude, climate and crop yield quartiles were the active variables, and food security hotspots and emerging P&Ps were the supplementary variables.
Some climate categories were represented by a few records only (< 4% of the dataset) in wheat, maize, potato and soybean, and these were removed before analyses to provide robust results. We therefore removed four records on wheat (equatorial); four records on potato (equatorial); eight records on soybean (arid (1), equatorial (2), Mediterranean (1) and monsoon (4)); and one record on maize (equatorial).
Our interpretation of the correspondence analyses (Supplementary Table 5) accounted for a number of criteria37,41. First was the axis inertia, where a
NATuRE EcoLogy & EvoLuTioN | www.nature.com/natecolevol

Articles NaTure eCOlOgy & evOluTiON
large accumulated inertia (accounted for by the considered axes) implies a proportionally large representation of the information contained in the original contingency table(s). In our analyses, the first two axes were deemed to represent a satisfactory fraction of this information. Second was the inertia accounted for by each of the classes (categories) representing the modalities of a given variable. The larger the inertia of an individual class, the larger its importance, which increases with the squared distance of this class from the origin of factorial axes. Third was the proximity between two classes of the variables considered. Proximity of two classes on the graph suggests association. However, the significance of such an association is proportional to the (squared) distance to the origin of axes. All of these interpretations can be specifically tested with chi-squared tests. All analyses were performed with the R package FactoMineR64.
Global crop loss estimates per P&P. We estimated the global losses for each P&P of each crop (Fig. 2) in four steps. (1) We computed the average loss frequency × loss magnitude per country (FMc) (Table 1 and Supplementary Fig. 1). (2) We accounted for non-reporting of P&Ps in the following manner. In countries where there was at least one record pertaining to the considered crop in our database, we examined cases where the P&P was reported in the literature1, but not in the survey, to cause crop losses in that country. In these cases, an FMc value for the missing P&P × country combination was imputed from the overall mean of the FMc from countries where the P&P had been reported in the survey. (3) We computed an average FMc, weighted by the crop production (average 2010–2014) of each country35 (Table 1), which was used as an auxiliary variable65. (4) We corrected the average FMc per P&P based on the correction factors for spatial extent (focal, local and general) and landscape diversity (uniform or heterogeneous in terms of disease management, including host plant resistance and pesticide use) (Supplementary Table 2).
Global loss estimates per crop. The sum of individual crop loss estimates was computed for each crop globally. Because interactions in the yield-reducing effects of P&Ps in general lead to less-than-additive effects of yield-reducing factors3, this sum is expected to be larger than crop losses from combined P&Ps. However, current empirical and theoretical knowledge is not sufficient to generate estimates that would account for these interactions within the context of the responses in the survey. Therefore, the sum of individual crop loss estimates is the best current proxy for estimating crop loss from multiple P&Ps. This allows for comparisons across crops and across hotspots (Fig. 1); however, we caution that this estimate is expected to be an overestimate. The rationale for choosing the sum of individual crop losses is explained below.
The estimation of crop losses from combined P&Ps requires: (1) estimates of individual crop losses; (2) the patterns of crop loss profiles; and (3) an approach to estimate the quantitative interactions of P&Ps in their yield-reducing effects. The first element was provided by the survey. The second element corresponds to injury profiles3,25, which represent the collective effects of multiple injuries that occur in the course of a crop cycle. Injury profiles vary with production situations, which are not specific to a geographical region25. The responses collected from the survey do not allow identifying injury profiles according to production situations: here, crop loss patterns are described at two scales—the global scale and the hotspot scale—and both entail several production situations and injury profiles. The third element can be addressed from experimental and theoretical approaches. Interactions of injuries in their yield-reducing effects have been quantified in several crops3,25, to an extent that does not cover all crops and injuries analysed in the survey. With respect to theoretical approaches, a pure interaction model is sometimes used to derive crop losses from multiple injuries, using Padwick’s formula4,66:
= − − × … × −RYL 1 (1 RYL ) (1 RYL )n1
where RYL is the relative yield loss expressed as a proportion, and RYLi are the relative yield losses due to a series of injuries. The underlying hypotheses of this formula are: pure, multiplicative interaction; and a homogeneous distribution of injuries over the population of fields considered. The first hypothesis may be chosen as the simplest one, as no information is available to produce a more detailed hypothesis. The second hypothesis may hold when yield losses are quantified for a population of fields corresponding to a given injury profile. The survey data, and the grain of analysis chosen (global and hotspot) correspond to several injury profiles that cannot be identified; therefore, the second hypothesis is not respected.
Crop loss estimates per food security hotspot. The following steps for the global crop loss estimates were used, with some adaptations. For countries that were partly included in a given food security hotspot (Northern India for the IGP; the United States Midwest for USM&C; Northern Italy and Northern France for NWE; and South Brazil for SB&A), 2010–2014 averages for crop production for the specific area of those countries were obtained from online sources67–71 and used as weighting variables to derive crop loss estimates. In the few cases where five years of data were not available, averages were computed from the available time series. As for the computation of global crop loss estimates, in countries where a P&P was reported from the literature to cause crop loss, and where no report was received for this country in the survey, the mean global FMc derived from the survey was
used. In countries that were partly included within hotspots and for which a P&P was not reported in the area within the hotspot area but was reported in areas of the country outside the hotspot area, estimates for these areas (outside the hotspot) were used to compute the estimate of the crop losses for the area included in the hotspot. In USM&C, FMc for potato late blight was derived from NWE only. As for global estimates, the sum of individual crop loss estimates was computed for each crop and each hotspot (Fig. 1).
Limitations and caveats on methodology. A first concern in interpreting our results is the possible omission of some P&Ps. We compared responses to the survey to reports on P&Ps in the literature (Supplementary Table 2 and the Supplementary References provide a list of citations and references, in addition to the database assembled in the Centre for Agriculture and Biosciences International Crop Protection Compendium and key references cited in the main text), and did not identify any major P&Ps1,26,72–78 in the five considered crops that would have been omitted.
Another concern is the uneven geographical coverage of responses, leading to a misrepresentation of P&Ps and their impacts (over- or underestimations). However, the geographical coverage of responses (Supplementary Fig. 1) indicates that no major agricultural area in the world was overlooked, although more data from Eastern Asia (rice, maize, potato and soybean), Southeast Asia (maize), North America (potato) and Europe (maize), for example, would have been desirable. The maps of Supplementary Fig. 1 do not suggest critical imbalance in the responses. Our anticipated concern regarding very poor coverage of Sub-Saharan Africa did not materialize.
A third area of concern is our handling of the information over time and space, via modifiers for the spatial extent of P&Ps and for the diversity of crop vulnerability. Despite the large volume of literature on the spatial spread of P&Ps10,56–58,61,79, the development of unifying approaches enabling them to be addressed in their entire diversity, at the various scales where spread occurs, with a diversity of mechanisms, remains challenging. This remark also applies to the difficulty of representing the diversity of crop vulnerability with unified parameters, despite advances in landscape ecology80–82. We therefore recognize that the two parameters (that is, spatial extent and diversity of crop vulnerability), as well as the categorization that we implemented, are presented to the reader as first steps towards better and unified estimation.
Over- or underestimations from some experts constitute a fourth concern. First, the effects of large over- or underestimations by individual experts would be reduced by our weighted averaging approach. Second, this concern is addressed at least in part by the congruence of the results of the present study with extensive field surveys and experimental work in tropical and subtropical Asia on P&Ps of rice83,84, both in terms of P&P ranking and respective impacts. While we made efforts to triangulate our results against published data, in the great majority of cases, the literature does not provide loss figures for specific P&P × crop × location combinations, but rather general statements on the importance of a P&P. None of the responses we received was rejected because it did not match available evidence we could have gathered. To the best of our knowledge, there are no data that quantify the losses caused by individual P&Ps on individual crops at a global scale; therefore, there is no database that would enable us to fully cross-check the results we generated.
A fifth concern relates to the representativeness of responses given (that is, there are few responses for a number of P&Ps). Our assessment of the data is that the number of expert responses on a given P&P for a given crop (in a hotspot, or globally) is a reflection of its importance. This is because a major P&P in a major production area is likely to be reported many times; in contrast, it is very unlikely that a secondary P&P in a secondary production area will be reported many times.
Finally, we took the following steps to assess the robustness of our results at the hotspot and global scales. We considered the distribution of survey responses per crop against the harvested area and production of each crop. The survey achieved good coverage of the most important production areas, and we observed that where the production of a given crop was low the number of responses was also low and vice versa for high production. Our estimates use auxiliary information on national production per crop as a weighing factor to generate yield loss estimates. An alternative of weighing losses by numbers of responses would create a bias associated with the unavoidably uneven distributions of responses across space. Weighing responses by production domain instead provides unbiased estimates of the burden of P&Ps, expressed as crop losses. We conducted statistical evaluations of the data with univariate tests of associations followed by multivariate representations of these associations. We found similar and clear patterns of associations involving the levels of losses across food security hotspots and across crops. These similarities across different crops and different P&Ps support the robustness of our results.
Reporting Summary. Further information on experimental design is available in the Nature Research Reporting Summary linked to this article.
Data availabilityThe anonymized survey data that support the findings of this study are available from the corresponding author upon reasonable request.
NATuRE EcoLogy & EvoLuTioN | www.nature.com/natecolevol

ArticlesNaTure eCOlOgy & evOluTiON
Received: 14 May 2018; Accepted: 20 December 2018; Published: xx xx xxxx
References 1. Crop Protection Compendium, https://www.cabi.org/cpc (CABI, 2018). 2. Strange, R. & Scott, P. R. Plant disease: a threat to global food security.
Annu. Rev. Phytopathol. 43, 83–116 (2005). 3. Savary, S., Teng, P. S., Willocquet, L. & Nutter, F. W. Quantification and
modeling of crop losses: a review of purposes. Annu. Rev. Phytopathol. 44, 89–112 (2006).
4. Esker, P., Savary, S. & McRoberts, N. Crop loss analysis and global food supply: focusing now on required harvests. CAB Rev. 7, 1–14 (2012).
5. Savary, S. et al. Crop health and its global impacts on the components of food security. Food Secur. 9, 311–327 (2017).
6. The State of Food Insecurity in the World 2013. The Multiple Dimensions of Food Security (IFAD, WFP & FAO, 2013).
7. Rausher, M. D. Co-evolution and plant resistance to natural enemies. Nature 411, 857–864 (2001).
8. McDonald, B. A. & Linde, C. Pathogen population genetics, evolutionary potential, and durable resistance. Annu. Rev. Phytopathol. 40, 349–379 (2002).
9. Zhan, J., Thrall, P. H. & Burdon, J. J. Achieving sustainable plant disease management through evolutionary principles. Trends Plant Sci. 19, 570–575 (2014).
10. Zadoks, J. C. & Schein, R. D. Epidemiology and Plant Disease Management (Oxford Univ. Press, New York, 1979).
11. Browning, J. A. Relevance of knowledge about natural ecosystems to development of pest management programs for agro-ecosystems. Proc. Am. Phytopathol. Soc. 1, 191–199 (1974).
12. Way, M. J. & Heong, K. L. The role of biodiversity in the dynamics and management of insect pests of tropical irrigated rice—a review. Bull. Entomol. Res. 84, 567–587 (1994).
13. Matson, P. A., Parton, W. J., Power, A. G. & Swift, M. J. Agricultural intensification and ecosystem properties. Science 277, 504–509 (1997).
14. Vitousek, P. M., Mooney, H. A., Lubchenco, H. A. & Melillo, J. M. Human domination of Earth’s ecosystems. Science 277, 494–499 (1997).
15. Cassman, K. G. et al. in Ecosystems and Human Well-Being: Current State and Trends Vol. 1 741–789 (Island Press, Washington, DC, 2005).
16. Foley, J. A. et al. Solutions for a cultivated planet. Nature 478, 337–342 (2011).
17. Hazell, P. & Wood, S. Drivers of change in global agriculture. Phil. Trans. R. Soc. Lond. B 363, 495–515 (2008).
18. West, P. C. et al. Leverage points for improving global food security and the environment. Science 345, 325–328 (2014).
19. Zhan, J. & McDonald, B. A. Experimental measures of pathogen competition and relative fitness. Annu. Rev. Phytopathol. 51, 131–153 (2013).
20. McDonald, B. A. & Stukenbrock, E. H. Rapid emergence of pathogens in agro-ecosystems: global threats to agricultural sustainability and food security. Phil. Trans. R. Soc. Lond. B 371, 20160026 (2016).
21. Anderson, P. K. et al. Emerging infectious diseases of plants: pathogen pollution, climate change and agrotechnology drivers. Trends Ecol. Evol. 19, 535–544 (2004).
22. Paini, D. R. et al. Global threat to agriculture from invasive species. Proc. Natl Acad. Sci. USA 113, 7575–7579 (2016).
23. Bebber, D. P., Holmes, T. & Gurr, S. J. The global spread of crop pests and pathogens. Glob. Ecol. Biogeogr. 23, 1398–1407 (2014).
24. Bebber, D. P., Holmes, T., Smith, D. & Gurr, S. J. Economic and physical determinants of the global distributions of crop pests and pathogens. New Phytol. 202, 901–910 (2014).
25. Savary, S., McRoberts, N., Esker, P. D., Willocquet, L. & Teng, P. S. Production situations as drivers of crop health: evidence and implications. Plant Pathol. 66, 867–876 (2017).
26. Waller, J. M., Lenné, J. M. & Waller, S. J. Plant Pathologist’s Pocketbook (CABI, Wallingford, UK, 2002).
27. Chiarappa, L. Crop Loss Assessment Methods. FAO Manual on Evaluation and Prevention of Losses by Pests, Disease and Weeds (Commonwealth Agricultural Bureaux, Buckinghamshire, UK, 1971).
28. James, W. C. & Teng, P. S. in Advances in Applied Biology Vol. 3 (ed. Coaker, T. H.) 201–267 (Academic Press, London, 1979).
29. Teng, P. S. Crop Loss Assessment and Pest Management (APS Press, St. Paul, MN, USA, 1987).
30. Heesterbeek, J. A. P. & Zadoks, J. C. Modelling pandemics of quarantine pests and diseases: problems and perspectives. Crop. Prot. 6, 211–221 (1987).
31. Cramer, H. H. Plant Protection and World Crop Production (Bayer, Leverkusen, Germany, 1967).
32. Oerke, E. C. Crop losses to pests. J. Agric. Sci. 144, 31–43 (2006). 33. Oerke, E. C., Dehne, H. W., Schönbeck, F. & Weber, A. Crop Production and
Crop Protection: Estimated Losses in Major Food and Cash Crops (Elsevier Science, Amsterdam, 1994).
34. Savary, S., Elazegui, F. A. & Teng, P. S. Assessing the representativeness of data on yield losses due to rice diseases in tropical Asia. Plant Dis. 82, 705–709 (1998).
35. FAOSTAT (Food and Agriculture Organization of the United Nations, 2018); http://www.fao.org/faostat/en
36. Nelson, A. D. et al. Crop pests: crop-health survey aims to fill data gaps. Nature 541, 464 (2017).
37. Greenacre, M. J. Theory and Applications of Correspondence Analysis (Academic Press, London, 1984).
38. Savary, S., Madden, L. V., Zadoks, J. C. & Klein-Gebbinck, H. W. Use of categorical information and correspondence analysis in plant disease epidemiology. Adv. Bot. Res. 21, 213–240 (1995).
39. Hill, M. O. Correspondence analysis: a neglected multivariate method. Appl. Stat. 23, 340–354 (1974).
40. Lebart, L., Morineau, A. & Fénelon, J. P. Traitement des Données Statistiques. Méthodes et Programmes (Dunod, Paris, 1982).
41. Benzécri, J. P. L’Analyse des Données. Tome 2. L’Analyse des Correspondances (Dunod, Paris, 1973).
42. Breman, H. & De Wit, C. T. Rangeland productivity and exploitation in the Sahel. Science 221, 1341–1347 (1983).
43. Zadoks, J. C. in Crop Loss Assessment Methods (ed. Chiarappa, L.) 5–11 (CAB/FAO, Rome, 1981).
44. Van Velthuizen, H. et al. Mapping Biophysical Factors that Influence Agricultural Production and Rural Vulnerability (FAO, 2007).
45. Mueller, N. D. et al. Closing yield gaps through nutrient and water management. Nature 490, 254–257 (2012).
46. Haefele, S. M., Nelson, A. & Hijmans, R. J. Soil quality and constraints in global rice production. Geoderma 235–236, 250–259 (2014).
47. Godfray, H. C. J. et al. Food security: the challenge of feeding 9 billion people. Science 327, 812–818 (2010).
48. Lim, S. S. et al. A comparative risk assessment of burden of disease and injury attributable to 67 risk factors and risk factor clusters in 21 regions, 1990–2010: a systematic analysis for the Global Burden of Disease Study 2010. Lancet 380, 2224–2260 (2012).
49. International Newsletter on Plant Pathology: ISPP Newsletter 46 (11) November 2016 (ISPP, 2016); http://www.isppweb.org/newsletters/pdf/46_11.pdf
50. International Newsletter on Plant Pathology: ISPP Newsletter 46 (12) December 2016 (ISPP, 2016); http://www.isppweb.org/newsletters/pdf/46_12.pdf
51. International Newsletter on Plant Pathology: ISPP Newsletter 47 (1) January 2017 (ISPP, 2017); http://www.isppweb.org/newsletters/pdf/47_1.pdf
52. Kottek, M., Grieser, J., Beck, C., Rudolf, B. & Rubel, F. World map of the Köppen–Geiger climate classification updated. Meteorol. Z. 15, 259–263 (2006).
53. Rubel, F., Brugger, K., Haslinger, K. & Auer, I. The climate of the European Alps: shift of very high resolution Köppen–Geiger climate zones 1800–2100. Meteorol. Z. 26, 115–125 (2017).
54. Hijmans, R. Global Administrative Areas Database (GADM) Version 3.6, http://www.gadm.org (University of California Berkeley, Berkeley, CA, USA, 2018).
55. You, L. et al. Spatial Production Allocation Model (SPAM) 2005 Version 3.2, http://mapspam.info (IFPRI, Washington, DC, 2017).
56. Gilligan, C. A. & van den Bosch, F. Epidemiological models for invasion and persistence of pathogens. Annu. Rev. Phytopathol. 46, 385–418 (2008).
57. Shaw, M. W. Simulation of population expansion and spatial pattern when individual dispersal distributions do not decline exponentially with distance. Proc. Biol. Sci. 259, 243–248 (1995).
58. Jeger, M. J., Pautasso, M., Holdenrieder, O. & Shaw, M. W. Modelling disease spread and control in networks: implications for plant sciences. New Phytol. 174, 279–297 (2007).
59. Shaw, M. W. & Osborne, T. M. Geographic distribution of plant pathogens in response to climate change. Plant Pathol. 60, 31–43 (2011).
60. Lo Iacono, G., van den Bosch, F. & Gilligan, C. A. Durable resistance to crop pathogens: an epidemiological framework to predict risk under uncertainty. PLoS Comput. Biol. 9, e1002870 (2013).
61. Fitt, B. D. L., Gregory, P. H., Todd, A. D., McCartney, H. A. & Macdonald, O. C. Spore dispersal and plant disease gradients; a comparison between two empirical models. J. Phytopathol. 118, 227–242 (1987).
62. Benzécri, J. P. L’Analyse des Données. Tome 1. La Taxinomie (Dunod, Paris, 1973).
63. Wilkinson, L., Engelman, L., Corter, J. & Coward, M. in Statistics I 223–302 (Systat Software, Chicago, 2009).
64. Lê, S., Josse, J. & Husson, F. FactoMineR: an R package for multivariate analysis. J. Stat. Softw. 25, 253–258 (2008).
65. Pfeffermann, D. The use of sampling weights for survey data analysis. Stat. Methods Med. Res. 5, 239–261 (1996).
66. Padwick, G. W. Losses Caused by Plant Diseases in the Tropics Phytopathology Paper No. 1 (Commonwealth Mycological Institute, 1956).
67. Statistical Year Book India 2016 (MOSPI, 2017); http://www.mospi.gov.in/statistical-year-book-india/2016/177
NATuRE EcoLogy & EvoLuTioN | www.nature.com/natecolevol

Articles NaTure eCOlOgy & evOluTiON
68. The Soybean Processors Association of India Databank (SOPA, 2016); http://www.sopa.org/statistics
69. United States Department of Agriculture National Agricultural Statistics Service (USDA, 2017); https://www.nass.usda.gov
70. Agricultural Production Crop Statistics (Eurostat, 2017); https://ec.europa.eu/eurostat/data/database
71. Instituto Brasileiro de Geografia e Estatística (IBGE, 2016); https://downloads.ibge.gov.br/downloads_estatisticas.htm
72. Bockus, W. W., Bowden, R. L., Hunger, R. M., Murray, T. D. & Smiley, R. W. Compendium of Wheat Diseases and Pests (APS Press, St. Paul, MN, USA, 2010).
73. Wiese, M. V. Compendium of Wheat Diseases (APS Press, St. Paul, MN, USA, 1987).
74. Ou, S. H. Rice Diseases (CABI, Slough, UK, 1985). 75. Pathak, M. D. Insect Pests of Rice (IRRI, Los Baños, Phillipines, 1977). 76. White, D. G. Compendium of Corn Diseases (APS Press, St. Paul, MN,
USA, 1999). 77. Stevenson, W. R., Loria, R., Franc, G. D. & Weingartner, D. P. Compendium of
Potato Diseases (APS Press, St. Paul, MN, USA, 2001). 78. Hartman, G. L. et al. Compendium of Soybean Diseases and Pests (APS Press,
St. Paul, MN, USA, 2015). 79. Turechek, W. W. & McRoberts, N. Considerations of scale in the analysis of
spatial pattern of plant disease epidemics. Annu. Rev. Phytopathol. 51, 453–472 (2013).
80. Thies, C. & Tscharntke, T. Landscape structure and biological control in agroecosystems. Science 285, 893–895 (1999).
81. Yuen, J. & Mila, A. Landscape-scale disease risk quantification and prediction. Annu. Rev. Phytopathol. 53, 471–484 (2015).
82. Parratt, S. R., Numminen, E. & Laine, A.-L. Infectious disease dynamics in heterogeneous landscapes. Annu. Rev. Ecol. Evol. Syst. 47, 283–306 (2016).
83. Savary, S., Willocquet, L., Elazegui, F. A., Castilla, N. P. & Teng, P. S. Rice pest constraints in tropical Asia: quantification of yield losses due to rice pests in a range of production situations. Plant Dis. 84, 357–369 (2000).
84. Savary, S. et al. Rice pest constraints in tropical Asia: characterization of injury profiles in relation to production situations. Plant Dis. 84, 341–356 (2000).
AcknowledgementsThe authors are grateful to the ISPP for help in reaching out to experts for the survey and for permission to reprint the information in Supplementary Note 2. The authors thank all experts (Supplementary Table 1) who have contributed to the online survey. All interpretations of the survey information are the sole responsibility of the authors. N.M. was partly supported by USDA-NIFA project CA-D-PPA-2131-H.
Author contributionsS.S., L.W., A.N., S.J.P., P.E. and N.M. designed the survey. A.N. and S.S. implemented the online survey. A.N. retrieved and assembled the climatic, population and crop production data. S.S., L.W. and A.N. analysed the data. S.S., L.W., A.N., S.J.P., P.E. and N.M. interpreted the data and results of the analyses. S.S., A.N. and L.W. wrote the article. S.J.P., P.E. and N.M. reviewed all elements of the article.
competing interestsThe authors declare no competing interests.
Additional informationSupplementary information is available for this paper at https://doi.org/10.1038/s41559-018-0793-y.
Reprints and permissions information is available at www.nature.com/reprints.
Correspondence and requests for materials should be addressed to A.N.
Publisher’s note: Springer Nature remains neutral with regard to jurisdictional claims in published maps and institutional affiliations.
© The Author(s), under exclusive licence to Springer Nature Limited 2019
NATuRE EcoLogy & EvoLuTioN | www.nature.com/natecolevol

1
nature research | reporting summ
aryApril 2018
Corresponding author(s): A. Nelson
Reporting SummaryNature Research wishes to improve the reproducibility of the work that we publish. This form provides structure for consistency and transparency in reporting. For further information on Nature Research policies, see Authors & Referees and the Editorial Policy Checklist.
Statistical parametersWhen statistical analyses are reported, confirm that the following items are present in the relevant location (e.g. figure legend, table legend, main text, or Methods section).
n/a Confirmed
The exact sample size (n) for each experimental group/condition, given as a discrete number and unit of measurement
An indication of whether measurements were taken from distinct samples or whether the same sample was measured repeatedly
The statistical test(s) used AND whether they are one- or two-sided Only common tests should be described solely by name; describe more complex techniques in the Methods section.
A description of all covariates tested
A description of any assumptions or corrections, such as tests of normality and adjustment for multiple comparisons
A full description of the statistics including central tendency (e.g. means) or other basic estimates (e.g. regression coefficient) AND variation (e.g. standard deviation) or associated estimates of uncertainty (e.g. confidence intervals)
For null hypothesis testing, the test statistic (e.g. F, t, r) with confidence intervals, effect sizes, degrees of freedom and P value noted Give P values as exact values whenever suitable.
For Bayesian analysis, information on the choice of priors and Markov chain Monte Carlo settings
For hierarchical and complex designs, identification of the appropriate level for tests and full reporting of outcomes
Estimates of effect sizes (e.g. Cohen's d, Pearson's r), indicating how they were calculated
Clearly defined error bars State explicitly what error bars represent (e.g. SD, SE, CI)
Our web collection on statistics for biologists may be useful.
Software and codePolicy information about availability of computer code
Data collection Survey data was collected using the online survey builder provided by www.123formbuilder.com (commercial). Survey data were collated in a Google Sheet that was only accessible to the author team.
Data analysis Data cleaning was done in Microsoft Excel 2013 (commercial). Analysis was done in R v3.4 and SYSTAT 13 (commercial). All maps were made in ArcGIS 10.5 (commercial). All graphs were made in R v3.4.
For manuscripts utilizing custom algorithms or software that are central to the research but not yet described in published literature, software must be made available to editors/reviewers upon request. We strongly encourage code deposition in a community repository (e.g. GitHub). See the Nature Research guidelines for submitting code & software for further information.
DataPolicy information about availability of data
All manuscripts must include a data availability statement. This statement should provide the following information, where applicable: - Accession codes, unique identifiers, or web links for publicly available datasets - A list of figures that have associated raw data - A description of any restrictions on data availability
The anonymised data that support the findings of this study are available from the corresponding author.

2
nature research | reporting summ
aryApril 2018
Field-specific reportingPlease select the best fit for your research. If you are not sure, read the appropriate sections before making your selection.
Life sciences Behavioural & social sciences Ecological, evolutionary & environmental sciences
For a reference copy of the document with all sections, see nature.com/authors/policies/ReportingSummary-flat.pdf
Behavioural & social sciences study designAll studies must disclose on these points even when the disclosure is negative.
Study description We designed an online survey for crop health experts in order to obtain expert assessments of crop losses for five major crops across the world. We cleaned and standardized the survey responses, associated the responses with additional variables based on their geographic location and characterized each reported pathogen or pest. We used contingency tables and chi-squared tests to examine and interpret patterns of association, for example, to assess the association between loss magnitude and climate. Correspondence analyses provided graphical summaries of these associations. Crop losses were estimated globally and for eight food security hotspots, first by individual P&P and then combined.
Research sample 989 expert reports on where a pest and pathogen was reported to occur, based on information from 219 crop health experts in 67 countries.
Sampling strategy Our data come from an online, worldwide survey of crop health experts carried out between Nov 1 2016 and Jan 31 2017 and hosted at http://globalcrophealth.org. The participants were crop health experts The survey was launched by the International Society for Plant Pathology (ISPP). The invitation to participate in the survey was first sent to the ISPP mailing list (over 2,500 members registered on the ISPP mailing list were thus emailed directly). There are 63 national scientific societies affiliated to the ISPP, which allowed a large coverage over countries producing the five crops addressed in the survey. The survey was announced in the ISPP November 2016 Newsletter which was circulated to the ISPP mailing list and was further circulated to the 63 national or regional ISPP societies (over 26,000 members). This allowed a large coverage over countries producing the five crops addressed in the survey. The survey was also promoted through a number of crop health mailing lists and Nature. We took several steps to reach a large coverage of experts and generate a large number of response rate. We kept track of the total number of responses per crop × country/region combination on a weekly basis and used this to identify combinations where the response rate was lower than we would expect. We used this information to provide monthly updates in the ISPP newsletters in December 2016 and January 2017 that documented the responses so far and encouraged further responses, both in general and by specific crop × country/region combinations where further responses were desirable (based on our weekly tracking of responses). Thus all recipients of the ISPP newsletter received the survey three times over the duration of the survey. We further emailed 87 specific crop health experts in countries where at least one of the give crops was grown extensively and in countries that hosted CGIAR institutes with mandates for the five crops. 30% of the experts emailed individually provided responses to the survey.
Data collection An online questionnaire was targeted to crop health experts. The survey (http://globalcrophealth.org) was conducted for three months between Nov 1 2016 and Jan 31 2017. Data were collated by Andy Nelson in a set of Google Spreadsheets, one per crop.
Timing Nov 1 2016 and Jan 31 2017, global scope, though responses were obtained from 67 countries.
Data exclusions The survey form sometimes duplicated expert submissions. These duplicates were removed from the dataset prior to any analysis. 1142 responses were recorded. When duplicates were removed, the final dataset was 989 records. No further data were excluded.
Non-participation We cannot assess how many recipients of the ISPP newsletter declined to respond since we have no way of tracking how many of the email addresses in the mailing list are active and how many recipients would be suitable experts for the survey. Of the 87 crop health experts that we specifically targeted by email, 70% did not respond.
Randomization No experiments were conducted in this research and thus needed no randomisation was required.
Reporting for specific materials, systems and methods

3
nature research | reporting summ
aryApril 2018
Materials & experimental systemsn/a Involved in the study
Unique biological materials
Antibodies
Eukaryotic cell lines
Palaeontology
Animals and other organisms
Human research participants
Methodsn/a Involved in the study
ChIP-seq
Flow cytometry
MRI-based neuroimaging