Embed Size (px)
Citation preview

Human DevelopmentResearch Paper
2010/18The Global Financial Crisis of 2008-10:
A View from the Social SectorsSara Guerschanik Calvo
United Nations Development ProgrammeHuman Development ReportsResearch Paper
July 2010
Human DevelopmentResearch Paper
2010/18The Global Financial Crisis of 2008-10:
A View from the Social SectorsSara Guerschanik Calvo

United Nations Development Programme Human Development Reports
Research Paper 2010/18 July 2010
The Global Financial Crisis of 2008-10:
A View from the Social Sectors
Sara Guerschanik Calvo1
The author is Lecturer of International and Public Affairs, School of International and Public Affairs (SIPA), Columbia University. E-mail: [email protected]
Comments should be addressed by email to the author.
1 I am grateful to the 2010 HDR team, Guillermo Calvo and Delfin S. Go for helpful discussions; and to Maureen Lewis for kindly facilitating information on social expenditures. Pamela Reyes-Herrera provided excellent research assistance.

Abstract The impact of the US financial crisis that unfolded in 2008 has been global. It was felt in output, trade, and cross-border capital flows and transfers. Incomes have dropped and consumption patterns are changing, placing at risk the human development gains of the 1990s. At the heart of this global crisis is a credit crunch that has put financial strains on firms and individuals and has led to a large number of job losses and drops i n income f rom other sources. Having l earned the lessons from past financial cr ises, some c ountries w ere w ell pr epared and, w ith s upport f rom t he international f inancial community, lessened the impact of the crisis. Still, current estimates about the impact of the Crisis are staggering. But country experiences show that in the past there have been huge overestimates of the impact on human development indicators that may be the case again now. The high share of developing-country exports in total e xports to a dvanced countries a nd t he hi gh number of w omen—pivotal i n c hild de velopment--in developing c ountry-export s ectors, make f ocusing on na tional a nd g lobal a ctions conducive to r estore world c redit a priority for pol icymakers. High on t he action list i s r estoring c redibility in f inancial markets, making cr edit accessible to small businesses that account for a large share of employment globally, strengthening t he a bsorptive c apacity of public s pending, a nd e xpanding s ocial p rotection programs. This paper is a compilation of selected literature on the impact of financial crisis on jobs, other sources of private income and publ ic s ocial s pending and on human de velopment. T he pa per uses t he bank run and sudden stop framework of financial-crisis analysis, discusses country cases, and summarizes the lessons learned from current as well as past crises to prevent loosing sources of income.
Keywords: financial crisis; credit; jobs; human development JEL classification: E2; E5; H4; I3 The H uman D evelopment R esearch P aper ( HDRP) S eries i s a m edium for s haring recent research c ommissioned t o i nform t he g lobal H uman D evelopment R eport, which i s publ ished annually and further research in the field of human development. The HDRP Series is a quick-disseminating, informal publication whose titles could subsequently be revised for publication as articles in professional journals or chapters in books. The authors include leading academics and practitioners from around the world, as well as UNDP researchers. The findings, interpretations and conclusions a re s trictly t hose of t he authors and do not necessarily represent t he vi ews of UNDP o r Un ited N ations M ember S tates. M oreover, t he da ta m ay not be c onsistent w ith t hat presented in Human Development Reports.

1
I. Introduction Global progress in human development since the 1990s has been impressive. In health,
for example, there has been progress in maternal mortality, which dropped to around 343,000 in
2008 from around 530,000 in 1980 in the 181 countries.1 Higher incomes partially explain these
outcomes by improving the nutritional status of women and more access, physically and
financially to health care. Progress was particularly significant in Egypt, China, Ecuador, and
Bolivia. In education, the 2010 Education for All Global Monitoring Report2
The global financial crisis (the Crisis) that unfolded in 2008 has lowered incomes and has
led to changes in consumption patterns that are placing at risk those gains in human
development. The Crisis originated in the US, and its impact has been felt globally. In 2009
global output dropped 2.2 percent and the global unemployment rate increased to close to 7
percent, the equivalent to having 35 million more people out of work (Figures 1 and 2). An
increase of 50 million in the number of the extreme poor is expected.
reports increasing
numbers of children in school, reduction in gender gaps, and increasing numbers of children
completing basic education (although the quality of education remains an issue).
3
Financial crises are not new to the global economy (Figure 3), and in some regions they
It is too soon to report on
the impact on education and health, but, based on the experience of past crises, in some
developing countries it is expected to be far from negligible, putting at risk the human
development gains of the last decade.
1 Hogan et al. (2010). 2 UNESCO (2010). 3 World Bank (2010).

2
have been recurrent.4 In developing countries the combination of banking and currency crisis
(the so-called twin crises) has inevitably led to output collapses.5 But even in successful
attempts to weather a financial crisis, output fell and fiscal adjustment, typically via public
expenditures, in some cases led to a fall in social expenditures. The impact of financial crises on
human development indicators (HDI) has been extensively reported.6
The Great Depression and financial crisis experiences in emerging markets provided
lessons that have guided world policymakers in addressing the Crisis. The ultimate goal of this
paper is to discuss the Crisis from the perspective of human development, to consider the lessons
learned, and to assess the current policy challenges. After this introduction, Section II discusses
channels of transmission; Section III addresses the development and impact of the Crisis; Section
IV evaluates prospects; and Section V looks at lessons and policy challenges.
Financial crises increase
poverty (Figure 4). However, the impact on health and education indicators has not been uniform
across countries. While in recent years there has been progress in protecting social expenditures
from volatility and in establishing and improving the effectiveness of social protection programs,
much remains to be done to ensure available resources are fully and efficiently disbursed and
used.
4 Reinhart and Rogoff (2009) review episodes of external defaults, inflation crises, currency crises, and banking crises in developed and developing countries since the 1800s. 5 Kaminsky and Reinhart (1999). 6 e.g., World Bank (2000), Ferreira and Schady (2008).

3
Figure 1. Real GDP growth Figure 2: World unemployment rates (%) (%, quarter over quarter annualized)
Source: IMF, World Economic Outlook Update, January 2010 Source: ILO, Global Employment Trends, January 2010
Figure 3. Percent of countries with at least one episode of financial crisis
Source: Reinhart and Rogoff (2009)
Figure 4: Poverty Headcount Before and After a Financial Crisis
Source: Conceição,, Zhang, and Yanchun, 2009. Note: The year of crisis is in the parenthesis.
Table 1. Selected Crisis Episodes and Health Development Indicators
Crisis Episode Impact on Infant Mortality (IMR) and Malnutrition
Peru, 1988-1992 IMR increased 2.5 percentage points for children born during the crisis
Mexico 1994-1995 Mortality from anemia increased from 6.3 to 7.9 /100000 in 1993 and 1995, respectively for children under age 1.
Indonesia, 1997-98 IMR increased 3.5 percentage points in rural and urban areas.
Cameroon, 1990s Malnutrition for children under three years increased from 16 (1991) to 23 percent (1998)
Source: Lustig (2010); World Bank (2000).
-10
-8
-6
-4
-2
0
2
4
6
8
10
12
2006 2007 2008 2009 2010 2011 2012
Emerging economies
World
Advanced economies
5.6
5.7
5.8
5.9
6
6.1
6.2
6.3
6.4
6.5
6.6
6.7
2004 2005 2006 2007 2008 2009 2010
0%
20%
40%
60%
80%
100%
120%
External default Currency crash Inflation crisis Banking CrisisLow income Middle income, low
0
10
20
30
40
50
60
Before crisis Years of crisis

4
II. Financial Crises and Human Development Outcomes: What have we Learned? The term financial crisis has been broadly used to describe situations in which financial
institutions or assets suddenly lose their value and national output drops significantly. A
characteristic of financial crises is a sudden change of investor sentiment with regard to the
riskiness of investments, which leads to a sudden withdrawal of funds from financial institutions.
This phenomenon, known as a “bank run” or “bank panic,” in turn leads to a drop in loanable
funds and credit to the private sector. Consequently, output collapses and private and public
incomes also drop, leading to changes in spending and consumption patterns. Poverty increased
in past crises. The direct impact on other aspects of human development is less clear. Financial
crisis can be particularly harmful to those least equipped to manage it, i.e., the poor. In terms of
distributional outcomes, the evidence on a country-by-country level provides ambiguous results,
largely due to measurement shortcomings. However, crisis-resolution strategies tend to be
inequitable due to the unequal influences of poorly-managed by institutions.7
The number of countries which have had recurrent banking crises in a region has been
high: 35 percent in Latin America; 13 percent in Sub-Saharan Africa; 11 percent in combined
Eastern Europe and Central Asia; and 8 percent in East Asia and the Pacific.
8
7 World Bank (2006).
There is no
definitive explanation as to why Latin America is the region with the highest share of countries
with recurrent crises. Most studies attempt to associate this outcome with the poor growth
performance of the region and this in turn with high growth volatility since the early 1800s
8 IDB (2005) for the period 1974-2003. There were no countries with recurrent financial crises the Middle East and North Africa and in high income countries. See also Reinhart and Rogoff (2009).

5
fueled.9 Although in this association causality remains uncertain, a recent study on Argentina10
In this section we discussed channels of transmission after a brief discussion on the
mechanics of financial crises.
during 1971-2001 supports the endogeneity of growth volatility: external shocks but more
importantly inconsistent domestic policies explain the recurrent crises there.
II.1. The mechanics of financial crises.
Sudden credit scarcity and the absence of a lender of last resort have characterized recent
(and past) financial crises. In both advanced and developing countries economic booms have
typically preceded a financial crisis. In developing countries these have been driven by external
factors such as a surge in capital inflows and/or commodity prices and fast growth in the world’s
largest economies. During booms more bank financing at lower cost becomes available, relative
prices change favoring the non-tradable sectors (e.g., real estate and commerce sectors), and
higher loan collaterals lead to faster bank lending. As a result, aggregate demand shoots up, and
GDP growth accelerates.11
9It is well known that since colonial times, in Latin America (a) economic inequality has been at the heart of many of the region’s political and social problems (particularly in endowment-rich economies); (b) the region has had many rapid inflation and default episodes (some involving creditor military interventions, e.g., Nicaragua and Venezuela); and (c) the region remains highly dependent on external factors, e.g., commodity prices, in other words, there has been little export diversification. Rodriguez (2001); Frieden, Pator Jr., and Tomz (2000); Edwards (2009); Engerman and Sokoloff (2002). Other sources of recurrent crises include higher terms of trade, real exchange rate and economic policy volatility (Sahay and Goyal (2006)), and lower regional productivity (IDB (2010A)) in relation to emerging Asian and advanced countries.
Current account balances deteriorate reflecting higher public and
private sector external indebtedness, and international reserves can increase consistent with a
10 Kaminsky, Mati, and Choueir (2010). 11 The credit-growth causality has been discussed in economist circles extensively. Today there seems to be consensus that credit explains growth as shown in Mendoza and Terrones (2008).

6
government strategy to accumulate them to address balance of payment troubles and/or to
maintain a depreciated currency and to maintain competitiveness.
But not all is good news during bonanzas. Reliance on short-term and foreign-currency
borrowing makes emerging markets vulnerable to bank runs as significant liquid liabilities end
up backed by illiquid assets and perceptions of real exchange rate misalignment mount (Chart
1).12
Chart 1. Boom-bust cycle in open economies
In low-income countries with limited formal financial intermediation and exposed to
temporary commodity price shocks, e.g., low-income small African economies, vulnerability to
12 Calvo (2009). Schularik and Taylor (2009) also show that over the past 140 years episodes of financial instability were often the result of "credit booms gone wrong." See also Reinhart and Rogoff (2009). Reinhart and Reinhart (2006) catalog capital inflow bonanzas in both advanced and emerging markets during 1980-2007 for 181 countries and 1960-2007 for a subset of 66 economies from all regions.
Fiscal adjustment; income drops; poverty increase
Output collapse; fire sales; lower tax revenue; higher foreign debt service; banking and public sector distress. Unsustainable levels of public debt
Bank run; sudden credit crunch; drop in aggregate demand; drop in money demand; depreciation of the currency
Negative external shock
Aggregate demand boom; faster growth accompanied by poverty reduction.
Deposit/Credit boom. Stronger currency. Higher private and public foreign currency indebtedness.
Positive external shock (capital inflow surge and/or commodity price surge)

7
capital outflows (i.e., capital flight) also exists. This typically arises from the government’s
inability to save a temporary windfall and to resort to money creation to close fiscal imbalances
in the face of a sudden negative shock.13 Not surprisingly, bonanzas have been associated with
a higher probability of depositor runs on banks, debt defaults, and inflation.14
In this context, as the economic literature suggests, even apparently small factors can lead
to self-fulfilling prophecies and trigger a run on vulnerable financial institutions.
15
Emerging
market examples of the 1990s include Mexico’s in 1994, Thailand’s in 1997, and Russia’s in
1998. As credit dries up, a contraction in expenditure accompanied by a real devaluation takes
place, closing the deficit of the current account of the balance of payments. But as collateral
values drop, further credit contraction follows, lowering GDP growth and generating a deep
recession. A bank run threatens the sustainability of the financial sector payment system. Hence,
once the banking crisis has erupted and with no access to international capital markets, central
bank liquidity injections could deepen the crisis further, leaving the economy insolvent and its
financial and real sectors collapsed. Argentina’s 2001 crisis makes a good example of this
scenario (Box 1).
13 Collier, Paul, Anke Hoeffler and Catherine Patillo (2004) and Collier (2007). 14 Reinhart and Reinhart (2006). 15 Burnside, Eichenbaum and Rebelo (2008) for a review of currency crisis literature.

8
Another common feature of recent financial crises is regional and global contagion,
reflecting increased financial and commercial integration. In virtually all the crisis episodes of
the 1990s, there were incipient or full-fledged bank runs in economies other than in the source of
the crisis. In Bolivia, for example, Argentina’s financial crisis combined with domestic political
instability led to capital outflows of about 6 percent of GDP in 2001-2002.16 Also, contagion
could be instantaneous or come with a lag, e.g., Central America in the mid-1990s.17
At the heart of these systemic effects of financial crisis is the absence of a lender of last
resort ready to inject liquidity when an incipient bank run occurs. In the cases of Russia and
Argentina, no lender of last resort came forward. In the case of Mexico, the $50 billion
Emergency Loan from the US contributed to preventing the breakdown of the financial sector
system. Emerging market experiences with boom-bust cycles--the so-called sudden stop
16 Calvo (2006). 17 Calvo and Reinhart (1996).
Box 1. Sudden stop, financial crisis and poverty increase in Argentina 2001/02. Like all emerging markets, during the 1990s Argentina enjoyed large capital inflows and fast growth. Throughout the 1990s, the macroeconomic framework compared favorably with countries renowned for their fiscal behavior, e.g., Euro countries. Contagion from Mexico’s crisis in 1994/5 brought fast growth to halt, but the economy recovered quickly and with a sounder financial sector. As the Russian crisis of 1998 froze international capital markets, risk premiums in emerging markets rose, but they rose far more in Argentina reflecting expectations of devaluation of the currency and the concomitant deterioration of public finances. Growth decelerated. To promote faster growth, in March, 2001, the central bank injected liquidity into the economy leading to deposit withdrawals and international reserve losses. By December 2001 bank deposits had dropped 18 percent; international reserves had fallen to less than half their January level; and the spread on government bonds had jumped almost five times to 4435 points. To prevent a collapse in the financial sector’s payment system, bank customers were not allowed to withdraw deposits (the so called corralito measure). As foreign reserves continued to plummet, the peso was devalued, bringing balance sheet problems in firms and individuals indebted in dollars but receiving income in pesos. A weaker peso together with higher interest rates and slower growth rendered the public debt unsustainable. Political constraints to adjust the fiscal accounts led the government to default on its debt. Thus, at the heart of Argentina’s crisis was the impact of a sudden cut in capital flows in a context of dollar debts that reached unsustainable levels also as a result of the large devaluation needed to close the current account (Calvo, Izquierdo, and Talvi, 2004). As a result of the crisis, output and investment dropped 18.4 percent and 56 percent, respectively. Unemployment increased from 11.7 percent to 15.9 percent during 2001/2. Poverty as traditionally measured increased from 38 percent in 2001 to 53 percent in late 2002.

9
episodes--have been costly in terms of investment drops and government rescue packages (Table
2).18
Table 2. Output, Investment Contraction, and Rescue Packages
in Developing Countries
Source: Calvo and Reinhart (2000). NA: not available. In view of these experiences, the economic profession remains divided regarding the
benefit of openness in developing countries. 19 Poorly-managed economic bonanzas in
economies with poor regulatory frameworks and supervision lead to vulnerability to costly
financial crisis, as discussed in Section II.1. Empirical studies, however, provide ambiguous
results about the impact of financial integration in developing countries. Could more (as
opposed to less) regulation promote sustainable growth in financially integrated economies?
Some policymakers (e.g., Brazil’s) and more recently the IMF believe that capital controls on
inflows could help, even though empirical studies provide ambiguous conclusions regarding their
potential effectiveness. 20
18 Analyzing the behavior of 32 developed and developing countries, Calvo, Izquierdo and Mejia (2004) found that the probability of a sudden stop episode is higher the more closed to international trade and the higher foreign currency debts are. Episodes of growth acceleration followed by growth deceleration have also been discussed in Hausmann, Rodriguez and Wagner (2006).
Capital controls on inflows do not prevent capital outflows of
19 Box 3.5 in World Bank (2010). 20 Ostry et al. (2010).
Output % Contraction
Investment % Contraction
Rescue Package % of GDP
35 Output collapses in developing countries
Mean: -9.9 Mean: 42.2 NA
Indonesia, 1997 -13 -39 18.1 Korea, 1997 -7 -31 11.7 Mexico, 1995 -6 -35 13.5 Morocco, 1994 -7 -25 NA Russia, 1998 -5 -44 5.8 Thailand 1997 -12 -62 12.1
10
resources already in the financial system.21 In many countries bonanzas have yielded improved
HDI--albeit temporarily--which suggests that the issue is not whether to integrate or not but
when and how to do so (including actions to protect expected human development gains). For
example, countries that trade less are more prone to sudden stops and currency crisis: closing the
current account will require higher real exchange depreciation and, accordingly, self-fulfilling
expectations of it may lead to a bank run in economies that trade little.22 This conclusion
provides support for trade openness and is consistent with the conclusions that bubbles may be
socially efficient once the costs and benefits of financial deregulation that spurs temporarily high
growth that then collapse are weighed.23 While there is no consensus regarding appropriate
financial sector regulations for advanced and developing countries, there is agreement on the
need to introduce reforms to regulate and supervise financial systems better in order to improve
welfare across societies and prevent financial crises.24
II.2. Channels of Transmission
Financial crises across the globe during the last decade have provided significant
information on the impact on human development. The outcomes on health and education have
not been uniformed across countries. In rich economies no deterioration has been identified in
either indicator. Well-functioning credit markets, well-established social protection programs,
and a low opportunity-cost of attending school explain this outcome. In developing countries
health indicators unambiguously deteriorates but only in low-income countries school enrollment
deteriorates unambiguously. School enrollment has increased in places where families chose to
21 Calvo (2010). 22 Calvo, Izquierdo and Mejia (2004) and Cavallo and Frankel (2004), respectively. 23 Calvo and Loo-Kung (2009). 24 Griffith-Jones and Ocampo (2009).

11
send their children to school because, as indicated, the opportunity-cost of doing so is low and/or
the school offers social services such as provision of food. The former was the situation, for
example, in Peru in the late 1990s. In contrast, annual growth in gross primary enrollment fell
from 0.44 percent in 1994 to 0.09 percent in 1995 in Mexico and from 2.2 percent in 1993 to 0.8
percent in 1996 in Argentina.25
HDI improve during booms and deteriorate during downturns.
26 The increased allocation
of private and public income to health and education appears to explain the improvement. But
there is heterogeneity of impact across the income level of countries, and human development
losses during growth deceleration periods are higher than gains during booms. Furthermore,
human development losses during downturns could have long-lasting effects in places where
little progress has been achieved during booms, for example, in poor economies in Sub-Saharan
Africa.27
After a short discussion on the constraints to a deeper understanding of the financial
crisis-human development links, this section elaborates on the financial crisis-income link,
highlighting the impact of financial crisis on jobs and the key role of small and medium
enterprises as providers of a large number of jobs.
This could be quite serious in economies with recurrent output collapses and makes
urgent the better understanding of the channels of transmission to design and implement social
protection programs to protect the poor from economic shocks effectively.
25 Ferreira and Schady (2008). 26 Conceição and Kim (2009) using a panel data with 200 countries for 1980-2006. 27 Arbache, Sala and Page (2002).

12
2.1. Measurement shortcomings While these studies provide useful information, forecasting impact and extracting policy
recommendations from them requires more country-specific knowledge. Unfortunately,
household surveys—the leading instrument used in human development research—still fall short
of providing an accurate picture of household
behavior when economic shocks hit.28 For
example, in the face of an economic shock,
different families may decide to live under the
same roof to reduce each one’s household
spending. Also, non-uniform economy-wide
factors such as price stickiness and inflexible
real wages may lead to a poor identification of
the determinants of human development
outcomes.29 The case of poverty in Indonesia in the late 1990s discussed in Box 2 illustrates
these measurement shortcomings. Furthermore, expenditure measures of well-being (used to
calculate poverty) do not integrate the value of public services30
Similarly, many studies based on cross-country regressions present methodological
shortcomings that make regression analysis of limited use, for example, to identify causality.
This type of analysis captures neither the efficiency effects nor the temporariness of benefits.
Implicit in growth regressions is the assumption that the same model of growth is applied to all
countries, and this may not be right. Linear growth regressions [typically used in growth
(Kanbur, 2010).
28 De Janvry and Sadoulet (2008) and Ravallion (2009). 29 Behrman (2009). 30 Kanbur (2010).
Box 2. Overstated poverty impact. Indonesia in the late 1990s. Output drop, devaluation of the currency, higher food prices, and annual inflation all led to the expectation of a huge increase in poverty in Indonesia as a consequence of the crisis in 1997. Poverty did increase 50 percent, but the prediction had been for a fivefold increase. Thomas and Frankenberg (2007) attribute this poor forecast to three reasons: 1. per capita expenditures—typically used to measure poverty—are hardly indicative of changes in well-being because household size and composition may change in response to the crisis; 2. households may just prefer to delay spending on semidurables, thus reducing expenditure without affecting well-being; and 3. potential poor estimation of inflation rates which tend to be volatile in the aftermath of a financial crisis.

13
research] “imply that the effect of increasing the value of the independent variable would be the
same for all countries, regardless of the initial value of that variable or other variable.”31
Therefore, the same policy, e.g., a 10 percent tax increase, may not have the same effect in a
poor country as in a rich country or in a country with weak institutions as in a country with
strong institutions (more on this below). Supplementing regression-based studies with more
country-specific information will provide a better picture of the relationship between growth and
trade integration.32
Thus, while there is better understanding of the impact on household income
and non-income resources, much remains to be learned about the channels of transmission from
income to human development.
2.2. The financial crisis-income-consumption link Lower consumption of quality food, medicine and public social services as a
consequence of lower private and public incomes have been associated with deterioration of
human development.33
Recalling the financial crises in East Asia in 1997-98, in Russia in 1998,
and in Latin America since the early 1990s, this section illustrates the impact of these events on
sources of income including labor markets, public services, and remittances. Discussing
engagement with illegal activities and the impact of a drop in the value of financial assets is
beyond the scope of this paper.
31 Rodriguez (2008). 32 Applications of the Growth Diagnostic Approach in growth analysis (Hausmann, Rodrik and Velasco (2005)) have brought to the forefront the discussion on the utility of cross-country regressions (Rodrik (2005) and Rodriguez (2008)). 33 World Bank (2000) and 2006).
14
The labor market The labor market is an important channel of transmission of financial crises. As output
collapses, firms close or reduce production leading to higher unemployment. The speed of
adjustment of the real sector depends on its production structure (e.g., a large and diversified
export sector),34
The situation could be particularly critical for workers in micro- and small and medium
firms (SMEs) in both advanced and developing countries. In the United States, SMEs account
for about 50 percent of total employment and account for about 60 percent of gross job
creation.
flexible labor costs, access to credit, and firm closure regulations (e.g.,
bankruptcy laws and the US’s Chapter 11-type of regulations) that provide resilience. In the
absence of these, surviving firms have typically resorted to strategies to reduce costs by, for
example, moving to the informal sector. Laid off workers migrate to sectors and/or countries
with better employment prospects.
35 In developing countries SMEs account for an average of 65 percent of total
employment.36 In Bolivia, for example, microfirms receiving microcredit were affected by the
economic shocks of 2001/02.37
34 Hausmann, Rodriguez and Wagner (2008) and Calvo, Talvi and Mejia (2008).
In Chile the impact of the 1997/8 East Asia and Russian crises
led many small firms to use non-bank financing, e.g., retained earnings, and thus to sacrifice
investment, as large firms—unable to access external financing and perceived more
creditworthy—crowded out domestic bank financing for SMEs. In Chile, employment in SMEs
and microfirms accounts for about 75 percent of total employment. Absence of credit, inflexible
wages, and high firing costs led many SMEs to reduce the number of employees and hence to
35 Bernanke (2010). 36 Beck, Dermirgüç-Kunt and Martinez Peria (2010). 37 Gonzalez-Vega and Rodriguez-Mesa, 2002.

15
become microenterprises or to file for bankruptcy. In the late 1990s unemployment increased
from 6 percent to 11 percent. Going back to pre-crisis unemployment rates took time.38 In Latin
American economies labor and credit inflexibilities have been identified as constraints to fast job
recovery.39
Displacement of workers to informal activities has featured in past crises. Indeed, in
Latin America recurrent financial crises have gradually led to increases in informality. For
example, urban salaried informality increased in Argentina from 1992 to 2003 by around 9
percentage points and by 17 percentage points in Greater Buenos Aires from 1980-2003.
40 These
workers are typically not covered by social protection. In East Asia displacement of workers
took the form of migration to the agriculture sector. About 30 to 40 percent of urban workers
moved to the agriculture sector.41
In Korea, unemployment increased from 2.6 to 6.8 percent in
1998 but achieved pre-crisis rates quickly as currency devaluations reduced the real wage. In
Indonesia fewer working hours helped to prevent further increases in unemployment. So did
sustained availability of microcredit.
Public sector social expenditures Public sector social expenditures have suffered during past crises in several developing
countries. The need to close the fiscal deficit in the face of lower tax revenues and increased
38 IDB (2006) and World Bank (2005). 39 Caballero, Engel and Micco (2004). 40 Perry et al. (2007). 41 World Bank (2009a).

16
public debt service has typically led to cuts in social expenditures.42 For example, one common
practice has been reducing the investment portion of government education and health budgets.
In education public investment dropped 50 percent during 1987-1990 in Peru. Typically, cuts in
social investment in developing countries have been the result of social pressures to sustain the
salary portion of these budgets.43 Teacher salaries can be counted as investment in human
capital; however, the quality of teaching in many developing countries is being questioned. In
Latin America salaries in education have shown the most anticyclical behavior reflecting the
strong presence of teacher unions.44
World public financing of health by governments and development assistance sources (in
constant US dollars) increased by nearly 100 percent from 1995 to 2006, as shown in Figures 5
and 6 using IMF data (consistent with WHO data).
On the other hand, attempts to better allocate education
expenditures biased toward tertiary education and the rich have proved virtually impossible. In
this region the volatility of public expenditures has been associated with macroeconomic
volatility and the need for recurrent episodes of fiscal adjustments (CAF, 2008).
45
42 Kaminsky, Reinhart and Vègh (2004) for emerging markets during 1965-2003. It has not been the case for OECD countries. CAF (2008) and Ravallion (2008) for the prociclicality of social expenditures.
Domestic resources have been larger than
development assistance. Aggregate data do not tell the whole story, however. In many
economies health public expenditures have been pro-cyclical. In Thailand public investment in
health fell 30 percent from 1995 to 99. However, breaking with past practices, Argentina
effectively prioritized health spending despite the fiscal adjustment that the crisis of 2001
43 World Bank (2009b). 44 IDB (2009); World Bank (2004) 45 The authors, although confident on the study result, acknowledge incomplete data sources in some countries.

17
required.46 Nevertheless, health outcomes suffered, partly due to the sudden increase in the cost
of imported inputs, e.g., drugs, as a result of the large devaluation. Evidence on donor responses
in recent past crises (i.e., without the involvement of advanced countries) remains mixed (Lewis
and Verhoeven, 2010). In crisis episodes involving advanced countries, aid flows have been
positively associated with the behavior of growth in advanced countries from 1997 to 2007).47
While sustained social expenditure is necessary, it is not sufficient to ensure good
outcomes. Efficient spending is also necessary. To achieve this several social programs have
been established in developing countries, some more effective than others. The common features
of these programs are “accountability between policymakers, providers and citizens” (World
Bank 2003) and these programs’ ability to address short-term objectives while contributing to the
achievement of long-term goals. Examples include Bangladesh’s Food-for Education, Brazil’s
Bolsa Escola, and Mexico’s Progresa. In fact, the city of New York is considering establishing
its own Progresa. These so-called cash (or food) transfer programs have been a source of income
(and non-income services) for the poor, somewhat compensating for their inability to procure
credit to smooth out consumption during the bad times.
46 World Bank (2009b). 47 Dang, Knack and Rogers (2009) cited in Lewis and Verhoeven (2010).
Figure 5. Government Health Expenditures Figure 6. Development Assistance
Source: Reproduced from Lewis and Verhoeven (2010). Data: Lu et al. (2010).

18
Remittances Remittances are an
important source of income and
hence of poverty reduction.48 The
phenomenal global increase in
worker remittances since 2004
was associated with the bonanza
enjoyed by advanced economies
and commodity exporters.49
For example, fast growth in Russia’s construction sector was an
important source of remittances in some CIS economies, reaching between 50 and 30 percent of
GDP (Figure 7). Remittances have been the driving force of GDP and tax revenue growth in
these economies. Slower global and regional growth associated with the Crisis has lowered
demand for migrant labor, in particular for hard-hit sectors such as construction. For example,
formal remittances to Tajikistan fell 36 percent year-on-year in the first five months of 2009.
III. The Crisis: Causes and Impact The Crisis has increased the number of unemployed people by 34 million.50
Recovery has
started, and 2010 growth prospects for advanced economies and the developing world are
generally good (with some exceptions). However, recovery is expected to be slow, particularly
in labor markets. This section primarily discusses impact on incomes. It starts with a discussion
of the sources of the Crisis and its impact on output.
48 Cervantes-Godoy and Dewbre (2010). 49 E.g. UNDP (2009a). 50 ILO (2010).
Figure 7. Remittances in selected countries, % of GDP, 2008
Source: World Bank (2009c)
0 20 40 60
Tajikistan
Moldova
Lesotho
Nepal
19
III.1 The root sources of the crisis and official responses Consensus has gradually been reached regarding the root sources of the crisis: 51
In a context of low lending standards, i.e., poor supervision and regulatory framework,
long-term projects such as real estate investment were financed with short-term deposits that
could be withdrawn at short notice, making financial institutions vulnerable to bank runs and
thus laying the foundations for the Crisis and for its spread to world capital markets. In this
regard the Crisis fits within the emerging-market type of financial crises.
A
combination of large capital inflows, low interest in the US, and new short-term maturity
instruments in the US banking industry that made cheap credit available. Capital inflows surged
as investors felt that the US was a safer place to invest. Emerging market governments were
significantly represented among these investors. They had accumulated huge international
reserves during the commodity boom and capital inflow surge to protect their financial systems
from sudden stops and to attempt to weaken appreciating pressures on the real exchange rate.
They also feared further dollar devaluation as a result of lower interest rates in the US.
52
Accordingly, as discussed in Section I, it was hard to identify what triggered the Crisis.
Increasing mortgage defaults since early-2007 led a large drop in the stock market capitalization
The Crisis started in a
segment of and quickly spread to the whole mortgage market, eventually infecting financial
institutions and threatening a major economic shock. The fast change of investor sentiment in
mid-2008 is reflected in the Standard & Poor’s Chicago Board Options Exchange (CBOE)
Volaility Index—a key barometer of investor sentiment and market volatility based on
information conveyed by S&P 500 stock index option prices (Figure 8).
51 E.g., Burnemeister (2008); Calvo (2009a). 52 Calvo (2009b). Calvo (2009c) points to the sudden stop in the flow of credit (as opposed to a sudden stop in capital inflows) as domestic financial institutions were reluctant to lend.

20
of major banks and a cessation of inter-money markets lending. Meanwhile, as off-balance-sheet
maturity mismatches began to surface and no credit was available, many hedge funds suffered
large losses, triggering margin calls and fire sales across the globe. In September 2008 the news
That Lehman Brothers and others were not going to be rescued by the government led to deposit
withdrawals globally. The role of lender of last resort, adopted by advanced governments a
month later, stopped the bank runs. Nevertheless, world credit decelerated (Figure 9) and global
output contracted by 2.2 percent in 2009.
The US mortgage crisis quickly spread around the world. As credit dried up, global
output, commodity prices, global trade, and remittances dropped. Financial contagion has been
Figure 8. CBOE Volatility Index, 2005:1-January 2010:1
0.00
10.00
20.00
30.00
40.00
50.00
60.00
70.00
Jan-05 Jul-05 Jan-06 Jul-06 Jan-07 Jul-07 Jan-08 Jul-08 Jan-09 Jul-09 Jan-10
CBOE Volatility Index (VIX)
Source: Chicago Board Options Exchange Figure 9. Total Credit Growth, %
Source: IMF (2009)
-5
0
5
10
15
20
25
30
2000 2002 2004 2006 2008 2010 2012
Advanced economies World Emerging and developing economies
-60
-40
-20
0
20
40
60
80
2000 2002 2004 2006 2008 2010 2012
Central and eastern europe Middle east Developing asia
Africa Western hemisphere

21
attributed to the risky liability structure of banks, which highlights the need to address related
regulatory issues and financial openness.53 The impact of the Crisis on countries with lower
global financial ties, e.g., low-income countries, was felt through lower remittances from
workers working abroad and through lower demand for their exports by advanced economies. A
recent study argues that more trade diversification could have protected countries better arguing
that “the possibility of international risk sharing through insurance schemes implicit in joint
ventures, international lending, production diversification, and formal insurance contracts is
greater in an open economy.“ 54 However, the benefits of export diversification in a global credit
crisis like the Crisis are likely to be limited. It is worth highlighting that those economies with a
higher share of food and other commodities (as opposed to a higher share of manufacturing) in
total exports have showed to be more resilient to growth decelerations in a crisis context,
highlighting the key role of credit in sustaining production.55
The implicit assumption here is
that the manufacturing sector is more credit intensive than the commodity sectors.
Official responses. The recognition of the central role of credit in the propagation of a financial crisis to the
real sector and the lessons of the Great Depression prompted governments and the international
financial community to intervene in the form of liquidity injections to prevent a credit crunch
and output collapse. The conventional view regarding the duration of the Great Depression is
that policymakers allowed credit to shrink, leading to the collapse of the banking system and a
damaging and protracted recession. Likewise, the slow growth of Japan of the 1990s has been
53 Raddatz (2010). 54 Haddad, Lim and Saborowski (2010). 55 Berkmen, Gelos, Rennback and Walsh (2010).

22
attributed to unresolved banking and corporate sector fragilities that surfaced when house and
equity prices collapsed. In emerging markets, the East Asian and Russian crises in the late 1990s
as well as Argentina’s in 2001 provided important lessons, preparing policymakers there and in
advanced countries to manage the Crisis better. While the bonanza that preceded the Crisis had
something to do with this, it also allowed many emerging market governments (e.g., East Asian
countries and Chile) to be prepared for a potential financial crisis originating at home or abroad.
Thus, the first line of attack to deal with the Crisis around the world was to stop bank
runs. This was achieved by a combination of liquidity injections and an increase in bank deposit
guarantees. Other actions aimed at restoring the credit channel included purchase of assets and
lending by national treasuries. Through different mechanisms liquidity was injected into the
private sector, reducing uncertainty and systemic risk in financial markets and allowing
vulnerable firms to continue operating while accessing schemes (e.g., Chapter 11 in the US) to
prevent widespread bankruptcies. At the international level the US, as lender of last resort, made
liquidity available to selected countries (e.g., Brazil, Korea, Mexico, and Singapore), also aiming
to prevent major real sector disruptions. Likewise, in 2008 Japan provided liquidity swaps to
Indonesia and India. In parallel the IMF launched a short-term liquidity facility (SLF). In April
2009 the G-20 increased IMF resources, leading to a new IMF facility, the Flexible Credit Line
(FCL) to assist countries with sound policies facing liquidity constraints unconditionally and at
longer maturities. In developing countries public banks became the channels for allocating
public resources to both public enterprises and the private sector.

23
In parallel fiscal stimulus packages were implemented in both advanced and developing
countries.56
However, the announced and the delivered stimuli have been different in different
places. For example, in Korea only half the planned stimulus was delivered, whereas in
Singapore it was fully delivered.
Fiscal stimuli took several forms, including tax cuts targeted to small and medium
enterprises (e.g., Brazil, China, Mexico, India, and Japan) and increased public spending, largely
on labor-intensive infrastructure projects (e.g., the US and Germany and Argentina, Chile, China,
Mexico, and Pakistan) but also in some cases to bring forward planned expenditures (e.g.,
China). In the US, for example, infrastructure spending took the form of “greening” or “climate
friendly” efforts. Economies with fiscal space, mostly middle-income countries, targeted
spending to the social sectors (e.g., Chile).
57 One of the cited causes of the shortfall has been
implementation bottleneck. Although difficult to measure,58 stimulus packages associated with
the Crisis so far have been much smaller than rescue packages in emerging markets in the late
1990s (Tables 2 and 4). A recent study indicates that the US stimulus package reached 6 per cent
of and China’s at 13 per cent of 2008 GDP, which make these closer to past rescue packages.59
56 Paci, Ravenga, and Rijkers (2009).
All the 35 fiscal packages reviewed in this study have a social protection component amounting
to about 25 percent of 2008 global GDP. South Africa (56 percent), Singapore (52 percent),
Taiwan (47 percent), and Finland (43 percent) have the largest allocations for social protection.
In Peru, Mexico, Israel, Chile, and Turkey this allocation amounted to an average of around 4
57 The World Bank has produced several reports describing the impact of the Crisis regionally, e.g., (2009d) and (2009e). 58 Reinhart and Rogoff (2009). 59 Zhang, Thelen and Rao (2010).

24
percent, perhaps consistent with the limited impact the Crisis had on these countries and/or the
amount of resources contingently allocated before the Crisis hit.
Preliminary data suggest that stimulus packages have been effective. The March 2010
data on employment in the US indicate that unemployment continues increasing but at a slower
pace and that some employment recovery has taken place.60
60 Bureau of Labor Statistics (2010).
An important topic of debate is the
long-run effect of fiscal stimuli on the soundness of public finances. Undoubtedly, government
intervention has resulted in larger budget deficits and debt (Figure 10), threatening fiscal
sustainability, i.e., the ability of a country to pay its debts, particularly in economies with little
fiscal space. Sinn (2009) estimates that the percentage increases in budget deficits in the UK,
OECD, and the Eurozone were 10.2, 4.5, and 3.7 respectively. Furthermore, a high level of
domestic currency debt in developed countries, e.g., the US, could lead to higher inflation rates
to reduce the real value of the debt. This would lead to higher interest rates on developing
countries’ external debt and stronger deterioration of their fiscal accounts, repeating the
Table 4. Selected Fiscal Stimuli, Advanced Countries, 2008-2009
Eurozone G-20 US Japan UK
Fiscal Stimulus, % of GDP*
1.5 2 2.4 2.5 3.5
Changes in public deficit/GDP, percentage points**
3.7 OECD 4.3 5.1 7.3
4.5
Sources: * World Bank (2009d); **Sinn (2009).

25
“Volcker” increase in interest rates of the 1970s that led to the debt crisis in the developing
world at that time.
The Management of the Crisis vis-à-vis the 1997/1998 East Asian and Russian Crises.
In contrast to the 1997/8 international financial crises, the origin of the Crisis was in an
advanced country, i.e., the US, and contagion hit both developing countries and other advanced
countries. The channels were financial markets as in the late 1990s but also private transfers
(e.g., remittances) and trade in goods and services. In low-income countries contagion was
primarily through the trade channel. Associated with a drop in global output and trade was a drop
in commodity prices.
How does the management of the Crisis on emerging markets compare with that of the
1998 Russian financial crisis? This time around emerging markets were able to use monetary and
countercyclical fiscal policy, which was not an option when the East Asian and the Russian
crises hit. For example, during the Crisis international reserves financed much of the current
account deficit in emerging markets. Also, in the large countries of LAC, lower liability
Figure 10. Budget Balances, % of GDP
Source: IMF (2010a).
-9
-8
-7
-6
-5
-4
-3
-2
-1
0
1
2000 2002 2004 2006 2008 2010
World Advanced economies Emerging and developing economies
-10
-5
0
5
10
15
2000 2002 2004 2006 2008 2010
Central and eastern europe Middle east
Developing asia Africa
Western hemisphere Commonwealth of independent states

26
dollarization permitted devaluations within the 30 to 35 percent range. Impact of inflation was
apparently negligible given global deflation.
The combination of stronger fundamentals, continued access to international markets, and
the US role as a lender of last resort allowed those types of official interventions. Stronger
fundamentals were the result of the adequate management of the bonanza that preceded the
Crisis and that led to surpluses in both the current account of the government and the balance of
payments; lower total debt and foreign-currency denominated debt and short-term debt in total
debt; and higher international reserves in both absolute values and as a back-up of short-term
debt, lower ratios of short-term debt to total external debt (Figure 11), and in some countries
accumulation of public savings.
Figure 11. International Reserves and Short-Term Debt Total International Reserves Short-Term Debt ( % of total (includes gold, % of GDP) external debt)
01020304050
1995 1997 1999 2001 2003 2005 2007 2009
Argentine Indonesia
Philippines Thailand
0
10
20
30
40
50
1995 1997 1999 2001 2003 2005 2007 2009
Argentina Indonesia
Philippines Thailand
Short Term Debt (% of international reserves)
050
100150200250
1995 1997 1999 2001 2003 2005 2007 2009
Argentine Indonesia
Philippines Thailand
Source: IMF (2010a)

27
Also, despite major disruptions in advanced-economy capital markets, capital inflows to
emerging markets were sustained, although at a lower rate, and there were no major disruptions
in short-term debt financing as in previous crises, e.g., Turkey’s. Neither did any major
disruption occur in the Central and Eastern Europe region where the Baltic economies showed
weaknesses similar to pre-Russia 1998 emerging market vulnerabilities. The availability of
multilateral resources for economies with good fundamentals, i.e., the IMF’s FCL, gave the clear
signal that the international community was ready to provide financial support to emerging
markets facing liquidity problems. This context contrasted completely with that of the late 1990s,
when international capital markets suddenly closed for emerging markets and there was no
effective lender of last resort, leading in some cases to full-fledged financial crises (e.g.,
Argentina 2002). However, some emerging markets chose not to save the commodity bonanza.
For example, Argentina and Venezuela are presently facing public sector financing problems, as
international capital markets still remain closed for them. Multilateral support has also been
identified as an important contributor to resilience in the large Latin American countries.61
III.2. Impact Data to assess the impact of the Crisis are gradually emerging. Credit and output
decelerated globally and fell in some countries (Figures 1 and 6). Consequently, oil and non-fuel
commodity prices dropped 36.1 and 18.9 percent respectively in 2009. No country was
untouched. But impact has not been uniform partly due to the initial conditions and the type of
stimulus package implemented in each country. Economies with higher growth rates were hit
61 Includes the seven major countries in the region, i.e., Argentina, Brazil, Chile, Colombia, Mexico, Peru, and Venezuela. IDB (2010).

28
harder.62 This is consistent with the behavior of private credit and the capital flows/commodity
boom-credit link described in Section I.I. In Latin America GDP growth turned negative with
significant drops in Chile, Peru, and Mexico. In contrast, developing Asia, driven by China and
India, sustained high positive albeit slower growth. Africa sustained positive growth, but this
dropped significantly from 5.2 percent in 2008 to 1.9 in 2009. In advanced economies the annual
growth rate fell 5.9 percentage points to – 3.2 percent in 2009. In the US, “one measure of
bank’s loans to small businesses dropped from more than $710 billion in the second quarter of
2008 to less than $670 billion in the first quarter of 2010.63
As credit, commodity prices, and global output dropped, so did global trade and
remittances.
Three factors appear to have
contributed to this outcome, namely weaker demand for loans (partly due to a drop in the value
of collaterals), deterioration in the financial conditions of small businesses, and limited credit
availability.
64 Preliminary data indicate that the volume of world trade in goods and services and
remittances dropped by 14.4 and 6 percent respectively in 2009. The drop in trade would have
been almost twice as large had the cost of credit (reflected in interbank rates) remained at the
high levels of September 2008.65 Remittances in Africa fell by 4 to 8 percent, hitting countries
such as Lesotho where accounts for 25 percent of GDP (Figure 7) and about 25 percent of the
income of the poor, respectively.66
62 Mody (2010).
In Moldova, with 2008 remittances at 40 percent of GDP, the
63 Bernanke (2010). 64 World Bank (2009e and d). 65 Chor and Manova(2010). 66 World Bank, Africa Region website.

29
drop was about 34 percent in the second quarter of 2009 compared to a year earlier.67 FDI also
suffered. Global FDI dropped 39 percent in 2009. All components, equity capital, reinvested
earnings, and other capital flows, were affected. However, the decrease was especially marked
for equity capital flows, which are most directly related to transnational long-term investment
strategies. FDI in commodity sectors had been important in Africa in recent years. In 2008 this
represented 29 % of capital formation.68
The impact on consumption has been far from negligible. For example, in Armenia about
43 percent of the surveyed households reduced food consumption, reduced or stopped buying
medicines, and reduced or stopped visits to health services. In Turkey, where 91 percent of the
poorest 20 percent of households lost income, 53 percent of surveyed households reduced food
consumption, and about 21 percent reduced visits to health services. “Among the poorest
households, 75 percent have reduced children’s food consumption, 29 percent reduced health
care use and 14 percent cut back on education spending.”
69 These findings have heightened
concerns about losing the health and education gains of the 1990s. Protecting human
development gains is critical. Globally, about 72 million primary-school-age children and
another 71 million adolescents remain out of school, and it is expected that 56 million primary-
school-age children will continue be out of school in 2015. Illiteracy remains at 759 million
people, two-thirds of them women.70
Drops in incomes have driven the changes in consumption patterns described above,
making jobs (particularly in SMEs) a key economic shock/human development channel. Also,
67 World Bank (2009f)). 68 UNCTAD (2010). 69 Lewis and Verhoeven (2009). 70 UNESCO (2010).

30
household actions related to human development typically are in the hands of women; hence,
sustaining their well-being is imperative. Availability and quality of social services are also
likely to suffer as a result of the Crisis. A discussion on jobs, women, and public expenditure
follows.
2.1 Jobs The impact of the credit crunch of the Crisis on jobs around the world has been
significant, particularly in the export, construction, and manufacturing sectors. Developed and
European Union (EU) countries and Eastern European (non-EU) and CIS countries had the
largest increases in unemployment (Table 5). In Lithuania, for example, the annual
unemployment rate increased close to 7 percentage points in the first quarter of 2009, reaching
nearly 12 percent in 2009.71 In India over 500,000 jobs in export-oriented sectors were lost in
2008:3.72 The impact was also felt in the mining sector, with South Africa eliminating 40,000
jobs (amounting to 10 percent of the workforce in the sector) and Zambia eliminating 27 percent
of total jobs in mining in 2008.73 Lower US demand for Cambodian exports led some 48
factories to close there from September 2008 through May 2009.74
After four consecutive years of decline, the associated global unemployment rate
increased from 5.7 percent in 2007 to 6.6 percent in 2009 (Table 5). Developed economies and
About 30,000 jobs,
amounting to about 10 percent of the labor force, were lost. This in turn had an impact on the
rural sector, where about 1.5 million people depend on remittances from migrant workers—
mostly women—in urban areas as their major source of income.
71 UNDP (2009). 72 World Bank (2009g). 73 Ndulo et. al (2009). 74 World Bank (2009g).

31
the European Union saw an increase of 2.3 percentage points. In the US the increase was 4
percentage points, and in other advanced countries it hovered between 0.5 and 3 percentage
points. During 2008-2009, the highest increases in unemployment rates among EU countries,
about 7.5 percentage points, occurred in Ireland and Spain. In contrast, in Germany
unemployment decreased half of a percentage point. Box 3 presents a good example of the
behavior of firms from Eastern Europe with regard to sales, financing, and employment during
2008 and 2009.
Table 5. Regional Unemployment
Source: ILO (2010, Table A2).
So far, output and unemployment have been affected differently across countries. While
Ireland and Spain saw unemployment increase 7.5 percentage points, output dropped by more
than 8 percent in Ireland but only by approximately 4 percent in Spain. Germany was able to
decrease unemployment even though output dropped 7 percent (2009). Output declines,
institutional differences, the characteristics of the Crisis (e.g., the construction sector collapse),

32
and policy response differences (e.g., short-time work programs in Germany, Italy and Japan)
explain this variety of responses.75
With respect to gender, male unemployment in developed economies rose faster in 2008
(1.1 percentage points for men versus 0.8 points for women). In South Asia, Latin America and
the Caribbean, and the Middle East and North Africa, the female unemployment increased more
than that for males.
75 IMF (2010b).

33
Measures to mitigate the impact of the Crisis on jobs were implemented around the
world. The UK, Australia, and Chile provided hiring subsidies. Germany reduced working hours
to prevent layoffs. The US, Brazil, and OECD countries extended unemployment benefits.
Mexico, for example, has in place the Job Training Program for Unemployed Workers
(PROBECAT) which has proven effective in providing private (as opposed to public) on-the job
Box 3. The behavior of firms. Eastern Europe and Central Asia are the regions that were hardest hit. Unemployment there is expected to reach
10.3 percent in 2010 (Table 5). Surveys of firms from those regions provide good information about the impact of the Crisis on labor. Some background first: Capital inflows in the form of foreign bank resources to Eastern Europe increased five times during 2003-2004:3. This in turn led to a fast increase in domestic bank credit in both domestic and foreign currency. The Crisis brought a sudden credit crunch, leaving domestic firms and households highly indebted, many of them with debt denominated in foreign currency. The threat of major devaluations and output collapses in these countries and of major financing troubles in the banking system of the countries that provided the loans (e.g. Norway, Sweden, and Austria), led the world to provide financing resources to avert a full-fledged crisis. Nevertheless, the impact of the sudden deceleration and drop in credit was felt in the real sector. Table 6 shows the impact of the Crisis on firms in some of these countries.
The behavior of firms was not uniform across countries. In Bulgaria both permanent and temporary employment dropped. In Hungary temporary workers suffered, whereas in Latvia the increase in temporary workers was at the expense of permanent workers. Clearly, sales in the export and the construction sectors dropped, but they increased in sectors producing goods for the domestic market such as food and textiles. This is consistent with the framework of analysis described in Section II.1. Firms delayed payments to financial institutions and increased used of non-bank financing for working capital, and workers, particularly those hired for temporary tasks, lost their jobs. Debt increased, making firms vulnerable to roll-over and foreign-exchange risk. Full-time employment of skill-intensive enterprises dropped in all countries except Hungary.
Table 6.Firm Survey Results. Central and Eastern Europe
Sales of goods domestically demanded,% change
Sales of exportables and construction, % change
Overdue on obligations, % of firms*
Non-bank financing, % of firms**
Corporate sector debt., % of total debt
Employment , % change
2008
July 2009
Short-term debt***
Foreign currency debt
Permanent employment
Temporary employment
Bulgaria 21 35 23 52 84 49 21 - 4.6 - 6.8 Hungary 11 25 66 26 51 69 35 1.2 - 5.3 Latvia 33 48 63 50 73 49 39 - 18 54.9 Lithuania 18 47 48 40 51 80 21 0.0 23.8 Romania 14 36 9 58 65 57 31 2.6 - 13.5
Source: Correa and Iotty (2010). *Percent of firms overdue on obligations to financial institutions in total firms that have restructured their outstanding liabilities in the last 12 months. **Percent of firms that use internal funds or retained earnings to finance 100 percent of working capital. *** Debt with maturity of less than a year in total debt.

34
training and targets the unemployed and displaced workers with income support and placement
services.76
2.2 Women
Women are particularly vulnerable to economic shocks, and addressing this is critical for
human development. A key factor in human development is women’s role as child caretakers.
Women are typically responsible for feeding children and facilitating access to health and
education. Also, the health of newborn children—critical for cognitive development—is directly
related to their mothers’ health. Iodine deficiency and anemia during pregnancy as well as
absence of skilled health personnel during delivery could leave children facing lifetime
disadvantages.77
Of the 3 billion employed around the world in 2008, 1.2 billion were women (40.4
percent). Female unemployment is likely to be impacted by the Crisis as well as men’s, as
discussed. But aggregate figures do not provide the whole picture. Women’s employment in
export-oriented industries has increased significantly in recent decades. In Uganda, for example,
the cut flower industry employs a workforce that is 85 percent female. In Kenya, where cut
flowers are the second largest agricultural export, 70 percent of workers are women. Women are
also well represented in the textile export sectors in Kenya, Lesotho, and Thailand.
A drop in household income implies lower consumption for the whole family,
poorer health, and less education.
78 As global
trade has decelerated, layoffs involving women in the export sectors have been significant.79
76 World Bank (2009a).
Self-employed women in the Indian garment sector have seen their monthly earnings fall by 50
77 UNESCO (2010). 78 World Bank (2009f). 79 ILO (2010).

35
percent and days of work reduced by 69 percent since November 2008. The reduction of
remittances in Vietnam as a consequence of the Crisis has made women migrant workers poorer.
To cope with the crisis, many Vietnamese women have moved to the informal sectors, others are
relying on community-based assistance.80
An increase in domestic violence toward women as a result of poorer economic
conditions has also been identified in past. The increased vulnerability of women’s well-being
due to the Crisis makes it imperative to continue addressing its short-term impact, i.e., reducing
unemployment due to a credit crunch and aiming at sustaining jobs for both men and women
while strengthening social protection programs.
2.3 Public spending The impact of the Crisis on public spending in the social sectors has been mixed.81
80 Nguanbanchong (2010).
In
some countries, in contrast with the crisis experiences of the 1990s, social spending did not
change, e.g., Brazil, Chile, and Peru. In others it increased. Mexico, which was hard hit by the
Crisis, increased funding for education by about 10 percent (Figure 13). Social spending
increases took place even in economies with significant drops in output in 2008-9, e.g., Romania,
Latvia, and Lithuania. In fact, the Crisis has facilitated the introduction of reforms in Latvia, and
Romania introduced reforms aimed at improving the efficiency of education and health spending
that proved difficult to implement. In Armenia there have been cuts in education spending, too,
amounting to 11 percent for the lowest income households. The Ukraine increased minimum
wages and public sector employment. However, this could be an expensive intervention with
limited impact on the poor—public employees typically are not among the poor group—and,
81 Lewis and Verhoeven (2010).

36
once implemented, increased minimum wages and public sector employment are virtually
impossible to reverse, leaving an inflexible wage bill in the government budget.
In light of the global nature of the Crisis, in all low-income countries there have been
concerns about lower donor funding. This has increased significantly in recent years, making
social sectors highly dependent on this type of resource. For example, in Rwanda donor funding
represents about 50 percent of the total government budget for the health sector and nearly 100
percent of the total public health budget.82
82 World Bank (2009b).
However, new estimates indicate that there has been
Figure 13. Education and Health Social Expenditures, 2005-2009 Mexico
Source: Secretaría de Hacienda y Crédito Público, Mexico Brazil
Source: Ministerio de Fazenda, Brazil. Union: Federal Government
0
100
200
300
2005 2006 2007 2008 2009 2010
Education expenditure of the Public sector (Pesos, bil)
Health expenditure of the Public sector (Pesos, bil)
0.00
10.00
-
50.00
2005 2006 2007 2008 2009 2010Education expenditure of the Union (R$ bil)

37
continued growth in development aid in 2009.83
A key challenge for donor grants is to increase the speed of disbursement. For example,
the Global Fund disburses quickly once allocations are decided, but spending in the target
country is slow. About half of the allocation of Global Fund resources for HIV/AIDS remains
undisbursed. This is particularly acute in Sub-Saharan Africa, where disbursement has only been
about 45 per cent. For example, Global Fund funding for HIV/AIDS increased during 2008-
2009, but a large share of that remains undisbursed. This is also a concern about government
spending.
More specifically, total net official development
assistance (ODA) from donors in the OECD’s Development Assistance Committee rose 0.7
percent in real terms or 6.8 percent once debt relief is excluded. Significant increases came from
Denmark, Sweden, and the United States. The increase from the US was 5.4 percent in real
terms over 2008. Most countries have maintained their commitments for 2010; others, including
some large donors, have reduced or postponed the pledges they made for 2010, confirming
expectations. However, the IMF (2010) reports countries with Poverty Reduction Strategy
Papers are expected to maintain social expenditures.
IV. Prospects
Preliminary projections are staggering. The Crisis--compounded by a lingering food
crisis that started in the mid-2000s--could bring hunger to an additional 100 million people,
increasing the overall number of undernourished to over one billion.84
83 OECD (2010).
People in extreme
poverty could reach 114 million by the end of 2011 (relative to a non-crisis scenario) and there
84 FAO (2009).

38
could be up to 3050 additional infant deaths in 2009 in S-Saharan countries.85 The number of
unemployed women could increase by 22 million in 2009, increasing the global unemployment
rate for women to 7.4 per cent.86
Table 7. Consumption Growth % (2010 and 2011 are forecasts)
While rescue packages have stopped the Crisis from deepening,
incomes will continue suffer where labor demand remains low and governments, firms, and
individuals remain highly indebted and credit constrained. Consumption forecasts augur difficult
times particularly for economies in recent years enjoyed high levels of consumption as capital
flow in and/or commodity prices increased and were poorly prepared to cope with a shock, e.g.,
the Central and Eastern European countries (Table 7).
Hungary Bulgaria Croatia Estonia Latvia Lithuania
2007 - 1.6 5.1 6.2 9.1 14.8 12
2008 - 0.6 4.5 0.8 -4.8 -5.5 3.6
2009 - 6.7 - 6.2 - 8.0 -17.4 - 22.4 - 17.0
2010
- 1.9 0.1 - 0.5 -3.8 - 7.5 - 5.0
2011
1.6 1.9 2.6 2.2 1.6 2.1
Source: Consensus Forecasts (March 2010) Recovery has started, and growth prospects in most countries are positive. Global output
is expected to rise by about 4 percent in 2010 (Annex 1), largely driven by emerging Asia. In the
US there is evidence of stronger consumption that may help normalize global trade, FDI, and
remittances. But dark clouds are still lingering. In some countries (e.g., China) this recovery
appears to be driven by a buildup of inventories and hence may not be sustainable. In the trade
area, while faster growth in rich countries may lead to higher demand for developing-country
85 World Bank (2009) and Friedman and Schady (2009), respectively. 86 ILO (2010).

39
exports, implicit protectionism imbedded in stimulus packages promoting consumption of
domestically-produced goods may have a negative impact. Protectionism also appears to be
increasing in developing countries (e.g., Indonesia, Argentina, Brazil, and Russia).87 In selected
emerging markets (e.g., Brazil and Colombia) inflows of capital have resumed, appreciating the
currencies and discouraging export production.88 In the financial sector there are indications that
banks remain reluctant to lend and more financial regulation is on the adjustment agenda. Banks
continue to tighten standards for loans to small businesses, while standards for large companies
remain unchanged.89
Macroeconomic policy decisions will also impact employment. In light of expansionary
packages, inflation may pick up and interest rates may go up, putting deceleration pressures on
economic activity. Fiscal accounts may deteriorate (partly as a result of rescue packages),
threatening the ability of governments to pay their debts and to maintain their credibility. These
uncertainties and past crises experiences augur stubborn global unemployment. It may take time
for new employment opportunities to emerge.
90
Commodity prices. Over the medium term, real commodity prices are expected to
remain stable at 2010 levels--still higher than mid-2000 levels and closer to the behavior of the
1970s (Figure 14).
91
87 Taylor and Wilson (2009).
As all, growth developments, the macroeconomy (reflected in volatile
exchange rates and interest rates), financial-investor appetite in commodity markets, and the use
88 Kiguel and Levy-Yeyati (2009). 89 However, fast recovery may take place without an associated bank credit increase as firms resort to informal credit markets and/or postpone investment plans as happened in emerging markets in the late 1990s (Calvo and Loo-Kung (2010) ) . 90 IMF (2010b). 91 World Bank (2010).

40
of agriculture products as an alternative fuel source remain volatile; upward and downward
pressures on commodity prices are expected to balance out This situation that contrasts with
that of the 1970s when markets were less volatile calls for continually addressing regulation on
financial commodity markets.
Whether or not agriculture production, consumption, and trade increase in developing
countries and produce more food for the world’s poor, access to food remains the most
immediate concern. In comparison with the 1970s,
inventories are more adequate to respond to demand.
For example, “the wheat stocks-to-use ratio in major
exporting countries has risen from 12 percent in
2007/8 to 20 percent this season. On the demand
side, biofuels remain a leading driver, but the year-on-
year growth has slowed down compared with the past
few years. In the United States, the largest user of
grains for biofuel production, the use of maize for ethanol has grown by 14 percent this season,
down from 40 percent in the run-up of the high price period”(FAO (2010)).
The response to the food and fuel crisis in the mid-2000s largely comprised general
subsidies in some countries and increasing taxes to contain its impact on domestic prices in
others. Out of 146 countries surveyed by the IMF, only 39 expanded targeted safety nets, partly
because not all countries (largely low-income) have safety nets in place and partly for political
reasons.92
92 World Bank (2008).
Unfortunately, temporary price distortions have long-term effects and typically have
Figure 12. Commodity Prices
Source: IMF (2010)
0
50
100
150
200
250
300
350
400
450
1980 1985 1990 1995 2000 2005 2010
Oil Metals Food
Oil
Metals
Food

41
turned out to be permanent. For example, export taxes and other price controls in the short term
redistribute income away from producers (rural producers in the case of commodity producers)
to richer consumers and in the medium term discourage investment (e.g., Argentina’s export tax
on commodity exports). Also, public stockpiles have proven costly and difficult to manage.
Slow employment recovery calls for sustained actions aimed at preventing job layoffs as
well as promoting employment. It also calls for the strengthening of social protection programs,
for example, through direct cash transfers that aim at smoothing out consumption and thus
preventing human development deterioration among the working poor. Effective safety nets
with a nutrition-driven component remain the first choice. Identifying those most vulnerable to
the food crisis is urgent. The food crisis of the mid-2000s has affected both consumers and
producers. For the poor in developing countries it was a negative shock, given the significant
share of these commodities in their budgets. A key policy issue is to identify who are the gainers
and who are the losers in the event of high commodity prices. This in turn depends on the
degree of transmission of international prices into domestic prices.93
V. Lessons and Challenges
93 De Janvry and Sadoulet (2009) in a welfare exercise for Guatemala stated that there was no statistically significant transmission of international into domestic prices. Most real staple food prices rose but not significantly, as usually assumed, yielding small welfare effects. However, given high food consumption share in farmer households, farmers of all sizes lost out from the rise in prices. Only if international prices had fully transmitted would half of the large farmers have gained, with the vast majority of small and medium farmers losing out. “Allowing for price responses in both production and consumption mitigates negative effects, but still leaves a vast majority of the farmer population losing.” This study suggests that social protection should target both the rural and urban poor, contrary to the belief that the most affected group is the latter.

42
The global financial crisis that unfolded in 2008 is the most severe global financial crisis
since the Great Depression. At the heart of this crisis has been a sudden credit crunch leading to
a drop in global output, trade, remittances, tourism, and other sources of employment and
incomes. Domestic liquidity injections and countercyclical policies and financial resources
from rich countries and international financial institutions to developing countries all contributed
to keeping economies going by protecting financial sector payment systems. True, still many
firms closed, millions remain out of work, and effective financial intermediation—key for the
effective functioning of economies--remains impaired. Gains in the reduction of poverty from
the last decade may be lost particularly in low-income countries and in this scenario the threat of
social unrest is real. But, in contrast with past crises (including the Great Depression), these
official interventions stopped the hemorrhaging virtually everywhere, preventing the crisis from
deepening. Economies with fiscal space implemented stimulus packages including additional
resources for the social sectors. Those with social protection programs in place were able to
increase coverage.94
The key short-term challenges policymakers face today include:
All these actions suggest that the lessons from the Great Depression and
recent financial crises in emerging markets were learned! It is, nonetheless, too soon to assess
the impact of those measures on the most vulnerable.
• sustaining protection of the vulnerable population while ensuring the “new” poor—
those who before the crisis the bonanza lifted out of poverty-- are also reached;
• increasing the absorptive capacity of public spending particularly in developing
countries where it remains very low;
94 E.g., Mexico’s Progresa; the Philippines’s Pantawid Pamilyang Pilipino Program; and Cambodia’s cash-and food for work.

43
• restoring confidence in financial systems that aim to sustain fully-functioning credit
channels and thus protect employment. In this regard, making credit accessible to
sound small business remains a priority ;
• addressing inflationary pressures as a consequence of increased liquidity that could
depreciate incomes further;
• maintaining an open international trade system both advanced and developing
countries. This should contribute sustain jobs particularly for women in developing
countries. In emerging markets trade openness have proven to help buffer the impact
of sudden stops in capital inflows;
• effectively implementing an exit strategy from fiscal stimuli to ensure sustained
employment while preventing stimuli from being perceived and becoming permanent.
In the current situation of vulnerable financial systems, depleting international
reserves as fiscal stimuli are withdrawn will leave the economy vulnerable to future
liquidity shocks;
As discussed in this paper, jobs and effective social spending is the key to
preventing the loss of the social gains of the 1990s and for the resumption of progress.
The 2008-10 crisis has shown that shock preparedness pays. In this regard, to buffer the
impact of financial crises on human development the following lessons have been
learned:
• to lessen economic adjustment when external financing becomes scarce, keep high
international reserves and reserve and liquidity requirements to lower vulnerability
to debt-rollover and currency risk. Sound financial systems are no guarantee of

44
output-collapse immunization. External factors matter and cross-border contagion
may strike any time.
• to avoid potentially regressive palliative measures during a crisis, build stronger
regulatory and supervisory structures for the financial system and comprehensive
insurance mechanisms during economic stability. Politically, it may not be easy to
implement such measures and to achieve more equitable outcomes once the crisis
hits. This applies likewise to ex-ante insurance design—whether for depositors,
bankruptcy, or unemployment. Beyond equity considerations, crisis may not be the
most appropriate time to implement constraints, e.g., higher bank loan provisions, in
an already credit-constrained financial sector. Putting bounds on financial regulation
has typically turned difficult. Wall Street is already searching for ways to bypass new
regulations.95
• to allow firms to adjust fast, have in place an effective bankruptcy regulatory
framework. Credit alone is not likely to speed up job and output recovery. Flexible
labor markets are also needed. This however has proven difficult to achieve in the
developing world, largely due to political economy considerations.
Controls on capital inflows do not guarantee containment of capital
outflows. Financial stocks already in the economy are as vulnerable to reversals as
new capital inflows, which highlights the need to maintain a stable macroeconomic
and social environment;
• to provide immediate social protection, have in place an efficient system of public
sector delivery.
95 Financial Times, April 13, 2010.

45
When the crisis unfolds, • maintain a well-functioning payment system in the financial sector during economic
crisis to the extent that credit matters for output and employment. Credit is needed to
keep the economy going and to prevent massive individual and firm bankruptcies,
particularly in labor-intensive sectors, e.g., SMEs and microfirms. In this regard
efficient public banks may have an important role as financial intermediaries.
• rebalance the use of public resources to prevent human development losses. In this
regard Chile’s behavior has been exemplary: Chile’s bonanza of 2003/8 was saved
despite strong pressures (including street protests) not to do so. Today Chile is
financially and institutionally ready to address the Crisis as well as the recent massive
earthquake it suffered. Prioritizing expenditures becomes more important during
economic crises; however, changing allocations may prove difficult and calls for
efforts to be directed toward encouraging private-public partnerships. An additional
challenge is to improve the ability of central and local governments from low-income
countries to disburse available resources. This calls for more involvement of local
communities in joint programs with governments;
• expand existing schemes to protect the most vulnerable. Collecting data takes time;
hence social programs created in the middle of a crisis are likely to be ineffective.
The short-term challenge in the social sectors is twofold: to improve protection
programs and to increase coverage effectively. The challenge is to identify the right
46
time to phase out shorter-hours work programs, for example, as well as to achieve
well-designed, targeted, and enforced programs.
Finally, the Crisis showed that advanced economies are not very different from emerging
markets when it comes to financial crises. Furthermore, it has highlighted the importance of
having a lender of last resort and fast international coordination to prevent crises from
deepening. Proposals to ensure that this occurs include having in place a body with global
central bank functions when a shock hits.96 This could lessen the need to hold international
reserves to avert crises, freeing them to address social needs.97
96 Calvo (2009a) and Kapur and Subramanian (2009)).
97 Stiglitz (2010).

47
References Aizenman, Joshua and Nancy Marion (2009). Using Inflation to Erode the US Public Debt.
NBER Working Paper 15562. December. National Bureau of Economic Research.
Cambridge MA.
Arbache, Jorge Saba and John Page (2007). More Growth and Fewer Collapses? A New Look at
Long Run Growth in Sub-Saharan Africa. World Bank Policy Research Working Paper
4384. November. World Bank, Washington, DC.
Beck, Torsten, Asli Demirguc-Kunt and Maria Soledad Peria (2010). Foreign Banks and Small
and Medium Enterprises: Are they Really Estranged? April. www.voxeu.org.
Behrman, Jere R. (2009). What You Don’t Know Can Hurt You—Or at least Mislead You:
Family Behaviors, Unobserved Heterogeneities, and the Determinants and Impacts of
Human Resources over the Life Cycle. Economia. Journal of the Latin American and
Caribbean Association, Volume 9, Number 2, Spring 2009.
Berkmen S. Pelin, Gaston Gelos, Robert Rennahack and James P. Walsh (2010). The Global
Crisis: Why Were Some countries Hit Harder? March. www.voxeu.org.
Bernanke, Ben S. (2010). Restoring the Flow of Credit to Small Businesses. Speech at the
Federal Reserve Meeting Series: “Addressing the Financing Needs of Small Buisnesses, “
July 12, Washington, DC. July 12.
Blanchard, Olivier, Giovanni DellAriccia, and Paolo Mauro (2010). Rethinking Macroeconomic
Policy. IMF Staff Position Note. SPN/10/03. February. International Monetary Fund.
Washington, DC.
Bloomberg (2010). Business Week . February 22, 2010.

48
Bureau of Labor Statistics (2010). Press Release. April 2nd. US Department of Labor.
Washington, DC.
Burke, Maureen (2010). Despite the Crisis, Poor Countries Try to Maintain Social Spending.
IMF Survey. January. International Monetary Fund. Washington, DC.
Brunnermeier, Markus K. (2008). Deciphering the Liquidity and Credit Crunch 2007-08, NBER
Working Paper Series 14612. December. National Bureau of Economic Research.
Cambridge MA.
Burnside, Craig, Martin Eichenbaum and Sergio Rebelo (2008). Currency Crisis in ed. Steven
Durlauf and Lawrence E. Blum, The New Palgrave: A Dictionary of Economics, 2nd
Edition. Palgrave MacMillan.
Caballero, Ricardo, Eduardo Engel, and Alejandro Micco (2004). Microeconomic Flexibility in
Latin America, NBER Working Papers 10398. March. National Bureau of Economic
Research.
Calvo, Guillermo A. (2009a). Financial Crises and Liquidity Shocks: A Bank-Run Perspective.
NBER Working Paper No 15425. October. National Bureau of Economic Research.
Cambridge, MA.
__________ (2009b). A Theory of How International Reserves and Easy Money Caused the
Crisis. October. www.voxeu.org.
__________ (2009c). Looking at Financial Crises in the Eye: A Simple Finance/Macro
Framework. September. Columbia University. New York.

49
__________ (2010). Controls on Cyclical Capital Inflows: Some Skeptical Notes. Prepared for
the XXXI Latin American Network of Central Banks and Finance Ministers, IDB, April
22-23, 2010.
__________ (2006). Monetary Policy Challenges in Emerging Markets: Sudden Stops, Liability
Dollarization and Lender of Last Resort. NBER Working Paper No 12788. December.
National Bureau of Economic Research, Cambridge, MA.
__________ and Carmen Reinhart (2000). When Capital Inflows Come to a Sudden Stop:
Consequences and Policy Options in Peter Kenen and Alexandre Swoboda, Key Issues in
Reform of the International Monetary and Financial System. International Monetary
Fund, Washington DC.
__________ Alejandro Izquierdo and Luis-Fernando Mejia (2004). On the Empirics of Sudden
Stops: the Relevance of Balance Sheet Effects. NBER Working Paper Series 10520.
May. National Bureau of Economic Research, Cambridge MA.
__________ and Ernesto Talvi (2004). Sudden Stops, the Real Exchange Rate, and Debt
Sustainability: Argentina’s Lessons in Guillermo Calvo (2005) Emerging Capital
Markets in Turmoil: Bad Luck or Bad Policy? MIT Press. Cambridge, MA.
__________ and Loo-Kung (2009). Should we rush to further regulate financial institutions?
June. www.voxeu.org.
__________ (2010). US Recovery. A new Phoenix-Miracle? April. www.voxeu.org.
Calvo, Sara Guerschanik (1999). Reducing Vulnerability to Speculative Attacks. PREM Notes
No 16. World Bank. Washington, DC.
__________ and Carmen Reinhart (1996). Capital Flows to Latin America. Is there Contagion
Effects in Private Capital Flows To Emerging Markets after the Mexican Crisis, ed.

50
Guillermo A. Calvo; Morris Goldstein and Eduard Hochreiter, ed. Institute for
International Economics. Washington, DC.
__________ (2006). Socially Responsible Macroeconomic Policy in Bolivia-Public Policy
Options for the Well-Being of All, ed. Vicente Fretes-Cibils, Marcelo Giugale and
Connie Luff. World Bank. Washington, DC.
CBOE (2010). Volatility Index. Chicago Board Options Exchange. Chicago, Ill.
Cervantes-Godoy and Joe Dewbre (2010). Economic Importance of Agriculture for Poverty
Reduction. January. OECD, Paris.
Cavallo, Eduardo and Jeffrey A. Frankel (2008). Does openness to trade make countries more
vulnerable to sudden stops or less? Journal of International Money and Finance. Elsevier.
Vol 27(8), pages 1430-1452.
Collier, Paul, Anke Hoeffler and Catherine Patillo (2004). Africa Exodus: Capital Flight and the
Brain Drain as Portfolio Decisions. Journal of African Economies, Vol 13 Suppl.2.
Centre for the Study of the African Economies.
__________ (2007). The Bottom Billion: Why the poorest countries are failing and what can be
done about it. Oxford University Press. London.
Conceição, Pedro, Zhang and Yanchun (2009). Economic Shocks and Human Development: A
Review of the Empirical Findings. UNDP/ODS Working Paper. September. UNDP, New
York.
__________ and Namsuk Kim (2009). The Asymmetric Impact of Growth Fluctuation on
Human Development: Evidence from Correlates of Growth Decelerations and
Accelerations. UNDP/ODS Working Paper. UNDP, New York. May.
Consensus Forecasts (2010). Consensus Economics Inc. London.

51
Corporacion Andina Financiera (2007). Oportunidades en America Latina. Hacia una mejor
política social. Reporte de Economia y Desarrollo 2007-2008.
Correa, Paulo and Mariana Iootty (2010). The Impact of the Global Economic Crisis on the
Corporate Sector in Europe and Central Asia: Evidence from a Firm-Level Survey.
Enterprise Note No 9. April. International Finance Corporation. Washington, DC.
Cotarelli, Carlo and José Viñals (2009). A Strategy for Renormalizing Fiscal and Monetary
Policies in Advanced Economies. IMF Staff Position Note S/PN/09/22. September.
International Monetary Fund, Washington, DC.
Chen, Shaohua and Martin Ravallion (2009). The impact of the global financial crisis on the
world’s poorest. April. www.voxeu.org.
Chunling Lu, Matthew T. Schneider, Paul Gubbins, Katherine Leach-Kemon, Dean Jamison,
Christopher JL Murray (2010). Public financing of health in developing countries: a
cross-national systematic analysis. April. The Lancet, Early Online Publication. The
Lancet.com.
Dang, Hai-Anh, Steve Knack and Halsey Rogers (2009). International Aid and Financial Crises
in Donor Countries. Policy Research. Working Paper 5162. December. World Bank.
Washington, DC
De Janvry, Alain and Elisabeth Sadoulet (2008). Methodological Note: Estimating the Effects of
the Food Price Surge on the Welfare of the Poor. December. University of California at
Berkekey.
__________ (2009). The Global Food Crisis and Guatemala: What Crisis and for Whom. May.
University of California at Berkeley.

52
Edwards, Sebastian (2009). Latin America’s Decline: A Long Historical View. NBER Working
Paper 15171. July. National Bureau of Economic Research. Cambridge MA. July.
Engerman, Stanley L. and Kenneth Lee Sokoloff (2002). Factor Endowments, Inequality, and
Paths of Development among New World Economies. Economia, Fall 2002, Volume 3,
Number 1.
FAO (2009a). The State of Food Insecurity in the World. Food and Agriculture Organization.
United Nations. Rome.
__________ (2009b). Food Outlook. December. Food and Agriculture Organization. United
Nations. Rome.
Ferreira, Francisco H.G. and Norbert Schady (2008). Aggregate Economic Shocks, Child
Schooling and Child Health. World Bank Policy Research Working Paper 4701. World
Ban, Washington, DC.
Friedman, Jed and Norbert Schady (2009).How Many More Infants Are likely to Die in Africa as
a Result of the Global Financial Crisis? World Bank Development Research Group.
August. World Bank. Washington, DC
Frieden, Jeffry, Manuel Pastor Jr. and Michael Tomz (2000). Modern Political Economy and
Latin America. Westview Press. Boulder, Colorado.
Gonzalez-Vega, Claudio y Jorge Rodriguez-Meza (2002). La Situacion Macroeconomica y el
Sector Microfinanzas en Bolivia. Cuadernos de Sefir. Marzo. La Paz, Bolivia.
Griffith-Jones, Stephany and Jose Antonio Ocampo (2009). Building on the counter-cyclical
consensus: A policy agenda. December. Columbia University.
Grosh, Margaret C. (2008). For Protection and Promotion: The design and implementation of
effective safety nets. World Bank, Washington, DC.

53
Haddad, Mona, Jamus Lim and Christian Saborowski (2010). Does openness increase volatility?
Not if countries are sufficiently diversified. March. www.voxeu.org..
Hailu, Degol (2009). The Global Economic Crisis Hampers Human Development. How? One
Pager No 95. The International Policy Centre for Inclusive Growth. September. UNDP.
New York.
Haussmann, Ricardo, Francisco Rodriguez, and Rodrigo Wagner (2008). Growth Collapses. In
Carmen Reinhart, Andrés Velasco and Carlos Vègh, eds. Money, Crises and Transition:
Essays in Honor of Guillermo Calvo. Cambridge: MIT Press.
__________ Dani Rodrik, and Andrés Velasco (2004). Growth Diagnostics. Harvard University.
Cambridge, MA.
Hogan, Margaret C, Kyle J. Foreman, Mohsen Naghavi, Stephanie Y Ahn, Mengur Wang,
Susanna M. Makela, Alan D. Lopez, Rafael Lozano and Christopher JL Murray (2010).
Maternal Mortality for 181 countries, 1980-2008: a systematic analysis of progress
towards Millenium Development Goal 5. The Lancet, Early Online Publication. April.
IDB (2003). Goods Jobs Wanted. Labor Markets in Latin America. 2004 Economic and Social
Progress Report. Inter-American Development Bank. Washington, DC.
__________ (2005). Unlocking Credit. 2005 Economic and Social Progress Report. Inter-
American Development Bank. Washington, DC.
__________ (2010a). The Age of Productivity. Inter-American Development Bank.
Washington, DC.
__________ (2010b). The Aftermath of the Crisis, coordinators Alejandro Izquierdo and Ernesto
Talvi. Inter-American Development Bank. Washington, DC.
ILO (2010). Global Employment Trends. February. International Labor Organization. Geneva..

54
__________ (2009). Global Employment Trends for Women. March. International Labor
Organization. Geneva.
IMF (2009). World Economic Outlook. October. International Monetary Fund. Washington, DC
__________ (2010a).World Economic Outlook Update. January. International Monetary Fund.
Washington, DC
__________ (2010b). World Economic Outlook. April. International Monetary Fund.
Washington, DC
Ivanic, Maros and Will Martin (2008). Ensuring Food Security. Finance and Development.
December. International Monetary Fund. Washington, DC..
Kaminsky, Graciela L. and Carmen M. Reinhart (1996 ). The Twin Crises: The Twin Crises: The
Causes of Banking and Balance-of-Payments Problems. International Finance
Discussion Papers 544, Board of Governors of the Federal Reserve System (U.S.).
__________ Carmen M. Reinhart, and Carlos Végh (2004). When it Rains, It Pours: Procyclical
Capital Flows and Macroeocnomic Policies in Mark Gertler and Kenneth s. Rogoff, eds.
NBER Macroeconomics Annual 2004. Cambridge, Mass: MIT Press.
Kanbur, Ravi (2009). Poverty Disconnected. December. Finance and Development. International
Monetary Fund. Washington, DC.
Kapur , Davesh and Arvind Subramanian (2009). Wanted: A Truly International Monetary Fund.
March. Forbes.com
Kiguel, Andrea and Eduardo Levy-Yeyati (2009). Back to 2007: Fear of appreciation in
emerging economies. August. www.voxeu.org.
Lewis, Maureen and Marijn Verhoeven (2010). Financial Crises and Social Spending:The
Impact of the 2008-2009 Crisis. March. World Bank. Washington, DC.

55
Lustig, Nora (2010). Protecting Latin America’s Poor during Economic Crises. Policy Brief No
2. February. Inter-American Dialogue. Washington, DC.
Mendoza, Enrique and Marco Terrones (2008). An Anatomy of Credit Booms: Evidence from
Macro Aggregates and Micro Data. NBER Working Paper 14040. National Bureau of
Economic Research. Cambridge, MA.
Mody, Ashoka (2010). Who fell in 2009: Those with current account deficits or with extra froth?
February. www.voxeu.org.
Ndulo, Manenga, Dale Mudenda, Lutangu Incombe and Lillian Muchimba (2009). Zambia.
Global Financial Crisis Discussion Series. May. Overseas Development Institute.
London.
Nguanbanchong, Aphitchaya (2010). Beyond the Crisis. The Impact of the Financial Crisis on
women in Vietnam. February. Oxfam GB in East Asia. UK.
Obstfeld, Maurice (1994). The Logic of Currency Crises. Cahiers Economiques et Monetaires
43, 189-213.
OECD (2010). Aid: Development aid rose in 2009 and most donors will meet 2010 aid targets.
Organization for Economic Cooperation and Development. April. Paris
Ostry, Jonathan D., Atish R. Ghosh, Karl Habermeier, Marcos Chamon, Mahvash S. Qureshi,
and Dennis B.S. Rinhardt (2010). Capital Inflows: The Role of Controls. IMF Staff
Position Notes SPN/10/04. February. Internatinonal Monetary Fund. Washington, DC.
February
Paci, Pierella, Ana Revenga, and Bob Rijkers (2009). Coping with Crises. Why and How to
Protect Employment and Earnings. October. Policy Research Working Paper 5094. The
World Bank, Washington, DC. October.

56
Perry, Guillermo E., William F. Maloney, Omar S. Arias, Pablo Fajnzylber, Andrew D. Mason,
and Jaime Saavedra-Chanduvi. 2007. Informality. Exit and Exclusion. The World Bank.
Washington, DC
__________ Omar S. Arias, J. Humberto Lopez, William F. Maloney, and Luis Serven. (2006).
Poverty Reduction and Growth: Virtuous and Vicious Circle. World Bank. Washington,
DC
Ravalion, Martin (2003). The Debate on Globalization, Poverty and Inequality. Why
Measurment Matters. Policy Research Working Paper 3038. May. The World Bank.
Washington, DC.
Raddatz, Claudio (2010). How important was the worldwide use of wholesale funds for the
international transmission of the US subprime crisis? March. www.voxeu.org.
Reinhart, Carmen and Vincent Reinhart (2008). Capital Flow Bonanzas: An Encompassing View
of the Past and Present. In eds. Jeffrey Frankel and Francesco Giavazzi, NBER
International Seminar in Macroeconomics 2008. Chicago University Press and NBER.
Forthcoming
__________ and Kenneth Rogoff (2009). This Time is Different. Eight Hundred Years of
Financial Folly. Princeton Press. Princeton, New Jersey.
Rodriguez, Francisco (2001). La economia política del crecimiento en América Latina. Reporte
de Coyuntura Annual 2001: Oficina de Asesoría Económica de Venezuela. Also The
Political Economy of Latin American Economic Growth. University of Maryland.
__________ (2007). Growth Empirics in a Complex World: A Guide for Applied Economists
and Policymakers in José Antonio Ocampo, Jomo K. S. and Rob Vos, eds., Growth
Divergences: Explaining Differences in Economic Performance, New York: Zed Books.

57
__________ (2008). What Can We Really Learn from Growth Regressions? Challenge, vol. 51,
no 4, July/August 2008. Pp 55-69.
Rodrik, Dani (2005). Why We Learn Nothing From Regressing Economic Growth on Policies.
March. Harvard University. Cambridge, MA.
Sahay, Ratna and Goyal, Rishi (2007). Growth Volatility in Latin America: An episodic Aproach
IMF Working Paper 06/287. January. International Monetary Fund, Washington, DC.
Schularick, Moritz and Alan M. Taylor, 2009, Credit Booms gone Bust: Monetary Policy,
Leverage Cycles and Financial Crises, 1870-2008, NBER Working Paper 15512).
Sinn, Hans-Werner. (2009). Shock Producers and Shock Absorbers in the Crisis. Development
Outreach. World Bank Institute. September. World Bank. Washington, DC.
Stiglitz, Joseph (2010). The Financial Crisis of 2007-8 and its Macroeconomic Consequences, in
Stephany Griffith-Jones, José Antonio Ocampo and Joseph E. Stiglitz, eds. Time for the
Visible Hand. Oxford University Press. New York.
__________ (2003). Poverty, globalization and growth: perspectives on some of the statistical
links, in Millennium Development Goals: A Compact Among Nations to End Human
Poverty. Human Development Report 2003. United Nations. New York.
Thomas, Duncan and Elizabeth Frankeberg, 2007, Household Responses to the Financial Crisis
in Indonesia: Longitudinal Evidence on Poverty, Resources, and Well-Being in
Globalization and Poverty, ed. Ann Harrison, National Bureau of Economic Research,
The University of Chicago Press.
Taylor, Benjamin J. and John S. Wilson (2009). The Crisis and Beyond: Why Trade Facilitation
Matters. Brief. Research at the World Bank. World Bank, Washington, DC.

58
UNDP (2009a). Overcoming Barriers: Human Mobility and Development. 2009 Human
Development Report. United Nations. New York
__________ 2009b) Lithuania-Crisis Poverty and Social Impact Analysis. The Inclusive
Development Cluster, Poverty Group. December. United Nations. New York.
UNESCO (2010). 2010 Education for All Global Monitoring Report. United Nations. Paris.
UNCTAD (2010). Global and Regional FDI Trends in 2009. Global Investment Trends Monitor
No 2. United Nations. Geneva. January.
World Bank (2000). Attacking Poverty. World Development Report 2000/2001. World Bank,
Washington, DC.
__________ (2003). Making Services Work for the Poor People. World Development Report
2004. The World Bank. Washington, DC.
__________ (2004). Bolivia-Public Expenditure Review. World Bank. Washington, DC.
__________ (2005). Chile—Development Policy Review. World Bank. Washington, DC.
__________ (2006). Equity and Development. World Development Report 2006. World Bank.
Washington, DC.
__________ (2008). Rising Food and Fuel Prices: Addressing the Risks to Future Generations.
Human Development Network. October. World Bank. Washington, DC..
__________ (2009a). How Should Labor Market Policy Respond to the Financial Crisis? HD
and PREM Labor Market Team. April. World Bank. Washington, DC.
__________ (2009b). Protecting Pro-Poor Health Services during Financial Crises. Lessons from
Experience. Health Nutrition and Population. April. World Bank. Washington, DC.
__________ (2009c). Migration and Development Brief No 11. World Bank. Washington, DC.
59
__________ (2009d). Transforming the Rebound into Recovery. East Asia and Pacific Update.
November. World Bank. Washington, DC.
__________ (2009e). The Crisis Hits Home. Stress-Testing Households in Europe and Central
Asia. November. World Bank. Washington, DC.
__________ (2009f). Protecting Progress: The Challenge Facing Low-Income Countries in the
Global Recession. Prepared for the G-20 Leaders’ Meeting, Pittsburgh, USA, September
24-25, 2009. September. World Bank. Washington, DC.
__________ (2009g). Swimming Against the Tide: How Developing Countries are Coping with
the Global Crisis..Prepared for the G20 Finance Ministers and Central Bank Governors
Meeting, Horsham, United Kingdom on March 13-14, 2009. March. World Bank.
Washington, DC.
World Trade Organization (2010). JOB (09)/2. January.
Zhang, Yanchun, Nina Thelen and Aparna Rao (2010). Social Protection in Fiscal Stimulus
Packages: Some Evidence. March. United Nations Development Program. United
Nations. New York.

60
Annex. Actual and Projected Real Growth Rates, %
Selected Advanced Countries
Selected Middle East and Africa Countries
Selected Western Hemisphere Countries
-10
0
10
2005 2006 2007 2008 2009 2010 2011 2012
United States United Kingdom
France Japan
Spain Italy
Advanced Economies
-100
10
2005 2006 2007 2008 2009 2010 2011 2012
Egypt Saudi Arabia
Nigeria South Africa
Middle east and Africa
-20.00.020.0
2005 2006 2007 2008 2009 2010 2011 2012
Argentina Brazil
Chile Colombia
Mexico Peru
Western Hemisphere

61
Seleted Developing Asia Countries
Selected Central and Eastern Europe
Selected Commonweath of Independent States
-10.0
0.0
10.0
20.0
2005 2006 2007 2008 2009 2010 2011 2012
China Indonesia India
Malaysia Pakistan Thailand
Developing Asia
-20.0
0.0
20.0
2005 2006 2007 2008 2009 2010 2011 2012
Estonia Hungary
Lithuania Latvia
Poland Turkey
Central and Eastern Europe
-20.0-10.0
0.010.020.0
2005 2006 2007 2008 2009 2010 2011 2012
Russia
Armenia
Ukraine
Commonwealth of Independent States

62
Annex’s Graphs Data
Source: Consensus Forecast, various issues, 2010 March
WESTERN HEMISPHERE (LATIN AMERICA) Country ISO 2005 2006 2007 2008 2009 2010 2011
Argentina ARG 9.2 8.5 8.7 6.8 -2.8 3.8 2.4
Bolivia BOL 4.4 4.8 4.6 6.1 3.3 3.6 4.1
Brazil BRA 3.2 4.0 5.7 5.1 -0.2 5.5 4.4
Chile CHL 5.6 4.6 4.7 3.2 -1.7 4.6 5.3
Colombia COL 5.7 6.9 7.5 2.5 0.1 2.8 3.7
Costa Rica CRI 5.9 8.8 7.8 2.6 -1.5 3.1 3.9 Dominican Republic DOM 9.3 10.7 8.5 5.3 2.5 3.1 4.1
Ecuador ECU 6.0 3.9 2.5 6.5 -0.8 2.2 2.6
Guatemala GTM 3.3 5.4 6.3 4.0 0.6 1.9 2.7
Honduras HND 6.1 6.7 6.3 4.0 -2.1 2.1 2.9
Mexico MEX 3.2 5.1 3.3 1.3 -6.5 4.0 3.5
Nicaragua NIC 4.4 3.9 3.2 3.2 -2.4 1.6 2.3
Panama PAN 7.2 8.5 11.5 9.2 2.4 4.0 5.5
Peru PER 6.8 7.7 8.9 9.8 0.9 4.9 4.8
Paraguay PRY 2.9 4.3 6.8 5.8 -3.4 3.2 3.9
El Salvador SLV 3.1 4.2 4.7 2.5 -3.1 1.7 2.4
Uruguay URY 6.8 4.6 7.6 8.9 1.9 3.9 3.8
Venezuela VEN 10.3 10.3 8.4 4.8 -3.3 -2.1 1.5 Simple average 5.7 6.3 6.5 5.1 -0.9 3.0 3.5
DEVELOPING ASIA Country ISO 2005 2006 2007 2008 2009 2010 2011
Bangladesh BGD 6.3 6.5 6.3 6.0 5.4 5.8 6.2
China CHN 10.4 11.6 13.0 9.0 8.7 9.9 9.1
Indonesia IDN 5.7 5.5 6.3 6.1 4.5 5.7 6.1
India IND 9.2 9.8 9.4 7.3 6.7 7.0 8.2
Sri Lanka LKA 6.2 7.7 6.8 6.0 3.4 6.2 6.5
Malaysia MYS 5.3 5.8 6.2 4.6 -1.7 5.4 5.0
Pakistan PAK 7.7 6.1 5.6 2.0 2.7 3.5 4.1
Philippines PHL 5.0 5.3 7.1 3.8 0.9 4.0 4.5
Thailand THA 4.6 5.2 4.9 2.6 -2.3 4.7 4.5
Vietnam VNM 8.4 8.2 8.5 6.2 5.3 6.5 6.7 Simple average 6.9 7.2 7.4 5.4 3.4 5.9 6.1
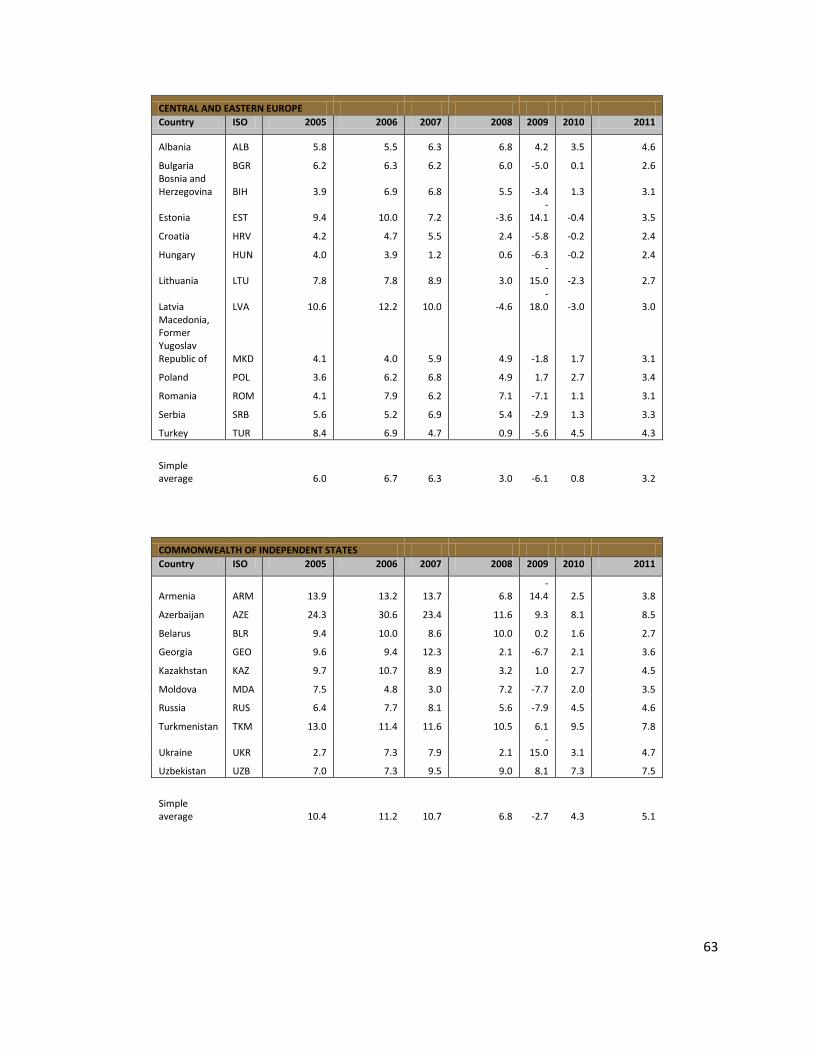
63
CENTRAL AND EASTERN EUROPE Country ISO 2005 2006 2007 2008 2009 2010 2011
Albania ALB 5.8 5.5 6.3 6.8 4.2 3.5 4.6
Bulgaria BGR 6.2 6.3 6.2 6.0 -5.0 0.1 2.6 Bosnia and Herzegovina BIH 3.9 6.9 6.8 5.5 -3.4 1.3 3.1
Estonia EST 9.4 10.0 7.2 -3.6 -
14.1 -0.4 3.5
Croatia HRV 4.2 4.7 5.5 2.4 -5.8 -0.2 2.4
Hungary HUN 4.0 3.9 1.2 0.6 -6.3 -0.2 2.4
Lithuania LTU 7.8 7.8 8.9 3.0 -
15.0 -2.3 2.7
Latvia LVA 10.6 12.2 10.0 -4.6 -
18.0 -3.0 3.0 Macedonia, Former Yugoslav Republic of MKD 4.1 4.0 5.9 4.9 -1.8 1.7 3.1
Poland POL 3.6 6.2 6.8 4.9 1.7 2.7 3.4
Romania ROM 4.1 7.9 6.2 7.1 -7.1 1.1 3.1
Serbia SRB 5.6 5.2 6.9 5.4 -2.9 1.3 3.3
Turkey TUR 8.4 6.9 4.7 0.9 -5.6 4.5 4.3
Simple average 6.0 6.7 6.3 3.0 -6.1 0.8 3.2
COMMONWEALTH OF INDEPENDENT STATES Country ISO 2005 2006 2007 2008 2009 2010 2011
Armenia ARM 13.9 13.2 13.7 6.8 -
14.4 2.5 3.8
Azerbaijan AZE 24.3 30.6 23.4 11.6 9.3 8.1 8.5
Belarus BLR 9.4 10.0 8.6 10.0 0.2 1.6 2.7
Georgia GEO 9.6 9.4 12.3 2.1 -6.7 2.1 3.6
Kazakhstan KAZ 9.7 10.7 8.9 3.2 1.0 2.7 4.5
Moldova MDA 7.5 4.8 3.0 7.2 -7.7 2.0 3.5
Russia RUS 6.4 7.7 8.1 5.6 -7.9 4.5 4.6
Turkmenistan TKM 13.0 11.4 11.6 10.5 6.1 9.5 7.8
Ukraine UKR 2.7 7.3 7.9 2.1 -
15.0 3.1 4.7
Uzbekistan UZB 7.0 7.3 9.5 9.0 8.1 7.3 7.5
Simple average 10.4 11.2 10.7 6.8 -2.7 4.3 5.1

64
ADVANCED ECONOMIES Country ISO 2005 2006 2007 2008 2009 2010 2011
Australia AUS 2.759 2.84 4.049 2.354 1.3 3.1 3.4
Austria AUT 2.46 3.46 3.547 2.048 -3.5 1.3 1.7
Belgium BEL 2.17 3.015 2.599 0.969 -3 1.2 1.8
Canada CAN 3.019 2.854 2.531 0.414 -2.6 2.9 3.2
Switzerland CHE 2.641 3.63 3.605 1.78 -1.5 1.5 1.8
Cyprus CYP 3.949 4.142 4.444 3.57 -1.5 1 2.4 Czech Republic CZE 6.316 6.808 6.131 2.697 -4.2 1.5 2.7
Germany DEU 0.732 3.176 2.516 1.248 -5 1.7 1.6
Denmark DNK 2.445 3.344 1.647 -1.202 -5.1 1.2 1.9
Spain ESP 3.615 4.017 3.565 0.856 -3.6 -0.4 1.1
Finland FIN 2.768 4.923 4.203 1.041 -7.8 1.1 2.1
France FRA 1.941 2.416 2.26 0.323 -2.2 1.4 1.6 United Kingdom GBR 2.173 2.853 2.559 0.742 -5 1.4 2.3
Greece GRC 2.898 4.497 4.036 2.933 -1.9 -1.3 0.3 Hong Kong SAR HKG 7.082 7.02 6.38 2.365 -2.7 4.9 4.5
Ireland IRL 6.175 5.356 6.024 -3.036 -7.3 -1.2 2
Israel ISR 5.1 5.283 5.203 4 0.1 3.3 3.9
Italy ITA 0.656 2.036 1.564 -1.04 -4.9 0.8 1.2
Japan JPN 1.934 2.039 2.337 -0.705 -5.1 1.9 1.6
Korea KOR 3.957 5.179 5.106 2.224 0.2 4.9 4.3
Netherlands NLD 2.047 3.394 3.613 1.996 -4 1.3 1.6
Norway NOR 2.739 2.281 3.134 2.132 -1.4 2.4 2.6
New Zealand NZL 2.813 1.954 3.193 0.194 -1.4 2.8 3.2
Portugal PRT 0.91 1.368 1.872 -0.045 -2.8 0.6 1.2
Singapore SGP 7.307 8.352 7.766 1.149 -2 6.2 5.2 Slovak Republic SVK 6.546 8.496 10.423 6.391 -4.7 2.7 3.4
Slovenia SVN 4.349 5.903 6.765 3.541 -7.8 1 2.4
Sweden SWE 3.298 4.246 2.56 -0.155 -4.7 2.1 2.6 Taiwan Province of China TWN 4.161 4.799 5.703 0.058 -1.9 5 4.5
United States USA 3.054 2.673 2.141 0.439 -2.4 3.1 3
Simple average 3.400466667 4.078466667 4.0492 1.309366667
-3.28 1.98 2.503333333

65
MIDDLE EAST AND AFRICA Country ISO 2005 2006 2007 2008 2009 2010 2011
Egypt EGY 4.472 6.844 7.088 7.171 4.7 4.9 5.5
Saudi Arabia SAU 5.553 3.158 3.314 4.448 0.2 3.9 4.6
Nigeria NGA 5.393 6.211 6.972 5.984 5.8 5.8 6.3
South Africa ZAF 4.965 5.321 5.098 3.062 -1.8 2.8 3.6