Embed Size (px)
Citation preview
The Goals and Objectives of Project FAIL-SAFE
The addition of redundant layers of safety is a well-established practice within the safety community, and
one the National Association of State Fire Marshals (NASFM) has championed for nearly two decades. We are
reminded of the aviation industry’s duplicative efforts to guard against catastrophic failure, and the automotive
industry’s exhaustive pursuit of higher levels of safety. As buildings get larger, taller, and more complex, NASFM
remains steadfast in our pursuit to ensure buildings are designed and constructed with the same care and concern
for safety that we have come to expect from the transportation industry.
The research documents that follow have been produced under the NASFM Fire Research & Education
Foundation’s Project FAIL-SAFE. This research effort is charged with establishing valid scientific information to
serve as a baseline for understanding the effects of incorporating safety layers into the built environment. It must
be noted, clearly and distinctly, that this is not a discussion advocating one product over another, or active vs.
passive; but rather it is a discussion around safety and resiliency of the built environment. In short, FAIL-SAFE is
a research project designed to evaluate existing levels of redundancy to determine acceptable levels of safety should
any individual system within the protective envelope fail to function as designed.
Each parcel of the research effort is designed to provide information to advance the understanding of the
value of safety layers. As such, they should not be taken individually, but considered holistically with a focus of
developing a baseline of knowledge from which further discussion and research will emanate. To that end, the
NASFM Foundation commissioned an analysis of tradeoffs in the IBC based on both occupancy and building type
to provide focus for subsequent phases of the project. Utilizing the results of the analysis for clarity, the following
literature review report was completed by Worcester Polytechnic Institute (WPI). Its goal was to identify what is
known scientifically, and what is not known, about how fire protection features interact with one another to increase
safety and building resiliency.
Again, building on the direction gleaned from the code analysis and literature review, computer modeling
was designed to better understand the knowledge gaps identified by the previous work. WPI was commissioned to
continue their work by developing a fire modeling plan designed provide initial answers to the identified knowledge
gaps.
Simultaneously, we have undertaken development of the NASFM Foundation Risk Evaluation
MATRIXTM. The MATRIXTM is an on-line application that applies standing International Existing Building Code
evaluation techniques to understand the overall fire risk associated with existing buildings. Utilizing the data input
from the application, an analysis was being performed to study the impact of various fire protection features in the
building co and their resultant impact on fire risk.
Evaluating a real-world collection of building inventory from representative areas across the country, with
the academic research performed by WPI, a comprehensive picture is being developed to advance the discussion
and importance of redundant layers of safety in the built environment.
The principal membership of the National Association of State Fire Marshals (NASFM) comprises the senior
fire officials in the United States and their top deputies. The primary mission of NASFM is to protect human
life, property and the environment from fire and related hazards. A secondary mission of NASFM is to improve
the efficiency and effectiveness of State Fire Marshals' operations. Learn more about NASFM and its issues
at www.firemarshals.org.

Analysis of the
Impact of Trade-
offs of Passive and
Active Building
Safety Features
Submitted to:
National Association of State
Fire Marshals (NASFM) Fire
Research & Education
Foundation
November 2017

Analysis of the Impact of Trade-offs of Passive and Active Building Safety Features
November 2017 i
TABLE OF CONTENTS
Summary ......................................................................................................................................... 3
Background ..................................................................................................................................... 5
The International Existing Building Code .................................................................................. 5
Study Question ............................................................................................................................ 7
Data Collection ............................................................................................................................... 8
Summary of Data Collected ........................................................................................................ 8
Analysis .................................................................................................................................... 11
Findings .................................................................................................................................... 11
Further Study ............................................................................................................................ 16
Conclusions ............................................................................................................................... 16
Appendix ....................................................................................................................................... 18
Works Cited ................................................................................................................................. 22
Analysis of the Impact of Trade-offs of Passive and Active Building Safety Features
November 2017 ii
LIST OF TABLES AND FIGURES
Table 1. IEBC Safety Parameter Model ......................................................................................... 6
Table 2. Distribution by Geographic Region .................................................................................. 8
Table 3. Distribution by Building Code .......................................................................................... 9
Table 4. Distribution by Year Built ................................................................................................ 9
Table 5. Distribution by Occupancy Type ...................................................................................... 9
Table 6. Distribution by Construction Type ................................................................................. 10
Table 7. Distribution by Building Height, Stories ........................................................................ 10
Table 8. Distribution by Building Size, Square Feet .................................................................... 10
Table 9. Distribution by Sprinklers Present .................................................................................. 11
Table 10. Distribution by Alarm Installed .................................................................................... 11
Table 11. Comparison of Other Declining Safety Scores ............................................................. 13
Table 12. Comparison of Other Increasing Safety Scores ............................................................ 14
Table 13. Comparison of Aggregate Safety Scores ...................................................................... 14
Table 14. Comparison of Legacy and I-Codes Fire Safety Scores ............................................... 18
Table 15. Comparison of Legacy and I-Codes Means of Egress Safety Scores ........................... 20
Table 16. Comparison of Legacy and I-Codes General Safety Scores ......................................... 21
Figure 1. Comparison of Means of Egress Capacity .................................................................... 12
Figure 2. Comparison of Standpipes ............................................................................................. 13
Figure 3. Comparison of Fire Safety Scores by Code Class ......................................................... 15
Figure 4. Comparison of Means of Egress Scores by Code Class ................................................ 15
Figure 5. Comparison of General Safety Scores by Code Class................................................... 16
Analysis of the Impact of Trade-offs of Passive and Active Building Safety Features
November 2017 3
SUMMARY
The NASFM Foundation Risk Evaluation MATRIXTM tool is a significant aid in the
measurement of building safety parameters and provides a foundation for the collection and
analysis of the evolution of the building code and its impact on occupant and building safety.
The MATRIXTM uses the specifications as detailed in Chapter 14 of the 2015 Edition of the
International Existing Building Code (IEBC) to assess a building’s fire and life safety risk.
Within the IEBC, Chapter 14 Performance Compliance Methods details how evaluations are
based on a numerical scoring system which encompasses twenty-three separate safety
parameters. Additionally, Chapter 14 details how these safety parameters can be combined into
three aggregate safety metrics: fire safety, means of egress, and general safety.
Prior to 2000, there were several independent code systems. These independent codes,
commonly referred to as the Legacy Codes, were synthesized into the single comprehensive code
system known as the International Codes (I-Codes). The I-Codes were first published in 2000.
One aspect of the I-Code development was the incorporation of many trade-offs from the three
Legacy Codes. A trade-off is an exchange of one item in return for another, especially in the
exchanging of one benefit or advantage for another regarded as more desirable. In modern
buildings, the concept of allowing trade-offs of built-in protection in exchange for the installation
of properly designed, installed, and maintained fire sprinkler systems is a customary practice.
The question addressed by this analysis therefore is: Has the adoption of various trade-offs had
an impact on the overall safety of the building inventory?
From the current sample, the adoption of the I-Codes appears to have had a statistically
significant impact to two individual safety parameters of buildings built post adoption of the I-
Codes. Specifically, means of egress capacity individual safety scores increased and the
standpipe individual safety score decreased.
For reference, a decreased safety score, whether for an individual parameter or overall, is
indicative of increased risk as quantified within the I-Codes. Likewise, an increased safety score
is indicative of decreased risk. Further explanation of the risk evaluation process is explained
later in this report.
It should be noted however, that despite various individual safety parameters displaying either
increased or decreased safety scores, all three aggregate building safety scores – fire safety,
means of egress, and general safety – have decreased after the adoption of the I-Codes. With
additional data, it may be possible to further determine if this decline was statistically significant
and the root causes of these decreases.

Analysis of the Impact of Trade-offs of Passive and Active Building Safety Features
November 2017 4
Additionally, there were changes in other safety parameters that indicate a shift of structural
trade-offs with the adoption of the I-Codes. For example, the trade-offs of the decline of passive
building features such as compartmentation, tenant / dwelling separation, and travel distances
compared with the increased reliance of active building features such as automatic fire detection,
fire alarm systems, and automatic sprinklers.
It should also be noted that the initial findings described herein may change as additional data is
collected.

Analysis of the Impact of Trade-offs of Passive and Active Building Safety Features
November 2017 5
BACKGROUND
The International Existing Building Code
The International Codes (I-Codes), developed by the International Code Council (ICC), provide
a comprehensive family of codes that are used in the design, build, and compliance processes of
building construction. While they are not the sole codes and standards available to guide building
construction, the comprehensive nature of the I-Codes provides guidance on the minimum
safeguards needed to protect the public in their homes, schools, and places of work.
Prior to the first edition of the I-Codes in 2000, there were several independent code systems.
These independent codes, commonly referred to as the Legacy Codes, included the Building
Officials and Code Administrators, International (BOCA); the International Conference of
Building Officials – Uniform Building Code (UBC); and the Southern Building Code Congress,
International (SBCCI). In creating the I-Codes, these Legacy Code systems were synthesized
into a single comprehensive code.
Specifically, the ICC’s International Existing Building Code (IEBC) contains the code
requirements for the alteration, repair, addition, and change of occupancy of existing structures,
including historic and moved structures. Within the IEBC, Chapter 14 Performance Compliance
Methods details how evaluations are based on a numerical scoring system, established through
the consensus process, which encompasses twenty-three separate safety parameters.
Additionally, Chapter 14 details how these safety parameters can be combined into three
aggregate safety metrics: fire safety, means of egress, and general safety. The degree of
compliance is based on a minimum compliance threshold, based on the occupancy type of the
building. The I-Codes standards evolve over time to incorporate new knowledge and allow trade-
offs between various active and passive safety features within a building. Chapter 14 of the IEBC
provides a basis for evaluating the various safety features within a building and the degree to
which those safety features may have been affected.
The IEBC aggregation of the individual safety parameters into the broader metrics of fire safety,
means of egress, and general safety is detailed in Table 1, IEBC Safety Parameter Model.

Analysis of the Impact of Trade-offs of Passive and Active Building Safety Features
November 2017 6
Table 1. IEBC Safety Parameter Model
IEBC Code Section Safety Parameter Fire Safety
(FS)
Means of Egress (ME)
General Safety (GS)
1401.6.1 Building Height
1401.6.2 Building Area
1401.6.3 Compartmentation
1401.6.4 Tenant and Dwelling Unit Separations
1401.6.5 Corridor Walls
1401.6.6 Vertical Openings
1401.6.7 HVAC Systems
1401.6.8 Automatic Fire Detection
1401.6.9 Fire Alarm Systems
1401.6.10 Smoke Control NA
1401.6.11 Means of Egress Capacity NA
1401.6.12 Dead Ends NA
1401.6.13 Maximum Exit Access Travel Distance NA
1401.6.14 Elevator Control
1401.6.15 Means of Egress Emergency Lighting NA
1401.6.16 Mixed Occupancies NA
1401.6.17 Automatic Sprinklers
1401.6.18 Standpipes
1401.6.19 Incidental Uses
1401.6.20 Smoke Compartmentation
1401.6.21.1 Patient Ability for Self-preservation NA
1401.6.21.2 Patient Concentration NA
1401.6.21.3 Attendant-to-patient Ratio NA
Total Building Score
One aspect of the I-Code development was the incorporation of trade-offs from the three Legacy
Codes. While the concept of trade-offs is not new, a recent study by Dempsey et al notes they
were first introduced in fire protection engineering in the groundbreaking report America
Burning. (Dembsey, Meacham, & Wang, p. 8) America Burning recognized the concept of

Analysis of the Impact of Trade-offs of Passive and Active Building Safety Features
November 2017 7
reducing the requirements of other fire protection features in exchange for the installation of
automatic fire sprinkler systems. (The National Commission on Fire Prevention and Control,
1973, p. 73) In modern buildings, the concept of allowing trade-offs in exchange for the
installation of properly designed, installed, and maintained fire sprinkler systems is a customary
practice.
While the concept of trade-offs was present in the Legacy Codes, the emergence of the I-Codes
accentuated trade-offs between various active and passive safety features within a building.
The results of these trade-offs can be seen in impacts to the various aspects of the greater fire
problem including building resiliency and the health and safety of building occupants and
firefighters who respond to incidents in these buildings. There is little real-world knowledge of
how those trade-offs perform once built, however, and there is much debate about the efficacy of
the trade-offs. Dembsey et al has summarized the debate as:
• Sprinkler systems effectiveness is widely accepted by both opponents and proponents
• Most, if not all, trade-off opponents advocate a balanced fire protection system
including both sprinklers and passive fire protection approaches
• Most, if not all, trade-off proponents believe sprinklers deserve more trade-offs in
passive fire protection approaches
• Both the opponents and proponents failed to persuade the other side by demonstrating
necessary proofs that are reasonable, scientific, and quantitative
• Sprinklers are effective in protecting both life safety and property
• Without deeper research that could provide enough scientific and quantitative proof
for each side, this kind of debate will continue in the future. (Dembsey, Meacham, &
Wang, pp. 9-10)
Specifically, the underlying question that remains to be answered is how the trade-offs between
active and passive safety features impact the resiliency of building, the safety of the occupants,
and the health and safety of firefighters who respond to incidents in these buildings.
Study Question
Chapter 14 of the IEBC provides a basis for evaluating the various safety features within a
building and the degree to which trade-offs have been used. It is thus possible to directly score
the active and passive safety features of a building and to analyze the impact to building risk and
safety subsequent to the adoption of the I-Codes.
The question addressed by this analysis therefore is: Has the adoption of various trade-offs had
an impact on the overall safety of the building inventory?
Analysis of the Impact of Trade-offs of Passive and Active Building Safety Features
November 2017 8
DATA COLLECTION
Fire department partners were engaged to use the MATRIXTM to collect building characteristics
including, but not limited to, building dimensions, occupancy type, construction type, systems,
and means of egress. Additionally, the department partners collected the building code under
which the building was permitted.
The MATRIXTM is a fire risk indexing tool for fire departments and others to use in determining
the fire and life safety risk of a building. The MATRIXTM uses the specifications as detailed in
Chapter 14 of the 2015 Edition of the IEBC to assess a building’s fire and life safety risk. The
specifications consist of a series of equations, parameters, conversion tables, and cross-
references. The necessary calculations to determine compliance, though, are complex, detailed,
and time-consuming. The MATRIXTM simplifies these calculations by providing an online
questionnaire for fire and building inspectors to collect the necessary inputs and determine the
building’s overall safety scores. In addition to the three aggregate metrics outlined in Chapter 14,
the twenty-three intermediate safety parameter scores are calculated and are included as part of
the MATRIXTM output.
The MATRIXTM output facilitates the analysis of the individual and aggregate safety metrics by
eliminating the calculation overhead and streamlining the collection of building characteristics.
We found the MATRIXTM output to be essential for the analyses of building trade-offs.
Summary of Data Collected
Participating fire departments collected a wide variety of buildings across multiple areas of the
United States, built under multiple building codes, age constructed, occupancy type, construction
type, height, and size. Additionally, the buildings collected included a variety of active building
protection features. Tables two through ten below detail how the collected data is dispersed
within each of the categories identified in the MATRIXTM.
While the total data collected during the trial was limited, we do not believe that there is inherent
bias in the data set for further analysis.
Table 2. Distribution by Geographic Region
Region Percent
Mid-Atlantic 21.9%
Mid-West 59.4%
New England 9.4%
South 9.4%
Total 100.0%

Analysis of the Impact of Trade-offs of Passive and Active Building Safety Features
November 2017 9
Table 3. Distribution by Building Code
Code Percent
BOCA 12.5%
SBCCI 0.0%
UBC 6.3%
Other 46.9%
I-Codes 2003 12.5%
I-Codes 2006 12.5%
I-Codes 2009 3.1%
I-Codes 2012 6.3%
Total 100.0%
Table 4. Distribution by Year Built
Year Built Percent
Prior to 1950 21.9%
1950s 6.3%
1960s 12.5%
1970s 9.4%
1980s 9.4%
1990s 9.4%
2000s 21.9%
2010s 9.4%
Total 100.0%
Table 5. Distribution by Occupancy Type
Occupancy Type Percent
A2 3.1%
A3 3.1%
B 18.8%
E 15.6%
M 31.3%
R2 28.1%
Total 100.0%
Analysis of the Impact of Trade-offs of Passive and Active Building Safety Features
November 2017 10
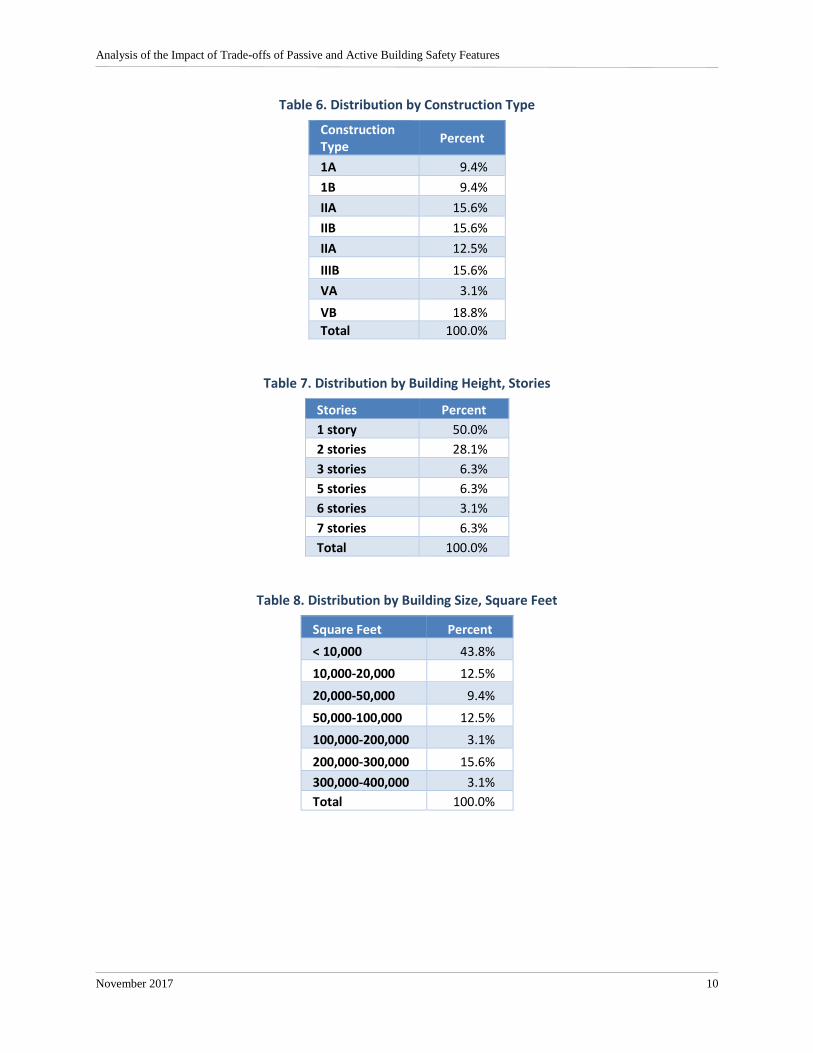
Table 6. Distribution by Construction Type
Construction Type
Percent
1A 9.4%
1B 9.4%
IIA 15.6%
IIB 15.6%
IIA 12.5%
IIIB 15.6%
VA 3.1%
VB 18.8%
Total 100.0%
Table 7. Distribution by Building Height, Stories
Stories Percent
1 story 50.0%
2 stories 28.1%
3 stories 6.3%
5 stories 6.3%
6 stories 3.1%
7 stories 6.3%
Total 100.0%
Table 8. Distribution by Building Size, Square Feet
Square Feet Percent
< 10,000 43.8%
10,000-20,000 12.5%
20,000-50,000 9.4%
50,000-100,000 12.5%
100,000-200,000 3.1%
200,000-300,000 15.6%
300,000-400,000 3.1%
Total 100.0%
Analysis of the Impact of Trade-offs of Passive and Active Building Safety Features
November 2017 11
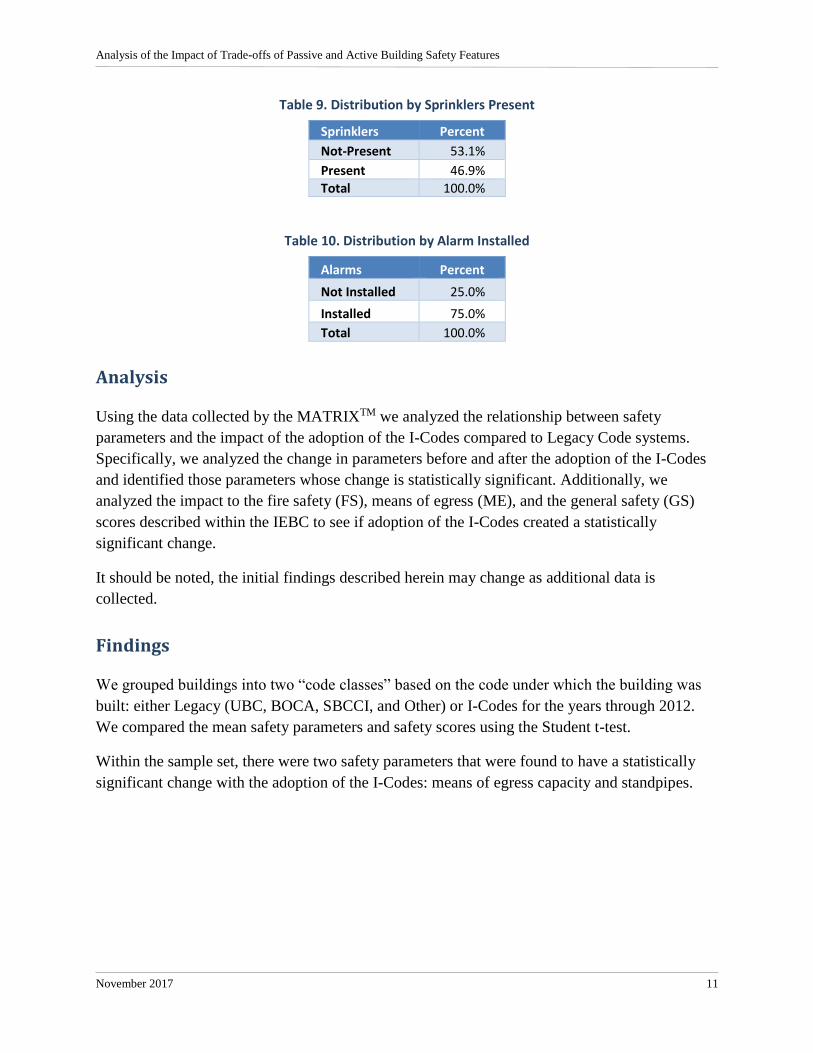
Table 9. Distribution by Sprinklers Present
Sprinklers Percent
Not-Present 53.1%
Present 46.9%
Total 100.0%
Table 10. Distribution by Alarm Installed
Alarms Percent
Not Installed 25.0%
Installed 75.0%
Total 100.0%
Analysis
Using the data collected by the MATRIXTM we analyzed the relationship between safety
parameters and the impact of the adoption of the I-Codes compared to Legacy Code systems.
Specifically, we analyzed the change in parameters before and after the adoption of the I-Codes
and identified those parameters whose change is statistically significant. Additionally, we
analyzed the impact to the fire safety (FS), means of egress (ME), and the general safety (GS)
scores described within the IEBC to see if adoption of the I-Codes created a statistically
significant change.
It should be noted, the initial findings described herein may change as additional data is
collected.
Findings
We grouped buildings into two “code classes” based on the code under which the building was
built: either Legacy (UBC, BOCA, SBCCI, and Other) or I-Codes for the years through 2012.
We compared the mean safety parameters and safety scores using the Student t-test.
Within the sample set, there were two safety parameters that were found to have a statistically
significant change with the adoption of the I-Codes: means of egress capacity and standpipes.
Analysis of the Impact of Trade-offs of Passive and Active Building Safety Features
November 2017 12
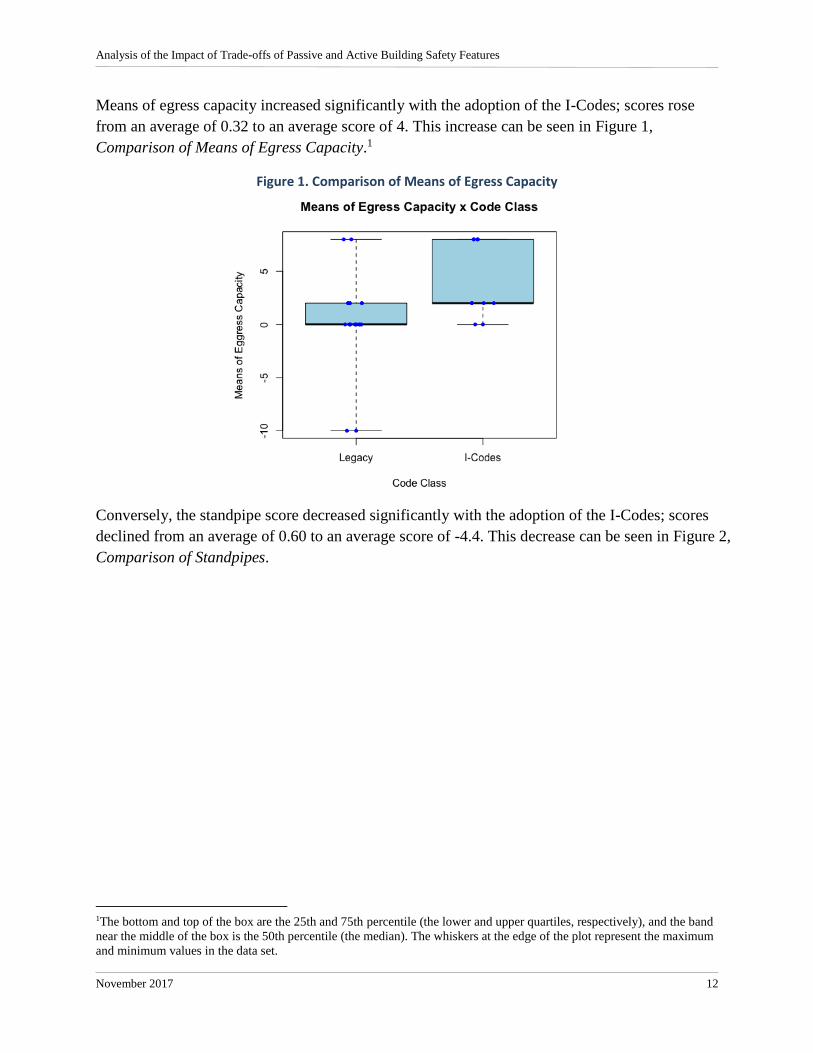
Means of egress capacity increased significantly with the adoption of the I-Codes; scores rose
from an average of 0.32 to an average score of 4. This increase can be seen in Figure 1,
Comparison of Means of Egress Capacity.1
Figure 1. Comparison of Means of Egress Capacity
Conversely, the standpipe score decreased significantly with the adoption of the I-Codes; scores
declined from an average of 0.60 to an average score of -4.4. This decrease can be seen in Figure 2,
Comparison of Standpipes.
1The bottom and top of the box are the 25th and 75th percentile (the lower and upper quartiles, respectively), and the band
near the middle of the box is the 50th percentile (the median). The whiskers at the edge of the plot represent the maximum
and minimum values in the data set.

Analysis of the Impact of Trade-offs of Passive and Active Building Safety Features
November 2017 13
Figure 2. Comparison of Standpipes
While not found to be statistically significant, it is notable that there were several other safety
parameters that declined by appreciable amounts with the adoption of the I-Codes. Additional
data may help further clarify if these declines are statistically significant. These declines are
further detailed in Table 11, Comparison of Other Declining Safety Scores.
Table 11. Comparison of Other Declining Safety Scores
Safety Score Average
Legacy Codes Average I-Codes
Percent Change
Building Area 9.70 -3.20 -132.8%
Compartmentation 12.40 11.40 -8.1%
Tenant and Dwelling Unit Separations 0.23 0.18 -20.0%
Smoke Control 2.60 1.70 -34.5%
Maximum Exit Access Travel Distance 11.60 8.10 -30.1%
Additionally, there were several other safety parameters that increased by appreciable amounts
with the adoption of the I-Codes. These were not found to be statistically significant, but
additional data may help further clarify this observation. These increases are further detailed in
Table 12, Comparison of Other Increasing Safety Scores.

Analysis of the Impact of Trade-offs of Passive and Active Building Safety Features
November 2017 14
Table 12. Comparison of Other Increasing Safety Scores
Safety Score Average
Legacy Codes Average I-Codes
Percent Change
Building Height 1.65 2.55 54.7%
Corridor Walls -0.50 0.00 100.0%
Automatic Fire Detection -5.23 -1.45 72.2%
Fire Alarm Systems 0.86 4.91 468.4%
Elevator Control -0.13 2.00 1700.0%
Means of Egress Control Lighting 1.36 2.27 66.7%
Automatic Sprinklers -0.18 2.91 1700.0%
The contrast of these increases and decreases are indications of the changes in structural
tradeoffs with the adoption of the I-codes. In particular, the tradeoffs illustrate the decline of
passive building features such as compartmentation, tenant / dwelling separation, and travel
distances compared with the increased reliance of active building features such as automatic fire
detection, fire alarm systems, and automatic sprinklers.
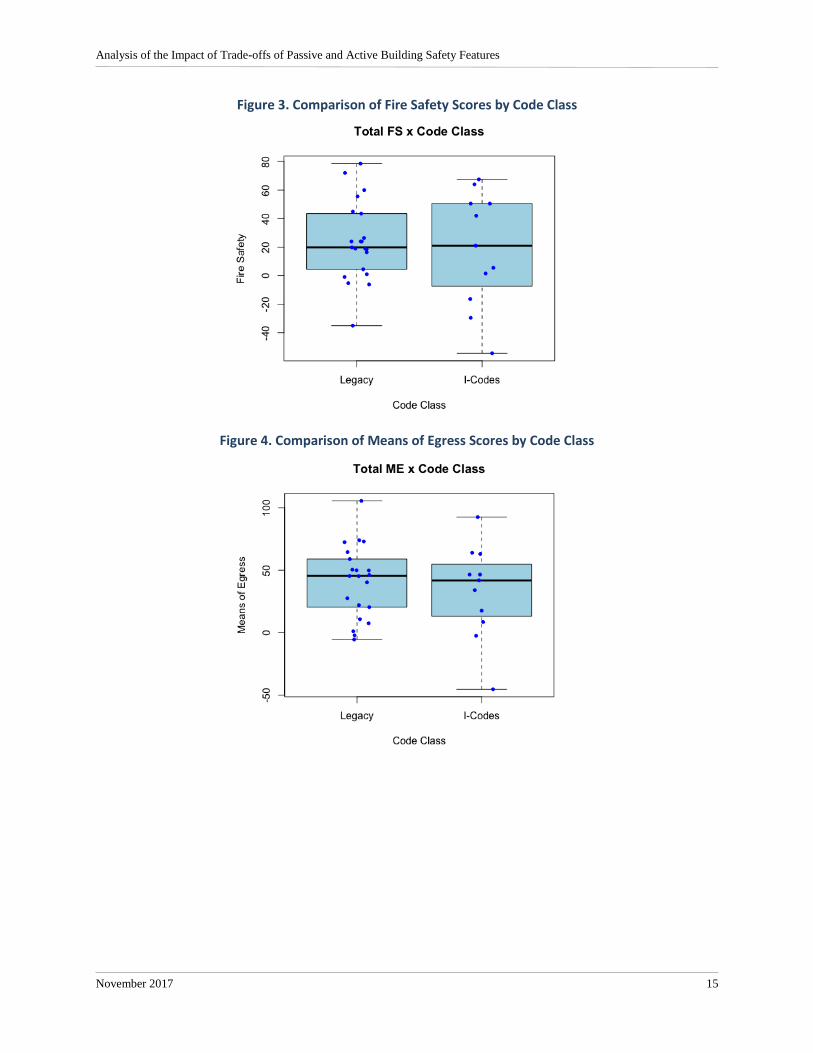
Finally, while not found to be statistically significant, it is notable that all aggregate safety scores
declined by appreciable amounts with the adoption of the I-Codes. Average fire safety scores
decreased by 23.4%, average means of egress scores decreased by 18.4%, and general safety
scores decreased by 13.2%. These declines are further detailed in Table 13, Comparison of
Aggregate Safety Scores; Figure 3, Comparison of Fire Safety Scores by Code Class; Figure 4,
Comparison of Means of Egress Scores by Code Class; and Figure 5, Comparison of General
Safety Scores by Code Class.
Table 13. Comparison of Aggregate Safety Scores
Safety Score Average
Legacy Codes Average I-Codes
Percent Change
Fire Safety (FS) 23.98 18.34 -23.4%
Means of Egress (ME) 40.81 33.32 -18.4%
General Safety (GS) 41.62 36.13 -13.2%
Analysis of the Impact of Trade-offs of Passive and Active Building Safety Features
November 2017 15
Figure 3. Comparison of Fire Safety Scores by Code Class
Figure 4. Comparison of Means of Egress Scores by Code Class

Analysis of the Impact of Trade-offs of Passive and Active Building Safety Features
November 2017 16
Figure 5. Comparison of General Safety Scores by Code Class
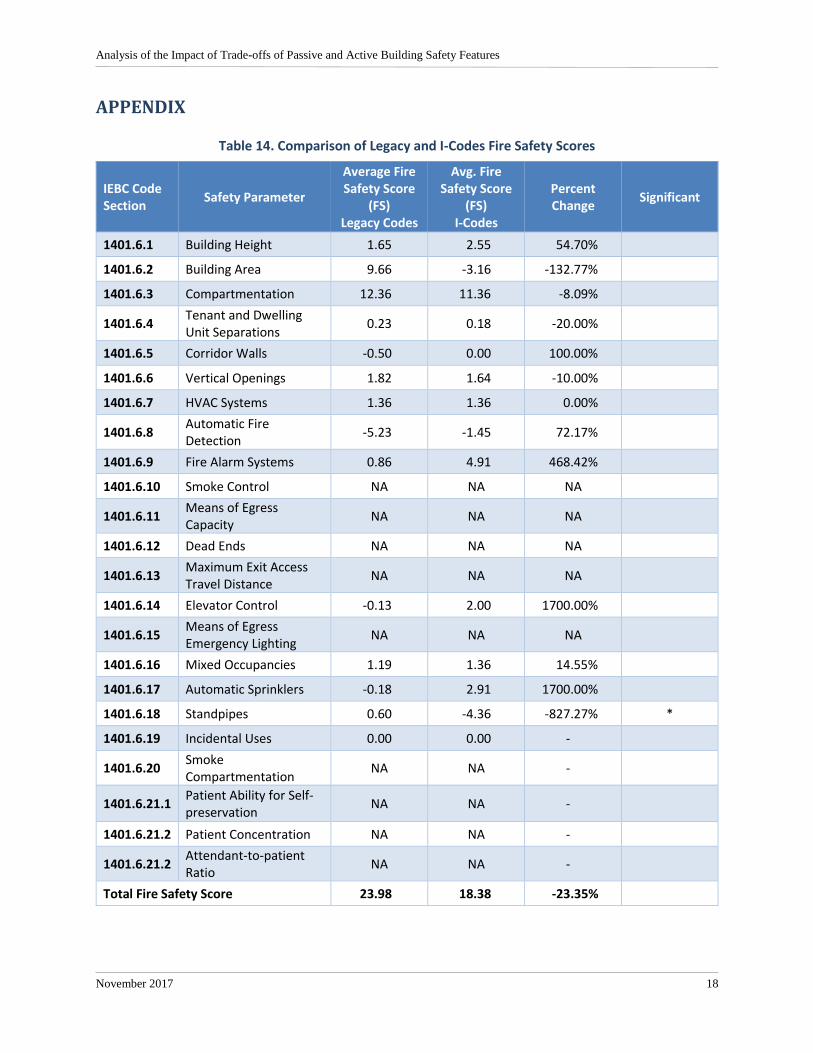
A complete description of each of the safety parameters and their impact on the aggregate safety
scores can be seen in the Appendix in Table 14, Comparison of Legacy and I-Codes Fire Safety
Scores; Table 15, Comparison of Legacy and I-Codes Means of Egress Safety Scores; and Table 16,
Comparison of Legacy and I-Codes General Safety Scores.
Further Study
Additional data would allow for the isolation of specific variables and their influence on
population data as well as more in-depth analysis of the impacts of specific code changes on
building safety scores. In particular, occupancy type has a disproportionate effect on the
calculation of safety parameters as well as a minimum passing score. Additional data would
allow for isolation of the effects of code changes within a given occupancy type.
A larger data set would also allow a more detailed analysis of safety features tradeoffs. This
tradeoff analysis could be conducted by comparing, for example, the relative scores of passive
and active features as a percentage of the building safety score over time. This analysis could
highlight the balance of active and passive features and their evolution with different updates of
the IEBC standards.
Conclusions
Based on the initial data sample, as previously detailed in the Summary of Data Collected, the
adoption of the I-Codes does appear to have had a statistically significant impact to the safety
parameters of buildings built post adoption of the code. In particular, means of egress capacity
safety scores increased and the standpipe safety score decreased.

Analysis of the Impact of Trade-offs of Passive and Active Building Safety Features
November 2017 17
Additionally, there were notable changes in other safety parameters that indicate a shift of
structural tradeoffs with the adoption of the I-Codes. In particular, the tradeoffs of the decline of
passive building features such as compartmentation, tenant / dwelling separation, and travel
distances compared with the increased reliance of active building features such as automatic fire
detection, fire alarm systems, and automatic sprinklers. More data is required to determine which
of these changes are statistically significant.
All the aggregate building safety scores – fire safety, means of egress, and general safety –
decreased with the adoption of the I-Codes. With further data, it may be possible to further
determine if this decline was statistically significant and the root causes of these decreases.
Additional data would also allow for better isolation of specific variables, such as occupancy
type, on the overall population scores.
Finally, the NASFM Foundation Risk Evaluation MATRIXTM tool is a significant aid in the
measurement of building safety parameters and provides a foundation for the collection and
analysis of the evolution of the building code and its impact on occupant and building safety.
Analysis of the Impact of Trade-offs of Passive and Active Building Safety Features
November 2017 18
APPENDIX
Table 14. Comparison of Legacy and I-Codes Fire Safety Scores
IEBC Code Section
Safety Parameter
Average Fire Safety Score
(FS) Legacy Codes
Avg. Fire Safety Score
(FS) I-Codes
Percent Change
Significant
1401.6.1 Building Height 1.65 2.55 54.70%
1401.6.2 Building Area 9.66 -3.16 -132.77%
1401.6.3 Compartmentation 12.36 11.36 -8.09%
1401.6.4 Tenant and Dwelling Unit Separations
0.23 0.18 -20.00%
1401.6.5 Corridor Walls -0.50 0.00 100.00%
1401.6.6 Vertical Openings 1.82 1.64 -10.00%
1401.6.7 HVAC Systems 1.36 1.36 0.00%
1401.6.8 Automatic Fire Detection
-5.23 -1.45 72.17%
1401.6.9 Fire Alarm Systems 0.86 4.91 468.42%
1401.6.10 Smoke Control NA NA NA
1401.6.11 Means of Egress Capacity
NA NA NA
1401.6.12 Dead Ends NA NA NA
1401.6.13 Maximum Exit Access Travel Distance
NA NA NA
1401.6.14 Elevator Control -0.13 2.00 1700.00%
1401.6.15 Means of Egress Emergency Lighting
NA NA NA
1401.6.16 Mixed Occupancies 1.19 1.36 14.55%
1401.6.17 Automatic Sprinklers -0.18 2.91 1700.00%
1401.6.18 Standpipes 0.60 -4.36 -827.27% *
1401.6.19 Incidental Uses 0.00 0.00 -
1401.6.20 Smoke Compartmentation
NA NA -
1401.6.21.1 Patient Ability for Self-preservation
NA NA -
1401.6.21.2 Patient Concentration NA NA -
1401.6.21.2 Attendant-to-patient Ratio
NA NA -
Total Fire Safety Score 23.98 18.38 -23.35%
Analysis of the Impact of Trade-offs of Passive and Active Building Safety Features
November 2017 19

Analysis of the Impact of Trade-offs of Passive and Active Building Safety Features
November 2017 20
Table 15. Comparison of Legacy and I-Codes Means of Egress Safety Scores
IEBC Code Section
Safety Parameter
Avg. Means of Egress
Score (ME) Legacy Codes
Avg. Means of Egress
Score (ME) I-Codes
Percent Change
Significant
1401.6.1 Building Height 1.65 2.55 54.70%
1401.6.2 Building Area 9.66 -3.16 -132.77%
1401.6.3 Compartmentation 12.36 11.36 -8.09%
1401.6.4 Tenant and Dwelling Unit Separations
0.23 0.18 -20.00%
1401.6.5 Corridor Walls -0.50 0.00 100.00%
1401.6.6 Vertical Openings 1.82 1.64 -10.00%
1401.6.7 HVAC Systems 1.36 1.36 0.00%
1401.6.8 Automatic Fire Detection
-5.23 -1.45 72.17%
1401.6.9 Fire Alarm Systems 0.86 4.91 468.42%
1401.6.10 Smoke Control 2.64 1.73 -34.48%
1401.6.11 Means of Egress Capacity
0.32 4.00 1166.67% *
1401.6.12 Dead Ends 2.00 2.00 0.00%
1401.6.13 Maximum Exit Access Travel Distance
11.61 8.12 -30.08%
1401.6.14 Elevator Control -0.13 2.00 1700.00%
1401.6.15 Means of Egress Emergency Lighting
1.36 2.27 66.67%
1401.6.16 Mixed Occupancies NA NA -
1401.6.17 Automatic Sprinklers -0.09 1.46 1700.00%
1401.6.18 Standpipes 0.60 -4.36 -827.27% *
1401.6.19 Incidental Uses 0.00 0.00 -
1401.6.20 Smoke Compartmentation
- - -
1401.6.21.1 Patient Ability for Self-preservation
- - -
1401.6.21.2 Patient Concentration - - -
1401.6.21.2 Attendant-to-patient Ratio
- - -
Total Means of Egress Safety Score 40.82 33.32 -18.36%

Analysis of the Impact of Trade-offs of Passive and Active Building Safety Features
November 2017 21
Table 16. Comparison of Legacy and I-Codes General Safety Scores
IEBC Code Section
Safety Parameter Avg. General Safety (GS)
Legacy Codes
Avg. General Safety(GS)
I-Codes
Percent Change
Significant
1401.6.1 Building Height 1.65 2.55 54.70%
1401.6.2 Building Area 9.66 -3.16 -132.77%
1401.6.3 Compartmentation 12.36 11.36 -8.09%
1401.6.4 Tenant and Dwelling Unit Separations
0.23 0.18 -20.00%
1401.6.5 Corridor Walls -0.50 0.00 100.00%
1401.6.6 Vertical Openings 1.82 1.64 -10.00%
1401.6.7 HVAC Systems 1.36 1.36 0.00%
1401.6.8 Automatic Fire Detection
-5.23 -1.45 72.17%
1401.6.9 Fire Alarm Systems 0.86 4.91 468.42%
1401.6.10 Smoke Control 2.64 1.73 -34.48%
1401.6.11 Means of Egress Capacity
0.32 4.00 1166.67% *
1401.6.12 Dead Ends 2.00 2.00 0.00%
1401.6.13 Maximum Exit Access Travel Distance
11.61 8.12 -30.08%
1401.6.14 Elevator Control -0.13 2.00 1700.00%
1401.6.15 Means of Egress Emergency Lighting
1.36 2.27 66.67%
1401.6.16 Mixed Occupancies 1.19 1.36 14.55%
1401.6.17 Automatic Sprinklers -0.18 2.91 1700.00%
1401.6.18 Standpipes 0.60 -4.36 -827.27% *
1401.6.19 Incidental Uses 0.00 0.00 -
1401.6.20 Smoke Compartmentation
- - -
1401.6.21.1 Patient Ability for Self-preservation
- - -
1401.6.21.2 Patient Concentration - - -
1401.6.21.2 Attendant-to-patient Ratio
- - -
Total General Safety Score 41.62 36.14 -13.19%

Analysis of the Impact of Trade-offs of Passive and Active Building Safety Features
November 2017 22
WORKS CITED
Dembsey, N., Meacham, B., & Wang, H. (n.d.). A Literature Review of Sprinkler Trade-offs.
Worcester Polytechnic Institute, Fire Protection Engineering.
The National Commission on Fire Prevention and Control. (1973). America Burning.
Washington, DC.