Embed Size (px)
Citation preview

Journal of Personality and Social Psychology Copyright 1996 by the American Psychological Association, Inc, 1996, Vol. 7 I, No. 3, 431-449 0022-3514/96/$3.00
The Gradual Threshold Model of Ambivalence: Relating the Positive and Negative Bases of Attitudes to Subjective Ambivalence
Joseph R. Priester University of Michigan
Richard E. Petty Ohio State University
This research examined the relationship between the measured (Study 1 ) and manipulated (Studies 2 and 3) positive and negative bases of attitudes and the psychological experience of attitudinal ambivalence. On the basis of these studies, the gradual threshold model of ambivalence (GTM) was advanced. The GTM holds that: (a) ambivalence increases in a negatively accelerating manner as the number of conflicting reactions (whichever of the positive or negative reactions are fewer in number) increases, (b) ambivalence is a negative function of the extent of dominant reactions, and (c) as the number of conflicting reactions increases, the impact of dominant reactions on ambiva- lence gradually decreases such that at some level of conflicting reactions (i.e., the threshold), the number of dominant reactions no longer has an impact on subjective ambivalence.
To be, or not to be, that is the question . . . . To die, to sleep no more, and by a sleep to say we end the heart-ache and the thousand natural shocks that flesh is heir to: "tis a consummation devoutly to be wish'd. To die, to sleep---to sleep, perchance to dream--ay, there's the rub, for in that sleep of death what dreams may come, when we have shuffled offthis mortal coil, must give us pause . . . . But that the dread of something after death, the undiscover'd country, from whose bourn no traveller returns, puzzles the will, and makes us rather bear those ills we have, than fly to others that we know not of.
--Shakespeare, Hamlet
Since the seminal work o f Thurstone (1928; Thurstone & Chave, 1929), researchers have typically conceptualized and measured attitudes as lying along a bipolar cont inuum ranging from negative to positive, with neutral located in between (see Eagly & Chaiken, 1993; Petty, Priester, & Wegener, 1994, for
This article is based on a doctoral dissertation submitted to the Ohio State University Graduate School by Joseph R. Priester under the direc- tion of Richard E. Petty. We thank dissertation committee members John T. Cacioppo and Jon A. Krosnick and members of the 1991-1994 Groups for Attitudes and Persuasion at Ohio State University for their helpful comments. We also thank Michael Browne, Glen Hass, Robert MacCallum, and Mark Zanna for their helpful comments. Portions of this research were presented at the 100th ( 1992, Washington, DIS) and 101st ( 1993, Toronto) Annual Conventions of the American Psychologi- cal Association, and the 1993 (Chicago) meeting of the Midwestern Psy- chological Association. This research was supported by National Insti- tute of Mental Health traineeship T32 MH 19728 and a Graduate Stu- dent Alumni Research Award to Joseph R. Priester and National Science Foundation Grants BNS 9021647 and SBR 9520854 to Richard E. Petty.
Correspondence concerning this article should be addressed either to Joseph R. Priester, School of Business Administration, University of Michigan, 701 Tappan Street, Ann Arbor, Michigan 48109-1234; or to Richard E. Petty, Department of Psychology, Ohio State University, 1885 Nell Avenue Mall, Columbus, Ohio 43210-1222. Electronic mail may be sent via the lnternet to [email protected] or to petty, l @osu.edu.
431
reviews). This perspective allows one to assess the degree to which an attitude is relatively more or less favorable toward an attitude object, As the above passage suggests, however, attitudes can sometimes possess both positive and negative features: Hamle t both longs for and at the same t ime fears his own death. Clearly, a "neu t ra l " or "slightly positive" response from Hamle t toward suicide on a traditional bipolar attitude scale would lose a great deal of information concerning the conflict and indeci- sion underlying his overall attitude.
At surprisingly regular intervals, researchers have argued for and presented data supportive of an indifference-ambivalence attitudinal dimension that assumes that attitudes are based on separate positive and negative components (e.g., Breckler, 1994; Cacioppo & Berntson, 1994; Chein, 1951; Edwards, 1946; Green & Goldfried, 1965; Kaplan, 1972; Katz, Wackenhut, & Hass, 1986; Klopfer & Madden, 1980; Scott, 1966, 1969; Thompson, Zanna, & Griffin, 1995; Zanna & Thompson, 1991 ). Investigators have also provided data supporting differ- ential attitude consequences as a function of ambivalence. For example, increased attitude ambivalence has been associated with attenuated at t i tude-behavioral intention consistency (Moore, 1973) and decreased attitude accessibility (Bargh, Chaiken, Govender, & Pratto, 1992; see also Costello, Rice, & Schoenfeid, 1974; Gilmore, 1982; Komori ta & Bass, 1967; Tourangeau, Rasinski, Bradburn, & D'Andrade , 1989). When researchers have used the concept of attitude ambivalence, they have generally adopted one of two approaches to assessing it. One approach is to assess the subjective perception of ambiva- lence directly by asking individuals, for example, whether their attitudes are one-sided or mixed toward an attitude object (e.g., Tourangeau et al., 1989). Another approach is to measure the positive and negative reactions that an individual holds toward some attitude object and then use one of several previously pro- posed mathematical models of ambivalence to combine the positive and negative reactions into an ambivalence index (e.g., Hass, Katz, Rizzo, Bailey, & Eisenstadt, 1991 ). Researchers of- ten use the first approach without examining whether the sub- jectively reported ambivalence is associated with actual conflict

432 PRIESTER AND PETTY
among the positive and negative components of attitudes. Sim- ilarly, the second approach is typically adopted without an ex- amination of that particular model's accuracy in predicting the subjective experience of ambivalence.
The present research was designed to examine the relation- ships between the positive and negative reactions people possess toward attitude objects and their subjective feelings of ambiva- lence. That is, the current research examines the link between what might be called objective and subjective indicators of am- bivalence (cf. Hass, Eisenstadt, Katz, & Chaudhary, 1996). An objective approach to assessing ambivalence considers the num- ber of positive and negative reactions that an individual holds toward an attitude object and how these are combined to reflect the level of ambivalence. In contrast, a subjective approach to assessing ambivalence considers the individual feelings of con- flict that a person experiences when an attitude object is consid- ered. In Experiment 1 we examined the link between objective and subjective indicators of ambivalence in a correlational de- sign. In Experiments 2 and 3 we examined this relationship in an experimental design in which the positive and negative attri- butes were manipulated rather than measured.l
Previously Proposed Models of Objective Ambiva lence
At least five models of how to combine the positive and nega- tive bases of attitudes to form an "objective" ambivalence index have been offered. Each of the models assumes that subjective ambivalence is a psychological state of conflict associated with an attitude object. The goal of these models is to make an infer- ence about the level of the underlying psychological state of am- bivalence associated with a specific attitude by assessing ante- cedent feelings of positivity and negativity associated with the attitude object. All of the models use some measure of positive and negative thoughts and feelings (henceforth referred to as reactions) toward an object to arrive at an index of predicted ambivalence. For reasons of parsimony, these positive and neg- ative reactions can be (and have been, see J. S. Brown & Farber, 1951; French, 1944; Scott, 1969) alternatively conceptualized in terms of their relative magnitude in relation to each other, without respect to valence. For example, a person with five pos- itive and two negative reactions to an object can be viewed as possessing five dominant and two conflicting reactions. In the present research we adopt this relative terminology: Whichever of the positive or negative reactions is greater in number is re- ferred to as the dominant reaction, and whichever is less in num- ber is referred to as the conflicting reaction. We next describe the five previously proposed models of ambivalence.
Conflicting Reactions Model
In perhaps the most widely used model of ambivalence, Kaplan (1972) proposed that the degree of ambivalence is a function of the "total affect" toward an object (the sum of pos- itive and negative reactions) minus the "polarity" toward the object (the absolute value of the positive minus negative reactions). Replacing the positive and negative reactions in this model with equivalent dominant and conflicting reactions, Kaplan's model (i.e., [dominant + conflicting] - [dominant - conflicting]) reduces to the quantity 2 times the number of
conflicting reactions. More simply, Kaplan's ambivalence index reduces to a formula we refer to as the conflicting reactions model (CRM), in which A represents the amount of ambiva- lence elicited by an attitude object and C the number of con- flicting reactions to that attitude object:
A = F(C) .
This CRM is graphed in Panel A of Figure 1. Inspection of the panel reinforces two properties that are important to the model. First, the number of dominant reactions has no influ- ence on the amount of ambivalence elicited by an object. Sec- ond, ambivalence increases at a constant (i.e., linear) rate as the number of conflicting reactions increases.
Positive Acceleration Model
J. S. Brown and Farber ( 1951 ) used Hull's (1943) theory to connect the hypothetical construct of frustration to its anteced- ent conditions and consequent behaviors. Brown and Farber took as their fundamental assumption that "frustration is a joint function of the absolute and relative strengths of the thwarted and competing tendencies" (p. 483). Then they at- tempted to integrate two common assumptions about the be- havior of frustration. The two assumptions were that
( 1 ) frustration increases as the difference between the strengths of the tendencies is reduced, being maximal at the point of equality, and (2) that if the two tendencies are equally strong, then the greater their absolute strengths, the more intense the frustration. (p. 484 )
The incorporation of these two assumptions led to the follow- ing general model of frustration:
F n n--I = F(Ew/Es ),
in which F represents the amount of frustration, E,~ the weaker of the two tendencies raised to the n th power, and E~ -t the stronger tendency raised to the n - 1 th power. As J. S. Brown and Farber (1951) pointed out, when n is set at the value 1, frustration is a function of the weaker of the two tendencies (i.e., the CRM). However, the equation departs from this model when n is set at values greater than I, and it is the characteristics resulting from this departure that Brown and Farber considered most desirable.
Scott (1966, 1969) used J. S. Brown and Farber's (1951) model with n set at the value 2 as one possible model of attitu- dinal ambivalence. That is, Scott used Brown and Farber's basic equation, substituting ambivalence for frustration and consid- ering positive and negative reactions as competing tendencies. Thus, the model predicts that ambivalence (A) is a function of the square of the conflicting reactions (C) divided by the num- ber of dominant reactions (D), a formula we refer to as the positive acceleration model ( PAM ):
J The distinction between objective and subjective properties of atti- tudes is not unique to ambivalence. For example, researchers have ex- amined both objective and subjective attitude accessibility (e.g., Bassili & Fletcher, 1991 ; Brown, 1974 ) and knowledge (e.g., Davidson, Yantis, Norwood, & Montano, 1985; Wood, 1982; Wood, Kallgren, & Preisler, 1985: see Wegener, Downing, Krosnick, & Petty, 1995 ).

THE GRADUAL THRESHOLD MODEL OF AMBIVALENCE 433
Am v 3
e n 1 c e O c
A 1 m b o.8 i v 0.6 a I 0.4 e n 0.2 c
Panel A - CRM
~ = A5 m b 4 i v 3 a I 2 e n 1 c
1 2 3 4 5 Conflicting Reactions
Panel C - N A M
~ ~ ' D = 2 D-3 D-4 D-5 A 4ii D-I b
v a I e n _ c e 0
A 25 m b 20 I v 15 a I lO e n 5 c e c
mA lO
b i V
n
C D-( e
1 2 3 4 5 Conflicting Reactions
Panel E - C P M
D-5 m b 4
D-4 i v 3 a I 2 e
, . 0 ~ ~ D - 2 n ~1 D=I C
1 2 3 4 5 • u( Conflicting Reactions
Panel G - A T M
J
Panel B - P A M
D-5
D-4 /
D'3
1 2 3 4 5 Conflicting Reactions
Panel D - S IM
D-5
1 2 3 4 5 Conflicting Reactions
Panel F - F rench 'a Mode l
mA9 8
v 6 T5 e 4 ' n 3
~ / J C 0 1 2 3 4 5 • 2(~ 1 2 3 4 5
Conflicting Reactions Conflicting React ions
1 2 3 4 5 Conflicting Reactions
Panel H - G T M
D-5
o .
Figure 1. Depiction of the predictions from the ambivalence models. Ambivalence is graphed as a func- tion of the extent of conflicting and dominant (D) reactions to an attitude object. CRM = conflicting reactions model: PAM = positive acceleration model; NAM = negative acceleration model: SIM = sim- ilarity-intensity model; CPM = cross-product model: ATM = abrupt threshold model; GTM = gradual threshold model.
A = F ( C 2 / D ) . This PAM is graphed in Panel B of Figure 1. Inspect ion of
the panel reinforces the two propert ies desired by Scott ( 1966, 1969) as well as by J. S. Brown and Farber (1951) . First, the
a m o u n t o f ambivalence decreases as the n u m b e r of d o m i n a n t react ions increases (holding the n u m b e r of conflicting react ions cons tan t ) . Second, the a m o u n t o f ambivalence increases as the n u m b e r of conflicting react ions increases (hold ing the n u m b e r

434 PRIESTER AND PETTY
of dominant reactions constant). Although not commented on by Scott, the PAM possesses yet a third distinguishing charac- teristic, namely, the association between the number of con- flicting reactions and ambivalence is positively accelerating rather than linear. That is, for those levels of dominant reactions at which there are more than two levels of conflicting reactions, the relationship between the conflicting reactions and ambiva- lence is positively accelerating: Later incremental increases (e.g., 4 to 5) in the number of conflicting reactions lead to larger increases in ambivalence than earlier ones (e.g., ! to 2).
Negative Acceleration Model
Inspection of Figure l 's Panel B also reveals a characteristic of the PAM that Scott (1966) found undesirable. Namely, the model "does not distinguish among degrees of univalence" (p. 394). In other words, when conflicting reactions are equal to 0, the resulting level of ambivalence is always equal to 0, regardless of the level of dominant reactions. This is a reasonable assump- tion if ambivalence requires conflict among the positive and negative reactions. It is not reasonable if people can feel ambiv- alent simply because they have an inadequate basis for holding an attitude ( i.e., just one positive reaction) .z To address the uni- valence problem, Scott proposed an alternative model for am- bivalence that maintained the desirable characteristics of the PAM and also allowed for differing levels of ambivalence given conflicting reactions equal to 0 (i.e., "degrees of univalence"). We refer to this model as the negative acceleration model (NAM):
A = F[(2C + 1) / (C + D + 2)].
This NAM is graphed in Panel C of Figure 1. Inspection of the panel indicates that the two properties of the PAM found desir- able by Scott are retained in the NAM. In addition, the NAM possesses the desired property (not found in the PAM) of dis- criminating across levels of univalence. That is, when the con- flicting reactions are equal to 0, the amount of ambivalence de- creases as the number of dominant responses increases. The NAM also differs from the PAM, however, in that there is a neg- atively accelerating relationship between the number of con- flicting reactions and ambivalence (i.e., the power function is less than 1 ). That is, earlier incremental increases in the amount of conflicting reactions lead to greater increases in am- bivalence than later ones. Though not commented on by Scott, this relationship is potentially important in differentiating the predictions of the NAM.
Similarity-Intensity Model
Recently, Thompson et al. (1995, see also Thompson & Zanna, 1995 ) hypothesized the existence of two necessary and sufficient conditions for ambivalence. First, they hypothesized that increased similarity between positive and negative reac- tions leads to increased ambivalence. Second, they hypothe- sized that (holding similarity constant) increased intensity (i.e., greater dominant and /o r conflicting reactions) leads to in- creased ambivalence. Thompson et al. provided an equation that translates these hypotheses into a mathematical model. That model is
A = F { [ ( C + D ) /2 ] - ( D - C)} .
Conceptually, the first component of the equation, [(C + D ) / 2 ], represents the second hypothesis. That is, the hypothesis that increased intensity leads to increased ambivalence is re- flected in the average of the conflicting and dominant reactions. As the average of these two components (i.e., the intensity) in- creases, so does the corresponding level of ambivalence. The second component of the equation, [ - ( D - C) ], represents the first hypothesis. When similarity is increased (e.g., equivalent numbers of positive and negative reactions), a smaller quantity is subtracted from the amount of ambivalence than when the similarity is less. Thus, increased similarity is associated with greater ambivalence scores.
It should be noted that one can simplify this formula to yield the equation that we refer to as the similarity-intensity model (SIM):
A = F(3C - D).
From this simplified representation of the SIM, it is clear that ambivalence is predicted to be a linear function of three times the conflicting reactions minus the dominant reactions. The SIM is graphed in Panel D of Figure 1. Inspection of the panel reveals that the characteristics desired by Thompson et al. are indeed embodied by the model.
Cross-Product Model
Katz, Hass, and their colleagues have conducted a program of research investigating the nature of racial attitudes and be- havior (e.g., Hass, Katz, Rizzo, Bailey, & Moore, 1992; Katz, Glass, & Cohen, 1973; Katz, Glass, Lucido, & Farber, 1977; Katz & Hass, 1988). An important moderating individual difference within this research is the construct of racial ambiv- alence. Katz et al. (1986) defined ambivalence as "the product of the subject's pro and anti scores" (p. 52, see also Hass et al., 1992, pp. 794-795). Thus, the model we refer to as the cross- product model (CPM) is
A = F ( C × D).
This model is graphed in Panel E of Figure 1. Inspection of the panel reinforces the properties important to the model, namely, increasing either the number of conflicting or the do- minant reactions leads to an increase in the amount of ambiva- lence (see Dollard, Miller, Doob, Mowrer, & Sears, 1939, for a conceptually similar model). Although Hass has recently rec- ommended against the use of the CPM for computing ambiva-
2 Some might argue that in univalence situations, the key construct is uncertainty rather than ambivalence. That is, people with just one pos- itive piece of information are more uncertain in their attitudes than people with 25 pieces of positive information but are not more ambiva- lent ( we thank Glen Hass for making this argument). However, this low- information state could be characterized by ambivalence if the reason for the uncertainty was that with just one piece of positive information, people fear that there might be negative information of which they are unaware. With 25 pieces of positive information, the anticipation of negative information is less salient.

THE GRADUAL THRESHOLD MODEL OF AMBIVALENCE 435
lence (see Hass & Eisenstadt, 1993 ), we include it here for com- parison purposes.
French's Threshold Model o f Frustration
To some extent, the systematic analysis of ambivalence can be traced to the work of French (1944), who sought to understand frustration in terms of field theory Most important for the pres- ent analysis is the model of frustration French proposed that introduced the concept of a threshold so that one could predict the effects of conflicting forces on behavior. Because of this threshold, the model can be thought of as the threshold model of frustration. French's model postulates that "the strength of frustration is a function of the strength of the weaker of these two forces when the weaker is greater than a certain minimum'" (emphasis added, p. 283 ). That is, given opposing fields, which- ever of the two fields is weaker in power is the consequent deter- minant of frustration, whenever that weaker force is above a certain threshold. It is worth noting the similarity between French's threshold model of frustration and the CRM (Kaplan, 1972). Namely, the two are equivalent, save for the question of how ambivalence--to the extent that it exists-- is determined below the minimal threshold. A simplistic instantiation of this model is presented in Panel F of Figure 1. Note that above some threshold, subjective ambivalence is solely a function of the magnitude of conflicting reactions. No predictions are graphed below the threshold. Given this underspecification of the thresh- old model of frustration proposed by French, we did not use it further in analyses comparing the correspondence of ambiva- lence models with subjective ambivalence. Nevertheless, we ex- amine the notion that a threshold moderates the impact of re- actions on ambivalence.
Prev ious A p p r o a c h e s to Val idat ing Mode l s
Given that each of the previously proposed models we re- viewed yield different predictions as to how the bases of ambiv- alence relate to the subjective experience of ambivalence, a nat- ural question arises as to which of the models most closely esti- mates the subjective experience of ambivalence. The responses of past researchers to this issue can be categorized as adopting one of two approaches. First, some researchers have provided theoretical justification in the absence of empirical support for the favored model. For example, Kaplan presented the CRM, and other investigators have simply used it without inspecting the ability of the model to accurately predict the subjective ex- perience of ambivalence (e.g., see Bargh et al., 1992). Second, at least one study attempted to compare models of ambivalence as to their ability to predict subjective ambivalence. Specifically, Thompson et al. ( 1995 ) examined the correlations among the models and reported ambivalence. The correlations between predicted and obtained ambivalence for the various models were SIM: r = .40, PAM: r = .37, CRM: r = .32, and CPM: r = .21.
Although the approach outlined above provides information about the general predictive ability of the models, it may not offer the best way to discriminate among the models. Specifi- cally, because all of the models make the general prediction that subjective ambivalence increases with the introduction of addi-
tional conflicting reactions (see Figure 1 ), the predictions of the models are highly correlated with each other. However, the models differ with respect to more specific predictions concern- ing the relationships among conflicting reactions, dominant re- actions, and subjective ambivalence. Thus, although the SIM produced the highest correlation coefficient in the study con- ducted by Thompson et al. ( 1995 ), the specific patterns of data hypothesized by the SIM, as well as by the other models, were not tested. To address this, we outline below the different data patterns predicted by the competing models of ambivalence and examine them empirically in the present research.
A second issue common to all of the previous empirical ex- aminations of ambivalence models concerns the nature of the data collection; namely, past researchers have relied on correla- tional procedures when investigating the ability of a model to predict subjective ambivalence. That is, participants completed unipolar measures of their positive and negative reactions to- ward a number of attitude objects, and the amount of subjective ambivalence elicited by those objects also was measured (e.g., Scott, 1969; Thompson et al., 1995 ). Although such studies are informative as to the relationships among the models and sub- jective ambivalence, this correlational approach cannot allow for inferences of causality. To make such inferences, the number of positive and negative reactions to an attitude object would have to be manipulated. In the present research we adopt this experimental, as well as the previously used correlational, approach.
C o m p a r i s o n o f the Mode l s
There have been several research investigations that use the concept of attitudinal ambivalence as a moderator of other pro- cesses and effects (e.g., Bargh et al., 1992; Costello et al., 1974; Hass et at., 1992; Komorita & Bass, 1967; Moore, 1973). For example, Bargh et al. hypothesized that because ambivalent at- titudes are the result of both positive and negative evaluative associations, greater attitudinal ambivalence should lead to re- duced attitude accessibility. Using the model of ambivalence suggested by Kaplan ( 1972; i.e., the CRM), Bargh et at. had one group of participants provide their positive and negative reactions toward a variety of attitude objects. From these rat- ings, ambivalence scores for the attitude objects were calculated by means of Kaplan's formula. A second group of participants then responded to attitudinal probes for both ambivalent and nonambivalent stimuli. As predicted, stimulus words that scored high in ambivalence according to the CRM were less accessible, as measured by response latency, than stimulus words that scored low in ambivalence.
However, it is important to note that the different ambiva- lence models make different predictions about the level of am- bivalence as a function of conflicting and dominant reactions. For example, imagine that two of the stimuli used by Bargh et al. (1992) were rated as being associated with two conflicting reactions. In addition, suppose that one stimulus was associated with five dominant reactions (Stimulus A), whereas the other stimulus was associated with two dominant reactions (Stimulus B). To determine whether ambivalence moderates accessibility, it is first necessary to determine the amount of ambivalence associated with the stimuli. Because Bargh et at. used the CRM,

436 PRIESTER AND PETTY
the two stimuli were categorized as equally ambivalent. Had Bargh et al. used the SIM, however, the stimulus associated with two dominant reactions (Stimulus B) would have been catego- rized as more ambivalent (ambivalence = 4) than the stimulus associated with five dominant reactions (Stimulus A; ambiva- lence -- 1 ). In contrast, had Bargh et al. used the CPM, the stimulus associated with five dominant reactions (Stimulus A) would have been categorized as more ambivalent (ambivalence = 10) than the stimulus associated with two dominant reactions (Stimulus B; ambivalence = 4). Thus, one's choice of a partic- ular ambivalence model can lead to very different predictions as to the amount of ambivalence expected to be associated with any given attitude object. Whether Bargh et at. had found (a) no differences in accessibility between Stimulus A and Stimulus B, (b ) Stimulus A to be more accessible than Stimulus B, or (c) Stimulus B to be more accessible than Stimulus A, some model of ambivalence would have supported their hypothesis that at- titudinal ambivalence is associated with diminished attitude accessibility.
It would be useful to know which model of objective ambiva- lence best translates the dominant and conflicting reactions to an attitude object into subjective feelings of ambivalence. This is one criterion, at least, by which the ambivalence models can be compared (Thompson et al., 1995). Even a cursory exami- nation of the panels in Figure l yields a clear conclusion: The level of ambivalence predicted by the previously proposed models of ambivalence varies, sometimes considerably. Of par- ticular note are two properties that differ across the models. We examine these properties next.
Does the Magnitude of Dominant Reactions Matter?
Both the CRM and French's threshold model predict that subjective ambivalence is a function of the conflicting reactions and that the number of dominant reactions does not matter. French's threshold model predicts also that this relationship should obtain only above a certain minimal number of con- flicting reactions. The PAM, NAM, and SIM all predict that subjective ambivalence is negatively related to dominant reac- tions, such that as the number of dominant reactions increases, subjective ambivalence decreases. In stark contrast, the CPM predicts that subjective ambivalence is positively related to do- minant reactions, such that as the number of dominant reac- tions increases, subjective ambivalence also increases. Thus, an examination of the influence of dominant reactions on subjec- tive ambivalence at different levels of conflicting reactions should help to determine which models provide a reasonable account of the impact of dominant reactions on subjective am- bivalence and which do not.
The different predictions as to the influence of dominant re- actions on subjective ambivalence are particularly pronounced when the number of conflicting reactions approaches zero. Three of the models (CRM, PAM, and CPM) do not predict a relationship between dominant reactions and subjective ambiv- alence when there are no conflicting reactions. That is, accord- ing to these models, given no conflicting reactions, subjective ambivalence does not vary as the dominant reactions increase. In contrast, two of the models (NAM and SIM) predict a nega- tive relationship between dominant reactions and subjective
ambivalence: When there are no conflicting reactions, subjec- tive ambivalence decreases as the dominant reactions increase. Thus, the examination of subjective ambivalence under condi- tions of no conflicting reactions can help distinguish among the models.
Relationship of Conflicting Reactions to Subjective Ambivalence
The models also yield conflicting predictions concerning the influence of the conflicting reactions on subjective ambivalence. As the number of conflicting reactions increases, the corre- sponding level of subjective ambivalence can increase in a lin- ear, positively accelerating, or negatively accelerating function. The PAM predicts a positively accelerating relationship, the NAM predicts a negatively accelerating relationship, and the other three models (CRM, CPM, and SIM) all predict a linear influence of conflicting reactions on subjective ambivalence. Thus, examination of whether the impact of conflicting reac- tions on subjective ambivalence is best described as a linear, pos- itively accelerating, or negatively accelerating function can help distinguish the models.
E x p e r i m e n t 1
To examine the utility of each of the previously proposed models of ambivalence for predicting subjective ambivalence, we adopt the following strategy: First we examine the correla- tional relationship between the magnitude of dominant reac- tions and the subjective experience of ambivalence at each level of conflicting reactions. This analysis allows for a general test of the different predictions made by the models about the relation- ship between dominant reactions and subjective ambivalence (e.g., recall that the models differ as to whether dominant reac- tions account for any variance in subjective ambivalence when there are no conflicting reactions) and also allows a test of French's prediction that above a certain level of conflicting re- actions, dominant reactions no longer matter. Then we analyze more specific subsets of the data to assess the relationships among the conflicting and dominant reactions and the subjec- tive experience of ambivalence. These more focused analyses allow for further differentiation among the abilities of the models to predict the subjective experience of ambivalence. Fi- nally, we examine the specific relationship of conflicting reac- tions to subjective ambivalence by calculating the power func- tion associated with the conflicting reactions to determine if the relationship is best described as linear, positively accelerating, or negatively accelerating.
Method tn Experiment 1,323 introductory psychology students were ran-
domly assigned to one of four cells in a 2 (questionnaire order: reactions first vs. subjective ambivalence first) x 2 ( reactions questionnaire order: assessment of positive reactions first vs. negative reactions first) factorial experimentP The administration of the reactions and subjective ambiv-
3 Experiment 1 was actually conducted as two separate experiments. This approach provided a cross-sample validation of the results. Be- cause of the similarity of the methods and results across the two samples (see Priester, 1994) they are reported here as one study. The attitude objects used in the first sample included: legalized abortion. White Cas- tle hamburgers, neutral toned wall paint, your mother, raising tuition at

THE GRADUAL THRESHOLD MODEL OF AMBIVALENCE 4 3 7
alence questionnaires, as part of a laboratory experiment, was con- ducted such that participants completed each questionnaire approxi- mately 30 min apart. The reactions questionnaire was designed to assess the psychological magnitude of positive and negative reactions associ- ated with the attitude objects. The subjective ambivalence questionnaire was designed to assess the perceived amount of ambivalence elicited by the attitude objects.
React ions Quest ionnaire
Half of the participants completed booklets that first assessed the magnitude of their positive reactions, followed by the assessment of the magnitude of their negative reactions. The other half of the participants completed booklets that first assessed the magnitude of their negative reactions, followed by the assessment of the magnitude of their positive reactions. The participants who completed the negative followed by pos- itive reaction booklet were instructed that:
On the next few pages we will ask for your opinions on a variety of topics. First, we will ask for you to give an indication of all of your NEGATIVE thoughts and feelings on the issue--that is, for all of the negative things that you personally think and feel about the issue. Later, we will ask for you to give an indication of all of your positive thoughts and feelings on the issue.
For some issues or objects, you may not have very many personal negative or positive thoughts and feelings. For other issues you may have some negative thoughts and feelings, but very few positive ones ( or vice-versa). For still other issues and objects, you may have many negative AND positive thoughts and feelings.
For each of the issues, we will ask you to first rate the extent to which you have NEGATIVE thoughts and feelings about it. In do- ing this, you should ignore any positive thoughts and feelings that you might have.
After reading these instructions, participants were given further in- structions on how to complete the scales, as well as an example with a popular beverage as an attitude object. On a separate page following the instructions, participants indicated the magnitude of their negative thoughts and feelings toward the attitude objects on l l-point unipolar scales, anchored with 0 (no negative thoughts or feelings) and lO ( maximum negative thoughts or/eelings). Participants then completed scales assessing the magnitude of their positive reactions to the attitude objects. The participants who completed the positive followed by the negative reaction booklets read the same instructions, except that posi- tive replaced negative (and vice versa). Thus, these participants com- pleted the same scales, albeit in reverse order.
Subjective Ambiva lence Quest ionnaire
Participants completed a series of three scales designed to assess the amount of subjective ambivalence elicited by the attitude objects. On three separate pages, participants were presented with the attitude ob- jects and completed scales to assess the extent to which their reactions were conflicted, mixed, and indecisive to the attitude objects. These three questions were chosen to measure ambivalence because of their relationship to the commonly accepted tripartite model of attitudes (e,g., Ostrom, 1969). The measure of"indecision'" was intended as an indicator of the conative basis, "'mixed" as an indicator of the cognitive basis, and "conflicted" as an indicator of the affective basis. Specifically, the participants completed 1 l-point scales anchored with 0 (feel no con- flict at all..leel no indecision at all. and completely onosided reactions)
the students" own institution, and the National Enquirer tabloid. The second sample included the same six attitude objects along with a sev- enth: alfirmative action.
and 10 (J&,l maximum conflict..l&'l maximum indecision, and com- pletely mLxed reactions). We created an ambivalence measure by aver- aging each participant's responses to the three questions. Thus, the sub- jective ambivalence scores could vary from 0 to 10.
Resul ts
Data Reduct ion
The number s of positive and negative react ions were t r ans fo rmed to equivalent measures of conflicting (C) and do- m i n a n t ( D ) reactions. For example , a par t ic ipant who re- sponded to an at t i tude issue with 10 positive react ions and 5 negative react ions would be categorized as having 10 d o m i n a n t and 5 conflicting reactions. W h e n the number s of positive and negative react ions were equivalent, t ha t n u m b e r was used as b o t h the d o m i n a n t and the confl ict ing measure . Following these t ransformat ions , we combined the number s of d o m i n a n t and conflicting react ions to arrive at the ambivalence score pre- dicted by each of the ambivalence models out l ined above.
Tests o f the Abi l i ty o f the Objective Ambivalence Models to Predict Subjective Ambivalence
Table 1 presents the part ial corre la t ion coefficient mat r ix for Exper iment 1. 4 O f greatest interest is tha t all models signifi- cantly predict the a m o u n t of subjective a t t i tudina l ambiva lence (all p s < .0001 ). Also of interest is the h igh in te rmodel correla- tion. As expected, Table 1 reveals tha t the correla t ions among the five previously proposed models range f rom .71 ( C P M and N A M ) to .98 ( N A M and SIM ). It is also interest ing to note tha t the pa t te rn of correla t ions we ob ta ined is remarkably s imilar to those repor ted by T h o m p s o n et ai. (1995) , despite the differ- ences in at t i tude objects and m e a s u r e m e n t p rocedures used, First, the magni tude o f the correlat ions is qui te s imilar for our study and tha t of T h o m p s o n et al. Second, the SIM correlates mos t highly with subjective ambiva lence bo th in our data and in tha t of T h o m p s o n et al. In our research, the corre la t ion o f the SIM with subjective ambiva lence was .44, and in the i r s tudy it was .40. However, in selecting the mos t appropr ia te ambiva- lence model, it is desirable to go beyond examina t ion of the overall corre la t ion between the predic ted and ob ta ined data.
Examina t ion o f the Different Predictions Derivable From the Models
Our analyses of the ways in which the var ious models of am- bivalence differ suggest several tests to de t e rmine the correspon-
4 All 2,166 observations (95 participants × 6 topics, 228 participants X 7 topics) were used in the analysis correlating subjective ambivalence with the ambivalence predicted by each of the models. To partial for the influence of individual differences in response tendencies (i.e., to provide a correlation partialing for the influence of the repeated obser- vations provided by each participant), we conducted regression analy- ses predicting subjective ambivalence and the ambivalence predicted by the models from the dummy coded participant variable. The residual- ized subjective and predicted ambivalence scores obtained from these regression analyses were then correlated. This strategy allows for the examination of the partial correlations of each oftbe models with sub- jective ambivalence (as well as each other) while controlling for the in- fluence of individual participant response tendencies (see Judd & McClelland, 1989).

438 PRIESTER AND PETTY
Table 1 Partial Correlation Matrix, Experiment 1
Variable 1 2 3 4 5 6 7 8
1. AMB 2. CRM .41 - - 3. SIM .44 .89 - - 4. NAM .43 .87 .98 5. PAM .38 .92 .89 6. CPM .36 .94 .76 7. ATM .44 .85 .92 8. GTM .42 .80 .90
.86
.71 .80 - -
.93 .71 .76
.90 .67 .73 .95
Note. The n for all correlations except those associated with the PAM is 2,166. The n associated with the correlations with the PAM (2,045) is smaller because of the exclusion of all responses in which the number of dominant and conflicting reactions are both equal to 0. AMB = ambivalence: CRM = conflicting reac- tions model; SIM = similarity-intensity model; NAM = negative acceleration model; PAM = positive acceleration model; CPM = cross-product model; ATM = abrupt threshold model; GTM = gradual thresh- old model.
dence between the models ' predictions and the observed rela- tionships among subjective ambivalence, conflicting, and domi- nant reactions. First, is there an influence o f dominant reactions on subjective ambivalence and, i f so, is this influence moderated by the level of conflicting reactions? Second, how do the domi- nant and conflicting reactions combine to produce the subjec- tive experience o f ambivalence? Third, is the subjective experi- ence of ambivalence a linear, positively accelerating, or nega- tively accelerating function o f the number o f conflicting reactions? Recall that the different models make different pre- dictions concerning these issues. Following these analyses, we discuss their implications for the different models.
Influence of Dominant Reactions on Subjective Ambivalence
To examine the relationship between dominant reactions and the subjective experience o f ambivalence (i.e., to determine if dominant reactions matter) , and at the same t ime examine French 's threshold notion (i.e., that dominant reactions will not matter above some minimal level o f conflict), we calculated the correlation between dominant reactions and subjective ambiv- alence for each level o f conflicting reaction. The results of these analyses revealed significant negative correlations between do- minant reactions and subjective ambivalence when conflicting reactions were equal to 0 ( r = - . 22 , p < .0001 ) and 1 ( r = - . 11, p < .05 ) but revealed nonsignificant correlations (ps > .3) when the conflicting reactions were greater than 1. Even when all cases in which conflicting reactions are greater than 1 are pooled, dominant reactions still do not predict ambivalence (r = - . 05 , p > .1).
Two findings are immediately apparent from this preliminary analysis. First, the subjective experience o f ambivalence is influ- enced by the extent o f dominant reactions given minimal con- flicting reactions (i.e., 0 or 1 conflicting reaction). Second, the subjective experience of ambivalence is not influenced by domi- nant reactions when the magnitude of the conflicting reactions is more than minimal (i.e., greater than 1 ). The finding that domi- nant reactions predict subjective ambivalence at all is inconsis- tent with the CRM, which postulates no role for dominant reac-
tions. The fact that dominant reactions matter when there are no conflicting reactions is inconsistent with the PAM and CPM. The finding that the dominant reactions are negatively associated with subjective ambivalence is also inconsistent with the CPM, which expects a positive relationship. The finding that dominant reactions fail to account for variance in subjective ambivalence above minimal levels of conflicting reactions is inconsistent with the NAM, PAM, and SIM (see Figure 1 ) but is quite consistent with French's threshold model of frustration.
Influence of Conflicting and Dominant Reactions as a Function of Threshold
The results o f the correlat ion analyses are consistent with the not ion that the influence o f dominan t reactions on subjec- tive ambivalence is moderated by a threshold. That is, a Do- minan t Reactions ( D ) × Threshold ( T ) interaction should emerge such that the influence o f dominant reactions are different depending on whether the relationship is examined above or below the threshold. To examine the impact o f con- flicting and dominan t reactions on subjective ambivalence and to examine the D x T interaction, we performed a series of mult iple regression analyses using conflicting reactions (C) and dominant reactions, as well as threshold level as indepen- dent variables and subjective ambivalence as the dependent variable. Threshold was d u m m y coded such that observations with more than one conflicting reaction were coded as "above" and conflicting reactions equal to 0 or I were coded as "be low" the threshold. 5 In all multiple regression analyses reported herein, participants was used as a regressor. We used d u m m y coding to create a participants categorical variable. This ana- lytic approach allowed for the examinat ion o f the relationships as a within-subjects design. Thus, all o f the responses provided by each part icipant were able to be used. As suggested by Co- hen and Cohen (1983) , we used a hierarchical approach such
5 Because of the high multicollinearity of the dummy coded threshold variable with the conflicting reactions measure (i.e., the threshold vari- able is a dichotomous representation of the continuous conflicting reac-

THE GRADUAL THRESHOLD MODEL OF AMBIVALENCE 439
Table 2 ResuRs ofMuflipleRegressionAnalysis, Experiment 1
Predictor b df F p
Participant C D CXT DXT D × C C X D X T
0.50 -0.13
(322, 1841) 1.5 < .0001 ( 1, 1841) 327.0 < .0001 (1, 1841) 61.7 < .0001 (1, 1838) 1.5 > .2 (1, 1838) 10.8 < .0010 (1, 1838) 0.9 > .3 (1, 1837) 1.0 > .3
Observations falling below the threshold C 0.68 (1,972) 20.7 < .0001 D -0.14 (1,972) 56.5 < .0001 C × D (1,971) 0.2 > .6
Observations falling above the threshold C 0.39 (1,576) 38.0 < .0001 D -0.03 (1,576) 0.3 > .5 C X D (1,575) 0.1 > .7
Note. C = conflicting reactions; D = dominant reactions; T = threshold level.
that a series of regression analyses increasing in complexity were run, interpreting only the highest order terms in each analysis. Thus, we conducted an initial analysis to examine the main effects of C and D on ambivalence, followed by an anal- ysis examining the main effects and two-way interactions (interpreting only the two-way interactions), followed by an analysis examining the main effects, two-way interactions, and the three-way interaction (interpreting only the three-way interaction).
The results of these analyses are presented in the top panel of Table 2. Inspection of the top panel reveals four significant re- sults. First, there were main effects for participants, conflicting reactions, and dominant reactions. Overall, subjective ambiva- lence is positively associated with conflicting reactions (b = 0.50) and negatively associated with dominant reactions (b = -0 .13) . More important, these main effects were qualified by a Dominant Reaction × Threshold interaction. This interaction reveals that the influence of dominant reactions on subjective ambivalence differs significantly, depending on whether the in- fluence occurs below or above the threshold. We interpreted this interaction further by examining the influence of conflicting and dominant reactions on subjective ambivalence both above and below the threshold.
Observations below and above the threshold. First we exam- ined the influence of conflicting and dominant reactions on sub- jective ambivalence with multiple regression analyses using only those observations with zero or one conflicting reaction (i.e., below the threshold). In these analyses, subjective ambivalence was regressed first on the dummy coded participants factor, the conflicting reactions, and the dominant reactions. Second, sub-
tions measure), we did not include it as a main effect predictor in the equation. This strategy is justified because the variance accounted for by the threshold variable is highly redundant with the variance ac- counted for by the conflicting-reactions main effect.
jective ambivalence was regressed on these main effects and the Conflicting x Dominant reactions interaction. The results of these analyses are presented in the middle section of Table 2. These analyses yielded two significant main effects. Subjective ambivalence was significantly predicted by both conflicting re- actions (b = 0.68) and dominant reactions (b = -0 .14) .
From these analyses it is possible to infer a specific formula for the influence of conflicting and dominant reactions on sub- jective ambivalence given minimal conflicting reactions (i.e., zero or one). Namely, given the positive conflicting reactions (C) unstandardized coefficient in combination with the nega- tive dominant reactions (D) unstandardized coefficient, it is de- ducible that given minimal (i.e., zero or one) conflicting reac- tions, subjective ambivalence is equal to .68 times the conflict- ing reactions minus . 14 times the dominant reactions or, more simply, subjective ambivalence is approximately 5 times the conflicting reactions minus the dominant reactions (i.e., 5C - D). It is worth noting the similarity between this relationship, derived from the results of Experiment 1, and the relationship hypothesized by the SIM (i.e., 3C - D).
We examined the influence of conflicting and dominant reac- tions on subjective ambivalence with similar analyses, using only those observations with more than one conflicting reaction ( i.e., above the threshold). The results of these analyses are pre- sented in the bottom section of Table 2. These analyses yielded only one main effect. Ambivalence was predicted solely by con- flicting reactions (b = 0.39). As expected, dominant reactions had no effect on subjective ambivalence above the threshold.
Summary. The multiple regression analyses suggest that consistent with French's threshold model, above a minimal number of conflicting reactions (i.e., conflicting reactions greater than 1 ), subjective ambivalence is solely a function of the magnitude of conflicting reactions. However, below that crit- ical value, subjective ambivalence is a joint function of the con- flicting and dominant reactions (5C - D). One point remains unaddressed, however. Namely, is the relationship between sub-
440 PRIESTER AND PETTY
.b I V a I
e n C e
5
4
8
1
%
_DR-5-7
1 2 -4 5 -7 Conf l ict ing React ions
8-10
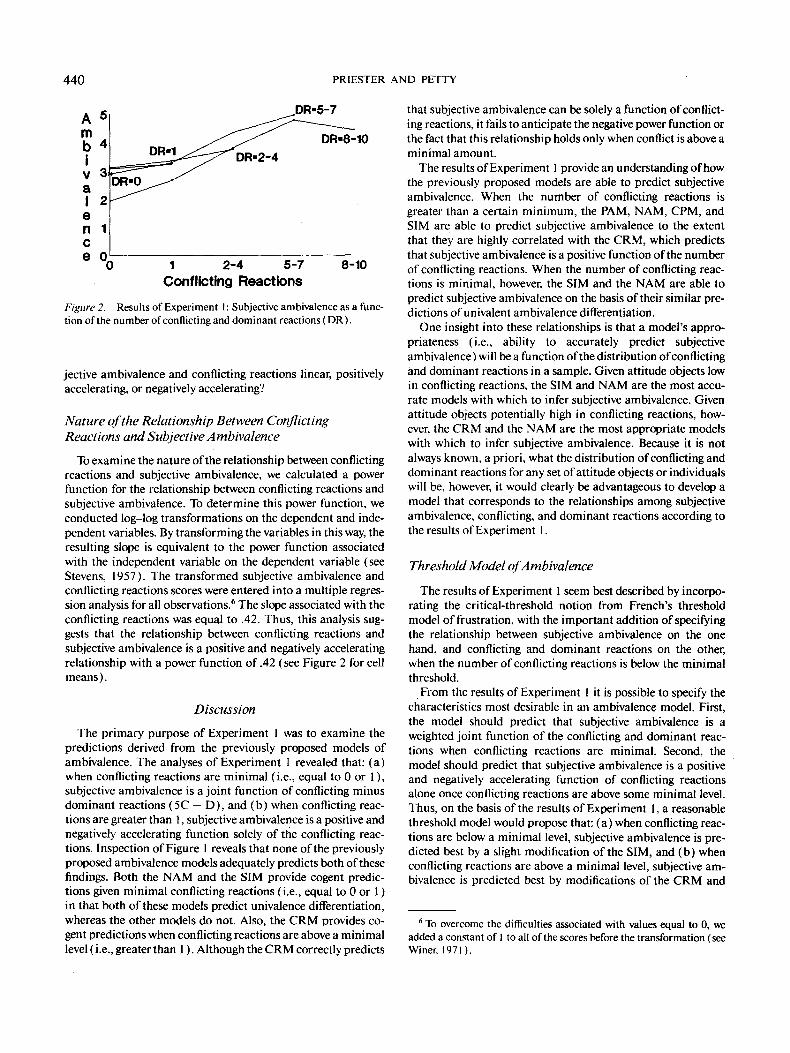
Figure 2. Results of Experiment h Subjective ambivalence as a func- tion of the number of conflicting and dominant reactions (DR).
jective ambivalence and conflicting reactions linear, positively accelerating, or negatively accelerating?
Nature of the Relationship Between Conflicting Reactions and Subjective Ambivalence
To examine the nature of the relationship between conflicting reactions and subjective ambivalence, we calculated a power function for the relationship between conflicting reactions and subjective ambiva!ence. To determine this power function, we conducted log-log transformations on the dependent and inde- pendent variables. By transforming the variables in this way, the resulting slope is equivalent to the power function associated with the independent variable on the dependent variable (see Stevens, 1957). The transformed subjective ambivalence and conflicting reactions scores were entered into a multiple regres- sion analysis for all observations. 6 The slope associated with the conflicting reactions was equal to .42. Thus, this analysis sug- gests that the relationship between conflicting reactions and subjective ambivalence is a positive and negatively accelerating relationship with a power function of .42 (see Figure 2 for cell means).
Discussion
The primary purpose of Experiment 1 was to examine the predictions derived from the previously proposed models of ambivalence. The analyses of Experiment I revealed that: (a) when conflicting reactions are minimal (i.e., equal to 0 or 1 ), subjective ambivalence is a joint function of conflicting minus dominant reactions ( 5C - D) , and (b) when conflicting reac- tions are greater than 1, subjective ambivalence is a positive and negatively accelerating function solely of the conflicting reac- tions. Inspection of Figure l reveals that none of the previously proposed ambivalence models adequately predicts both ofthese findings. Both the NAM and the SIM provide cogent predic- tions given minimal conflicting reactions (i.e., equal to 0 or 1 ) in that both of these models predict univalence differentiation, whereas the other models do not. Also, the CRM provides co- gent predictions when conflicting reactions are above a minimal level (i.e., greater than l ). Although the CRM correctly predicts
that subjective ambivalence can be solely a function of conflict- ing reactions, it fails to anticipate the negative power function or the fact that this relationship holds only when conflict is above a minimal amount.
The results of Experiment l provide an understanding of how the previously proposed models are able to predict subjective ambivalence. When the number of conflicting reactions is greater than a certain minimum, the PAM, NAM, CPM, and SIM are able to predict subjective ambivalence to the extent that they are highly correlated with the CRM, which predicts that subjective ambivalence is a positive function of the number of conflicting reactions. When the number of conflicting reac- tions is minimal, however, the SIM and the NAM are able to predict subjective ambivalence on the basis of their similar pre- dictions of univalent ambivalence differentiation.
One insight into these relationships is that a model's appro- priateness (i.e., ability to accurately predict subjective ambivalence) will be a function of the distribution of conflicting and dominant reactions in a sample. Given attitude objects low in conflicting reactions, the SIM and NAM are the most accu- rate models with which to infer subjective ambivalence. Given attitude objects potentially high in conflicting reactions, how- ever, the CRM and the NAM are the most appropriate models with which to infer subjective ambivalence. Because it is not always known, a priori, what the distribution of conflicting and dominant reactions for any set of attitude objects or individuals will be, however, i t would clearly be advantageous to develop a model that corresponds to the relationships among subjective ambivalence, conflicting, and dominant reactions according to the results of Experiment 1.
Threshold Model of Arnbivalence
The results of Experiment 1 seem best described by incorpo- rating the critical-threshold notion from French's threshold model of frustration, with the important addition of specifying the relationship between subjective ambivalence on the one hand, and conflicting and dominant reactions on the other, when the number of conflicting reactions is below the minimal threshold.
From the results of Experiment 1 it is possible to specify the characteristics most desirable in an ambivalence model. First, the model should predict that subjective ambivalence is a weighted joint function of the conflicting and dominant reac- tions when conflicting reactions are minimal. Second, the model should predict that subjective ambivalence is a positive and negatively accelerating function of conflicting reactions alone once conflicting reactions are above some minimal level. Thus, on the basis of the results of Experiment 1, a reasonable threshold model would propose that: (a) when conflicting reac- tions are below a minimal level, subjective ambivalence is pre- dicted best by a slight modification of the S1M, and (b) when conflicting reactions are above a minimal level, subjective am- bivalence is predicted best by modifications of the CRM and
6 To overcome the difficulties associated with values equal to 0, we added a constant of I to all of the scores before the transformation (see Winer, 1971 ).

THE GRADUAL THRESHOLD MODEL OF AMBIVALENCE 441
NAM. What we will call the abrupt threshold model (ATM) of ambivalence states that: (a) subjective ambivalence is a func- tion of 5 times the conflicting reactions minus the dominant reactions (i.e., 5C - D) when the number of conflicting reac- tions is below some minimal level, and (b) subjective ambiva- lence is a positive and negatively accelerating function of the conflicting reactions when the number of conflicting reactions is above a minimal level (i.e., 5CP). When the conflicting and dominant reactions are assessed on 11-point thoughts and feel- ings scales, as in the current research, the threshold appears to be just one conflicting reaction. Expressed mathematically, the ATM of ambivalence is
I fC < t, A = F ( 5 C - D); I fC > t, A = F(5CP),
where t = threshold andp < 1. The ATM, with t = 1 andp = .4, is graphed in Panel G of Figure 1. Inspection of the panel reveals that the desired properties are embodied by the formula. First, below the threshold, subjective ambivalence is a joint function of the conflicting and dominant reactions. Second, above the threshold, subjective ambivalence is a positive and negatively accelerating function of the conflicting reactions. The corre- lations of the ATM with subjective ambivalence as well as with the other models of ambivalence are presented in Table 1.
Although the ATM provides a reasonable description of the data obtained in Experiment 1, use of the model in future in- vestigations requires selection of a specific conflict threshold be- low which the number of dominant reactions influences ambiv- alence and above which the number of dominant reactions does not matter (see Panel G in Figure 1 ). Close inspection of the Study I correlations between dominant reactions and subjective ambivalence, however, suggests that the reduced impact of do- minant reactions on ambivalence as conflict increases may oc- cur somewhat gradually rather than abruptly. That is, the in- fluence of dominant reactions on subjective ambivalence is marginally greater at zero conflicting reactions ( r = - . 2 2 ) than at one conflicting reaction ( r = - . 11 ). One way to model a more gradual decline in the influence of dominant reactions on sub- jective ambivalence as conflict increases is to use one formula that accommodates this overall pattern. This formula, which we call the gradual threshold model ( G T M ) of ambivalence, is
A = 5C p - D l/c
(with a constant of I added to each C and D score). This for- mula (with p = .4) produces effects that are virtually identical to the ATM and is graphed in Panel H of Figure 1. The results are very close to the ATM because the formula reduces to 5C - D when there are zero conflicting reactions, and because the exponent of D (i.e., 1 /C) renders the impact of dominant reac- tions on ambivalence progressively smaller as conflict increases until the effect of dominant reactions is negligible. That is, after conflict reaches a certain point, for all practical purposes am- bivalence is a function only of the extent of conflicting reactions. The correlations of the GTM with subjective ambivalence, as well as the other models, is presented in Table 1.
Summary
The ATM and GTM were developed specifically to predict subjective ambivalence based on the empirically observed rela-
tionships between subjective ambivalence and the underlying dominant and conflicting reactions observed in Study 1. Both models account for the subjective experience of ambivalence across the full range of data as well as the previously proposed models of ambivalence (see Table 1 ). Of greater interest is the fact that the threshold models account better than any of the previously proposed models for the specific pattern of data ob- served. That is, both the ATM and GTM, unlike the previously proposed models, predict that subjective ambivalence is a joint function of the conflicting and dominant reactions when con- flicting reactions are low and that subjective ambivalence be- comes a positive and negatively accelerating function of only the conflicting reactions as conflict increases. 7 The ATM and GTM differ only in whether the threshold is point specific (ATM) or gradually emerges (GTM; see Panels G and H of Figure 1 ). Of course, the superiority of our threshold models over the other models should not be surprising given that these models were constructed explicitly on the results of Experiment 1. Thus, a critical issue is whether the relative superiority of these models over the previously proposed models in accounting for the spe- cific pattern of results can be replicated in an independent sample. 8
In addition to the necessity of a cross-sample validation, three other issues arise from the results of Experiment 1. First, it is possible that the relationships uncovered are connected to the specific attitude objects used in the experiments and might not generalize beyond them. Second, the nature of the data col- lection raises an important question. Given the correlational nature of the design, it is not possible to make inferences con- cerning the causal impact of conflicting and dominant reactions on subjective ambivalence. Although the proposed relationship seems cogent (namely, that the dominant and conflicting reac- tions cause the subjective ambivalence), other explanations cannot be ruled out. Third, our specific measure of the positive and negative bases of attitudes is not necessarily an interval scale. This could compromise the conclusions from some of our analyses (e.g., calculation of a power function).
E x p e r i m e n t s 2 a n d 3
We conducted Experiments 2 and 3 to "test the threshold models while simultaneously addressing the issues raised by Ex- periment 1. In Experiments 2 and 3, conflicting and dominant traits associated with fictitious target persons were manipu- lated, and the resulting subjective ambivalence was measured. By manipulating the information about the attitude objects in this fashion we were able to address the generality of the results of Experiment 1. First, if the relationships discovered in Exper-
7 Correlational analyses conducted above and below the threshold to examine the ability of the various models to predict subjective ambiva- lence support these conclusions. Below the threshold, the SIM and the NAM predict better than the other models, whereas above the threshold the CRM predicts better than the other models. In contrast, the ATM and the GTM predict as well as the best predicting models both above and below the threshold (see Priester, 1994).
8 It should be noted, however, that given the near-identical results of the two studies composing Experiment 1, each provides an independent replication of the other (see Priester, 1994).

442 PRIESTER
iment 1 are the result o f the specific attitude objects used in those studies, it is unlikely that the relationships will be repli- cated with the new object used in Exper iments 2 and 3. Second, the experimental manipula t ion o f the conflicting and dominan t reactions allows for the inference o f causality. Third, by using discrete numbers of positive and negative trait i tems ascribed to an individual we create the desired ratio scale o f dominan t and conflicting reactions from which to better infer the empirical relat ionship between subjective ambivalence and conflicting and dominan t reactions.
M e t h o d
Des ign and Cover S tory
In Experiments 2 and 3, participants were instructed to read a list of traits for, and answer questions about, each of 16 different target per- sons. In Experiment 2, 87 introductory psychology students partici- pated in a 4 (number of positive traits: 0, 1, 3, or 5) × 4 (number of negative traits: 0, 1, 3, or 5) factorial experiment. In Experiment 3, 64 introductory psychology students participated in a 4 (number of posi- tive traits: 0, 1, 4, or 7) × 4 (number of negative traits: 0, 1, 4, or 7) factorial experiment.
Participants were instructed that:
On each of the next pages you will find a set of words that describe a person. Your task is to read the set of words and form an impression about the person being described and decide how much you would like that particular person.
Participants were also informed that each page described a different person, the descriptive words were listed alphabetically, each word was equally important, and each word came from a different acquaintance of the person, To create the no-information condition, each participant received information on 1 target individual that read "'no descriptions available. ''9
Independent Variables
The top half of each page contained the positive and negative traits purportedly describing the target individual. Positive and negative traits were taken from Anderson ( 1968 ). Thirty-six traits ( 18 positive and 18 negative) were used in Experiment 2, and 48 traits (24 positive and 24 negative) were used in Experiment 3. The traits used in Experiments 2 and 3 are presented in Table 3. Traits were randomly selected from the positive and negative trait pool for each of the 16 impression sets (i.e., target person descriptions) with the restriction that no trait be repeated twice in the same set and each trait be used exactly twice across all 16 impression sets. The traits were chosen such that the average of the pos- itive and negative traits were of equal extremity in evaluation. The aver- age rating of the negative traits was 68, and the average rating of the positive traits was 520, based on a 700-point scale ranging from 0 to 700. Thus, the average rating for the negative traits was 230 units below the midpoint (300), and the average rating for the positive traits was 220 units above the midpoint. For each description, the traits were ar- ranged in alphabetical order. The 16 different descriptions were ordered randomly on a participant-by-participant basis.
Dependent M e a s u r e s
The bottom half of each page listing the impression set contained four questions about the target person. Consistent with the cover story, the first question was designed to assess participants' impression of the target person. The question read "People can feel very unfriendly or
AND PETTY
Table 3 Positive and Negative Traits, Experiments 2 and 3
Negative traits Positive traits
boring a broad-minded a conceited cheerful a cruel clever ~ dishonest considerate distrustful a courteous a greedy dependable hostile friendly ill-mannered a happy i nsi ncere honest liar humorous loud-mouthed intelligent malicious kind mean loyal narrow-minded pleasant a obnoxious reliable phony responsible quarrelsome a sincere rude thoughtful self-centered a trustworthy selfish trustful a unfriendly a truthful unkind understanding untrustworthy unselfish untruthful warm
Note. Unmarked traits were used in Experiments 2 and 3. These traits were used in Experiment 3 only.
very friendly to other people. How friendly do you find this person?" Participants responded to this question on a 9-point scale anchored with -4 ( very zmfriendly) and +4 ( very friendly). The other three questions were the subjective ambivalence measures used in Experiment 1. That is, participants reported on 1 l-point scales the extent to which their impressions of the target individual were mixed, conflicted, and indeci- sive (e.g., 0 = not at all indecisive and 10 = maximum indecision). We created a subjective ambivalence measure by averaging each partici- pant's responses to the three ambivalence questions. Thus, the subjec- tive ambivalence scores could vary from 0 to 10.1°
Resul t s
Data Reduct ion
As in Exper iment 1, we t ransformed the numbers o f positive and negative traits to reflect the number of conflicting and do- minan t traits associated with the target person. Because of the similar methods and results o f Experiments 2 and 3 (see Priester, 1994), we combined the two studies into one data set (see Figure 3 for cell means) . ~
9 All analyses include this cell, though the results do not differ if this cell is deleted.
~0 The Cronbach's alpha for the subjective ambivalence measure was .9 for Experiments 2 and 3 and .6 for Experiment 1.
~ To replicate past research on the influence of positive and negative attributes on subsequent impressions (e.g., Anderson, 1971 ), we con- ducted a multiple regression analysis in which the impression of the target individuals was regressed on the number of positive and negative traits. In agreement with past research, this analysis yielded significant main effects for both positive and negative traits, b = 0.57, F( 153, 2415 ) = 690, p < .0001 for positive traits, and b = -0.62, F( 153, 2415) = 6,820, p < .0001 for negative traits. The Positive × Negative Trait in- teraction was not significant (p = .2 ). We conducted an additional anal-

THE GRADUAL THRESHOLD MODEL OF AMBIVALENCE 443
A 8 m b s i
V a 4~ I
e 2 n C e (~
DT-7
1 3 4 5 7
Conflicting Traits
Figure 3. Results of Experiments 2 and 3: Subjective ambivalence as a function of the number of conflicting and dominant traits (DT).
Establishing a ThreshoM
Recall that the results of Experiment 1 suggested that there could be a min imal value of conflicting reactions that serves as a threshold above which subjective ambivalence is differentially influenced than below. To determine if a threshold existed in Experiments 2 and 3, and to provide a replication of our first study, we examined the correlations between dominan t reac- tions and subjective ambivalence for each level of conflicting reactions. These analyses replicated the results of Experiment 1. Significant negative correlations between dominan t reactions and subjective ambivalence were obtained when conflicting re- actions were equal to 0 ( r = - . 27 , p < .0001 ) and 1 (r = - . 10, p < .01 ), but nonsignificant correlations were observed when the conflicting reactions were greater than 1 (ps > .5). If all cases in which conflicting reactions are greater than 1 are pooled, dominant reactions still do not predict ambivalence ( r = .04, p > .3). Thus, as in Experiment 1, conflicting reactions equal to 1 serve as a threshold: At and below this threshold the relationship between dominan t reactions and subjective ambiv- alence is negative and significant, whereas above this threshold the relationship between dominan t reactions and subjective am- bivalence is nonsignificant.
Influence o f Conflicting and Dominant Reactions as a Function o f Threshold
As in Experiment 1, to examine the impact of conflicting and dominan t reactions on subjective ambivalence and to examine
ysis that examined the univalent influence of trait information (i.e., the influence of positive traits given no negative traits and the influence of negative traits given no positive traits). In these analyses, the impres- sions resulting from the negative traits were reverse scored, allowing for the examination of the relative influence of both trait valence and num- ber on impression formation. A 2 (valence; positive or negative) X 5 (number of traits; 1, 3, 4, 5, or 7) multiple regression yielded a signifi- cant main effect of number of traits on impression formation, F( 153, 745) = 362, p < .0001. The main effect for valence and the Number of Traits X Valence interaction were not reliable (ps > .7). Log-log transformations revealed that the slopes for both positive and negative traits were negatively accelerating. That is, for both positive and nega- tive traits, earlier incremental increases (e.g, from one to three traits) resulted in greater changes in impression than later increases (e.g., from four to seven traits).
the Dominan t Reactions X Threshold interaction, we per- formed a series of multiple regression analyses using conflicting reactions and dominan t reactions, as well as threshold level and participants as independent variables and subjective ambiva- lence as the dependent variable.
The results of these analyses are presented in the top panel of Table 4. Inspection of the panel reveals that there were main effects for participant, conflicting reactions, and dominan t re- actions. As in Experiment 1, subjective ambivalence is posi- tively associated with conflicting reactions (b = 0.85 ) and neg- atively associated with dominant reactions (b = -0 . 26 ) . More important , these main effects, as in Experiment 1, are qualified by the predicted Dominan t Reactions X Threshold interaction. This interaction reveals that the influence of dominan t reac- tions on subjective ambivalence differs, depending on whether the influence occurs below or above the threshold. As in Exper- iment 1, this interaction is interpreted further by examining the influence of conflicting and dominan t reactions on subjective ambivalence below and above the threshold. Following the de- composition of the Dominan t Reactions X Threshold interac- tion, we discuss the other effects observed in this analysis.
Observations below and above the threshold. The results of the regression analyses below the threshold (i.e., conflicting re- actions equal to 0 or 1 ) are presented in the middle panel of Table 4. Inspection of this panel reveals three significant results. As in Experiment 1, there were main effects for both dominan t (b = - 0 . 3 0 ) and conflicting (b = 1.37) reactions. These results replicate the results of Experiment I for the influence of con- flicting and dominan t reactions on subjective ambivalence be- low the threshold: Subjective ambivalence is a jo in t function of conflicting and dominan t reactions. Also, as in Experiment 1, the best formula for predicting subjective ambivalence below the threshold is approximately 5C - D (specifically, 1.37 times conflicting reactions minus 0.3 dominan t reactions, which sim- plifies to 4.6C - D) . In addition, these main effects were quali- fied by a significant Conflicting x Dominan t Reactions interac- tion that we discuss shortly.
The results of the regression analyses above the threshold are presented in the bottom panel of Table 4. One significant result was obtained: a main effect of conflicting reactions on subjective ambivalence (b = 0.35 ). This finding replicates the results of Experiment 1. Above the threshold, subjective ambivalence is solely a function of conflicting reactions.
Conflicting X Dominant Reactions interaction. Inspection of the top section of Table 4 reveals a Conflicting X Dominan t Reactions interaction that was not observed in Experiment 1. It is impor tant to note that this two-way interaction is qualified by a three-way interaction of conflicting reactions, dominan t reactions, and threshold level. This three-way interaction can b e interpreted by examining the Conflicting X Dominan t Reac- tions interaction for those observations that fall below and above the threshold in the middle and bottom sections of Table 4. The Conflicting × Dominan t Reactions interaction is sig- nificant for observations falling below the threshold (middle section) but is not significant for observations falling above the threshold (see bottom section). To interpret the significant two- way interaction for those observations falling below the thresh- old, we conducted separate analyses that regressed dominant reactions (and participants) on subjective ambivalence for

444 PRIESTER AND PETTY
Table 4 Results of Multiple Regression Analysis, Experiments 2 and 3
Predictor b d[ F
Participant C D C X T D X T D X C C X D X T
0.85 -0.26
(150, 2263) 3.7 < :0001 ( l, 2263) 757.4 < .0001 (1~ 2263) 101.5 < .01 ( 1, 2260) 41.7 < .0001 (1,2260) 38.9 < .0001 ( 1, 2260) 3.9 < .05 ( 1, 2259) 20.9 < .0001
Observations falling below the threshold C 1.37 D -0.30 C X D
(1, 1659) 146.0 < .0001 (1, 1659) 132.1 < .0001 (1, 1658) 12.6 < .0005
Observations falling above the threshold C 0.35 (1,451) 19.4 < .0001 D 0.07 ( 1,451 ) .8 > .3 C X D ( I, 450) .3 > .6
Note. C = conflicting reactions; D = dominant reactions; T = threshold level.
those observations with zero conflicting reactions and those ob- servations with one conflicting reaction. These analyses re- vealed that, as expected by the G T M of ambivalence, the influ- ence of dominant reactions on subjective ambivalence is greater given zero conflicting reactions (b = - 0 . 3 7 ) than given one con- flicting reaction (b = - 0 . 1 6 ) . In total, these analyses suggest that the dominant traits we presented to participants had their greatest impact on subjective ambivalence when there were no conflicting traits presented, and this impact was attenuated with the introduction of the first conflicting trait. When more than one conflicting trait was presented, the number of dominant traits no longer had any impact on subjective ambivalence.
Nature of the Relationship Between Conflicting Reactions on Subjective Ambivalence
As in Experiment 1, to examine the nature o f the relationship between conflicting reactions and subjective ambivalence, we calculated a power function. Using the same procedure as in Experiment 1, we found that the slope associated with conflict- ing reactions was equal to .51.
Tests of the Ability o f the Objective Ambivalence Models to Predict Subjective A mbivalence
To examine the ability o f the models to predict subjective am- bivalence across the full range o f data, we computed partial cor- relations among the models and subjective ambivalence for all observations (i.e., both those above and below the threshold). The ATM is set first such that t = 1 a n d p = .4 (as in Experiment 1 ) and second such that p = .5 (as determined by the power function analysis conducted on the data from Experiments 2 and 3), and the G T M is set first with p = .4 (as in Experiment 1 ) and second such that p = .5 (as determined by the power function analysis conducted on the data from Experiments 2
and 3 ). Table 5 presents the partial correlation coefficients ma- trix for Experiments 2 and 3 and reveals that both threshold models (with p set at ei ther .4 or .5 ) are at least as good or better than previous models in predicting subjective ambivalence across the full data set.
O f greater importance is that both the ATM and the G T M represented the specific properties of the data better than the previously proposed models. Specifically, when the level of con- flicting reactions was minimal, subjective ambivalence was a jo in t function o f the conflicting and dominant reactions. As the level o f conflicting reactions increased, subjective ambivalence became a function solely of the magnitude of the conflicting reactions. Finally, the nature of the relationship between con- flicting reactions and subjective ambivalence was positive and negatively accelerating. The threshold models of ambivalence are the only models that accurately account for these three properties of the data (see Figure 3). j2
Discussion
The results of Experiments 2 and 3 conform to the patterns predicted by the threshold models of ambivalence. When the magnitude o f conflicting traits was minimal , subjective ambiv- alence was a jo in t function o f the conflicting and dominant re- actions (specifically, 5C - D) . As the magnitude of conflicting traits became more than minimal (i.e., above the threshold), subjective ambivalence became influenced solely by the extent of conflicting information. Finally, subjective ambivalence in-
~2 As in Experiment 1, correlational analyses examining the ability of the models to predict subjective ambivalence were conducted above and below the threshold. The NAM and the SIM predicted better than the previously proposed models below the threshold, whereas the CRM pre- dicted better than the previous models above the threshold. The ATM and GTM predicted better than all previous models both above and below the threshold.

THE GRADUAL THRESHOLD MODEL OF AMBIVALENCE
Table 5 Partial Correlation Matrices: Experiments 2 and 3
Variable 1 2 3 4 5 6 ATM a ATM b GTM a GTM b
1. AMB 2. CRM .47 - - 3. SIM .50 .91 - - 4. NAM .50 .84 .94 - - 5. PAM .46 .95 .93 .84 6. CPM .42 .96 .84 .71
ATM a .52 .90 .95 .96 ATM b .52 .92 .96 .96
GTM a .52 .84 .92 .93 GTM b .52 .89 .94 .94
m
.65 m
.83 .81 - -
.86 .84 .99 - -
.77 .77 .96 .96
.81 .82 .98 .97 .99
Note. The n for all correlations except those associated with the positive acceleration model (PAM) is 2,416. The n associated with the correlations with the PAM (2,265) is smaller because of the exclusion ofatl responses in which the number of dominant and conflicting reactions are both equal to 0. AMB = ambiva- lence; CRM = conflicting reactions model; S1M = similarity-intensity model: NAM = negative accelera- tion model; CPM = cross-product model; ATM = abrupt threshold model; GTM = gradual threshold model. ap = .4. b,o = .5.
4 4 5
creased in a negatively accelerat ing funct ion as the a m o u n t of conflicting in format ion increased (i.e., C p, p < 1 ). The superi- ori ty o f the threshold models o f ambiva lence over previous models lies chiefly in the i r abil i ty to accoun t for these features of the data in Exper imen t 1 and to ant ic ipate these features in the da ta of Exper iments 2 and 3.
The results of Exper iments 2 and 3 also suggest tha t the G T M migh t be super ior to the ATM. T h a t is, the G T M accounts for the fact tha t the impac t of d o m i n a n t react ions on ambivalence decreased but was still significant as conflicting react ions went f rom 0 to 1. Recall t ha t this pa t te rn also was appa ren t in Exper- imen t 1, though the appropr ia te in teract ion t e rm was not sig- nificant. The advantage of the G T M lies in its abili ty to account for this gradually a t t enua t ing influence o f d o m i n a n t react ions on ambivalence as conflict increases.
In addi t ion to providing a test of the predict ive validity of our threshold models of ambivalence, Exper iments 2 and 3 also addressed the concerns t ha t arose f rom the design o f Experi- men t 1. The first o f these concerns was tha t the results of Exper- imen t I could have been the result of the specific at t i tude objects used. In contras t to the social issues used in Exper imen t 1, in Exper iments 2 and 3 we used a hypothet ica l o ther person as the at t i tude object. If the first concern had been valid, it would have been highly unlikely t ha t the results o f Exper imen t 1 would have been repl icated in Exper iments 2 and 3. The repl icat ion across such disparate classes of at t i tude objects attests to the abili ty of the threshold models to accoun t for subjective ambiv- alence across divergent domains . The second concern was tha t the corre la t ional design of Exper imen t 1 did no t allow us to conclude tha t the d o m i n a n t and conflicting react ions assessed caused feelings of ambivalence. In cont ras t to Exper imen t 1, in Exper iments 2 and 3 we man ipu la t ed the n u m b e r of d o m i n a n t and conflicting trai ts tha t individuals received abou t the target persons and repl icated the ma jo r findings o f Exper imen t I. Given this replicat ion wi th manipu la ted , ra ther t han measured, conflicting and d o m i n a n t in format ion , the conclus ion tha t the
conflicting and d o m i n a n t react ions p roduce feelings o f subjec- tive ambivalence is justified. The th i rd concern was tha t the m e a s u r e m e n t of the positive and negative bases o f the at t i tudes in Exper imen t 1 was not interval in nature , and thus some in- ferences (e.g., the negatively accelerat ing re la t ionship between confl ict ing react ions and subjective ambiva lence) may have been the result o f the methodology used ra ther than the underly- ing psychological processes. To address this concern, part ici- pants in Exper iments 2 and 3 were presented with discrete number s of positive and negative traits, t hus yielding rat io mea- sures of the a t t i tudina l bases. Because the re la t ionship inferred f rom the results of Exper imen t l was repl icated in Exper iments 2 and 3, concerns regarding the m e a s u r e m e n t of the positive and negative react ions in Exper imen t l are a t tenuated. 13
C o n c l u s i o n
We conducted the present research to examine how well the var ious models of objective ambivalence predic t subjective am-
~3 Because the subjective ambivalence measure does not constitute at least an interval scale, one could argue that interpretation of the power functions remain problematic (Anderson, 1972). This concern is ad- dressed by two observations. First, previous research (e.g., Latan~ & Harkins, 1976 ) has found that the use of measures similar to the sub- jective ambivalence measure used in Experiments 2 and 3 yields results similar in nature to both category rating scales (i.e., measures possess- ing interval properties) and behavioral responses. Second, the replica- tion of the negatively accelerating power function across Experiment 1 and across Experiments 2 and 3, given the divergent operationalizations of conflicting and dominant reactions, provides support for the infer- ence of the underlying psychological processes. That is, had the obser- vation of the power function been a function of the noninterval nature of the independent and dependent measures in Experiment 1, it is un- likely that the power function would have been replicated in Experi- ments 2 and 3, given the change in the nature of the independent vari- able. Nevertheless, replication of the power function results with in- terval or ratio scale measures for both independent and dependent variables is desirable.

446 PRIESTER AND PETTY
bivalence. The results of Experiment 1 suggested that none of the previously proposed models were adequate in predicting the experience of ambivalence across the entire range of conflicting and dominant reactions. Thus, on the basis of the results of Ex- periment 1, we proposed two threshold models of ambiva- l e n c e - o n e with a gradual threshold and one with an abrupt threshold. Experiments 2 and 3 provided the first experimental examinations of the influence of conflicting and dominant re- actions on subjective ambivalence and indicated that the GTM of ambivalence was superior to the other models in accounting for the pattern of data observed.
Psychological Bases of Subjective Ambivalence
The present research provides important and perhaps sur- prising discoveries as to how dominant and conflicting reactions combine to create subjective ambivalence. To summarize, across a diverse set of attitude objects and experimental proce- dures, we found that: (a) subjective ambivalence is a negatively accelerating function of conflicting reactions, (b) dominant re- actions matter only when conflicting reactions are minimal, and (c) the critical threshold for both Experiment 1 and Experi- ments 2 and 3 was quite low (i.e., a rating of just one conflicting reaction or just one conflicting trait). These results not only provide the basis for a mathematical model by which to predict subjective ambivalence (i.e., GTM) , but they also offer a pat- tern from which the underlying psychological processes of sub- jective ambivalence can be inferred.
Influence of Conflicting Reactions on Subjective Ambivalence
If individuals desire consistency (e.g., positively evaluated at- titude objects should be associated with only positive attributes, and negatively evaluated attitude objects should be associated with only negative attributes; see Brehm & Cohen, 1962; Fes- tinger, 1957; Heider, 1958; Osgood & Tannenbaum, 1955), it is plausible that the conflicting reactions (i.e., negative reactions associated with a positive attitude object, positive reactions as- sociated with a negative attitude object) are most psychologi- cally salient to the individual. That is, it is the inconsistency introduced by the conflicting reactions that is largely responsi- ble for the psychological experience of subjective ambivalence. Thus, dominant reactions might matter only when conflict is minimal, and even then, dominant reactions are weighted less than conflicting reactions (i.e., 5C - D) . The desire for evalua- tive consistency might also account for the negatively accelerat- ing relationship between conflicting reactions and subjective ambivalence. That is, the first few conflicting reactions would be the most disturbing of evaluative consistency and thus cause the greatest feelings of subjective ambivalence. Once consis- tency is disturbed, additional conflicting reactions would still add to the feelings of inconsistency, but to a smaller degree. Thus, the greatest increases in subjective ambivalence are found with the initial conflicting reactions, with less of an increase in subjective ambivalence with each additional conflicting reaction.
Influence of Dominant Reactions on Subjective Ambivalence
The present research found that when there are no or few conflicting reactions, the psychological experience of ambiva- lence is attenuated by the addition of dominant reactions (for similar results, see Thompson et al., 1995 ). It is interesting that some ambivalence models do not even allow for differences in the extent of ambivalence if there are no conflicting reactions, presumably because without opposite reactions there is no "ob- jective" ambivalence or conflict. Why do increasing dominant reactions attenuate subjective ambivalence when there are no or few conflicting reactions? There are at least two possible expla- nations for this finding.
As suggested previously, one explanation hypothesizes two separate underlying psychological processes, certainty and ten- sion, that are jointly responsible for subjective ambivalence. In this view, increasing conflicting reactions are associated with increasing tension, whereas increasing dominant reactions are associated with increasing certainty. As tension goes up, ambiv- alence goes up, and as certainty goes up, ambivalence goes down. This framework can account for the current data but would require an additional assumption that certainty pro- cesses operate mostly when conflict is minimal. Given our data, this framework would contend that with no conflicting reac- tions, subjective ambivalence reflects only certainty processes (i.e., subjective ambivalence would be correlated very highly with measured certainty), but as conflict alone increases, sub- jective ambivalence is determined mostly by tension processes (and would show a lower correlation with subjective certainty). Thus, one possibility is that there are two distinct psycholog- ical processes accounting for the feelings of subjective ambivalence. ,4
A second explanation hypothesizes one underlying psycho- logical process, tension, influenced by two separate kinds of conflicting reactions. First, subjective ambivalence is influenced by manifest conflicting reactions (i.e., conflicting information of which the individual is knowledgeable). However, if there are few or no conflicting reactions of which the individual is aware, anticipated or expected conflicting information could influence feelings of ambivalence. That is, when people are aware of in- formation of only one valence or predominantly of one valence, they might sometimes assume that there is information of an opposite valence of which they are unaware. These anticipated conflicting reactions could influence feelings of ambivalence, especially below the threshold (i.e., when actual conflicting re- actions are minimal) . When people have only a little informa- tion on one side of an issue (or of one valence), they might assume that there is information on the other side of the issue (or of opposite valence). As the amount of dominant informa- tion increases, people may be less likely to assume that there is
~4 An alternative approach might contend that subjective certainty was a more global attitude property that was determined in part by ambivalence but also by other factors such as attitude-relevant knowl- edge, attitude accessibility, and others. Another approach might view certainty and ambivalence as opposite poles on a bipolar continuum (see Gross, Holtz, & Miller, 1995, for additional discussion of attitude certainty).

THE GRADUAL THRESHOLD MODEL OF AMBIVALENCE 447
opposite information of which they are unaware. If anticipated conflicting information decreases as dominant information in- creases, this would account for decreased feelings of ambiva- lence as dominant reactions increase below the threshold (i.e., when there are few or no actual conflicting reactions). Once an individual is aware of conflicting reactions, however, it should be the manifest conflicting reactions that influence subjective ambivalence. According to this explanation, subjective ambiva- lence is caused by conflicting reactions both above and below the threshold (i.e., the psychological mechanism is the same), but above the threshold manifest conflict is the primary deter- minant of ambivalence, and below the threshold (i.e., when ac- tual conflict is low) anticipated conflict becomes important.
The GTM of Ambivalence
The present research provides the basis for advancing the GTM of ambivalence. This model incorporates features of the SIM, CRM, NAM, and French's threshold model of frustra- tion. In sum, the GTM proposes that: (a) ambivalence increases in a negatively accelerating manner as the number of conflicting reactions increases; (b) ambivalence is a negative function of the extent of dominant reactions when there are no conflicting reactions; and (c) as the number of conflicting reactions in- creases, the impact of dominant reactions on ambivalence grad- ually decreases such that at some level of conflicting reactions (i.e., the threshold), the number of dominant reactions no longer has a significant impact on subjective ambivalence. The mathematical representation of the GTM is expressed as
A = 5C p - D I/~,
where p < 1, and a constant of one is added to C and D. Several aspects of the GTM are worth commenting on. First,
the precise threshold at which dominant reactions no longer have a significant impact on subjective ambivalence can vary. Although the threshold was found to occur at just one conflict- ing reaction in both sets of studies reported here, it is possible that the use of other scales to assess conflicting and dominant reactions or other procedures to manipulate positivity and neg- ativity could result in a different threshold. For example, use of scales with a smaller range (e.g., 4 points, see Kaplan, 1972) could result in a lower threshold (e.g., 0), whereas the use of 100-point scales would almost certainly result in a threshold greater than 1. In addition, the statistical power of the study as indexed by the number of data points included could influence the threshold. That is, although dominant reactions are postu- lated to have a smaller impact on subjective ambivalence as con- flict increases, the more data points entered, the more likely it is that this increasingly smaller effect can be detected. Thus, methodological factors might influence the specific threshold value obtained in any given study. Similarly, conceptual factors, such as the personal relevance of the attitude objects, might also influence the specific threshold value obtained. The importance of the present research lies not in uncovering a universal thresh- old value but rather in pointing out that a threshold gradually emerges above which subjective, ambivalence is determined solely by conflicting reactions (as anticipated initially by French's threshold model of frustration).
Second, the specific power function (p) is not specified by the model. In the present research, p was determined empirically to be between .4 and .5. Again, the importance of the present research lies not in specifying a universal power function value at which conflicting reactions are associated with subjective am- bivalence. Rather, the importance of the present research lies in suggesting that the general function of conflicting reactions and subjective ambivalence is positive and negatively accelerating (rather than linear or positively accelerating, as suggested by some ambivalence models; cf. Latan6, 1981 ).
Third, it is important to clarify the meaning of both the threshold and the relationship of conflicting to dominant reac- tions (i.e., 5C - D) . The threshold, from a mathematical per- spective, constitutes a moderator, such that below the thresh- old subjective ambivalence is the result of both conflicting and dominant reactions, whereas above the threshold subjective ambivalence is the result solely of conflicting reactions. As noted previously, from a conceptual perspective, it could be that this threshold moderates the specific psychological mech- anism responsible for the experience of ambivalence, such that below the threshold subjective ambivalence is the result mostly of certainty, whereas above the threshold subjective ambiva- lence is the result mostly of tension. Alternatively, it could be that there is one underlying psychological mechanism and that the threshold moderates which factors influence the psycho- logical process. Thus, below the threshold, dominant reactions influence the number of anticipated conflicting reactions, and it is the anticipated conflicting reactions (unmeasured in this research) that influence subjective ambivalence. Above the threshold, however, manifest conflicting reactions influence subjective ambivalence. Which of these explanations offers a better account is an empirical issue, which future research should address.
The term 5C - D is empirically derived from both Experi- ment l and Experiments 2 and 3. The importance of the term lies in the concept that, below the threshold, subjective ambiv- alence is a weighted joint function of conflicting reactions mi- nus dominant reactions. The conflicting reaction term is multiplied by 5 to give the conflicting reactions greater weight than dominant reactions. That is, the GTM of ambivalence is constructed to allow for a greater influence of conflicting reactions than dominant reactions on subjective ambivalence (see Panel H, Figure l ). The specific value of the coefficient, such as 5C (found in Experiment 1 and Experiments 2 and 3), is not important, rather, it is the general prediction that conflicting reactions have a greater positive influence on sub- jective ambivalence than the negative influence of dominant reactions that is important.
Finally, it is important to note that our threshold models account for variance in subjective ambivalence that is pro- duced by the intrapersonal positive and negative reactions as- sociated with the attitude object. However, the fact that these models, like the previously proposed models, account for only a moderate amount of the subjective ambivalence associated with an object suggests that there may be other factors that also contribute to ambivalence. One interesting possibility sug- gested by balance theory (Heider, 1958) concerns interper- sonal factors such as the extent to which one's attitude is con-

448 PR1ESTER AND PETTY
sistent or inconsistent with the opinions o f significant others (e.g., Priester & Petty, 1994).
Utility o f the A mbivalence Construct
At the most basic level, this article examines the adequacy of previous models o f objective ambivalence to reflect subjective ambivalence and offers a new model to predict how subjective ambivalence is influenced by its component elements. Although the concept of att i tudinal ambivalence has existed in social psy- chology since at least the 1960s (Kaplan, 1972; Scott, 1966, 1969), it has not generated a great deal o f research. One expla- nation for this dearth o f investigation is that atti tude theorists have, until recently, been guided by an overriding assumption that rendered the study of ambivalence trivial. Theories such as cognitive dissonance (Festinger, 1957) and balance theory (Heider, 1946) have taken as their most basic postulate that in- dividuals are motivated to reduce conflicting reactions. In sum- marizing this paradigm, Brown (1965) wrote that " h u m a n na- ture abhors incongrui ty-d issonance- imbalance" (p. 604 ), and people therefore presumably were motivated to resolve such in- consistencies so that they were relatively rare. It has not been until recently that researchers interested in attitudes (e.g., Cac- ioppo & Berntson, 1994; Thompson & Zanna, 1995; Thompson et al., 1995; Zanna & Rempel , 1988; Zanna & Thompson, 1991 ) have begun to question this assumption with renewed vigor. As this assumption is put aside, a different view of the human evaluator emerges. Rather than being driven to reduce all inconsistencies in evaluation by any means possible, humans are viewed instead as being capable of maintaining, as well as reducing, their conflicting reactions. Exciting research ques- tions emerge with this more balanced view.
R e f e r e n c e s
Anderson, N. H. (1968). Likeableness ratings of 555 personality-trait words. Journal t~/'Personality and Social Psychology, 9, 272-279.
Anderson, N. H. ( 1971 ). Integration theory and attitude change. Psy- chological Review, 78, 171-206.
Anderson, N. H. (1972). Cross-task validation of functional measure- ment. Perception & Psychophysics, 12, 389-395.
Bargh, J. A., Chaiken, S., Govender, R., & Pratto, E (1992). The gener- ality of the automatic attitude activation effect. Journal of Personality and Social Psychology, 62, 893-912.
Bassili, J. N., & Fletcher, J. E ( 1991 ). Response-time measurement in survey research: A method for CATI and a new look at nonattitudes. Public Opinion Quarterly, 55, 331-346.
Breckler, S. J. (1994). A comparison of numerical indexes for measur- ing attitude ambivalence. Educational and Psychological Measure- ment. 54, 350-365.
Brehm, J. W., & Cohen, A. R. (1962). Explorations in cognitive disso- nance. New York: Wiley.
Brown, J. S., & Farber, I. E. (1951). Emotions conceptualized as in- tervening variables--With suggestions toward a theory of frustration. Psychological Bulletin, 48, 465-495.
Brown, R. ( 1965 ). Socialpsychology. New York: Free Press. Brown, R. (1974). Further comment on the risky shift. American Psy-
chologist, 29, 468-470. Cacioppo, J. T., & Berntson, G. (1994). Relationship between attitudes
and evaluative space: A critical review, with emphasis on the separa- bility of positive and negative substrates. Psychological Bulletin, 115, 401-423.
Chein, I. ( 1951 ). Notes on a framework for the measurement of dis- crimination and prejudice. In M. Jahoda, M. Deutsch, & S. W. Cook (Eds.), Research method~ in social relations with especial reference to prejudice (pp. 381-390). New York: Dryden Press.
Cohen, J., & Cohen, C. ( 1983 ). Applied multiple regression~correlation .[br the behavioral sciences ( 2nd ed.). Hillsdale, N J: Erlbaum:
Costello, R. M., Rice, D. P., & Schoenfeld, L. S. (1974). Attitudinal ambivalence with alcoholic respondents. Journal of Consulting and Clinical Psychology, 42, 303-304.
Davidson, A. R., Yantis, S., Norwood, M., & Montano, D. E. (1985). Amount of information about the attitude object and attitude-be- havior consistency. Journal of Personality and Social Psychology, 49, 1184-1198.
Dollard, J., Miller, E., Doob, L. W., Mowrer, O. H., & Sears, R. R. ( 1939 ). Frustration and aggression. New Haven, CT: Yale University Press.
Eagly, A. H., & Chaiken, S. ( 1993 ). The psychology of attitudes. Fort Worth, TX: Harcourt, Brace, Jovanovich.
Edwards, A. L. ( 1946 ). A critique of "neutral' items in attitude scales constructed by the method of equal appearing intervals. Psychologi- cal Review, 53, 159-169.
Festinger, L. (1957). A theory of cognitive dissonance. Evanston, IL: Row, Peterson.
French, J. R. P. (1944). Organized and unorganized groups under fear and frustration. Authority and Frustration: Sludies in Topological and Vector Psychology IlL University ~f lowa Studies in ChiM Welfare, 20, 231-307.
Gilmore, R. E (1982). Conflict or dissonance: A reinterpretation of counterattitudinal essay writing. Dissertation Abstracts Interna- tional 43, 1659.
Green, R. E, & Goldfried, M. R. ( 1965 ). On the bipolarity of semantic space. Ps),chological Monographs: General and Applied, 79(6), 1- 31.
Gross, S. R., Holtz, R., & Miller, N. (1995). Attitude certainty. In R. E. Petty & J. A. Krosnick (Eds.), Attitude strength: Antecedents and consequences (pp. 215-245 ). Mahwah, N J: Erlbaum.
Hass, R. G., & Eisenstadt, D. ( 1993, August). Ambivalent racial atti- tudes. In R. E. Petty (Chair), Attitudinal ambivalence. Symposium presented at the 101 st Annual Convention of the American Psycho- logical Association, Toronto, Ontario, Canada.
Hass, R. G., Eisenstadt, D., Katz, I., & Chaudhary, N. (1996). Ambiv- alence: A comparison of methods, measures, and concepts. Unpub- lished manuscript, Brooklyn College, City University of New York.
Hass, R. G., Katz, I., Rizzo, N., Bailey, J., & Eisenstadt, D. (1991). Cross-racial appraisal as related to attitude ambivalence and cogni- tive complexity. Personality and Social Psychology Bulletin, 17, 83- 92.
Hass, R. G., Katz, I., Rizzo, N., Bailey, J., & Moore, L. (1992). When racial ambivalence evokes negative affect, using a disguised measure. Personality and Social Psychology Bulletin, 18, 786-797.
Heider, E (1946). Attitudes and cognitive organization. Journal of Psy- chology, 21. 107-112.
Heider, E ( 1958 ). The psycholog.v ~)[interpersonal relationships. New York: Wiley.
Hull, C. L. (1943). Principles o['behavior New York: Appleton-Cen- tury-Crofts.
Judd, C. M., & McClelland, G. H. (1989). Data analysis: A model- comparison approach. Orlando, FL: Harcourt Brace Jovanovich.
Kaplan, K. J. ( 1972 ). On the ambivalence-indifference problem in at- titude theory and measurement: A suggested modification of the se- mantic differential technique. P~Tchological Review, 77, 361-372.
Katz, I., Glass, D. C., & Cohen, S. (1973). Ambivalence, guilt, and the scapegoating of minority group victims. Journal of Experimental Social Psychology, 9. 423-436.

THE GRADUAL THRESHOLD MODEL OF AMBIVALENCE 449
Katz, 1., Glass, D. C., Lucido, D. J., & Farber, J. (1977). Ambivalence, guilt, and the denigration of a physically handicapped victim. Journal of Personality, 47. 419-429.
Katz, I., & Hass, R. G. (1988). Racial ambivalence and American value conflict: Correlational and priming studies of dual cognitive struc- tures. Journal of Personality and Social Psychology, 55, 893-905.
Katz, I., Wackenhut, J., & Hass, R. G. (1986). Racial ambivalence, value duality, and behavior. In J. E Dovido & S. L. Gaetner (Eds.), Prejudice, discrimination, and racism (pp. 35-59). New York: Aca- demic Press.
Klopfer, E J., & Madden, T. M. (1980). The middlemost choice on attitude items: Ambivalence, neutrality, or uncertainty? Personalit.v and Social Psycholog.v Bulletin, 6, 97-101.
Komorita, S. S., & Bass, A. R. ( 1967 ). Attitude differentiation and eval- uative scales of the semantic differential. Journal of Personalit.v and Social Psychology, 6, 241-244.
Latan6, B. ( 1981 ). The psychology of social impact. American Psychol- ogist, 36, 343-356.
Latan6, B., & Harkins, S. ( 1976 ). Cross-modality matches suggest an- ticipated stage fright a multiplicative power function of audience size and status. Perception & Psychophysics, 20, 482-488.
Moore, M. ( 1973 ). Ambivalence in attitude measurement. Educational and Psychological Measurement, 33. 481-483.
Osgood, C. E., & Tannenbaum, P. H. (1955). The principle of congru- ity in the prediction of attitude change. Psychological Review 62, 42- 55.
Ostrom, T. M. (1969). The relationship between the affective, behav- ioral, and cognitive components of attitude. Journal of Experimental Social Psychology, 5, 12-30.
Petty, R. E., Priester, J. R., & Wegener, D. T. (1994). Cognitive processes in attitude change. In R. S. Wyer & T, K. Srull (Eds.), Handbook of social cognition (2nd ed., Vol. 2, pp. 69-142). Hillsdale, NJ: Erlbaum.
Priester, J. R. (1994). The threshold model of ambivalence: An exami- nation of the bases of attitudinal ambivalence through tests of compet- ing models. Unpublished doctoral dissertation, Department of Psy- chology, Ohio State University.
Priester, J. R., & Petty, R. E. ( 1994, August). Attitudinal ambivalence and perceived parent-self conflict. In R. E. Petty (Chair), Ambiva- lence and tmcertainty--Focus on the self. Symposium presented at the 102nd Annual Convention of the American Psychological Asso- ciation, Los Angeles.
Scott, W. A. ( 1966 ). Brief report: Measures of cognitive structure. Mul- tivariate Behavioral Research. I (3), 391-395.
Scott, W. A. ( 1969 ). Structure of natural cognitions. Journal of Person- ality and Social Ps.vchology, 12, 261-278.
Stevens, S. S. (1957). On the psychophysical law. Psychological Review 64. 153-181.
Thompson, M. M., & Zanna, M. P. ( 1995 ). The conflicted individual: Personality-based and domain specific antecedents of ambivalent so- cial attitudes. Journal of Personality, 63, 259-288.
Thompson, M. M., Zanna, M. P., & Griffin, D. W. ( 1995 ). Let's not be indifferent about (attitudinal) ambivalence. In R. E. Petty & J. A. Krosnick (Eds.), Attitude strength: Antecedents and consequences (pp. 361-386). Mahwah, N J: Erlbaum.
Thurstone, L. L. ( 1928 ). Attitudes can be measured. American Journal of Sociology, 33. 529-554.
Thurstone, L. L., & Chave, E. J. ( 1929L The measurement of attitude. Chicago: University of Chicago Press.
Tourangeau, R., Rasinski, K. A., Bradburn, N., & D'Andrade, R. (1989). Carryover effects in attitude surveys. Public Opinion Quar- terly, 53. 495-524.
Wegener, D. T., Downing, J., Krosnick, J. A., & Petty, R. E. (1995). Measures and manipulations of strength-related properties of atti- tudes: Current practice and future directions. In R. E. Petty & J. A. Krosnick (Eds.), Attitude strength: Antecedents and consequences (pp. 455-487). Mahwah, N J: Erlbaum.
Winer, B. J. ( 1971 ). Statistical principles in experimental design ( 2nd ed.). New York: McGraw-Hill.
Wood, W. (1982). Retrieval of attitude-relevant information from memory: Effects on susceptibility to persuasion and on intrinsic mo- tivation. Journal of Personalit.v and Social Psychology,, 42, 798-810.
Wood, W., Kallgren, C. A., & Preisler, R. M. ( 1985 ). Access to attitude- relevant information in memory as a determinant of persuasion: The role of message attributes. Journal of Experimental Social Psychol- og.v, 21, 73-85.
Zanna, M. P., & Rempel, J. K. (1988). Attitudes: A new look at an old concept. In D. Bar-Tal & A. W. Kruglanski (Eds.), The social ps.vchology ofkno~qedge (pp. 315-334). Cambridge, England: Cam- bridge University Press.
Zanna, M. P., & Thompson, M. M. ( 1991, September). Let's not be indifferent about (attitudinal) ambivalence. Paper presented at the Ohio State University Symposium on "Attitude Strength: Anteced- ents and Consequences", Nags Head, North Carolina.
Received July 31, 1995 Revision received March 27, 1996
Accepted M a r c h 29, 1996 •