Embed Size (px)
Citation preview

Appendix A:
Letters of Support for the Trinidad-Westhaven Coastal Watershed Project

BOARD OF SUPERVISORS
COUNTY OF HUMBOLDT825 5TH STREET
EUREKA, CALIFORNIA 95501-1153 PHONE (707) 476-2390 FAX (707) 445-7299
Apri112,2005 RECEIVED
Chi- Wei Lin, Mayor
CityofTrinidad409 Trinity StreetTrinidad. CA 95570
APR Z 8 ZOO!
City of Trinidad
Integrated Coastal Watershed Management PlanRE:
Dear Mayor Lin:
As Humboldt County's Sth District Supervisor, I am pleased to write in support ofTrinidad's efforts to secure funding from the State Water Resources Control Board forthe development of an Integrated Coastal Watershed Management Plan for the TrinidadArea of Special Biological Significance (ASBS).
As you know, I am extremely interested in plans that will improve the quality ofwateron land and in the watersheds that empty into the ocean. I believe the proposed projectwhich seeks to preserve the pristine conditions of the water and kelp beds in the oceanaround Trinidad, will most certainly assist to prevent discharge of pollutants into this areaof the ocean
I commend the City for taking a proactive approach and utilizing this opportunity towork with other communities to solve water quality problems.
Sincerely,
-({1
~ 5th D .. S . ..t, lstnct upervlsor
of Humboldt
JG:kh

STANDING COMMITTEES,
BUDGET & FISCAL REVIEW,
CHAIR
ENVIRONMENTAL QUALITY
GOVERNMENTAL ORGANIZATION
HEALTH
HUMAN SERVICES
VETERANS AFFAIRS
w~"' , ~~,."." , , ~~ ~"
LEGISLATIVE BUDGET, CHAIR
SELECT COMMITTEES,
CALIFORNIA'S WINE INDUSTRY,
CHAIRSENATOR
WESLEY CHEsBRO
SECOND SENATORIAL DISTRICT
~~v~~vrm~" ,~~~,~~~,~, , ,~& MENTAL HEALTH, CHAIR
BAY AREA TRANSPORTATION
MOBILE & MANUFACTURED
HOMES
RURAL EDUCATION
April 28, 2005RECEIVED
MAY O 9 ZOOS
Chi-Wei Lin, MayorCityofTrinidadPO Box 390Trinidad. CA 95570
City of Trinidad
RE: Support for an Integrated Coastal Watershed Management Plan for the Trinidad Area
of Special Biological Significance
Dear Mayor Lin
I am writing to offer my support for the City of Trinidad and its efforts to secure fundingfor an Integrated Coastal Watershed Management Plan for the Trinidad Area of SpecialBiological Significance. Funding for this project will improve the quality of water in theocean as well as rivers, springs and wells in this region.
Trinidad Bay is an important and significant resource not only for Humboldt County butfor the State of California. This area of Special Biological Significance provides manybenefits and preserves the pristine nature of this significant resource. I support the effortsof the City to address polluted runoff and preserve the water quality in local watersheds.
I am pleased to support this project and am pleased with the City's efforts to securepartnerships with the broader community. If I can be of assistance with this project, donot hesitate to contact me. :"?'c7,"',,",ic,..c"'.,~c~
Sincerely,
-V4IJ..t (---State
(1ffESBRo'
6r. Second District
WC:sar
444 GEORGIA STREETVALLEJO, CA 94590TEL (707) 648-5312FAX(
710 E STREET, SUITE 150EUREKA, CA 95501TEL (707) 445-6508FAX (707) 445-6511
PrintBrl nn RR"""/Rrl PRDRf
1040 MAIN STREET, SUITE 205NAPA, CA 94559
TEL (707) 224-1990FAX (707) 224-1992
PO BOX 785UKIAH, CA 95482
TEL (707) 468-8914FAX (707) 468-8931
10 D STREET. SUITE 120ASANTA ROSA. CA 95404
TEL (707) 576-2771.-AX '707) 578-2773

~~~~!:,- ~
-" ' --'1
~ ~
-~/ ~~
~ -.., ~. ~ '"-"'1 ~, ..." ~cjJer(a---7-
~ ,/~.-:-,)
~~-:::=:::::~::::>~~-;;;:; "'--
~ ~ ----~ ~ --~ , ~ --'-:".
~- ~~~."
-// ~
-,6/ /
~
RECEIVED
APR ZMayor Chi- Wei Lin409 Trinity StreetTrinidad, Ca. 95570
zoos
City of Trinidad
RE: Support of the City's Grant Application for the development of anIntegrated Coastal Watershed Management Plan
Dear Mayor:
Trinidad Rancheria has a long-standing interest in protecting stream and oceanwater quality on and around our properties. Our members gather traditionalfoods at the water's edge. The sole drinking water source for our Trinidad andWesthaven tribal neighborhoods and several of our tribal businesses is waterfrom Luffenholtz Creek. As the owners of Trinidad Harbor, we want to see thequality of the ocean water maintained for the benefit of our customers andvisitors.
Trinidad Rancheria has been proactive in water quality protection activities.Trinidad Rancheria has an EPA Section 106 Water Quality Grant that supportsan environmental staff and has paid for various water quality samplingequipment, including a 20-foot skiff for ocean water sampling. The Rancheriaalready has a Quality Assurance Project Plan (QAPP) in place for certainmonitoring activities, and has conducted several years of wet- and dry-seasonmonitoring in Trinidad Bay. Responding to State Water Resources ControlBoard concerns about protecting water quality and kelp bed habitat within theTrinidad Area of Special Biological Significance, our environmental staffattended the SWRCB workshop at Scripps Oceanographic Institute in January2005 dealing with the statewide enforcement program for ASBS's. This is thefirst step in Trinidad Rancheria's effort to modify our practices at the harbor tomeet the State's concerns.
We are committed to helping the City of Trinidad to fulfill the grant scope ofwork within the constraints of our available resources. We are interested inlooking into ways that we can contribute to the project by possibly sharing staff
P.O. BOX 630- TRINIDAD, CALIFORNIA 95570- (707) 677-0211 -FAX (707\ 677-3921

time and equipment resources for project activities that relate to the Rancheria'sconcerns. Additionally, Trinidad Rancheria has a Water Quality Educationcomponent in its Youth Program activities. The Rancheria is in a position tohelp with cooperative water quality education activities for area youth, as it didpreviously when the Rancheria funded the visit by Captain Moore of theAlgalita Marine Research Foundation at Trinidad School to talk about plasticpollution in the ocean. Finally, the Rancheria has an active GeographicInformation Systems program with recent aerial photos of Trinidad Harbor,which could be integrated into GIS activities for the grant scope of work.
Trinidad Rancheria strongly supports the City's grant application for thedevelopment of an Integrated Coastal Watershed Management Plan. We hopethat this collaborative effort will bring effective solutions to some of the long-standing water quality problems in our area, particularly the turbidity problemsin the City's water source.
We look forward to cooperating on this project with the City of Trinidad.
Sincerely,
lJ~~~
Garth Sundberg, Tribal Chairman

Marine Laboratory
Chi-Wei Lin, Mayor
City of Trinidad
409 Trinity
Trinidad. CA 95570
Dear Mayor Lin:
I am pleased to provide a supportive letter on behalf of the City of Trinidad's efforts todevelop a regional watershed management plan and to seek funding from the State WaterResources Control Board Proposition 50 Grant Program. We all recognize that protectingwatersheds and maintaining water quality standards is essential for environmental preservation.As you may know, Humboldt State University and the Telonicher Marine Lab (TML) in Trinidadare currently completing a study of water and wastewater use and discharge from the TML in aneffort to comply with ASBS requirements and to help preserve water quality of Trinidad Bay. TMLand the City of Trinidad both have a vested interest in preserving the pristine condition of thewater and kelp beds of Trinidad Bay and we are both committed to preserving and maintainingthe high quality water of Trinidad Bay.
Although I have not yet identified explicit ways in which we can contribute to your efforts,I do wish to extend an open invitation for discussions of whatever thoughts you may haveconcerning a future University or Marine Lab role in your project. Among other things, we may beable to provide assistance in marine bioassay of Trinidad runoff waters if that proves to be anarea where you will require assistance in the future.
wish you the very best success in your grant application.
David Hankin
I
/L-,
Professor and Chair, Fisheries Biology
Acting Director, Telonicher Marine Laboratory
cc: Alex Culick, Winzler and Kelly, Eureka, CA
Robert Schulz and David Ho5kin5, HSU
p .0. Box 690, Trinidad, California 95570-0690 .(707) 826-3671 .FAX (707) 826-3682
ThP ralifnmia Stal~ I Jniv~..itv

!+~! HUMBOLDTLlf.- STATE UNIVERSITY
May 2, 2005Chi-Wei Lin, MayorCity of TrinidadP.O. Box 390Trinidad, CA 95570
Dear Mayor Lin
CICORE (Center for Integrative Coastal Observation, Research and Education) would like theCity of Trinidad's permission to attach water quality monitoring equipment to Trinidad Pier thissummer. We are also seeking permission from the Trinidad Rancheria. CICORE, established in2002, is a group of NOM funded California State University campuses whose mission is toprovide water quality and habitat map information for estuarine and coastal locations. CICOREprovides free data that may be used by many different people, including those involved withprivate industry, resource managers, scholars and educators. Humboldt State University is thenorthernmost location in this collective effort.
You can visit the HSU CICORE website (http:llcicore.humboldt.edu) in order to see the type ofwater quality data currently being collected in Humboldt Bay, and these same variables wouldalso be collected from the pier. A Yellow Springs Instruments sonde (YSI 6600 EDS datalogger) is used to record tidal elevation, water temperature, salinity, dissolved oxygen, pH,turbidity, and chlorophyll every 15 minutes. Data on the website are updated monthly wherewater quality graphics can be generated or the data may be downloaded as a file. We arecurrently undergoing steps to convert the Humboldt Bay sonde to real-time, and would like toinstall another sonde with a real-time data acquisition system at the Trinidad Pier this summer.This proposed CICORE sonde and communication infrastructure, valued at over $20,000, is
federally financed by NOM.
Since the mission of CICORE is to provide water quality information and habitat maps to thepublic, we hope our data collected in this new location will be useful as a partial description ofwater quality in the Trinidad Area of Special Biological Significance. If you agree that this is aproductive collaboration, please send a letter of permission to Dr. Frank J. Shaughnessy.
~B ~--! .
Frank J. Shaughnessy, PhD V
Principle Investigator for HSU CICOREDepartment of Biological Sciences1 Harpst St.Humboldt State UniversityArcata. CA 95521

TRUSTEES: Don AUanMelody Hamilton
Kathleen LakeGail Ward
ADVISERS:Jeanine MartinBen MooreheadTom Lindquist
April 8, 2005
Mayor Chi Wei LinP. 0. Box 390Trinidad, CA 95570
Re: Support of City's grant application for the development of an Integrated Coastal WatershedManagement Plan
Dear Honorable Mayor Chi Wei Lin:
The Humboldt North Coast Land Trust has a long standing interest in the quality ofwaters increeks, rivers and the ocean in the Trinidad area. We hold several properties and easements withbeach access as well as a creek easement and support maintaining and even improving the healthof the local environment. We therefore strongly support the City's grant application for a CoastalWatershed Management Program grant to bring together a local watershed collaborative project.We hope that this collaborative effort will bring effective solutions to some of the water qualityconcerns in our area.
Sincerely,
-~ ~~
~, -"'2$'Gai enny .
Pre~ident
p .0. Box 457, Trinidad, CA 95570-0457Phone (707) 677-0716/ www.hnclt.org
Gail KennyPresident 677-{!515
John CalkinsVice-President 677-3885
Matthew MarshallSeaetary 822-7117
Ned SimmonsTreasurer677-{!716

Af"'GREEN DIAMOND
RESOURCE COMPANYT (707) 668-4400
F (707) 668-3710
greendiamond.cor
California Timberlands Division
P.O. Box 68 Korbel, California
95550-0068
Watershed Assessment Proposal AgreementIntegrated Coastal Watershed Management Plan for the Trinidad ASBS
Purpose
The following agreement describes the commitments of Green Diamond Resource Company(hereinafter, "Landowner") and the City of Trinidad in regards to the Integrated CoastalWatershed Management Plan for the Trinidad ASBS (the "project") on real property owned byLandowner located within the Luffenholtz, McConnahas and Mill Creek watersheds, HumboldtCounty (the "property"). The Landowner has spent ninety-four thousand five hundred dollars($94,500) in the past two years and has budgeted one hundred fifty thousand dollars ($150,000)for the near future to fund road upgrades, watercourse crossing construction, and repairs withinthe assessment area.
Landowner is aware that the project will be submitted to the California State Water ResourcesControl Board (the "SWRCB") for funding consideration under Proposition 50. Landownerunderstands the objectives of the project and the City's need for access to the property tofacilitate pre-project evaluation. Landowner's assistance in this regard should not be construedas creating or endorsing any restriction, limitation, or encumbrance on Landowner's use of the
property.
Access PermissionII.
Landowner hereby grants the City of Trinidad, their contractors and Board representativespermission to access the property for a pre-project evaluation, if necessary; and if an agreementfor the project substantially as proposed is entered into between the City of Trinidad and theBoard, Landowner may, subject to review of the agreement between the City and the Board,grant permission to perform the project and for any necessary contract inspections by theBoard's representatives under the terms of an Entry Permit to be written at that time andacceptable to Landowner. Access for post-project follow up maintenance, inspection, andmonitoring purposes may be agreed upon with written permission.
Access pursuant to this Agreement is limited to those portions of Landowner's property wherepre-project evaluation field work is to be performed and those additional portions of the realproperty which must be traversed to gain access to those sites. Landowner shall be givenreasonable and actual notice of any needed access and all necessary arrangements shall bemade with Landowner prior to such access.
III. Duration
This Agreement shall be effective on the latest date signed by either of the parties below andshall terminate on the earlier of (i) the date of execution of the Entry Permit contemplatedabove, or (ii) the date of denial of the project proposal by the Department, or (iii) June 30, 2006.
IV. Liabilities
Reasonable precautions will be exercised by the City of Trinidad, its employees and contractorsto avoid injury to persons and damage to property.
The City of Trinidad agrees to indemnify, defend and hold harmless Landowner from any and allloss, cost, damage, claim or expense of any nature whatsoever (including attorney's fees), onaccount of injuries to or death of any persons whomsoever, including the City of Trinidad, theBoard's or Landowner's representatives or employees, and any and all damage to property towhomsoever belonging, arising or growing out of, or in any way connected with the project, orcaused or occasioned, in whole or in part, by reason of or arising during the presence of the Cityof Trinidad, the Board or their respective representatives or employees upon or in proximity tothe property of landowner.
v. Contacts
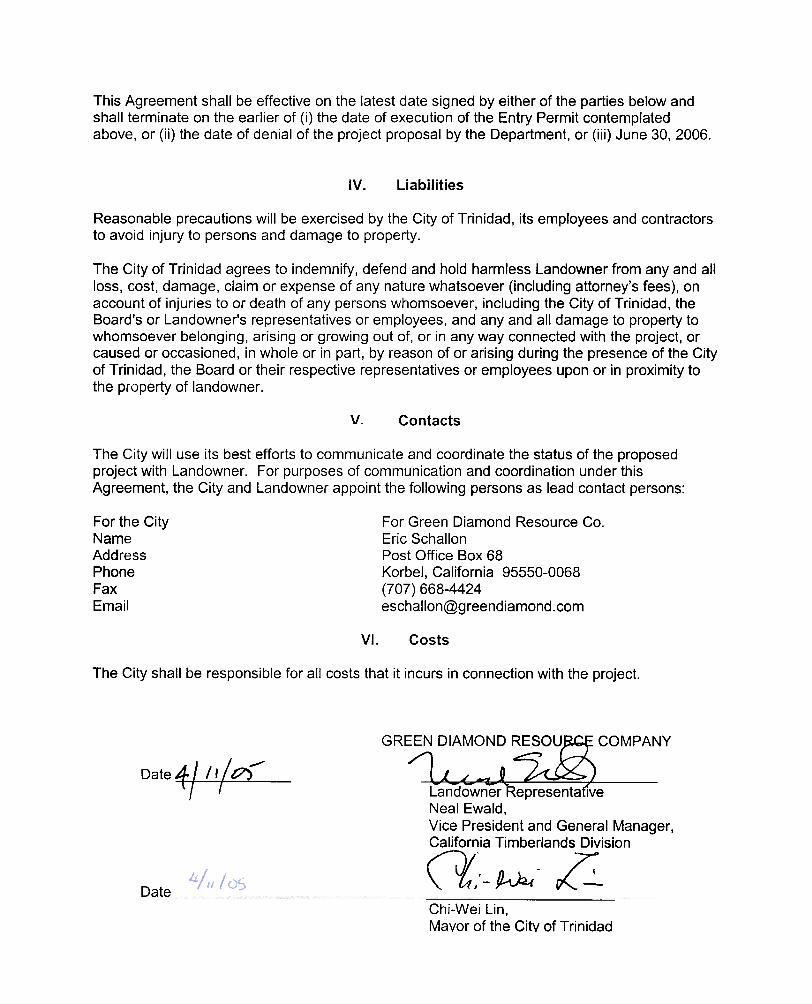
The City will use its best efforts to communicate and coordinate the status of the proposedproject with Landowner. For purposes of communication and coordination under thisAgreement, the City and Landowner appoint the following persons as lead contact persons:
For the CityNameAddressPhoneFaxEmail
For Green Diamond Resource Co.Eric SchallonPost Office Box 68Korbel, California 95550-0068(707) 668-4424eschallon@g reend iamond .com
VI. Costs
The City shall be responsible for all costs that it incurs in connection with the project.
Date~
GR~ DIAMOND ~OUt;z COMPA
~:nd~w-;;ef Re~~eNeal Ewald,Vice President and General Manager ,California Timberlands Division
a.r_~- ZDateChi-Wei Lin,Mayor of the City of Trinidad
Humboldt County Department of Health and Human Services
DIVISION OF ENVIRONMENTAL HEALTH
100 H Street -Suite 100- Eureka, CA 95501Voice: 707-445-6215- Fax: 707-441-5699- Toll Free: 800-963-9241
env hea Ith@co .h umbo Idt.ca. us
April 26, 2005RECEIVED
APR 28 ZOOS
Mayor Chi Wei Lin409 Trinity StreetTrinidad, CA 95570
Support of the City's Grant Application for the development of an Integrated Coastal
Watershed Management Plan for the Trinidad ASBSRe
Dear Mayor:
The Hurnboldt County Division of Environmental Health recognizes that protecting watershedsand maintaining water quality standards is essential to public health and environmentalpreservation. Evaluating and improving the water resources in the Trinidad area will bebeneficial to both public health and biological communities. The Division of EnvironmentalHealth enthusiastically supports the work to be accomplished within the scope of the grant being
sought.
If you need any further assistance, please do not hesitate to contact me at (707) 268-2209.
.Regards, .
=:PI ~-
David SpinosaLand Use Program Manager
Brian Cox. Directorcc:
P.O. Box 2015 (4468 6U1 Ave. Westhaven) Trinidad CA 95570 (707) 677-0798 [email protected]
.,
April 20, 2005
RECEIVED
The Honorable Chi-Wei Lin
MayorCity of Trinidad
409 Trinity StreetP.O. Box 390Trinidad, CA 95570
APR 2'5 ZOOS
Dear Mayor Lin,
The Westhaven Community Service District (WCSD) supports the effort led by the City ofTrinidad to develop a regional watershed management plan and to seek funding to support thisplan from the State Water Resources Control Board Proposition 50 grant program. Thiscollaborative effort involving stakeholders in the watershed region of the Trinidad Area ofSpecial Biological Significance will benefit the communities as well as the ASBS.
The General Manager of the WCSD, Richard Swisher, has attended the initial project meetings,and will provide advice and relevant information during the planning of the project and thewatershed management component of the project. Richard is a longtime resident of Westhavenand has managed the WCSD water system for sixteen years. His knowledge of local watersupply issues and local community needs will be a significant contribution to the project. TheBoard of the WCSD understands that work performed by Richard Swisher as part of the grantproject will be compensated through the grant funding and not as an expense to the WCSD.
The WCSD welcomes this collaborative effort to address some of the long-standing water-related issues common to our communities.
Sincerely,
Kay Schulz
~~President, Westhave~SD Board of Directors

Appendix B:
Results of GIS-Based Watershed Analysis

i
Appendix B: Results of GIS-Based Watershed Analysis
Analyses of land use and other characteristics in the Trinidad-Westhaven planning area were carried out using Geographic Information Systems (GIS) technology. ArcGIS was used to analyze land use distribution, lot sizes, and impervious surfaces in the watershed. A parcels layer from Humboldt County Community Development Services, last updated in August 2007, was used as the basis for analyzing land use and parcel sizes in unincorporated areas. The parcels layer used as a base for the City of Trinidad was created by STREAMLINE Planning Consultants (City of Trinidad Planning Dept.) using source data from the County parcels layer and City land use maps. Watershed boundaries were obtained through ArcHydro analysis performed by STREAMLINE Planning Consultants. Their accuracy is uncertain, and the boundaries are expected to be modified slightly as more field studies are performed. An impervious surfaces layer was created using an aerial photo of the region (photo date: 2006). These processes are described briefly below. Analyses were performed for the study area as a whole, the nine watersheds of interest, and areas along the coastline that lie outside significant watershed boundaries. Land use information was obtained directly from the Humboldt County parcels layer, in the field labeled “EXLU4” (Existing Land Use). According to the County, these land use categories were created using an interpretive method involving zoning designation, ownership, use codes, and other information. The parcels layer was trimmed to match the study area boundary and then to match the boundaries of each of the nine watersheds. The amount of land falling under each use category was calculated for each area of interest. Land uses were then further grouped as follows:
Land Use Category County Existing Land Use Designations (2005)
City Zoning Designations
Timber Timber production -- Commercial Commercial Commercial Open Space Open space/parks Open Space, Special
Environment Public Facilities/Tribal Public, tribal Public & Religious, Visitor
Services Roads/Other Road, highway -- Vacant Rural residential – vacant, single
family residential – vacant, multifamily residential – vacant, commercial – vacant
Any residential or commercial parcels marked as vacant
Urban/Suburban Residential
Single family residential, multifamily residential
Urban Residential, Suburban Residential, Planned Development
Rural Residential Rural residential -- In order to determine average lot sizes, it was necessary to account for entire parcels rather than fragments of parcels that lie within watershed boundaries. Therefore, calculations included each parcel whose centroid (approximate center) is located in the area of interest. The parcels were

ii
grouped according to land use category, as discussed above. The data calculated for each watershed included overall average lot size, average lot sizes for timber vs. nontimber uses, and average lot size per land use category. The impervious surfaces layer was created by tracing the outlines of rooftops, paved roads, driveways, and parking lots that were apparent on the aerial photo. This resulted in a set of polygons for which area (in square feet) was calculated. The resulting layers were trimmed to match the boundaries of each of the eight watersheds of interest. For each watershed, the total amount of impervious land was calculated and expressed as a percentage of watershed area. Much of the forested eastern portion of the watershed was omitted from the impervious analysis under the assumption that it contains few to no buildings or paved surfaces. This region was outlined using the boundaries of parcels that are recorded in the Humboldt County parcels layer as having no improvement value, i.e. parcels that are assumed to be vacant. Tables 1-3, on the following pages, provide a summary of the data collected.

iii
Table 1a. Land use by watershed
Land Use Type
Commercial Open Space Urban/Suburban Residential Rural Residential Watershed Name
Area (acres) % of Total Area (acres) % of Total Area (acres) % of Total Area (acres) % of Total Mill Creek 9.2 1.1 48.5 5.7 11.7 1.4 71.8 8.4 Trinidad 3.5 2.4 80.9 55.8 23.1 15.9 0 0 Parker Creek 3.1 1.3 7.2 3.1 14.3 6.1 51.9 22.1 McConnahas-Mill Creek 0 0 0 0 12.1 1.6 139.7 18.8 Unnamed 0 0 0 0 0 0 88.7 59.1 Deadman’s Creek 0 0 0 0 0 0 83.2 23.6 Luffenholtz Creek 0 0 0.6 0.02 9.0 0.3 445.5 14.1 Joland Creek 0 0 0 0 0 0 173.7 74.2 Two Creeks 0 0 12.8 4.8 0.8 0.3 110.6 41.6 Other areas* 0 0 14.1 6.7 13.8 6.5 78.8 37.2 Planning area 15.8 0.2 164.1 2.6 84.8 1.3 1,243.9 19.6 * Lands not contained by subwatershed boundaries

iv
Table 1b. Land use by watershed
Land Use Type Timber Public Facilities/Tribal Vacant Roads/Other Watershed Name Area (acres) % of Total Area (acres) % of Total Area (acres) % of Total Area (acres) % of Total
Mill Creek 559.5 65.4 3.7 0.4 120.3 14.1 31.1 3.6 Trinidad 0 0 1.9 1.3 1.6 1.1 33.5 23.1 Parker Creek 35.8 15.2 6.9 2.9 88.2 37.5 27.4 11.7 McConnahas-Mill Creek 382.5 51.3 17.1 2.3 176.8 23.7 17.0 2.3 Unnamed 0 0 22.8 15.2 25.7 17.1 13.1 8.7 Deadman’s Creek 60.9 17.3 0 0 194.5 55.1 14.3 4.1 Luffenholtz Creek 2,445.8 77.3 11.0 0.4 197.2 6.2 53.9 1.7 Joland Creek 0 0 0 0 32.4 13.8 27.7 11.8 Two Creeks 20.4 7.7 21.7 8.2 51.1 19.2 48.8 18.3 Other areas* 0 0 22.0 10.4 46.3 21.8 37.0 17.5 Planning area 3,504.9 55.1 107.1 1.7 934.1 14.7 303.8 4.8 * Lands not contained by subwatershed boundaries

v
Table 2. Average lot sizes
Average Lot Size (Acres) by Land Use Watershed Name Average Lot
Size (Acres) Commercial Open Space
Urban/Suburban Residential
Rural Residential Timber Tribal/Public Vacant
Mill Creek 1.9 1.5 4.7 0.5 2.4 15.8 0.5 1.7 Trinidad 0.8 0.7 4.3 0.2 0.4 0.1 Parker Creek 1.6 1.1 1.3 0.4 2.1 40.7 3.0 1.8 McConnahas-Mill Creek 19.4 6.1 3.7 629.5 2.1 36.3 Unnamed 3.6 5.0 1.8 1.0 Deadman’s Creek 23.5 5.7 278.7 37.0 Luffenholtz Creek 22.9 2.2 5.2 265.4 11.0 7.9 Joland Creek 1.6 1.8 1.0 Two Creeks 0.8 0.4 0.4 0.8 22.0 0.5 Other areas* 2.5 5.2 1.6 1.9 4.1 3.1 Planning area 5.1 1.1 4.4 0.5 2.6 322.5 2.8 3.2 * Lands not contained by subwatershed boundaries

vi
Table 3. Impervious surfaces data
All Impervious Surfaces Impervious Surfaces by Type Road Driveway/Parking Lot Roof Watershed Name
Area (acres) % of Total Acres % Acres % Acres %
Mill Creek 24.1 2.8 14.1 58.5 4.6 19.1 5.4 22.4 Trinidad 19.5 13.4 8.8 45.1 3.7 19.0 7.1 36.4 Parker Creek 17.9 7.6 10.2 57.0 3.4 19.0 4.4 24.6 McConnahas-Mill Creek 9.4 1.3 5.1 54.3 1.6 17.0 2.6 27.7 Unnamed 14.3 9.5 5.8 40.6 5.2 36.4 3.3 23.1 Deadman’s Creek 6.4 1.8 5.2 81.3 0.3 4.7 0.9 14.1 Luffenholtz Creek 22.1 0.7 12.1 54.8 3.6 16.3 6.4 29.0 Joland Creek 18.0 7.7 8.9 49.4 4.0 22.2 5.0 27.8 Two Creeks 24.9 9.4 13.3 53.4 4.0 16.1 7.6 30.5 Other areas* 15.5 7.3 7.6 49.0 4.3 27.7 3.6 23.2 Planning area 172.0 2.7 90.9 52.8 34.9 20.3 46.3 26.9 * Lands not contained by subwatershed boundaries

Appendix C:
Disadvantaged Community Calculation (Westhaven)

ATTACHMENT 4 DISADVANTAGED COMMUNITY SUPPORTING INFORMATION
1. Methodology: a. Census 2000 data were used as the basis for the determination of a disadvantaged region. The planning area for the Integrated Coastal Watershed Management Plan for the Trinidad ASBS encompasses primarily the City of Trinidad and Westhaven and Moonstone communities. The census designated places representing these areas are defined as "Trinidad City, CA", and "Westhaven-Moonstone, CA". Census data for these two areas was obtained from the American FactFinder website. The relevant data came from the U.S. Census 2000, Summary File 1 (SF1) and Summary File 3 (SF3). b. The City of Trinidad and Westhaven-Moonstone census areas most closely matched the watershed planning area. An alternative area would have been is to use zip code area 95570, which covers an area greater than the Trinidad-Westhaven-Moonstone region. The census 2000 data show that the total population of the 95570 region is 2,352 and MHI $33,300. We have decided to use the Trinidad-Westhaven-Moonstone data because they more closely correspond to the watershed region in this study. c. The Median Household Income (MHI) of the region is used as the criteria for the determination of disadvantaged community status. A region with MHI less then 80% of State average ($37,994) is considered as a disadvantaged region. 2. Population and MHI data The data obtained from Census 2000 listed the population and MHI as follows: City of Trinidad: population, 311 MHI, $40,000 Westhaven-Moonstone population,1,044 MHI, $36,000 (disadvantaged) Total population: 1,355 Disadvantaged community ratio (DCR) = 1,044/1,355 = 0.77 3. Reduced funding match calculation: Reduced fund match factor (RFMF) = 0.25 -- (0.25x0.77) = 0.25 --0.1925 = 0.0575 (~ 6%) The City of Trinidad is requesting a reduced funding match rate of 6%. 4. Descriptions of disadvantaged communities:
A majority of the planning area for the Integrated Coastal Watershed Management Plan for the Trinidad ASBS is located within the Westhaven-Moonstone area, with other planning areas including the City of Trinidad and Humboldt County. Within the watershed planning area, only the City of Trinidad has a MHI ($40,000) above the disadvantaged level ($38,000). The Westhaven- Moonstone area is considered a

disadvantaged community with a MHI of $36,000. Humboldt County is also considered a disadvantaged area, with a MHI in of $31,226 according to the 2000 U.S. Census.
5. Participation and representation of disadvantaged communities: The Westhaven Community Services District (WCSD) is the primary organization
representing the Westhaven-Moonstone area. The WCSD supports the Integrated Coastal Watershed Management Plan for the Trinidad ASBS and participated in the development of this project. A letter of support from the Westhaven Community Services District is attached.
The General Manager of the WCSD, Richard Swisher, who represents the Board of
Directors, participated in all of the project development meetings for the planning of this project. A WCSD representative will also take part in the watershed assessment work by performing sample collection and water quality analysis.
Several of the key members of the project team are long time residents and active
community members of Westhaven. Their involvement ensures that the interests of the Westhaven community are been considered.
In addition, the Trinidad Rancheria (located within the Humboldt County census area) is
also a supporter of this project. They have also participated in all of the planning meetings for the development of this proposal, and their letter of support is also included with this proposal.
6. Benefits and impact to disadvantaged community: This planning effort is intended to improve the water quality of the area watersheds,
which provide source water supplies for not only for the City of Trinidad and the Trinidad Rancheria, but also for Westhaven and all of the small water systems on the local creeks that are also influenced by sediment and septic pollution. Dealing with Watershed-wide pollution problems and solutions will benefit all disadvantaged residents in the Watersheds that this plan covers.


Appendix D:
Water Quality Sampling Reports (Wastewater Component)

City of Trinidad Prop 50 ICWMP
P. 1 December 2007 Draft February Water Quality Report
CCIITTYY OOFF TTRRIINNIIDDAADD
WASTEWATER ELEMENT WATER QUALITY SUMMARY REPORT
FEBRUARY 7-8, 2007
DECEMBER 2007
PREPARED BY: STREAMLINE PLANNING CONSULTANTS 1062 G STREET, SUITE I; ARCATA, CA 95521 PHONE: 707-822-5785; FAX: 707-822-5786
WWW.STREAMLINEPLANNING.NET

City of Trinidad Prop 50 ICWMP
P. 2 December 2007 Draft February Water Quality Report
Introduction The following brief report summarizes the February 2007 wastewater element water quality sampling event under a Prop 50 Coastal Watershed Planning Grant (Trinidad-Westhaven Coastal Watershed Project). Sampling Samples were collected over two days. Sampling began, according to our QAPP, on February 7, 2007 after 0.5 inches of rain had fallen. Sampling continued on the morning of February 8, 2007 starting at 8:30 a.m. and ending at 2:00 p.m. Sampling began at the southern end of the project area, including Two Creeks, Joland and Luffenholtz on the first day and the remaining sites sampled on the second day. Weather This sampling event occurred after more than a month of almost zero rainfall. According to National Weather Service, at the Woodly Island weather station, there were 1.85 inches of rainfall in the first few days of January, and then no more rain until February 7, 2007. January only saw 31% of its normal rainfall, and that occurred in the first few days of the month. Up until the dry spell, the Humboldt Bay area had nearly normal rainfall, at 96% of normal. By the time of the February storm that broke the dry spell, Eureka was at only 70% of normal rainfall. The storm came in on the morning of February 7, 2007. Weather conditions during sampling were cool and very rainy with gusts of winds up to 18 mph; 1.03 inches of rain fell on February 7. Sampling began after 0.5 inches had fallen. On February 8, 2007, conditions were rainy in the morning, with some subsiding in the afternoon; 0.5 inches of rain fell this day. Temperatures were cooler than the day before, but wind speeds were the same.
Figure 1 – Daily rainfall collected at the City’s water plant at upper Luffenholtz Creek at approximately 9:00 a.m. each morning.
0
0.2
0.4
0.6
0.8
1
1.2
1.4
1.6
Date

City of Trinidad Prop 50 ICWMP
P. 3 December 2007 Draft February Water Quality Report
Notes Due to the lack of rain for over a month, several other groups also collected water samples on the same day(s) that we did. As a result, the Humboldt County Health Lab ran out of some of the bacteria tests normally used in terms of the range of MPN resolution. Therefore, we had to choose to use a different test for total and fecal coliforms. We chose the higher range test, which could only quantify samples over 100 MPN. This decision was based on a preference for a distinguishable range that included the contact recreational standards. Therefore, many of our samples turned out to be < 100 MPN / 100 ml, but at least we know this is below the contact recreational standard. Generally the more southern sites were sampled on the first day during the rainstorm, which was essentially a first flush event. The other sites were sampled on the next day after the rainfall had slackened and had much lower bacteria levels then those sites sampled on the first day. Results Table 1 – Vital Signs and Turbidity
Site Air (ºC)
Water (ºC)
pH EC (uS)
Turbidity (NTUs)
TRS-1 11 10.4 7.27 247 TRS-2 TRS-3 12 12 6.6 1282 TRW-1 12 13 6.58 242 MCL-1 10 9.5 7.45 80 10.5 MCU-1 9 9.1 7.26 71 9.67 MCU-2 64 PCL-1 9.5 9.3 7 115 19.6 PCU-1 9 8.5 6.77 98 26.9 MML-1 8.5 8.6 6.86 59 14.5 MMU-1 9.5 8.2 6.7 46 12.1 DCL-1 10 8.7 6.36 70 14 DCU-1 8.8 8.6 6.9 46 5.75 LCL-1 10.5 8.8 6.71 66 156 LCU-1 10 8.5 6.97 53 71.4 JCL-1 11.5 9.8 6.51 86 313 JCU-1 11 9 6.6 61 403 TCL-1 14.5 10.4 6.25 95 342

City of Trinidad Prop 50 ICWMP
P. 4 December 2007 Draft February Water Quality Report
0
2
4
6
8
10
12
14
16
TRS-
1
TRS-
3
TRW
-1
MC
L-1
MC
U-1
PCL-
1
PCU
-1
MM
L-1
MM
U-1
DC
L-1
DC
U-1
LCL-
1
LCU
-1
JCL-
1
JCU
-1
TCL-
1
Site
Tem
p (C
)Air Water
Figure 2 – February 2007 Air and Water Temperatures
6.2
6.4
6.6
6.8
7
7.2
7.4
7.6
TRS
-1
TRS
-3
TRW
-1
MC
L-1
MC
U-1
PC
L-1
PCU
-1
MM
L-1
MM
U-1
DC
L-1
DC
U-1
LCL-
1
LCU
-1
JCL-
1
JCU
-1
TCL-
1
Site
pH U
nits
Figure 3 – February 2007 pH

City of Trinidad Prop 50 ICWMP
P. 5 December 2007 Draft February Water Quality Report
0
50
100
150
200
250
300
TRS-
1
TRS-
3
TRW
-1
MC
L-1
MC
U-1
PCL-
1
PCU
-1
MM
L-1
MM
U-1
DC
L-1
DC
U-1
LCL-
1
LCU
-1
JCL-
1
JCU
-1
TCL-
1
Site
EC (u
S)
1282
Figure 4 – February 2007 Electrical Conductivity
0
50
100
150
200
250
300
350
400
450
MC
L-1
MC
U-1
PCL-
1
PCU
-1
MM
L-1
MM
U-1
DC
L-1
DC
U-1
LCL-
1
LCU
-1
JCL-
1
JCU
-1
TCL-
1
Site
Turb
idity
(NTU
)
Figure 5 – February 2007 Turbidity

City of Trinidad Prop 50 ICWMP
P. 6 December 2007 Draft February Water Quality Report
Table 2 – Bacteria and Nutrients
Site
Total Coliform
(MPN)
E. Coli (MPN)
Entero-coccus (MPN)
Ammonia
(Mg/L)
Nitrite (Mg/L)
O-Phos- phate (Mg/L)
MPN / 100ml
MPN / 100ml MPN / 100ml Mg / L Mg / L Mg / L
TRS-1 2,070 100 10 0.05 0.00 0.15 TRS-2 2,710 200 20 1.50 1.25 0.00 TRS-3 1,640 < 100 10 0.05 3.00 0.00 TRW-1 < 100 < 100 < 10 0.05 6.00 0.10 TRO-1 100 < 100 10 MCL-1 1,640 < 100 74 0.20 0.00 0.20 MCU-1 1,500 < 100 20 0.25 0.00 0.10 MCU-2 1,110 < 100 10 0.10 0.00 0.05 PCL-1 16,520 1,110 110 0.30 3.00 0.00
PCL-1D 16,520 870 243 PCU-1 4,780 100 110 0.30 0.00 0.05 MML-1 1,780 200 31 0.60 0.00 0.05 MMU-1 1,110 < 100 31 0.40 0.00 0.05 UCL-1 2,540 < 100 120 UCU-1 2,070 < 100 20 DCL-1 1,640 < 100 63 0.80 0.00 0.00 DCU-1 1,110 < 100 20 1.00 0.00 0.05 LCL-1 7,270 146 487 0.20 0.00 0.00 LCU-1 6,867 135 121 0.20 0.00 0.00 LCU-2 > 24,192 880 2,909 1.00 0.00 0.00 JCL-1 > 24,192 3,873 5,794 0.80 0.00 0.00 JCU-1 Sample Leaked In Transport 0.80 0.00 0.00 TCL-1 > 24,192 1,439 3,609 1.0 1.25 0.0

City of Trinidad Prop 50 ICWMP
P. 7 December 2007 Draft February Water Quality Report
Figure 6 – February 2007 Total Coliform Counts
Figure 7 – February 2007 Fecal Coliform Counts
0
5,000
10,000
15,000
20,000
Site
>24,192
Contact Recreational Standard
100
300
500
700
900
1,100
1,300
1,500
1,700
1,900
Site
>
Contact Recreational Standard

City of Trinidad Prop 50 ICWMP
P. 8 December 2007 Draft February Water Quality Report
Figure 8 – February 2007 Enterococcus Counts
0.00
0.20
0.40
0.60
0.80
1.00
1.20
1.40
1.60
TRS
-1
TRS
-2
TRS
-3
TRW
-1
MC
L-1
MC
U-1
MC
U-2
PC
L-1
PC
U-1
MM
L-1
MM
U-1
DC
L-1
DC
U-1
LCL-
1
LCU
-1
LCU
-2
JCL-
1
JCU
-1
TCL-
1
Site
Am
mon
ia (M
g/L)
Figure 9 – February 2007 Ammonia Levels
050
100150200250
300350400
450500
Site
Contact Recreational Standard

City of Trinidad Prop 50 ICWMP
P. 9 December 2007 Draft February Water Quality Report
0.00
1.00
2.00
3.00
4.00
5.00
6.00
7.00
TRS
-1
TRS
-2
TRS
-3
TRW
-1
MC
L-1
MC
U-1
MC
U-2
PC
L-1
PC
U-1
MM
L-1
MM
U-1
DC
L-1
DC
U-1
LCL-
1
LCU
-1
LCU
-2
JCL-
1
JCU
-1
TCL-
1
Site
Nitr
ate
(Mg/
L)
Figure 10 – February 2007 Nitrate Levels
0.00
0.05
0.10
0.15
0.20
0.25
TRS
-1
TRS
-2
TRS
-3
TRW
-1
MC
L-1
MC
U-1
MC
U-2
PC
L-1
PC
U-1
MM
L-1
MM
U-1
DC
L-1
DC
U-1
LCL-
1
LCU
-1
LCU
-2
JCL-
1
JCU
-1
TCL-
1
Site
Orth
opho
spha
te (M
g/L)
Figure 11 – February 2007 Orthophosphate Levels

City of Trinidad Prop 50 ICWMP
P. 1 January 2008 Draft March Water Quality Report
CCIITTYY OOFF TTRRIINNIIDDAADD
WASTEWATER ELEMENT WATER QUALITY SUMMARY REPORT
MARCH 27-28, 2007
JANUARY 2008
PREPARED BY: STREAMLINE PLANNING CONSULTANTS 1062 G STREET, SUITE I; ARCATA, CA 95521 PHONE: 707-822-5785; FAX: 707-822-5786
WWW.STREAMLINEPLANNING.NET
City of Trinidad Prop 50 ICWMP
P. 2 January 2008 Draft March Water Quality Report
Introduction The following brief report summarizes the March 2007 wastewater element water quality sampling event under a Prop 50 Coastal Watershed Planning Grant (Trinidad-Westhaven Coastal Watershed Project). Sampling Samples were collected over two days. Sampling began, according to our QAPP, on Tuesday, March 27, 2007 in the morning; more than 0.5 inches of rain had fallen in the previous 24 hours. Sampling occurred between 8:45 a.m. and 1:30 p.m. Sampling continued on the morning of March 28, 2007, occurred between 9:50 a.m. and 1:00 p.m. Similar to the February event, sampling began at the southern end of the project area. However, more sites were sampled on the first day this time, including Two Creeks, Joland, Luffenholtz, Deadman’s, Unnamed, McConnahas, Parker Creeks. Mill Creek and the City of Trinidad sites were sampled on the second day. Weather A storm came in on Saturday night, early Sunday morning (March 25) after 5 days with 0 or trace amounts of rainfall. The following data is from the National Weather Service, Eureka (Woodly Island) station. Sunday saw approx. ¼ inch of rainfall with partial clearing in the afternoon / evening. Another storm hit with rapidly dropping temperatures on Monday afternoon; there was 0.39 inches of rain on Monday. The storm continued through the night and into Tuesday, dropping 0.45 more inches of rain. Snow levels dropped dramatically and there were significant amounts of hail and sleet along the coast, including Trinidad. There were weather advisories for high winds (up to 35 mph gusts) and high surf. The storm slackened on Tuesday morning, with clearing in the afternoon. There were occasional rain showers during the sampling in the morning. A new record low was set for the day (34°F) on Wednesday March 28, the morning of our second sampling day. March 28 was clear and cold with fairly strong winds (26 mph gusts) and high surf, but no rainfall. In general, the Humboldt Bay Area at this point (end of March) is at very close to normal rainfall for the year 2007 and for the entire water year, but is at only 47% of normal for the month of March, with only 2.5 inches of rain. The month of February saw 215% of the normal rainfall, with 11.86 inches. Notes Due to a shortage of some of the nutrient sample tests, they were not run for all sites. Sites not tested are indicated on the graphs below.

City of Trinidad Prop 50 ICWMP
P. 3 January 2008 Draft March Water Quality Report
0
0.5
1
1.5
2
2.5
26-F
eb
28-F
eb
1-M
ar
3-M
ar
5-M
ar
7-M
ar
9-M
ar
11-M
ar
13-M
ar
15-M
ar
17-M
ar
19-M
ar
21-M
ar
23-M
ar
25-M
ar
27-M
ar
29-M
ar
Date
Rai
nfal
l (in
)
Figure 1 – Daily rainfall collected at the City’s water plant at upper Luffenholtz Creek at approximately 9:00 a.m. each morning. Results Table 1 – Vital Signs and Turbidity
Site Air (ºC)
Water (ºC)
pH EC (uS)
Turbidity(NTUs)
TRS-1 15 12.80 7.76 255 TRS-2 14 11.90 7.85 220 TRS-3 9.50 11.50 7.65 385.00 TRW-1 8.5 12.7 6.51 260 MCL-1 9 8.1 7.61 70 7.13 MCU-1 11.00 10.10 8.40 62.00 6.55 PCL-1 9 9 7.04 94 30.3 PCU-1 8.00 8.30 6.67 87.00 43.10 MML-1 9.00 8.50 7.14 49.00 14.60 MMU-1 7.00 8.60 7.13 41.00 15.50 DCL-1 8.00 8.90 7.34 49.00 21.6 DCU-1 7.00 8.20 6.82 42.00 25.40 LCL-1 8.00 8.00 6.80 77.00 36.40 LCU-1 7.00 7.90 7.32 45.00 27.30 JCL-1 8.00 8.50 6.80 77.00 64.60 JCU-1 wet 8.10 7.01 67.00 33.90 TCL-1 10.00 10.10 6.75 101.00 72.80

City of Trinidad Prop 50 ICWMP
P. 4 January 2008 Draft March Water Quality Report
0
2
4
6
8
10
12
14
16TR
S-1
TRS
-2
TRS
-3
TRW
-1
MC
L-1
MC
U-1
PC
L-1
PC
U-1
MM
L-1
MM
U-1
DC
L-1
DC
U-1
LCL-
1
LCU
-1
JCL-
1
JCU
-1
TCL-
1
Site
Tem
pera
ture
(C)
Air Water
Figure 2 – March 2007 Air and Water Temperatures
6.5
6.7
6.9
7.1
7.3
7.5
7.7
7.9
8.1
8.3
8.5
TRS
-1
TRS
-2
TRS
-3
TRW
-1
MC
L-1
MC
U-1
PC
L-1
PC
U-1
MM
L-1
MM
U-1
DC
L-1
DC
U-1
LCL-
1
LCU
-1
JCL-
1
JCU
-1
TCL-
1
Site
pH U
nits
Figure 3 – March 2007 pH

City of Trinidad Prop 50 ICWMP
P. 5 January 2008 Draft March Water Quality Report
0
50
100
150
200
250
300
350
400
TRS
-1
TRS
-2
TRS
-3
TRW
-1
MC
L-1
MC
U-1
PC
L-1
PC
U-1
MM
L-1
MM
U-1
DC
L-1
DC
U-1
LCL-
1
LCU
-1
JCL-
1
JCU
-1
TCL-
1
Site
EC (u
S)
Figure 4 – March 2007 Electrical Conductivity
0
10
20
30
40
50
60
70
80
MC
L-1
MC
U-1
PC
L-1
PC
U-1
MM
L-1
MM
U-1
DC
L-1
DC
U-1
LCL-
1
LCU
-1
JCL-
1
JCU
-1
TCL-
1
Site
Turb
idity
(NTU
)
Figure 5 – March 2007 Turbidity

City of Trinidad Prop 50 ICWMP
P. 6 January 2008 Draft March Water Quality Report
Table 2 – Fluorescence (ppm) Site TRS-1 TRS-2 TRS-3 TRS-4 TSD-1 TRW-1 MCL-1 MCU-1
Fluorescence 10.53 12.52 1.995 14.95 15.31 4.181 14.21 12.84 Site PCL-1 PCU-1 PCU-2 MML-1 MMU-1 UCL-1 DCL-1 DCU-1 LCL-1
Fluorescence 20.61 18.56 14.39 20.19 22.33 23.02 24.6 26.25 20.06Site LCU-1 LCU-2 LCU-3 LCT-1 JCL-1 JCU-1 TCL-1 TCU-1 TCU-2
Fluorescence 15.96 27.71 15.16 25.78 22.61 26.14 30.79 28.96 24.31
0
5
10
15
20
25
30
35
TRS-
1TR
S-2
TRS-
3TR
S-4
TSD
-1TR
W-
MC
L-1
MC
U-1
PCL-
1PC
U-1
PCU
-2M
ML-
1M
MU
-1U
CL-
1D
CL-
1D
CU
-1LC
L-1
LCU
-1LC
U-2
LCU
-LC
U-3
LCT-
1JC
L-1
JCU
-1JC
U-2
TCL-
1TC
U-1
TCU
-2
Site
Fluo
resc
ence
(ppm
)
Figure 6 – March 2007 Fluorescence Readings Table 3 – Bacteria and Nutrients
Site
Total Coliform
(MPN)
E. Coli (MPN)
Entero-coccus (MPN)
Ammonia
(Mg/L)
Nitrite (Mg/L)
O-Phos- phate (Mg/L)
TRS-1 988 1 75 0.10 2.50 0.15 TRS-2 2,613 119 1 0.10 1.25 0.00 TRS-3 602 1 363 0.00 2.50 0.00 TRS-4 3,873 10 1 0.10 2.50 0.00 TSD-1 8,164 122 288 0.00 2.50 0.00 TRW-1 1 1 10 0.10 5.00 0.10 TRO-1 41 10 1 MCL-1 521 1 31 0.05 0.00 0.00 MCU-1 336 20 10 0.10 0.00 0.00 PCL-1 2,613 109 135 0.60 0.00 0.05 PCU-1 3,255 96 313 0.30 0.00 0.05

City of Trinidad Prop 50 ICWMP
P. 7 January 2008 Draft March Water Quality Report
PCU-2 3,488 10 1 0.30 0.00 0.00 MML-1 1,296 20 10 0.30 0.00 0.05 MMU-1 794 31 1 0.30 0.00 0.05 UCL-1 1,050 52 134 0.30 DCL-1 1,274 20 85 0.80 0.00 0.00 DCU-1 1,050 20 109 0.70 0.00 0.05 LCL-1 2,247 121 52 0.40 0.00 0.05 LCU-1 2,359 63 41 LCU-2 2,143 218 345 0.60 LCU-3 1,046 63 10 0.25 LCT-1 8,664 4,884 1,112 0.80 JCL-1 24,200 3,873 1,785 0.60 0.00 0.05 JCU-1 24,200 1,723 2,187 0.40 0.00 0.05 TCL-1 17,329 960 216 TCU-1 24,196 3,076 1,071 0.80 TCU-2 14,136 1,291 1,723 0.50
0
5,000
10,000
15,000
20,000
TRS
-1TR
S-2
TRS
-3TR
S-4
TSD
-1TR
W-1
TRO
-1M
CL-
1M
CU
-1P
CL-
1P
CU
-1P
CU
-2M
ML-
1M
MU
-1U
CL-
1D
CL-
1D
CU
-1LC
L-1
LCU
-1LC
U-2
LCU
-3LC
T-1
JCL-
1JC
U-1
TCL-
1TC
U-1
TCU
-2
Site
Tota
l Col
iform
Cou
nt (M
PN)
>24,192
Contact Recreational Standard
Figure 7 – March 2007 Total Coliform Counts

City of Trinidad Prop 50 ICWMP
P. 8 January 2008 Draft March Water Quality Report
0200400600800
1,0001,2001,4001,6001,8002,000
TRS
-1TR
S-2
TRS
-3TR
S-4
TSD
-1TR
W-1
TRO
-1M
CL-
1M
CU
-1P
CL-
1P
CU
-1P
CU
-2M
ML-
1M
MU
-1U
CL-
1D
CL-
1D
CU
-1LC
L-1
LCU
-1LC
U-2
LCU
-3LC
T-1
JCL-
1JC
U-1
TCL-
1TC
U-1
TCU
-2
Site
E. C
oli C
ount
(MPN
)
3,87
3
Contact Recreational Standard
3,07
6
4,88
4
Figure 8 – March 2007 Fecal Coliform Counts
0
50
100
150
200
250
300
350
400
450
500
TRS
-1TR
S-2
TRS
-3TR
S-4
TSD
-1TR
W-1
TRO
-1M
CL-
1M
CU
-1P
CL-
1P
CU
-1P
CU
-2M
ML-
1M
MU
-1U
CL-
1D
CL-
1D
CU
-1LC
L-1
LCU
-1LC
U-2
LCU
-3LC
T-1
JCL-
1JC
U-1
TCL-
1TC
U-1
TCU
-2
Site
Ente
roco
ccus
Cou
nt (M
PN)
1,78
5
1,07
1
2,18
7
Contact Recreational Standard
1,11
2
1,72
3
Figure 9 – March 2007 Enterococcus Counts

City of Trinidad Prop 50 ICWMP
P. 9 January 2008 Draft March Water Quality Report
0.000.100.200.300.400.500.600.700.800.90
TRS-
1TR
S-2
TRS-
3TR
S-4
TSD
-1TR
W-1
MC
L-1
MC
U-1
PCL-
1PC
U-1
PCU
-2M
ML-
1M
MU
-1U
CL-
1D
CL-
1D
CU
-1LC
L-1
LCU
-2LC
U-3
LCT-
1JC
L-1
JCU
-1TC
U-1
TCU
-2
Site
Am
mon
ia (M
g/L)
Figure 10 – March 2007 Ammonia Levels
0.00
1.00
2.00
3.00
4.00
5.00
6.00
TRS-
1TR
S-2
TRS-
3TR
S-4
TSD
-1TR
W-1
MC
L-1
MC
U-1
PCL-
1PC
U-1
PCU
-2M
ML-
1M
MU
-1U
CL-
1D
CL-
1D
CU
-1LC
L-1
LCU
-2LC
U-3
LCT-
1JC
L-1
JCU
-1TC
U-1
TCU
-2
Site
Nitr
ate
(Mg/
L)
X X X X X X
X = Not Tested
Figure 11 – March 2007 Nitrate Levels

City of Trinidad Prop 50 ICWMP
P. 10 January 2008 Draft March Water Quality Report
0.00
0.02
0.04
0.06
0.08
0.10
0.12
0.14
0.16
TRS-
1TR
S-2
TRS-
3TR
S-4
TSD
-1TR
W-1
MC
L-1
MC
U-1
PCL-
1PC
U-1
PCU
-2M
ML-
1M
MU
-1U
CL-
1D
CL-
1D
CU
-1LC
L-1
LCU
-2LC
U-3
LCT-
1JC
L-1
JCU
-1TC
U-1
TCU
-2
Site
Orth
opho
spha
te (M
g/L)
X X X X X X
X = Not Tested
Figure 12 – March 2007 Orthophosphate Levels

City of Trinidad Prop 50 ICWMP
P. 1 January 2008 Draft October Water Quality Report
CCIITTYY OOFF TTRRIINNIIDDAADD
WASTEWATER ELEMENT WATER QUALITY SUMMARY REPORT OCTOBER 3, 2007
JANUARY 2008
PREPARED BY: STREAMLINE PLANNING CONSULTANTS 1062 G STREET, SUITE I; ARCATA, CA 95521 PHONE: 707-822-5785; FAX: 707-822-5786
WWW.STREAMLINEPLANNING.NET
City of Trinidad Prop 50 ICWMP
P. 2 January 2008 Draft October Water Quality Report
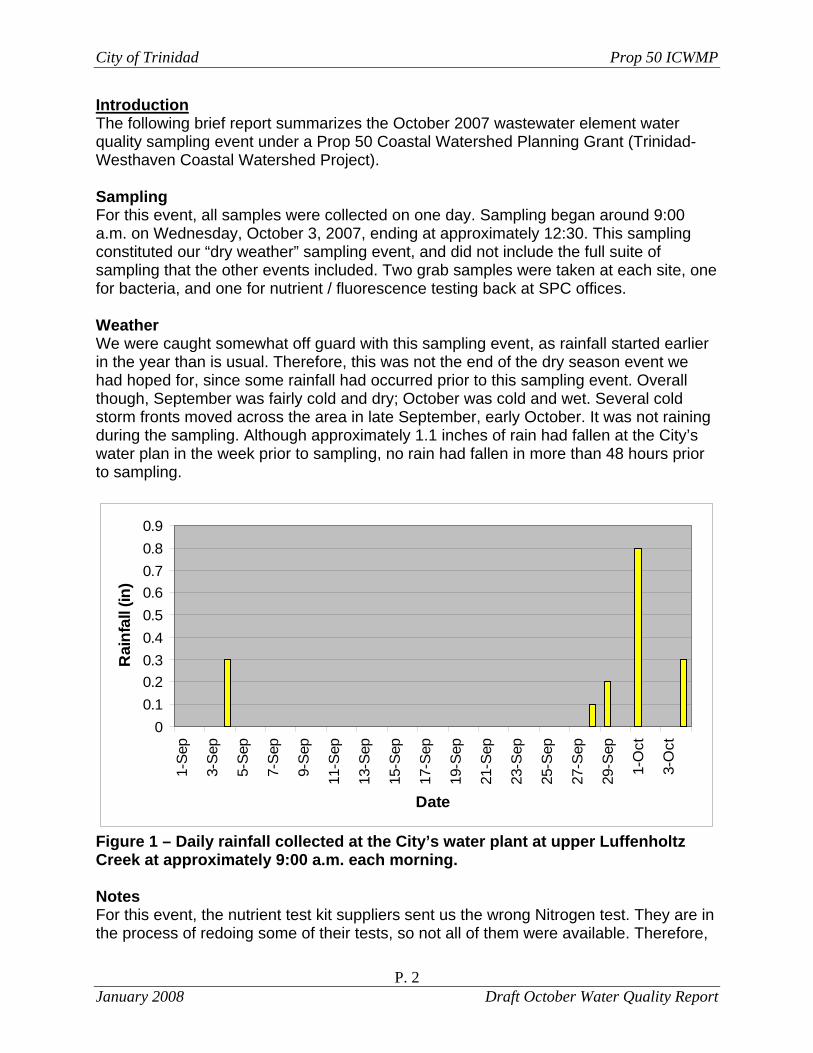
Introduction The following brief report summarizes the October 2007 wastewater element water quality sampling event under a Prop 50 Coastal Watershed Planning Grant (Trinidad-Westhaven Coastal Watershed Project). Sampling For this event, all samples were collected on one day. Sampling began around 9:00 a.m. on Wednesday, October 3, 2007, ending at approximately 12:30. This sampling constituted our “dry weather” sampling event, and did not include the full suite of sampling that the other events included. Two grab samples were taken at each site, one for bacteria, and one for nutrient / fluorescence testing back at SPC offices. Weather We were caught somewhat off guard with this sampling event, as rainfall started earlier in the year than is usual. Therefore, this was not the end of the dry season event we had hoped for, since some rainfall had occurred prior to this sampling event. Overall though, September was fairly cold and dry; October was cold and wet. Several cold storm fronts moved across the area in late September, early October. It was not raining during the sampling. Although approximately 1.1 inches of rain had fallen at the City’s water plan in the week prior to sampling, no rain had fallen in more than 48 hours prior to sampling.
00.10.20.30.40.50.60.70.80.9
1-S
ep
3-S
ep
5-S
ep
7-S
ep
9-S
ep
11-S
ep
13-S
ep
15-S
ep
17-S
ep
19-S
ep
21-S
ep
23-S
ep
25-S
ep
27-S
ep
29-S
ep
1-O
ct
3-O
ct
Date
Rai
nfal
l (in
)
Figure 1 – Daily rainfall collected at the City’s water plant at upper Luffenholtz Creek at approximately 9:00 a.m. each morning. Notes For this event, the nutrient test kit suppliers sent us the wrong Nitrogen test. They are in the process of redoing some of their tests, so not all of them were available. Therefore,

City of Trinidad Prop 50 ICWMP
P. 3 January 2008 Draft October Water Quality Report
we had a use a Nitrate kit with a much broader range of resolution as previous test kits; the minimum reading was 2.5 Mg/L, so most results were read as 0. Also, due to the rushed nature of this event, the Fluorometer and Turbidimeter had not been calibrated prior to sampling. Therefore, I ran several (4) samples with distilled water and took an average of those readings. Since they were both negative, I added that average amount to each result. Results Table 1 – Turbidity (NTUs)
Site TRS-1 TRS-2 TRS-3 MCL-1 MCU-1 PCL-1 PCU-1 Turbidity 1.367 6.898 0.213 0.827 0.098 0.617 5.636
Site MML-1 MMU-1 UCL-1 DCL-1 DCU-1 LCL-1 LCU-1 Turbidity 0.148 0.638 4.176 0.287 0.051 0.723 0.826
Site LCU-2 LCU-3 JCL-1 JCU-1 TCL-1 TCU-1 Turbidity 2.416 3.05 1.923 3.81 0.994 0.114
0
1
2
3
4
5
6
7
8
TRS
-1
TRS
-2
TRS
-3
TRW
-1
MC
L-1
MC
U-1
PC
L-1
PC
U-1
MM
L-1
MM
U-1
UC
L-1
DC
L-1
DC
U-1
LCL-
1
LCU
-1
LCU
-2
LCU
-3
JCL-
1
JCU
-1
TCL-
1
TCU
-1
Site
Turb
idity
(NTU
)
Figure 2 – October 2007 Turbidity Table 2 – Fluorescence (ppm)
Site TRS-1 TRS-2 TRS-3 TRW-1 MCL-1 MCU-1 PCL-1 Fluorescence 5.895 24.58 7.683 5.398 13.85 9.516 18.16
Site PCU-1 MML-1 MMU-1 UCL-1 DCL-1 DCU-1 LCL-1 Fluorescence 14.78 22.38 21.81 19.38 14.76 17.38 9.111
Site LCU-1 LCU-2 LCU-3 JCL-1 JCU-1 TCL-1 TCU-1 Fluorescence 7.728 21.71 16.19 16.08 19.39 8.651 13.81

City of Trinidad Prop 50 ICWMP
P. 4 January 2008 Draft October Water Quality Report
0
5
10
15
20
25
30
TRS
-1
TRS
-2
TRS
-3
TRW
-1
MC
L-1
MC
U-1
PC
L-1
PC
U-1
MM
L-1
MM
U-1
UC
L-1
DC
L-1
DC
U-1
LCL-
1
LCU
-1
LCU
-2
LCU
-3
JCL-
1
JCU
-1
TCL-
1
TCU
-1
Site
Fluo
resc
ence
(ppm
)
Figure 3 – October 2007 Fluorescence Readings Table 3 – Bacteria and Nutrients
Site
Total Coliform
(MPN)
E. Coli (MPN)
Entero-coccus (MPN)
Ammonia
(Mg/L)
Nitrite (Mg/L)
O-Phos- phate (Mg/L)
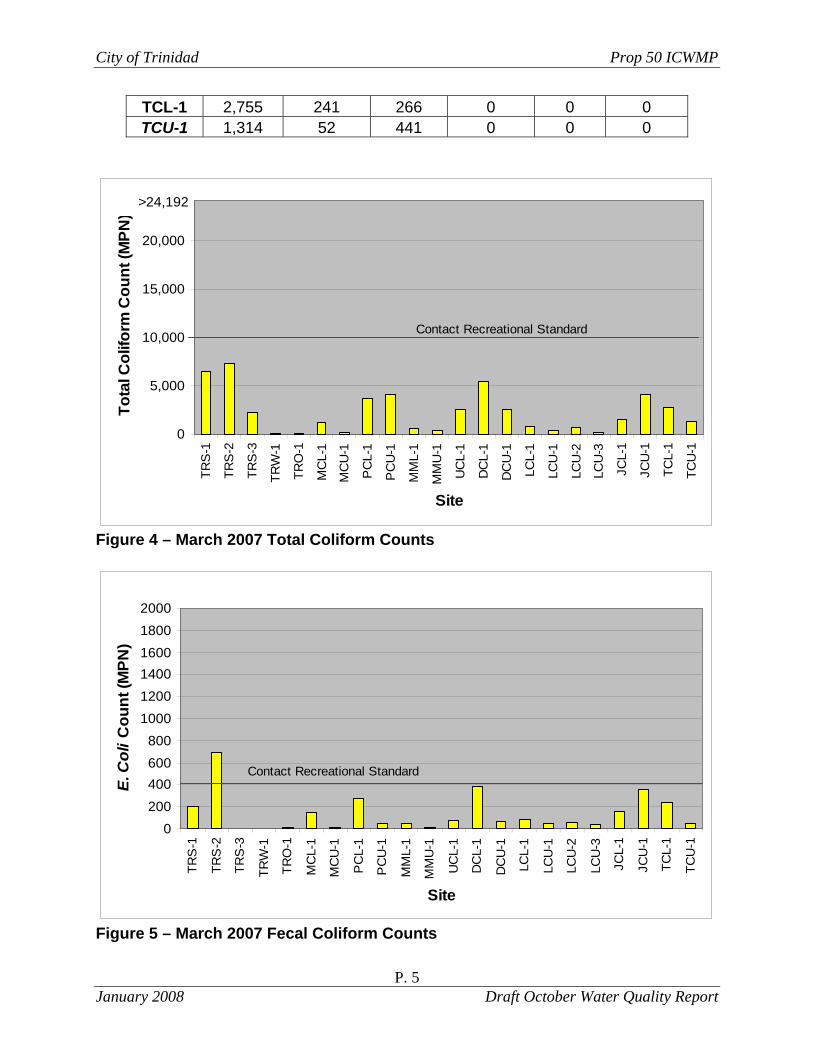
TRS-1 6,488 199 144 0 5 0 TRS-2 7,270 697 265 0.1 0 0 TRS-3 2,247 1 10 0 5 0 TRW-1 122 1 20 0.1 0 0 TRO-1 86 10 31 MCL-1 1,153 146 420 0 0 0 MCU-1 246 10 1 0 0 0 PCL-1 3,654 272 183 0 3 0 PCU-1 4,106 52 97 0.2 0 0.1 MML-1 617 52 86 0.1 0 0 MMU-1 359 10 41 0.1 0 0 UCL-1 2,613 75 110 0.1 0 0 DCL-1 5,475 389 1,172 0.1 0 0 DCU-1 2,489 74 20 0.2 0 0 LCL-1 776 86 1 0.1 0 0 LCU-1 450 52 10 0.1 0 0.2 LCU-2 663 62 51 0.1 0 0.3 LCU-3 216 41 20 0.2 0 0 JCL-1 1,467 160 160 0.1 0 0 JCU-1 4,106 364 808 0.1 0 0.1
City of Trinidad Prop 50 ICWMP
P. 5 January 2008 Draft October Water Quality Report
TCL-1 2,755 241 266 0 0 0 TCU-1 1,314 52 441 0 0 0
0
5,000
10,000
15,000
20,000
TRS
-1
TRS
-2
TRS
-3
TRW
-1
TRO
-1
MC
L-1
MC
U-1
PC
L-1
PC
U-1
MM
L-1
MM
U-1
UC
L-1
DC
L-1
DC
U-1
LCL-
1
LCU
-1
LCU
-2
LCU
-3
JCL-
1
JCU
-1
TCL-
1
TCU
-1
Site
Tota
l Col
iform
Cou
nt (M
PN)
>24,192
Contact Recreational Standard
Figure 4 – March 2007 Total Coliform Counts
0200400600800
100012001400160018002000
TRS
-1
TRS
-2
TRS
-3
TRW
-1
TRO
-1
MC
L-1
MC
U-1
PC
L-1
PC
U-1
MM
L-1
MM
U-1
UC
L-1
DC
L-1
DC
U-1
LCL-
1
LCU
-1
LCU
-2
LCU
-3
JCL-
1
JCU
-1
TCL-
1
TCU
-1
Site
E. C
oli C
ount
(MPN
)
Contact Recreational Standard
Figure 5 – March 2007 Fecal Coliform Counts

City of Trinidad Prop 50 ICWMP
P. 6 January 2008 Draft October Water Quality Report
050
100
150200250300350
400450500
TRS
-1
TRS
-2
TRS
-3
TRW
-1
TRO
-1
MC
L-1
MC
U-1
PCL-
1
PC
U-1
MM
L-1
MM
U-1
UC
L-1
DC
L-1
DC
U-1
LCL-
1
LCU
-1
LCU
-2
LCU
-3
JCL-
1
JCU
-1
TCL-
1
TCU
-1
Site
Ente
roco
ccus
Cou
nt (M
PN)
808
Contact Recreational Standard
1,17
2
Figure 6 – March 2007 Enterococcus Counts
0
0.05
0.1
0.15
0.2
0.25
TRS-
1
TRS-
2
TRS-
3
TRW
-1
MC
L-1
MC
U-1
PCL-
1
PCU
-1
MM
L-1
MM
U-1
UC
L-1
DC
L-1
DC
U-1
LCL-
1
LCU
-1
LCU
-2
LCU
-3
JCL-
1
JCU
-1
TCL-
1
TCU
-1
Site
Am
mon
ia (M
g/L)
Figure 7 – March 2007 Ammonia Levels

City of Trinidad Prop 50 ICWMP
P. 7 January 2008 Draft October Water Quality Report
0
1
2
3
4
5
6
TRS
-1
TRS
-2
TRS
-3
TRW
-1
MC
L-1
MC
U-1
PC
L-1
PC
U-1
MM
L-1
MM
U-1
UC
L-1
DC
L-1
DC
U-1
LCL-
1
LCU
-1
LCU
-2
LCU
-3
JCL-
1
JCU
-1
TCL-
1
TCU
-1
Site
Nitr
ate
(Mg/
L)
Figure 8 – March 2007 Nitrate Levels
0.00
0.02
0.04
0.06
0.08
0.10
0.12
0.14
0.16
TRS-
1TR
S-2
TRS-
3TR
S-4
TSD
-1TR
W-1
MC
L-1
MC
U-1
PCL-
1PC
U-1
PCU
-2M
ML-
1M
MU
-1U
CL-
1D
CL-
1D
CU
-1LC
L-1
LCU
-2LC
U-3
LCT-
1JC
L-1
JCU
-1TC
U-1
TCU
-2
Site
Orth
opho
spha
te (M
g/L)
Figure 9 – March 2007 Orthophosphate Levels

City of Trinidad Prop 50 ICWMP
P. 1 February 2008 Draft December Water Quality Report
CCIITTYY OOFF TTRRIINNIIDDAADD
WASTEWATER ELEMENT WATER QUALITY SUMMARY REPORT
DECEMBER 18-19, 2007
FEBRUARY 2008
PREPARED BY: STREAMLINE PLANNING CONSULTANTS 1062 G STREET, SUITE I; ARCATA, CA 95521 PHONE: 707-822-5785; FAX: 707-822-5786
WWW.STREAMLINEPLANNING.NET

City of Trinidad Prop 50 ICWMP
P. 2 February 2008 Draft December Water Quality Report
Introduction The following brief report summarizes the December 2007 wastewater element water quality sampling event under a Prop 50 Coastal Watershed Planning Grant (Trinidad-Westhaven Coastal Watershed Project). Sampling Samples were collected over two days. Sampling began, according to our QAPP, on Tuesday, December 18, 2007 in the morning; more than 0.5 inches of rain had fallen in the previous 24 hours. Sampling occurred between 9:00 a.m. and 12:30 p.m. All the lower watershed sampling sites were samples on the 18th. Sampling continued on Wednesday, December 19, 2007, occurring between 9:00 a.m. and 12:00 p.m. All the upper sites and seeps were sampled on the 19th. This was different from the previous storm event samples were sampling occurred south to north. Weather There were some sprinkles of rainfall in the days leading up to this sampling event with about a quarter of an inch of rain on the 16th. However, it was the best window of opportunity that we had had in several weeks to do the sampling. A larger storm came in on Monday, dropping over 0.5 inches of rainfall late in the day. On Tuesday it was still raining during sampling. There was 0.63 inches of rain on the 18th and 1.15 inches of rain the next day. This rainfall data was obtained from the National Weather Service, Eureka (Woodly Island) station. At this point, the area is just a few 100ths of an inch away from normal rainfall amounts for both the season and the month. Winds were faily strong during the sampling with gusts up to 30 mph. Temperatures were near normal for the dates with a maximum of 54ºF and a low of 42ºF. Notes

City of Trinidad Prop 50 ICWMP
P. 3 February 2008 Draft December Water Quality Report
00.20.40.60.8
11.21.41.61.8
2
16-N
ov
18-N
ov
20-N
ov
22-N
ov
24-N
ov
26-N
ov
28-N
ov
30-N
ov
2-D
ec
4-D
ec
6-D
ec
8-D
ec
10-D
ec
12-D
ec
14-D
ec
16-D
ec
18-D
ec
20-D
ec
Date
Rai
nfal
l (in
)
Figure 1 – Daily rainfall collected at the City’s water plant at upper Luffenholtz Creek at approximately 9:00 a.m. each morning. Results Table 1 – Vital Signs and Turbidity
Site Water (ºC)
pH EC (uS)
Turbidity(NTUs)
TRS-1 11 6.7 345 TRS-2 9.5 6.3 380 TRS-3 12 5.7 1503 TRW-1 11 6.9 260 MCL-1 14 5.6 263 MCU-1 10 6.5 103 34.1 PCL-1 10.5 6.3 89 15.9 PCU-1 10 6.9 144 128.2 MML-1 9.7 5.6 153 28.4 MMU-1 10 6.3 100 25.6 DCL-1 9.4 6.2 59 12.8 DCU-1 10 6.1 85 20.4 LCL-1 9.2 5.9 72 4.5 LCU-1 9.5 6.3 86 40.7 JCL-1 9.1 6.35 76 15.7 JCU-1 10 5.15 202 78.5 TCL-1 9.3 6.1 97 77.3

City of Trinidad Prop 50 ICWMP
P. 4 February 2008 Draft December Water Quality Report
0
2
4
6
8
10
12
14
16
TRS
-1
TRS
-2
TRS
-3
TRS
-4
TRW
-1
MC
L-1
MC
U-1
PC
L-1
PC
U-1
MM
L-1
MM
U-1
DC
L-1
DC
U-1
LCL-
1
LCU
-1
JCL-
1
JCU
-1
TCL-
1
Site
Wat
er T
empe
ratu
re (C
)
Figure 2 – December 2007 Water Temperatures
5
5.5
6
6.5
7
7.5
TRS
-1
TRS
-2
TRS
-3
TRS
-4
TRW
-1
MC
L-1
MC
U-1
PCL-
1
PC
U-1
MM
L-1
MM
U-1
DC
L-1
DC
U-1
LCL-
1
LCU
-1
JCL-
1
JCU
-1
TCL-
1
Site
pH U
nits
Figure 3 – December 2007 pH

City of Trinidad Prop 50 ICWMP
P. 5 February 2008 Draft December Water Quality Report
0
50
100
150
200
250
300
350
400
TRS
-1
TRS
-2
TRS
-3
TRS
-4
TRW
-1
MC
L-1
MC
U-1
PC
L-1
PC
U-1
MM
L-1
MM
U-1
DC
L-1
DC
U-1
LCL-
1
LCU
-1
JCL-
1
JCU
-1
TCL-
1
Site
EC (u
S)
Figure 4 – December 2007 Electrical Conductivity
0
20
40
60
80
100
120
140
MC
L-1
MC
U-1
PC
L-1
PC
U-1
MM
L-1
MM
U-1
DC
L-1
DC
U-1
LCL-
1
LCU
-1
JCL-
1
JCU
-1
TCL-
1
Site
Turb
idity
(NTU
)
Figure 5 – December 2007 Turbidity

City of Trinidad Prop 50 ICWMP
P. 6 February 2008 Draft December Water Quality Report
Table 2 – Fluorescence (ppm)
Site TRS-1 TRS-2 TRS-3 TRS-4 TRW-1 MCL-1 MCU-1 PCL-1 PCU-1Flourescence 1.96 4.61 0.2 3.07 0.83 5.24 3.48 5.99 4.89
Site MML-1 MMU-1 UCL-1 DCL-1 DCU-1 LCL-1 LCU-1 LCU-2LCU-2.5
Flourescence 6.18 5.4 7 8.55 8.11 5.09 4.33 6.29 7.55 Site LCT-1 JCL-1 JCU-1 JCU-2 TCL-1 TCU-1 TCU-2
Flourescence 7.76 7.21 6.06 6.84 7.18 6.69 5.79
0
1
2
3
4
5
6
7
8
9
TRS
-1TR
S-2
TRS
-3TR
S-4
TSD
-1TR
W-1
MC
L-1
MC
U-1
PC
L-1
PC
U-1
PC
U-2
MM
L-1
MM
U-1
UC
L-1
DC
L-1
DC
U-1
LCL-
1LC
U-1
LCU
-2LC
U-2
.5LC
U-3
LCT-
1JC
L-1
JCU
-1JC
U-2
TCL-
1TC
U-1
TCU
-2
Site
Fluo
resc
ence
(ppm
)
Figure 6 – December 2007 Fluorescence Readings Table 3 – Bacteria and Nutrients
Site Total
Coliform E. Coli Entero- coccus Ammonia Nitrite O-Phos
TRS-1 2,613 10 41 0 4 NA TRS-2 2,187 10 10 0.1 2 NA TRS-3 4,611 1 1 0 7.5 0 TRS-4 4,884 63 20 0 7.5 NA
TRW-1 Error Error Error 0.4 5 NA TRO-1 199 10 10 NA NA NA MCL-1 10 160 336 0.3 0 0 MCU-1 10 20 10 0.1 0.3 NA MCU-S 7,270 52 459 0.4 0 0

City of Trinidad Prop 50 ICWMP
P. 7 February 2008 Draft December Water Quality Report
PCL-1 6,488 341 1,396 0.2 0.3 NA PCU-1 1,334 1 85 0.4 0.5 0 MML-1 1,450 75 146 0.1 0.5 NA MMU-1 250 1 1 0.3 0 0 UCL-1 8,164 320 2,723 0.6 0.5 0 DCL-1 1,860 122 203 0.4 0.6 NA DCU-1 399 52 1 0.4 0.5 0 LCL-1 1,500 41 465 0.1 0.2 NA
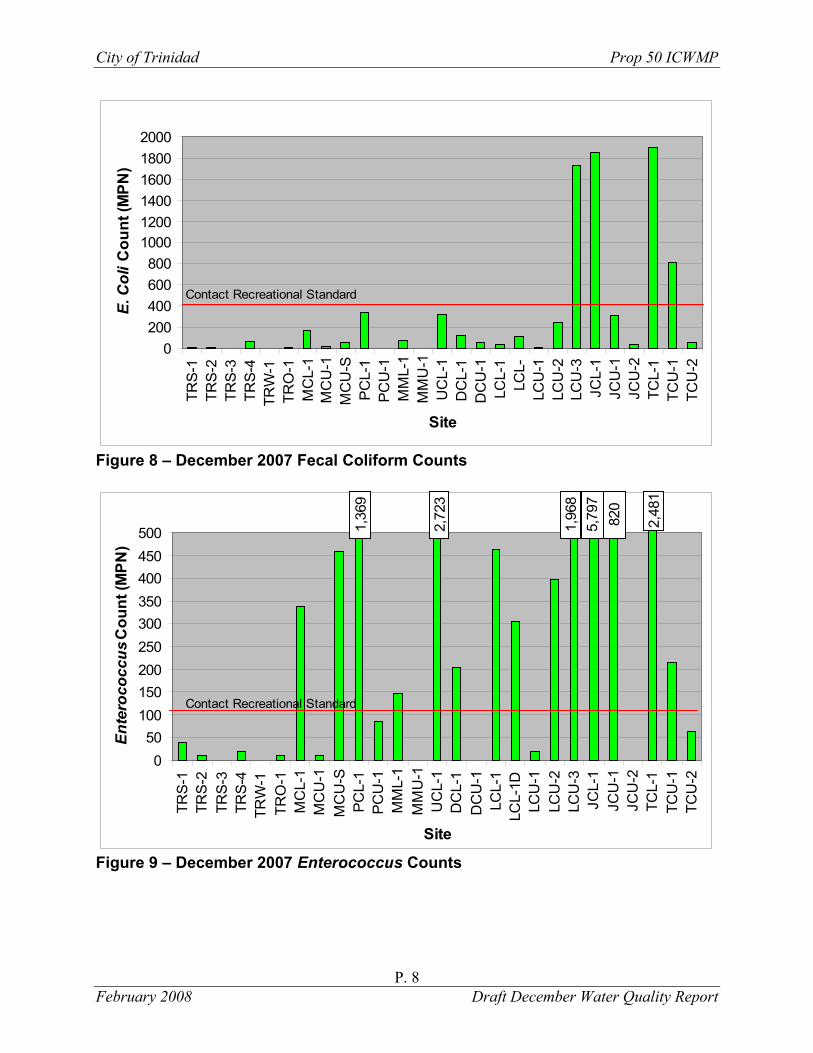
LCL-1D 1,956 110 305 NA NA NA LCU-1 450 10 20 0.1 0 NA LCU-2 6,488 250 399 0.8 0 NA LCU-3 15,531 1,723 1,968 0.3 0.1 NA JCL-1 8,664 1,850 5,797 0.6 0 0 JCU-1 3,654 309 820 0.3 0.4 NA JCU-2 1,607 41 1 0.1 0 NA TCL-1 7,270 1,904 2,481 0.4 0.5 0 TCU-1 5,172 816 213 0.2 2 NA TCU-2 1,476 52 63 0.2 0 0
0
5,000
10,000
15,000
20,000
TRS-
1TR
S-2
TRS-
3TR
S-4
TRW
-1TR
O-1
MC
L-1
MC
U-1
MC
U-S
PC
L-1
PCU
-1M
ML-
1M
MU
-1U
CL-
1D
CL-
1D
CU
-1LC
L-1
LCL-
LCU
-1LC
U-2
LCU
-3JC
L-1
JCU
-1JC
U-2
TCL-
1TC
U-1
TCU
-2
Site
Tota
l Col
iform
Cou
nt (M
PN)
>24,192
Contact Recreational Standard
Figure 7 – December 2007 Total Coliform Counts
City of Trinidad Prop 50 ICWMP
P. 8 February 2008 Draft December Water Quality Report
0200400600800
100012001400160018002000
TRS
-1TR
S-2
TRS
-3TR
S-4
TRW
-1TR
O-1
MC
L-1
MC
U-1
MC
U-S
PC
L-1
PC
U-1
MM
L-1
MM
U-1
UC
L-1
DC
L-1
DC
U-1
LCL-
1LC
L-LC
U-1
LCU
-2LC
U-3
JCL-
1JC
U-1
JCU
-2TC
L-1
TCU
-1TC
U-2
Site
E. C
oli C
ount
(MPN
)
Contact Recreational Standard
Figure 8 – December 2007 Fecal Coliform Counts
050
100150200250300350400450500
TRS
-1TR
S-2
TRS
-3TR
S-4
TRW
-1TR
O-1
MC
L-1
MC
U-1
MC
U-S
PCL-
1P
CU
-1M
ML-
1M
MU
-1U
CL-
1D
CL-
1D
CU
-1LC
L-1
LCL-
1DLC
U-1
LCU
-2LC
U-3
JCL-
1JC
U-1
JCU
-2TC
L-1
TCU
-1TC
U-2
Site
Ente
roco
ccus
Cou
nt (M
PN)
2,72
3
1,07
12,
187
Contact Recreational Standard
1,36
9
1,72
3
2,48
1
5,79
71,
968
820
Figure 9 – December 2007 Enterococcus Counts

City of Trinidad Prop 50 ICWMP
P. 9 February 2008 Draft December Water Quality Report
0
0.1
0.2
0.3
0.4
0.5
0.6
0.7
0.8
0.9
TRS
-1TR
S-2
TRS
-3
TRS
-4TR
W-1
MC
L-1
MC
U-1
PC
L-1
PC
U-1
MM
L-1
MM
U-1
UC
L-1
DC
L-1
DC
U-1
LCL-
1
LCU
-1LC
U-2
LCU
-2.5
LCT-
1JC
L-1
JCU
-1JC
U-2
TCL-
1
TCU
-1TC
U-2
Site
Am
mon
ia (M
g/L)
Figure 10 – December 2007 Ammonia Levels
0
1
2
3
4
5
6
7
8
TRS
-1
TRS
-2
TRS
-3
TRS
-4
TRW
-1
MC
L-1
MC
U-1
PC
L-1
PC
U-1
MM
L-1
MM
U-1
UC
L-1
DC
L-1
DC
U-1
LCL-
1
LCU
-1
LCU
-2
LCU
-2.5
LCT-
1
JCL-
1
JCU
-1
JCU
-2
TCL-
1
TCU
-1
TCU
-2
Site
Nitr
ate
(Mg/
L)
Figure 11 – March 2007 Nitrate Levels Due to a lack of the number of samples, Ortho-phosphate was only tested for samples that had high readings of Nitrate or Ammonia. For all samples tested, Ortho-phosphate did not show up, so there is no figure (see table). Figure 12 – March 2007 Orthophosphate Levels

Appendix E:
OWTS Permit Analysis

OWTS Permit Analysis Draft Report February 2008 - 1 -
Appendix E: On-Site Wastewater Treatment Systems Permit Analysis
There are nine watersheds within the designated study area. Due to time constraints and limited funding, OWTS information has only been obtained for six of these watersheds. The watersheds selected for analysis were chosen based on high bacterial counts obtained during preliminary surface water sampling as well as high residential densities.
Trinidad watershed: This drainage area comprises a total of 144 acres and is the most densely populated of the watersheds. Hydrologically, the City of Trinidad is separated into three different drainage areas. Water in the southern part of the City drains into the ocean via Indian Beach, water in the western part of the City drains into Trinidad State Beach, and water that falls directly on Trinidad Head enters the ocean from its cliff overhangs.
Mill Creek: This watershed is 855 acres in area and is one of the least densely populated. Impervious surfaces, such as roads and homes, cover only 2.8% of the Watershed.
Parker Creek: This watershed covers an area of 234 acres and contains 60 parcels. Lands owned by the Trinidad Rancheria are found within this watershed. Impervious surfaces comprise 7.6% of the total land area.
Luffenholtz Creek: This watershed occupies 3,162 acres and, due to extensive forest cover, has the lowest amount of impervious surfaces at 0.7%.
Joland and Two Creeks: These two watersheds cover the Westhaven area and were also found to have the poorest overall water quality. Over 8% of both watersheds are covered with impervious surfaces.
Assessor Parcel Numbers (APNs) for lots within these watersheds were obtained from Geographic Information Systems (GIS) data produced by the Humboldt County Community Development Services Department. APNs were used to locate permit files at the offices of the Humboldt County Division of Environmental Health (DEH). Information was collected from DEH files over a five-week period in late 2007. Results were recorded by hand and subsequently entered into an Excel spreadsheet.
Table 1 lists the six watersheds studied, the number of parcels within each of them, the number of parcels on file at the DEH, and the number of files containing OWTS information.

OWTS Permit Analysis Draft Report February 2008 - 2 -
Table 1. Summary results of OWTS permit analysis Watershed Total Parcels Parcels with Files Files with OWTS
Information Trinidad 300 119 112 Joland Creek / Two Creeks
394 + 14 Unknown 183 113
Luffenholtz Creek 137 66 50 Mill Creek 66* 27 18 Parker Creek 58* 13 7 * These numbers do not include parcels within Trinidad City limits On-site Wastewater Treatment Systems: Background Trinidad is currently in the process of enacting an OWTS Management Ordinance. The City has been using Humboldt County’s design standards since 1974, when they were introduced. The County’s sewage disposal regulations have not been updated since 1984; however, new standards were introduced for ‘non-standard systems’ in 1997. A major change to the regulations occurred in 1979 when the ‘Basin Plan’ was introduced by the North Coast Regional Water Board. Our investigation is focused on OWTS that were built prior to the establishment of regulations protecting environmental quality, and on OWTS that have been built without permits. OWTS constructed prior to 1974 were built under a very different permitting system, which required only limited inspection and minimal design specifications. Systems built under these regulations will require detailed inspection in an attempt to discover if any repair or upgrade work is necessary. OWTS designs often did not require a reserve leachfield before 1974, which may cause a problem when it comes to upgrading these systems. Inadequate space may necessitate the continued use of existing leachfields, even if they are malfunctioning. Mitigation measures will have to be discussed and introduced. These pre-1974 systems, along with non-permitted systems, are likely to be the most problematic for water quality. Systems constructed between 1975 and 1979 will also require further investigation, as they were constructed before the introduction of the current regulations. Systems constructed after 1980 were generally built to higher standards. The new regulations introduced criteria that made it compulsory for new systems to provide adequate tank sizes for the proposed number of bedrooms. For example, a three-bedroom house is required to have a tank size of 1,800 gallons that can accommodate 450 gallons of water per day. The standards also set out how many lines are required and the length the trenches need to be. More stringent setbacks were created to keep disposal fields at least 100 feet back from bodies of water. Soil investigations have

OWTS Permit Analysis Draft Report February 2008 - 3 -
become a lot more detailed as well, to ensure that soils are capable of handling sewage effluent. Nevertheless, standard OWTS built after 1980 are not required to be regularly inspected, meaning that problems with these systems may go unnoticed for long periods of time. Non-standard OWTS, such as mounds and pressure distribution systems, are required to be inspected by a qualified inspector every two years leaving less chance of failure. Trinidad Watershed Initial OWTS permit analysis was begun in 2005 under a State Proposition 13 Grant – Coastal Nonpoint Source Pollution Control Program. Under this grant, septic information was collected only for the City of Trinidad. The data collected for Trinidad is displayed in the figures below. Figure 1a depicts the date on which OWTS were last repaired. Figure 1b depicts the date on which new systems were constructed or approved. The majority of permitted OWTS were constructed after 1985. It should be noted, however, that more than half of the systems in the City do not have permits on file with the DEH and may be over 30 years old.
a)
b)
New Systems17%
7%
19%
1%
56%
Post 1995
1985-1994
1970-1984
Prior to 1970
UnknownApproval
Figure 1. Results of OWTS permit analysis in City of Trinidad (2005)

OWTS Permit Analysis Draft Report February 2008 - 4 -
It is apparent from the data collected, presented in the graphs above, that there are a large proportion of systems that have not received approval by the DEH. This would suggest that there are at least 95 systems in Trinidad that were constructed prior to 1974, when regulations were limited and not strongly enforced. A large proportion of these may have been constructed prior to 1970. Such systems would have no government regulations in place to ensure competent construction, making the chance of malfunction even more likely.
In terms of repairs the signs are more promising. Nearly two-thirds of repairs have been conducted after 1984, reducing the likelihood that older systems are failing. However, this initial data collection has revealed a great need for further inspection in an attempt to identify problematic systems.
Water quality data collected for the Trinidad area under Prop 50 resulted in few bacteria readings that were above the ‘Contact Recreational Standard.’ Different results were obtained under the Prop 15 funding back in 2005 however both of these studies identified that Trinidad is not one of the high contributors to poor water quality. Although Trinidad is not one of the priority areas for poor water quality it still has significance. The presence of sensitive cultural resources at the Tsurai Study Area triggers a need to ensure that contaminants are kept to a minimum in an attempt to protect the bluff. Problematic OWTS that contribute to destabilization of the bluff will be addressed during the General Plan Update.
Joland and Two Creeks Watersheds
In the Joland Creek and Two Creeks watersheds there are a total of 411 parcels comprising the Westhaven Community Services District. Of these 411 parcels, only 183 (45%) were found to have DEH files. Only 113 of these files had information in them pertaining to OWTS. As noted in Table 1, 14 of these files had APNs that did not correspond to the APNs obtained from the County’s GIS parcel layer. It is possible that these 14 parcels have recently been lost due to subdivisions or lot mergers, meaning that the data obtained for these APNs may correlate to other newly created APN’s. Further research is necessary to determine which parcels these data correspond to.
The data obtained from Joland and Two Creeks revealed that 64 new systems have been permitted by the DEH since 1970, of which 26 have been constructed since 1995. The files also showed there to be a total of 36 OWTS repairs since 1970, 14 of which were completed post-1995. The following figures summarize the age of systems that have been installed and repaired since 1970.

OWTS Permit Analysis Draft Report February 2008 - 5 -
3%
31%
28%
38%
Repaired 1995-PresentRepaired 1985-1994Repaired 1970-1984Prior to 1970
System Constructed
10%
5%
10%
2%
73%
Constructed1995-PresentConstructed1985-1994Constructed1970-1984Prior to 1970
UnknownApproval Date
a)
b)
Figure 2. Results of OWTS permit analysis in Westhaven Community Services District (2007)
Joland Creek had the highest overall ranking of bacteria and nutrients when results were tabulated for all water quality sampling events. Two Creek had the highest ranking when it came to percent exceedances of bacterial standards, and had the second-highest ranking for overall nutrient contamination. Within these two watersheds there are 188 parcels that have ‘Unknown Approval Dates’ for OWTS. Considering the poor water quality readings and the large number of old/unapproved OWTS, major focus will be given to these watersheds in utilizing funds provided by the Clean Beaches Grant for inspecting, repairing, and upgrading OWTS.
Luffenholtz Creek Watershed
There are 137 parcels in the Luffenholtz Creek watershed, of which 66 have DEH files and 50 have OWTS information. There are 26 vacant parcels within this watershed, leaving 61 parcels (45%) that contain OWTS but have no approval date. The data collected from the health department did reveal there to be a sizeable number of systems that were constructed post-1995 with almost a quarter of systems being built after 1980. The number of parcels that are vacant and the number built after 1980
System Repairs

OWTS Permit Analysis Draft Report February 2008 - 6 -
System Constructed
20%
4%
8%
0%68%
Post 1995
1985-1994
1970-1984
Prior 1970
Unknown approvaldate
Date Repaired
75%
17%
8% 0%
Post 19951985-19941970-1984Prior 1970
make up almost half of the parcels in the Luffenholtz watershed. This indicates that the majority of permitted systems were built to the standards set by the Humboldt Basin Plan.
Attention should be given to inspecting the other ‘Unknown Approved’ systems. Water quality sampling on Luffenholtz Creek revealed mixed results. In February 2007, coliform counts were above the ‘Contact Recreational Standard’ while March 2007 coliform levels were well below this standard. Further investigation will be required in order to ascertain why there was a reduction in coliform counts over a one-month period. Overall, Luffenholtz Creek received mid-level rankings for bacteria and nutrient contamination when compared to the other sampling sites.
a)
b)
Figure 3. Results of OWTS permit analysis in Lufenholtz Watershed (2007)
Mill Creek
There are 66 Parcels in Mill Creek, 27 of which have DEH files and 18 of which contain OWTS data. Eighteen parcels in the Mill Creek watershed are vacant, leaving 2 parcels

OWTS Permit Analysis Draft Report February 2008 - 7 -
that have unknown approval dates. Water quality sampling revealed that Mill Creek had some of the lowest total coliform readings of all the creeks. Most of the readings taken were all below the ‘Contact Recreational Standard’ for bacteria. Although Mill Creek is very sparsely populated its low level readings makes further investigation necessary so it can be ascertained why the levels are so low. Mill Creek might then be used to demonstrate baseline conditions against which other watersheds will be measured. Due to the low levels of coliform there is no immediate need to seek funding for OWTS inspections and repairs within this watershed.
One of the most noticeable details in Figure 4b is the proportion of repairs that have been conducted after 1995. The number of files that do conatain OWTS data shows that the largest number of constructions has occurred post 1995.
a)
b)
Figure 4. Results of OWTS permit analysis in Mill Creek Watershed (2007)
Systems Constructed
18%4%
0%
4%
74%
Post 1995
1985-1994
1970-1984
Prior 1970
Unknown approval date
System Repaired
64%
18%
18%0%
Post 1995
1985-1994
1970-1984Prior 1970

OWTS Permit Analysis Draft Report February 2008 - 8 -
6% 6%3%3%
82%
Constructed 1995-presentConstructed 1985-1994Constructed 1970-1984Constructed prior1970Unknown ApprovalDate
Repair of System
50%50%
Repair 1985-1994Repair 1995-Present
Parker Creek
Parker Creek has a total of 58 parcels of which 16 are vacant and 7 have OWTS data on them. Due to such a small number of files in this watershed it is hard to detect any substantial pattern. The information that does exist is relatively balanced, showing an even distribution of systems constructed before 1985 and after. The lower part of Parker Creek received relatively high rankings for bacteria and nutrient contamination. Due to the large proportion of non-permitted OWTS in this watershed, it should receive moderately high funding priority for OWTS inspections and repairs.
a)
b)
Figure 5. Results of OWTS permit analysis in Parker Creek Watershed (2007)
Systems Constructed

OWTS Permit Analysis Draft Report February 2008 - 9 -
Summary
The most prevalent pattern that can be seen across the watersheds is a correlation between ‘Repairs Post 1995’, ‘Constructions Post 1995’ and low bacteria levels. In most cases, a higher proportion of OWTS constructed or repaired after 1995 corresponded to lower coliform readings obtained from water quality sampling. For example, it is apparent in the results obtained for Mill Creek that a large number of repairs and constructions have occurred after 1995 and that coliform readings have generally been below the ‘Contact Recreational Standard.’ This is not to say that other factors, such as a low population, have not played a part in the low bacteria levels in Mil Creek. It is important to note that there are only 48 occupied parcels in this watershed. However, a similar pattern can be identified in the highly populated Trinidad drainage, where post-1995 repairs and constructions are relatively high and coliform readings have been relatively low.
Joland and Two Creeks, as mentioned earlier, have been identified as having the highest levels of fecal coliform. OWTS permit analysis also revealed that these two watersheds combined have the highest proportion of ‘Unknown Approval Dates’ – a sign that further research is necessary to discover those systems that are contributing to the high levels of coliform.
Across all the watersheds it is evident that there is a lack of OWTS data pertaining to a large number of occupied parcels. This is also demonstrated in Figure 6, which shows quite clearly that Westhaven has a lot of occupied parcels without data. Considering that Westhaven makes up the main urban land mass of the Joland and Two Creeks watersheds, there is a real need to focus attention on obtaining further information on OWTS in this area before repairs can even be considered. One positive piece of data that is evident in Figure 6 is the number of systems constructed after 1995.

XYXYXYXYXYXYXYXYXYXYXYXYXYXYXYXYXYXYXYXYXYXYXYXYXYXYXYXYXYXYXYXYXYXYXYXYXYXYXYXYXYXYXYXYXYXYXYXYXYXYXYXYXYXYXYXYXYXYXYXYXYXYXYXYXYXYXYXY
XY
XY
XY
XY
XY
XY
XY
XY
XY
XY
XY
XY
XY
XY
XY
XY
XY
XY
XY
XY
XY
XY
XY
XY
XY
XY
XY
XY
XY
XY
XY
XY
XY
XY
XY
XY
XY
XY
XY
XY
XY
XY
XY
XY
XY
XY
XY
XY
XY
XY
XY
XY
XY
XY
XY
XY
XY
XY
XY
XY
XY
XY
XY
XY
XY
XY
XY
XY
XY
XY
XY
XY
XY
XY
XY
XY
XY
XY
XY
XY
XY
XY
XY
XY
XY
XY
XY
XY XY XY XY XY XY XY XY XY XY XY XY XY XY XY XY XY XY XY XY XY XY XY XY XY XY XY XY XY XY XY XY XY XY XY XY XY XY XY XY XY XY XY XY XY XY XY XY XY XY XY XY XY XY XY XY XY XY XY XY XY XY XY XY XY XY XY XY XY
XY
XY
XY
XY
XY
XY
XY
XY
XY
XY
XY
XY
XY
XY
XY
XY
XY
XY
XY
XY
XY
XY
XY
XY
XY
XY
XY
XY
XY
XY
XY
XY
XY
XY
XY
XY
XY
XY
XY
XY
XY
XY
XY
XY
XY
XY
XY
XY
XY
XY
XY
XY
XY
XY
XY
XY
XY
XY
XY
XY
XY
XY
XY
XY
XY
XY
XY
XY
XY
XY
XY
XY
XY
XY
XY
XY
XY
XY
XY
XY
XY
XY
XY
XY
XY
XY
XY
XY
Fig. 6: OWTS Age of System
February 2008www.trinidad.ca.gov
Trinidad-Westhaven Coastal Watershed Project
0 2,500
1 inch equals 2,500 feet
8
LegendOWTS Status
Constructed prior to 1970Constructed 1970-1984Constructed 1985-1994Constructed 1995 to presentRepaired prior to 1970Repaired 1970-1984Repaired 1985-1994Repaired 1995 to presentUnknown approval dateVacant/open space No information available

Appendix F:
STREAMLINE Planning Wastewater Management Action Plan

Wastewater Management Action Plan February 2008 (Draft)
1
WASTEWATER MANAGEMENT ACTION PLAN FOR THE TRINIDAD-WESTHAVEN COASTAL WATERSHED
Prepared by STREAMLINE Planning Consultants for the City of Trinidad
1. INTRODUCTION
A. Purpose and Objectives This Action Plan has been developed as part of an integrated coastal watershed planning effort for the Trinidad Head ASBS. The objective of this planning effort is to improve water quality in the multiple watersheds on the Trinidad Plateau that ultimately drain into the ocean near Trinidad Bay. The kelp beds offshore of Trinidad Head have been designated by the State as an Area of Special Biological Significance (ASBS), and the coastal watersheds draining into the ASBS have been designated by the state as a Critical Coastal Area (CCA). The City of Trinidad and its neighbors have come together as a group of stakeholders committed to taking stewardship of their watersheds and protecting the shared resource of the Trinidad Head ASBS. The overall approach to achieving the project objective involves identification of the pollutants of concern through watershed assessments and water quality monitoring, and identification of specific management strategies to help reduce or eliminate those pollutants at their sources. The process will result in preparation of a final Trinidad-Westhaven Integrated Coastal Watershed Management Plan (ICWMP) addressing wastewater, stormwater runoff, and sediment as high-priority issues for watershed management. The Wastewater Management Action Plan proposes specific strategies to implement the ICWMP.
Management of onsite wastewater treatment systems (OWTS) has been an objective of the City of Trinidad for at least the past ten years. The City is now in the early stages of implementing a management and operating permit process for the approximately 200 septic systems within City limits. Ground and surface water quality sampling in the City is being conducted under various funding sources, including grant funding under Proposition 13. Water quality sampling has taken place throughout the watershed under Proposition 50 funding. Measurements have been taken at various locations on perennial creeks and seeps/springs along coastal bluffs to the south and west of Trinidad, and the resulting data will be used in combination with a series of other tasks to address the objectives described below. The objective of the Wastewater Management Action Plan is to determine the degree to which existing OWTS may be contributing elevated levels of fecal coliform bacteria, other bacteria, and nutrients to the surface and ground waters influencing the Trinidad Head ASBS. A subsequent objective is to develop

Wastewater Management Action Plan February 2008 (Draft)
2
recommendations for appropriate measures to reduce the introduction of these contaminants into surrounding water resources.
Long-term goals for the Action Plan include the following:
1. Reduce the level of bacteria and nutrients found in local surface and ground waters.
2. Comply with the requirements set forth in State Assembly Bill 885. 3. Prevent future OWTS failures. 4. Promote a watershed-based approach to land use planning.
B. Process and Partnerships The following tasks were undertaken in the process of achieving wastewater management objectives. Water quality sampling: Sampling took place throughout the watershed in order to test for bacterial contaminants and nutrient constituents. A Quality Assurance Project Plan (described in Chapter 5) used standardized procedures and methods to guarantee the quality of the data generated.
Objective: To isolate areas of high pollutant concentration within the watershed.
OWTS permit assessment: As was done for the City of Trinidad, existing OWTS permit information was obtained for unincorporated areas indicating higher levels of pollution. The information obtained included age of system, date of last upgrade, system type and capacity, etc.
Objective: To identify priority action areas in conjunction with data obtained from water quality sampling.
OWTS incentives program: Incentives and opportunities were identified for fixing/upgrading OWTS in the highest-priority areas. These include public education/outreach and water conservation efforts.
Objective: To educate property owners about proper care for and maintenance of onsite wastewater treatment systems and the effect of OWTS on water quality.
OWTS analysis: Using GIS software, areas with noted poor water quality were categorized in terms of the number, density, age and adequacy of OWTS in the area. Separate analyses were performed for each of the watersheds in the study area.
Objective: To identify problem areas and prioritize action alternatives for reducing OWTS pollution of surface water and groundwater systems.

Wastewater Management Action Plan February 2008 (Draft)
3
Habitat assessments: Habitat assessments were conducted within representative stream reaches at each surface water sampling point.
Objective: To provide indicator relationships between water quality data and potential limiting factors for target species.
The tasks were carried out by STREAMLINE Planning Consultants using funding from State Proposition 50 Integrated Regional (Coastal) Water Management (IRWM) Grant Program. The intent of the Prop 50 IRWM grants is to encourage integrated regional strategies for management of water resources and to provide funding for projects that protect communities from drought, protect and improve water quality, and improve local water security by reducing dependence on imported water. The Trinidad-Westhaven Coastal Watershed Project scored the highest out of all 54 planning grant proposals. Cooperating agencies and organizations are described in the Trinidad-Westhaven ICWMP.
2. REGIONAL DESCRIPTION
A. General Watershed Characteristics Location and Geography The planning area for the Trinidad-Westhaven Coastal Watershed Project includes nine watersheds, from the southern boundary of the Two Creeks watershed to the northern boundary of the Mill Creek watershed. Figure 2.1 shows the location of the project area within Humboldt County. Figure 2.2 shows the planning area watersheds and the Trinidad Head ASBS. This planning area was selected because it contains the tributary watersheds that have the potential for greatest impact on water quality in the waters surrounding Trinidad Head, where the kelp beds are located.
The watersheds comprising the planning area are listed and briefly characterized below:
• Mill Creek – encompasses about 856 acres of residential and timber land;
drains into the Pacific Ocean on the north side of Trinidad Head • City of Trinidad – encompasses about 144 acres of residential,
commercial and open-space land; drains into Trinidad Bay • Parker Creek – encompasses about 235 acres of residential and timber
land; drains into Trinidad Bay • McConnahas Mill Creek – encompasses about 745 acres of residential
and timber land; drains to the Pacific Ocean south of Trinidad Bay • Unnamed drainage – encompasses about 150 acres of residential land;
drains to the Pacific Ocean south of Trinidad Bay • Deadman’s Creek – encompasses about 353 acres of residential and
timber land; drains to the Pacific Ocean south of Trinidad Bay • Luffenholtz Creek – encompasses about 3,163 acres of residential and

Wastewater Management Action Plan February 2008 (Draft)
4
timber land, including about half of the Westhaven community; drains into the Pacific Ocean at Luffenholtz Beach, south of Trinidad Bay
• Joland Creek – encompasses about 234 acres of residential land; drains into Luffenholtz Creek near Luffenholtz Beach, but has been treated as a separate watershed for analysis purposes
• Two Creeks– encompasses about 267 acres of residential land, including about half of the Westhaven community; drains into the Pacific Ocean south of Luffenholtz Beach


XYXYXYXYXYXYXYXYXYXYXYXYXYXYXYXYXYXYXYXYXYXYXYXYXYXYXYXYXYXYXYXYXYXYXYXYXYXYXYXYXYXYXYXYXYXYXYXYXYXYXYXYXYXYXYXYXYXYXYXYXYXYXYXYXYXYXYXY
XY
XY
XY
XY
XY
XY
XY
XY
XY
XY
XY
XY
XY
XY
XY
XY
XY
XY
XY
XY
XY
XY
XY
XY
XY
XY
XY
XY
XY
XY
XY
XY
XY
XY
XY
XY
XY
XY
XY
XY
XY
XY
XY
XY
XY
XY
XY
XY
XY
XY
XY
XY
XY
XY
XY
XY
XY
XY
XY
XY
XY
XY
XY
XY
XY
XY
XY
XY
XY
XY
XY
XY
XY
XY
XY
XY
XY
XY
XY
XY
XY
XY
XY
XY
XY
XY
XY
XY XY XY XY XY XY XY XY XY XY XY XY XY XY XY XY XY XY XY XY XY XY XY XY XY XY XY XY XY XY XY XY XY XY XY XY XY XY XY XY XY XY XY XY XY XY XY XY XY XY XY XY XY XY XY XY XY XY XY XY XY XY XY XY XY XY XY XY XY
XY
XY
XY
XY
XY
XY
XY
XY
XY
XY
XY
XY
XY
XY
XY
XY
XY
XY
XY
XY
XY
XY
XY
XY
XY
XY
XY
XY
XY
XY
XY
XY
XY
XY
XY
XY
XY
XY
XY
XY
XY
XY
XY
XY
XY
XY
XY
XY
XY
XY
XY
XY
XY
XY
XY
XY
XY
XY
XY
XY
XY
XY
XY
XY
XY
XY
XY
XY
XY
XY
XY
XY
XY
XY
XY
XY
XY
XY
XY
XY
XY
XY
XY
XY
XY
XY
XY
XY
8Legend
Major WatershedsStreamsStudy Area Boundary
Fig. 2.2: Watershed Boundaries
February 2008www.trinidad.ca.gov
Luffenholtz Creek
Mill Creek
Two Creeks
Joland Creek
Trinidad
McConnahas Mill Creek
Deadmans Creek
Parker Creek
Unnamed drainage
Trinidad-Westhaven Coastal Watershed Project
0 4,000
1 inch equals 4,000 feet
Pacific Ocean

Wastewater Management Action Plan February 2008 (Draft)
7
Area of Special Biological Significance (ASBS) The kelp beds of Trinidad Head represent a State-identified Critical Coastal Area (CCA) and Area of Special Biological Significance (ASBS). The CCA program, part of the State's Nonpoint Source Plan, is a non-regulatory planning tool to coordinate the efforts of multiple agencies and stakeholders, to ensure that effective management measures are implemented to protect or restore coastal water quality in CCAs. The ASBS designation is intended to afford special protection to marine life through prohibition of waste discharges within ASBS areas. In January 2005, ASBS areas were redesignated as a subset of State Water Quality Protection Areas (SWQPA), which require special protection. Section 36700(f) of the Public Resources Code defines a SWQPA as “a nonterrestrial marine or estuarine area designated to protect marine species or biological communities from an undesirable alteration of natural water quality, including but not limited to, areas of special biological significance.” Trinidad Bay is located immediately to the east of Trinidad Head. Rock outcroppings help to shield the bay from strong winds and waves, providing a safe harbor for recreational and commercial fishing vessels. Crab and salmon fishing are especially popular and provide an economic base for the City of Trinidad. Offshore rocks provide haul-out areas for harbor seals and sea lions and roosting areas for marine birds. Steep coastal bluffs, hiking trails, beaches and a pier provide sightseeing and recreational values. In 1974, the State Water Resources Control Board (SWRCB) designated approximately 2.5 square miles of ocean to the west and east of Trinidad Head as an ASBS (Fig. 2.3). Water quality is of special concern in this area due to the presence of dense beds of bull kelp and other wildlife habitat. The 2005 California Ocean Plan places limits on bacteria, nutrients, and other pollutants that may occur within ocean waters, including all kelp beds. About 0.5 square miles of the ASBS are encompassed by Trinidad Bay, which is primarily influenced by runoff and discharge from the Parker Creek and City of Trinidad watersheds. The westerly portion of the ASBS is primarily affected by Mill Creek. No major water diversions occur on these creeks, although small dams and pumps provide domestic water supplies to residents outside municipal service areas.

Figure 2.3: Location of Trinidad Head Area of Special Biological Significance (State Water Quality Protection Area, or SWQPA)

Wastewater Management Action Plan February 2008 (Draft)
9
Land Use and Ownership Timber production is the dominant land use in the watershed, accounting for 55 percent of the study area. The majority of timberlands are found in the Luffenholtz Creek, Mill Creek, and McConnahas Mill Creek watersheds. Rural residential uses account for the next highest proportion of land area in the watershed (20 percent). A similar proportion of land (15 percent) is vacant but zoned for residential or commercial uses. It unknown how many of these vacant parcels are developed versus undeveloped with regard to structures or infrastructural improvements. Land uses that account for less than five percent of the study area include public facilities, tribal lands, urban and suburban residential, and commercial. The following chart is based on land use data from the Humboldt County and City of Trinidad planning departments.
Timber 54%
Open Space 3%
Roads/Other 5%
Vacant 15%
Commercial 0%
Public Facilities/Tribal
2%Urban/Suburban Residential 1%
Rural Residential 20%
Figure 2.4. Watershed land use by category Most of the watershed is privately owned, with scattered parcels under State or federal ownership. Green Diamond Resource Company is the largest landowner in the planning area with several hundred acres of timber holdings in upland areas. The largest federal land holding consists of approximately 53 acres owned by the Trinidad Rancheria, located south of the City of Trinidad. These lands include a large casino as well as some residential areas. Trinidad occupies just over 300 acres in the northwestern part of the watershed. The Westhaven Community Services District encompasses nearly 400 acres and is located at the southern edge of the watershed ( City of Trinidad GIS 2007; Humboldt County GIS 2005). See Fig. 2.5 for land ownership.

XYXYXYXYXYXYXYXYXYXYXYXYXYXYXYXYXYXYXYXYXYXYXYXYXYXYXYXYXYXYXYXYXYXYXYXYXYXYXYXYXYXYXYXYXYXYXYXYXYXYXYXYXYXYXYXYXYXYXYXYXYXYXYXYXYXYXYXYXYXYXYXYXYXYXYXYXYXYXYXYXYXYXYXYXYXYXYXYXYXYXYXYXYXYXYXYXYXYXYXYXYXYXYXYXYXYXYXYXYXYXYXYXYXYXYXYXYXYXYXYXYXYXYXYXYXYXYXYXYXYXYXYXYXYXYXYXYXYXYXYXYXYXYXYXY
XY
XY
XY
XY
XY
XY
XY
XY
XY
XY
XY
XY
XY
XY
XY
XY
XY
XY
XY
XY
XY
XY
XY
XY
XY
XY
XY
XY
XY
XY
XY
XY
XY
XY
XY
XY
XY
XY
XY
XY
XY
XY
XY
XY
XY
XY
XY
XY
XY
XY
XY
XY
XY
XY
XY
XY
XY
XY
XY
XY
XY
XY
XY
XY
XY
XY
XY
XY
XY
XY
XY
XY
XY
XY
XY
XY
XY
XY
XY
XY
XY
XY
XY
XY
XY
XY
XY
XY
XY
XY
XY
XY
XY
XY XY XY XY XY XY XY XY XY XY XY XY XY XY XY XY XY XY XY XY XY XY XY XY XY XY XY XY XY XY XY XY XY XY XY XY XY XY XY XY XY XY XY XY XY XY XY XY XY XY XY XY XY XY XY XY XY XY XY XY XY XY XY XY XY XY XY XY XY XY XY XY XY XY XY XY XY XY XY XY XY XY XY XY XY XY XY XY XY XY XY XY XY XY XY XY XY XY XY XY XY XY XY XY XY XY XY XY XY XY XY XY XY XY XY XY XY XY XY XY XY XY XY XY XY XY XY XY XY XY XY XY XY XY XY XY XY XY XY XY XY XY XY XY XY XY
XY
XY
XY
XY
XY
XY
XY
XY
XY
XY
XY
XY
XY
XY
XY
XY
XY
XY
XY
XY
XY
XY
XY
XY
XY
XY
XY
XY
XY
XY
XY
XY
XY
XY
XY
XY
XY
XY
XY
XY
XY
XY
XY
XY
XY
XY
XY
XY
XY
XY
XY
XY
XY
XY
XY
XY
XY
XY
XY
XY
XY
XY
XY
XY
XY
XY
XY
XY
XY
XY
XY
XY
XY
XY
XY
XY
XY
XY
XY
XY
XY
XY
XY
XY
XY
XY
XY
XY
XY
XY
XY
XY
XY
XY
LegendCoastal Zone BoundaryCity of TrinidadTrinidad RancheriaWesthaven Community Services DistrictWatershed BoundariesStudy Area
Fig. 2.5: Major Jurisdictional Boundaries
February 2008www.trinidad.ca.gov
Luffenholtz Creek
Mill Creek
Two Creeks
Parker Creek
Joland Creek
Trinidad
McConnahas Mill Creek
Deadmans Creek
Unnamed drainage
Trinidad-Westhaven Coastal Watershed Project
2,000 0 2,0001,000
1 inch equals 2,000 feet
Pacific Ocean
16

Wastewater Management Action Plan February 2008 (Draft)
11
Cultural Resources The Tsurai Study Area (TSA), located on a hillside near the southeastern edge of Trinidad (Fig. 2.6), is home to an ancient village site of the Yurok Tribe. Past archaeological studies have revealed that the village was a permanent settlement, containing multiple levels of human occupation through time. As a result, an abundance of cultural resources and artifacts can be found at the site (Sloan and Rocha 2007). The Tsurai Ancestral Society was formed in 1978 to protect and maintain the village and burial grounds. In the same year, the California Coastal Conservancy purchased the lands encompassing the TSA and retains a conservation easement, although the TSA was transferred to the City of Trinidad in 1989. The village site is designated a California State Historical Landmark and is included on the California Register of Historic Places. Historical and archaeological resources associated with the village site are not necessarily confined to the TSA boundaries (Sloan and Rocha 2007). Erosion of coastal bluffs on and near the village site is a major concern of the Tribe and the Tsurai Ancestral Society, and may be exacerbated by excessive wastewater leaching and stormwater runoff from the greater Trinidad area.

XYXYXYXYXYXYXYXYXYXYXYXYXYXYXYXYXYXYXYXYXYXYXYXYXYXYXYXYXYXYXYXYXYXYXYXYXYXYXYXYXYXYXYXYXYXYXYXYXYXYXYXYXYXYXYXYXYXYXYXYXYXYXYXYXYXYXYXY
XY
XY
XY
XY
XY
XY
XY
XY
XY
XY
XY
XY
XY
XY
XY
XY
XY
XY
XY
XY
XY
XY
XY
XY
XY
XY
XY
XY
XY
XY
XY
XY
XY
XY
XY
XY
XY
XY
XY
XY
XY
XY
XY
XY
XY
XY
XY
XY
XY
XY
XY
XY
XY
XY
XY
XY
XY
XY
XY
XY
XY
XY
XY
XY
XY
XY
XY
XY
XY
XY
XY
XY
XY
XY
XY
XY
XY
XY
XY
XY
XY
XY
XY
XY
XY
XY
XY
XY XY XY XY XY XY XY XY XY XY XY XY XY XY XY XY XY XY XY XY XY XY XY XY XY XY XY XY XY XY XY XY XY XY XY XY XY XY XY XY XY XY XY XY XY XY XY XY XY XY XY XY XY XY XY XY XY XY XY XY XY XY XY XY XY XY XY XY XY
XY
XY
XY
XY
XY
XY
XY
XY
XY
XY
XY
XY
XY
XY
XY
XY
XY
XY
XY
XY
XY
XY
XY
XY
XY
XY
XY
XY
XY
XY
XY
XY
XY
XY
XY
XY
XY
XY
XY
XY
XY
XY
XY
XY
XY
XY
XY
XY
XY
XY
XY
XY
XY
XY
XY
XY
XY
XY
XY
XY
XY
XY
XY
XY
XY
XY
XY
XY
XY
XY
XY
XY
XY
XY
XY
XY
XY
XY
XY
XY
XY
XY
XY
XY
XY
XY
XY
XY
Fig. 2.6: Location of Tsurai Study Area
February 2008www.trinidad.ca.gov
Trinidad-Westhaven Coastal Watershed Project
0 1,000
1 inch equals 1,000 feet
8City of Trinidad
LegendTsurai Study Area

Wastewater Management Action Plan February 2008 (Draft)
13
B. Summary of Issues Water Supplies and Water Quality Water Supplies Water quality in the watershed is important not only for the ASBS, but for the communities that obtain drinking water from local creeks and aquifers. Water suppliers in the City’s general plan planning area include the City of Trinidad and Westhaven Community Services District Public Water Systems, as well as smaller private systems serving Moonstone Heights, Patrick’s Point, and Big Lagoon. A significant portion of residents are served by private wells or stream withdrawals. The City of Trinidad water system diverts its water from the Luffenholtz Creek. The Trinidad system serves approximately 310 hook-ups and supplies water to the City, the Trinidad Rancheria, and some Westhaven residents along the 2-mile transmission line from the treatment plant to the City. The Westhaven CSD water system obtains water from local springs and a groundwater well. Approximately 210 households in the southern section of Westhaven are served by water supplied by the Westhaven CSD. The Moonstone Heights water system is also fed by springs and serves approximately 15 connections. In total, over half of the residents of the Trinidad plateau are on these three systems, and the remaining residents are on individual spring and groundwater well systems. All of these systems rely on local plateau water resources from surface water sources or groundwater aquifers, which are typically fairly shallow. Many of these systems are vulnerable to pollution from sedimentation, septic leaching and other sources. Water quality from local springs is generally good to excellent, depending on the depth of the spring. Shallow springs from clay hardpans are generally clean, but can be contaminated by upslope activities and can suffer from reduced flow during the dry season. Deeper springs that derive from the seam between the marine terrace soils and the Franciscan layer are typically of higher quality, provide a more reliable year-round supply, and are less susceptible to surface activities. Water diverted from creeks is highly susceptible to pollution from upslope activities. Water Quality Humboldt County Division of Environmental Health has been monitoring ocean water quality near the mouths of several creeks on County beaches since February 2003. This program is funded by the U.S. Environmental Protection Agency Beach Environmental Assessment and Coastal Health Act (BEACH Act), through the California Department of Health Services. Weekly monitoring occurs from April through September and bi-weekly from October though March. Three of the County’s monitoring locations fall within Trinidad’s project area. These include Moonstone Beach near Little River, Luffenholtz Beach near Luffenholtz Creek and Trinidad State Beach near Mill Creek. As a result of this monitoring,

Wastewater Management Action Plan February 2008 (Draft)
14
two locations—Trinidad State Beach (mouth of Mill Creek) and Luffenholtz Beach (mouth of Luffenholtz Creek)—in the study area have recently been listed as impaired water bodies under Section 303(d) of the federal Clean Water Act. Both have been listed due to a high presence of “indicator bacteria” that pose a threat to human health. Most of the exceedances were due to Enterococcus, and the data shows that the bacteria counts have been increasing over the years. The City of Trinidad has been monitoring water quality related to septic systems for a number of years. A Bacterial Water Quality Summary Report was prepared in January 2007 that describes the various septic studies that have been completed since the 1970’s. In 2005 and 2006, City staff collected quarterly water quality data for a variety of constituents to provide baseline water quality data under a grant from the Prop 13 Coastal Nonpoint Source Program. Twelve of the 15 sampling sites were taken on the beaches, including two in the ocean. Samples included creeks, seeps, ocean water and a monitoring well. In addition to the bacteria, samples also included tests for “vital signs” such as temperature, pH and conductivity, turbidity and nutrients (chloride, nitrate and ammonia), but the bacteria results were the most useful. The results showed that there were significant variations in the bacterial counts, even for replicated samples. However, a summary of the data shows that some sites had consistently higher bacteria counts and that the counts varied fairly consistently by quarter as well. Three seeps on three different beaches were the highest contributors of Total Coliform and E. Coli, where Parker Creek and another seep were the largest contributors of Enterococcus. The end of the dry season (September) consistently had the highest bacteria counts, which is also the best time of the year on the Humboldt County coastline and when the most people are using the beaches and most likely to be in the water. The beginning of the wet season also had high counts, and the lowest counts were at the end of the wet season. A recent SWRCB reconnaissance survey of the Trinidad Head ASBS (approx. 2 mi2) found a total of 53 drainages just within this area (17 discharges, 7 stream outlets and 29 springs / seeps were inventoried) (Final Report: Discharges into State Water Quality Protection Areas, July 2003). The City, along with Trinidad Rancheria and HSU Marine Lab applied for an exception request from the Ocean Plan prohibition of discharge. In order to meet the requirements a major suite of water sampling occurred on May 23, 2006 in nine locations around the City, all discharging to adjacent beaches. Sampling occurred after more than three days without rain, and after 0.3” of rainfall. Many of the samples exceeded the maximum detection range, and the majority of them exceeded the single sample standards for contact recreational waters. With the Prop 50 funding, the City completed four water sampling events over the entire Planning Area. The same constituents were generally sampled under Prop 50 as were under Prop 13, including temperature, pH, conductivity, turbidity,

Wastewater Management Action Plan February 2008 (Draft)
15
nutrients (ammonia, nitrate, ortho-phosphate). However, instead of sampling quarterly, we sampled after three storm events throughout the winter and once during the summer dry season. In addition, a fluorometer was purchased and used to attempt to detect optical brighteners from laundry detergent to confirm human origin of the bacterial. Although this data has not been statistically analyzed, preliminary assessment shows that although bacteria was variable, several creeks again had consistently higher counts – in particular, Two Creeks, Joland Creek, Parker Creek and parts of Luffenholtz Creek. In terms of seasonal differences, the dry season sample generally had the lowest results except for the seeps. There were problems during all the winter sampling events, with averages that were in exceedance of bacterial contact recreational standards. The storm events that came after a long dry spell were the worst. The following table summarizes a variety of rankings that were compiled for our “station sites” where habitat assessments were completed. Due to space constraints the table headings are lettered according to the following key: A = Rank of average total coliform count B = Rank of average fecal coliform count C = Rank of average Enterococcus count D = Rank of all bacteria E = Rank of percentage exceedances of bacterial standards F = Rank of average fluorometer readings G = Rank of average turbidity readings H = Rank of sum of all nutrient samples I = Rank of average ammonia levels J = Rank of average nitrate levels K = Rank of average Ortho-phosphate levels L = Rank of total habitat quality score M = Sum of all the above rankings N = Final ranking based on the sum of all the rankings
Site A B C D E F G H I J K L M N MCU-1 1 2 1 1 1 1 2 3 1 4 9 2 28 1 MCL-1 3 7 7 6 6 3 5 1 3 2 11 1 55 2 LCU-1 6 5 4 4 3 2 9 2 2 3 14 3 57 3 MMU-1 2 1 2 2 1 12 4 4 4 10 10 6 58 4 MML-1 5 6 5 5 4 10 6 7 9 9 7 4 77 5 DCU-1 4 3 3 3 4 14 3 11 13 11 8 8 85 6 PCU-1 9 4 6 7 6 5 8 5 5 5 13 13 86 7 LCL-1 8 8 8 8 9 4 11 6 6 8 5 9 90 8 DCL-1 7 9 9 9 6 9 7 10 14 7 1 5 93 9 PCL-1 10 10 10 10 10 6 10 14 7 14 6 10 117 10 TCU-1 11 13 11 12 12 11 1 12 8 13 3 12 119 11 JCL-1 14 14 14 14 13 7 13 8 12 1 4 11 125 12

Wastewater Management Action Plan February 2008 (Draft)
16
Site A B C D E F G H I J K L M N TCL-1 13 12 13 13 14 8 12 13 11 12 2 7 130 13 JCU-1 12 11 12 11 11 13 14 9 10 6 12 14 135 14
Onsite Wastewater Treatment Systems (OWTS) The most likely sources of bacterial contamination in the watershed are OWTS effluent and animal wastes. While animal wastes undoubtedly contribute to the problem, their impact would be much more difficult to assess than the likely impact of non-functioning OWTS in the study area. Furthermore, regulatory measures to ensure proper disposal of animal waste would be difficult to enact and to enforce. New regulations for OWTS, on the other hand, will become necessary under State law as described in Chapter 3. OWTS have been identified in many areas throughout the state as probable factors in water quality deterioration. Non-functioning OWTS and animal wastes are also potential sources of nutrient pollution in local streams. Nutrient overloading can cause exceedance of drinking water standards and eutrophication of water bodies, a process during which excessive plant and algae growth leads to low dissolved oxygen content and the deaths of aquatic organisms. Other common sources of nutrients, according to the Environmental Protection Agency (2005), include fertilizer runoff and atmospheric deposition from industry and automobile emissions. Chemical fertilizers are likely used to some extent in the study area for gardening and landscaping maintenance, but would be more likely to cause problems in areas where agriculture is a dominant land use. As seen in Fig. 2.4, there are no known agricultural operations in the watershed according to zoning and land use data from Humboldt County, although small rangelands are present. Similarly, no industrial activities are taking place in the region. This leaves automobile emissions as another potential source of nutrient pollution. Most of the study area is rural and does not receive heavy traffic. Furthermore, monitoring by the North Coast Unified Air Quality Management District has generally found that the region is in attainment of most air quality goals, thereby reducing the probability that vehicle emissions could be a substantial contributor to water quality problems. The City of Trinidad is currently working on addressing OWTS-related water quality issues within its boundaries. The City is comprised of approximately 230 houses densely located within approximately a half square mile area. Many of the house lots are smaller than 10,000 square feet, and all have OWTS. Many of these systems are more than 30 years old and were installed prior to permit requirements. As a result, more than 50 percent of OWTS within the City are unpermitted, and include some pit systems. Further, it is unknown whether the OWTS are being maintained or are functioning properly. This poses a substantial risk to the water quality of the coastal streams that run through the City, as well as groundwater runoff from the coastal bluffs, and to the Tsurai Study Area. Currently, the City is involved in a project funded by Proposition 13 and the

Wastewater Management Action Plan February 2008 (Draft)
17
federal EPA to sample ground and surface water quality on a limited basis to address some of these issues.
As part of this project (and an earlier project completed under Prop 13), a variety of data was collected from OWTS permit files at the office of the Humboldt County Division of Environmental Health (DEH). Due to time and funding constraints, not all watersheds in the planning area were analyzed. The ones that were analyzed are briefly discussed in the following paragraphs. The parameters assessed included system type, system capacity, tank size, date of last repair/upgrade, and date of original approval. Fewer than half of parcels in the study area had OWTS information on file. There were no permits on file for over half of OWTS within the City of Trinidad, suggesting that a large number of systems were constructed prior to permitting requirements. Systems that were installed prior to 1970 are at particular risk for malfunctioning, especially if they have not been regularly maintained. In terms of repairs noted for the City, the statistics are more promising. Nearly two-thirds of repairs were conducted after 1984, reducing the likelihood that older systems are failing. However, this initial data collection has revealed a great need for further inspection in an attempt to identify problematic systems. Although the Trinidad “drainage basin” is not one of the higher contributors to poor water quality compared to other watersheds in the planning area, the potential for OWTS contamination is of significant concern due to the fact that effluent seepage may have impacts on the Tsurai Study Area. The City of Trinidad also includes portions of the Mill Creek and Parker Creek watersheds, which have shown substantial readings of bacterial and nutrient pollution. The Joland Creek and Two Creeks watersheds comprise a total of 408 parcels. Of these 408 parcels, only 183 (45%) were found to have DEH files. These files revealed that 57 new systems have been permitted by the DEH since 1970, of which 16 have been constructed since 2000. The files also showed there to be a total of 36 OWTS repairs since 1970, eleven of which were completed post-2000. These numbers have potential significance as both Joland Creek and Two Creek were found to exceed the contact recreational standard for bacteria during water quality sampling events. Given these bacterial readings and a large number of OWTS with unknown approval dates, major focus will be placed on these watersheds when seeking funding to implement projects. In the Luffenholtz Creek watershed there are 137 parcels, of which 50 have DEH files containing OWTS information. Approximately 26 parcels in this watershed are vacant, leaving 61 parcels (45%) that have OWTS but no approval date. The data collected from the DEH did reveal a sizeable number of systems that were constructed post-1995, with almost 25% of all systems being built after 1980. The number of vacant parcels combined with the number of parcels containing OWTS built after 1980 add up to nearly half of the parcels in the Luffenholtz Creek watershed. Attention should be given to inspecting the systems with unknown

Wastewater Management Action Plan February 2008 (Draft)
18
approval dates. Water quality sampling on Luffenholtz Creek revealed mixed results. In February 2007, coliform counts were above the contact recreational standard while March 2007 coliform levels were well below this standard. Further investigation will be required in order to ascertain why there was a reduction in coliform counts over a one-month period. There are 66 Parcels in the Mill Creek watershed, 18 of which have DEH files that contain OWTS data. Approximately 18 parcels in this watershed are vacant, leaving 21 parcels that are occupied and have unknown OWTS approval dates. Water quality sampling revealed that Mill Creek had one of the lowest coliform readings of all the watersheds. Most of the readings taken were all below the contact recreational standard for bacteria. Although the Mill Creek watershed is sparsely populated, its low bacteria readings should elicit further investigation so we can understand why the levels are so low. Mill Creek might then be used to demonstrate baseline conditions against which other watersheds will be measured. Due to the low levels of coliform there may be no urgent need to seek funding for OWTS management in this watershed. See Fig. 2.7 for summaries of the data collected.

Figure 2.7(A): OWTS permit information for Trinidad watershed
New Systems
Post 1995
1985-1994
1970-1984
Prior to 1970
UnknownApproval

Figure 2.7(B): Combined OWTS permit information for Joland Creek and Two Creeks watersheds

Figure 2.7(C): OWTS permit information for Luffenholtz Creek watershed
System Constructed
Post 1995
1985-1994
1970-1984
Prior 1970
Unknown approvaldate
Date Repaired
Post 1995
1985-1994
1970-1984
Prior 1970

Figure 2.7(D): OWTS permit information for Mill Creek watershed outside Trinidad City limits
Systems Constructed
Post 1995
1985-1994
1970-1984
Prior 1970
Unknown approvaldate
System Repaired
Post 19951985-1994
1970-1984
Prior 1970

Wastewater Management Action Plan February 2008 (Draft)
23
3. ACTION ITEMS
A. Project Descriptions A series of planned and potential projects (or “action items”) have been identified and placed into two broad categories: (1) onsite wastewater treatment system (OWTS) repairs and (2) waste diversion. Each project category is proposed to be carried out through a combination of regulatory mechanisms, incentives, monitoring, and public outreach. These projects will be focused in areas of the watershed that have shown especially high levels of bacteria and/or nutrients. OWTS Repairs The County Department of Environmental Health, the City of Trinidad and the Westhaven Community Services District have all received reports that OWTS have failed in the planning area in the past. Water quality improvements are difficult to come by under the current practice of waiting for existing systems to fail, then undertaking major repairs or replacements. It would be less expensive and more beneficial to water quality if poorly functioning systems could be brought up to current standards before they have an opportunity to fail. High-priority action areas will be those which exhibit poor water quality and have a high concentration of old or unpermitted septic systems. If no action is taken, then OWTS repairs and replacements will continue to take place after the systems have already failed. Failures will continue to be caught only when reports are received by local government officials, at least until Assembly Bill 885 (described below) becomes effective in mid-2008. At that time, inspections and repairs in certain cases will become mandatory. Effective implementation of these new State regulations will require a great deal of local planning and coordination. The Action Plan attempts to fulfill that role now, rather than beginning in 2008, in order to minimize the delay in achieving water quality improvements.
Regulatory Mechanisms
Although water quality concerns in Trinidad Bay are a major reason for placing new controls on OWTS in the area, imperatives are also coming directly from the State. Assembly Bill 885 (AB885), effective May 1, 2008, contains regulations governing new and replaced OWTS as well as some rules for existing OWTS. The law will require new and replaced systems to be designed by a qualified professional to ensure that they have no adverse effect on surface water or groundwater quality. An operation and maintenance manual will have to be prepared for each of these systems, and owners will be required to keep inspection records for at least five years. All systems, new and old, will need to be inspected a minimum of once every five years. This Action Plan attempts to

Wastewater Management Action Plan February 2008 (Draft)
24
address some of the major requirements of AB885 in order to provide a smoother transition into the new regulations. Project organizers are hopeful that local residents will be more receptive to OWTS controls from local government than to controls from State government, since local regulations can be tailored to fit the needs of the area. Proposed regulatory mechanisms for OWTS repairs are described below. The City of Trinidad will enforce OWTS inspection, maintenance and repair by requiring operating permits for all systems within City limits. The City will also adopt the County’s sewage disposal regulations which govern the design, siting and construction requirements for new and repaired OWTS. Operating permits will require a fee and be issued on the condition that systems are properly maintained and comply with sewage disposal regulations. These permits will supplement the existing construction/repair permits issued by the County Department of Environmental Health for new and repaired systems. Having a City-maintained database of operating permits will facilitate better OWTS monitoring than is currently possible under the County permitting system. Other mechanisms will need to be used to regulate OWTS on properties located outside the City’s jurisdiction. Septic systems and water quality can be regulated in a broad sense through the City and County General Plans. Water quality and watershed planning will be considered as a crucial part of Trinidad’s ongoing General Plan update process. The process began in 1997 and resulted in the creation of a Draft General Plan document in 2001, which is being used as a baseline in the current update process. Updates of existing water-related policies will focus on strengthening water quality protection measures, encouraging a watershed-based approach to planning and following State General Plan guidelines. The City’s current General Plan includes several policies stating that septic systems should be located only where site characteristics are favorable and where water quality will not be affected. These policies should be carried through to the updated plan. The Trinidad Planning Commission and City Council will also be urged to adopt the following policies:
• The City should work with the County to encourage landowners in the Trinidad-Westhaven watershed to have their septic systems inspected, and to investigate possible sources of funding for upgrading/repairing old or failing systems.
• Development applications should be reviewed for their impact on the entire watershed, not just on the parcel itself.
• The City should oppose developments in the Luffenholtz Creek watershed that may have adverse impacts on groundwater quality.
Although some of the proposed policies do not specifically address OWTS, they pertain to the location of new development and thus have an indirect effect on the

Wastewater Management Action Plan February 2008 (Draft)
25
location of new OWTS. These policies will not have a direct effect on development outside City limits but will provide City staff with guidance for reviewing projects that are proposed to occur within the City’s sphere of influence. Ideally, the policies will promote a more stringent review of developments with regard to their impact on water quality and encourage a more comprehensive and cooperative approach to enhancing watershed health. To that end, the City of Trinidad will recommend that the County General Plan update (currently in progress) incorporate similar policies. More specific regulatory measures should be put into place to implement the suggested General Plan policies and the objectives of this Action Plan. The County could adopt an ordinance mandating that OWTS be inspected in areas identified as having poor water quality, and repaired when they are found to be failing. An ordinance would be most effective if paired with an incentives program like the ones described in the following section. The ordinance would also need to be enforced in order to be effective. Enforcement could be carried out through the creation of a special district governing septic systems in Westhaven and other parts of the watershed. This would be similar to a community services district or fire protection district, which collect assessment fees from area residents in exchange for providing a service. A septic services district could issue operating permits such as the ones that will be required for Trinidad residents. The district would use revenues to conduct regular OWTS inspections and perhaps pay a portion of the costs to replace or repair failing systems. The septic services district boundary should be drawn to encompass the areas most vulnerable to water quality impairment. Alternatively, the authority to enforce a septic ordinance would remain with the County Department of Environmental Health. Currently the DEH regulates OWTS through its Land Use Program. Applications for OWTS repair, septic tank demolition, and construction or modification of water wells are made directly to DEH. All other projects, including construction of new septic sytems, are reviewed by DEH as part of applications made to the County Community Development Services Department (CDSD). The DEH also investigates reports of unsanitary conditions. When conditions are discovered to be non-compliant with land use regulations, the problem may be referred to the CDSD or the DEH may pursue nuisance abatement. This system relies on reports of unsanitary conditions rather than monitoring and maintenance to prevent violations from occurring. New regulations governing system design, placement, inspection, maintenance, and repairs would aid in the prevention of problems that may lead to environmental health violations.
Incentives
Given the Disadvantaged Community status of much of the planning area, many property owners do not have the means to inspect or repair their systems. An incentives program will be undertaken to allow property owners to take better

Wastewater Management Action Plan February 2008 (Draft)
26
care of their systems. There are three main components that need to be addressed through such a program: OWTS inspection, OWTS repair, and long-term OWTS maintenance. Initially, residents in high-priority areas for OWTS repair will be encouraged to have their systems inspected. Discounts may be available through local septic service companies if multiple households take advantage of their services at a pre-arranged time. Property owners who sign up for inspections during pre-arranged times will receive a discount. When systems are found to be failing, grant funds will be used to cover the cost of system replacement and the addition of risers and filters, which will reduce long-term OWTS maintenance costs. This program is being put into place for the City of Trinidad and should be extended to Westhaven and other parts of the watershed. Financial incentives should also be made available to property owners who are unable to participate in the initial round of inspections and upgrades, or who live in lower-priority areas. Rebates or discounts may be offered to residents who are low-income, elderly or disabled. These are the groups most likely to be unable to cover the costs of OWTS inspection or repair without assistance. Rebates may also be offered to residents who participate in a public education program. As an example, the Skagit County (Wash.) Health Department provided “Septics 101” classes and offered attendees a $100 rebate toward the cost of septic system inspection as well as a $100 rebate toward the cost of installing water and vapor-tight risers and lids to septic tanks. People who are more knowledgeable about their septic systems will be more likely to keep them maintained, thus reducing long-term costs. After initial inspections and repairs, property owners may need further incentives to keep their systems maintained and pumped regularly. Additional rebates could be offered to those landowners who sign contracts to have their systems pumped and inspected on a regular basis. This would help to ensure that OWTS are repaired not only for the short term but will be less likely to fail in the future. Property owners could also be trained to inspect their own septic systems in order to detect future problems. This is an attractive cost-saving option, but may lead to problems with accountability. If a landowner-training program is put into place, participating residents should be added to a database and required to report their inspection results. In addition to rebates, other types of financial assistance can be utilized. Low-interest loans could be provided to landowners to defray the costs of OWTS inspection, repairs, or upgrades/replacements. A revolving loan fund could be used similar to the loan programs that exist to help small businesses. Under a revolving fund, loans would be gradually repaid back into the fund, thereby making additional monies available for lending. This has the advantage of being able to provide multiple loans for an indefinite period of time, assisting people not only with initial inspections but also with long-term maintenance and repairs.

Wastewater Management Action Plan February 2008 (Draft)
27
Long-term maintenance of OWTS also involves leachfield maintenance and enhancement. Some studies have shown that aerating the soil in a leachfield aids in the removal of certain bacteria from the effluent. Commercial products such as SoilAir have been developed for this purpose. Low-interest loans may be made available for landowners to carry out leachfield enhancement as well as septic tank replacements and repairs. A combination of landowner education, rebates, legal requirements and low-interest loans has contributed to a rise in the number of septic systems inspected in Skagit County, WA. Four years after the county’s program was initiated, the number of OWTS inspections per year was five times greater than it had been prior to the project. Skagit County officials also replaced nearly 600 failing septic systems from 2001 to 2007.
Public Outreach Outreach and education will be an important part of OWTS management. “Out of sight, out of mind” is the attitude of many property owners when it comes to septic systems. Residents within the study area should be able to understand the basic operation of these systems and be aware of their connections to water quality and watershed health. An understanding of the issues will help landowners to see how they can play a role in protecting the natural resources that they value. Specific information about OWTS regulations, incentives and monitoring will need to be accessible to all watershed residents to encourage maximum participation in these programs. Outreach will occur in the form of public meetings and dissemination of electronic and paper-based educational materials. At the start of the implementation phase, a meeting will be held to discuss the project team’s findings in regard to OWTS and water quality. An overview of the proposed OWTS repair program will be provided, and landowners will have an opportunity to provide input and recommendations. Additional meetings will be held as the project proceeds in order to get further public input and report on the status of the program. Notice of the meetings will be provided through targeted mailings and announcements on the City of Trinidad’s Web site and in a local newspaper, the McKinleyville Press. Pamphlets and flyers containing relevant OWTS information will be available at the meetings and on the City’s Web site. Limited educational materials, such as pamphlets, will also be mailed to property owners in targeted areas. It is important to try to reach as many watershed residents as possible. The population centers are Trinidad and Westhaven, but residential properties also exist in the approximately 2-mile stretch between these communities. Outreach efforts will be focused on Westhaven due to the high concentration of OWTS and the potential for water quality impacts to occur in that area. However, residents within all identified problematic areas will be notified of public meetings. If a

Wastewater Management Action Plan February 2008 (Draft)
28
significant portion of non-Westhaven residents are unable to attend meetings in Westhaven, then additional meetings may need to be held in another area. Residents will be educated about the workings of their septic systems and how to care for them properly in order to prevent failures. They will also learn to recognize the symptoms of possible system failure so problems can be caught early on. Hopefully, this information will be shared among neighbors who may not be able to attend scheduled meetings or training sessions. Several residents indicated during public meetings that they have an interest in forming a Westhaven watershed council. The watershed council is envisioned as a voluntary, collaborative group that would undertake watershed improvement projects and provide policy recommendations to City and County decision-makers. It would also provide a forum for ongoing public input on wastewater management and other regional water quality issues. The effort would be spearheaded by local residents and composed of a representative group of stakeholders. Models for this type of group can be found throughout California and Oregon.
Monitoring Monitoring will take place to ensure that necessary OWTS repairs are carried out, and that systems remain in good condition and are not contributing to water quality problems. As a first step, OWTS information will be entered into a Geographic Information System (GIS) database. Data will include age of system, date of last inspection and/or repair, system type, and other pertinent details. Maintaining and regularly updating this information in GIS format will allow the monitoring agency to see the location of parcels where OWTS still need to be inspected or repaired. Property owners who are due for service can then be sent a reminder. OWTS maintenance involves the regular pumping of septic tanks as well as routine inspections for leaks, blockages and other problems. Long-term maintenance and inspection contracts could be offered to property owners in cooperation with local septic service companies. System inspection and septic tank pumping schedules will be established on a site-by-site basis, depending on characteristics such as tank size and soil type. Leachfields will also be inspected so their adequacy can be determined. Maintenance agreements will be kept on file with the responsible agency—the City of Trinidad, County DEH, or a newly created septic services district. If a property owner fails to adhere to the schedule, agency personnel may obtain permission to enter the property and inspect the OWTS at owner’s expense. However, the overall approach will be to limit intrusions onto private property as much as possible. Septic systems that are located in areas susceptible to poor water quality, or have been known to fail in the past, will be considered the highest priority for maintenance and follow-up inspections.

Wastewater Management Action Plan February 2008 (Draft)
29
Monitoring and enforcement of OWTS repairs will be most effective if property owners are involved in the process as much as possible. Through the public outreach efforts described above, residents will be trained to look for symptoms of failing systems. They will also be encouraged to report neighbors whose OWTS do not appear to be working properly. This will aid the overall effort in case regulatory agencies do not have enough staff or funding to make thorough and frequent inspections. It may also facilitate OWTS repairs in more rural parts of the watershed that are not identified as high-priority areas and might otherwise be overlooked. Water quality monitoring will continue to take place throughout the watershed. Samples will be tested for bacterial and nutrient content so the effectiveness of OWTS repairs can be determined. If certain areas continue to show a decline in water quality, then properties in the vicinity will need to be examined more closely and more regulations and incentives may be needed to encourage OWTS inspection and repair. Water quality monitoring is described in more detail in Chapter 5. Waste Diversion OWTS functioning and effluent quality are also affected by the type and quantity of waste that is sent through the system. Hazardous materials, such as cleaning products, may have an impact on water quality if they are permitted to enter a household septic system. Also, when large quantities of wastewater and solids are disposed of, a household’s system may be overwhelmed and become more prone to failure. AB885 will prohibit discharges of wastewater that exceed the designed capacity of OWTS. Waste diversion measures, including water conservation, will help reduce the likelihood of OWTS failure. Pre-treatment measures, such as carefully monitoring the types of waste that enter a septic system, will help protect water quality. The need for water conservation arises not only from OWTS concerns but from other environmental considerations, such as maintaining drinking water supplies and protecting the surrounding landscape from erosion. High rates of erosion affect water quality by increasing the amount of sediment in nearby water bodies. Being located on a marine terrace, the City of Trinidad must ensure that it takes account of water runoff and its effect on the slope stability. A 2004 study conducted by LACO Associates into the geological engineering of the Tsurai Study Area identified the possibility of increased slope instability along the Indian Beach bluff caused by water runoff. Through the use of water-conserving landscaping, water runoff can be reduced and the impact on the Tsurai Study Area can be substantially decreased. According to the U.S. Geological Survey, the average water use across the nation is recorded at 400 cubic feet (c.f.) per month. Trinidadians are using well

Wastewater Management Action Plan February 2008 (Draft)
30
above this national average. In 2003 the average monthly water usage in Trinidad and Westhaven was recorded as being 900 c.f. per hook up. It is expected that average water use would be even higher if there weren’t such a high proportion of vacation rentals among Trinidad households. Out of 300 customers in Trinidad, 59 are using water in excess of 1000 c.f. Only nine of these excessive water users are businesses. These high rates of water usage can be attributed largely to a lack of public education and the current rate structure implemented by the City Water Department. The current structure has a base rate of 300 c.f., billed at $30 for households within City limits and $45 for households outside City limits. Each 100 c.f. thereafter is charged at $2.15. With the base rate being so high customers are encouraged to use all 300 c.f. of water supplied with no incentive to conserve. Although it may seem unnecessary to conserve water in a county that receives 53.4 inches of rainfall annually, there is still only a limited amount of water that the City is capable of supplying. In 2003 Trinidad was recorded as having 40 vacant lots and is predicted to provide an average of three new hook-ups per year. In order to provide for new customers the City will eventually need to upgrade its water facilities. If water conservation becomes an integral part of water provision then the need for and cost of upgrading can be delayed or made unnecessary. If no action is taken, then Trinidad and Westhaven water users will continue to be charged on a flat-rate basis and no incentives for conservation, waste reduction or waste diversion will exist. Financial inequalities will persist between residents who use little water and those who use large amounts of water. OWTS will continue to be at risk for failure due to being overloaded with wastewater. Furthermore, the City of Trinidad and the Westhaven Community Services District will eventually need to upgrade their facilities as water supplies need to be increased to meet the demands of a growing population. There are a variety of conservation methods that Trinidad-Westhaven residents could pursue with regard to outdoor, commercial, indoor and emergency service water usage. These four avenues for water conservation are discussed below along with other waste diversion efforts such as recycling, composting and source reduction.
Regulatory Mechanisms
An effective way to more strictly regulate water usage would be implementation of a variable rate structure in place of the current flat-rate structure. This type of rate structure would charge customers based on the amount of water used, thereby encouraging people to use less. Customers in the City of Trinidad and Westhaven Community Services District service areas would be affected. Residents who obtain water from private wells are not charged for their usage.

Wastewater Management Action Plan February 2008 (Draft)
31
Regulation of water usage will be optimally effective if Trinidad and Westhaven ensure that all buildings are metered for water service. Meters should be installed at Trinidad Town Hall and other buildings that are known to be without them. Meters may also be installed on water mains in order to identify the location of leaks. Identification and repair of leaks can lead to significant water savings. For example, in 2003 the Chevron station in Trinidad was found to be using an average of 22,000 c.f. of water per month as a result of a leaky pipe. Controls may also be placed on specific activities or landscaping elements that affect water consumption. On average, 32 percent of a household’s water usage is for gardening and associated activities. The use of water-efficient vegetation in landscaping would reduce the amount and frequency of watering needed. This could be implemented on City-owned properties in Trinidad or enforced by a City-wide ordinance. Regulations could also be put into place for rain gutters, requiring them to be installed in such a way that water is diverted away from the Tsurai Study Area and other coastal bluffs. Rainwater diversion and infiltration will reduce the amount of runoff contributing to slope instability. During the City of Trinidad’s General Plan update process, the City will be encouraged to adopt policies supporting the development of a water conservation program and installation of water meters on currently unmetered City buildings.
Incentives
Incentive programs may encourage residents to reduce their water consumption and solid waste generation. Voluntary efforts are likely to be more acceptable than regulatory efforts when it comes to water usage and garbage disposal. Financial incentives could include rebates or low-interest loans. A revolving loan fund may be created to provide homeowners with the means to inspect their houses and repair any leaks that are discovered. Loan funds could also be used to purchase and install appliances such as low-flow toilets and shower heads. Alternatively, if a loan fund is not feasible, rebates may be offered on a first-come first-served basis to homeowners who buy water-efficient appliances. In order to address solid waste reduction, rebates could be offered on the purchase of composters. The use of food leftovers as compost matter will reduce the amount of waste sent through the sink garbage disposal, thereby reducing the waste delivered to a septic tank. Another possibility may be to offer discounted water rates to homeowners who use water-conserving landscaping elements such as turf, native vegetation and on-site water storage methods (e.g. dikes). This would be applicable only under the current flat-rate structure for water usage, under which low water users are not rewarded.

Wastewater Management Action Plan February 2008 (Draft)
32
Public Outreach
Public education will be necessary to inform residents of the various options available for water conservation and waste diversion. Outreach can take the form of workshops, classes, and educational pamphlets. The first issue to point out will be the importance of water conservation. Community members will learn about the connections between water usage, solid waste disposal and OWTS functioning. One important topic to address will be water management during storms. Conservation becomes especially necessary during high rainfall events due to the potential for septic tanks to become overloaded and for polluted runoff to reach nearby surface waters. Information on greywater usage may also be provided to the public. Greywater is household water that has been used for laundry, dishwashing, showering, and other functions. (It does not include toilet water.) Instead of being discharged to an OWTS, this water can be recycled and used on lawns and gardens. It must be partially treated, however, to meet certain standards. Homeowners will be informed of the various options available for treating greywater on-site.
Monitoring
Residential and commercial water usage will continue to be monitored through the use of meters in Trinidad and Westhaven. A periodic review of water usage information will let us know whether new regulations and/or incentive programs are having the desired impact. If certain households or businesses continue to show extraordinarily high water usage, they will be encouraged to undergo an audit to determine where water might be conserved. Additionally, OWTS monitoring will take place as described earlier in this chapter. In cases where OWTS are found to be improperly functioning due to excessive wastewater discharge, residents will receive information on how to reduce their household waste generation and water consumption. Households or businesses that are connected to a public water system but are not being metered will be required to install water meters. B. Project List and Status See Table 3.1 for project list, status and responsibilities for implementation.
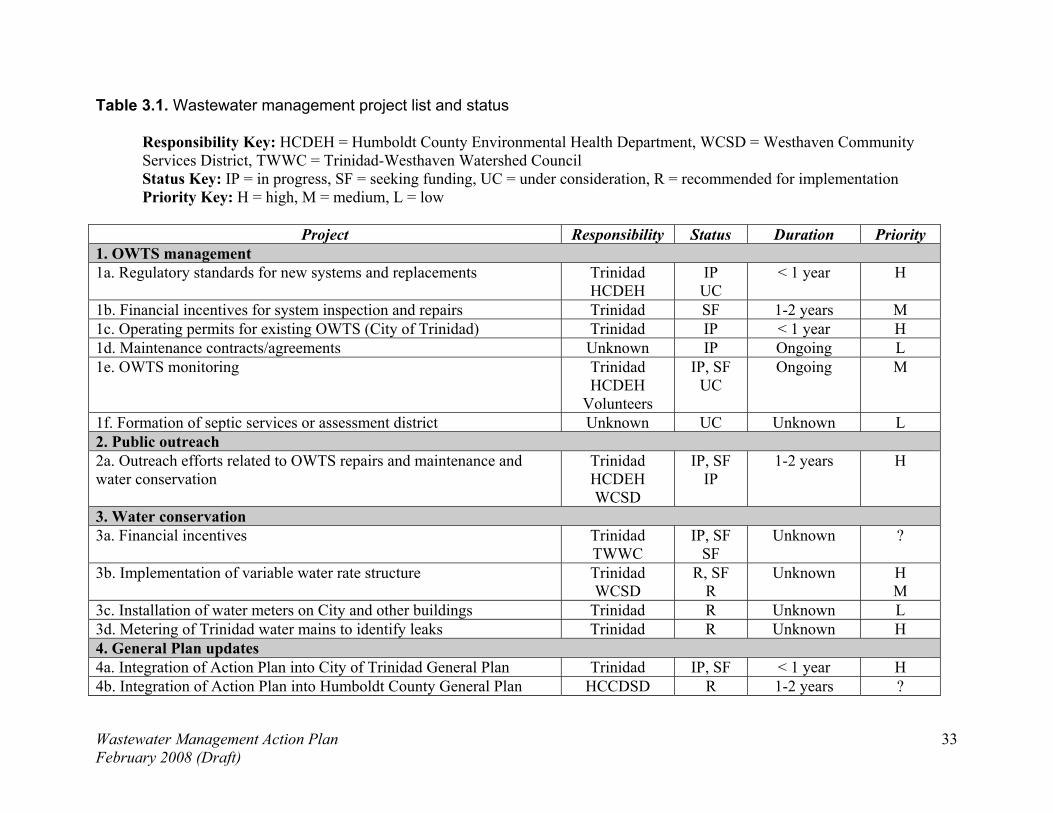
Wastewater Management Action Plan February 2008 (Draft)
33
Table 3.1. Wastewater management project list and status
Responsibility Key: HCDEH = Humboldt County Environmental Health Department, WCSD = Westhaven Community Services District, TWWC = Trinidad-Westhaven Watershed Council Status Key: IP = in progress, SF = seeking funding, UC = under consideration, R = recommended for implementation Priority Key: H = high, M = medium, L = low
Project Responsibility Status Duration Priority
1. OWTS management 1a. Regulatory standards for new systems and replacements Trinidad
HCDEH IP UC
< 1 year H
1b. Financial incentives for system inspection and repairs Trinidad SF 1-2 years M 1c. Operating permits for existing OWTS (City of Trinidad) Trinidad IP < 1 year H 1d. Maintenance contracts/agreements Unknown IP Ongoing L 1e. OWTS monitoring Trinidad
HCDEH Volunteers
IP, SF UC
Ongoing M
1f. Formation of septic services or assessment district Unknown UC Unknown L 2. Public outreach 2a. Outreach efforts related to OWTS repairs and maintenance and water conservation
Trinidad HCDEH WCSD
IP, SF IP
1-2 years H
3. Water conservation 3a. Financial incentives Trinidad
TWWC IP, SF
SF Unknown ?
3b. Implementation of variable water rate structure Trinidad WCSD
R, SF R
Unknown H M
3c. Installation of water meters on City and other buildings Trinidad R Unknown L 3d. Metering of Trinidad water mains to identify leaks Trinidad R Unknown H 4. General Plan updates 4a. Integration of Action Plan into City of Trinidad General Plan Trinidad IP, SF < 1 year H 4b. Integration of Action Plan into Humboldt County General Plan HCCDSD R 1-2 years ?

Wastewater Management Action Plan February 2008 (Draft)
34
C. Impacts and Benefits Implementation of this Action Plan will result in benefits to water quality, public awareness, landowner-government cooperation, and land use planning and will lead to cost savings. No adverse impacts are expected. Potential environmental impacts will be analyzed in the Environmental Impact Report prepared for the Trinidad-Westhaven ICWMP. CEQA compliance may also be necessary for individual projects carried out in accordance with this Plan, such as implementation of an OWTS ordinance for the City of Trinidad. Water quality improvements will result from better-performing OWTS. Non-functioning sewage disposal systems that currently contribute to NPS pollution of groundwater and surface waters will be repaired and/or replaced, thereby preventing leaks. Currently functioning systems will be upgraded whenever possible through the addition of risers and filters, reducing the risk of future failures. Maintenance agreements signed by property owners are also expected to reduce the occurrence of OWTS failures because landowners will be obligated to have their septic tanks pumped regularly. Reductions in NPS pollution will lead to better water quality in surface waters and thus in the Trinidad ASBS. This will improve wildlife and plant habitat in the bay and increase compliance with the California Ocean Plan, as described in Chapter 2. Public outreach programs will lead to better education for landowners about OWTS and water quality issues. The more property owners are educated, the more likely they will be to take good care of their septic systems over the long term because they will be able to spot problems before they become major issues. Increased awareness will also encourage residents to monitor their neighbors’ systems for potential problems. This Action Plan will promote better relationships between government agencies and private landowners. Water quality improvements will be achieved through cooperative efforts. Landowners will learn about how their actions can have a positive effect on watershed health, and will have the opportunity to interact with agency officials on a non-confrontational basis. Similarly, relations between different government agencies will be improved through these cooperative efforts. Efforts will involve officials from the County Department of Environmental Health, the City of Trinidad, the Westhaven Community Services District, the Trinidad Rancheria, and possibly others. Working across jurisdictional boundaries and public-private boundaries requires each party to consider the others’ interests and work toward a common goal. Cost savings will be achieved through implementation of OWTS repairs and water conservation measures, as discussed above. Inspecting and repairing septic systems is much less expensive than replacing them after they begin to

Wastewater Management Action Plan February 2008 (Draft)
35
fail. This will result in money savings for private landowners, but government savings will result from the program as well. Currently, the City of Trinidad and the County of Humboldt must spend staff time responding to complaints of failing septic systems. In some cases, nuisance abatement is pursued and the government is not always able to recover the costs incurred. Long-term improvements in OWTS performance and maintenance will reduce the number of system failures and hence the number of complaints to which government agencies must respond. A watershed-based approach to land use planning will be promoted by General Plan updates and implementation of the final ICWMP. The ICWMP approach will create a long-term vision for the watershed, including water quality standards to be achieved, and will require that future development projects be reviewed based on this standard. It recognizes the idea that development does not affect only one piece of land or one neighborhood, but may have impacts throughout the watershed. Updating the Trinidad General Plan to reflect these ideas will add to the regulatory framework and provide a direction for future decision-making. D. Opportunities and Constraints There are several circumstances that are likely to promote successful implementation of this Plan. The City of Trinidad has secured grant funding from the State’s Clean Beaches Initiative to cover some of the costs of future water quality monitoring and other projects proposed by the Action Plan. Another advantage is that the timing of the City and County General Plan updates coincides with this watershed planning process in such a way that ongoing implementation of the Action Plan will receive formal support from local government policies. Regulatory support is also coming from State Assembly Bill 885, described earlier in this chapter. Furthermore, the partnerships that have been established during the watershed planning process will provide a foundation for future collaborations on watershed improvement projects. Potential obstacles to plan implementation include funding issues, jurisdictional issues, community/agency capacity and adequate level of trust between residents and agencies. The City of Trinidad has been relatively successful to date in obtaining funding for water-related projects; however, implementation of the Action Plan and ICWMP will require additional resources. The County of Humboldt has limited resources to address pressing water-related issues in Westhaven and many other communities within its jurisdiction. Maintaining this collaborative effort will require the ongoing support of the stakeholders and project partners.

Wastewater Management Action Plan February 2008 (Draft)
36
4. TECHNICAL ANALYSIS AND PLAN PERFORMANCE
A. Data and Methods Used in Plan Development Pre-Existing Data Reviewed and Utilized Most analyses conducted for this project were done independently from previous studies in order to generate more specific data than was available from existing planning and technical documents. Zoning, land use and parcel size information was available from the Humboldt County Department of Community Development Services and the City of Trinidad Planning Department. Septic system information, such as date of installation, was noted in OWTS permit files obtained from the County Division of Environmental Health. Background information pertinent to Trinidad and Westhaven was obtained from documents including the Tsurai Management Plan and a State Water Resources Control Board water quality monitoring report on the Trinidad ASBS. General information on septic systems, water quality and other issues was available from EPA reports and a variety of research documents prepared by other organizations. The Tomales Bay (Calif.) Integrated Coastal Watershed Management Plan served as a model for developing both the Action Plan and the ICWMP. Water Quality Sampling Water quality sampling was conducted according to a Quality Assurance Project Plan (QAPP) that was approved by the City and the State and Regional Water Quality Control Boards. The QAPP describes in detail the project and data use objectives, data rationale, quality assurance goals, and requirements for sampling and analysis activities. It also describes the sampling and data collection methods that were utilized for this project and was developed in accordance with SWAMP guidance documents. Please see this document for additional details beyond the summary included below. Samples of surface and groundwater runoff as well as ocean water were collected for analysis of various contaminants related to OWTS that may potentially impact water quality and the Trinidad Kelp Beds. Samples were collected from these sources during, or immediately following three storm events covering in 2007 during the wet weather seasons. Sampling occurred during three winter storm events with specific criteria as specified in the QAPP. Early, mid- and late-season storm events were sampled along with an abbreviated (no field ‘vital sign’ measurements) late summer dry season event. Some follow-up samples between major events were also taken. Data was evaluated to assess water quality, to help prioritize where OWTS education and correction efforts should be focused, and to provide baseline data to be used to gage success of future management activities. The two major objectives of this monitoring program were: 1) to establish baseline water quality

Wastewater Management Action Plan February 2008 (Draft)
37
conditions in the Trinidad-Westhaven Coastal Watershed Planning Area; and 2) to begin to track problem areas and identify the most likely sources of contamination. Products of this assessment include water quality data, which will be used to establish current baseline water quality. Current water quality data was used to determine which constituents may be causing alteration to water quality within the ASBS. For contaminants that have been identified at concentrations of concern (mainly bacteria), measures have been recommended to reduce or eliminate those constituents caused by OWTS. Sampling included measurement of pH, conductivity, temperature, and turbidity at each sample site during specified storm events (see below). At the same time as sampling for vital signs occurred, samples were collected for bacteria (total coliforms, fecal coliforms (E. coli) and enterococcus) and then taken to the Humboldt County Public Health Laboratory. Samples were also collected to perform nutrient tests at the SPC offices. The typical vital sign information was obtained through field samples. Samples were collected in the field for nutrient sampling that were analyzed through use of test strips or color ampoules that included Ortho-phosphate, Nitrate N and Ammonia N. Measurements for temperature, pH, conductivity and turbidity were taken in the field and recorded on data sheets with the name of the sampler, the date, time, and location. Samples were collected for offsite nutrient analysis at the offices of SPC. Samples were also collected and submitted for laboratory analysis for bacteria. After each sapling event, the water quality data was compiled in Excel for easy manipulation and creation of graphs and tables.
OWTS Permit Assessment Permits for OWTS are issued by the Humboldt County Division of Environmental Health (DEH). Permit files from DEH were available for fewer than half of all properties in the study area. Files from the Westhaven area were analyzed first, followed by files from outlying areas within the watershed. The files were assessed for the most recent information available regarding the OWTS on each property. A variety of data were pulled from each OWTS permit file including system type, system capacity, tank size, location on the parcel, and date of approval or repair/upgrade. The results were tabulated and added to the parcel information available in GIS format. In this way, the location of old or failing systems could be identified and used to delineate problematic areas in the watershed. Progress in this task was hampered by a lack of complete file information for most parcels. In some files it was noted that a septic system existed, or was repaired or upgraded at some point, but no details on the system were available. In many cases it was unclear if and when an OWTS was approved. Furthermore, without field investigation it is unknown whether existing systems have been built according to the original plans. The advantage of assessing permit records was

Wastewater Management Action Plan February 2008 (Draft)
38
to provide a general idea of where problematic OWTS (old systems, undocumented systems) may be located and how many exist. OWTS Analysis GIS analysis was utilized to categorize the number, density, age and adequacy of septic systems (OWTS) and other potential sources of pollutants near areas with poor water quality sampling results to identify specific areas to be addressed. Through spatial analyses tools in GIS, watershed properties and site specific data collection (including septic systems and land use information) was used to determine problem areas and prioritization of action alternatives for reducing pollution from OWTS into the surface water and groundwater systems. Separate analyses were performed for each of the seven noted watershed areas. Prioritization of watershed areas was given to Parker and Mill Creeks, for their proximity to the City of Trinidad and Luffenholtz Creek, including Joland Creek, for its adjacent land use and potential impact to the sole source of water supply for the City and the source of much of the water supply for the Westhaven area.
Habitat Assessments Habitat assessments were conducted within representative stream reaches at each surface water sample point in order to provide indicator relationships between potential limiting factors for target species and water quality sampling data. These habitat assessments provide a measure of baseline conditions for a variety of factors. Cross sections were completed at each main creek sampling site using a laser level and measuring tape. Water level and velocity were measured at each cross section during each sampling event other than the late summer event. The area for each cross section was calculated using a standard equation or geometry for the ones at culverts and in AutoCAD for the irregular ones. This facilitated discharge calculations in order to get an idea of which creeks were contributing the highest amounts of pollutants to the shoreline and ocean. The habitat assessments also included the collection site specific ecological data including, macroinvertebrate samples, pebble counts, physical features (slope, cover, substrate, etc.) and dominant vegetation. In addition, a rapid bioassessment was done in accordance with the CA Stream Bioassessment procedures (Physical Habitat Quality) (CDFG, 2003). This method was used to score each sampling site based on several factors, including, epifaunal substrate / available cover, embeddedness, velocity / depth regimes, sediment deposition, channel alteration, frequency of riffles, bank stability, vegetative protection and riparian vegetation zone width. Wolman Pebble Counts were also conducted at each site in order to create particle size distribution charts. . The macroinvertebrates were categorized into functional feeding groups described by Cummins and others (i.e. Merritt and Cummins, 2006). Samples were taken from each of our primary sampling locations. A kick net was used to

Wastewater Management Action Plan February 2008 (Draft)
39
collect samples; bugs were then sorted into trays based on their functional feeding group association. Samples were mainly taken from riffles, where macroinvertebrate abundance tends to be the highest. Multiple samples were taken in order to get the number of bugs counted to near 100. Samples were also taken from a nearby pool for comparison in most locations. Ratios of some of these different feeding groups can indicate certain characteristics of a stream, such as stability of substrate and predator controls. These ratios were calculated based on Merritt and Cummins, 2006 as well. GIS Analysis & Coastal Watershed Assessments ArcGIS was used to analyze land use distribution, lot sizes, and impervious surfaces in the watershed. A parcels layer from Humboldt County Community Development Services, last updated in June 2005, was used as the basis for analyzing land use and parcel sizes in unincorporated areas. The parcels layer used as a base for the City of Trinidad was created by STREAMLINE Planning Consultants (City of Trinidad Planning Dept.) using source data from the County parcels layer and City zoning maps. Watershed boundaries were obtained through ArcHydro analysis performed by STREAMLINE Planning Consultants. Further explanation of these methods and the results of GIS analysis can be found in a separate watershed assessment document prepared for the Trinidad-Westhaven region.
B. Quality Assurance and Plan Performance Generally, there are three types of performance measures for this project: 1) performance measures used for each task in developing this plan; 2) measures by which this action plan will be evaluated; and 3) measures to assess individual implementation projects listed in this plan. Plan Development Tasks Water Quality Sampling The QAPP that was prepared for the water quality sampling plan and approved by the City and the State and Regional Water Quality Control Boards includes detailed quality assurance measures and a plan for data assessment and response to problems. Section 14 of the QAPP includes the general quality control measures and section 19 specifies data management practices. Other chapters provide more detail on such things as instrument calibration and sample collection methods. Careful evaluation of field and laboratory control procedures were utilized in the planning process and will continued to be performed during the lifetime of the project and implementation of the Action Plan. Other – GIS, Permits, Habitat & Watershed Assessments, etc. The performance measures for the other tasks listed under the Prop 50 Coastal Watershed Planning Grant were generally outlined in the PAEP that was

Wastewater Management Action Plan February 2008 (Draft)
40
prepared and accepted as part of the grant contract development. The ‘output indicators’ included: identification of specific high level pollutant (bacteria and nutrient) concentration areas (by watershed or subwatershed); categorization of the number, density, age and condition of OWTS within priority areas; quantification of OWTS pollutant contributions to surface and groundwater; identification of other potential sources of degradation in poor water quality areas; development of a Wastewater Management Action Plan; develop coastal watershed assessments; determine problem areas and prioritization of actions; integrate the various (stormwater, sediment and wastewater) action plans into the ICWMP; and integrate the action plans into the General plan as one prioritized action plan. The ‘targets’ included: broad acceptance based on peer review of data; high pollutant concentration areas; most likely potential sources of pollution; list of priority action areas; prioritized list of action alternatives; water quality indicators chosen; and implementation cost estimate. These outcomes and targets are included in this Action Plan in appropriate sections.
Action Plan Evaluation The Action Plan itself should be evaluated in a couple of different ways. The format and content of the Plan may be evaluated in terms of the IRWM Plan Standards (Integrated Regional Water Management Grant Program Guidelines, Appendix A). This action plan includes all the required topics and descriptions as required under those guidelines. The Plan has been organized for ease of future use. The main objective in the development of this action plan was to provide a prioritized list of watersheds based on the degree of water quality problems found and to provide a prioritized list of actions with cost estimates that will decrease wastewater pollution. See Chapter 3. Project Effectiveness Monitoring and Analysis
OWTS Source Tracking and Upgrades The effectiveness will be measured in terms of the number of systems that are inspected and how many risers and in-line filters are appropriately installed. It will also be measured by the number of malfunctioning or failing systems that are found and repaired or upgraded. Finally, water quality monitoring should show both a reduction in bacterial contaminants and optical brighteners (OBs) in coastal waters after project completion. In general, post construction effectiveness will be measured by OB levels coupled with bacteriological indicator sampling. Post Construction monitoring will show a reduction of water quality exceedances (<4%) in the surf zone along with a reduction in human-induced bacteria levels at the beach. This will be verified through monitoring OB levels; the target is a reduction of OB reading by 20% in the surf zone and impacted contributing waters. OB monitoring should indicate that bacteria present can mostly be attributed to non-human (wildlife) sources. The project will isolate areas where OWTS are nonfunctioning. Targeted OWTS

Wastewater Management Action Plan February 2008 (Draft)
41
will be inspected / pumped and improved with inline-filters / risers as needed. The worst contributing OWTS determined non-functioning will be repaired replaced. The Project will result in up to 100 minor improvements to individual OWTS and 10 major repairs / replacement of failing system, which will directly and immediately benefit receiving waters and adjacent beaches. Water Conservation Refer to the Waste Diversion section under Chapter 3 for information on monitoring activities related to water conservation. C. Data Management Data Gaps The primary difficulties in analyzing previous water quality sampling data are a lack of the ability to track sources and differentiate human sources (and therefore public health threats) of bacteria indicators from background levels. Another difficulty is in isolating the areas contributing the greatest pollution in order to focus future implementation efforts. Current approaches to OWTS pollution prevention react to systems one-at-a-time as they fail or malfunction and cause obvious problems that someone complains about. The proactive approach proposed herein, on the other hand, will provide a means of fixing many systems on a priority basis to provide immediate reductions in bacteriological contamination. The proposed actions will also provide assistance to those who would not otherwise be able to afford to fix a problem OWTS. Data Management
Data management has been and will continue to occur using methods already being implemented by the City and project partners. The Trinidad Planning Department and City Clerk’s Office will have primary responsibility for storing and managing data. Information dissemination has been / will continue to occur as described below. Information distribution tools will include public meetings, the City’s webpage and local newspapers. Besides standard filing systems, the GIS will be the primary tool for data management. This data will be standardized so that it can be used in a statewide GIS Data gathered as part of the ICWMP will be filtered into a database management system. Database strategies have been incorporated to allow collection and storage of data into the same system during the development of the ICWMP and during the implementation phase. In addition, the system would allow for data to be easily distributed to statewide databases and other information dissemination and exchange entities. All water quality monitoring has been and will continue to be collected according to a State-approved, SWAMP comparable QAPP.

Wastewater Management Action Plan February 2008 (Draft)
42
Information Dissemination This section briefly describes the public outreach efforts that have taken place, and will continue to take place, during development of the Action Plan and ICWMP. During the planning process, property owners in the watersheds were notified and directed to the City’s website for information on the Trinidad-Westhaven Coastal Watershed Project. The website identified meetings and other opportunities for involvement. It is anticipated that eventual implementation of management strategies will provide additional opportunities for watershed groups, private citizens and governmental agencies to continue to be involved. The stakeholder process used in this planning effort addresses environmental justice issues by making clean water a priority for everyone—rich or poor, large landowner or small, renter or owner. The process was designed to give a voice to all residents. Six public meetings were conducted as part of this watershed planning project in locations easily accessible to interested parties. Two initial public meetings to introduce the ICWMP concept, cooperating entities, and opportunities for involvement were conducted (one each in Trinidad and Westhaven). Two mid-process meetings were held to get public input. Finally, two more community meetings will be held to obtain feedback on the draft Action Plan and ICWMP. Work items for the public meetings include printing announcements, securing locations, preparing agendas, inviting speakers and/or moderators, and taking meeting minutes. Also included is the potential distribution of brochures as necessary to the public and interested stakeholders. The brochure may contain information describing the project and its significance to the community. A mailing list of the residents in the planning areas watersheds could be obtained from the Humboldt County elections office. Also included in public outreach is the announcement of meetings and other important information in a local newspaper, the McKinleyville Press. In specific regards to the wastewater management task, the dissemination of information to the public is vital to successful project management. Materials for the public meetings were prepared and distributed with the goal that all improved properties within the program area will be provided with sources of OWTS literature and additional materials will be placed on the City’s website. The website currently explains some of the OWTS highlights. Additional information explaining this specifically proposed program as well as other links and sources of information have been provided. The City’s recently constructed website (http://www.trinidad.ca.gov) will be the primary vehicle for public education and outreach for the proposed ICWMP. This task encompasses the work involved with writing webpage development,

Wastewater Management Action Plan February 2008 (Draft)
43
maintenance, and updates. The webpage will include information to be distributed in the form of pamphlets, reports, web links etc. as well as notices of public meetings, workshops, and hearings. The website will include an area for interested parties to sign onto a project email list to receive information on updates to the plan progress, updates to the website, and meeting announcements. Public education materials for all projects, as well as general information on the Trinidad Head ASBS, will be accessible through the City’s website. The site will also include links to the California Coastal Commission, SWRCB, California Department of Water Resources, and Humboldt County Planning Department websites.
5. FINANCING
The Action Plan will be used to seek funding, from both private sources and grants, to implement the activities proposed herein. Potential sources include State Proposition 50 and Proposition 84 grants.
In most cases, specific project costs and projected funding matches from local sources are unknown and will be determined as implementation measures are developed in more detail. Beneficiaries will include those agencies, organizations and individuals who are responsible for implementation as described in Chapter 3.
6. REFERENCES
California Assembly Bill 885. March 2007. “Draft California Onsite Wastewater Treatment System Regulations.” California Coastal Commission. April 2007. Local Coastal Program Update Guide: Protecting Sensitive Habitats and Natural Resources. City of Trinidad. May 2005. Work Plan: Integrated Coastal Watershed Management Plan for the Trinidad ASBS. Prepared for California Department of Water Resources and State Water Resources Control Board. City of Trinidad water billing information. April 2006-2007 and July 2005. Obtained from RVS water billing program: Year End Report. Hanark, Ellen, and Matthew Davis. July 2006. Californian Economic Policy: Lawns and Water Demand in California. Public Policy Institute of California.
Humboldt County Department of Community Development Services. June 2005. Parcel Layer Version 2.0 (GIS dataset). http://co.humboldt.ca.us/planning/maps/datainventory/gisdatalist.asp Lin, Chi-Wei. August 2005. “Options on Water Rate Structure For Trinidad.”

Wastewater Management Action Plan February 2008 (Draft)
44
Prepared for August 22, 2005 Trinidad City Council meeting.
Merritt, R. W. and K. W. Cummins. 2006. Trophic Relationships of Macroinvertebrates. Pages 585-601 in R. Hauer and G. Lamberti (Eds.) Methods in Stream Ecology 2nd Ed. Elsevier: U.S.A. Narayanan, Arvind. 1998. “Household water usage.” University of Alabama research paper. http://bama.ua.edu/~naray003/Household%20water%20usage.htm North Coast Regional Water Quality Control Board. February 2005. Watershed Planning Chapter. http://www.waterboards.ca.gov/rwqcb1/programs/watermanageinit.html Sloan, Kathleen, and Megan Rocha. May 2007 (Final). Tsurai Management Plan. Prepared for the Tsurai Management Team. http://trinidad.ca.gov/documents/PC%20Draft%20Tsurai%20Management%20Plan%2008-2006%20ALL.pdf State Water Resources Control Board. June 1979. California Marine Waters Areas of Special Biological Significance Reconnaissance Survey Report. Kelp Beds at Trinidad Head. Water Quality Monitoring Report No. 79-19. SWRCB, Surveillance and Monitoring Section, Sacramento, CA. State Water Resources Control Board. 2005. Water Quality Control Plan: Ocean Waters of California. Tomales Bay Watershed Council. June 2007 (Draft). Tomales Bay Integrated Coastal Watershed Management Plan. Prepared for State Water Resources Control Board. U.S. Environmental Protection Agency. 1998. Water Recycling and Reuse: The Environmental Benefits. Water Division Region IX. Pub. No. 909-F-98-001. U.S. Environmental Protection Agency. May 2004. Protecting Water Resources With Smart Growth. EPA Pub. No. 231-R-04-002. http://www.epa.gov/smartgrowth/pdf/waterresources_with_sg.pdf U.S. Environmental Protection Agency. December 2005. National Management Measures to Control Nonpoint Source Pollution from Urban Areas. EPA Pub. No. 841-B-05-004. U.S. Environmental Protection Agency. January 2006. Growing Towards More Efficient Water Use: Linking Development, Infrastructure and Drinking Water Policies. EPA Pub. No. 230-R-06-001.

Wastewater Management Action Plan February 2008 (Draft)
45
U.S. Geological Survey. August 2005. “Water Science for Schools.” http://ga.water.usgs.gov/edu/qahome.html Washington State Department of Ecology, Northwest Regional Office Water Quality Program. August 2007. “Skagit County On-Site Programs: Financial Assistance Leads to Pollution Reduction.” Dept. of Ecology Pub. No. 07-10-072. http://www.ecy.wa.gov/pubs/0710072.pdf

Appendix G:
Winzler & Kelly Stormwater Action Plan

Storm Water Action Plan 1 01063-06004-11001
STORM WATER ACTION PLAN FOR THE TRINIDAD-WESTHAVEN COASTAL WATERSHED
Prepared by Winzler & Kelly for the City of Trinidad The Action Plan defines activities needed to achieve the goals of the Watershed Management Plan. These activities may be undertaken voluntarily, and we have identified lead and supporting partners for each task and we look to those entities to act. Some of the recommended actions are already being implemented, while others have yet to be initiated. The City will generally support implementation of this Plan, taking on specific programs and projects that are beyond the mission or capacity of individual organizations/agencies or established partnerships. The City will also continue to provide a forum where programs and projects are discussed and considered. At this time, there is sufficient information to undertake many appropriate management and restoration actions through implementation of the recommendations contained in this Plan. In the future, additional assessment will be useful in guiding us towards more effective and efficient policies and programs; however, due to the complex nature of this natural system, we will continue to depend on the best available information and professional judgment if our efforts to manage human impacts on this system are to be timely. ACTION PLAN Action 1.0 Develop a coordinated and comprehensive water quality monitoring plan for Trinidad Bay and tributary streams. Clean water is essential to aquatic, coastal and marine environments. In the Trinidad Bay watershed, water quality and healthy aquatic habitats are influenced by tidal circulation, by activities that occur nearby on land, and by pollutants delivered via surface run-off and subsurface seepage. A comprehensive long-term monitoring program is needed to document baseline conditions and identify trends for pollutants of concern. Pollutants refers to human created or induced alterations in the physical, biological or chemical character of water thereby producing undesirable environmental results, as well as the standard evaluation of substances affecting human health. Monitoring would provide the information needed to evaluate water quality in the bay and its tributaries, as well as the efficacy of projects to reduce non-point sources of pollution, management practices intended to improve water quality, and educational programs. It is anticipated that considerable energy and capital will be expended to improve water quality and it is essential to have a scientifically valid database to determine action efficiency. In this way, adaptive management and conservation strategies based on the most current and best available monitoring data can be incorporated into future actions in the watershed to improve water quality and watershed health. The development of a comprehensive water quality monitoring program is only the first step in watershed monitoring for Trinidad Bay. Along with baseline monitoring (to characterize existing conditions) and effectiveness monitoring (to determine the success of existing or newly implemented projects or management practices), bio-indicators should be identified and monitored. In addition, it is necessary to monitor and evaluate land-use practices and other

Storm Water Action Plan 2 01063-06004-11001
human influences on tributaries to the bay, uplands, riparian corridors, wetlands and along the bay shores. Voluntary landowner monitoring will provide important information about the effectiveness of projects on private lands. Together, these monitoring activities will provide the framework for adaptive management, which will increase the effectiveness of our actions. Some components of this program can be carried out by existing agencies if the components fit into an agency’s specific directives and goals. Others will need to be carried out by organizations outside the regulatory network (such as academic institutions and non-profit groups). However, without a central group to coordinate activities, monitoring efforts will continue to serve specific goals rather than lead to an overall understanding and improvement in the health of Trinidad Bay. Objectives: • Obtain high quality baseline data describing the concentrations of contaminants in the waters
of Trinidad Bay and tributary streams, and to increase understanding and awareness of water quality problems in the watershed.
• Measure effectiveness of management practices implemented on public and private lands to reduce sediment, bacteria and nutrient delivery, and other non-point sources of pollution.
• Increase understanding of water quality problems in the watershed including the impacts of septic systems, sewage ponds and landfills on the water quality of Trinidad Bay and tributaries.
• Identify temporal and spatial changes in the bay and tributary streams. Determine seasonal, annual and long-term trends in chemical, physical (e.g. sedimentation), and bacteriological water quality in Trinidad Bay and the tributary streams.
• Determine whether water quality, and sediment contamination and supply, in Trinidad Bay and tributary streams are in compliance with objectives established in the Trinidad Bay Integrated Watershed management Plan.
• Provide adequate information and recommendations to result in water quality improvements to reduce shellfish harvest closures during winter rain events by reducing run-off containing high concentrations of coliform bacteria. Evaluate and revise minimum required closure period for shellfish grown in Trinidad Bay based on data.
• Provide a database on water quality that is compatible with data being developed in ongoing studies in Trinidad Bay and tributary streams.
• Provide a clearinghouse and monitoring database for use by landowners, stakeholders, regulatory agencies, watershed managers and the general public through such media as the Internet (web page), published reports and readily available, computer searchable databases.
• Provide volunteer monitoring opportunities for local communities and schools. Lead: The City of Trinidad will be the lead in the development of this Water Quality Monitoring Plan. I. High priority, short-term activities for developing a coordinated and comprehensive water quality monitoring plan for Trinidad Bay and tributaries. Please note that some of these activities are interrelated and do not necessarily to occur in this exact order.

Storm Water Action Plan 3 01063-06004-11001
Purpose: Define the purpose and identify the questions to be answered with this monitoring plan. Status: Summarize historic and current water quality monitoring efforts and data. Collect data on sources of pollution, and develop initial database. Identify pollutants of concern and water quality problems in Trinidad Bay watershed. Trends: Identify trends, based on historical and current data. Regulatory status: Determine which agencies have regulatory responsibility for development of best management practices, specific contaminant monitoring, enforcement of the Clean Water Act, etc. Identify actions already taken by those agencies. Prioritize: List and rank known and potential sources of pollutants of concern. Fill data gaps: Identify gaps in existing data and incompatibilities between databases. Decide how to fill data gaps. Develop a water quality and quantity monitoring plan: The plan should identify the questions to be answered, outline the approaches to take, describe the limitations, estimate the costs, and develop a sampling plan. The plan is likely to include monitoring to develop a baseline, to support existing actions (e.g. development of a TMDL), and to evaluate current monitoring tools and methods, and the implementation of remediative actions. The plan shall identify lead(s) for implementation, and have an adaptive management component. Database: Continue development of the database stated under Step 2 that will allow for long-term trend analysis. Design a framework to support maintenance and updating of database. Funding: Work with leads to identify and secure adequate funding for equipment, monitoring and sampling, staffing and related needs On-going coordination: Identify a central organization to coordinate existing water quality monitoring efforts going on in the watershed and to serve as a “clearinghouse.” Implementation and analyses: Facilitate implementation of the monitoring program and support on-going efforts. Analyze trends. Develop recommendations for actions to improve water quality. Indicator Species and/or systems as a measure of water quality and overall “health” of the bay: Determine if there are resources to develop indictor species and/or systems for Trinidad Bay. If so, the City may work with technical advisors to identify indicators of watershed function. These activities will be successful if they achieve these results. Specific criteria will be developed on a project basis: 1. Easy-to-use water quality database for Trinidad Bay and tributaries. 2. Practical understanding of water quality problems, sources of pollution and primary loading routes to Trinidad Bay and tributary streams. 3. Preliminary list of prioritized projects to reduce sources of contaminants. This list should be updated as the long-term monitoring program uncovers new information. 4. Recommendations for best management practices and restorative actions to improve water quality in Trinidad Bay and tributary streams.

Storm Water Action Plan 4 01063-06004-11001
Action 2.0 Support implementation of practices and projects that will reduce nonpoint sources of water pollution and enhance habitats in Trinidad Bay and its watershed. During the past 20 years, significant steps have been taken on private and public lands to improve water quality and aquatic and terrestrial habitats in the Trinidad Bay watershed. The momentum that has been created by partnerships between private landowners, local agencies and organizations has resulted in an increased understanding of water quality issues, the condition of Trinidad Bay and tributary streams, and linkages between sources of pollutants and water quality. In addition, these activities have improved local awareness about native habitats in the bay and watershed. Future collaboration will be necessary to maintain this progress and to increase these local programs. Sources of water pollution in the Trinidad Bay watershed include sediment and bacteria; recreational activities and stormwater runoff that contribute pathogens and environmental toxins; groundwater contamination related to septic systems and storage ponds; and heavy metal pollutants from marine facilities. BMPs are methods to control pollution sources and to maintain the integrity of a watershed ecosystem. BMPs offer private and public landowners the opportunity to change unsustainable management practices, and may preclude enforcement of environmental regulations by state and federal agencies. BMPs have been identified for road construction and grading; road crossings and culverts; septic system construction and maintenance; mariculture; recreation; weed management; forest management and others. Most BMPs are subject to revision as research and experience lead to improvements, and as some practices become more technically or financially feasible (sometimes due to the availability of technical or financial support). When BMPs alone are not sufficient to protect water quality and sensitive habitats, it may be necessary to set limits on use. In many cases, private landowners who have implemented BMPs not only improved water quality, and riparian and aquatic habitats, they have also improved the economic viability/sustainability of their enterprises. For example, agricultural operators who collect and spread manure can reduce both potential sources of water quality contamination and the costs associated with fertilization and transportation of animal wastes. Similarly, implementing BMPs for culvert installation and road grading has resulted for many landowners in lower maintenance costs associated with poorly draining road surfaces and culvert failure. Future projects and programs to improve and protect water quality and habitats in the watershed will require the participation and collaboration of private and public partners. As with habitat restoration, water quality benefits accrue not only to local communities, but also to the millions of visitors that come to the watershed each year, to future generations to come, and to the many species for which the bay and watershed provide critical habitat. Future habitat restoration measures will require the on-going participation of and financial support for private and public landowners to implement best management practices. These management practices will include measures to reduce and contain the introduction and spread of invasive non-native species. During the next decade, the SWQCB and RWQCB will be developing TMDLs for pollutants of concern, and looking to local partnerships for assistance in

Storm Water Action Plan 5 01063-06004-11001
implementing these plans to reduce water pollution. The continued support for and encouragement of community participation through voluntary management measures to resolve pollution problems will be a critical component to our success. These recommendations are intended to promote the protection of water quality and recognized beneficial uses of the bay and tributaries, habitats and species, and human health. Purpose:
• Improve water quality and habitats in the Trinidad Bay watershed. • Protect human health. • Benefit species of local interest • Improve sustainability of human activities; including residential needs, recreational
opportunities, and mariculture. • Comply with local, state and federal laws and regulations. • Achieve regional and national water quality goals.
I. High priority, short-term activities to reduce non-point sources of pollution and to improve aquatic habitats to be implemented and maintained:
• Provide adequate facilities to handle recreational sources of human waste. • Support community-based septic evaluation, improvement, management and
monitoring programs. Consider alternative options for on-site treatment of human waste. Promote outreach, education and funding to achieve these programs. Include outreach to new homeowners, realtors, etc.
• Improve and implement upland BMPs to reduce erosion, sediment and nutrient runoff, and to reduce and control the introduction and spread of invasive non-native species.
• Assess ecological effects of mariculture on Trinidad Bay, and support implementation of BMPs and related projects.
• Assess ecological effects of recreational uses of Trinidad Bay and its watershed, and support implementation of BMPs and related projects.
• Assess ecological effects of non-recreational uses of Trinidad Bay, and support implementation of BMPs and related projects.
• Provide outreach and support to avoid future dumping of dirt into streams and wetlands along roads during county, state, federal and private road maintenance activities; and develop BMPs.
• Develop and support enforcement of grading standards that better protect Trinidad Bay.
• Support educational efforts targeting road owners and managers about design, maintenance and management of roads to protect water quality. Educate homeowners, contractors and public agencies about erosion control and stream crossings.
• Provide outreach to landowners and public agencies about importance of road construction and maintenance to minimize changes in natural runoff patterns. Support funding for improved road management.

Storm Water Action Plan 6 01063-06004-11001
• Implement stream crossing best management and construction practices using hydrologic inventories and prioritization. Replace or maintain culverts to benefit salmonids, streams and wetlands.
II. Medium and long-term activities to reduce non-point sources of pollution and to improve aquatic habitats:
• Reassess and evaluate effectiveness of BMPs and projects implemented. Adapt priorities and recommendations based on this reassessment.
• Consider development of a management plan for recreational uses in the Trinidad Bay watershed that impact water quality if data suggest such a management plan may be useful. Support implementation of identified practices and related projects should they be developed.
• Promote interagency coordination for efficient issuance of environmental restoration permits.
These activities will be successful if they achieve these results. Specific criteria will be developed on a project basis: 1. Increased support and capacity for implementation of BMPs on private and public lands in the watershed. 2. Measurable improvements in water quality in Trinidad Bay and tributary streams. 3. Measurable improvements in the health of terrestrial and aquatic habitats in Trinidad Bay and its watershed. 4. Population growth in diminished native species. 5. Improved management and containment of invasive, non-native species. Action 3.0 Promote and support public outreach and education about Trinidad Bay and its watershed. The project area lies within seven sub-watersheds that constitute the Trinidad Plateau. The Trinidad Plateau is bounded by the Mad River Watershed to the south, the Pacific Ocean to the west, and the Redwood Creek Watershed to the east and north. The north coast range rises to the east of the City and consists primarily of Franciscan Complex. There are Quaternary alluvium deposits within the Trinidad Plateau Watershed as well. The northeast boundary, shared with the Redwood Creek Watershed, is the northwest trending Trinidad Fault, which is located near Trinidad, extends to the Trinidad State Beaches. The ICWMP itself is composed of seven separate drainage basins, which are shown on Figure 3 and are detailed below. Drainage Basin 1, Mill Creek, encompasses approximately 998 acres of residential land and coastal range land. Mill Creek drains to the Pacific Ocean on the north side of Trinidad Head. Drainage Basin 2, City of Trinidad, encompasses approximately 155 acres of land. The majority of the land is residential with some commercial use. This basin drains to Trinidad Bay.

Storm Water Action Plan 7 01063-06004-11001
Drainage Basin 3, Parker Creek, encompasses approximately 210 acres of residential and coastal range land. This basin drains to Trinidad Bay. Drainage Basin 4, McConnahas Mill Creek, encompasses approximately 750 acres of residential and coastal range land. This basin drains to the Pacific Ocean south of Trinidad. Drainage Basin 5, an unnamed sub-watershed, encompasses approximately 161 acres of residential and coastal range land. This basin drains to the Pacific Ocean south of Trinidad. Drainage Basin 6, Deadman’s Creek, encompasses approximately 449 acres of residential and coastal range land. This basin drains to the Pacific Ocean south of Trinidad. Drainage Basin 7, Luffenholtz Creek, encompasses approximately 3,774 acres of residential land and coastal range area. This drainage flows into the Pacific Ocean at Luffenholtz beach, south of Trinidad. The community of Westhaven is almost entirely within the Luffenholtz watershed. Purpose:
• Encourage public awareness and participation in developing and implementing this watershed plan.
• Increase public awareness of priority watershed issues. • Increase public awareness about efforts to reduce nonpoint source pollution. • Increase public awareness about opportunities to support and assist with endeavors to
protect the bay and watershed. • Support watershed education in local schools. • Promote volunteer efforts. • Promote watershed stewardship.
Lead: The City of Trinidad will be the lead to undertake the high priority, short-term activities. I. High priority, short-term activities to increase public awareness and involvement in watershed stewardship.
• Submit periodic articles to local newspapers and give interviews to radio stations. • Facilitate information sharing about Trinidad Bay and the surrounding watershed by
sponsoring regular “State of the Bay” conferences, and create a repository for proceedings.
• Support outreach efforts to private landowners regarding incentive programs to reduce non-point source water pollution and habitat fragmentation.
• Promote education and outreach to encourage responsible human recreational activities which can disturb wildlife, and dissemination of information about existing policies to protect marine mammals, shorebirds, sensitive plant communities, etc.
• Develop an educational flyer/brochure about watershed conservation, collaborative efforts by local stakeholders, and restoration efforts to place at locations visible to the

Storm Water Action Plan 8 01063-06004-11001
community and visitors, including: bed & breakfasts, state and national parks, inns and other commercial establishments including kayaking companies.
• Develop and disseminate an updated bibliography of scientific literature on Trinidad Bay.
• Prepare an annual newsletter to be sent out to all residents in the watershed, and consider combining with local organizations’ newsletters to increase visibility and readership. Post newsletter electronically on website, and if possible on other websites.
• Develop a list of volunteer opportunities in the watershed- avenues for active engagement. Include this material in our outreach materials and website. Query local groups and agencies on their volunteer needs and programs.
II. Medium and long-term activities to increase public awareness about watershed stewardship:
• Promote education and outreach to encourage water conservation and the importance of installing common household low-water usage appliances (e.g. low flow toilets), and use of appropriate landscaping practices (e.g. planting native, drought tolerant plants).
• Support development and dissemination of watershed-based curricula to local schools. Promote and enhance watershed education efforts at local schools.
• Promote watershed educational outreach opportunities including hikes, tours, seminars, etc. Participate in and support existing efforts. Provide information on on-going volunteer opportunities with partners in the watershed.
• Hold tours of demonstration projects. • Develop stewardship education packets.
These activities will be successful if they achieve these results. Specific criteria will be developed on a project basis: 1. Creation and dissemination of watershed education materials to communities in Trinidad using different media on a regular basis. 2. Development and maintenance of a website to facilitate education and information sharing about Trinidad Bay and its watershed. 3. Sustained community participating and interest in watershed planning activities. Action 4.0 Implement Stormwater Projects Within and Outside of the City: The proposed implementation projects described below were developed based on common stormwater treatment methodologies that target reduction of bacterial contamination. Reduction of impervious surfaces and stormwater retention that encourage sub-surface infiltration are widely accepted approaches for reducing bacterial contamination and loading of pollutants to surface waters. Implementation projects utilizing infiltration treatment methods for bacterial contamination reduction have been conceptually developed for the three project implementation

Storm Water Action Plan 9 01063-06004-11001
watersheds. The implementation projects described below are part of the planning objectives and goals set-forth in the ICWMP and meet the Clean Beach Initiative guidelines. Both the ongoing ICWMP planning project and the current proposed implementation projects enjoy support and collaboration with a wide range of local stakeholders and government agencies. There are two project areas for implementation projects proposed for funding by the Clean Beach Initiative program, as described below. Mill Creek and City of Trinidad Watershed Project Area The Mill Creek Watershed drains the northern region of the ICWMP planning area in addition to the northern portion of the City of Trinidad. The existing watershed divide is shown on Figure 3. Figure 3 shows an overview of the project area and current drainage patterns based on watershed divisions. Studies to date reveal that stormwater runoff originating in the northern portion of the City of Trinidad is routed through a series of roadside ditches, drain inlets, and culverts which discharge to the Mill Creek drainage. Stormwater originating in the central portion of the City of Trinidad watershed is also routed through a series of roadside ditches, drain inlets, and culverts to a storm drain outfall adjacent to the boat launch on Trinidad Bay Beach. The Humboldt State University (HSU) Telonicher Marin Lab (TML), and the Trinidad Rancheria Parking Facility are also located within the City of Trinidad Watershed. Stormwater from the HSU TML is also routed in a storm drain that parallels the City’s system and they discharge at the same location. A photo of both outfalls is shown in a photo on the following page. The Trinidad Rancheria mainly has limited stormwater runoff from their parking facility near the harbor and Trinidad Head. The Trinidad Kelp Beds Area of Special Biological Significance (ASBS) is located around Trinidad head and adjacent to these outfalls as shown in Figure 2.1. Implementation projects that will reduce bacterial contamination in the waters at Trinidad Beach and Trinidad Bay Beach in addition to minimizing direct stormwater discharge into the ASBS region have been conceptually developed as part of the ongoing integrated watershed planning process. Stormwater treatment techniques utilizing infiltration and bio-retention swales will be incorporated into the implementation project area which has been conceptually identified on Figure 4. The implementation projects will include collecting and re-directing stormwater runoff through a series of bio-retention swales and infiltration galleries. The proposed re-directed drainage paths will result in manageable runoff volumes suitable for the proposed treatment technologies. As shown on Figure 4, some drainage will be diverted from Trinidad Bay Beach and re-routed to the Mill Creek drainage where it will be treated by similar techniques. The result will be to reduce the volume and loading of pollutants at Trinidad Bay Beach while not increasing the volume or loading to Mill Creek by utilizing retention and infiltration. In addition to reducing bacterial contamination in stormwater runoff, the implementation projects will allow for the City of Trinidad, the HSU TML, and the Trinidad Rancheria to approach a zero direct discharge of stormwater. This implementation project is too conceptual at this point to promise a zero direct discharge, but it appears feasible to design for a 100 year storm event and is the ultimate goal of this project. These implementation projects are discussed in more detail on the following pages.

Storm Water Action Plan 10 01063-06004-11001
Figure 1 Location of SWQPA at the Trinidad Kelp Beds and Surveyed Discharges

Storm Water Action Plan 11 01063-06004-11001
Figure 2 Example of Storm Water Discharge Points at Trinidad Bay Beach. HSU TML Storm Water

Storm Water Action Plan 12 01063-06004-11001

Storm Water Action Plan 13 01063-06004-11001

Storm Water Action Plan 14 01063-06004-11001
Luffenholtz Creek Watershed Project Area The Luffenholtz Creek watershed contains limited stormwater facilities that consist primarily of rural roadside ditches and independent culvert crossings. There is no interconnected stormwater conveyance system. The limited culverts are located in the lower reaches of the watershed and primarily route stormwater runoff off or under the roadways, and do not pipe the runoff all the way down to the ocean. This Conceptual implementation project sites for stormwater treatment have been identified within the lower Luffenholtz Creek watershed and are shown on Figure 5. The project sites were selected based on the anticipated effectiveness of bacterial reduction through stormwater infiltration, their close proximity to the Luffenholtz Creek, and the availability of public right-of-way required to accommodate the implemented project. This criterion limited the potential project implementation sites within the Luffenholtz Creek watershed. The proposed implementation projects will consist of surface bio-retention swale and sub-surface infiltration stormwater chambers. The surface swales could be used in some low gradient areas conducive to this approach. The underground chambers will capture stormwater runoff from the rural developed areas in the lower reaches of Luffenholtz Creek Watershed and eliminate direct discharge of bacterial contaminated stormwater into Luffenholtz Creek form most storm events which are ultimately transported to the surf-zone of Luffenholtz Beach. The existing culvert would be left in place as a gravity overflow for large storm events. Most storm events would be captured and treated by the new implementation project, eliminating the direct discharge of contaminated stormwater.

Storm Water Action Plan 15 01063-06004-11001

Storm Water Action Plan 16 01063-06004-11001
Figure 6. Photo of Westhaven Drive Looking North (photo at left) and South (photo at right) showing how stormwater is currently routed on roadway and enters culvert (bottom of photos) that drains directly to Luffenholtz Creek. Project would re-direct stormwater to utilize grassy area to provide infiltration and treatment in this area and upgradient in adjacent areas that contribute runoff.
Action 5.0 Develop Supporting Programs Within and Outside of the City
• The City of Trinidad should investigate the feasibility of Low Impact Development. Low Impact Development is a new comprehensive land planning and engineering design approach with a goal of maintaining and enhancing the pre-development hydrologic regime of urban and developing watersheds. This design approach incorporates strategic planning with micro-management techniques to achieve superior environmental protection, while allowing for development or infrastructure rehabilitation to occur. This innovative approach can be used to help meet a wide range of Wet Weather Flow (WWF) control and community development goals.
• Consider the implementation of a Grading Ordinance for the City of Trinidad. A Grading Ordinance would minimize hazards to property and life, protect against soil erosion, protect drainage courses and watercourses from obstruction, an protect fish, wildlife and their habitat.
• Consider adopting a Stormwater Management Plan. • Development of Groundwater Model representing the drainage groundwater
flow paths of the Trinidad Watershed. A better understanding of groundwater flow would enable the City to design and implement projects that benefit storm water quality, reduce storm water flows by encouraging infiltration, and

Storm Water Action Plan 17 01063-06004-11001
take other actions that benefit water quality while not having a negative impact on bluff stability.
• Develop Zoning laws within the City and County to ensure that sensitive riparian habitat is protected and preserved.
• Begin Permeable Paving Project within Trinidad.
Action 6.0 Support Tsurai Management Plan
• Work to support efforts of the Tsurai Ancestral Society to reduce erosion near and around the bluffs near their ancestral village site.
• Pursue groundwater modeling study (part of previous action item) of City and bluffs to confirm natural groundwater gradients and determine how to reduce anthropogenic impacts.
• Pursue drainage improvements on neighboring parcels to ancestral village site to reduce impacts of excess water on village site.

Appendix H:
Redwood Community Action Agency
Watershed Assessment Action Plan

WATERSHED ASSESSMENT ACTION PLAN FOR THE TRINIDAD-WESTHAVEN COASTAL WATERSHED
Prepared by Natural Resources Services Division
Redwood Community Action Agency
1. INTRODUCTION A. Purpose and Objectives
Sediment from the Trinidad Terraces is a source of non-point pollution impacting stream water quality, ocean water quality, and the kelp beds in Trinidad Bay. The watersheds of the terraces drain into the Area of Biological Significance (ASBS) which was formed to protect sensitive kelp beds surrounding Trinidad Head. In addition, Luffenholtz Creek supplies the drinking water for the city of Trinidad, while the adjacent creeks supply the water for the unincorporated area of Westhaven. High levels of turbidity in Luffenholtz Creek result in increased water treatment costs for the City of Trinidad and periods when the City has to delay processing of raw water through its pressurized filtration system. The non-point sources of sediment are primarily related to gravel and dirt roads, erosion associated with residential development, and gullies caused by water diversions and concentrated runoff. The goal of the Watershed Assessment is to identify the primary sediment sources in the Trinidad/Westhaven area and develop a Watershed Assessment Action Plan for sediment reduction. This Action Plan will be combined with a Wastewater Management Action Plan and a Storm Water Action Plan to form an Integrated Coastal Watershed Management Plan (ICWMP) for the Trinidad ASBS. Reducing road-derived sediment entering the bay is part of the Watershed Assessment action plan.
The primary objectives of the Watershed Assessment Action Plan are:
1. Conduct turbidity monitoring in streams within the project area to identify subwatersheds contributing high concentrations of suspended sediment to the Trinidad ASBS.
2. Conduct road inventories to identify sources of road-related sediment.
3. Prepare a list of prioritized sites and treatment recommendations for roads within
the watershed. Long-term goals for the Action Plan include the following:
1. Reduce the quantity of road-related sediment entering the Trinidad ASBS.
Watershed Assessment Plan April 2008 (Draft)
1

2. Provide recommendations for Best Management Practices when conducting road repairs or routine maintenance.
3. Comply with the goals of implementing actions that protect the beneficial uses of
the waters of the US and the State of California as outlined by: a) Integrated Watershed Management Program (IWMP) b) Nonpoint Source Pollution Control (NPSPC) Program
2. REGIONAL DESCRIPTION A. General Watershed Characteristics Location and Land Ownership The project area for the Trinidad ASBS ICWMP consists of seven watersheds that constitute the Trinidad Terraces, Humboldt County, California (Figure 2.1). The watersheds, listed from north to south include: Mill Creek, Parker Creek, McConnahas Mill Creek, unnamed Creek, Deadman Gulch, Luffenholtz Creek, Joland Creek, and Two Creek (Figure 2.2). The Two Creek watershed encompasses about half of the community of Westhaven. Green Diamond Resource Company owns approximately 55% (3,500 acres) of the land in the upper portions of these watersheds and manages it for commercial timber production (Figure 2.2). The roads in this area include graveled haul roads and native surface secondary roads. The lower watershed is mostly privately owned with the City of Trinidad occupying 300 acres and the Westhaven Community Serviced District managing nearly 400 acres. Roads in the lower watershed are managed by the City of Trinidad, Humboldt County, the State of California (Caltrans), Cher-Ae-Heights Rancheria, private road associations, and private land owners. Geography The topography of the Trinidad terraces is somewhat unique on the north coast. The watersheds traverse uplifted marine terraces which create several low gradient terraces with steeper scarps along the transitions between terraces. The first terrace is at approximately 200 feet in elevation and underlays the residential area of Westhaven west of Highway 101. The second terrace is at approximately 300-480 feet in elevation and includes the residential areas of Westhaven east of Highway 101. The third terrace is at about 500 to 600 feet in elevation and includes a small portion of the residential areas of Westhaven (upper Fox Farm Road and Ox Road to Old Wagon Road) and the industrial timber lands owned by Green Diamond Resource Company. The Green Diamond Resource Company property primarily occupies the terrace at about 600 feet, with an escarpment rising to a narrow ridge along the eastern edge of the watershed at approximately 900 to 1300 feet.
The Trinidad terraces receive abundant precipitation, most of which falls as rain between November and April. A private rain gage at approximately 350 feet elevation was used to monitor rainfall as part of the turbidity monitoring effort. This gage has been maintained
Watershed Assessment Plan April 2008 (Draft)
2

Project Area
Ca l i f o r n i a
0 250 500125Miles
Figure 2.1 Project Vicinity of Watershed AssessmentHumboldt County, California
Eureka
Arcata
Fortuna
Garberville
Trinidad
Map Created by Redwood Community Action AgencyNatural Resources Services Division GIS,2008.
0 10 205Miles

P ac i f i c
Oc e a n
Created by Map Ction Agencywood Community ActRedws Division GIS,ral Resources ServicesNatur
.2008.
0 0.5 10.25 Miles
Watershed Boundaries
Study Area Boundary
Streams
Green Diamond Property
Trinidad Westhaven
Figure 2.2 Location of the Seven Watersheds Within the Project Area
Mill Creek
ParkerCreek
McConnahas Mill
Creek
unnamedCreek
DeadmanGulch
TwoCreek
LuffenholtzCreek
JolandCreek

since 1992 and shows an average annual rainfall of 57 inches. The maximum 24-hour rainfall since 1992 was 7.5 inches. The Rainfall Depth-Duration Frequency curves published by the Department of Water Resources estimate the 100-year twenty-four hour peak rainfall event at 7 inches.
The Trinidad terraces are underlain by uplifted marine terraces and rocks from the Franciscan Formation. This assemblage includes weakly consolidated and unconsolidated sediments with high concentrations of clay in some areas. The soils in the watershed range from sandy - gravels to clays that tend to create hardpans, resulting in numerous wetlands and perched water tables. The clays are easily entrained in water as suspended sediment and carried through the stream system and deposited into Trinidad Bay.
3. ACTION ITEMS
A. Project Description and List Potential projects (action items) have been identified and prioritized to reduce suspended sediment within the project area. These projects fall into three broad categories: (1) updates to the General Plan regarding new construction; (2) road maintenance Best Management Practices; and (3) site specific treatments to the road network.
Update to General Plan Sediment source inventories indicate that some of the suspended sediment in the stream system stems from construction and landscaping practices on small residential parcels. Some of the causes of erosion include: building within the stream zone, bare soil from cleared vegetation, building during the rainy season, and lack of erosion control measures. Provisions in the General Plan could address many of the causes of sediment delivery to the stream system in the Trinidad/Westhaven community. Recommendations include erosion control plans for new buildings or additions, increased buffer strips between construction and streams, construction of bioswales for yard drainage, enforcement of existing vegetation removal and grading ordinances, and implementation of erosion and sediment control Best Management Practices. Best Management Practices for Road Maintenance The process of repairing and maintaining rural roads can be a significant source of sediment delivery into a stream network. Within the project area, roads are maintained by various entities including: Humboldt County, City of Trinidad, Green Diamond Resource Company, private road associations, and private citizens. The adoption of best management practices (BMPs) while performing road related activities can substantially reduce the impacts on water quality while complying with efforts to meet regulations under Phase II of the National Pollutant Discharge Elimination System (NPDES), promulgated by the Regional Water Quality Control Board. Many of these BMPs have been compiled in the County Road Maintenance Manual for Northwestern California Watersheds prepared by the Five Counties Salmonid Conservation Program. Humboldt County participated in the development of the manual and is currently using it in their
Watershed Assessment Plan April 2008 (Draft)
3

road maintenance program. This manual needs to be available to private citizens and road associations to assist them in their road maintenance projects. A series of workshops should be scheduled to disseminate the manual and inform the citizenry of BMPs to protect water quality while maintaining their road network. Road Treatments Within the watershed, 212 sites on 57 roads were inventoried and evaluated. Treatment prescriptions were identified for 167 sites (77%) to reduce delivery to the stream system (Table 3.1). Of these sites, 76 (36%) were identified as high or medium priority for treatment for a potential sediment savings of 9,322 cubic yards. Treatment of all sites would result in a potential sediment savings of 13,148 cubic yards at cost of $1,264,687. Treatment prescriptions include: upgrading drainage systems, decommissioning stream crossing, replacing culverts, installing additional drainage features, and surface erosion control measures (Table 3.2). Because of the different land usage, road system, ownership, and road maintenance capability, Green Diamond Resource Company’s (GDRC) road system was evaluated separately from those in the residential area of Trinidad/Westhaven. Road treatment projects on GDRC land will be bundled separately for funding opportunities and treatment options. B. Impacts and Benefits Implementation of projects for treating road-derived and erosion-based sediment sources will benefit stream and ocean water quality, stream habitat, road maintenance costs, and public awareness. Domestic and municipal water supplies will benefit from decreased siltation of their stream-based drafting points and a reduction in turbidity. This will increase the reliability of water sources for the City of Trinidad and private citizens while reducing the water provider’s operating costs. Aquatic organisms in the stream system will benefit from lower turbidity and fine sediment deposition, which change channel morphology and degrade aquatic habitat. Fish species found in the watersheds include steelhead trout, residential rainbow trout, and cutthroat trout. The Trinidad Head ASBS will benefit from a reduction of non-point source pollution entering the bay and detrimentally affecting the kelp beds. The ICWMP and Action Plan will be used to seek public funding, with private and public cost shares, to implement treatments designed to reduce sediment input into the streams draining the Trinidad terraces. No adverse impacts are expected from implementing the proposed projects. The public outreach will bring together landowners to provide feedback on the process and results of turbidity monitoring and sediment source assessment. The process will also provide an opportunity for local residents to share their knowledge of sediment sources, road conditions, and other situations that may be affecting water quality. These meetings can be used to help residents form road associations and neighborhood associations to address problems in their watersheds and to develop a mechanism and process for working together to solve common problems. There will be some overlap of interests and areas targeted for outreach between the
Watershed Assessment Plan April 2008 (Draft)
4

Table 3.1. Treatment costs for High, Medium, and Low priority sites within the Trinidad Terrace project area.
Watershed
Number of High
Priority sites
Cost of Treating
High Priority
Sites
Number of
Medium Priority
sites
Cost of Treating Medium Priority
Sites
Number of Low
Priority sites
Cost of Treating
Low Priority
Sites
No Treatment
Sites
Total Number of
sites
Cost of Treating all
Sites Mill Ck 4 $ 27,314 2 $ 138 12 $ 18,950 8 26 $ 46,402 Parker Ck 1 $ 1,518 2 $ 64,414 2 $ 8,071 0 5 $ 74,004 McConnahas Mill Ck 3 $ 6,360 2 $ 10,550 4 $ 1,743 4 13 $ 18,653 Unnamed Ck 1 $ 1,003 0 $ 0 0 $ 0 0 1 $ 1,003 Deadman Gulch 0 $ 0 2 $ 3,945 2 $ 628 0 4 $ 4,573 Luffenholtz Ck 18 $ 147,942 27 $ 123,744 61 $ 203,619 30 136 $ 475,305 Joland Ck 2 $ 160,030 3 $ 13,230 1 $ 3,294 1 7 $ 176,554 Two Creek 6 $ 262,841 3 $ 9,013 9 $ 19,174 2 20 $ 291,028 Permitting, design, management fees NA $ 98,886 NA $ 36,660 NA $ 41,619 NA NA $ 177,165
Total 35 $ 705,894 41 $ 261,694 91 $ 297,098 45 212 $ 1,264,687

sediment source assessment and the OWTS assessment that is also part of the ICWMP project. Whenever feasible, education/outreach meetings will be combined to reduce the organizational effort and to maximize public participation.
4. TECHNICAL ANALYSIS AND PLAN PERFORMANCE A. Data and Methods Used in Plan Development
Turbidity Monitoring Methods Turbidity monitoring was used to compare water quality (suspended sediment) between creeks in the project area. Turbidity samples were collected during winter storm events in Joland Creek (tributary to Luffenholtz Ck) at Westhaven Drive, Luffenholtz Creek at Westhaven Drive, Dead Man’s Gulch at Scenic Drive, McConnahas Mill Creek at Scenic Drive, Parker Creek at Scenic Drive, and Mill Creek at Stage Coach Road. These locations were selected to reflect water quality conditions near the discharge point to the Bay while providing for a comparison of the turbidity in creeks draining the industrial timber lands and the rural residential areas. Collection of turbidity samples was coordinated so the samples would represent similar antecedent moisture and rainfall conditions. Data was summarized and analyzed to determine the relative turbidity contributions of the streams in the project area. Turbidity monitoring was conducted in accordance with a Quality Assurance Project Plan (QAPP) developed by Redwood Community Action Agency (RCAA). Turbidity samples were taken during the first significant rain event of the rainy season (minimum 0.5 inches of rain in a 24-hour period) and during 4 other rainfall events throughout the project time period. Rainfall events were selected to represent high intensity events distributed throughout the rainy season. A high intensity event consisted of a minimum rainfall of one inch within 24 hours as measured in Westhaven. Turbidity was measured with a Hach 2100P Turbidimeters in accordance with the “Standard Operating Procedure” developed by for the project. Measurements were taken in the field and recorded on data sheets with the name of the collector, the date, time, and location. Data sheets were collected by the project manager and the data entered into a spreadsheet. To assure accuracy of samples, turbidimeters were calibrated monthly to a test solution of known turbidity. To test precision, at least two samples will be taken at each monitoring location. Analysis Results of turbidity monitoring were used to quantify and compare water quality between streams in the project area. Subwatersheds with elevated turbidity readings were investigated to detect sources of suspended sediment contribution.
Watershed Assessment Plan April 2008 (Draft)
5

Road Inventory and Assessment Methods Aerial photograph analysis was conducted to identify dirt and gravel roads, landslides, and other potential sources of sediment. A road inventory and assessment were conducted on approximately 60 miles of roads within the project area. Roads in industrial timber lands and rural residential area were inventoried and individual sites were identified and given a site number. All stream crossings on main roads, secondary roads, and abandoned roads were included as sites. Erosion sites (road fill failures) were included if they delivered sediment to a water course. Data was collected using a road inventory protocol developed by Pacific Watershed Associates (PWA). The field inventories included an assessment of sediment produced by: road surfaces, stream crossings, road fill, cross drains, cutbanks, and erosional features associated with the road. The drainage pattern of the road was noted for potential to transport sediment to the stream network. Data collected in the field was entered into a database program which will be used for data storage, analysis, and presentation. Analysis Individual sites were assessed and treatment prescriptions were developed to identify management actions that could be implemented to prevent sediment from entering the stream system. Cost estimates were determined for all sites with treatment prescriptions. Prioritization was based on an assessment of the sediment impacts on water quality in the stream network and the cost effectiveness of treatment combined with a logical approach that groups sites within close proximity on road segments. Stream crossings were analyzed by examining site-specific data organized into four categories: • Culvert hazard – the likelihood of culvert capacity being exceeded, referred to as
culvert failure; • Fill hazard – the likelihood of the stream crossing fill failing; • Consequences – the erosional effects of culvert failure, and; • Impacts – the effects of culvert failure on downstream resources. Using these factors and professional judgment, stream crossing sites were then identified as high, medium, or low treatment priority sites. The volume of potential sediment delivery to streams (“sediment saved”) was estimated for all stream crossings requiring treatment. Stream crossing volumes were calculated using a computer program (Winroads) developed by Redwood National Park. The program uses field measurements to compute the fill volume and can also be used in designing and estimating the costs of culvert replacements. The potential for stream crossing failure during high flow events was based on the capacity of the culvert to convey flood flows and associated debris. Field indicators
Watershed Assessment Plan April 2008 (Draft)
6

(geomorphic indicators of channel width, depth, flood terraces) were used to determine the adequacy of the culvert at each site. Treatment recommendations were based on the risk and quantity of sediment delivery to the stream network in the event of a stream crossing failure. Cross drains were inventoried if they posed a sediment delivery threat to the stream system. The assessment of cross drain sites was based on the failure potential of the site and delivery potential of sediment to the stream network. Cross drains were evaluated as a potential high or medium priority treatment site when the outlet gully was connected to a stream, inlet was plugged or crushed, pipe was damaged by rust, roadbed was saturated, excess ravel in ditch, or ditch was not routing water properly. Information on contributing ditch length was collected and used in the analysis of road segments. B. Monitoring and Quality Assurance Quality Assurance Turbidity Monitoring Following the Quality Assurance Project Plan (QAPP) developed by RCAA, accuracy was determined by calibrating Hach 2100P turbidimeters prior to each sampling event. Each turbidimeter was calibrated using Gelex Standards prior to each monitoring event and had to read within +/- 2% or 0.2 NTU, whichever is greater (Table 4.1). Precision was determined by taking triplicate readings for each sample. Each of the 3 readings had to be within 5% of the other two or 0.2 NTU, whichever was greater, to ensure precision. Completeness was determined by ensuring that 90% of the target samples are collected within the accuracy and precision requirements.
Table 4.1. Data quality objectives for field measurements.
Group Parameter Accuracy Precision Recovery Target Reporting Limit
Completeness
Field Testing
Turbidity ±2% or 0.2 NTU, whichever is greater
± 5% or 0.2 NTU, whichever is greater
NA 0.2 NTU 90%
Road Inventory and Assessment Personnel performing sediment source assessments were trained in the Pacific Watershed Associates (PWA) road assessment protocol. Survey leaders were required to have completed the training and have a minimum of 3 months of field experience with oversight by a trained supervisor. Survey assistants received on-the-job training by the survey leader. The Quality Assurance officer ensured that survey leaders had the required experience.
Watershed Assessment Plan April 2008 (Draft)
7

C. Data Management Turbidity Monitoring Turbidity measurements at each sample location were recorded on a data sheet specific to the location from which the sample was taken. These results were transferred to an Excel database. The watershed assessment coordinator was responsible for collecting data sheets, photocopying data sheets, checking data sheets for accuracy and completeness, and then providing the data sheet to a data entry person. After the data was entered, the coordinator reviewed the data for accuracy and completeness and made any needed corrections or notes. Turbidity data for each stream was compared to determine which streams were contributing the highest levels of turbidity. The data was used to prioritize road assessments in watersheds which produced the highest levels of turbidity. Turbidity served as a surrogate for sediment and it was assumed that high turbidity was a good indicator of sediment sources. Road Inventory The road source inventory data was entered into field forms. The road inventory coordinator collected all field forms and reviewed them for completeness and accuracy at the end of each day. Field forms were given to a data entry person who photocopied each field form, entered the information from the field form into the data base program, and filed the field forms and photocopies in 2 separate locations. All data will be stored at Redwood Community Action Agency’s (RCAA) office in Eureka. Field data forms will be kept for a minimum of 5 years after completion of field surveys. Copies of all files will be recorded onto compact disks at the end of the project and archived in the RCAA library. Copies of all electronic files and hard copies of reports will be provided to the City of Trinidad. Reports will be archived in the RCAA library.
5. RESULTS AND DISCUSSION Road Treatments Green Diamond Resource Company Property - Summary Green Diamond Resource Company owns approximately 55% (3,500 acres) of the land in the upper portions of four watersheds and manages it for commercial timber production (Figure 2.2). Within the Green Diamond Resource Company portion of the project area, 165 sites on approximately 34 miles of roads were inventoried and evaluated. One hundred twenty-three (79%) of these sites are located in the Luffenholtz Creek watershed, the largest of the four watersheds (Table 5.1). Turbidity monitoring conducted during the winters of 2006/2007 and 2007/2008 found that Luffenholtz Creek consistently had the highest turbidity of the four watersheds. Luffenholtz Creek is also the water source for the City of Trinidad and many Westhaven residences. Treating all
Watershed Assessment Plan April 2008 (Draft)
8

sites in the Luffenholtz watershed would lead to a potential sediment savings of 6,728 cubic yards, while treating all sites within the project area would lead to potential sediment savings of 8,462 cubic yards.
Table 5.1. Distribution of sites on Green Diamond Resource Company property by watershed. Treatment costs reflect the only the implementation costs.
Watershed Number of sites
Number of high priority
sites
% of high
priority sites
Future yield of all sites (cy)
Average future yield
per site (cy)
Cost to treat all sites in
watershed Mill Ck 23 4 17% 1,553 68 $ 53,961 McConnahas Mill Ck 10 2 20% 176 18 $ 7,952 Luffenholtz Ck 131 17 13% 6,728 51 $ 446,609 Deadman Gulch 1 0 0% 5 5 $ 1,320 Total 165 23 14% 8,462 51 $ 509,843
Stream crossings constituted the feature most often in need of treatment, followed by road segments, cross drains and gullies (Table 5.2). The inventory effort found that over 90% of the stream crossings assessed were on intermittent or ephemeral streams. This makes for low flowing streams and small fill volumes. The average fill volume for the area was 205 cubic yards, while the median fill volume was 119 cubic yards. Approximately 21% of the stream crossings were identified in the field as being undersized and/or needing replacement. Common sources and potential sources of sediment at stream crossings included: surface erosion on bare road surfaces adjacent to the stream, fill material eroding into the stream, old failing Humboldt crossing, undersized or damaged culverts, and potential diversions of the stream out of the channel eroding the road and hillslope during crossing failure. Table 5.2. Site classification and future sediment yield from all inventoried road-related sites on Green Diamond Resource Company property.
Site Type
Total number of sites
Number of high
immediacy sites
Number of medium
immediacy sites
Number of low
immediacy sites
Number of sites
with diversion potential
Future yield to streams
(cy) Stream Crossing 157 21 30 66 31 8,181 Cross Drain 3 --- --- 3 1 6 Road Segment 4 2 --- 2 1 4 Gully 1 --- --- 2 --- 4 Totals 165 23 30 73 33 8,191
Green Diamond Resource Company Property - General Treatment Recommendations The road maintenance activities observed during the inventory included treatments for main haul roads (i.e., CR 1000, CR 1600), secondary roads (i.e., CR 1400), and roads used seasonally for timber harvest activities. A number of recent upgrades and treatments were observed on various roads depending on the road status as either permanently closed, seasonally closed, or maintained. On maintained roads, treatments included replacing culverted stream crossings with bridges or corrugated metal pipes (CMP’s), armoring stream channels with large (2-ton and larger) riprap, applying crushed rock to
Watershed Assessment Plan April 2008 (Draft)
9

road surfaces, regular watering of the road surface during the summer, and adding straw bales to berm drains along Luffenholtz Creek. Seasonally closed roads appeared to be treated effectively to reduce coarse sediment delivery to stream courses by dissipating runoff and diverting most overland flow away from stream courses. On many of these roads waterbars were installed to hydrologically disconnect roads from the stream network and straw mulch applied to control rain-splash and sheet erosion. Some seasonally closed roads were lacking proper mulching to prevent surface erosion. Provided these roads are not driven on during the rainy season their sediment contributions are minimal, consisting mainly of the suspended sediment (clay) that is entrained by sheet erosion, rills, and gullies. Where seasonally closed roads have the potential to deliver fines to a water course, they should be mulched with weed and seed free straw to protect bare soil from rain-splash and sheet erosion. In most cases the waterbars prevented delivery of the fine sediment to the stream course. The permanently closed roads are hydrologically disconnected from stream courses by installation of waterbars and by removal of stream crossings. More recent practices include placement of slash on these roads. The slash acts as a mulch to protect bare soil from rain-splash and sheet erosion. It also provides shade and fosters regeneration of native forbs, shrubs, and trees. These roads quickly become indistinguishable from the rest of the landscape. The permanently closed roads were generally excellent examples of treating roads such that they produce no sediment. Maintained roads include the main-haul and access roads to timber stands and spur roads. These roads are regularly graded and rocked and have received significant upgrades at stream crossings in the recent past with the installation of bridges at several crossings and upgraded pipes at others. These crossing upgrades have included extensive rock-armoring of the headwalls and, when needed, installation of boulders for grade control. In general, the treatments Green Diamond Resource Company has applied to their roads are a good model of how to manage and maintain roads. The work implemented over the past few years has resulted in stable stream crossings. Where culverts have been replaced by bridges, the stream crossings are passable by the resident trout in the streams and built to withstand 100-year or greater events. The volume of sediment generated by management activity and the potential sediment production from failing stream crossings in the study area is very low compared to many north coast watersheds under similar management. The low actual and potential volume of sediment production is a result of general management practices, upgrades to the road network, and the low-relief topography in much of the assessment area. Trinidad/Westhaven Residential Areas – Summary The initial project area included all watersheds between Mill Creek to the north and Joland Creek to the south. High turbidity readings in Joland Creek led investigators to sample turbidity in neighboring Two Creek to the south. Two Creek and Joland Creek share a similar population density in the Westhaven area. Turbidity readings in Two
Watershed Assessment Plan April 2008 (Draft)
10

Creek were relatively high and the decision made to include the watershed in the study assessment area. A total of 47 sites were assessed in the Trinidad/Westhaven area. The largest concentration of sites was located in the Two Creek Watershed with 19 (40%) sites assessed and 16 sites identified as needing treatment (Table 5.3). A majority of the sites in the northern watersheds (Mill Creek, Parker Creek, McConnahas Mill Creek, No Name Creek, Deadman Gulch) are located on County roads (Figure 5.1) while the southern sites are mostly found on public easements or roads managed by private road associations (Figure 5.2). Treating all the sites in the Trinidad/Westhaven area would result in a potential sediment savings of 4,684 cubic yards at a cost of $754,844. Table 5.3. Distribution of sites assessed in the Trinidad/Westhaven residential area by watershed.
Watershed Number of
sites surveyed Number of
sites to treat Average future
yield per site (cy) Cost of treatment Mill Ck 3 0 0 $ 0 Parker Ck 5 5 1,408 $ 86,060 McConnahas Mill Ck 3 2 44 $ 13,740 Unnamed Ck 1 1 50 $ 1,166 Deadman Gulch 3 3 1 $ 3,998 Luffenholtz Ck 5 5 29 $ 106,126 Joland Ck 7 6 162 $ 205,316 Two Creek 20 16 2,990 $ 338,439 Total 47 38 4,684 $ 754,844
Trinidad/Westhaven Residential Areas – General Recommendations Sediment contribution from roads in the Trinidad/Westhaven area is best characterized by looking separately at paved County roads and residential gravel/native surface roads. The main County roads in the area are Scenic Drive and Westhaven Drive. Both are paved with mostly inboard drainage systems. With the paved surface, surface erosion from these roads is minimal. Sediment contributions from these roads are mostly from long inboard ditches that either erode and thus contributing sediment, or transport sediment from unimproved roads or cutbanks to the stream system. Stream crossing at major drainages (i.e., Luffenholtz, Parker) have large deep fills. The long ditches discharging into these drainages have accumulated enough water and velocity to have sufficient power to erode the crossing fill causing gully erosion. The County has recently addressed this problem by installing culverts from the road directly to the stream. While this reduces fill erosion, it directly deposits sediment and other pollutants transported by the ditch system into the stream network. Many of the treatments recommended for County roads include installing additional drainage features before stream crossings to shorten the ditch length, reducing the quantity and erosive power of the drain water, and direct water away from the stream system to areas that will allow the sediment to filter out before entering the stream system (Table 5.4). Residential roads managed by individual land owners or road associations were mostly native surface (bare dirt), or poorly maintained gravel roads. These roads contributed sediment to the stream network through surface erosion and ineffective drainage systems. Common treatments for these roads include a regular re-surfacing program and the
Watershed Assessment Plan April 2008 (Draft)
11

Figure 5.1 Locations of Road Assessment Sites for North Trinidad/Westhaven Area
704
245
313703
702 701
700
600
503502
501
426
425
424
312
311
242
241
240
237
236
234
233
232
Map Created by Redwood Community Action AgencyNatural Resources Services Division GIS,2008.
P a ci f
ic
Oc
ean
RoadsRoad Assessment Sites
0 0.25 0.50.125
Miles

818
817 816
815814
813
812811
810
809
808
807
805
806
804
803802
801
244
243
240
239
238
235
234
RailroadAve
4th Ave.
Railroad Ave.6th Ave.
2nd Ave.
3rd Ave.
Figure 5.2 Locations of Road Assessment Sites for the Westhaven Area
RoadsRoad Assessment Sites
Pacific
O
c e a n
Map Created by Redwood Community Action AgencyNatural Resources Services Division GIS,2008.

installation of additional drainage features. Residential roads that would benefit from these treatments include Old Wagon Road, Second Avenue, Third Avenue, Fourth Avenue, and Eighth Avenue. Table 5.4. Treatments for roads in the Trinidad/Westhaven section of the project area.
Treatments Number of treatments % of sites needing this
treatment Cross Drain 11 23% Replace Culvert 5 11% Rolling Dip 4 9% Armored Fill 2 4% Add downspout 2 4% Critical Dip 2 4% Clean Culvert 1 2%
High turbidity readings were recorded in N.F. Parker Creek. Field investigation discovered runoff with suspended sediment emerging from the quarry located in the headwaters of the watershed. This sediment was routed through the stream system and eventually entered the Trinidad ASBS. The road inventories came upon three horse corrals within the study area. All of these corrals were discharging runoff into the stream system. These sites not only contribute sediment to the stream system, but may present a health hazard to the general public. Turbidity
Results and Discussion Turbidity monitoring results showed that residential areas in Trinidad/Westhaven are producing higher levels of turbidity than the industrial timber areas (Figure 5.3). Early turbidity sampling showed Joland Creek and Luffenholtz Creek having the highest turbidity of the six original sampling sites. The high readings at Joland Creek led to additional turbidity monitoring on the southern portion of the residential area of Westhaven which is drained by an un-named creek known locally as Two Creek. Turbidity monitoring was conducted on the Mainstem, North Fork, and South Fork of Two Creek. All three forks had elevated turbidity levels. Subsequently, the Two Creek watershed was added to the turbidity monitoring program.
The three turbidity monitoring locations on the tributaries and main stem of Two Creek point to the North Fork as being a problem area. Field surveys confirmed this, finding a quarter-mile of un-surfaced road adjacent to and within three to fifteen feet of a tributary draining into the North Fork of Two Creek east of Westhaven Drive. Field surveys also discovered an area of channel scour with a small stream-bank landslide and channel incision on the North Fork of Two Creek between Westhaven Drive and Highway 101. This was the likely cause for the higher turbidity reading on the main stem of Two
Watershed Assessment Plan April 2008 (Draft)
12
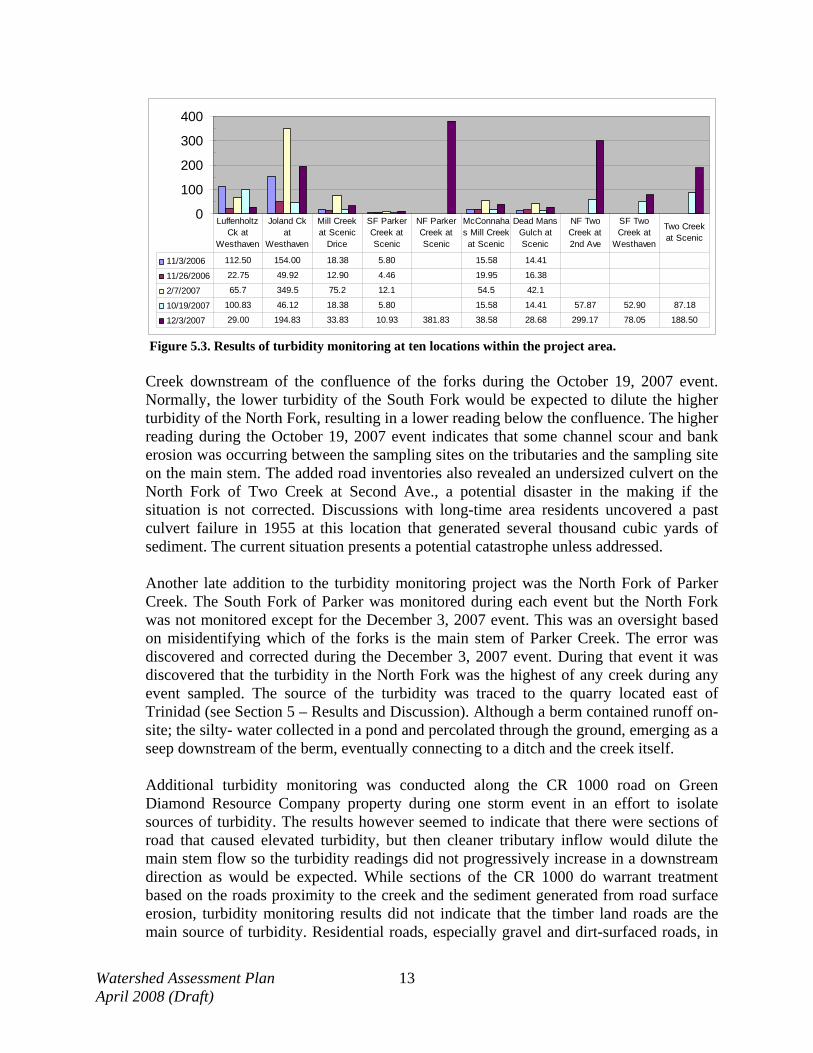
0
100
200
300
400
11/3/2006 112.50 154.00 18.38 5.80 15.58 14.41
11/26/2006 22.75 49.92 12.90 4.46 19.95 16.38
2/7/2007 65.7 349.5 75.2 12.1 54.5 42.1
10/19/2007 100.83 46.12 18.38 5.80 15.58 14.41 57.87 52.90 87.18
12/3/2007 29.00 194.83 33.83 10.93 381.83 38.58 28.68 299.17 78.05 188.50
Luffenholtz Ck at
Westhaven
Joland Ck at
Westhaven
Mill Creek at Scenic
Drice
SF Parker Creek at Scenic
NF Parker Creek at Scenic
McConnahas Mill Creek at Scenic
Dead Mans Gulch at Scenic
NF Two Creek at 2nd Ave
SF Two Creek at
Westhaven
Two Creek at Scenic
Figure 5.3. Results of turbidity monitoring at ten locations within the project area.
Creek downstream of the confluence of the forks during the October 19, 2007 event. Normally, the lower turbidity of the South Fork would be expected to dilute the higher turbidity of the North Fork, resulting in a lower reading below the confluence. The higher reading during the October 19, 2007 event indicates that some channel scour and bank erosion was occurring between the sampling sites on the tributaries and the sampling site on the main stem. The added road inventories also revealed an undersized culvert on the North Fork of Two Creek at Second Ave., a potential disaster in the making if the situation is not corrected. Discussions with long-time area residents uncovered a past culvert failure in 1955 at this location that generated several thousand cubic yards of sediment. The current situation presents a potential catastrophe unless addressed. Another late addition to the turbidity monitoring project was the North Fork of Parker Creek. The South Fork of Parker was monitored during each event but the North Fork was not monitored except for the December 3, 2007 event. This was an oversight based on misidentifying which of the forks is the main stem of Parker Creek. The error was discovered and corrected during the December 3, 2007 event. During that event it was discovered that the turbidity in the North Fork was the highest of any creek during any event sampled. The source of the turbidity was traced to the quarry located east of Trinidad (see Section 5 – Results and Discussion). Although a berm contained runoff on-site; the silty- water collected in a pond and percolated through the ground, emerging as a seep downstream of the berm, eventually connecting to a ditch and the creek itself. Additional turbidity monitoring was conducted along the CR 1000 road on Green Diamond Resource Company property during one storm event in an effort to isolate sources of turbidity. The results however seemed to indicate that there were sections of road that caused elevated turbidity, but then cleaner tributary inflow would dilute the main stem flow so the turbidity readings did not progressively increase in a downstream direction as would be expected. While sections of the CR 1000 do warrant treatment based on the roads proximity to the creek and the sediment generated from road surface erosion, turbidity monitoring results did not indicate that the timber land roads are the main source of turbidity. Residential roads, especially gravel and dirt-surfaced roads, in
Watershed Assessment Plan April 2008 (Draft)
13

Westhaven and Trinidad appear to be a more significant source of turbidity entering the ocean within the project area.
The creeks that consistently displayed the lowest levels of turbidity were the South Fork of Parker Creek and Dead Man’s Gulch. Mill Creek and McConnahas Mill Creek were usually in the lower turbidity ranges with a couple of exceptions (2/7/07 and 12/3/07 on Mill Creek; and 12/3/07 on McConnahas Mill Creek). The reasons for the variability are probably related to activities within those watersheds prior to the sampling event. For instance, winter road grading, site development, and construction activities often occur during the typical mid-winter dry spell. In the industrial timber lands, timber harvesting does not occur in the winter in the Luffenholtz Creek watershed, and there is a decrease in traffic on the CR 1000. Traffic is consistent throughout the year in the residential areas.
6. REFERENCES Flanagan, S.A., Ory, J., Ledwith, T.S., Moore, K., Love, M.A., and. M.J. Furniss. 1998. Methods for inventory and environmental risk of road drainage crossings. Water/Road Interaction Technology Series. USDA Forest Service. San Dimas Technology and Development Center, San Dimas, California. U.S. Department of Interior, National Park Service, Redwood National Park. 2001. ROAD for Windows – Version 1.1. Pacific Watershed Association. 2006. Road Assessment Inventory Form.
Watershed Assessment Plan April 2008 (Draft)
14

Table 3.2. Treatments and Costs for all road assessment sites in the Watershed Assessment area, Trinidad Terraces, CA. Site Information Type of Treatment
Site Watershed Owner-
ship Treat Road Upgrade Decom Maint
Future yield (cy)
Treatment Priority Comments on Problem Comments on Treatment
101 Luffenholtz Creek
Green Diamond Resource
Co.
yes 1300 X 30 L
Wetland drains thru undersized, rusted, bowed, CMP. New ditch relief culvert 360 ft to left. Another new ditch relief culvert (24 inch) is at junction of Road 1300 and 1305.
Install 24" inch x 40' CMP. Clean ditch.
102 Luffenholtz Creek
Green Diamond Resource
Co.
yes 1310 spur X 37 H
Newly reopened rocked road. Rusted culvert, possibly on top of Humboldt crossing. Severe piping under culvert eroding fill. Outslope fill failure with potential of 11 cy of sediment. No diversion. Short inboard ditch.
Install 36" x 30' CMP. Rock outfill slope to armor from ditch exiting on fill slope.
103 Luffenholtz Creek
Green Diamond Resource
Co.
yes 1310 spur X 41 M
Newly reopened rock road. New 12" steel casing pipe installed high in fill. Undersized with shotgun outlet.
Decom crossing after logging operation or install a 36" x 30' pipe.
104 Luffenholtz Creek
Green Diamond Resource
Co.
yes 1310 X 40 M Undersized CMP rusting out, headwater wetland - no channel upstream.
Install 24" x 40' CMP. Clean ditch to left. Armor headwall (inlet and outlet), rock road. Mulch 400 ft2.
105 Luffenholtz Creek
Green Diamond Resource
Co.
yes 1310 X 63 L Undersized CMP on class 2 stream.
Install 24" x 40' CMP. Maintain water bars 100 ft up right road. Mulch 600 ft2.
106 Luffenholtz Creek
Green Diamond Resource
Co.
yes 1310 X 275 H
CMP 100% plugged on class 2 stream. Plugged ditch relief culvert 200 ft up right road with 9 ft drop to channel outlet. Plugged water bar 100 ft up right road, rills start 400 ft up right road and delivers to stream crossing. Large sediment wedge stored upstream.
Install 24" x 50' CMP. Excavate upstream sediment deposit (333 cy), install 3 rolling dips on right road. Remove DRC 200' to right. Road on upstream left bank is good storage area. Mulch 400 ft2.

Table 3.2. Treatments and Costs for all road assessment sites in the Watershed Assessment area, Trinidad Terraces, CA. Site Information Type of Treatment
Site Watershed Owner-
ship Treat Road Upgrade Decom Maint
Future yield (cy)
Treatment Priority Comments on Problem Comments on Treatment
107 Luffenholtz Creek
Green Diamond Resource
Co.
yes 1310 X 48 L
Undersized, rusted 18" CMP on class 2 stream. Some rock over pipe on road surface, otherwise soft soil. Adequate ditch to right and left. Ditch relief culvert 100 ft. up right approach with high cut bank sloughing into ditch and plugging it.
Install 24" x 40' CMP. Set to grade; rock inlet/outlet. Replace ditch relief culvert with rocked swale. 40 ft length x 30 ft width x 4 ft deep. Mulch 1000 ft2.
108 Luffenholtz Creek
Green Diamond Resource
Co.
yes 1310 X 461 H
CMP on Humboldt crossing with riprap at both ends. 100% plugged at inlet and buried at outlet. New drainage relief culvert 100 ft up right road. Road to right has rilling (50' l x 3" d x 12" w).
Install 24" x 60' CMP. Armor fillslope. Install rolling dips on either side of xing. Mulch 1000 ft2.
109 Luffenholtz Creek
Green Diamond Resource
Co.
No 1310 X 0 L
30 inch CMP on class 2 stream. Old yet adequately sized rocked outlet. Drainage relief culvert - 300 ft up left road adequate. Road 100 ft up left road maintained. 18" plastic pipe has inlet blocked by armor rock, still adequate.
No treatment. Install 30" x 40' culvert if upgrading road. Needs to be replaced in next 5-10 yrs. Otherwise, maintain waterbars.
110 Luffenholtz Creek
Green Diamond Resource
Co.
yes 1310 X 92 M
New 24" CMP with minor rust line and heavily rocked inlet and outlets. Heavy alder (6-10 ft tall) growth on all slopes with critical dip in road. Right road slope steep and erodible for 450 ft. Ditch relief culvert 50% plugged. Diversion potential.
Remove DRC on both sides of road and install water bars. Increase berm on road left of xing. Rock ditches, rock road to right for 500'.
111 Luffenholtz Creek
Green Diamond Resource
Co.
yes 1310 X 5 L
18" CMP with slumping headwall ~ 250 ' up left road. Waterbar 80' up left road. Outlet and down channel armored with 1/4 ton boulders. Waterbar 100' up right approach with high cutbank and erodible soil, slumping cutbank at waterbar.
Install culvert if upgrading road for use. Add rock toe to cutbank at waterbar - 40' long x 12' width with 1/4 ton rock.

Table 3.2. Treatments and Costs for all road assessment sites in the Watershed Assessment area, Trinidad Terraces, CA. Site Information Type of Treatment
Site Watershed Owner-
ship Treat Road Upgrade Decom Maint
Future yield (cy)
Treatment Priority Comments on Problem Comments on Treatment
112 Luffenholtz Creek
Green Diamond Resource
Co.
yes 1310 X 10 L
Steep left road approach with 6 large waterbars needing maintenance. 1 critical waterbar up right approach. CMP in good condition.
Maintain 6 waterbars. Mulch 600 ft of road (12000 ft2).
113 Luffenholtz Creek
Green Diamond Resource
Co.
yes 1310 X 3 M
24" CMP on class 2 stream with partially crushed inlet and side - 80% capacity. Drainage 50 ft (bfc = 2 ft x 1 ft deep) to right diverted by inboard ditch to pipe.
Install 30" x 40' CMP. Rock right ditch - 50' x 4' x 0.5'. Mulch 1000 ft2.
114 Luffenholtz Creek
Green Diamond Resource
Co.
yes 1310 X 3 L
Headwall swale - class 3 stream. Erodible soils, minor sheet erosion; may deliver sediment in high intensity storm. Evidence of enough flow to carry silt across road.
Rock road for 20 ft on either side of swale.
115 Luffenholtz Creek
Green Diamond Resource
Co.
yes 1310 X 1 L
Headwall swale - class 3 channel; steep outslope fill; stable/well vegetated - minor surface erosion; potential to divert left down road.
Remove crossing if road decom; otherwise rock the swale - 20' x 40' x 0.5' ~ 15 cy road base.
116 Luffenholtz Creek
Green Diamond Resource
Co.
yes 1310 X 3 L Class 3 stream, headwall swale. Adequate although highly erodible soil/no road rock. Rock road.
117 Luffenholtz Creek
Green Diamond Resource
Co.
yes 1310 X 40 L Needs rock armor crossing (30' x 20' x 1') Install armored ford. Mulch 1000 ft2.
118 Luffenholtz Creek
Green Diamond Resource
Co.
yes 1311 spur X 249 L
18" CMP not in thalweg; adequate due to no sediment transport and little flow. Downstream channel is incising but well vegetated. Steep outslope fill.
Install 24" x 40' culvert, relocate to thalweg. Pull back OBR to reduce perched fill - (40' x 6' x 6') x 1/2 = 26 cy.
119 Luffenholtz Creek
Green Diamond Resource
Co.
yes 1311 spur X 38 L Headwall swale into a class 3 stream below road. 0.5' x 1' incision in channel below road.
Install armored fill xing using 6-18 inch rock. 30-40 cy armor fill.

Table 3.2. Treatments and Costs for all road assessment sites in the Watershed Assessment area, Trinidad Terraces, CA. Site Information Type of Treatment
Site Watershed Owner-
ship Treat Road Upgrade Decom Maint
Future yield (cy)
Treatment Priority Comments on Problem Comments on Treatment
120 Luffenholtz Creek
Green Diamond Resource
Co.
yes 1311 X 356 L Sinkholes in fill slope below OBR, no flow evident upstream, flows subsurface. Fill xing.
Install 24" x 50' CMP if road is to be reopened, otherwise monitor condition. Mulch 1100 ft2.
121 Luffenholtz Creek
Green Diamond Resource
Co.
yes 1311 X 186 H
Class 3 stream xing eroding through active debris flow upstream and downstream of road. Stored sediment on both sides of road. 3' x 3' incisions through stored sediment. Active erosion and delivery.
Install 24" x 50' CMP with 20' downspout. Excavate top to bottom to remove stored sediment. Armor outlet.
122 Luffenholtz Creek
Green Diamond Resource
Co.
yes 1311 X 81 M Filled xing with sinkholes mid road and at OBR. Spring on left approach - wet road surface, headwall swale.
Install rocked ford (50' x 30'); install DRC at spring 100 ft left of xing. Re-grade and fill sinkholes, define channel. Armor OBF at xing and to left with 1/4 ton rock. Possible buried logs in xing.
123 Luffenholtz Creek
Green Diamond Resource
Co.
yes 1311 X 11 H Filled xing with no channel below road. Unstable road fills on left approach for 100' and right approach for 120'.
Install cross road drain. Armored outslope. Pull fill across whole steep area. End haul fill. Excavate back to ridge 200'+.
124 Luffenholtz Creek
Green Diamond Resource
Co.
No 1310 X 0 L Stable rocked ford. Low gradient channel - no erosion. Adequate. No treatment. Maintain only.
125 Luffenholtz Creek
Green Diamond Resource
Co.
yes 1310 X 6 L Undersized culvert, sill log over outlet, fill erosion at OBR.
Install 24" x 30' culvert; armor inlet and outlet.
126 Luffenholtz Creek
Green Diamond Resource
Co.
yes 1010 spur X 263 M Undersized culvert, 25% plugged. Class 3 stream drains into water hole upslope of road.
Install 32"x 40' CMP. Retain depth at inlet, place outlet at bottom (increase slope of culvert). Install trash rack.
127 Luffenholtz Creek
Green Diamond Resource
Co.
yes 1010 spur 88 M
Headwater class 3 stream crosses road in waterbars - some downcutting; diversion potential down left road. Total future yield is xing volume with 1:1 side slopes.
Install rocked ford (4" crushed rock at xing, 5 cy 1/4 ton rock at OBF). Excavate to prevent diversion.

Table 3.2. Treatments and Costs for all road assessment sites in the Watershed Assessment area, Trinidad Terraces, CA. Site Information Type of Treatment
Site Watershed Owner-
ship Treat Road Upgrade Decom Maint
Future yield (cy)
Treatment Priority Comments on Problem Comments on Treatment
128 Luffenholtz Creek
Green Diamond Resource
Co.
yes 1010 spur X 46 L Headwall swale - filled xing. Eroding at OBR. Install rocked ford. Excavate fill.
129 Luffenholtz Creek
Green Diamond Resource
Co.
yes 1010 spur X 115 H 12" CMP on top of Humboldt Crossing. Diversion potential. Shotgun outlet, 12' drop to channel - deep gully.
Install 24" x 40' culvert. Excavate fill from Humboldt crossing. Rock road.
130 Luffenholtz Creek
Green Diamond Resource
Co.
yes 1010 spur X 110 M Cross-road drain drops drainage from upslope swale below road, through gully. Perched fills along left side road.
Install rocked armor swale at outlet. Excavate perched fills(~ 110 cy) right and left of CRD and increase size of drain and berm to prevent diversion. Armor fill area (20' x 10' x 2').
131 Luffenholtz Creek
Green Diamond Resource
Co.
yes 1010 spur X 194 H
100% filled channel with steep slope below, then a terrace, then 100' to creek channel. No drainage structure. Could divert to site 132.
Install armored xing (40' x 20' x 2') to prevent diversions. Excavate fill. Maintain cross-road drains.
132 Luffenholtz Creek
Green Diamond Resource
Co.
yes 1010 spur X 191 H
Humboldt crossing with pipe. Class 3 stream xing eroding outslope fill. Sinkhole and incised channel in fill 30 ft left of outlet. Low gradient below but erosion delivers to stream. Skid road on right of site 131 feeds waterbar to sinkhole.
Install 24" x 50' culvert. Excavate 50 cy of outslope fill 35' to left. Armor outslope fill 35' to left and 30' to right (~ 20-25 cy). Maintain waterbar to left and armor outlet of water down to sinkhole (~ 10 cy of 4 inch crushed rock).
133 Luffenholtz Creek
Green Diamond Resource
Co.
yes 1010 spur X 1 L Small amount of fill in draw along road edge. Headwater swale. Install armored ford, excavate fill.
134 Luffenholtz Creek
Green Diamond Resource
Co.
yes 1010 spur X 0 L
2 Headwall swales/class 3 with skid trail going up left channel. 2' x 1/3' deep channel; vegetation swale across road (grass, sedge, alder); stable and low gradient. Waterbar 160' right approach slopes to LB.
Maintain 3 waterbars to left and right and allow to reveg. If re-opened outslope 160' to right and rock road. If road decom, excavate xing and outslope road 500' to left and right.

Table 3.2. Treatments and Costs for all road assessment sites in the Watershed Assessment area, Trinidad Terraces, CA. Site Information Type of Treatment
Site Watershed Owner-
ship Treat Road Upgrade Decom Maint
Future yield (cy)
Treatment Priority Comments on Problem Comments on Treatment
135 Luffenholtz Creek
Green Diamond Resource
Co.
yes 1010 spur X 8 H 100% filled xing with 6' deep sinkhole at edge of road 60' along channel. Failed waterbars.
Install armored xing and water bars on both road approaches. Excavate fill at road edge and downslope. Possible embedded logs.
136 Luffenholtz Creek
Green Diamond Resource
Co.
yes 1320 spur X 70 M New 18" CMP, with rock headwall and outlet. 85% plugged, although 2" rustline suggests adequate sizing.
Clean CMP and inlet of DRC 240' up right road approach.
137 Luffenholtz Creek
Green Diamond Resource
Co.
yes 2430 X 117 L
18" DRC 150' up right road.
Install critical dip. Maintain ditches, DRC and road. Block ditch line to left.
138 Luffenholtz Creek
Green Diamond Resource
Co.
yes 1305 X 320 M
Long inboard ditch feeds headwall swale into 18" x 60'CMP with 24" drop at outlet. Gully below outlet, low diversion potential down left ditch. 1000' of ditch including to spur roads at 800' and 200'. Next DRC is at 750'.
Install 2 DRC up right road to dissipate ditch flow into 2 to 3 dips. Blade crowned road to outslope. Add 1 DRC down left road and maintain/clean 4 blade outs. Block ditch 20' to left and add critical dip.
139 Luffenholtz Creek
Green Diamond Resource
Co.
No 1300 X 60 L
Road built in upstream corridor adjacent to stream for 600' and 1300' of road drain to stream/wet areas. New 24" CMP drains whole area to 18 creek. 300' downslope channel leads to 18" DRC. Downstream channel appears intermittent, unknown sediment delivery.
No treatment. Remove 1300 (+/-) of road and re-route to watershed divide to south would restore wetlands and cost roughly $50,000. Nearly half of the length of re-route already exists. Sediment delivery to wetland area is small and runoff from wetland is clear.
140 Luffenholtz Creek
Green Diamond Resource
Co.
yes 1006 X 110 H
Excavated class 2 stream xing; some fill left on left bank at upstream end, bulging and eroding. Very minor rilling on left approach (add 2 rolling dips up left approach); 5% grade on right thru erodible soil - rilling for 200' upstream right road - water bar delivers upper half to creek.
Install 2 rolling dips up both approaches. Right approach: reshape rolling dip 75' to rt of xing, make rocked swale 40' x 16' wide x 0.5' thick. Use soil from rt side of waterbar, construct rounded berm on left with broad rocked, gentle swale to rt leading to creek. Excavate and end haul 106 cy of soil from upper left of xing. Mulch 8000 ft2.
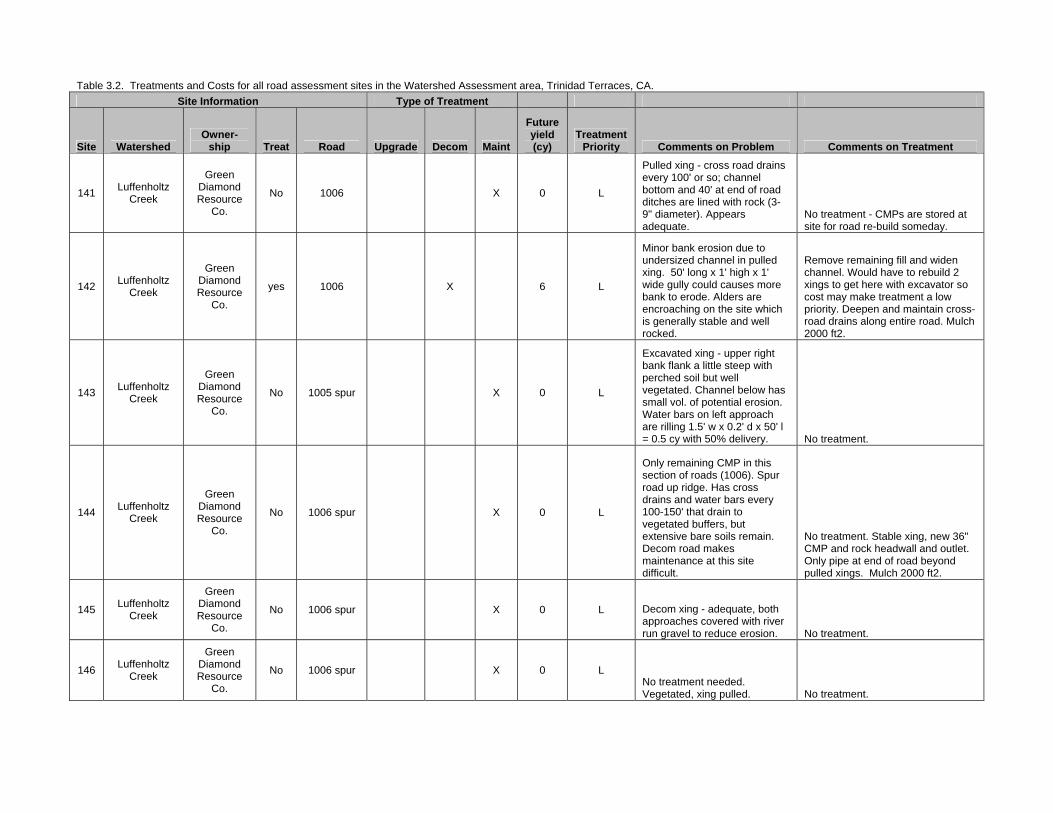
Table 3.2. Treatments and Costs for all road assessment sites in the Watershed Assessment area, Trinidad Terraces, CA. Site Information Type of Treatment
Site Watershed Owner-
ship Treat Road Upgrade Decom Maint
Future yield (cy)
Treatment Priority Comments on Problem Comments on Treatment
141 Luffenholtz Creek
Green Diamond Resource
Co.
No 1006 X 0 L
Pulled xing - cross road drains every 100' or so; channel bottom and 40' at end of road ditches are lined with rock (3-9" diameter). Appears adequate.
No treatment - CMPs are stored at site for road re-build someday.
142 Luffenholtz Creek
Green Diamond Resource
Co.
yes 1006 X 6 L
Minor bank erosion due to undersized channel in pulled xing. 50' long x 1' high x 1' wide gully could causes more bank to erode. Alders are encroaching on the site which is generally stable and well rocked.
Remove remaining fill and widen channel. Would have to rebuild 2 xings to get here with excavator so cost may make treatment a low priority. Deepen and maintain cross-road drains along entire road. Mulch 2000 ft2.
143 Luffenholtz Creek
Green Diamond Resource
Co.
No 1005 spur X 0 L
Excavated xing - upper right bank flank a little steep with perched soil but well vegetated. Channel below has small vol. of potential erosion. Water bars on left approach are rilling 1.5' w x 0.2' d x 50' l = 0.5 cy with 50% delivery. No treatment.
144 Luffenholtz Creek
Green Diamond Resource
Co.
No 1006 spur X 0 L
Only remaining CMP in this section of roads (1006). Spur road up ridge. Has cross drains and water bars every 100-150' that drain to vegetated buffers, but extensive bare soils remain. Decom road makes maintenance at this site difficult.
No treatment. Stable xing, new 36" CMP and rock headwall and outlet. Only pipe at end of road beyond pulled xings. Mulch 2000 ft2.
145 Luffenholtz Creek
Green Diamond Resource
Co.
No 1006 spur X 0 L Decom xing - adequate, both approaches covered with river run gravel to reduce erosion. No treatment.
146 Luffenholtz Creek
Green Diamond Resource
Co.
No 1006 spur X 0 L No treatment needed. Vegetated, xing pulled. No treatment.

Table 3.2. Treatments and Costs for all road assessment sites in the Watershed Assessment area, Trinidad Terraces, CA. Site Information Type of Treatment
Site Watershed Owner-
ship Treat Road Upgrade Decom Maint
Future yield (cy)
Treatment Priority Comments on Problem Comments on Treatment
147 Luffenholtz Creek
Green Diamond Resource
Co.
No 1006 spur X 0 L
Erosive soil on headwater ford, draining off both sides of road into headwater swales. Big waterbar 100' up left road. Rilling moderately - 60' x 1' x 0.1', but no delivery.
No treatment. Maintain waterbars if used by quads only.
148 Luffenholtz Creek
Green Diamond Resource
Co.
yes 1006 spur X 1 L
Sheet erosion/ exposed soil adjacent to class 3 stream xing with skid going up the channel. Near headwall swale, skid trail obliterated old channel.
Mulch road 150 ft to left and right with local woody debris or native material on site. No vehicle access at present. Rock road and install CMP if re-opened.
149 Luffenholtz Creek
Green Diamond Resource
Co.
No 1006 spur X 0 L
Abandoned road crosses headwall swale/wetland spring features. Evidence of ponding, low gradient channel. Any erosion filters out through well vegetated swale/channel downstream.
No treatment unless road re-opened. Then rock road for 20' x 50' x 0.7' (26 cy) with 3" crushed rock.
150 Luffenholtz Creek
Green Diamond Resource
Co.
yes 1006 spur X 1 L
Pulled, well-rocked xing at headwater swale. 2 waterbars on either road approach that are large and rocked. Large bare road area upslope of right waterbar for 100' diverted to filter strip then draw.
Mulch 3000 ft2 to right/ upslope of xing with native slash and light straw.
151 Luffenholtz Creek
Green Diamond Resource
Co.
yes 1006 spur X 1 L
Small lobe of fill on lower OBR bank, surface rilling occurring on left road reach, large amount of organics which could be used for mulching road reach. Waterbar draining left approach enters channel down left bank, may deliver turbidity to class 3 channel.
None needed at xing. Mulch 2000 ft2. Check turbidity delivery during winter/fall first flush to see if clays stay suspended after going through a slash pile filter and out end of waterbar draining left.
152 Luffenholtz Creek
Green Diamond Resource
Co.
yes 1006 spur X 1 L
Some fill left, but stable and well rocked. Water bars to either side and up road to left are adequate but will need maintenance.
Crossing area is well rocked, mulched and has 6'-12' tall alders encroaching as well as other herbs and forbs. Road areas above water bars are bare and need native slash mulch, 1000 ft2.
153 Luffenholtz Creek
Green Diamond Resource
Co.
No 1006 X 0 L Headwall swale, erosive soils/exposed left and right approach but does not appear to deliver.
No treatment. Mulch road reach on both sides of crossing if working in area.

Table 3.2. Treatments and Costs for all road assessment sites in the Watershed Assessment area, Trinidad Terraces, CA. Site Information Type of Treatment
Site Watershed Owner-
ship Treat Road Upgrade Decom Maint
Future yield (cy)
Treatment Priority Comments on Problem Comments on Treatment
154 Luffenholtz Creek
Green Diamond Resource
Co.
yes 1006 X 50 M Pulled crossing nearly complete. Flanks rocked and revegetating. Waterfall headcut is actively eroding upstream sediment fan.
Excavate sediment fan upstream 60' x 20' x 4' and haul spoils to location on ridge or place rock armor and buttress against headwall. Several waterbars on either approach need maintenance on several hundred feet of road drain here. 12 cy of rock needed for armor.
155 Luffenholtz Creek
Green Diamond Resource
Co.
yes 1006 X 2 L
200' left and 150' right road reaches feeding into water bars. If water bars fail, potential delivery to crossing. Water bar already delivering into stream below site. Maintain water bars, mulch 700 ft2.
156 Luffenholtz Creek
Green Diamond Resource
Co.
No 1009 X 0 L Erosive soils, headwall swale, moderate rilling 120' left and 50' right of swale.
No treatment. Rock road if reopened. Should be spreading slash on these abandoned roads to reduce splash erosion. Come in with excavator and spread available slash if winter turbidity monitoring shows high turbidity downstream.
157 Luffenholtz Creek
Green Diamond Resource
Co.
yes 1009 X 22 L
200' of road on each side drain to cross-road drain into a headwater swale. Road is bare and rilling with sheet erosion. Two small waterbars intercept flow 100' above drain.
Mulch bare road areas with native slash - 6000 ft2.
158 Luffenholtz Creek
Green Diamond Resource
Co.
No 1009 X 0 L
Excavated, armored xing. Road to east has bare areas with splash erosion, but roads are waterbarred and feed into low slope/slash areas. Rt. approach has moderate rilling - feeds water bar aimed upstream of road.
No treatment. Check turbidity around bare soil areas and where waterbars deliver to creek. Possibly come in from other end of road with excavator and spread slash on abandoned roads.
159 Luffenholtz Creek
Green Diamond Resource
Co.
yes 1009 X 73 M
Undersized, rusted 24" CMP with steep road approach on left road. Erosive soils with one large, easily plugged pond (30'x20') above crossing.
Install 48" x 40' CMP, partially submerged for resident trout habitat. Rock both road approaches.

Table 3.2. Treatments and Costs for all road assessment sites in the Watershed Assessment area, Trinidad Terraces, CA. Site Information Type of Treatment
Site Watershed Owner-
ship Treat Road Upgrade Decom Maint
Future yield (cy)
Treatment Priority Comments on Problem Comments on Treatment
160 Luffenholtz Creek
Green Diamond Resource
Co.
yes 1009 X 3 L
Headwall swale, soft erodible soils with low slope areas and depressions that road runoff percolates into. May deliver turbidity in winter to class 2 or bigger stream.
Install 3 rolling dips, rock road and swales 400' x 12' x 0.7'. Distribute ditches equally to the 3 swales and make part of rocked surface. If road not needed - spread slash on road surface to prevent sheet erosion and promote re-vegetation.
161 Luffenholtz Creek
Green Diamond Resource
Co.
yes 1009 X 20 M
600' of road erosion on bare erodible soils leads to cross-road at headwater swale from left approach; rilling and sheet erosion apparent.
Install 4 rolling dips. Mulch road bed with straw for 1,000 feet through bare erodible soils from site 160-161.
162 Luffenholtz Creek
Green Diamond Resource
Co.
yes 1009 X 11 L
Road surface is mostly bare erodible clay soils rilling for ~ 100' on both approaches. Sheet erosion drains to road blade out and draw.
Install rock armored xing. Rock road for 100' on either side of crossing with 100 cy of rock. Mulch 3000 ft2.
163 Luffenholtz Creek
Green Diamond Resource
Co.
yes 1010 X 336 H
Huge crossing with well rocked faces. 18" CMP with 30-40% rust lines and 20% plugged outlet. Plugged culvert could wash out crossing (unlikely due to rock faces) but most likely would divert down quarry to CMP at Luffenholtz creek.
Install 36" x 100' CMP with rock fill faces and critical dip over crossing to prevent diversion. Rock critical dip on road.
164 Luffenholtz Creek
Green Diamond Resource
Co.
yes 1010 X 1 M
Decom xing, rutted by traffic. Headwater trib rutted/rilled approaches for 100' either side. Flows into undefined channel. Uncertain delivery.
Install rock ford. Rock road 100' on either side of xing for 200'. Check during winter storms to confirm delivery. Mulch 1200 ft2.
165 Luffenholtz Creek
Green Diamond Resource
Co.
yes 1010 X 2 L
Excavated xing. Artificial headwall swale eroding at xing, drains through vegetation below soft, erodible soil. Stable water bar 100' left of xing.
Rock channel. Mulch 3800 ft2 of road.
166 Luffenholtz Creek
Green Diamond Resource
Co.
yes 1010 X 30 M
Crossing pulled with rill and gully on both flanks and minor undercutting of steeper left flank; 450' of road drains from right and 300' from left to WB that delivers to creek.
Install 4 cross-road drains up 200' on either road approach. Pull back 30 cy from left flank. Mulch both flanks and 100' of road approach with native slash (3000 ft2).

Table 3.2. Treatments and Costs for all road assessment sites in the Watershed Assessment area, Trinidad Terraces, CA. Site Information Type of Treatment
Site Watershed Owner-
ship Treat Road Upgrade Decom Maint
Future yield (cy)
Treatment Priority Comments on Problem Comments on Treatment
167 Luffenholtz Creek
Green Diamond Resource
Co.
yes 1010 spur X 2 L
Filled class 3 stream xing. 70' of moderate rilling from left approach, lump of soil on right edge of stream perched right over creek. Xing partly washed out, partially filled.
Excavate 4 cy fill from xing. Mulch with woody debris and straw for 100' on either side.
168 Luffenholtz Creek
Green Diamond Resource
Co.
yes 1010 X 6 M Pulled xing; right flank looks good; left flank over-steepened with sloughs and rilling.
Install 2 cross-road drains on right approach. Pull remaining 60 cy fill on left flank. Mulch at least 100' of each road approach (2000 ft2).
169 Luffenholtz Creek
Green Diamond Resource
Co.
yes 1010 spur X 4 L Low gradient class 3 headwater swale, minor surface erosion w/moderate rilling for 100' on left approach.
Add 1 water bar to right, mulch 100' x 20' w/straw or slash.
170 Luffenholtz Creek
Green Diamond Resource
Co.
yes 1010 X 3 L Waterbar creates seasonal channel over unstable steep slope. Perched fill on steep OBR slope.
Pull back perched fill on OBR slope, armor drain with rock, mulch area. Supported by redwood and alder - possibly no treatment needed. Mulch 400 ft2.
171 Luffenholtz Creek
Green Diamond Resource
Co.
yes 1010 X 5 M
Bare slopes in quarry are exposed to erosion which enters sediment pond in quarry that drains to CMP or channel. CMP adequate at downspout.
Create settling pond in quarry to catch runoff. Direct overflow away from stream system. Rock overflow channel. Mulch bare soil as needed.
172 Luffenholtz Creek
Green Diamond Resource
Co.
yes 1010 X 171 L
18" CMP ~70' long,100% plugged at inlet. Road intersection at quarry. Drainage overflows to sites 171 and 172. Silty clay soil from quarry may enter channel. Erodible soil; low gradient; well rocked.
Install culvert 24" x 80'. Make settling pond in quarry to accept drainage and allow percolation. Mulch 3000 ft2.
173 Luffenholtz Creek
Green Diamond Resource
Co.
yes 1010 X 6 L DRC draining 600' of road, empties near creek.
Add 2 DRCs up right road approach (ditch relief culvert drains to the east).

Table 3.2. Treatments and Costs for all road assessment sites in the Watershed Assessment area, Trinidad Terraces, CA. Site Information Type of Treatment
Site Watershed Owner-
ship Treat Road Upgrade Decom Maint
Future yield (cy)
Treatment Priority Comments on Problem Comments on Treatment
174 Luffenholtz Creek
Green Diamond Resource
Co.
yes 1400 X 92 L
18" CMP and new 18" DRC both drain to same channel. Inlets have woody debris at inlets and diversion potential. Would divert down rd. and around corner on 1400 rd. and across road.
Install critical rolling dip over xing to prevent diversion.
175 Luffenholtz Creek
Green Diamond Resource
Co.
yes 1400 Maintain 94 L
18" CMP on headwall swale with branches/limbs at inlet. Diversion potential to left; outlet is 80% plugged (staked "WQ5") w/road rock and soil; new 18" plastic DRC 90' up right road. Road with 600' of ditch feeding onto it.
Clean woody debris away from inlet to avoid plugging; clean outlet.
176 Luffenholtz Creek
Green Diamond Resource
Co.
yes 1400 X 43 M
Undersized cross road drain can divert to intersection with 1400 road and both drains have potential to deliver sediment to headwater swale areas.
Install 18" CMP at xing with a critical dip over pipe to prevent a diversion.
177 Luffenholtz Creek
Green Diamond Resource
Co.
yes 1410 X 44 H
Class 3 headwall swale with undersized pipe. Flat road/landing to left sloping 0% to -1% with slight diversion potential; high plug potential. Erosive soils, moderate rilling on right approach with waterbars every 25' feeding into well-vegetated slope.
Install 30" x 40' CMP. Rock armor headwall and fill slope. Install critical dip on left and rock 300' of road. Maintain WB on right approach; rock WB and critical dip; put brush at WB outlet to filter sediment. Mulch 20 ft2 .
178 Luffenholtz Creek
Green Diamond Resource
Co.
yes 1410 X 5 L Re-opened road in June 2007; stump 5 ft. upstream from inlet-potential plugging; could plug and divert 100 ft. to right.
Clean inlet by hand (~1/2 hour) to remove accumulated sediment. Rock road if being used for hauling long term. If one year access only, water bar and slash before rains set in.
179 Luffenholtz Creek
Green Diamond Resource
Co.
yes 1411 X 2 L
Bare roads. Steep approach from left at 3 waterbars that are eroding; two 18" CMPs both plugged 15%, only one was surveyed originally (Second one found on 6-18-07)
Install 2 waterbars, rock. Mark culvert locations. Mulch 4000 ft2.

Table 3.2. Treatments and Costs for all road assessment sites in the Watershed Assessment area, Trinidad Terraces, CA. Site Information Type of Treatment
Site Watershed Owner-
ship Treat Road Upgrade Decom Maint
Future yield (cy)
Treatment Priority Comments on Problem Comments on Treatment
180 Luffenholtz Creek
Green Diamond Resource
Co.
yes 1411 X 2 L
Class 3 stream xing, 18" CMP adequate. Erosive, bare soils. Road has rilling waterbars, no rock on road. WB feeds into creek at site 181.
Rock or mulch (with straw or slash) entire length of road (w=20', ~4000 ft2).
181 Luffenholtz Creek
Green Diamond Resource
Co.
yes 1411 X 2 L
Class 3 stream xing w/18" CMP. Xing and 0.3 cy susceptible to future erosion. Erosive, bare road surfaces draining to creek.
Clean inlet and outlet with hand tool. Rock road or mulch 4000 ft2.
182 Luffenholtz Creek
Green Diamond Resource
Co.
yes 1411 X 15 L Filled xing in headwater swale. Bare road surfaces draining to swale.
Excavate fill on outside of road (30'w x 5'l x 3'd = 15 cy). Maintain dip in road at swale. Mulch road with slash or straw (4000 ft2).
183 Luffenholtz Creek
Green Diamond Resource
Co.
yes 1410 X 15 L
Total future yield would come from gully and WB from diversion. Bare roads with sheet erosion leading to waterbars. No culvert on critical dip with diversion potential to waterbar at intersection with 1411 road.
Construct critical dip and rock armored crossing. Mulch road with straw (4000 ft2) or rock. (30 cy of 3'-9' rock).
184 Luffenholtz Creek
Green Diamond Resource
Co.
No 1400 X L
Rocked road near stream within inner gorge. Many outlet berms to drain road. Thick vegetation filters sediment before entering stream.
No treatment. Keep road rocked and maintain berm drains.
185 Luffenholtz Creek
Green Diamond Resource
Co.
No 1500 X 58 L
New 36" x 40' CMP on class 2 steam at Junction of Rd 1400/1500. 2 to 4 ton boulder armor around headwall, outlet and up 50' on right bank, 40' on left bank. Silt line at outlet is at ~ 18" (new pipe so no rustline). Low flow barrier to resident trout. Total future yield is from small gully over road. No treatment.

Table 3.2. Treatments and Costs for all road assessment sites in the Watershed Assessment area, Trinidad Terraces, CA. Site Information Type of Treatment
Site Watershed Owner-
ship Treat Road Upgrade Decom Maint
Future yield (cy)
Treatment Priority Comments on Problem Comments on Treatment
186 Luffenholtz Creek
Green Diamond Resource
Co.
No 1000 X 98 L
Well constructed new xing with adequate pipe and rip rap inlet and outlet. Possible cutthroat migration barrier at low flows. Lots of bare road surfaces all around this triple road junction and very few filter strips. Inlet of 12" plastic pipe is plugged. No treatment.
187 Luffenholtz Creek
Green Diamond Resource
Co.
yes 1510 X 48 M
Fill xing can divert down road causing successive water bar failure for 800'. Bare road surfaces are sheet eroding with large rills and small gullies in 8 water bars. 4 more waterbars up right road - steep pitch.
Install create critical dip at xing, pull fill. Maintain water bars on road to left (8) and right (4). Over build water bars, rock them and close road. Mulch road with straw or slash.
188 Luffenholtz Creek
Green Diamond Resource
Co.
yes 1510 spur X 3 L
Ridge road with steep erosive soils, big waterbars every 100' or less, low delivery unless clays stay suspended. ~ 1100' upstream from road 1000 bridge. Near continuous flow: class 2 steam, potential resident trout habitat. Fill was left in crossing, so channel flows subsurface through xing but has flow above and below. Not easily accessed.
Mulch 12000 ft2 with natural materials on site.
189 Luffenholtz Creek
Green Diamond Resource
Co.
yes 1510 spur X 10 L
Small amount of fill left on upper left bank after decommission. Road approaching from left has 0.5 miles of moderate rilling and some sheet erosion.
Install 12 water bars along 0.5 miles up road. Excavate remaining fill (10 cy) on upper left road surface left from previous decommission. Mulch 300 ft2.
190 Luffenholtz Creek
Green Diamond Resource
Co.
yes 1620 X 3 M
Class 3 stream xing - mostly excavated. North end of recent clearcut, still hauling logs out. Powdery road through clearcut. Low gradient and headwater area.
Water bar or outslope as appropriate to dispense and dissipate runoff. Slash/ mulch 40,000 ft2 after logging completed.
191 Luffenholtz Creek
Green Diamond Resource
Co.
yes 1620 X 10 L Road cuts across wetland soils - minor fills. Ponding and muddy water evident on road.
Decommission road by installing tank traps at either end of road. Allow vegetation to establish.

Table 3.2. Treatments and Costs for all road assessment sites in the Watershed Assessment area, Trinidad Terraces, CA. Site Information Type of Treatment
Site Watershed Owner-
ship Treat Road Upgrade Decom Maint
Future yield (cy)
Treatment Priority Comments on Problem Comments on Treatment
192 Luffenholtz Creek
Green Diamond Resource
Co.
No 1620 X 0 L
Spring/wetland on road; non-delivery site. If road is re-opened, it will need to be rocked ~30 ft left road; and ~60 ft right road which feeds to site. Vehicle use has created ruts.
No treatment. Rock 12' wide x 60' long if reopened, or close road.
193 Luffenholtz Creek
Green Diamond Resource
Co.
yes 1620 X 45 L Erodible fill crossing plugged channel. Piping through road fill eroding away.
Decommission road - pull crossing. Mulch 100 ft2.
194 Luffenholtz Creek
Green Diamond Resource
Co.
yes 1620 X 22 M
Crossing volume and rills to contribute future erosion. Class 3 stream xing through 12" steel pipe. Pipe undersized with water diverted onto road, no possibility for further diversion. Gully in right road crosses road at waterbar and connected with creek. Sheet erosion 500-750' to right.
Install 24" x 30' CMP. Install 4 rolling dips. Other possibility is to pull xing and decom road.
195 Luffenholtz Creek
Green Diamond Resource
Co.
yes 1600 X 31 M
Undersized, 30% plugged pipe in active channel; 1000' of steep road grade drains to inboard ditch at DRC 70' before main stream xing. DRC delivers directly to channel.
Install 36" x 40' CMP with rock inlet and outlet. Add 2 DRCs up road at headwater swales; rock inlets and outlets. Existing DRC should be disconnected from live stream and put into a sediment trap.
196 Luffenholtz Creek
Green Diamond Resource
Co.
yes 1600 X 43 M
Class 2 stream with 18" CMP. Dirt line above 1/2 culvert diameter indicating pipe undersized. Armored at outlet. Long deep ditches feed into site. 18" DRCs at 150' left and 90' right of crossing. Install 24" x 40' CMP.
197 Luffenholtz Creek
Green Diamond Resource
Co.
No 1900 X 0 L
800' of cutbank and ditch run to 18" plastic culvert at headwater swale. Road rocked with good base; ditches are open. No treatment. Maintain culvert.
198 Luffenholtz Creek
Green Diamond Resource
Co.
yes 1900 X 282 L Slash at inlet and inboard ditch.
Clear slash from culvert inlet and inboard ditch.

Table 3.2. Treatments and Costs for all road assessment sites in the Watershed Assessment area, Trinidad Terraces, CA. Site Information Type of Treatment
Site Watershed Owner-
ship Treat Road Upgrade Decom Maint
Future yield (cy)
Treatment Priority Comments on Problem Comments on Treatment
199 Luffenholtz Creek
Green Diamond Resource
Co.
No 1900 X 0 L Long ditch and cutbank to headwater swale. Minor rilling of road. Adequate culvert size.
No treatment. Maintain ditches. Encourage cut banks to re-vegetate.
200 Luffenholtz Creek
Green Diamond Resource
Co.
yes 1900 X 272 M Diversion potential. Slash left on cut banks and at culvert inlets. DRC has plug potential.
Install critical dip to prevent diversion. Maintain ditches and encourage cut bank to re-vegetate.
201 Luffenholtz Creek
Green Diamond Resource
Co.
yes 1900 X 230 L
Class 3 headwall stream with 18" CMP in good condition. Recently brushed with slash put on cutbank and fillslope helping to mulch bare soil. High steep cutbanks, especially up right road with some erosion but low % of delivery. Minor amount of sediment in pipe form cutbank/ditch erosion. Outlet 30% plugged but not a significant problem. Future delivery is 5% from gully and 100% from xing fill.
Clean outlet. Mulch 1000 ft2 with slash.
202 Luffenholtz Creek
Green Diamond Resource
Co.
yes 1600 spur X 40 L
Flowing class 3 stream: low slope, 50% plugged at outlet. Slumping in middle, flow may go partly around pipe (small hole to right of inlet).
Install 36" x 40' CMP; set to grade (slope of ~ 0.5%). Make sure it is not bellied in the middle. Add critical dip on left hinge.
203 Luffenholtz Creek
Green Diamond Resource
Co.
yes 1600 spur X 1 L
Bare soil road. Mulch road 100' in both directions (2000 ft2).
204 Luffenholtz Creek
Green Diamond Resource
Co.
yes 1600 spur X 70 L Undersized, short pipe discharges on erodible fill. Bare road surfaces.
Install 24" x 80' CMP. Mulch road for 100' on either side of xing (2000 ft2).
205 Luffenholtz Creek
Green Diamond Resource
Co.
yes 1601 spur X 57 H
Inlet crushed - 100% plugged. Repair 10' of crushed culvert at inlet.

Table 3.2. Treatments and Costs for all road assessment sites in the Watershed Assessment area, Trinidad Terraces, CA. Site Information Type of Treatment
Site Watershed Owner-
ship Treat Road Upgrade Decom Maint
Future yield (cy)
Treatment Priority Comments on Problem Comments on Treatment
206 Luffenholtz Creek
Green Diamond Resource
Co.
yes 1601 spur X 114 H 100% plugged culvert inlet. Gully at outlet. Undercut bank, 40% unstable with rills, exposed roots, and cones. Clean inlet and outlet.
207 Luffenholtz Creek
Green Diamond Resource
Co.
No 1000 X 0 L Surface erosion from heavy use on road. Some fines being deposited directly into stream channel.
No treatment. Well armored and vegetated.
208 Luffenholtz Creek
Green Diamond Resource
Co.
No 1000 X 0 L Minor rilling on approach slopes.
No treatment. Possibly mulch approach slopes and encourage vegetation.
209 Luffenholtz Creek
Green Diamond Resource
Co.
No 1011 X 0 L
Wetland /headwater swale on a abandoned, vegetated over road. Fill: 100' x 20' x 4'. More pond features, but eventually becomes a drainage. No treatment.
210 Luffenholtz Creek
Green Diamond Resource
Co.
yes 1011 X 22 L
100% plugged Humboldt Crossing, partly eroded - Max gully 5' x 5' through low gradient headwater swale. For 40' average 3' by 4' depth, max 1' d 1' w.
Excavate fill and logs from crossing. Access through 1012 road thru clear cut. Water bar, mulch on way out. Use backhoe or small excavator to avoid damaging reveg.
211 Luffenholtz Creek
Green Diamond Resource
Co.
yes 1011 X 5 L Some perched fill remains at excavated crossing and is still subject to erosion.
Pull crossing fill that remains and mulch area with native materials. Use small excavator. Assess access option to avoid disturbing revegetated roads.
212 Luffenholtz Creek
Green Diamond Resource
Co.
yes 1011 spur X 3 L
Filled crossing in class 3 headwall swale flowing 6" x 2". Red clay soils - bare and exposed through crossing, not mulched.
Excavate 80 cy of fill. Use onsite slash or straw to totally cover road for 100 ft on each side. Place spoils on road 100 ft to right and left of crossing.
213 Luffenholtz Creek
Green Diamond Resource
Co.
yes 1000 X 2 L
Small intermittent flow at road crossing ditch; bare road surface delivery to trib which at times may connect to the main stem below.
Block off 1600 Rd to prevent access in winter, mulch 4000 ft2 over bare road surfaces.
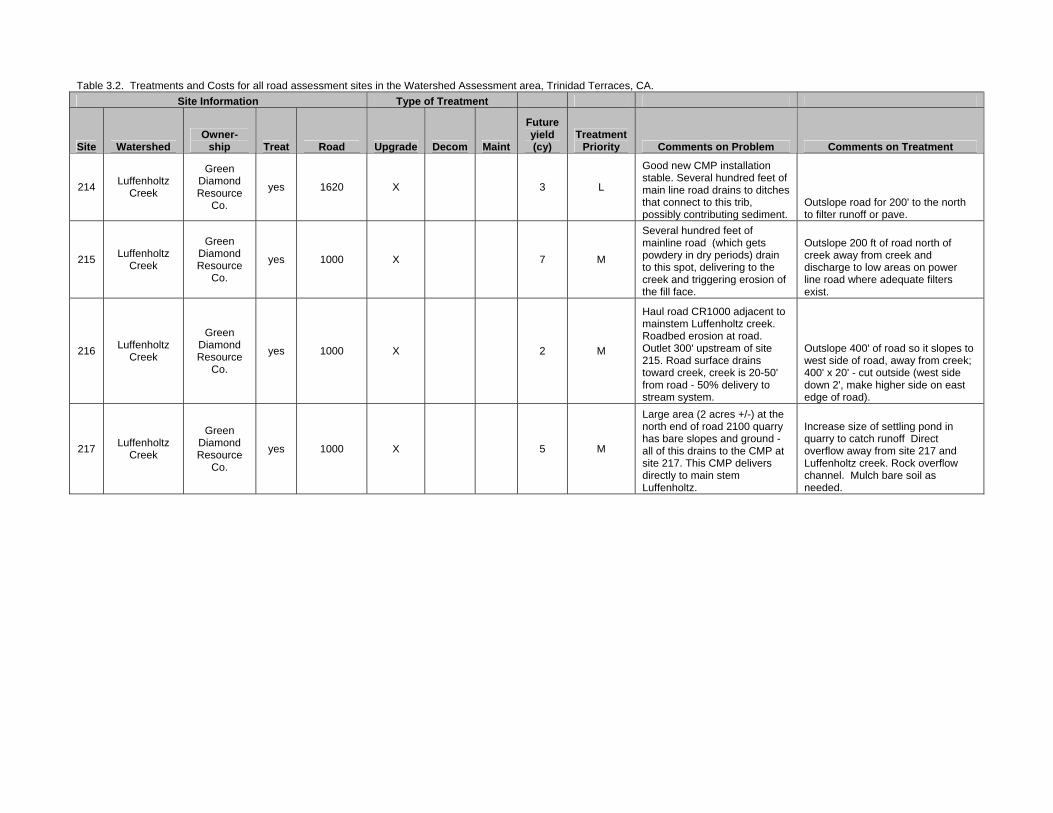
Table 3.2. Treatments and Costs for all road assessment sites in the Watershed Assessment area, Trinidad Terraces, CA. Site Information Type of Treatment
Site Watershed Owner-
ship Treat Road Upgrade Decom Maint
Future yield (cy)
Treatment Priority Comments on Problem Comments on Treatment
214 Luffenholtz Creek
Green Diamond Resource
Co.
yes 1620 X 3 L
Good new CMP installation stable. Several hundred feet of main line road drains to ditches that connect to this trib, possibly contributing sediment.
Outslope road for 200' to the north to filter runoff or pave.
215 Luffenholtz Creek
Green Diamond Resource
Co.
yes 1000 X 7 M
Several hundred feet of mainline road (which gets powdery in dry periods) drain to this spot, delivering to the creek and triggering erosion of the fill face.
Outslope 200 ft of road north of creek away from creek and discharge to low areas on power line road where adequate filters exist.
216 Luffenholtz Creek
Green Diamond Resource
Co.
yes 1000 X 2 M
Haul road CR1000 adjacent to mainstem Luffenholtz creek. Roadbed erosion at road. Outlet 300' upstream of site 215. Road surface drains toward creek, creek is 20-50' from road - 50% delivery to stream system.
Outslope 400' of road so it slopes to west side of road, away from creek; 400' x 20' - cut outside (west side down 2', make higher side on east edge of road).
217 Luffenholtz Creek
Green Diamond Resource
Co.
yes 1000 X 5 M
Large area (2 acres +/-) at the north end of road 2100 quarry has bare slopes and ground - all of this drains to the CMP at site 217. This CMP delivers directly to main stem Luffenholtz.
Increase size of settling pond in quarry to catch runoff Direct overflow away from site 217 and Luffenholtz creek. Rock overflow channel. Mulch bare soil as needed.

Table 3.2. Treatments and Costs for all road assessment sites in the Watershed Assessment area, Trinidad Terraces, CA. Site Information Type of Treatment
Site Watershed Owner-
ship Treat Road Upgrade Decom Maint
Future yield (cy)
Treatment Priority Comments on Problem Comments on Treatment
218 Luffenholtz Creek
Green Diamond Resource
Co.
yes 1000 X 70 H Road is in close proximity to Luffenholtz creek. Road is sloped towards creek and has 8 exit points for road surface runoff between site 218 and site 221. Sediment delivery is evident during rain storms. Largest delivery is most likely during the first flush (first large storm event) when pulverized rock from the road surface is mobilized and transported to stream system.
Starting at site 218 outslope 320 ft of road away from Luffenholtz creek, while blocking drain sites 1 and 2 (see diagram). From this point south, trench outslope ditch 700' x 1' x 1' and fill with drain rock. At drain site 3 rock 20' x 1' x 3' of 3" swale between road and creek. Install culvert across road near drain site 3 to drain accumulated water on West side of road. Drain site 4 and 6 requires no treatment, except maintain and periodically replace straw bales. Drain site 5 requires rocking 20' x 3' x 1' swale directing water to small flood plain between road and creek. Drain sites 7 and 8 are to be blocked off and water directed via the rocked ditch to site 221. The exit point needs to be rocked with 1/4 ton rock all the way to Luffenholtz creek.
219 Luffenholtz Creek
Green Diamond Resource
Co.
yes 1000 spur X 5 L
Class 3 stream crossing waterbarred 100' to left, bare soil. Erodible with significant sheet erosion when left bare, but waterbar directs all but the last 100' ~ 10% slope up to left, flat/ponded for 75' to rt.
Slash entire road, excavate to soil from crossing, armor with onsite wood. If dry in summer, do with bulldozer, and if wet with excavator. Mulch 12' w x road length.
220 Luffenholtz Creek
Green Diamond Resource
Co.
No 1000 X 0 L Fill crossing, abandoned road, no erosion potential, 95% fill removed. No treatment needed. No treatment.
221 Luffenholtz Creek
Green Diamond Resource
Co.
yes 1000 X 80 L New 24" CMP, class 3 headwall swale, armored inlet and outlet; ALINE adjacent to Luffenholtz Creek.
Culvert could have been cut down 6' shorter distance to creek to allow sediment to filter out. Rock line inlet ditch 20' x 2' x 0.5' with maximum 6" diameter rock and add 2 check dams. Rock Fillslope to receive drainage from road ditch (see site 218).

Table 3.2. Treatments and Costs for all road assessment sites in the Watershed Assessment area, Trinidad Terraces, CA. Site Information Type of Treatment
Site Watershed Owner-
ship Treat Road Upgrade Decom Maint
Future yield (cy)
Treatment Priority Comments on Problem Comments on Treatment
222 Luffenholtz Creek
Green Diamond Resource
Co.
No 1000 X 2 L Road adjacent to Luffenholtz Creek, fine dust and sediment delivered to creek in air and runoff.
No treatment. Allow buffer strip of trees to grow in to help prevent airborne dust delivery.
223 Luffenholtz Creek
Green Diamond Resource
Co.
No 1000 X 0 L
CR1000 within 15 to 25' of Luffenholtz Creek for 0.35 mi - back to site 222 and beyond. Road crowned. Trib enters from east side of CR1000 site 223. May be an old cutout meander draining back to Luffenholtz. Road drains onto small vegetated flood plain; traps sediment.
No treatment. Site visits in 6/ 07 and 9/07 found little to no delivery of sediment to the creek system.
224 Luffenholtz Creek
Green Diamond Resource
Co.
No 1000 X 0 L Incomplete crossing removal, perched fill on Luffenholtz, potential for full delivery.
No treatment. Revegetating well with alders - low potential for failure.
225 Luffenholtz Creek
Green Diamond Resource
Co.
No 1000 X 0 L
Headwall swale filled for ~ 100 ft for road crossing. Flow downstream but none upstream. Stable 100%, revegetated road. No treatment.
226 Luffenholtz Creek
Green Diamond Resource
Co.
No 1000 X 0 L Erosive soils on steep pitch, waterbarred.
No treatment. If road opened, needs to be rocked and possibly have culvert installed.
227 Luffenholtz Creek
Green Diamond Resource
Co.
yes 1000 X 74 H
Rusted 48" CMP. 5% plugged/ Medium priority for replacement. For ~ 300' crossing road is outsloped and bermed, routing water and sediment to outlet at Site 227 and Luffenholtz Creek.
Remove berm or punch hole in berm every 50' for 250' of road north/right of crossing. Add low-tech energy dissipaters at each opening. Replace culvert. Replacement culvert should be shorter than existing pipe. Mulch 600 ft2.
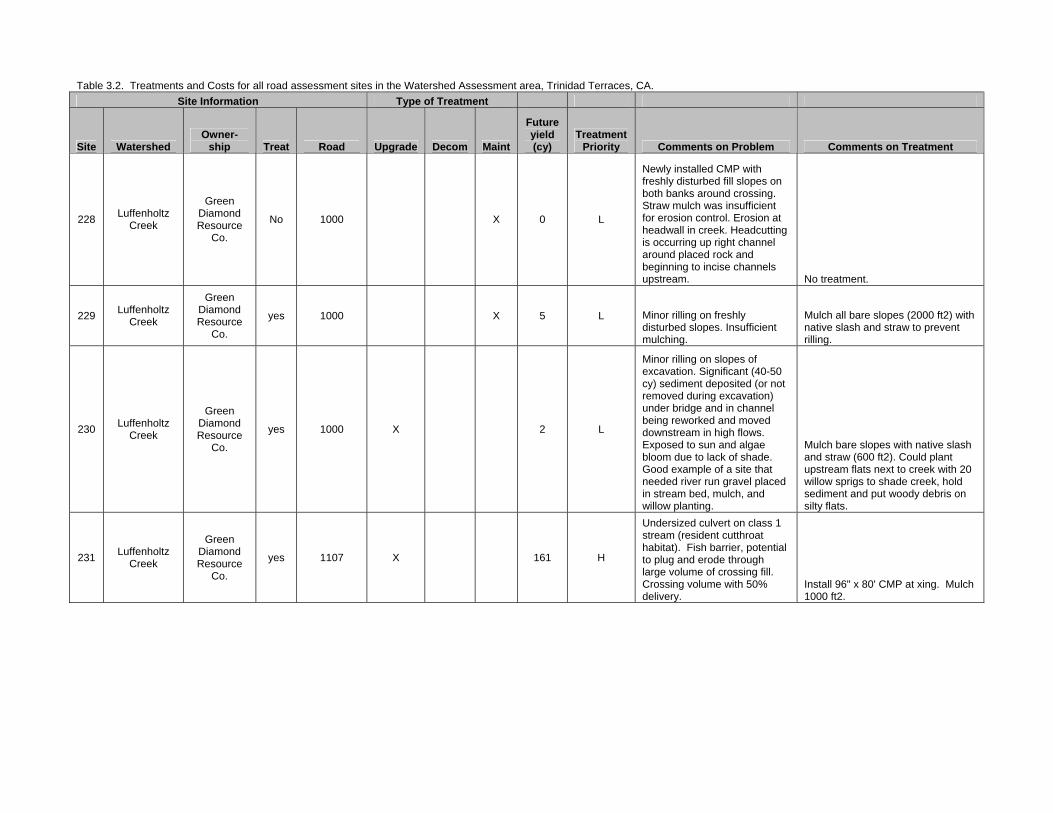
Table 3.2. Treatments and Costs for all road assessment sites in the Watershed Assessment area, Trinidad Terraces, CA. Site Information Type of Treatment
Site Watershed Owner-
ship Treat Road Upgrade Decom Maint
Future yield (cy)
Treatment Priority Comments on Problem Comments on Treatment
228 Luffenholtz Creek
Green Diamond Resource
Co.
No 1000 X 0 L
Newly installed CMP with freshly disturbed fill slopes on both banks around crossing. Straw mulch was insufficient for erosion control. Erosion at headwall in creek. Headcutting is occurring up right channel around placed rock and beginning to incise channels upstream. No treatment.
229 Luffenholtz Creek
Green Diamond Resource
Co.
yes 1000 X 5 L Minor rilling on freshly disturbed slopes. Insufficient mulching.
Mulch all bare slopes (2000 ft2) with native slash and straw to prevent rilling.
230 Luffenholtz Creek
Green Diamond Resource
Co.
yes 1000 X 2 L
Minor rilling on slopes of excavation. Significant (40-50 cy) sediment deposited (or not removed during excavation) under bridge and in channel being reworked and moved downstream in high flows. Exposed to sun and algae bloom due to lack of shade. Good example of a site that needed river run gravel placed in stream bed, mulch, and willow planting.
Mulch bare slopes with native slash and straw (600 ft2). Could plant upstream flats next to creek with 20 willow sprigs to shade creek, hold sediment and put woody debris on silty flats.
231 Luffenholtz Creek
Green Diamond Resource
Co.
yes 1107 X 161 H
Undersized culvert on class 1 stream (resident cutthroat habitat). Fish barrier, potential to plug and erode through large volume of crossing fill. Crossing volume with 50% delivery.
Install 96" x 80' CMP at xing. Mulch 1000 ft2.

Table 3.2. Treatments and Costs for all road assessment sites in the Watershed Assessment area, Trinidad Terraces, CA. Site Information Type of Treatment
Site Watershed Owner-
ship Treat Road Upgrade Decom Maint
Future yield (cy)
Treatment Priority Comments on Problem Comments on Treatment
232 Luffenholtz Creek County No Fox Farm X 7 L
Culvert inlet undercut. Bottom beginning to severely rust. Most likely undersized. Indicators: High rustline, downstream channel incised, culvert diameter less than active channel. Culvert bottom is not rusted thru. Left inboard ditch drains to old skid trail with no erosion or delivery. Left outboard ditch and road drain to 8 inch pipes on both fillslopes. Pipe ends on floodplain. Very little delivery. Right ditches exits road onto slope - heavily vegetated and thick forest litter. No delivery of fines. Lots of fine sediment in channel.
No treatment until culvert rusts out (5+ years).
233 Luffenholtz Creek County yes Westhaven
Drive X 10 H
Two 6 ft x 8 ft concrete box culverts. Large (2 ft wide) gully on fillslope contributing fine sediment to creek from both right and left inboard ditches. Left road downspout drains 420 ft of road with lots of fines directly into creek. On left inboard ditch there are 3 bare bank spots of erosive clays (blue goo). This material will be transported to creek. The three bank area have three bare areas of 60 sqft, 40 sqft, and 480 sqft.
Install 4 cross drains to shorten inboard ditches. Multiple for left ditch. Treat bank failures with erosion control cloth and install sediment control BMPs in ditch. Route downspout on outslope fill away from creek. Rock gullies in fillslope.
234 Joland Creek County yes Westhaven Drive X 104 M
Long inboard ditches are contributing sediment to small creek. During storm events very turbid water running off Old Wagon Road and into east ditch of Westhaven Drive running ~ 1000 ft into stream. Culvert bottom rusting thru - culvert near end of life.
Replace culvert with 36" x 50' CMP. Install 2 cross drains to catch sediment before stream. Pave entrance to Old Wagon Road (Site 245).

Table 3.2. Treatments and Costs for all road assessment sites in the Watershed Assessment area, Trinidad Terraces, CA. Site Information Type of Treatment
Site Watershed Owner-
ship Treat Road Upgrade Decom Maint
Future yield (cy)
Treatment Priority Comments on Problem Comments on Treatment
235 Joland Creek County yes 8th Avenue X 5 M
Culvert drains 300+ of ditch from 8th Ave. and 200 ft from Westhaven Dr. Deposition from eroded road bank and ditch wall at inlet. Direct delivery to Joland creek 30 ft away from outlet.
Inboard ditches are well vegetated and need no treatment. A sediment catch basin - with routine maintenance - would keep 2-3 cy of sediment form direct delivery to Joland creek. Sediment basin should be placed on northeast corner of 8th and Westhaven Drive. Clean culvert.
236 Luffenholtz Creek
Private Road
Association yes Old Wagon
Road X 8 L
700-800 ft of inboard ditch on both sides of road to the right of the crossing entering creek. Last 200 ft is steep (15%) and is lined with erosion control fabric and large rock (8-12 inch). North ditch goes directly to creek. South ditch is diverted off road 100 ft before crossing onto rocked gully leading to stream. Still some delivery to creek. Turbid during storm events. Minor delivery from dust.
Install cross drains and downspout at top of steep section to shorten ditch. Create sediment infiltration/catchment basin near creek to catch sediment from 200 ft of 15% slope. Clean culvert. Paving 600 ft thru crossing and up steep are is best option. This option would cost ~ $56,000. Tributary to Luffenholtz Ck.
237 Luffenholtz Creek
Private Road
Association yes Old Wagon
Road X 1 L
2 Long ditches to right of road contribute sediment to creek. Road rock is pulverized and full of potholes indicating water ponding on road at site. Not sure if stream connects to Luffenholtz creek.
Shorten ditches thru diverting ditch off road before crossing. Clean culvert. Re-rock or pave section of road.
238 Joland CreekPrivate Road
Association No Railroad X 0 L
Culvert in fair condition. Undersized for stream. 4 inch pipe below "822 8th" sign delivers left ditch to crossing. Could not locate end. Houses at outlet may contribute sediment to creek.
No treatment. Rocked road in good condition. Shallow slope. No evidence of sediment contribution. Replace with larger culvert (36" - 48") when needed.

Table 3.2. Treatments and Costs for all road assessment sites in the Watershed Assessment area, Trinidad Terraces, CA. Site Information Type of Treatment
Site Watershed Owner-
ship Treat Road Upgrade Decom Maint
Future yield (cy)
Treatment Priority Comments on Problem Comments on Treatment
239 Two CreekPrivate Road
Association yes Ox Road 0 L
Unable to access site - could not measure pipe. Small tributary ponds ~ 120 ft North of sites on east side of roads. Seeps thru road to West side. No sign of cross drain at site. Possibly Humboldt Crossing. Diversion potential. Drains to Two Creeks Watershed.
No Treatment. Installing critical dip would be great for diversion, but would adversely affect traffic on steep hill. Low flow crossing.
240 Two CreekPrivate Road
Association yes Ox Road X 7 L
Small swale ponding at road. Possible Humboldt crossing. road. Diversion potential to site 239 120 ft down road. Drains to Two Creeks Watershed.
Install culvert. While there is no evidence of past failure, significant ponding in July indicates a drainage structure in needed.
241 Luffenholtz Creek County yes Scenic
Drive X 3 L
A seep along the right wing wall at inlet is transporting fine sediment to stream. Left inboard ditch is routed directly to stream via culvert. Could not find end of right ditch pipe.
Clear vegetation and rock seep. Install a cross drain on either side of Luffenholtz creek to shorten inboard ditch.
242 Joland Creek County yes Scenic Drive X 3 L
Left ditch transporting fine sediment to stream. 4 ft drop at outlet onto rock.
Rock last 20 ft of ditch. Install cross drain 90 ft uproad (past parking area) to reduce ditch length and drain seep. Ditch well vegetated. Install downspout to shotgun outlet. No critical dip, paved road.

Table 3.2. Treatments and Costs for all road assessment sites in the Watershed Assessment area, Trinidad Terraces, CA. Site Information Type of Treatment
Site Watershed Owner-
ship Treat Road Upgrade Decom Maint
Future yield (cy)
Treatment Priority Comments on Problem Comments on Treatment
243 Joland CreekPrivate Road
Association yes 8th Avenue X 10 H
Contributing ditch on both sides of road left of culvert. Gully connects left inboard ditch to stream by surface flow path. Both ditches and road surface gullies extending 500 ft. east are contributing sediment directly to Joland Ck. Very turbid during storm events. Low grade and vegetation minimizes sediment delivery from right inboard ditch. Plus road is slightly outsloped. Thick layer of fine dust in inlet basin and light dust layer in outlet basin. This would cause high turbidity in first flush. Dust layer covers ~ 1000 sqft.
Install cross drains to catch left inboard and outboard ditch before creek. Pave 700 ft of road thru stream crossing to reduce dust. If paved and crowned, install cross drain for right ditch.
244 Joland Creek County yes Westhaven Drive X 3 M
Long inboard ditches delivers fine sediment directly to creek. Lots of fine sediment in channel. Fillslope failing into inlet of creek.
Install sediment basin on north side of Eighth ave. Install cross drain for left ditch along Westhaven Dr. (Site 235). Rock fillslope to prevent sediment entering inlet.
245 Joland Creek County yes Old Wagon Road X 37 H
During storm events, extremely turbid water running off Old Wagon Road and into east ditch of Westhaven Drive running ~ 1000 ft into stream at site 234.
Pave ~ 500 ft of entrance to Old Wagon Road.
301 McConnahas Mill Creek
Green Diamond Resource
Co.
yes 1900 X 150 L Diversion potential due to plugged inlet (40%); exposed cut banks and clogged ditch on road left of crossing.
Clean culvert inlet. Install critical dip, keep inlet clean, open ditch to left.
302 McConnahas Mill Creek
Green Diamond Resource
Co.
yes 1600 spur X 8 L
Soft, erosive soils; gully at outlet of class 3 stream xing. Road is un-mulched, bare and looks like potential turbidity issue. Looks like road was bladed to keep open berms at OBR 75-100' either side of xing.
Mulch road surface - either with straw or slash - slash is readily available from clearcuts - could be chipped or spread and walked in to keep it drivable. Scraping off veg to keep road open exposes erosive soils - need to keep the mulch.

Table 3.2. Treatments and Costs for all road assessment sites in the Watershed Assessment area, Trinidad Terraces, CA. Site Information Type of Treatment
Site Watershed Owner-
ship Treat Road Upgrade Decom Maint
Future yield (cy)
Treatment Priority Comments on Problem Comments on Treatment
303 McConnahas Mill Creek
Green Diamond Resource
Co.
yes 1600 X 8 H Undersized/ rusted 18" CMP; plugged 10% at inlet. Install 24" x 40' CMP at xing.
304 McConnahas Mill Creek
Green Diamond Resource
Co.
No 1600 X 0 L Wetland drains thru 18" plastic pipe to class 3 stream below. No treatment.
305 McConnahas Mill Creek
Green Diamond Resource
Co.
No 1013 spur X 0 L
Pulled xing with decommission road covered in native slash/mulch. Good native reveg - seedlings of alder, redwood, baccharis, salal doing well. No treatment.
306 McConnahas Mill Creek
Green Diamond Resource
Co.
No 1013 spur X 0 L
Surface lowering rate: 0.1ft/decade w/gullies. Large ruts in banks of pulled xing from a large machine, but this channel is not well defined and is a series of low spots with sedge and juncus, and high spots with lots of wood and vegetation.
No treatment. Minor erosion but not delivering, also no access.
307 McConnahas Mill Creek
Green Diamond Resource
Co.
yes 1000 X 1 L Minor rilling on all four approach slopes.
Mulch 200 ft2 of approach slopes to prevent future erosion.
308 McConnahas Mill Creek
Green Diamond Resource
Co.
yes 1012 spur X 3 L
Road drivable in summer by quad. Excavated xing. Class 3 headwater erosive soils - mulched xing but not approaches - significant sheet erosion until it re-veg but no delivery to stream system.
Mulch 2400 ft2 of road with slash or straw to reduce sheet erosion (should do upon excavation but no delivery to stream system so more of a topsoil saving than water quality benefit).
309 McConnahas Mill Creek
Green Diamond Resource
Co.
No 1012 spur X 0 L Headwall swale. Minor amount of fill in xing, abandoned road, re-vegetated with good ground cover. No treatment

Table 3.2. Treatments and Costs for all road assessment sites in the Watershed Assessment area, Trinidad Terraces, CA. Site Information Type of Treatment
Site Watershed Owner-
ship Treat Road Upgrade Decom Maint
Future yield (cy)
Treatment Priority Comments on Problem Comments on Treatment
310 McConnahas Mill Creek
Green Diamond Resource
Co.
yes 1012 X 6 H Fill crossing. Entire road bed is rutted with major gullying. Infrequent cross drains. Totally bare road surface is eroding.
Mulch or rock road surface. Make sure cross road drains are working properly. Excavate fill at crossing and armor approach from both sides to construct an armored ford crossing.
311 McConnahas Mill Creek County yes Scenic
Drive X 5 M
6 ft x 6 ft concrete box culvert. Large gully form left ditch and seep contributing sediment to creek 40 ft upstream of culvert. Lower right ditch concrete lined. Room for siltation pond near crossing. Outboard berm drains ~ 100 ft of left road exiting into creek. This downspout also drains 40 ft of right outboard ditch. Another downspout 40 ft to right drains 200-300 ft of road surface.
Armor ~ 200 ft of gully with rock from top of fill down to stream. Install cross drain 200 ft south of creek (near house 170) to reduce ditch length. Any closer to stream would direct flow onto private driveway. Right ditch well vegetated - no treatment. Install energy dissipaters on downspout. This contributes very little sediment but delivers road chemical with first flush.
312 McConnahas Mill Creek County yes Westhaven
Drive X 2 M
Downspout on outslope fill draining the center of crossing ends at midslope with disconnected section ending in stream. Right ditch enters downspout stretching 1/3 of fillslope turning into a gully which runs to creek causing small bank failure. Culvert bottom cemented. Left ditch has created long gully that connects to creek. Culvert complete fish barrier. There is a flexible 8 inch pipe which drains the outside edge of road for 100 ft. No erosion. Uproad outboard ditch collects 200 ft of runoff and is causing large gully. Unsure if gully connects to stream.
Install 2 cross drains near road fill to shorten ditches. Rock gullies (both sides) from ditches. Right gully is ~ 100 ft and left gully is ~ 150 ft. Rock 75 ft of fillslope gully caused by outboard ditch. Redirect center downspout - though no good location - could cause gully.

Table 3.2. Treatments and Costs for all road assessment sites in the Watershed Assessment area, Trinidad Terraces, CA. Site Information Type of Treatment
Site Watershed Owner-
ship Treat Road Upgrade Decom Maint
Future yield (cy)
Treatment Priority Comments on Problem Comments on Treatment
313 McConnahas Mill Creek County yes Westhaven
Drive X 37 H
Horse corral at intersection of Ravens Ridge Rd and Westhaven Dr. drains directly onto Westhaven Dr. and flows 500 ft. directly into McConnahas Ck. Health hazard from horse manure as well.
Need access to private land for full prescription. Install sediment basin on Northeast side of pasture where there is room for sediment and horse waste to settle out.
401 Mill Creek
Green Diamond Resource
Co.
No 1900 X 0 L Headwall swale and ditches through 18" CMP develops into class 3 stream below road is part of Mill Ck tributary. No treatment
402 Mill Creek
Green Diamond Resource
Co.
yes 1900 X 223 M Inlet plugged with woody debris.
Clean out woody debris in inlet areas.
403 Mill Creek
Green Diamond Resource
Co.
yes 1900 X 497 L Inlet 30% plugged with woody debris. Clean ditches and inlet.
404 Mill Creek
Green Diamond Resource
Co.
yes 1900 X 11 L
Class 3 stream, 18" x 60' CMP, rusty at outlet with holes in it; diversion potential down left ditch; minor erosion on cutbank and in ditch. Future erosion: 9 cy cutbank, 2 cy ditch. Install critical dip at left hinge
405 Mill Creek
Green Diamond Resource
Co.
yes 1900 X 193 L Inlet 15% plugged with plants debris - diversion potential.
Clean inlet. Install critical dip. Encourage cut banks to revegetate.
406 Mill Creek
Green Diamond Resource
Co.
yes 1900 X 234 L
Small amount of woody debris in inlet area (~5%). Diversion potential down ditch to site 405, then to 404. Ditch relief culvert up road 300 ft can plug and divert here + 400 ft more ditch above DRC.
Clean out woody debris in inlet area and construct critical dip and encourage reveg of cut bank with Whipplea modesta.

Table 3.2. Treatments and Costs for all road assessment sites in the Watershed Assessment area, Trinidad Terraces, CA. Site Information Type of Treatment
Site Watershed Owner-
ship Treat Road Upgrade Decom Maint
Future yield (cy)
Treatment Priority Comments on Problem Comments on Treatment
407 Mill Creek
Green Diamond Resource
Co.
yes 1900 X 6 L
Headwall swale is captured in inboard ditch and water travels down road in inboard ditch and leaves road in Maple Creek watershed.
Install 24" x 60' CMP at channel grade. Install critical dip on left hinge. Excavate top to bottom. Mulch 2000 ft2 of exposed cutbank.
408 Mill Creek
Green Diamond Resource
Co.
yes 1900 X 89 L 18" CMP at Headwall Swale. Diversion potential. 200 ft exposed/bare cut bank.
Install critical dip 30 ft left of pipe where road is less steep to prevent diversion.
409 Mill Creek
Green Diamond Resource
Co.
yes 1600 spur X 180 H
Abandoned road with 100% plugged Humboldt xings at site 409 and 410. Long steep ridge road connecting up to the 1900 road. Large rills and small gullies much of the way due to a lack of waterbars and single track/ mtn. bike use. There is more fill (several 100 more cy in the draw to north, no discernible crossing).
Pull xing fill and end haul up spur to south and out to large flat area away from creeks, springs, and wetlands. Cover spoils with slash mulch. Be sure to pull fill from 2nd draw (to north of site 409).
410 Mill Creek
Green Diamond Resource
Co.
yes 1600 spur X 42 H Undersized, rusted culvert 30% plugged at inlet in mainstem class 2 stream.
Install 48" x 50' CMP at xing. Mulch as needed. Water bar road in both directions.
411 Mill Creek
Green Diamond Resource
Co.
yes 1600 spur X 40 H
Steep road with single track rut - 100' x 0.7' x 0.5' on left approach. Humboldt crossing, channel deeply incised and filled up and downstream, possible skid road. Now downcutting through filled channel.
Remove fill from Humboldt xing - about 40-60' channel length by 30' wide at top of fill and 6' wide at bottom of channel. Armor upstream and downstream fillslopes. Mulch 2000 ft2.
412 Mill Creek
Green Diamond Resource
Co.
yes 1600 spur X 19 H Major gully through Humboldt Crossing. Install 24" x 50' CMP. Excavate fill.
413 Mill Creek
Green Diamond Resource
Co.
No 1600 spur X 0 M
Abandoned road with Humboldt xing partly removed or eroded - slab bridge for bikers; roads have been used as race course for mountain bikes. Bank erosion likely.
No treatment. Not enough remaining fill to warrant disturbing the mature alder reveg. Maintain as WLPZ.

Table 3.2. Treatments and Costs for all road assessment sites in the Watershed Assessment area, Trinidad Terraces, CA. Site Information Type of Treatment
Site Watershed Owner-
ship Treat Road Upgrade Decom Maint
Future yield (cy)
Treatment Priority Comments on Problem Comments on Treatment
414 Mill Creek
Green Diamond Resource
Co.
No 1600 spur X 0 L
3 streams converge with Humboldt crossing. Cutthroat trout in at least 2 of the creeks - filling all 3 channels to make landing. Largely washed out and revegetated.
No treatment. Area has recovered with 2-3 ft diameter alders; good riparian forest with mature second growth - stream exclusion zone (WLPZ).
415 Mill Creek
Green Diamond Resource
Co.
yes 1700 X 1 L Headwater swale area with fabric and fill, Juncus growing on site.
Remove fabric and fill - reveg with Juncus soil and mulch with slash as needed (~1200 ft2).
416 Mill Creek
Green Diamond Resource
Co.
yes 1700 X 1 L Headwall swale on perimeter fire road around a clearcut with erosive soils. Very low delivery - vegetated headwall swale.
Mulch road (~4500 ft2) and encourage ground cover and shrubs: blackberry, salal, huckleberry, whipplea.
417 Mill Creek
Green Diamond Resource
Co.
yes 1000 X 1 L
Sloppy job done when armoring headwall. Needs a critical dip. Outlet 5% plugged with gravel. Diversion potential.
Install critical dip. Rebuild headwall rock armoring. Clean outlet area.
418 Mill Creek
Green Diamond Resource
Co.
yes 1700 X 2 L
Erosive soils, infrequent cross drain, lack of woody debris and mulch. Some fill still in crossing. Placed log for mountain bike crossing; mostly reclaimed its old channel dimensions.
Install water bars every 50'. Mulch 12400 ft2 of road - 420' right approach and 200' left. Mulch with slash and close road to allow reveg; straw and waterbar entire road.
419 Mill Creek
Green Diamond Resource
Co.
No 1000 X 0 L Road related sediment runoff down all 4 ditches to bridge site. Total future yield is minor (< 5 cy)
No treatment. Excellent bridge installation and bank armor. Alders and native veg coming in; some pampas grass; road ditches were disconnected 300' before site and last 300' of ditches is rock lined. Maintain road.
420 Mill Creek
Green Diamond Resource
Co.
No 1700 spur X 0 L Crossing 80% excavated, some fill left on upstream banks as well as in channel. No tree reveg on road surface.
No treatment. Could plant trees to encourage re-growth of road surfaces.
421 Mill Creek
Green Diamond Resource
Co.
No 1700 spur X 0 L
Excavated class 3 stream crossing 80% excavated - fill left in crossing but low gradient, low erosion potential. Total past yield (cy): miniscule. No treatment.

Table 3.2. Treatments and Costs for all road assessment sites in the Watershed Assessment area, Trinidad Terraces, CA. Site Information Type of Treatment
Site Watershed Owner-
ship Treat Road Upgrade Decom Maint
Future yield (cy)
Treatment Priority Comments on Problem Comments on Treatment
422 Mill Creek
Green Diamond Resource
Co.
yes 1700 spur X 4 L Outlet 10% plugged with sediment. Minor road rilling and bare road surface.
Rock road surface or mulch 2000 ft2.
423 Mill Creek
Green Diamond Resource
Co.
yes 1700 spur X 10 L
Steep grade into a cross-road drain, fill in a headwater swale area. Delivery probability small as there is lack of defined channel downslope for some distance.
Rock road approach and mulch 3000 ft2 of bare soil areas.
424 Mill Creek County No Stage Coach X 0 L Cross drain discharging into
old stream channel. No treatment. No delivery.
425 Mill Creek County No Stage Coach X 0 L
Ditches are long and drain many seeps. Ditch well vegetated with little to no sediment delivery. Strange orange material seeping out of bank - most likely iron loving bacteria. Another culvert 50 ft upstream.
No treatment. 1.5 - 2 ft aggradation above inlet. Trout present in late august.
426 Mill Creek County No Trinidad Frig X 0 L
Ditches drain to cross drain which extend to culvert inlet. Direct delivery. Floor of metal wingwall extensions rusted.
No treatment. Ditches mainly drain road surface. No cost effective alternatives except directing water onto hillslope above creek.
500 Dead Man Gulch
Green Diamond Resource
Co.
yes 1012 X 5 M Bare road surface. Partially excavated crossing still has a small amount of fill remaining. Major gullying in road.
Install and maintain cross road drains. Excavate remaining fill, armor crossing if needed. Mulch entire road surface (~2000 ft2).
501 Deadman Gulch County yes Westhaven
Drive X 1 L
6 ft x 6 ft concrete box culvert. Outlet drop is onto concrete apron. Low fines content in channel. Road is outsloped with downspout, could not find outlet. No sign of gully erosion.
Rock outlet of 12 inch culvert on right hillslope. Low connectivity of right and left inboard ditch to stream.
502 Deadman Gulch County yes Westhaven
Drive X 2 M Culvert bottom rusted thru and gone. Outlet 15% plugged.
Replace culvert with 24" x 30' CMP. Culvert bottom is rusted thru and is starting to erode fill.

Table 3.2. Treatments and Costs for all road assessment sites in the Watershed Assessment area, Trinidad Terraces, CA. Site Information Type of Treatment
Site Watershed Owner-
ship Treat Road Upgrade Decom Maint
Future yield (cy)
Treatment Priority Comments on Problem Comments on Treatment
503 Deadman Gulch County yes Scenic
Drive X 0 L
60 inch x 52 inch concrete box. Large boulder 2 ft in front of inlet blocking flow. Stream modified by road. Loose soil for 40 ft on streambank between road and stream. Area is unofficial parking for Baker Beach.
Remove boulder. Level, gravel or pave pullout. Install berm between road and creek. No critical dip, paved road.
600 Unnamed County yes Westhaven Drive X 50 H
Stream flows thru Cheri-Heights Casino. Bottom of CMP is rusted thru at inlet but eventually enters pipe. Large pond behind inlet due to culvert elevation and boards placed at invert. Logs placed across road and creek trapping fine sediment. Pond water very turbid. Lots of fine sediment at stored in pond and lower channel. Even with storage behind logs, high delivery of fines in higher flows. Shotgun outlet creating a turbid outlet pool. Outboard ditch 450 ft long and causing fillslope gully. Connected at higher flows.
Unable to identify fine sediment source upstream of culvert. Add downspout at outlet and rock. Perched inlet is creating a sediment basin and storing sediment for the time being. Culvert will need to be replaced in the next 5-10 years. Rock gullies on upstream and downstream fillslopes. No critical dip, paved road.
700 Parker Creek County yes Westhaven Drive X 3 L
Left and right inboard ditch has eroded gully down to creek. Minor erosion. Vegetation and forest duff provide some filtering. Outlet pool has high turbidity.
While there is vegetation and duff to filter fines in fillslope gullies - light rocking of gullies on fillslope is needed. Install 2 cross drains to shorten ditch lengths.
701 Parker Creek County yes Westhaven Drive X 15 M
Bottom of inlet and outlet are rusted thru and gone. Middle section is still present but still rusted thru. Long left inboard ditch.
Install 60" x 60" CMP. Wait to install critical dip when road is upgraded. No place to install cross drain to shorten left ditch.

Table 3.2. Treatments and Costs for all road assessment sites in the Watershed Assessment area, Trinidad Terraces, CA. Site Information Type of Treatment
Site Watershed Owner-
ship Treat Road Upgrade Decom Maint
Future yield (cy)
Treatment Priority Comments on Problem Comments on Treatment
702 Parker Ck County yes Scenic Drive X 1373 M
Confluence with large side channel downstream of outlet. Side channel drains Murphy's Market parking lot and unknown channel beyond. Culvert rusted thru before outlet draining water thru fill and eroding fill material. Side channel has surface flow in mid-august. Direct sediment and road chemical contribution to stream. Runoff form parking lot filtered thru ~ 50 ft of grass. Some fill erosion from drainage.
Install 60' x 100" culvert. Thru fill flow is eroding fill and depositing sediment in downstream channel. Chronic erosion. Neither ditch is contributing sediment to creek. Right ditch is paved ~ 75 ft. Right ditch could be shortened 125 ft below intersection with Main street. If culvert is not replaced, clean culvert.
703 Parker Creek County yes Scenic Drive X 2 L
Seep on left bank causing small gully to inlet. Little sediment delivery. Left inboard ditch connected to stream via not well formed gully. Forest duff filters flow. Minor delivery of fines with large flows. Cement berm on outboard edge of road directs ~ 250 of road surface flow to downspout down fillslope to creek. Runoff does jump berm 100 ft from culvert causing gully.
Rock (6-10 inch diameter) 10 ft of steep infill slope where inboard ditch exits road. Install downspout on outfill slope where ditch runoff exits road. Redirect outfill downspout to deposit runoff away from creek.
704 Parker Creek Private yes Quarry Road X 15 H
Large quantity of sediment is seeping out of dirt pile/ground at local parking area adjacent to quarry. Seep is coming from large spoils pile in the Mercer Frazier quarry. Spoil pile is oversteep and is sliding downslope depositing sediment into the quarry. After leaving quarry, sediment travels 100 ft. by road/ditch to cross drain and then forest. From looking at sediment plume at the scenic drive crossing, the sediment is connecting to Parker Creek.
Large spoils pile needs to be modified to reduce slope and surface erosion BMPs applied. Modify existing drainage patterns of quarry. Need to confer with quarry operator and adjacent landowners for final treatment prescription.

Table 3.2. Treatments and Costs for all road assessment sites in the Watershed Assessment area, Trinidad Terraces, CA. Site Information Type of Treatment
Site Watershed Owner-
ship Treat Road Upgrade Decom Maint
Future yield (cy)
Treatment Priority Comments on Problem Comments on Treatment
801 Two Creek Private NoOld
Railroad Grade
X 105 L
Old Humboldt crossing where Railroad Grade crossed 2 Creeks at abandoned trestle - two old pilings from trestle remain. ~ 7 logs at right angle to creek, creek goes under logs, 2 large logs parallel to creek. About 105 cy stored above channel. Small amount of fill remains on logs. Well revegetated, private access on both sides of creek. Old dump site with old cars, refrigerator. A few pockets of soil remain and will slowly meter out over time (10 to 20 years).
No treatment. If old Humboldt xing is removed, there is ~ 90 CY of sediment stored in creek that would need to be removed or stabilized by using crossing logs to create check dams, which is what they are functioning as now.
802 Two CreekPublic Access
Easement yes Transit X 5 M
~ 100 ft. of road (60' left, 40' right) draining to middle of xing. Ponded water exits on upstream fillslope causing gully erosion - direct delivery. Culvert old but no holes - OK condition. If water bars fail, ~500 ft of road will drain to site. Fill remains of old Humboldt xing 20' below xing. Potential for 20 cy of fill potential to deliver to stream.
Outslope 200' of road through xing. Rock with 50 cy of crushed shale. Install 2 rolling dips (4 total) on either side of xing 40 ft from center and 100 ft from center.
803 Two Creek County yes Westhaven Drive X 15 L
Channel incised for 40' above inlet. A few small erosional features (5 cy) along bank. Long right ditch drains into crossing. Heavy vegetation may filter some sediment. Small erosional feature on downstream bank - past erosion 5 cy. Potential diversion 800 ft to scenic drive.
Install trash rack. Direct left ditch into north fork two creeks shortening ditch to 250 feet. Rock exit point on north fork (6x10' area). Treat uproad site at north fork Two creeks at Westhaven Dr.
804
Two Creek State No Highway 101 X 0 L
25' concrete trough at outlet leading into site 805 under Scenic Drive. South Fork and North Fork converge at inlet. Concrete headwall. Winzler and Kelly should have ditch data. No Treatment

Table 3.2. Treatments and Costs for all road assessment sites in the Watershed Assessment area, Trinidad Terraces, CA. Site Information Type of Treatment
Site Watershed Owner-
ship Treat Road Upgrade Decom Maint
Future yield (cy)
Treatment Priority Comments on Problem Comments on Treatment
805 Two Creek County yes Scenic Drive X 2 L
Old trash rack needs replacing. 20' concrete trough from Highway 101 outlet to inlet. 50' gully on infill slope from ditch.
Install trash rack for woody debris and safety. Rock gully with 2 cy of rock.
806 Two Creek Private yes Osurg Lane X 66 L
36" diameter concrete culvert. Pipe changes angle midway. Two pieces to culvert: Lower half - 0% slope, upper half 5% slope. Joint overlaps - plug potential. Install 48" x 40' CMP.
807 Two Creek Private yes Osurg Lane X 1 L
36" concrete pipe - two pieces with different grades. Bottom half is steeper. Overflow culvert adds capacity - probably big enough. Add trash rack. Install rolling dip.
808 Two Creek Private yes Trump/ Osurg Lane X 4 L
Right ditch near DRC uproad. DRC from Scenic Drive drains to culvert under driveway, then forms gully down fillslope to creek. Scenic Drive DRC is 102' from Trump Drive. Downspout from Scenic DRC saturating slope. Low potential for hillslope failure (DRC drainage goes subsurface). 25 ft long cascade ~ 25% slope. Shotgun Outlet.
Rock gully on fillslope from DRC 400' uproad from site 808. Rock 20'x1'x0.5'
809 Two CreekPublic Access
Easement yes Spruce
Avenue X 10 L
Wet/ marshy area near headwaters of creek. Long ditch line from right drains horse pasture. Native surface on road. Channel downstream is silted and creek goes subsurface. Not driven on very often - mainly used as a trail.
Work with Landowners on disconnecting drainage from horse pasture to from ditch leading to stream. Rock included in price.
810 Two CreekPublic Access
Easement yes
Old Railroad Grade
X 0 M
CMP on top of old Humboldt crossing. CMP ~5' above channel bottom, 2' in front of inlet is Large woody debris 100% blocking inlet. Large quantities of trash at base of fill. Outlet is 50% plugged. Humboldt xing transfers most water.
Remove Large woody debris at inlet and outlet of culvert. Clear trash at bottom of outlet berm. Need chainsaw crew.

Table 3.2. Treatments and Costs for all road assessment sites in the Watershed Assessment area, Trinidad Terraces, CA. Site Information Type of Treatment
Site Watershed Owner-
ship Treat Road Upgrade Decom Maint
Future yield (cy)
Treatment Priority Comments on Problem Comments on Treatment
811 Two CreekPublic Access
Easement yes Railroad
Avenue X 10 M
New 24" x 20' plastic pipe installed during timber harvest in the mid 1990s. Road was left open but not rocked. 100' of earth on each side feed down to ruts and into creek, eroding upstream of crossing (8'x3'x1'). Creek is subsurface 30' up and 30' downstream.
Rock 200 of road (200'x10' x 6"). Install 2 rolling dips - one on either side of xing ~ 50 ft. from right crossing, ~25 ft. from left crossing.
812 Two CreekPublic Access
Easement yes Railroad
Grade X 2 L
18' CMP with pond upstream, controlled by 3" diameter pipe trapping sediment. Bend at mid-pipe with lower half at a steeper grade. 40' x 25' pond. Road drainage drains above culvert directly into creek. Road bed is old RR Grade and is built much higher than adjacent ground.
Eliminate drains immediately over creek - install drains 50' to either side of crossing. Berm up both edges of road to direct drainage away from creek so it can filter through vegetation before entering creek. Build up road over culvert so it drains away from culvert to allow runoff to filter through veg. Rock 100 ft of road.
813 Two CreekPublic Access
Easement yes 6th Avenue X 31 H
Two stream crossings at site. One on 6th avenue (site 2) and one on an abandoned road (site 1). Outlet undermined and lost 5 cy of fill at site 1. Outlet 85% plugged by 45 gal drum at site 2. 18" CMP, 24" drop at outlet - needs replacement. Trail on 6th avenue heavily used.
Decommission stream crossing on abandoned road (site 1). Replace culvert on 6th ave. (site 2). Rock line critical dip 50' down road.
814 Two Creek Private yes 4th Avenue X 21 H
Road is built adjacent to creek. Horse stables across road 225 ft up left road drains to creek. Road is poorly designed, badly rutted, culvert provides access to parcel on north side of creek. Road parallels creek. Future yield of erosion is 8 cy plus crossing volume and road ruts/ surface. Could convert to trail but this is 4th Ave. and it accesses private property.
Rock road for 225' to left, install 3 rolling dips every 75 feet. Upgrade culvert with 20'x30" CMP set to grade.

Table 3.2. Treatments and Costs for all road assessment sites in the Watershed Assessment area, Trinidad Terraces, CA. Site Information Type of Treatment
Site Watershed Owner-
ship Treat Road Upgrade Decom Maint
Future yield (cy)
Treatment Priority Comments on Problem Comments on Treatment
815 Two CreekPublic Access
Easement yes 4th Avenue X 55 H
Stream confined by road causing extreme downcutting to 4 ' at points. Bridge in poor condition. Long ditch contributing sediment. Fillslope failure 30 ft down road to west is past erosion and needs rock armoring.
Bridge not contributing sediment. Disconnect road with rolling dip every 75 feet for 900 ft. Add crushed rock to road Total of 12 rolling dips will be needed. Rock fillslope failure with 2 cy 1/4 ton rock.
816 Two CreekPublic Access
Easement yes 3rd Avenue X 64 H
Road runoff from 600 ft of road discharged over edge, causing landslide that delivered to the North Fork of Two Creeks ~ 150 ft upstream of 2nd Avenue crossing. Old DRC plugged, cutbank has also slumped.
Maintain waterbars up the road to the east. Runoff from Third Avenue needs to be dissipated more frequently. All the drainage from transit has the potential to discharge at this spot which ~100 ft of road.
817 Two CreekPublic Access
Easement yes 2nd
Avenue X 617 H
Site extends from 2nd Ave (site 817) to outlet below Westhaven Drive (site 818). Culvert is buried ~ 10 ft below surface between 2nd Ave and Westhaven Dr. Surface water between the two roads flows into a ~ 10 ft deep downspout into a 24" CMP that extends under Westhaven Dr. (site 818). The outlet of this pipe is perched10 ft above the stream. Scour at outlet arrested by boulder channel. The concrete pipe from site 817 exits at the outlet of site 818 at stream level. The stream flow is split between the two pipes. Inadequate trash rack. Evidence of past overtopping of inlet above 2nd Ave (site 817).
Install 72" x 80' CMP. Rock Add trash rack. Rock lower fill slope and mulch.

Table 3.2. Treatments and Costs for all road assessment sites in the Watershed Assessment area, Trinidad Terraces, CA. Site Information Type of Treatment
Site Watershed Owner-
ship Treat Road Upgrade Decom Maint
Future yield (cy)
Treatment Priority Comments on Problem Comments on Treatment
818 Two Creek County yes Westhaven Drive X 1975 H
See site 817. Site extends from 2nd Ave (site 817) to outlet below Westhaven Drive (site 818). Culvert is buried ~ 10 ft below surface between 2nd Ave and Westhaven Dr. Surface water between the two roads flows into a ~ 10 ft deep downspout into a 24" CMP that extends under Westhaven Dr. (site 818). The outlet of this pipe is perched10 ft above the stream. Scour at outlet arrested by boulder channel. The concrete pipe from site 817 exits to the left of the outlet of site 818 at stream level. The stream flow is split between the two pipes. Inadequate trash rack. Evidence of past overtopping of inlet above 2nd Ave (site 817). Westhaven Drive culvert plugged and blew out in early 1950's; one house was damaged and had to be demolished.
Remove existing two culverts and install a 72" x 160' culvert. Remove culvert and soil between sites 817 and 818. Either replace this culvert or create surface creek flow with grade control between sites. Final prescription to be determined at engineering planning stage. Requested funding reflects either option. Rock outfill slope and mulch. Permitting and engineering costs are included on total project costs.

Appendix I:
NPS Management Measure Evaluation Summary

Trinidad Head Critical Coastal Area Preliminary NPS Management Measure Evaluation Summary
June 2006 Vanessa Metz
Non Point Source (NPS) Category: Urban Areas
Extent of Land Use that MM
Addresses
Degree of NPS Issues from Land
Use
Current MM Implementation
Planned to Implement
More
Future MM Priority
Management Measures
0 none ■ low
■ ■ med ■ ■ ■ high N/A or ?
0 none partial
+ full N/A or ?
yes -- no or ?
-- no low med
high + top
Urban Areas ■ ■ ■ ■ ■ 3A. Runoff From Developing Areas 3A.1 Watershed protection 3A.2 Site development, disturbance of
land, drainage, vegetation 3A.3 New development, reduce TSS &
maintain runoff rate/volume
■
■ ■ ■ ■ ■ ■ ■ ■ ■
■ ■ ■
0
3B. Runoff from Construction Sites 3B.1 Erosion and sediment control 3B.2 Chemical control
■ ■ ■ ■
0
-- -- --
3C. Runoff from Existing Development 3C.1 Pollution reduction opportunities 3C.2 Schedule for implementing 3C.3 Natural conveyance systems 3C.4 Buffers along surface waters
■ ■ ■ ■ ■ ■ ■ ■ ■ ■ ■ ■ ■ ■ ■ ■ ■
? ?
-- --
+ +
3D. Onsite Wastewater Treatment Systems
3D.1 New OWTSs 3D.2 Operating OWTSs
■ ■ ■ ■
■ ■ ■
■ ■ ■
■ ■ ■ ■ ■
+
+
3E. Transportation Development 3E.1 Protect areas benefit WQ 3E.2 Bridges, protect ecosystems 3E.3 Construction projects, erosion 3E.4 Chemical control 3E.5 Operation and maintenance 3E.6 Road, highway, and bridge runoff
■ ■ ■ 0 ■ ■ ■ ■ ■
■ ■ ■ ■ N/A ■ ■ ■ ■ ■ ■ ■
N/A ? ? ? 0
-- -- -- -- --
-- -- -- ?
3F. Urban Education/Outreach 3F.1 Urban pollution prevention and
public education
■ ■
■ ■ ■
+

Trinidad Head Critical Coastal Area Preliminary NPS Management Measure Evaluation Summary
June 2006
2
NPS Category: Forestry Extent of
Land Use that MM
Addresses
Degree of NPS Issues from land
Use
Current MM Implementation
Planned to Implement
More
Future MM Priority
Management Measures
0 none ■ low
■ ■ med ■ ■ ■ high N/A or ?
0 none partial
+ full N/A or ?
yes -- no or ?
-- no low med
high + top
Forestry ■ ■ ■ ■ ■ ■ 2A Preharvest Planning ■ ■ ■ ■ + ? 2B Streamside Management Areas ■ ■ ■ ■ ■ ? 2C Road Construction/Reconstruction ■ ■ ■ ■ ■ + 2D Road Management ■ ■ ■ ■ ■ ■ + 2E Timber Harvesting ■ ■ ■ ■ ? 0 ? ? -- 2F Site Prep. and Forest Regeneration ■ ■ ■ ■ + ? -- -- 2G Fire Management 0 N/A N/A -- --
2H Revegetation of Disturbed Areas ■ ■ ■ ■ + -- 2I Forest Chemical Management ■ ■ + ? -- ? -- 2J Wetlands Forest Management ■ ■ ? -- ? -- 2K Postharvest Evaluation ■ ■ ■ ? ? -- -- 2L Forestry Public Education/Outreach ■ ■ 0 -- --
NPS Category: Wetlands, Riparian Areas, & Vegetated Treatment Systems
Extent of Land Use that MM
Addresses
Degree of NPS Issues from Land
Use
Current MM Implementation
Planned to Implement
More
Future MM Priority
Management Measures
0 none ■ low
■ ■ med ■ ■ ■ high N/A or ?
0 none partial
+ full N/A or ?
yes -- no or ?
-- no low med
high + top
Wetlands & Riparian Areas ■ ■ ■ ■ -- 6A. Protection of Wetlands and Riparian
Areas ■ ■ ■ ■ --
6B. Restoration of Wetlands and Riparian Areas
■ ■ ■ ■ --
6C. Vegetated Treatment Systems 0 N/A N/A --
6D. Wetlands and Riparian Areas public Education/Outreach
■ ■ ■ ■ 0

Trinidad Head Critical Coastal Area Preliminary NPS Management Measure Evaluation Summary
June 2006
3
NPS Category: Hydromodification Extent of
Land Use that MM
Addresses
Degree of NPS Issues from Land
Use
Current MM Implementation
Planned to Implement
More
Future MM Priority
Management Measures
0 none ■ low
■ ■ med ■ ■ ■ high N/A or ?
0 none partial
+ full N/A or ?
yes -- no or ?
-- no low med
high + top
Hydromodification ■ ■ ■ ■ 5A. Channelization and Channel
Modification 5A.1 Physical and chemical
characteristics of surface waters 5A.2 Instream and riparian habitat
restoration
■ ■
■ ■
■ ■
■ ■
■ ■
■ ■
5B. Dams 5B.1 Erosion and sediment control 5B.2 Chemical and pollutant control 5B.3 Operation and maintenance
including water quality and habitat assessment
0 N/A N/A -- --
5C Streambank and Shoreline Erosion 5C.1 Stabilize eroding streambanks
and shorelines with vegetation 5C.2 Protect features with potential to
reduce NPS pollution 5C. 3 Protect from erosion caused by
use of shorelands & waters
■ ■
■
■
■ ■
■
0 ?
0
--
--
5D. Hydromod. Education and Outreach 5D.1 Watershed and hydro-
modification public education 5D.2 Promote projects that retain
natural hydrologic functions
■ ■ ■ ■
■ ■
■ ■ ■ ■
■ ■
0 ? 0 ?
0 ?

Trinidad Head Critical Coastal Area Preliminary NPS Management Measure Evaluation Summary
June 2006
4
NPS Category: Marinas and Recreational Boating Extent of
Land Use that MM
Addresses
Degree of NPS Issues from Land
Use
Current MM Implementation
Planned to Implement
More
Future MM Priority
Management Measures
0 none ■ low
■ ■ med ■ ■ ■ high N/A or ?
0 none partial
+ full N/A or ?
yes -- no or ?
-- no low med
high + top
Marinas & Boating ■ ■ ■ ■ 4A. Assessment, Siting, and Design 4A.1 Marina Flushing 4A.2 Habitat Protection 4A.3 Water Quality Assessment 4A.4 Shoreline Stabilization 4A.5 Runoff Control 4A.6 Fueling Station Design 4A.7 Sewage Management Facilities 4A.8 Waste Management Facilities
■
N/A ■ ■
■ ■ ■ ■ ■ ■ ■ ■ ■ ■
■ ■ ■ N/A
■ ■ ■ ? ■ ?
+?
0
0 ? 0
N/A
--
--
?
--
--
? 4B. Operation and Maintenance 4B.1 Solid Waste Control 4B.2 Fish Waste Management 4B.3 Liquid Material Management 4B.4 Petroleum Control 4B.5 Topside Cleaning & Maintenance 4B.6 Maintenance of Sewage Facilities 4B.7 Boating in Shallow-water Habitat
■ ■ ■ ■ ■ ■ ■ ?
N/A N/A
■ ■ ■ ■ ? ■ ? ■ ?
■ ■ ■ ? ■ ■ N/A N/A
?
0 ? 0 ? N/A N/A
--
-- -- -- -- --
?
?
-- --
4C. Education and Outreach 4C.A Boating Public Education/
Outreach
■ ■
■ ■ ■
0
?
?

Trinidad Head Critical Coastal Area Preliminary NPS Management Measure Evaluation Summary
June 2006
5
NPS Category: Agriculture Extent of
Land Use that MM
Addresses
Degree of NPS Issues from Land
Use
Current MM Implementation
Planned to Implement
More
Future MM Priority
Management Measures
0 none ■ low
■ ■ med ■ ■ ■ high N/A or ?
0 none partial
+ full N/A or ?
yes -- no or ?
-- no low med
high + top
Agriculture 0 N/A N/A -- -- 1A. Agricultural Erosion and Sediment
Control 0 N/A N/A -- --
1B. Facility Wastewater & Runoff from Confined Animal Facilities
0 N/A N/A -- --
1C. Nutrient Management 0 N/A N/A -- -- 1D. Pesticide Management 0 N/A N/A -- -- 1E. Grazing Management 0 N/A N/A -- -- 1F. Irrigation Water Management 0 N/A N/A -- -- 1G. Agricultural Education and
Outreach 0 N/A N/A -- --

Appendix J:
Summary of Public Comments

Appendix J: Summary of Public Comments 1 Trinidad-Westhaven ICWMP May 2008
Appendix J: Summary of Public Comments
Public Review Draft Trinidad-Westhaven ICWM Plan February 2008 – April 2008
This appendix summarizes public comment received regarding the Public Review Draft of the Trinidad-Westhaven Integrated Coastal Watershed Management Plan (ICWMP). The draft plan was made available on the City of Trinidad Website, via email, cd-rom, and hard copy by request. In addition, the plan was presented and hardcopy summaries were distributed at the Community Meeting March 19, 2008 and at the Trinidad Bay Watershed Council Meetings February 28 and April 17, 2008. Comments were received orally at the meetings, by phone, by mail and via email. Where possible, the comments have been sorted according to topic.
Water quality and monitoring, (Chapters 2-7, 3-2, 5-3, 6-1, 7-1, 8, & 9) • There needs to be more specified monitoring of the pollution sources. See 2-7, 6-1, 8 & 9. • Development of “bio-indicators” is proposed as part of Objective 1, however there is no
baseline. • Re: p. 97, TMDL Is the County monitoring now or are there plans for this under
development? When will this be done? Plan should clarify this. • Rural Trinidad (north of City) needs an emphasis on identifying the sources of pollution in
order to take action proactively before the State or County steps in. Recommendation: a regional study to figure out where the coli form bacteria are coming from – a primary problem.
• The water pipe on Highway 101 at Westhaven does get tested and has been used as a benchmark in the past. There has been coliform occasionally, but the theory is that is just the pipe outlet that is contaminated up a foot or so and not the groundwater itself.
• Those conducting water quality monitoring should seek permission with the landowner before going on private property. Most residents will be willing to cooperate with monitoring efforts.
• Plan should quantify pollutants in streams with different loads. Little River could be really overwhelming compared to the other streams.
Wastewater & Onsite Wastewater Treatment Systems (OWTS) (Chapters 2-7, 3-2, 5-3) • Private cost of septic services district for Westhaven: The benefits were listed, but not the
disadvantages or financing issues. A septic services district for Westhaven is not currently being proposed, but could be considered in the future. See 6-1 & 7-1.
• No ranch plans are included. There are some horse boarding places. Could these be contributing to the bacteria? We should try to differentiate between human sources, stock/pets and wild animal sources.
• Concern about the wastewater systems of trailer parks. • Not all septic systems need the same standards or upgrades due to variations in conditions • Bacteria & OWTS monitoring results should be shared with stakeholders and available to
the public. See 9-1.

Appendix J: Summary of Public Comments 2 Trinidad-Westhaven ICWMP May 2008
Sediment & Road Issues • Who is going to pay for all the roadwork? See Chapter 10
Groundwater and Water supplies (Chapters 2-6, 3-2, 5-3, 6-1) • Groundwater is not adequately addressed in implementation. Everyone with a well is
concerned with pollution in groundwater. See 6-1. • Water is tight in Westhaven and each new residence can impact the neighbors downstream
or on wells. There is a waiting list for a WCSD hookup and the City has a moratorium on hookups outside the City. See 2-6, 3-2, 5-3, 6-1.
• The water table is very low in Westhaven in the Fall before the rain starts. Storm water • What are the consequences of surface water or stormwater infiltration in new locations?
See Chapter 8. • The potential stormwater projects should be discussed with stakeholders & the public
before sending out grant applications to fund them. Ecosystems & Habitat (Chapter 2-8) • Scenic Drive is a barrier to salmon on Luffenholtz Creek. We want the fish to come back.
See 2-8, 3-2, 5-3, Table 4. • Luffenholtz Creek: Are individual diversions permitted or not? The City requires 1/2
CFS. What is the effect of all these diversions on coastal cutthroat trout? Regional Description (Chapter 2)
• The Tsurai Study Area shown in Figure 7 is incorrect. See Chapter 2-4. • The cultural resources description is not complete. Perhaps there could be an appendix
devoted to cultural resources. See Chapter 2-4. • In the ICWMP there is no information on the marine sciences, bay and biological
resources – when is this going to be looked at? See Chapter 2. Implementation Comments on Chapter 6: Implementation, 6-1: Implementation Projects & Plans: Objective 1: Develop a coordinated and comprehensive water quality monitoring plan…
• Development of “bio-indicators” is proposed as part of Objective 1, however there is no baseline.
Objective 2: Reduce the quantity of bacteria and nutrients introduced to local surface and ground waters from OWTS effluent. Ensure compliance with State Assembly Bill 885.
• Please eliminate Implementation activity 2.3 referring to promoting greater enforcement of county sewage disposal regulations, and replace with one that promotes working with landowners in problem areas to identify and eliminate wastewater pollution, and assisting with funding issues.
Objective 13: Reduce the ecological impacts of recreational and water-related activities on Trinidad Bay. • The use of the language “Reduce the ecological impacts…” seems binding in its intent that
some action must take place regardless of sound scientific data. It would be more appropriate if the language read, “Assess the ecological impacts…” After the impacts are

Appendix J: Summary of Public Comments 3 Trinidad-Westhaven ICWMP May 2008
assessed using sound scientific processes then it can be determined if any actions are needed to reduce impacts or improve water quality.
• Additionally, under Implementation activities: 13.2 should be changed to read, “Assess the need for a management plan for recreational uses…” 13.3 should be changed to read, “Assess water quality impacts of boating on Trinidad Bay…”
Comment on 5: Regional Priorities, 5-3: Priorities for Implementation: Long-Term Priorities: Develop a recreation management plan for Trinidad Bay and its tributary watersheds. • This language seems binding to develop an outcome that may or may not be needed.
More appropriate wording would read “Assess the need for a recreation management plan for Trinidad Bay and its tributary watersheds, with the input and collaboration of other vested stakeholders.”
Stakeholder Involvement (Chapter 13) • It is important to have meetings in the evening so working people can attend. There was
acknowledgement that this is more difficult for stakeholder staff. • Use more maps and charts in meetings and presentations to communicate the problems and
potential solutions clearly & simply. • Not all the appendices were available for public review. There were projects identified in
the Action Plans that should have been available for public review before they were submitted for funding.
Water Conservation & Recycling (Chapter 4-1) • Trinidad Septic Systems – In addition to water conservation, is a reclamation system
possible like the one at the Rancheria? Agency Coordination (Chapter 14) The county and the plan should be more coordinated, especially Environmental Health, Planning, and water supplies. Water supplies in Westhaven are tight, and when the county allows more build-able sites, the downstream residents, or those on wells can be impacted. Issues not addressed in current plan Comments regarding Little River, outside the southern boundary of planning area
o The ICWMP doesn’t address the pollutant contributions of the Little River into the ocean. There were a number of comments on this issue
o Lower down Little River in the agricultural area there are more pollutants – there is a feed lot which is currently closed
o What are the plans for the (cattle) ranch at Little River? In the past there has been a feedlot adjacent to the river and freeway.
o Little River needs a watershed council of its own. • Scenic Drive closure – what are the effects of that? What is going to be done?