Embed Size (px)
Citation preview
Tackling inequality: the distributional impact of implementing Atkinson's alternative tax/benefit reform packages and the Living Wage in the UK
Tony Atkinson1, Chrysa Leventi2, Brian Nolan3,
Holly Sutherland2, Iva Tasseva2
1 LSE, Nuffield College and INET, University of Oxford 2 ISER, University of Essex
3 INET, University of Oxford
EUROMOD 20th. Anniversary Conference, University of Essex September 2016
1
Outline
• “Market-income inequality has been the main driver of inequality trends in disposable incomes, but redistribution policies had a substantial effect as well, especially since the mid-1990s.” OECD Divided We Stand (2011)
• What impact could strengthening direct redistribution by raising income tax and cash transfers have in reducing inequality
– as well as addressing structural failings of transfer system?
• What about addressing market income inequality directly by substantially increasing the Minimum Wage?
• Simulation of proposals set out for UK in Atkinson’s Inequality: What Can Be Done? (Harvard, 2015), of broader strategic relevance
The UK Context
• UK inequality now much higher than in late 1970s
– disposable income Gini up from 0.25 to 0.35
– Market income Gini up even more, from 0.38 to 0.52
• Beveridge structure originally based primarily on social insurance benefits but now heavily means-tested
– 25% of non-pensioners benefit spending in 1970s vs 80% now;
– “the contributory principle plays an increasingly marginal role in the social security system, particularly for those of working age” (IFS)
The Perils of Means-Testing
• Targetting income support by direct means-testing attractive as a way to promote efficiency in tackling poverty, but …..
– Embeds work disincentives and poverty/unemployment traps
– Non-take-up can lead to unmet need
– (Potentially) stigmatising and erodes dignity
Alternative Strategies
• Substantial increase in income tax rates
– to include 55% and 65% rates (current top rate 40%)
– Increase in SI contributions for higher earners
• Substantial increase in Child Benefit
– £90 per week for first child, £48 each for other children (up from £20 and £14);
– child tax credit, housing benefit, council tax benefit reduced by up to amount of increase
– paid for all children (including in high-income families)
– taxable
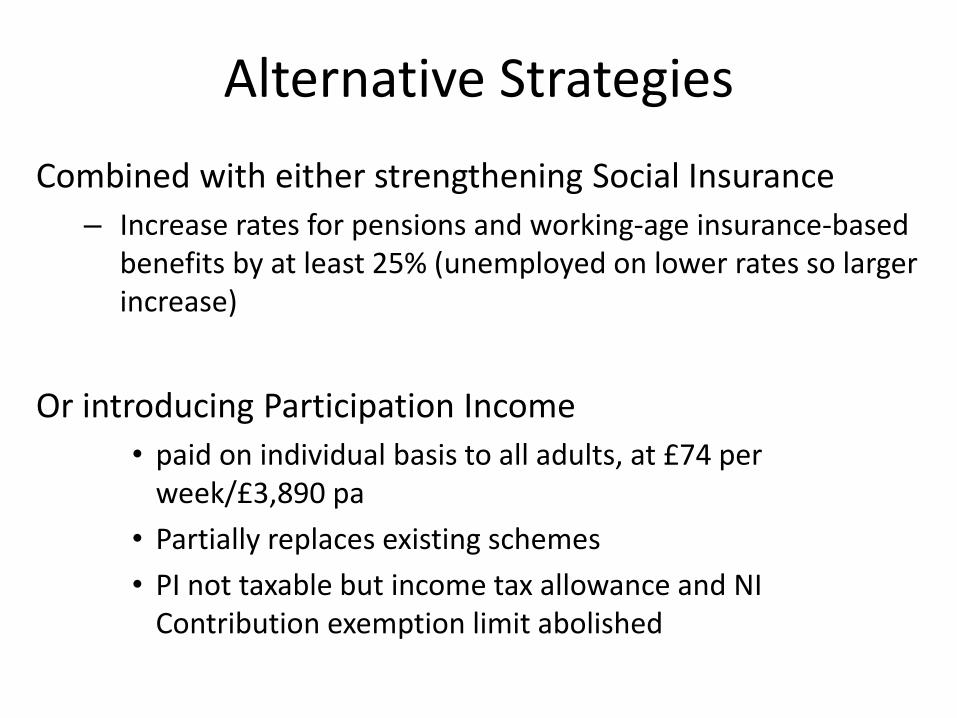
Alternative Strategies
Combined with either strengthening Social Insurance
– Increase rates for pensions and working-age insurance-based benefits by at least 25% (unemployed on lower rates so larger increase)
Or introducing Participation Income
• paid on individual basis to all adults, at £74 per week/£3,890 pa
• Partially replaces existing schemes
• PI not taxable but income tax allowance and NI Contribution exemption limit abolished
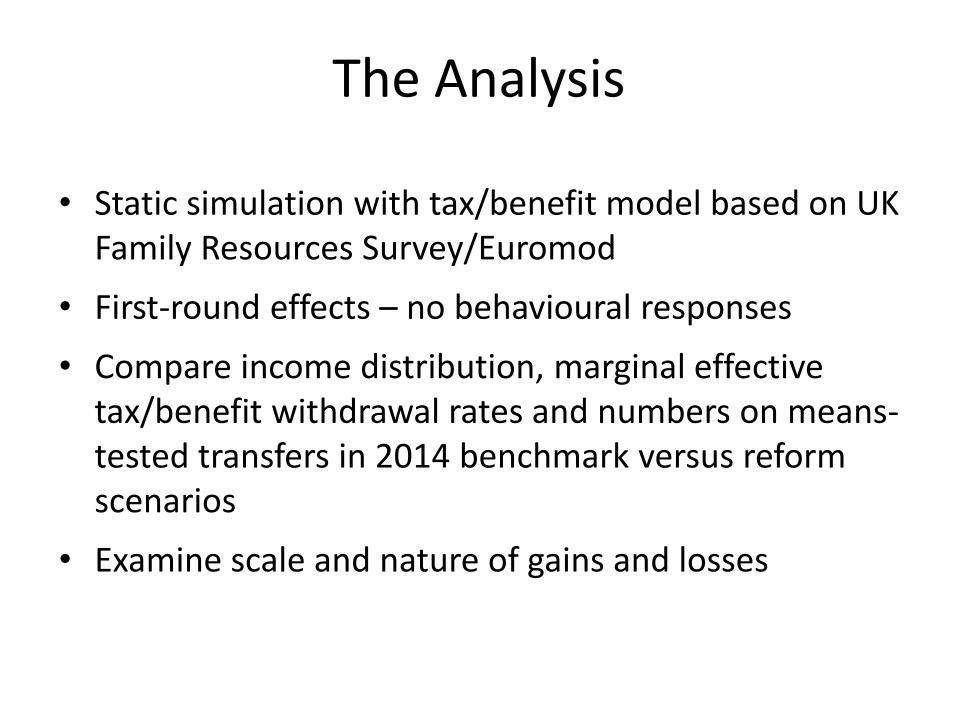
The Analysis
• Static simulation with tax/benefit model based on UK Family Resources Survey/Euromod
• First-round effects – no behavioural responses
• Compare income distribution, marginal effective tax/benefit withdrawal rates and numbers on means-tested transfers in 2014 benchmark versus reform scenarios
• Examine scale and nature of gains and losses
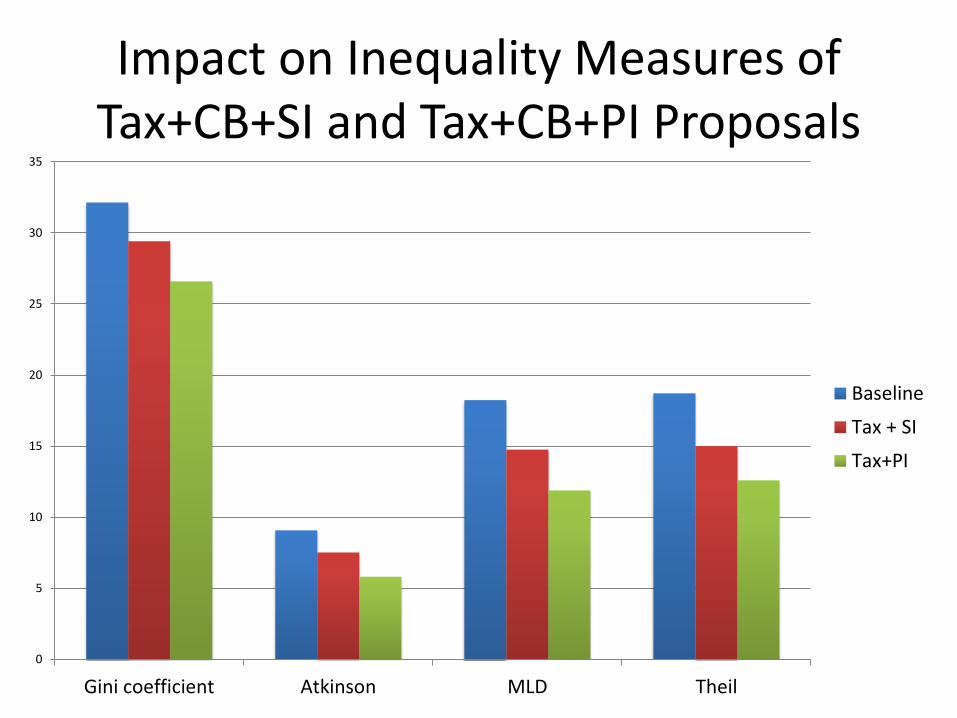
Impact on Inequality Measures of Tax+CB+SI and Tax+CB+PI Proposals
0
5
10
15
20
25
30
35
Gini coefficient Atkinson MLD Theil
Baseline
Tax + SI
Tax+PI
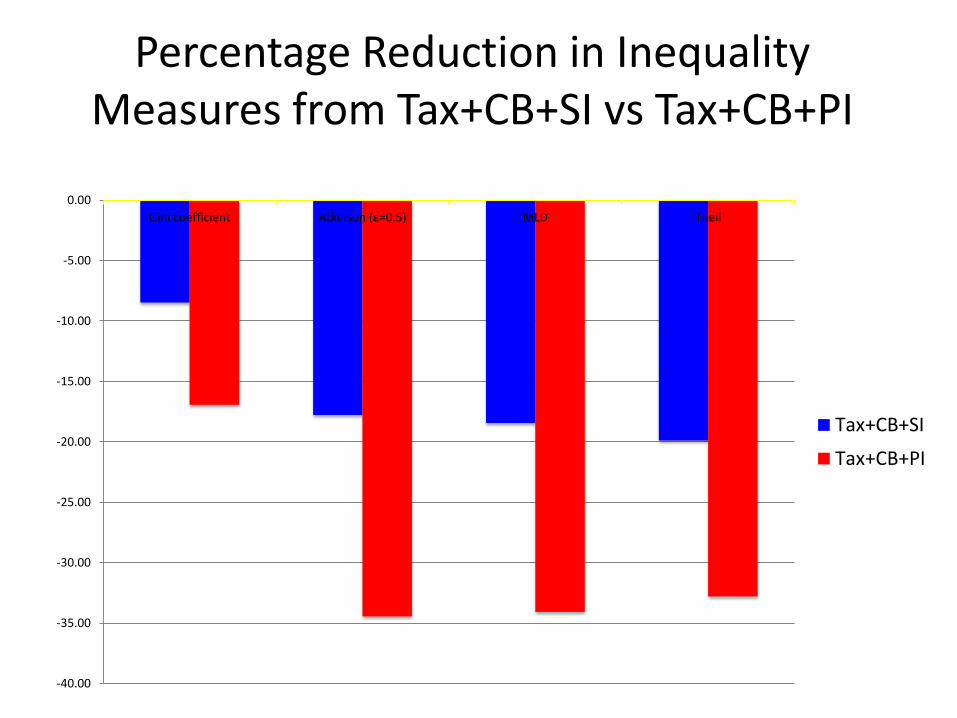
Percentage Reduction in Inequality Measures from Tax+CB+SI vs Tax+CB+PI
-40.00
-35.00
-30.00
-25.00
-20.00
-15.00
-10.00
-5.00
0.00
Gini coefficient Atkinson (ε=0.5) MLD Theil
Tax+CB+SI
Tax+CB+PI
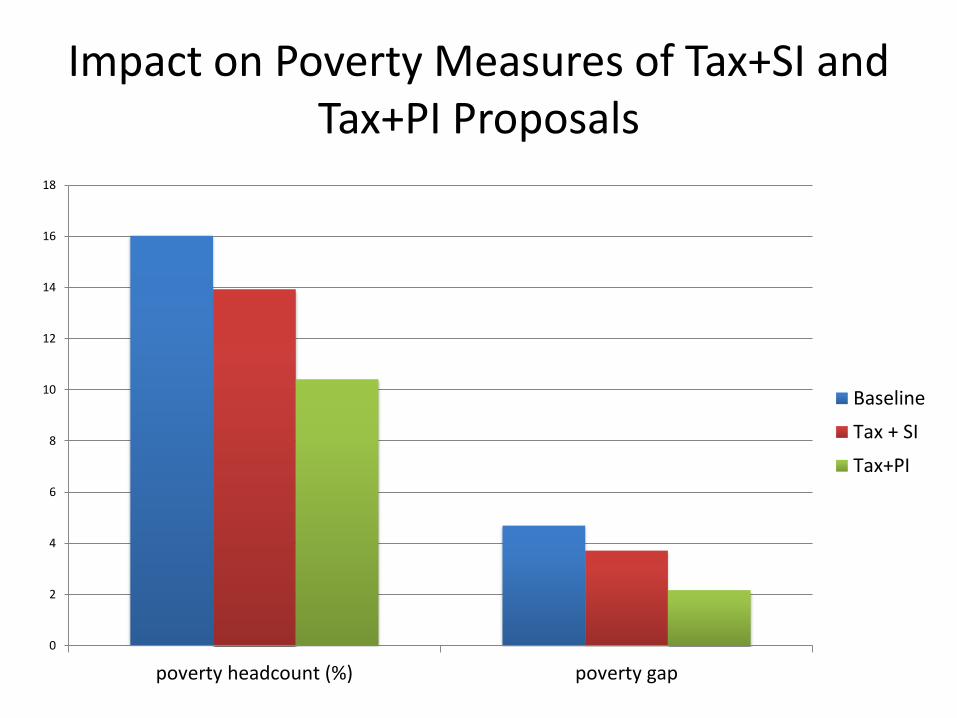
Impact on Poverty Measures of Tax+SI and Tax+PI Proposals
0
2
4
6
8
10
12
14
16
18
poverty headcount (%) poverty gap
Baseline
Tax + SI
Tax+PI
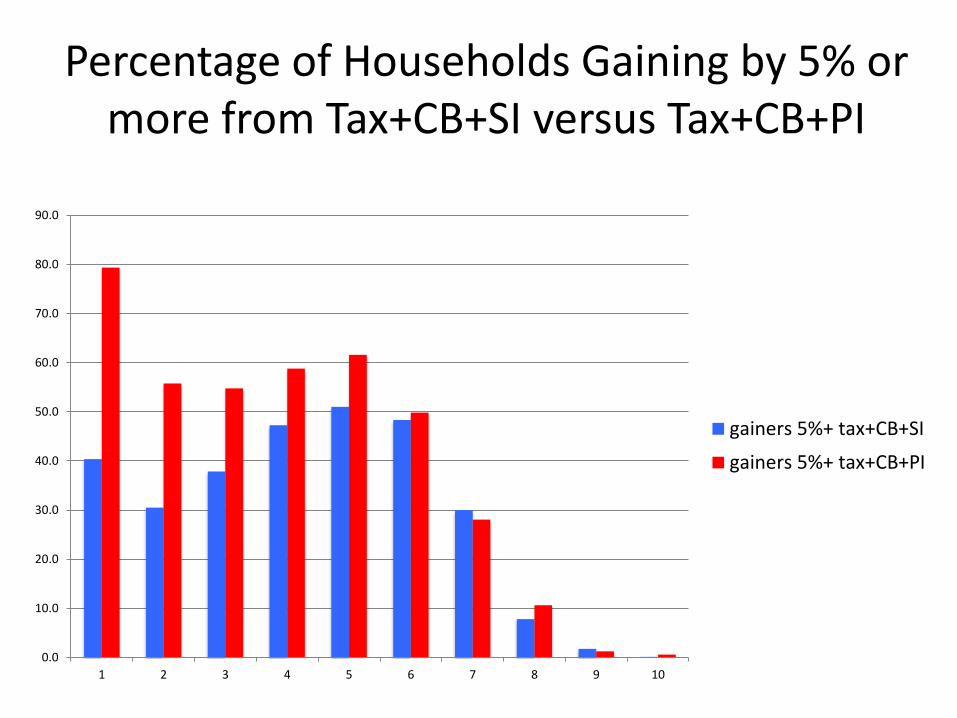
Percentage of Households Gaining by 5% or more from Tax+CB+SI versus Tax+CB+PI
0.0
10.0
20.0
30.0
40.0
50.0
60.0
70.0
80.0
90.0
1 2 3 4 5 6 7 8 9 10
gainers 5%+ tax+CB+SI
gainers 5%+ tax+CB+PI

Percentage of Households Losing by 5% or more from Tax+CB+SI versus Tax+CB+PI
0.0
10.0
20.0
30.0
40.0
50.0
60.0
70.0
80.0
90.0
100.0
1 2 3 4 5 6 7 8 9 10
losers 5%+ tax+CB+SI
losers 5%+ tax+CB+PI
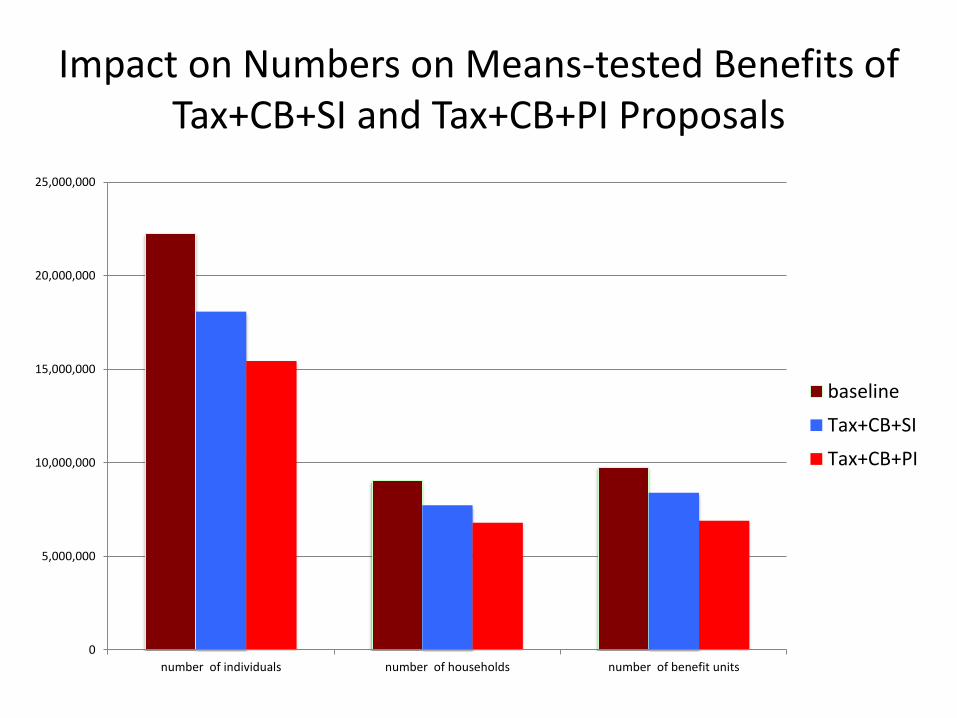
Impact on Numbers on Means-tested Benefits of Tax+CB+SI and Tax+CB+PI Proposals
0
5,000,000
10,000,000
15,000,000
20,000,000
25,000,000
number of individuals number of households number of benefit units
baseline
Tax+CB+SI
Tax+CB+PI
Impact on Work Incentives
• Average/median METRs on additional earnings increase in both options
– but more with PI than SI option
– and increase at bottom with PI but not SI option
• Incentive to participate enhanced with PI option
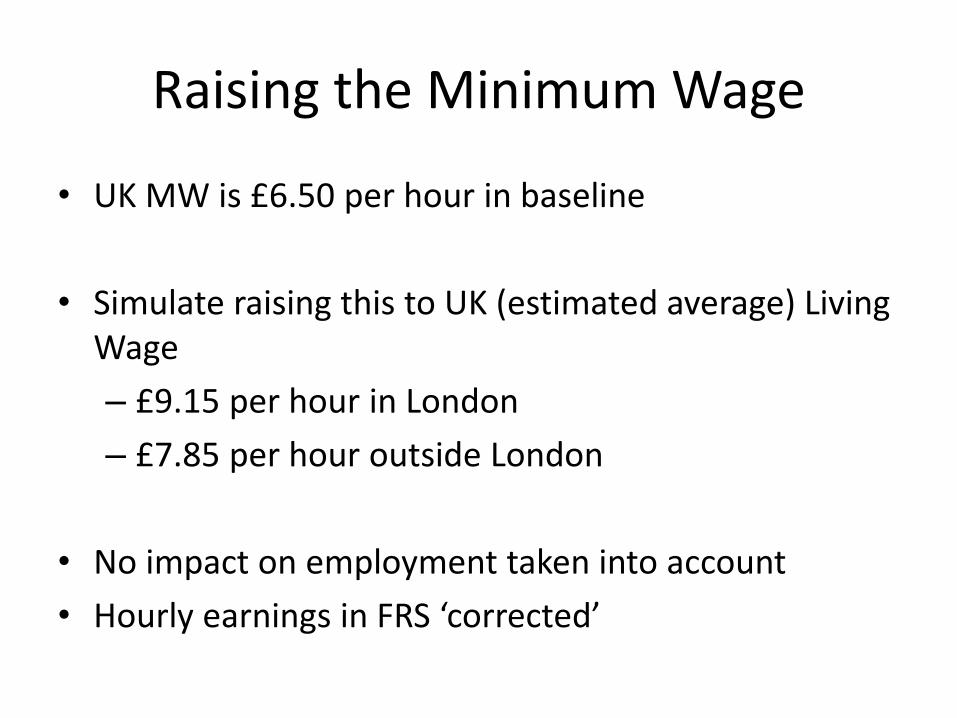
Raising the Minimum Wage
• UK MW is £6.50 per hour in baseline
• Simulate raising this to UK (estimated average) Living Wage
– £9.15 per hour in London
– £7.85 per hour outside London
• No impact on employment taken into account
• Hourly earnings in FRS ‘corrected’
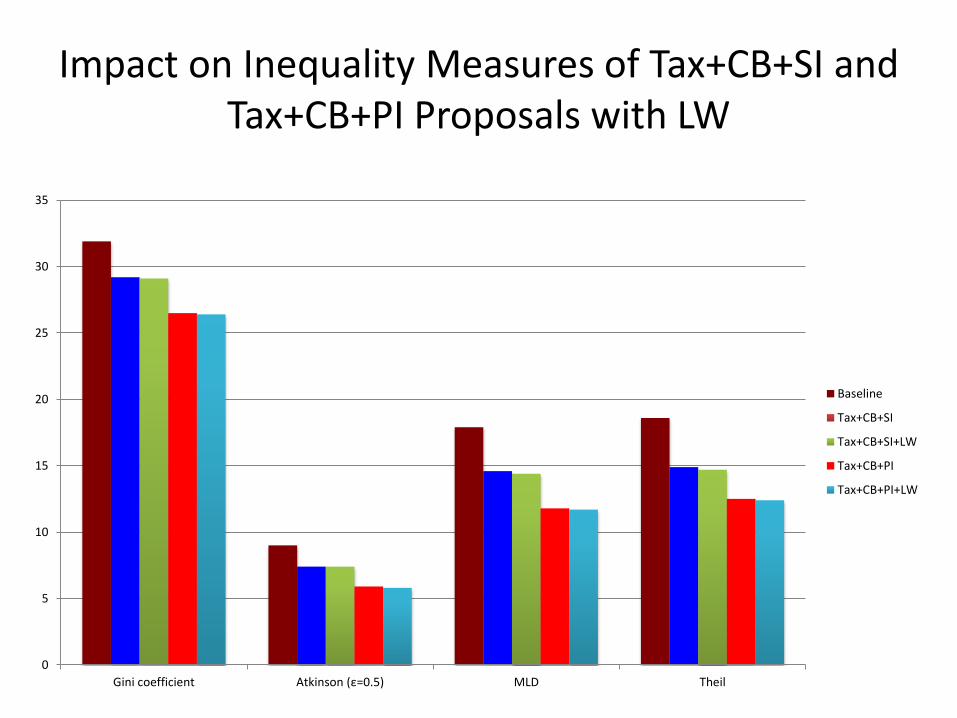
Impact on Inequality Measures of Tax+CB+SI and Tax+CB+PI Proposals with LW
0
5
10
15
20
25
30
35
Gini coefficient Atkinson (ε=0.5) MLD Theil
Baseline
Tax+CB+SI
Tax+CB+SI+LW
Tax+CB+PI
Tax+CB+PI+LW

Impact on Numbers on Means-tested Benefits of Tax+SI and Tax+PI Proposals with LW
0
5,000,000
10,000,000
15,000,000
20,000,000
25,000,000
number of individuals number of households number of benefit units
baseline
Tax+CB+SI
Tax+SI+CB+LW
Tax+CB+PI
Tax+CB+PI+LW
Conclusions and Questions
• Strengthening direct redistribution one important plank in a strategy to reduce inequality
• Universal payments for children powerful tool
• Participation income more redistributive than raising social insurance
• MW workers are spread across the entire income distribution, so raising MW has modest redistributive effect
• Key strategic choice: increasing means-testing or (re-)finding alternative ways to target
• Does higher MW complement Basic/Participation Income or are they substitutes?