Embed Size (px)
Citation preview

The Great Sand DunesNational Park and
PreserveUnmanned Aircraft System Aerial Survey
720 259 0965
wcecivil.com
11582 Colony Row
Broomfield, CO 80021
720 638 9656
BlackSwiftTech.com
2100 Central Ave., Ste. 102
Boulder, CO 80301
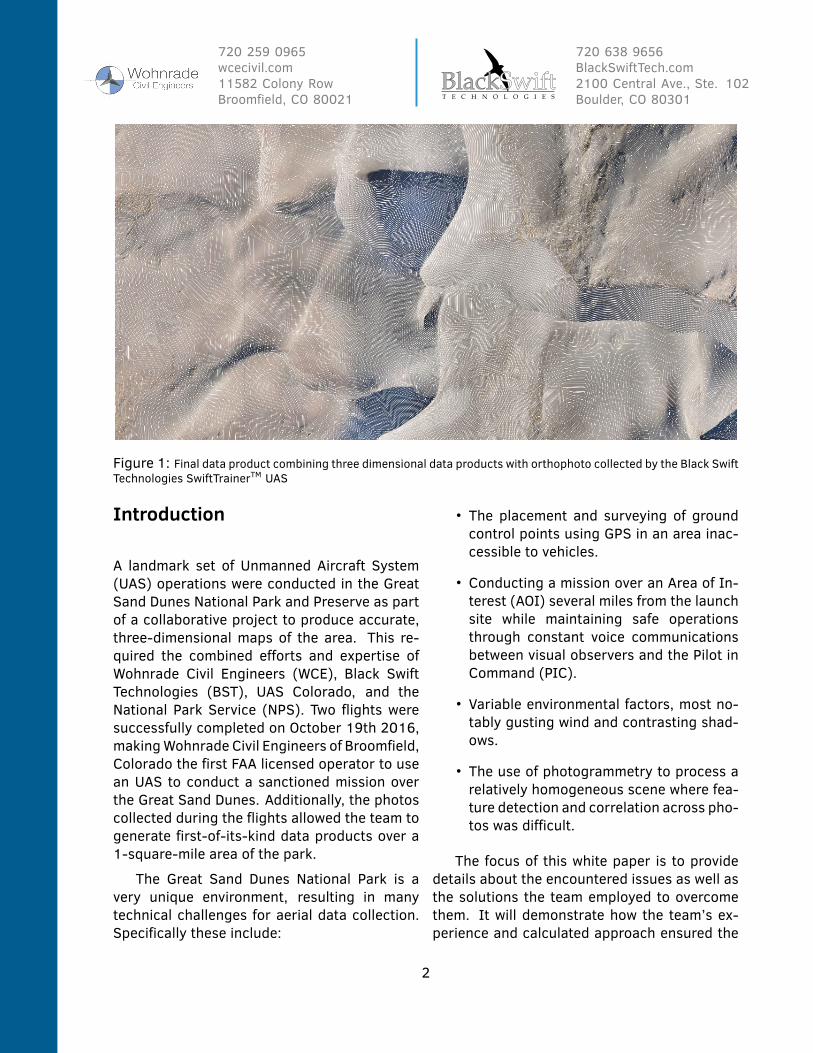
Figure 1: Final data product combining three dimensional data products with orthophoto collected by the Black Swift
Technologies SwiftTrainerTM UAS
Introduction
A landmark set of Unmanned Aircraft System
(UAS) operations were conducted in the Great
Sand Dunes National Park and Preserve as part
of a collaborative project to produce accurate,
three-dimensional maps of the area. This re-
quired the combined e�orts and expertise of
Wohnrade Civil Engineers (WCE), Black Swift
Technologies (BST), UAS Colorado, and the
National Park Service (NPS). Two flights were
successfully completed on October 19th 2016,
makingWohnrade Civil Engineers of Broomfield,
Colorado the first FAA licensed operator to use
an UAS to conduct a sanctioned mission over
the Great Sand Dunes. Additionally, the photos
collected during the flights allowed the team to
generate first-of-its-kind data products over a
1-square-mile area of the park.
The Great Sand Dunes National Park is a
very unique environment, resulting in many
technical challenges for aerial data collection.
Specifically these include:
• The placement and surveying of ground
control points using GPS in an area inac-
cessible to vehicles.
• Conducting a mission over an Area of In-
terest (AOI) several miles from the launch
site while maintaining safe operations
through constant voice communications
between visual observers and the Pilot in
Command (PIC).
• Variable environmental factors, most no-
tably gusting wind and contrasting shad-
ows.
• The use of photogrammetry to process a
relatively homogeneous scene where fea-
ture detection and correlation across pho-
tos was di�cult.
The focus of this white paper is to provide
details about the encountered issues as well as
the solutions the team employed to overcome
them. It will demonstrate how the team’s ex-
perience and calculated approach ensured the
2

720 259 0965
wcecivil.com
11582 Colony Row
Broomfield, CO 80021
720 638 9656
BlackSwiftTech.com
2100 Central Ave., Ste. 102
Boulder, CO 80301
Figure 2: Photo of the visual observer stationed on top of the Star Dune.
work culminated in a successful and safe flight-
deployment as well as a valuable data product
for the NPS.
1 Purpose of the Study
The primary purpose of this work was to pro-
vide meaningful data to the National Parks Ser-
vice. “The Great Sand Dunes contain the tallest
dunes (maximum height about 750 feet, or
230 m) in North America. These dunes cover
an area of 72 square kilometers (28 square
miles) and contain an estimated 10-13 billion
cubic meters (2.4 to 3.1 cubic miles) of sand.
The dunes accumulated in an embayment that
formed where the trend of the Sangre de Cristo
Range changes from southeasterly to south-
westerly. They owe their exceptional height
to a combination of factors including range-
front geometry, topography, an abundant sand
supply from the nearby basin, a complex wind
regime, and the Sangre de Cristo Range, which
prevents continued eastward migration of dune
sand deposited by the prevailing southwest-
erly and westerly winds. Although the sand on
the surface of the Great Sand Dunes is of late
Holocene age, most of this massive sand body is
a complex of deposits that accumulated episod-
ically for more than 130,000 years.”[1]
Although the dunes system as a whole is
fairly stable, changes still occur within the
field. According to the NPS, “Currently, there
is enough vegetation on the valley floor that
there is little sand blowing into the main dune-
field from the valley. However, even today there
are still some small parabolic dunes that orig-
inate in the sand sheet and migrate across
grasslands, joining the main dunefield. At
other times, some of these migrating dunes be-
come covered by grasses and shrubs and stop
migrating.”[2] Additionally, although the larger
formations, such as the Star Dune and the High
Dune, havemaintained their shape for hundreds
of years, they will commonly change locations
based on shifts in weather patterns.
One of the fundamental tenets of the Na-
tional Park Service is the study and understand-
3

720 259 0965
wcecivil.com
11582 Colony Row
Broomfield, CO 80021
720 638 9656
BlackSwiftTech.com
2100 Central Ave., Ste. 102
Boulder, CO 80301
Figure 3: Flight path of the two flights conducted over the Star Dune area of interest. Note the straight flight tracks
and significant distance between the AOI and takeo� and landing location.
ing of the resources they are charged with pro-
tecting. For the Great Sand Dunes system, this
involves remote and in situ sensing to monitor
change detection. Work to date largely involved
labor intensive traditional surveying methods,
consuming valuable resources from an already
over-constrained workforce. In an e�ort to al-
leviate these issues, this investigation was con-
ducted to develop precision mapping capabili-
ties through the use of UAS. Specifically, a de-
sire exists tomeasure terrain height in the vicin-
ity of the largest park feature, the 750ft (229m)
tall Star Dune, as well as provide change detec-
tion for the dune itself.
2 Mission Planning
2.1 GPS Ground Control Points
The AOI for the project consisted of an one
square mile rectangle, centered on the Star
Dune (Figure 3). This size and shape were cho-
sen to balance the requirements of the NPS with
the limited resources available for the collect.
Specifically, this size of survey would generally
require up to 24 ground control points (GCPs)
to provide an absolute reference for the photo
set, as well as several check points (CPs) to
use in error analysis of the final data product.
However, the AOI was inaccessible by vehicle
and required travel by foot, which consequently
meant the establishment of GCPs and collec-
tion of their individual GPS x,y and z coordinates
would take significantly longer than usual.
Over a period of eight hours on October 18,
2016, a combined total of seven surveyed GCPs
and check points CPs were set by a two man
crew from Wohnrade Civil Engineers. Although
well short of the desired 24, this was the maxi-
mum number achievable by a two man team in
the period allotted for the mission. Measures
were taken to ensure that the GCPs did not shift
on the dune or become covered in sand before
the collect could take place.
4

720 259 0965
wcecivil.com
11582 Colony Row
Broomfield, CO 80021
720 638 9656
BlackSwiftTech.com
2100 Central Ave., Ste. 102
Boulder, CO 80301
2.2 Flight Path Generation
The flight paths were generated using the
SwiftTabTM user interface software from BST.
This software allows for the simple creation
of mapping plans based on only a few speci-
fied parameters from the operator. Specifically
these include the height above ground level for
the mapping mission and percent overlap of the
photos. Tracks are automatically generated to
achieve these parameters, and photo trigger lo-
cations are based on GPS location, eliminat-
ing incorrect spacing due to strong tail or head
winds.
One of the challenges for this particular
project was the collection of data over very di-
verse terrain, given the area of interest con-
tained terrain variations of up to 750ft (229m).
Use of the SwiftTabTM app greatly simplified the
mapping plan generation process as it makes
use of digital elevation maps to 1) ensure the
waypoints remain within a specific height of
the ground (thus maintaining a uniform ground
sample distance for the photos taken through-
out the flight) and 2) inform the operator if any
flight paths will intersect particularly sharp ter-
rain features.
3 Aerial Data Collection
3.1 The SwiftTrainerTM UAS
The UAS team of Wohnrade Civil Engineers and
Black Swift Technologies chose the fixed-wing
SwiftTrainerTM (Figure 4) for the Sand Dunes
project for its ease of use, accurate ground
tracks, accurate geotagging of images, ex-
tended range, and ability tomap large areas in a
single flight (up to 2.25 sq-mi). The SwiftTrainer
is a small, fixed-wing UAS that is sold by BST
to primarily conduct these sorts of aerial cam-
paigns.
Figure 4: Launch of the SwiftTrainerTMTM UAS from a
small dirt road.
The SwiftTrainerTM provides industry-
leading AOI coverage through the uniform
spacing of images, tight flight tracking, and
consistent overlap pattern. These factors are
essential for producing an image set capable
of deriving accurate geospatial data from. This
was especially important for this particular data
set, given the incredibly limited number of fea-
tures that could be extracted from the dunes
themselves.
One of the conditions of the NPS Scien-
tific Research and Collecting Permit was to lo-
cate the launch and landing site outside of
the Great Sand Dunes National Park boundary.
This not only extended the collection time con-
siderably, but also required operations from a
very short dirt road. The hand launch capabil-
ity and automated landing functionality of the
SwiftTrainerTM proved invaluable in being able
to conduct the missions given the NPS con-
straints.
The 1-square mile AOI was flown in 2 hours
and 30 minutes over two flights, collecting
1,755 images. The automated "resume map-
ping" feature of the SwiftTrainerTM was used to
ensure proper overlap between the data sets. A
total of 1,289 images were collected during the
first flight, and 466 images were collected dur-
ing the second.
5

720 259 0965
wcecivil.com
11582 Colony Row
Broomfield, CO 80021
720 638 9656
BlackSwiftTech.com
2100 Central Ave., Ste. 102
Boulder, CO 80301
4 Post Processing
The geo-tagged images collected with the
SwiftTrainer need to be processed after the
flight to generate useful data products. The NPS
desired both a detailed orthomosaic image of
the entire 1 sq mile area as well as a 3D point
cloud.
4.1 Computed Image/GCPs/Manual TiePoint Positions
Several di�erent software suites were used to
process the data in an attempt to determine
which one would produce the most accurate
and complete data products. As expected,
many software packages had issues with uni-
form nature of the large sections of sand visible
in the images. The photogrammetry process re-
lies on the ability to distinctly identify andmatch
overlapping features in di�erent photos, some-
thing inherently di�cult in photos of homoge-
nous regions. Even with significant intervention
this issue caused data artifacts and even com-
plete failure in many of these software pack-
ages. Fortunately, the team was able to eventu-
ally find a set of settings and software package
which produced a satisfactory data product.
Figure 5 shows the o�set between initial im-
age positions (blue dots) and computed po-
sitions (green dots) as well as the o�set be-
tween the GCP initial positions (blue crosses),
and computed positions (green Xs) in the x-y
plane. Omitted images (red dots) are a result of
both intense elevation change, as well as homo-
geneous ground surface textures. Both of these
conditions make it di�cult for photogrammet-
ric algorithms to identify common match points
between overlapping photographs. While these
environmental factors commonly make pro-
cessing di�cult, this set proved to be partic-
ularly di�cult for identifying and matching tie
points. Despite these di�culties the software
was still able to generate an orthomosaic image
and three-dimensional point cloud.
Figure 5: Original and corrected photo locations pro-
vided by the ESRI Drone2map software.
4.2 ASPRS Accuracy Calculations
Wohnrade Civil Engineers, Inc. calculates the
RMSE accuracy for each project using method-
VerticalAccuracyClass
Absolute Accuracy Relative Accuracy (where applicable)
RMSEzNon-Vegetated
(cm)
NVA at 95%Confidence Level
(cm)VVA at 95th
Percentile (cm)
Within-SwatchHard SurfaceRepeatability(Max Di�) (cm)
Swath-to-SwathNon-Veg Terrain(RMSDx) (cm)
Swath-to-SwathNon-Veg Terrain(Max Di�) cm
1-cm 1.0 2.0 3 0.6 0.8 1.62.5-cm 2.5 4.9 7.5 1.5 2 45-cm 5.0 9.8 15 3 4 810-cm 10.0 19.6 30 6 8 1615-cm 15.0 29.4 45 9 12 2420-cm 20.0 39.2 60 12 16 3233.3-cm 33.3 65.3 100 20 26.7 53.366.7-cm 66.7 130.7 200 40 53.3 106.7100-cm 100.0 196.0 300 60 80 160
Table B.7 Vertical Accuracy/Quality Examples for Digital Elevation Data
6

720 259 0965
wcecivil.com
11582 Colony Row
Broomfield, CO 80021
720 638 9656
BlackSwiftTech.com
2100 Central Ave., Ste. 102
Boulder, CO 80301
ology and equations established by the Amer-
ican Society for Photogrammetry and Remote
Sensing (ASPRS)[3]. The horizontal RMSE ac-
curacy for the Sand Dunes project falls short of
their usual high standards for several reasons,
namely the limited number of GCPs, and the
di�culty in processing images of large homo-
geneous regions. The horizontal accuracy of
the final collect is summarized as follows.
RMSEx = 0.22 ft
RMSEy = 0.72 ft
RMSEr = 0.75 ft
Based on Table B.3 of the ASPRS Positional
Accuracy Standards, the Horizontal Accuracy
Class for the Sand Dunes collection is 17.50
cm. When an adequate number of ground con-
trol points are used, the accuracy of their final
deliverables usually fall within a Horizontal Ac-
curacy Class of 10.00 cm or less.
The vertical accuracy was computed to be:
RMSEz = 1.84 ft
Based on Table B.7 of the ASPRS Posi-
tional Accuracy Standards, the Vertical Accu-
racy Class for the Sand Dunes project is be-
tween 33.3 and 66.7 cm. Again, when an ad-
equate number of ground control points are
used, final deliverables usually fall within a Ver-
tical Accuracy Class of between 2.5 and 10 cm.
Horizontal AccuracyClassRMSEx
andRMSEy (cm)RMSEr
(cm)
OrthoimageMosiac Seamline
MaximumMismatch
HorizontalAccuracy at
the 95% Confidencelevel (cm)
0.63 0.9 1.3 1.51.25 1.8 2.5 3.12.50 3.5 5.0 6.15.00 7.1 10.0 12.27.50 10.6 15.0 18.410.00 14.1 20.0 24.512.50 17.7 25.0 30.615.00 21.2 30.0 36.717.50 24.7 35.0 42.820.00 28.3 40.0 49.0
Table B.3 Common Horizontal Accuracy
Classes According to the New Standard
Figure 6: 3D rendering generated from UAS Data.
4.3 The Photogrammetric Process/3DPoint Cloud
The photogrammetric process generates a
point cloud containing millions of points, with
each point representing approximately 1 to 1.5
square inches on the ground. The precision
mapping products generated by WCE utiliz-
ing the SwiftTrainer are routinely supplemented
with traditional ground survey from a licensed
land surveyor, to create a type of hybrid topo-
graphic map with very high vertical and hori-
zontal accuracies.
The three-dimensional image in Figure 7 be-
low represents a point cloud that was developed
using photogrammetry, and includes over 145
million points to provide a complete represen-
tation of the ground surface. Each point repre-
sents roughly 1.5 square inches on the ground.
4.4 Final Deliverables to the Great SandDunes National Park Research Sta�
The processed data from this set of flight exper-
iments was used to put together a set of useful
deliverables for the research sta� of the Great
Sand Dunes NP. These include:
1. High-resolution Orthomosaic Image (3
cm/pixel) of the 1 sq mile area.
7

720 259 0965
wcecivil.com
11582 Colony Row
Broomfield, CO 80021
720 638 9656
BlackSwiftTech.com
2100 Central Ave., Ste. 102
Boulder, CO 80301
Figure 7: Three dimenstional point cloud data set visualization from the Sand Dunes project.
2. One-foot contours in a .shp file format.
3. Point cloud of the DEM in a .las file format
containing over 145 million points.
4. 3D Model in a .obj file format.
5 Conclusion
The Great Sand Dunes National Park aerial data
collection was performed under very challeng-
ing conditions under the purview of the National
Park Service. Numerous site and environmen-
tal factors a�ected the final accuracy of the col-
lection, and much has been learned about how
to mitigate these factors in the future. It is the
hope of the entire team that this work can help
inform future projects of both the technical and
regulatory challenges of (1) operating in Na-
tional Parks, (2) performing photogrammetry
missions in uniform areas such as deserts, and
(3) operating in areas that are many miles from
a possible launch and landing location.
The Great Sand Dunes National Park Re-
search Team is pleased with the results, and
believes, “It is definitely the best imagery of
the dunes to date!” The high-resolution im-
agery has also led to the recognition of new
features on the Dunes, and possibly new dis-
coveries. The high-resolution orthomosaic im-
age (3 cm/pixel) proved to be a valuable source
of information. This imagery revealed new in-
formation about the Great Sand Dunes, which
was previously unknown to Research Sta� at
the Great Sand Dunes National Park.
We anticipate future data collections at the
8

720 259 0965
wcecivil.com
11582 Colony Row
Broomfield, CO 80021
720 638 9656
BlackSwiftTech.com
2100 Central Ave., Ste. 102
Boulder, CO 80301
Great Sand Dunes National Park on an annual
basis in the same AOI. WCE has already be-
gun developing new methods to increase verti-
cal and horizontal accuracies in this very chal-
lenging and unique environment. To this end,
WCE has teamed with BST to develop a custom
UAS platform that includes a LiDAR scanner, and
42 megapixel camera. WCE expects to use this
UAS in 2017 to map a portion of the 2016 AOI.
The results from the two collections will then be
compared, and evaluated for accuracy.
5.1 Acknowledgments
This milestone project was made possible
through the e�ort of a diverse team of pro-
fessionals including: Project Coordination by
Constantin Diehl of UAS Colorado1, and the
Research Sta� at Great Sand Dunes National
Park, Engineering and Surveying expertise
by Mary Wohnrade, P.E. of WCE, UAS Mis-
sion Planning by Brendan Thompson of WCE,
and SwiftTrainerTM UAS operations by Pilot-in-
Command Jack Elston, Ph.D., CEO of BST.
References
[1] R. F. Madole, D. P. VanSistine, and J. H.
Romig, “Geologic map of great sand dunes
national park, colorado,” tech. rep., US Ge-
ological Survey, 2016.
[2] N. P. Service, “Great sand dunes national
park & preserve colorado, geology,” 2011.
[3] “ASPRS Positional Accuracy Standards for
Digital Geospatial Data,” Photogrammet-
ric Engineering & Remote Sensing, vol. 81,
pp. A1–A26, March 2015.
1http://uascolorado.com/
About Wohnrade Civil Engineers
Wohnrade Civil Engineers, Inc. (WCE) is an FAA Section 333 Exemption Holder, as well as an FAA Part 107 Certified
Operator. WCE has been performing aerial data collections for the past eighteen months, using the SwiftTrainerTM UAS
platform (developed by Black Swift Technologies). WCE makes use of the SwiftTrainerTM, as well as our DJI Inspire 1,
to perform data collections, which are then processed using photogrammetry. WCE is at the forefront of delivering
precision UAS mapping products in a variety of digital formats, which are then used for civil engineering design.
WCE has developed a unique in-house workflow that includes: UAS mission planning; UAS field data collection;
Data processing using photogrammetry; Preparation of precision mapping products. All products are generated using
surveyed ground control points (GCPs), and are georeferenced in a real world coordinate system. Our deliverables
generally include: High-resolution orthomosaic image (2.5 to 3 cm/pixel GSD); Digital elevation model (DEM); Digital
point cloud; 3D model; Digital terrain model (DTM) with 1-foot contours. All of these products are accurate enough to
be used for civil engineering design.
WCE has demonstrated that the use of UAS to generate reliable and precise ground surface models is very cost
e�ective when compared to traditional ground and aerial surveys. WCE has accumulated a database for all of our
projects, which includes actual costs for UAS aerial mapping versus traditional ground surveying. WCE is able to save
our clients roughly 40% on average. The cost savings that can be achieved varies widely, depending on the size of
the project and type of terrain, and relates directly to the field collection time. In most cases, a UAS platform is able
to collect data in less than an hour, as compared to traditional ground survey methods, which take days.
About Black Swift Technologies
Black Swift Technologies (BST) is based in Boulder, CO and has been in operation since 2011. All UAS sold by BST are
built upon the SwiftCoreTM FMS that includes the autopilot, ground station, user interface, and support electronics.
Unlike many competing systems that rely on open-source and low-quality avionics, BST is able to guarantee quality,
robustness, and supply of the most critical components of our systems. The SwiftCore FMS was designed by BST from
the ground up. This a�ords control of the critical parts of our products, including the design of all electronics for both
the avionics and ground systems, software, mechanical assembly, and the detailed QC process for all outgoing sys-
tems. Furthermore, BST uniquely couples avionics expertise with consulting services, and has delivered products and
engineering services to many government entities including NASA, NOAA, various universities along with commercial
sales to end-users and aircraft integrators.
9