Embed Size (px)
Citation preview
1
The “Greatest” Carry Trade Ever?
Understanding Eurozone Bank Risks
Viral V. Acharya† Sascha Steffen‡
January 14, 2014
Abstract
We show that eurozone bank risks during 2007-2013 can be understood as a form of “carry trade”
behavior. Bank equity returns load positively on peripheral (Greece, Ireland, Portugal, Spain, and
Italy, or GIPSI) bond returns and negatively on German government bond returns, a position that
generated “carry” until the deteriorating GIPSI bond returns impacted bank balance sheets. The
positive GIPSI loadings correlate with banks’ holdings of GIPSI bonds, as well as the negative
German loading with banks’ short-term debt exposures. We find support for risk-shifting moral
hazard and regulatory arbitrage motives at banks in that carry trade behavior is stronger for large
banks and banks with low capital ratios and high risk-weighted assets. We also evaluate alternative
hypotheses such as the home bias of peripheral banks and suasion by domestic governments.
Keywords: Sovereign debt crisis, banking crisis, risk-shifting, regulatory arbitrage, home bias
JEL Classification: G01, G21, G28, G14, G15, F3
We thank Jacob Boudoukh, Martin Brown, Ruediger Fahlenbrach, Paul Glasserman, Paul Heidhues, Martin Hellwig,
Gur Huberman, Vasso Ioannidou, Anil Kashyap, Bryan Kelly, Jan-Pieter Krahnen, David Lesmond, Christian Leuz,
Marco Pagano, Hélène Rey, Joerg Rocholl, Anthony Saunders, Phil Strahan, Anjan Thakor, Elu von Thadden and
participants in the 2013 SFS Cavalcade, 2013 NBER Summer Institute IFM, 2013 CAF Summer Research Conference,
2013 FIRS Conference, 12th annual FDIC / JFSR conference, 49th Bank Structure and Competition Conference, 2012
C.R.E.D.I.T., 2nd Mofir Ancona and seminar participants at Darden, Deutsche Bundesbank, ESMT, Goethe University,
Indiana, Lancaster, Leeds, Mainz, NYU Stern, Ohio State University, Osnabrueck, and Tulane for valuable comments
and suggestions. We are grateful to Matteo Crosignani and Diane Pierret for excellent research assistance.
†C.V. Starr Professor of Economics, Department of Finance, New York University, Stern School of Business, 44 West
4th St., New York, NY 10012, email:[email protected], phone: +1 (212) 998 - 0354 fax: +1(212) 995 - 4256.
Acharya is also a Research Affiliate of the CEPR and a Research Associate in Corporate Finance at the NBER.
Acharya is grateful for financial support from the Center for Global Economy and Business at NYU-Stern. ‡ESMT European School of Management and Technology, Schlossplatz 1, 10178 Berlin (Germany), email:
[email protected], phone +49 (30) 21231 - 1544, fax: +49 (30) 21231 - 1281. Sascha Steffen is grateful for financial
support from the Peter Curtius Foundation.
2
“And of course, the deterioration of the Euro zone situation and particularly the sovereign
crisis in the peripheral economies hit very badly the group. And that’s of course not a
surprise for a group that still had very important short-term funding needs that was mainly
present in strong exposures in peripheral countries. [...] Before 2008, it was the group’s high
rating granting easy access to wholesale funding that led to the situation of October 2008
with short-term funding need of €260 billion outstanding in October 2008, i.e. 43% of total
balance sheet. [...] with very significant acceleration and buildup of the bond portfolio was
amounting at €203 billion at the end of 2008. Mostly carry trades with marginal improvement
of customer access [...] that led to a very significant gearing ratio because the portfolio size
was, at that time, 25 times the group equity.” - Pierre Mariani, Chairman of the Management
Board and CEO, Dexia SA, Earnings Call, February 23, 2012.
The ongoing sovereign debt crisis in Europe has cast doubt on the solvency of
European banks that incurred substantial mark-to-market losses and impairments on their
peripheral (Greece, Ireland, Portugal, Spain, and Italy, or GIPSI) sovereign bond holdings.
Since mid-2008, government bond yield spreads between pairs of European countries, for
example, between German bunds and GIPSI bonds, have widened considerably, mirroring the
economic divergence between these across the region (Figure 1).1 This divergence is
challenging the survival of the eurozone. Since then, banks have on average lost 70% of their
market value and shed billions of euros of assets in an effort to increase regulatory capital ratios.
[Figure 1]
In this paper, we show that banks’ risks during the 2007-2013 period can be
understood as a form of “carry trade.” With access to short-term unsecured funding in wholesale
markets, banks appear to have undertaken long peripheral sovereign bond positions. On the
upside, the trade would pocket the “carry,” which is the spread between long-term peripheral
sovereign bonds and banks’ short-term funding costs. On the downside, which has materialized,
the spreads between the two legs of the trade diverged even further, resulting in significant
losses for banks and leading to concerns about their solvency and liquidity. In essence, this
1 For almost a decade prior to this, the ten-year sovereign bond yields for these countries hovered around the four
percent benchmark with a small yield spread difference between core and peripheral European countries.
3
carry trade reflects a bet that eurozone countries would converge economically, resulting in a
convergence of the spread involving its two legs.
Dexia SA (Dexia) and the Bank of Cyprus provide two quintessential examples of
such behavior as they invested heavily in these carry trades.2 We document that this behavior
has in fact been pervasive among eurozone banks. We investigate the causes of the European
banking crisis and argue that banks’ substantial share price decline can in part be explained by
banks anticipating the survival of the eurozone, choosing to hold peripheral sovereign bonds
and financing their investments in short-term wholesale markets. While correlations between
the bond yields of Germany (or France) and peripheral sovereign bond yields were above 95%
in 2005, these correlations became negative in 2010 when markets became more reluctant to
finance banks’ investments in risky sovereign debt, which resulted in a flight into longer-term
core European (particularly German) government bonds. In other words, the banks lost on both
sides of the carry trade.
At the core of our analysis are the publicly listed banks that took part in five consecutive
stress tests conducted by the European Banking Authority (EBA) starting in 2010 and ending
in June 2012. March 2010 is the first reporting date for which detailed information about
European banks’ sovereign bond holdings is available. We document interesting patterns in the
sovereign bond holdings of banks for the March 2010 to June 2012 period.
Our data show that European banks entered the stress test period with a substantial
exposure to GIPSI sovereign debt, which overall remained remarkably constant over the next
two years. More importantly, GIPSI banks and (in particular) non-GIPSI banks appear to have
actively managed their sovereign bond portfolios by increasing their exposures to the periphery
even as yield spreads on these countries’ debt widened between March and December 2010.
2 Dexia built up a risky bond portfolio of almost a third of the bank’s total balance sheet, almost 50% of which
was financed with short-term funding. As the quality of the bond portfolio declined, Dexia was unable to roll over
the financing of its assets and was bailed out in October 2011. Dexia is not an isolated case. The Bank of Cyprus
more than quadrupled its investments in Greek government bonds in 2010 as Greek bonds were among the highest
yielding sovereign bonds. This investment was financed with short-term funds obtained from the ECB in 2009.
4
This behavior rules out the alternative that banks were passively caught in the sovereign debt
crisis due to exposures to peripheral sovereign debt prior to the emergence of the sovereign
crises Greece and Ireland in 2009. In fact, our analysis suggests that part of these purchases
were financed with proceeds from selling non-GIPSI (i.e., German and French) sovereign debt.
We find that both GIPSI and non-GIPSI banks with lower Tier 1 ratios and higher risk-
weighted assets increased their peripheral exposure between March and December 2010 and
January to June 2012 periods, strongly supporting regulatory arbitrage as an important
motivation for bank behavior.3 We document that peripheral banks substantially increased their
exposure to their domestic sovereign bonds between January and June 2012, while non-
domestic banks decreased their holdings, consistent with an increase in home bias over time.4
Additionally, we find that GIPSI banks that were bailed out do not explain the overall increase
in sovereign bond purchases by GIPSI banks.
Micro-level data of sovereign bond positions (except for the five EBA reporting dates)
are unavailable to us on a high-frequency basis. Furthermore, banks may be exposed to
sovereign bond risk other than through direct bond positions (e.g., through credit default swap
positions and counterparty exposure in derivatives transactions with governments). Given this
limitation and to link bank risk to both the investment leg and the funding leg of the carry trade,
we collect daily stock prices for these banks, as well as daily ten-year sovereign bond yields
over the January 2007 to June 2012 period.5
We find a positive correlation between banks’ stock returns and GIPSI bond returns and
a negative correlation with German bund returns. These correlations are significantly larger
3 Interestingly, non-domestic banks increased their exposure more relative to domestic banks in 2010. For example,
non-Spanish banks increased their Spanish sovereign bond positions by 66% between March 2010 and December
2010. S&P downgraded Spanish bonds to AA from AA+ in April 2010, pushing yield spreads for ten-year
sovereign bonds higher than (worse rated) Italian bonds. 4 To facilitate these trades, in December 2011 and February 2012 the ECB injected about €1 trillion with a maturity
of three years and a 1% coupon into the banking system in two three-year Long-Term Refinancing Operations
(LTROs). 5 To further strengthen our methodology, we relate our estimates to actual portfolio holdings throughout the paper.
5
during the 2007–2012 period as compared to the pre-2007 period. European banks are thus
effectively, on average, long GIPSI government bonds, thus their stock returns decline when
bond prices depreciate. The negative loadings on German government bonds (bunds) suggest
that banks are “short” long-term German bunds. In other words, these results suggest that banks
were financing long-term peripheral bonds with short-term debt in a carry trade.6 We also find
that non-GIPSI banks, and in particular banks from strong countries such as Germany and
France, are heavily loaded on peripheral debt, which helps to rule out that reverse causality (i.e.,
weak sovereigns weaken banks in a vicious cycle) is driving our factor loading estimates.
We show that the peripheral exposures relate to banks’ actual government bond holdings
rather than non-sovereign exposures (to firms, households, and real estate). Moreover, banks
with more short-term funding exposure, through U.S. money market funds (MMF)7 and other
wholesale funding sources, have more negative factor loadings on German bunds. Interestingly,
we find that MMFs withdraw, particularly from weakly capitalized institutions, which
highlights how liquidity and solvency risk interact.
In this paper, we explore incentives for banks to engage in carry trades, namely risk
shifting by under-capitalized banks and regulatory capital arbitrage, as well as the home bias of
peripheral banks and suasion by their domestic sovereigns to maintain asset exposures.
The regulatory capital arbitrage motive arises under the current Basel II regulations,
which assign a zero-risk weight for investments in sovereign debt.8 The governments may
themselves have had incentives to preserve the zero-risk weight to be able to continue to
6 If long-term German bund prices appreciate whenever short-term funding dries up (due to a flight-to-safety or
quality) and banks are exposed to short-term funding, then it would appear as if banks were “short” long-term
German bunds. 7 The dependence on U.S. MMFs by European banks for U.S. dollar funding potentially poses a threat to their
(short-term) liquidity and could be transmitted to other financial institutions or the real economy (Chernenko and
Sunderam, 2012; Ivashina, Scharfstein, and Stein, 2012). 8 The Capital Requirement Directive (CRD) assigns a zero-risk weight for “exposures to Member States’ central
government […] denominated and funded in the domestic currency of that central government” (BIS, 2011). That
is, despite (even little) differences in country ratings, banks are allowed to reduce the capital they hold against
these positions to zero. Consequently, particularly undercapitalized banks, that is, banks with low Tier 1 capital
ratios, have an incentive to shift their portfolios into assets with lower risk weights (regulatory capital arbitrage).
6
borrow.9 Undercapitalized banks, that is, banks with low Tier 1 capital ratios, now have an
incentive to increase short-term return on equity by shifting their portfolios into the highest-
yielding assets with lowest risk weights in an attempt to meet regulatory capital requirements
without having to issue economic capital (regulatory capital arbitrage).10
Moreover, riskier banks might shift into riskier government bonds by placing a bet on
their own survival (risk shifting) as this way they shift risk into the states of the world
(government defaults) where they are likely to experience bank runs [as argued by Diamond
and Rajan (2011)]. While the regulatory arbitrage incentive would be stronger for both GIPSI
banks and non-GIPSI banks, the second incentive would be stronger for the domestic banks of
GIPSI countries, which would increase the home bias of these countries over time.
The premise behind the moral suasion hypothesis is that peripheral sovereigns force
domestic banks to purchase more own sovereign debt because overall demand is weak and to
reduce sovereign bond yields. This hypothesis also implies an increase in home bias over time.
We bring these hypotheses to the data in a variety of tests. We first conduct a large
number of falsification tests and find that the return exposures are consistent with a carry trade
behavior that is specific to banks, not to hedge funds or industrial firms, and are also specific
to eurozone banks but not to the banks of other Western economies. Only European banks
benefit from the zero-risk weights and do not have to hold capital against risky sovereign debt,
which reduces the incentives of the other financial institutions to hold these assets. Moreover,
a funding “put” from domestic central banks and the ECB against eurozone sovereign collateral
is only available to eurozone banks.
Analyzing the carry trade behavior of European banks in subsamples of GIPSI banks,
non-GIPSI and German and French banks shows that non-GIPSI banks have significant
9 The more entangled the financial sector and the governments become, the more costly the government default
would be due to “collateral damage” in the form of bank runs and disruption of interbank and repo markets (Broner,
Martin, and Ventura, 2010; Acharya and Rajan, 2011; Bolton and Jeanne, 2011). 10 See Acharya, Engle, and Pierret (2013) for a formal derivation of this perverse incentive when banks disregard
the risks that arise from earning returns on capital subject to a risk-weight based capital requirement scheme.
7
exposures to the periphery, which highlights that there are motives other than home bias that
can explain our findings. Moreover, we find that larger non-GIPSI banks are significantly more
exposed, which is consistent with large banks exploiting an implicit bailout guarantee from
their (stronger) sovereign.
We also repeat our tests in consecutive subperiods and document a significant exposure
of non-GIPSI banks. Consistent with our descriptive results, this exposure decreases over time,
while GIPSI banks’ factor loadings increase, which is consistent with an increase in home bias.
Interestingly, the loadings on German bunds are significantly lower for GIPSI banks in the first
half of 2012, suggesting that the LTRO injections by the ECB reduced the funding risk of GIPSI
banks.
We show that banks with a high short-term leverage, high risk-weighted assets, and low
Tier 1 ratios have more exposure to peripheral sovereign debt. The results of a subsample test
of GIPSI versus non-GIPSI banks show that the moral hazard (risk shifting) motive is stronger
for GIPSI banks, which is consistent with Diamond and Rajan (2011). The regulatory arbitrage
motive, however, is stronger in the subsample of non-GIPSI banks. Moreover, our tests over
different subperiods suggest that moral hazard by under-capitalized banks is an important
determinant of banks’ carry trade behavior, even during periods when home bias is increasing.
We then investigate whether banks that have been bailed-out by their government have
larger exposures, which would make peripheral banks more prone to pressure by their
governments to buy their own sovereign debt. However, we find that banks that have not been
bailed out have significant exposures, which lends support to the carry trade hypothesis.
In final tests, we examine whether and when the carry trades became profitable. We find
that only the ECB interventions in summer 2012, when ECB President Mario Draghi explained
that he will do anything to save the eurozone and, in particular, the announcement of the details
of the Outright Monetary Transaction (OMT) program implying possible unlimited purchases
of sovereign debt in secondary markets by the ECB, made these trades profitable. We analyze
8
both announcement effects on sovereign bonds returns as well as on banks’ equity returns. Both
interventions significantly reduced peripheral bond yields and benefited the banks with high
GIPSI exposures. Interestingly, the LTRO capital injections did not have a significant impact
on peripheral bond yields, but the first tranche in December 2011 helped to reduce banks’
funding costs.
The paper proceeds as follows. In Section 1, we discuss the related literature. In Section
2, we discuss Dexia and Bank of Cyprus as two quintessential examples of carry trade behavior,
and explain the data sources and some descriptive statistics. In Section 3, we provide portfolio-
level evidence on sovereign bond exposures. In Section 4, we discuss our carry trade exposure
estimates from multifactor models, as well as various robustness tests to demonstrate their
validity. In Section 5, we relate our carry trade estimates to reported sovereign bond holdings
as reported by the EBA and measures of short-term funding risk. In Section 6, we explore bank
incentives for carry trades. In Section 7, we analyze the profitability of carry trades. We present
concluding remarks in Section 8.
1. Related literature
Our paper is related to the literature investigating the yield-chasing investment behavior
of financial institutions. Becker and Ivashina (2013) analyze the investment behavior of
insurance firms and document a reaching for yield behavior due to agency frictions. Kacperczyk
and Schnabl (2013) analyze the investment behavior of U.S. MMFs and find that they invested
in riskier securities searching for higher yields as money inflow was responsive to fund yields.
Fischer et al. (2012) focus on the investment behavior of German Landesbanken and document
a searching for yield due to risk-shifting incentives after the announcement that government
guarantees will be revoked. We show in our paper that yield chasing by European banks implies
investing in high-yielding long-term government debt financed with low-yielding short-term
wholesale funds, which ultimately leaves the banks exposed to risky assets and high funding
risk.
9
Our paper is also related to the literature highlighting that regulatory arbitrage is an
important motive for banks’ investment and financing decisions. Acharya, Schnabl, and Suarez
(2011) investigate the widespread use of conduits in the securitization process and find evidence
consistent with regulatory arbitrage: Most conduits were set up with capital-reducing liquidity
guarantees, which were initiated by weakly capitalized commercial banks; risks were not
transferred to investors, and losses were rather booked by the guarantee issuing institutions.11
Boyson, Fahlenbrach, and Stulz (2013) analyze the use of trust preferred securities by U.S. bank
holding companies as part of their regulatory capital. They also find evidence consistent with a
regulatory capital arbitrage motive.12 Acharya, Engle, and Pierret (2013) compare the results
from macroprudential stress tests both in the U.S. and Europe with stress tests based on market
data. They conclude that the reliance on regulatory risk weights in the original stress tests is in
part responsible for the undercapitalization of the banking sector that create incentives for banks
to invest in low risk-weight assets.
The paper relates more broadly to the literature on the risk-shifting incentives of firms
(Jensen and Meckling, 1976). Several theoretical studies emphasize banks’ incentives to shift
into riskier assets. Furlong and Keeley (1987, 1989), for example, show that banks increase
asset risks if they have higher leverage. Keeley (1990) shows that increased competition among
banks induces risk shifting because of lower charter values. Relatedly, Hellman, Murdock, and
Stiglitz (2000) argue that banks have higher gambling incentives if they are poorly capitalized.
The Japanese experience from the 1990s provides supporting evidence too. Undercapitalized
Japanese banks followed a policy of regulatory forbearance: extending loans to troubled
borrowers to avoid their insolvency and subsequent capital write-downs (Peek and Rosengren,
2005; Hoshi and Kashyap, 2010). Particularly affiliated banks channeled funds to these firms
11 Acharya and Richardson (2010) also emphasize the importance of regulatory capital relief in explaining the
huge increase in the securitization schemes of banks. 12 The Collins amendment to the Dodd-Frank Act requires that any trust preferred securities issued after May 19,
2010 no longer count towards Tier 1 capital, which effectively eliminates the regulatory capital arbitrage using
these instruments.

10
instead of extending credit to high-quality firms betting that the banks were going to be bailed
out by the government if the firms eventually defaulted (Caballero, Hoshi, and Kashyap, 2008).
2. Background and data
In this section, we provide brief examples of two non-peripheral European banks that
heavily invested in carry trades and eventually defaulted: Dexia SA and Bank of Cyprus. We
describe their trading behavior, as well as the costs when these trades fail: losses through sales
of bonds at lower prices, losses through mark-to-market of trading portfolios, an increase in
short-term funding costs, less collateral for private repo markets, and losses through hedges that
went wrong. We then describe the data we used.
A. Carry trades gone wrong: Dexia and Bank of Cyprus
A.1. Dexia SA
In October 2011, Dexia SA (Dexia)13 was bailed out because of carry trades that went
wrong (see the quote of Dexia’s current CEO at the start of the paper): Dexia built a proprietary
bond portfolio amounting to €203 billion at the end of 2008 (about 32% of its balance sheet),
searching for higher yields compared to their significantly less profitable municipal lending
business.14 These investments were financed in short-term wholesale markets. The bond
exposure was mainly to fixed rate bonds and Dexia hedged the interest rate risk using credit
derivatives. Effectively, Dexia was short German bunds in the total return swap market betting
on an increase in bund yields.
Dexia sold part of its portfolio in 2011 and incurred losses of about €2.6 billion. At
the same time, it wrote down 75% of its Greek sovereign bond holdings due its private sector
involvement. The losses on the exposure to Greek sovereign debt amounted to €3.4 billion.
Moreover, Dexia incurred substantial mark-to-market losses on its remaining bond portfolio.
13 Dexia SA was formed in 1996 through a merger of Crédit Local (France) and Crédit Communal (Belgium). 14 Holding a large amount of securities given Dexia's funding imbalances was even encouraged by rating agencies:
"Dexia's widely diversified funding base and the liquidity reserve provided by its large securities portfolio offset
its reliance on wholesale capital markets" (S&P Ratings Direct, May 22, 2008).
11
Consequently, Dexia’s Tier 1 ratio fell to 7.56% at end of 2011 and its book equity even became
negative. Both Moody's and S&P placed Dexia's ratings under review for possible downgrade
in spring 2011. Between April and June 2011, €22 billion in unsecured short-term funds were
withdrawn and its U.S. dollar position was impacted first. Figure 2. shows that U.S. MMF
reduced their holdings of Dexia’s commercial papers and repos within a few months in spring
2011 from about $10 billion to zero.
[Figure 2]
Dexia lost about €40 billion in short-term funding within six months in the second
half of 2011. An additional €6 billion in unsecured short-term funding was withdrawn during
the July - September 2011 period, and another €6 billion after Moody's announcement of
placing the group's long- and short-term rating under review for possible downgrade on October
3, 2011. Moreover, the group lost commercial deposits of €7 billion in the fourth quarter of
2011.15 Consequently, Dexia needed to rely increasingly on central bank funding, which
reduced the amount of available collateral for further repo transactions.16
The European Commission explicitly addressed its concerns with respect to the large
amount of sovereign debt in Dexia's portfolio and the use of interest rate derivatives, which
"probably requires significant collateral for Dexia, which may reduce its eligible collateral base
for financing from the central banks or in the interbank repo market" (EC, 2010).17
Dexia's derivative positions put even more pressure on short-term liquidity. Between
June and September 2011, Dexia had to post €15 billion cash collateral due to the fall in interest
15 The 1-year CDS spread of the banking subsidiary Dexia Crédit Local. The CDS spread increased within a few
weeks after June 2011 from 200 bps to 1,000 bps, reflecting its rise in short-term funding costs, as well as the
market’s expectation of Dexia’s default probability over the next year. 16 The ratio of repurchase agreements with the ECB over total repurchase agreements almost doubled between
2010 and 2011. 17 Dexia held a portfolio of GIPSI sovereign bonds amounting to €26.1 billion as of March 31, 2010 consisting
mainly of Italian bonds (€17.6 billion) and Greek government bonds (€3.7 billion). The size of the sovereign bond
portfolio corresponds to almost three times its book equity. Importantly, Dexia has kept the positions unchanged
since then.
12
rates. On October 7, 2011 Dexia incurred an additional €16 billion margin call but was unable
to post the collateral.18
A.2. Bank of Cyprus
The bailout of Cyprus to rescue its two failing banks, Bank of Cyprus (BOC) and
Cyprus Popular Bank, provides the most recent example of how aggressive yield chasing by
banks in the form of investing in risky sovereign debt brings an entire country to the verge of
financial collapse. A recent investigation by the Cypriot central bank into the activities of BOC
documents a premeditated trading in Greek sovereign bonds by BOC. Appendix Table I in the
Online Appendix reports the purchases of Greek sovereign bonds by ISIN in 2009:Q1. Buying
and selling the same ISIN within the same quarter suggests active trading, rather than holding
sovereign bonds to manage liquidity risk. Importantly, trades with the same ISIN have
frequently occurred with the same counterparty. The report mentions Deutsche Bank, Barclays,
and Société Générale SA as the most important European trading partners, which indicates that
this behavior was prevalent across European banks.19
Internal emails from BOC executives reveal the motives behind these trades. The non-
performing loan portfolio eroded the capital of the firm. BOC thus purchased Greek government
bonds to pursue an “absolute yield” strategy to deliver net interest income and "relative value"
strategy to take advantage of selling opportunities to generate gains around reporting dates
(“window dressing”). They invested in the highest yielding bonds including longer maturity
18 Dexia was eventually bailed out by the governments of Belgium, France, and Luxembourg. The government
assured debtholders as well as swap counterparties that they would not incur any losses in order not to trigger a
default event. This is similar to September 2008, when the U.S. government bailed out American International
Group (AIG). Also in the case of Dexia, governments were concerned with massive losses that had to be booked
by the (unidentified) counterparties, emphasizing the systemic importance of Dexia. It was bailed out a third time
in November 2012 and the European Commission extended an additional €85 billion refinancing guarantee to
restructure Dexia in December 2012. 19 Figure II in the Internet Appendix II shows the Greek sovereign bond holdings over the January 2009 to
December 2011 period. BOC purchased about €2 billion Greek government bonds in 2010, increasing its holdings
to about €2.4 billion (A&S, 2013) when Greece was downgraded further and rescue packages made a default of
Greece more likely. The data published by the EBA shows a consistent increase in Greek bond exposure. BOC
actually kept their holdings up to the private sector involvement in late 2011.

13
inflation-linked bonds. Hedges were put in place to swap longer dated bonds onto floating rates
and maintain BOC’s target duration.
ECB repo funding was not driving the banks’ decision to do the carry trades. “We
have no reliance on ECB borrowing because (a) we borrow and invest in liquid bonds and (b)
alternatively, we could have utilized our USD cash, swap them into Euro, and invest in such
assets. Moreover, we could utilize undrawn (but uncommitted money-market lines) amount to
EUR 500 million […] The reason we used repos is because the cost was lower.” ECB funding
improves the profitability of the trades and made them still look attractive while private repo
markets were already rejecting the collateral: “Almost no bank accepts Greek government
bonds as repo collateral for 1 year. Those that do, impose very high haircuts… The cost of
repoing Greek government bonds for 3 months is around 0.7%.”
Total losses as a result of BOC’s Greek government bond holdings amounted to €1.9
billion on November 16, 2012: €910 million relates to the costs of restructuring due to the
Private Sector Involvement (PSI) program; €562 million relates to mark-to-market adjustments
on the new bonds; €48 million relates to transfers from available for sale (AFS) reserves; €399
million relates to the costs of unwinding the hedges related to the bonds.
Overall, these are two illuminating examples documenting the widespread and active
use of carry trades and the associated costs when the downside scenario materializes.
B. Data Sources
To identify the effects of banks’ carry trade behavior, we construct a dataset using
three data sources. We collect market information (bank stock prices, bank and sovereign CDS
spreads, and sovereign bond yields) from Bloomberg, information about bond portfolio
holdings from the European Banking Authority (EBA) and annual and quarterly reports from
the banks, and financial information from SNL Financial as well as company reports. We
augment the data with information from S&P Credit Portal, investor presentations, and the ECB
and Bank of International Settlement (BIS).
14
We start with all public European banks included in the EBA stress tests. A list of
these banks is included in Appendix II.20 We collect financial information such as size,
leverage, and capitalization from SNL Financial. In addition, we compute stock returns from
daily stock prices. We use ten-year benchmark government bond yields, which are observed on
a daily basis.
Information about banks’ actual portfolio holdings of sovereign bonds is obtained
from the EBA. The EBA took over the responsibilities from the Committee of European
Banking Supervisors (CEBS) on January 1, 2011. They have been responsible for five stress
tests and capitalization exercises that have been conducted in the European banking market
since 2010 to “ensure the orderly functioning and integrity of financial markets and the stability
of the financial system in the EU.”21 The results of the tests together with detailed information
about banks sovereign bond portfolios were published for the following reporting dates: (1)
March 2010, (2) December 2010, (3) September 2011, (4) December 2011, and (5) June 2012.22
We use the iMoneyNet database to collect monthly information about the holdings of
U.S. MMFs in European banks’ commercial paper and repurchase agreements (repos). As a
consequence of the recent financial crisis, in 2010 the Securities and Exchange Commission
(SEC) approved changes to Rule 2a-7 of the Investment Company Act of 1940 and took other
actions to strengthen the regulatory framework that governs MMFs. Following the SEC
regulation, U.S. MMFs have to report monthly mark-to-market net asset value (NAV) per share
of their portfolios on Form N-MFP, which is then published by the SEC. We can access the
data from November 2010 onwards.
20 We exclude six banks from our analysis either because of data availability or because the bank is part of a
banking group where the parent owns the vast majority of stocks. These are: Bankia (BKIA), Raiffeisenbank
International AG (RBI), Österreichische Volksbanken AG (VBPS), Caja de Ahorros del Mediterraneo (CAM),
Hypo Real Estate (HRX), and Irish Life and Permanent (IPM). 21 The first stress test was already performed in 2009, but neither the identity of the participating institutions nor
details about the results have been disclosed except for the information that all institutions were adequately
capitalized. 22 The data are publicly available on the EBA website (http://www.eba.europa.eu/Home.aspx).
15
C. Summary statistics
In Table 1, we provide descriptive statistics for the returns of GIPSI banks as well as
German ten-year government bonds. Panel A of Table 1 shows the mean daily bond returns
since January 2007 in basis points (bps). Greek government bonds have the highest negative
return as well as the highest variance followed by Portugal and Ireland. All three countries have
already been bailed out by the European Union. Germany has positive daily returns with a small
variance.
[Table 1]
Panel B (Panel C) in Table 1 reports bond return correlations between 2001 and 2006
(2007 and 2013). In the period between 2001 and 2007, bond returns were almost perfectly
correlated. This demonstrates that these countries were perceived by investors as being almost
identical despite the major economic differences between them. The government bond returns
in Greece and Germany, for example, had a correlation of 0.99. This changed significantly as
the sovereign debt crisis unfolded. Between 2007 and 2013, the bond return correlation among
the GIPSI countries declined, while the correlation between GIPSI and German bond returns
became negative, which shows the divergence within the eurozone and the flight-to-quality.23
Panel A of Appendix III lists the averages of key variables for each bank. Log-Assets
is the natural logarithm of total book assets. ST-LVG is short-term debt divided by total debt.
RWA/Assets is risk-weighted assets divided by book assets. Tier 1 is the Tier 1 capital divided
by risk-weighted assets. ∆MMF/Assets is the monthly withdrawal by US Money Market Mutual
Funds scaled by book assets. On average, 33% of the total debt is short-term debt and banks
have a Tier 1 ratio of 10.15%. Panel B of Appendix III reports bond holdings of GIPSI banks
versus non-GIPSI banks. Sovereign bonds correspond to 8.69% (1.2%) of total assets of GIPSI
23 We explore further time-series characteristics of GIPSI bond yields. The time-series are non-stationary but first
differenced time-series are. GIPSI bond yields are thus integrated of the order of 1 (I(1)). We test the co-integration
relationship between, for example, Italian government bond and German government bond yields and find that
there is no co-integrating relationship in the period starting in Q4 2009.
16
(non-GIPSI) banks and domestic sovereign bonds account for 83.9% (50.97%) of GIPSI (non-
GIPSI) banks’ sovereign bond portfolios. Panel C of Appendix III provides time series
characteristics of banks’ stock returns and CDS prices observed on a daily basis. The average
daily realized return is -13.21 bps and the average five-year CDS spread is about 185 bps.
3. How did banks manage their GIPSI exposures? Evidence from micro-level data
In this section, we document the trading behavior of European banks and discuss
alternative explanations for our findings based on micro-level (portfolio) holding data from
EBA. Moreover we explore important differences as to the investments of peripheral versus
core European banks in peripheral sovereign debt, particularly how these patterns change once
the ECB funded carry trades with two three-year LTROs in December 2011 and February 2012.
A. Sovereign bond holdings
The carry trade hypothesis implies that banks exploited a widening of yield spreads
by betting on their subsequent convergence while short-term funding was available. The
incentives were particularly strong for weakly capitalized banks to shift their portfolios into
riskier assets and to improve their regulatory capital without incurring the costs of raising equity
as these exposures had zero capital requirements. However, there are alternative explanations
for these findings. For example, it could be that European banks did not increase their exposure
to GIPSI sovereign debt and simply held on to their pre-crisis holdings, that is, before the
spreads widened (“inertia hypothesis”). European banks’ exposure to GIPSI countries might
also simply reflect a home bias of banks holding domestic sovereign debt (“home bias
hypothesis”). Moreover, domestic sovereigns might have forced domestic banks to maintain
asset exposures (“moral suasion hypothesis”).
The EBA disclosed the sovereign bond holdings of European banks on five reporting
dates during the March 2010 to June 2012 period, which provides evidence that helps us to
analyze banks’ behavior as to investments in risky sovereign debt and to disentangle the
different hypotheses. The various explanations for bank behavior are relevant during different
17
time periods, as well as for different countries, and depend in part on the regulatory
environment.
Table 2 reports European banks’ sovereign bond holdings at five reporting dates since
March 2010 both for the full sample (Panels A and C) and separately for GIPSI and non-GIPSI
banks (Panels B and D). Table II.1 in the Online Appendix documents the holdings of GIPSI
sovereign debt by domestic banks.
[Table 2]
In Table 2, we document several important findings. First, European banks entered
the sovereign debt crisis with a substantial exposure to peripheral sovereign debt; however,
their total exposure towards Italian, Spanish, and Portuguese government debt did not decrease
substantially during the March 2010 to June 2012 period. For example, Italian government bond
positions decreased only from €264.5 billion to €258.9 billion.
Second, we observe an increase in GIPSI and non-GIPSI banks’ exposure to Spanish,
Italian, and to some extent Portuguese sovereign debt between March and December 2010 when
yield spreads widened (see Figure 1). Non-GIPSI banks even increased their exposure to
Spanish sovereign debt more than GIPSI banks in absolute euro amounts.24 In other words,
banks were not passively caught by the emergence of the sovereign debt crisis as implied by
the inertia hypothesis. On the contrary, they actively increased risky sovereign debt positions
in their portfolios in response to a surge in yields (e.g., Spanish sovereign bond yields).
We find that non-GIPSI banks were actively purchasing Italian and Spanish sovereign
debt. Purchases by GIPSI banks were achieved mostly by domestic (i.e., Italian and Spanish)
banks; however, other GIPSI banks also purchased smaller amounts. In Ireland and Portugal,
we observe a deleveraging in 2010 by non-GIPSI banks; the purchasers were domestic Irish
and Portuguese banks. In fact, Table II.1 in the Online Appendix shows that non-domestic
24 Spanish bond yields surged above Italian bond yields after Spain was downgraded by S&P in April 2010 despite
a higher rating of Spain vis-à-vis Italy.
18
GIPSI banks even sold Irish and Portuguese debt to some extent. Thus, we observe a home bias
particularly for those countries that were hit first by the sovereign debt crisis.
Taken together, non-GIPSI banks increased their holdings of Italian and Spanish
sovereign debt, which is consistent with our carry trade hypothesis. Domestic Italian and
Spanish banks also increased their holdings by a significant amount and the purchases by Irish
and Portuguese banks were all done by domestic banks. These observations are consistent both
with the carry trade hypothesis and the moral suasion hypothesis; however, we need more cross-
sectional evidence to disentangle these hypotheses.
Third, there is a de-leveraging in 2011 with respect to peripheral sovereign debt.
GIPSI (non-GIPSI) banks reduce their exposures to GIPSI sovereign debt by about 29% (45%).
Non-GIPSI banks continued their de-leveraging process in the first half of 2012, reducing their
total exposure to GIPSI sovereign debt to €105 billion. Interestingly, this decrease is driven by
the write-down of Greek sovereign bonds due to the PSI, but the exposures to the other
peripheral countries remain largely unchanged.
Fourth, there is a further substantial exposure increase to GIPSI sovereign debt in the
portfolios of GIPSI banks between December 2011 and June 2012. For example, Italian banks
invested about €37 billion in domestic sovereign debt; Spanish banks increased their exposure
to Spanish government debt by about €13 billion.25 In other words, we observe a shift in risk
exposure towards peripheral sovereign debt from non-GIPSI banks into GIPSI banks’ portfolios
which is consistent with an increase in home bias over time and thus consistent with both the
carry trade hypothesis and the moral suasion hypothesis.
Fifth, there is an increase in exposure to non-peripheral (in particular, German and
French) government debt during the March 2010 to June 2012 period, which is driven by non-
GIPSI banks consistent with flight-to-quality behavior.
25 Note that Greek banks have not participated in the stress tests or capitalization exercises since September 2011.

19
In the following sub-sections, we provide more cross-sectional evidence to
differentiate between the carry trade, home bias and moral suasion hypotheses.
B. Increasing sovereign exposures: Moral hazard, home bias, and suasion
In this sub-section, we take a first step in differentiating between the different
hypotheses as to European banks’ incentives to purchase GIPSI sovereign debt after the
emergence of the sovereign crisis in 2009. We analyze the changes in banks’ sovereign bond
holdings (1) by domestic versus non-domestic bank, (2) by bank risk, (3) by bond maturity, and
(4) by government interventions. The results are reported in Table 3.
[Table 3]
Panel A of Table 3 reports the percentage changes in Italian, Spanish, and overall
GIPSI sovereign bond holdings for domestic and non-domestic banks for the five stress tests.
Between March and December 2010, non-domestic banks had a larger percentage increase in
peripheral sovereign debt compared to domestic banks. For example, non-Spanish banks
increased their holdings by 66.34%. GIPSI banks simultaneously decreased their German and
French sovereign bond holdings, which suggests that they used the proceeds to finance the
purchase of their own sovereign debt. While GIPSI and non-GIPSI banks decrease their
exposures to peripheral sovereign debt in 2011, this process is accelerated by GIPSI banks after
the capital exercise of the EBA in September 2011. Between January and June 2012, non-GIPSI
banks reduced their peripheral sovereign exposures, whereas GIPSI banks purchased a
significant amount of their own sovereign bonds, which is consistent with the interpretation that
home bias increases. Interestingly, while GIPSI banks decreased German bunds in the first half
of 2012, they loaded up on French government bonds, whose yields have substantially increased
vis-à-vis German bunds since late 2011.
In Panel B of Table 3, we exploit cross-sectional variation among European banks
and show the changes in GIPSI, and German and French sovereign debt as a percentage of total
assets for banks with high/low Tier 1 or RWA/TA ratios and for GIPSI versus non-GIPSI banks.
20
We use indicator variables equal to 1 if the banks’ Tier 1 ratio (RWA/Assets ratio) is within the
lowest (highest) quartile to identify under-capitalized banks. Between March and December
2010, low Tier 1 and high RWA/TA banks both from core and peripheral European increased
their exposure to GIPSI sovereign debt and finance at least part of their purchases with proceeds
from selling German bunds. We observe a similar pattern during the January to June 2012
period. Moreover, we find that weakly capitalized GIPSI banks increase their exposure to
French sovereign bonds in 2012, which is consistent with our earlier result. Overall, we find
that banks with low Tier-1 ratios and high RWA/Assets, that is banks with higher gambling and
regulatory arbitrage incentives, increase their exposure to GIPSI sovereign debt more relative
to other banks.
While non-domestic banks increased their holdings in Italian and Spanish bonds
relatively more than domestic banks between March and December 2010, this trend reversed
between January and June 2012. Domestic banks increased their holdings while non-domestic
banks even decreased their sovereign bond exposures. These results indicate an increase in
home bias in the first half of 2012, which was in part been funded by the ECB. In December
2011 and February 2012, the ECB injected about €1 trillion into the banking system in two
three-year LTROs at an initial interest rate of 1%.26
Panel C of Table 3 reports the change in GIPSI, Italian and Spanish sovereign bond
holdings of our sample banks between January and June 2012. The data show that Italian banks
increased Italian sovereign bond holdings with a maturity equal to or less than three years by
€28.6 billion and longer dated bonds by €7.8 billion. 27 Similarly, Spanish banks increased their
26 Since then, the interest rate on these funds has decreased to 0.25%. 27 We aggregate all individual bank exposures to the country level and distinguish between changes in bond
holdings with maturities equal to or less than three years and greater than three years. If banks use LTRO funds
for new carry trades and match the maturities of the securities they purchase with the maturity of these funds, we
would expect to see increases in sovereign debt holdings particularly for maturities equal to or less than three
years. Note that Panel B of Table 3 reports holding changes. That is, if banks use the funds to simply replace
maturing bonds or to replace own funding with ECB funding, this is not recognized in this analysis. Only increases
in euro exposures are recognized as “new” carry trades.
21
exposure to Spanish sovereign bonds by €6 billion with a maturity of less than or equal to three
years and €6.6 billion with maturities above three years.28 Overall, non-GIPSI banks’ exposure
changes were small in comparison to purchases by Italian or Spanish banks and holdings were,
on average, reduced not increased. Taken together, these results indicate that carry trades with
Italian and Spanish sovereign debt have been executed by domestic banks, which is consistent
with the notion that home bias increased over time due to funding by the ECB.
An alternative explanation for these results might be that domestic regulators forced
domestic banks to maintain asset exposures to reduce bond yields. After the recent financial
crisis, several European banks were bailed out by their governments, thereby increasing the
influence regulators have over their domestic banks. We test this in Panel D of Table 3 and
differentiate between GIPSI (Italian and Spanish) banks that have or have not been bailed out
(we call them “intervened” after they have received bailout funds).29 We compile data on
government interventions using information disclosed on the official EU state-aid websites.
While intervened banks increase GIPSI sovereign exposures, the majority of the bonds were
purchased by non-intervened banks in the first half of 2012.30
4. Estimating banks’ carry trade exposure using multifactor models
Can carry trade behavior be understood using market data? In this section, we
investigate the carry trade behavior of European banks inferring banks’ peripheral sovereign
debt, as well as short-term funding exposures using sensitivities of banks’ equity with GIPSI
and German sovereign bond returns. We then provide a series of robustness and falsification
tests to support our interpretation of carry trade behavior among European banks. We
28 However, about €12 billion short-term bonds matured between December 2011 and June 2012, so net purchases
of Spanish banks were about €19 billion. 29 Appendix V provides a list of the intervened banks. 30 We also document substantial exposure increases by intervened GIPSI banks in 2010 which even exceed those
of non-intervened banks and is consistent with moral suasion. Unfortunately, we cannot further decompose these
purchases as all Greek, Irish and Portuguese banks in our sample have been bailed out at that time.
22
demonstrate that this behavior is bank specific and does not extend to hedge funds, non-
European banks, or non-financial firms.
A. Methodology: Measuring banks’ carry trade exposure
Unfortunately, micro-level data of sovereign bond positions are unavailable to us on
a high frequency basis. Furthermore, banks may be exposed to sovereign bond risk other than
through direct bond positions (e.g., through credit default swap positions and counterparty
exposure in derivatives transactions with governments). Given this limitation and to link bank
risk to both the investment and funding leg of the carry trade, we use multifactor models in
which the sensitivities of banks’ stock returns to sovereign bond returns are measures of their
exposure to sovereign debt.31 To improve these models, we also link our estimates to micro-
level portfolio holdings. We estimate the following regression:
𝑅𝑖,𝑡 = 𝛽0,𝑖 + 𝛽𝐺𝐼𝑃𝑆𝐼,𝑖𝑅𝐺𝐼𝑃𝑆𝐼,𝑡 + 𝛽𝐺𝑒𝑟𝑚𝑎𝑛𝑦,𝑖𝑅𝐺𝑒𝑟𝑚𝑎𝑛𝑦,𝑡 + 𝛽𝑚,𝑖𝑅𝑚,𝑡 + 𝜀𝑖,𝑡, (1)
where 𝑅𝑖,𝑡 is bank i’s daily stock return, 𝑅𝐺𝐼𝑃𝑆𝐼,𝑡 is the daily return on ten-year government
bonds from Greece, Italy, Portugal, Spain or Ireland. We also construct a GDP-weighted GIPSI
Sovereign Bond Index, which is a comprehensive measure of the overall exposure of banks’ to
peripheral sovereign debt.32 𝑅𝐺𝑒𝑟𝑚𝑎𝑛𝑦,𝑡 is the daily return on ten-year German government
bonds and 𝑅𝑚,𝑡 is the daily return of the equity market index in country m in which the bank is
headquartered. Because of the co-movement of 𝑅𝑚,𝑡 and the sovereign bond returns of country
m and Germany, we orthogonalize 𝑅𝑚,𝑡 to both return series.33 Note that the ten-year German
government bond is an additional risk factor in our model.
The estimate of 𝛽𝐺𝐼𝑃𝑆𝐼,𝑖 provides an unbiased estimate of the exposure of bank i to
GIPSI sovereign debt. A positive factor loading suggests that banks have invested in long-term
31 Our approach to estimate European banks’ sovereign risk exposure is similar to the procedure employed by
Agarwal and Naik (2004) to characterize the exposures of hedge funds. 32 A GDP-weighted index has the advantage over other (market value) weights as it captures the ability of
governments to repay their debt. 33 Not orthogonalizing gives qualitatively similar results.
23
(peripheral) government bonds. 𝛽𝐺𝑒𝑟𝑚𝑎𝑛𝑦,𝑖 is an estimate of bank i’s short-term funding
exposure. The negative factor loading suggests that banks are “short” long-term German bonds.
This reflects a “flight to quality” of investors who purchase long-term safe (German)
government bonds, at the same time reducing the supply of short-term capital. If long-term
bond prices appreciate whenever short-term funding dries up and banks are exposed to short-
term funding, then it appears as if banks were short long-term bonds. 𝛽𝐺𝐼𝑃𝑆𝐼,𝑖 > 0 and
𝛽𝐺𝑒𝑟𝑚𝑎𝑛𝑦,𝑖 < 0 is consistent with a carry trade behavior of European banks: they appear to have
invested in long-term government bonds financed in the short-term wholesale market to
maximize the carry between both legs of the trade.
[Table 4]
Panel A of Table 4 provides descriptive statistics of the estimated carry trade
exposures, for the full sample of banks and separately for GIPSI and non-GIPSI banks. The
factor loadings are estimated quarterly and averaged across all banks. The mean factor loadings
for peripheral bond exposure (GIPSI Sovereign Bond Index, Italy and Spain) suggest that non-
domestic banks had large exposures to the periphery. A large negative loading of German bunds
indicates the funding pressure on banks during our sample period due to a flight to quality of
investors. The pre-2007 carry trade estimates show that the exposure estimates were close to
zero and sometimes even small and negative before the yield spreads widened in mid-2008.
This evidence supports our hypothesis that banks built substantial carry trade positions as bets
on the convergence of sovereign bond yields in the euro area.
B. “Carry trade” behavior of European banks
We estimate regression equation (1) using pooled OLS regressions and cluster
standard errors at two dimensions, bank and quarter, to account for (unobserved but time-
variant) variation that is both bank specific in different quarters and that is common across all
banks in the same quarter. The results are reported in Panel B of Table 4.
24
The estimated values of 𝛽𝐺𝐼𝑃𝑆𝐼 and 𝛽𝐺𝑒𝑟𝑚𝑎𝑛𝑦 represent the cross-sectional averages of
European banks’ carry trade exposure. We also estimate (1) for each bank individually. Our
results indicate that banks’ stock returns are very sensitive to peripheral sovereign bond returns.
Model (1), for example, estimates the sensitivity of stock returns to Greek government bond
returns. The positive factor loading indicates an (unhedged) exposure of banks to Greek
government debt. All other factor loadings are (when employed individually) positive and
significant and the exposure is largest with respect to Italian and Spanish government debt.
Model (6) estimates the sovereign debt exposures collectively and model (7) uses the GIPSI
Sovereign Bond Index to measure banks’ exposure to peripheral debt. The R²s of the models
show that a substantial proportion of the variation in stock returns is explained by these
covariates. 𝛽𝐺𝑒𝑟𝑚𝑎𝑛𝑦 is negative and large in magnitude, which indicates banks’ funding
pressure is caused by their exposure to short-term debt. Overall, our results are consistent with
a carry trade behavior by European banks.
C. Robustness of our carry trade estimates
In Table 5, we report a series of robustness tests that supports the notion of carry trade
behavior of European banks. We first construct an index of bond returns using the daily average
return of sovereign bonds from euro area members other than GIPSI countries or Germany or
France (Bond Index). If banks invested in GIPSI government debt to exploit the highest-yielding
sovereign investments, banks’ stock returns should be less sensitive to the return of this index.
Model (1) of Table 5 reports a regression including Bond Index as separate control variable and,
as expected, its coefficient is not statistically significant.
[Table 5]
We include a variety of other macroeconomic state variables in the model to control for
changes in macroeconomic fundamentals that could drive both stock and sovereign bond
25
prices.34 Model (2) in Table 5 reports the results. Most importantly, the factor loadings do not
change including these variables. Model (3) includes all macroeconomic proxies but uses the
GIPSI Sovereign Bond Index as an exposure measure.
The sovereign debt market is characterized by a high degree of collinearity as shown in
Table 1 above. Principal component analysis (PCA) is a statistical procedure we use to construct
different linear combinations of the factor returns that are uncorrelated with each other using
the covariance matrix of the returns.35 Instead of using the GIPSI returns as independent
variables, we regress the banks’ stock return on PC1 and Germany. We find a positive and
significant relationship between PC1 and stock returns (Model (4) in Table 5), which is
consistent with a carry trade behavior by banks.
In Model (5) in Table 5, we substitute French for German government bonds and find a
negative and significant value for 𝛽𝐹𝑟𝑎𝑛𝑐𝑒, which is smaller in magnitude compared to the factor
loadings of German bunds. This reflects the increasing divergence of yields between French
and German government debt that started in 2011. The coefficients of Greece and Italy are even
stronger. In Model (6), we include the Fama-French factors SMB and HML, however, the results
remain unchanged.36
Carry trade exposure should also be reflected in CDS spreads as an important proxy for
bank risk and funding costs. We expect to see that CDS spreads reflect a widening of the gap
between GIPSI bond and German bund yields, either through an increase in peripheral bond
34 There are: (i) VSTOXX, the European counterpart to the VIX index in the U.S., is the change in the volatility
index of the European stock market; (ii) TermStructure is the slope of the term structure of interest rates measured
as the difference between the yield on a ten-year euro area government bond and the one-month Euribor; (iii)
BondDefSpread is the difference between the yield on ten-year German BBB bonds and yields on ten-year German
government debt; (iv) 1mEuribor is the level of the short-term risk-free interest rate measured as the one-month
Euribor; (v) ∆ESI is the monthly change in the economic sentiment indicator obtained from opinion surveys
conducted by the ECB; (vi) ∆IntProd is the monthly change in the level of industrial production; (vii) ∆CPI is the
change in the rate of inflation measured as the monthly change in the European Consumer Price Index. 35 As the covariance matrix is symmetric, it has linearly independent eigenvectors corresponding to the number of
positive eigenvalues. The eigenvectors are called principal components and are ranked according to the eigenvalue.
The first principal component (PC1) is the linear combination of GIPSI bond returns with the highest eigenvalue.
It is the component that explains the largest part of the variation in GIPSI bond returns. 36 HML and SMB are measured for European portfolios and available on Kenneth French’s website since 1990.
26
yields or if funding conditions deteriorate. We test this in Models (7) and (8) in Table 5 and use
ΔLog (Bank CDS) as a dependent variable, which is the change in the natural logarithm of daily
bank CDS spreads. As reported in column (7), the coefficient of Greek bond returns is negative
and significant, whereby, if Greek bond prices fall, banks experience, on average, an increase
in their CDS spreads. Moreover, if German bund prices appreciate, banks’ funding costs also
rise, ceteris paribus, pointing to their exposure to short-term wholesale markets. The PCA in
Model (8) shows a similar result. Overall, we find strong evidence consistent with a carry trade
behavior by European banks.37
D. Subsamples of GIPSI versus Non-GIPSI banks
An alternative explanation of our results is an intensification of weak sovereign bank
linkages, i.e., banks become weaker when their sovereigns become weaker, which could explain
the positive factor loadings on GIPSI sovereign debt. If sovereign risk makes GIPSI banks
weaker, then non-GIPSI (particularly German and French) banks should get stronger under the
alternative hypothesis and should thus not get affected the same way GIPSI banks do. We test
this by splitting our sample into subsamples of (1) GIPSI, (2) non-GIPSI, and (3) German and
French banks. We report the results in Panel B of Table 5, where we estimate banks’ exposure
using the GIPSI Sovereign Bond Index. While the loadings for GIPSI banks are larger in
magnitude, we find evidence consistent with large and significant exposures of non-GIPSI and
German and French banks to peripheral sovereign bonds. Similarly, non-GIPSI banks are
vulnerable to a flight-to-quality as the sensitivity of their equity return to changes in German
bund returns suggests.
37 We perform further tests that remain unreported for brevity. We include bank fixed effects to control for time-
invariant bank characteristics. In other tests, we use bond yield changes instead of bond returns. We also construct
an equally-weighted portfolio of bank stocks from our sample and estimate a time series regression. In separate
tests, we exclude broker-dealer banks. These banks might have larger portfolios due to this specific function.
Lastly, we use weekly (instead of daily) stock returns. In all tests, our results from Table 4 remain qualitatively
unchanged.
27
E. Falsification tests
We provide a variety of falsification tests as European banks have different incentives
to load up on peripheral sovereign debt compared to similar banks in other Western economies.
First, the CRD IV establishes zero-risk weights for EU member banks’ exposure to sovereign
debt issued in their domestic currency. Thus, U.K. and U.S. bank have to hold capital against
investments in peripheral sovereign debt. Second, U.K. and U.S. banks were systematically
recapitalized after the U.S. mortgage crisis.38 European banks, on the other hand, are still
undercapitalized based on various standards (such as leverage ratios). Third, U.K. and U.S.
banks cannot use sovereign debt to the same extent as European banks as collateral for liquidity.
We thus expect to find smaller estimates on similar tests using U.K. or U.S. banks. A third set
of firms we consider are non-financial (industrial) firms, which do not have similar incentives
such as gambling or regulatory capital arbitrage as banks, which should also be reflected in
their factor loadings.
We run tests with the following index returns as dependent variables: (1) a value-
weighted index of all EBA banks in our sample; (2) a value-weighted index of U.K. banks; (3)
a value-weighted index of the 100 largest U.S. banks based on market values; (4) a HFRX
Macro Hedge Fund Index; (5) an equally-weighted industrial index formed from the underlying
MSCI industrial indices from Italy, Spain. and Portugal (MSCI GIPSI)39; (6) the MSCI
Industrial Germany index; (7) an equally-weighted index of the most important countries in
Europe other than Germany and the periphery (France, Netherlands, Norway, Denmark. and
Sweden); and (8) the MSCI Industrial U.K. Index. Panel C of Table 5 reports the results. Control
variables include the Fama-French factors, SBM and HML. As market return, we include the
Euro Stoxx 600 Index for European indices, the S&P 500 Index for the U.S. banks, and the
MSCI World for the HFRX Macro Hedge Fund Index. Newey-West standard errors are adjusted
38 Many of the U.K. banks have been nationalized and their capital position strengthened after the recent
financial crisis. 39 We exclude Ireland and Greece from this index due to missing data in their respective industrial indices.

28
for heteroscedasticity and autocorrelation using eight lags. Column (1) shows the time-series
estimates for all EBA banks, which reflect our earlier cross-sectional results. We do not find
statistically significant exposure of U.K. banks to peripheral sovereigns (column (2)).
Moreover, the value of 𝛽𝐺𝑒𝑟𝑚𝑎𝑛𝑦 is much smaller, which indicates a lower funding exposure.
Column (3) reports the result for U.S. banks echoing the results for U.K. banks.40 We use daily
returns of the HFRX Macro fund as the dependent variable in column (4). The results are
intriguing and suggest that macro hedge funds are betting against Italy but are long German
bunds, thus effectively taking opposite positions in trades with European banks. Columns (5)
to (8) show sensitivities of country-specific industry indices to GIPSI and German sovereign
debt. Overall, the betas are close to zero and insignificant.
5. Factor loadings, sovereign bond holdings, and liquidity risk
Do our factor loadings relate to actual government bond holdings of banks or simply
reflect some other underlying economic exposures and linkages? What determines banks’
liquidity, i.e., short-term funding risk? And does liquidity risk interact with a bank’s solvency
risk? To address these important questions, in this section we examine bank-level data,
sovereign bond holdings, and short-term funding exposure.
A. Relating factor loadings to micro-level holding data
Since June 2010, the EBA has disclosed bank-level sovereign bond holdings reported
during five sequential stress tests.41 If �̂�𝐺𝐼𝑃𝑆𝐼 reflects higher exposure to GIPSI sovereigns, we
expect to find higher �̂�𝐺𝐼𝑃𝑆𝐼 if banks have higher reported holdings. To visualize this
relationship, in Panel A of Figure 3 we plot the factor loadings against average GIPSI holdings
(measured between the EBA reporting dates as the sum of the exposures to all peripheral
sovereigns) scaled by total assets for GIPSI and non-GIPSI banks. In Panel B, we plot these
40 We also run these results for a portfolio of Goldman Sachs, JPMorgan, Morgan Stanley, Citigroup, and Bank of
America. It has frequently been claimed that these banks had huge counterparty exposure to the GIPSI countries.
We do not find significant exposures to sovereign debt of either of the GIPSI countries. 41 Note that not all banks participated in all stress tests or the capitalization exercise.
29
relationships between each EBA stress date. Overall, all scatterplots show a positive
relationship between factor loadings and portfolio holdings for GIPSI and non-GIPSI banks.42
One possibility of how non-GIPSI banks could be affected (other than through bond
holdings) is contagion through real-sector exposure. We thus exploit the data released by the
EBA in 2011 on non-sovereign bond exposure to show that it is not real-sector exposure
(particularly among the non-GIPSI banks) that is explaining their factor loadings. More
importantly, it is their direct sovereign bond holdings that matter. If it was contagion, they
should not matter, but since they do (also) matter, it shows that the bond exposure channel is at
work too. We report the results in Panels C and D of Appendix Table IV in the Online
Appendix.
[Figure 3]
B. Funding liquidity risk and interaction of liquidity and solvency risk
We argue above that the negative factor loading of German bond returns reflect a flight-
to-quality from short-term investors into long-term German government bonds. We thus expect
to see cross-sectional differences in the factor loadings across banks arising from their short-
term funding exposure. An important source of funding risk for European banks is their
exposure to U.S. MMFs.43
Figure 4 shows U.S. MMFs’ exposure to European banks since October 2010. These
funds withdrew about $167 billion in repurchase agreements and commercial paper from
European banks in 2011 alone. Panel B shows the percentage withdrawal from individual banks
in 2011. U.S. MMFs completely eliminated their exposure to seven banks in the eurozone,
among them Dexia S.A., suggesting that MMFs responded to potential solvency concerns of
these banks. Other banks, predominantly Scandinavian banks, experienced massive inflows
42 Internet Appendix IV provides further results, linking factor loadings to individual peripheral bond holdings. 43 Ivashina, Scharfstein, and Stein (2012) show that the reduction in U.S. dollar lending by U.S. MMFs caused a
significant decline in the dollar lending relative to euro lending by European banks, which was not the case for
U.S. banks.
30
such as Svenska Handelsbanken AB, SEB Banken AB, and Swedbank, which indicates the
divergence in funding opportunities for European banks.
[Figure 4]
We aggregate the monthly MMF holdings data to the quarter and estimate quarterly
�̂�𝐺𝑒𝑟𝑚𝑎𝑛𝑦,𝑖 using (1). We find some variation in the value of �̂�𝐺𝑒𝑟𝑚𝑎𝑛𝑦,𝑖 ranging from -3.92 to -
0.93. Panel A in Figure 5 shows the relationships between the factor loading estimates and
MMF withdrawals in the cross-section of banks in 2011. This correlation is 0.71, suggesting
that U.S. MMF exposure is an important determinant of banks’ liquidity problems.
[Figure 5]
We plot the time series of U.S. MMF withdrawals for weakly versus well capitalized
banks in Panel B in Figure 5. We measure capitalization using a one-year lagged market
leverage ratio (defined as (total assets – book equity + market equity) / market equity) and
define weak (well) capitalized banks as those in the upper (lower) quartile of the market
leverage ratio.44 We document an asymmetric development as to MMF fund withdrawals.
MMFs withdrew more than 60% of their investments from weakly capitalized institutions
after November 2010 but have more than doubled their investments in well-capitalized banks,
which reinforces our earlier conjecture that short-term liquidity risk interacts with solvency
risk.
C. Results from seemingly unrelated regressions
In this subsection, we assess the importance of portfolio holdings of sovereign debt as
well as MMF exposure in explaining our factor loadings more formally in a one-step regression
framework using Zellner’s (1968) seemingly unrelated regression (SUR) technique.45 The
pooled time series cross-sectional approach is well suited in our setting because there might be
44 The figure looks similar using regulatory or book leverage measures. 45 This approach has also been used, for example, in French et al. (1983) to estimate the effects of nominal
contracting on stock returns.
31
substantially more variation in the bond portfolios across banks as there is variation over time
for a single bank given the limited portfolio data that is available to us. Regression model (1) is
estimated as a system of equations consisting of N (i.e., the number of banks) time series
equations and is estimated using GLS.
In Panel A of Table 6, �̂�𝐺𝐼𝑃𝑆𝐼 takes the form 𝛼0 + 𝛼1𝐻𝑜𝑙𝑑𝑖𝑛𝑔𝑠𝐺𝐼𝑃𝑆𝐼,𝑖,𝑡−1
𝐴𝑠𝑠𝑒𝑡𝑠𝑖,𝑡−1 and �̂�𝐺𝑒𝑟𝑚𝑎𝑛𝑦
takes the form 𝛼2 + 𝛼3𝐻𝑜𝑙𝑑𝑖𝑛𝑔𝑠𝐺𝑒𝑟𝑚𝑎𝑛𝑦,𝑖,𝑡
𝐴𝑠𝑠𝑒𝑡𝑠𝑖,𝑡−1. The coefficients are point estimates and constrained
to be constant across all banks. We thus can interpret these coefficients as average factor
loadings of our sample banks. We expect the value of �̂�1 and �̂�3 to be positive.
[Table 6]
We report the results using banks overall GIPSI as well as Italian and Spanish bond
holdings. �̂�1 and �̂�3 are positive, which indicates that banks benefit from higher bond returns
if they own bonds from the periphery or Germany. In Panel B of Table 6, �̂�𝐺𝑒𝑟𝑚𝑎𝑛𝑦 takes the
form 𝛼2 + 𝛼3∆𝑀𝑀𝐹𝑖,𝑡
𝐴𝑠𝑠𝑒𝑡𝑠𝑖,𝑡−1. ∆MMF are monthly money market withdrawals denominated in
million euros. We re-estimate our systems of equations and find that �̂�3 is negative and highly
significant. Banks with larger withdrawals from MMFs experience more short-term funding
pressure. �̂�2 is also negative and significant, which indicates that even if banks do not have
exposure to U.S. MMFs, they are still subject to short-term funding risk.46
46 In unreported tests, we also analyze the effect of other measures of liquidity risk on banks’ sensitivity to German
bunds, which have been used widely in the literature. There are: short-term debt over total debt and repurchase
agreements with other banks or the ECB over total assets. As expected, banks with more short-term debt (relative
to total debt) or more repo funding have more negative factor loadings on German bunds.
32
6. Carry trade incentives
Who is doing the carry trades? In this section, we look at various explanations for this
behavior: (1) home bias of peripheral banks, (2) moral hazard and regulatory arbitrage of under-
capitalized banks, and (3) suasion of national regulators.
A. Home bias of peripheral banks
A possible explanation for our results is a home bias of peripheral banks to accumulate
domestic sovereign debt. Our descriptive results suggests a rotation of peripheral sovereign debt
in banks’ portfolios with non-GIPSI banks reducing and GIPSI banks increasing their exposure.
The ECB injected about €1 trillion into the financial system in two LTRO transactions and
Table 3 showed a corresponding jump in GIPSI portfolio holdings in GIPSI banks.
Simultaneously, the provision of liquidity most likely mitigated the funding problems of GIPSI
banks. We test this by estimating regression model (1) over various subperiods and using
interaction terms to analyze factor loadings for GIPSI banks versus non-GIPSI banks. We
interact both the returns on the GIPSI Sovereign Bond Index and German bund returns with an
indicator variable equal to 1 if the bank is from one of the GIPSI countries (IGIPSI Bank). We chose
the time periods between the EBA stress test dates consistent with our descriptive analysis in
Tables 2 and 3 and to link our factor loadings to micro-level holding data. The results are
reported in Table 7.
[Table 7]
�̂�𝐺𝐼𝑃𝑆𝐼 reflects the exposure of non-GIPSI banks to peripheral sovereign debt. We find
that non-GIPSI banks load significantly on peripheral sovereign debt, which (in addition to our
subsample analysis above) helps us to rule out the alternative hypothesis that our results reflect
an intensification of weak sovereign bank linkages. Moreover, we find that non-GIPSI banks
reduce their peripheral sovereign debt exposure between March 2010 and June 2012, which
consistent with our descriptive results. The negative and decreasing coefficient �̂�𝐺𝑒𝑟𝑚𝑎𝑛𝑦
suggests that the funding problems (even of non-GIPSI banks) magnified. The interaction term
33
�̂�𝐺𝐼𝑃𝑆𝐼𝑥𝐺𝐼𝑃𝑆𝐼 𝐵𝑎𝑛𝑘 shows the additional exposure and �̂�𝐺𝑒𝑟𝑚𝑎𝑛𝑦𝑥𝐺𝐼𝑃𝑆𝐼 𝐵𝑎𝑛𝑘 the additional funding
risk of GIPSI banks. Interestingly, the interaction terms suggest that GIPSI banks increased
their exposure to GIPSI sovereign debt significantly in the first half of 2012 and had lower
funding risk following the ECB’s LTRO injections. Overall, these results are consistent with
an increase in the home bias of GIPSI banks in 2012. However, non-GIPSI banks continue to
have a significant exposure to the periphery, which is consistent with the moral hazard
hypothesis for carry trades, which we discuss in detail in the following subsection.
B. Moral hazard and regulatory arbitrage
It is posited in the moral hazard hypothesis that under-capitalized banks are more
likely to invest in carry trades to comply with regulatory capital requirement (“regulatory
arbitrage”) and/or shift risk betting on their own survival (“risk shifting”).
We use the Tier 1 capital ratio defined as Tier 1 capital over risk-weighted assets
(RWA) and the RWA/Asset ratio to measure capital constraints. We also include bank
characteristics such as bank size (Log-Assets) and short-term leverage (ST-LVG) to investigate
the investment behavior of European banks. In all tests, we use one-year lagged bank
characteristics.47 We run the regression on the full sample of banks and report the results in
Model (1) of Table 8.
[Table 8]
In Table 8, we show that banks with higher Tier 1 capital ratios have lower exposure
to GIPSI sovereign debt. Tier 1 capital increases if banks have higher RWA or if they decide
to hold more economic capital. For a given amount of RWA, the negative coefficient implies
higher risk-shifting incentives. Moreover, the positive coefficient on RWA/Assets (unlike the
sign on Tier 1) indicates that there is a regulatory arbitrage motive. Only including one of these
47 ST Debt and Log-Assets are included in addition to the interaction terms in the respective models as well as a
constant term, but all remain unreported for brevity.
34
variables might result in biased estimates of the coefficients due to confounding effects.48
Moreover, we find that banks with high exposure to short-term funding have significantly more
exposure to GIPSI sovereign debt. We document that larger banks (that is banks with more
international focus, more wholesale funding and that are more systemically important) also
have larger GIPSI sovereign exposures.
We estimate the regression separately for GIPSI and non-GIPSI banks and report the
results in columns (2) and (3) in Table 8. Interestingly, only larger non-GIPSI banks have more
peripheral sovereign exposures, which is consistent with the moral hazard behavior of European
banks of stronger countries that are able to bailout their struggling banks. We find that GIPSI
banks with high short-term funding and low Tier 1 ratios are more loaded on GIPSI sovereign
debt. Additionally, GIPSI banks with more short-term debt are also more exposed to funding
shocks. These results provide strong evidence for the moral hazard behavior of GIPSI banks,
consistent with Diamond and Rajan (2011).49 We also find evidence consistent with regulatory
capital arbitrage in the sample of non-GIPSI banks.
We next estimate the regression over subperiods and report the results in columns (4)
to (6) in Table 8. The results are again consistent with the interpretation that weakly capitalized
banks are more exposed to peripheral sovereign debt. In Appendix Table IV, we provide similar
analyses regressing GIPSI bond holdings scaled by total assets on our regulatory capital
measures and bank characteristics. Overall, these results provide strong support for the moral
hazard and regulatory arbitrage hypotheses.50
48 In unreported results, we include either Tier 1 or RWA/Assets and find that the coefficient of Tier 1 is less
negative when we do not control for RWA/Assets. This result indicates that the discretionary part of Tier 1 capital
is more strongly related to the risk-shifting hypothesis. In other words, not controlling for RWA understates the
risk-shifting effect. 49 Interestingly, we do not find statistically significant evidence that riskier Italian banks (that is, banks with lower
capital ratios or higher RWA or short-term debt) invest more in domestic sovereign debt, which is in line with our
earlier results. Domestic banks most likely have different motives to invest in own sovereign debt (over and above
the carry trade motive). 50 Panel A of Appendix Table IV reports cross-sectional tests, Panel B reports the same regressions using bank-
by-bank means which gives very similar results. An Analysis of Variance (ANOVA) helps us to identify the
sources of variation in reported sovereign bond holdings. We find that 95% of the variation can be explained by
differences between banks. The F-statistic based on Mean Squares is 62 and the p-value is < 0.001. In other words,
35
C. Moral suasion
An alternative explanation for our findings could be peripheral sovereigns forcing
domestic banks to purchase their own sovereign debt because of limited demand by other
investors (moral suasion hypothesis). The results in Panel D of Table 3 indicate that non-
intervened banks significantly increased their exposure to peripheral sovereign debt. We test
this hypothesis using our multifactor model interacting both GIPSI Sovereign Bond Index
returns and German bund returns with the indicator variable Intervened. Table 9 reports the
results for the full sample (column (1)), as well as for GIPSI banks (column (2)) and non-GIPSI
banks (column (3)).
[Table 9]
Column (1) in Table 9 shows that intervened banks have higher GIPSI sovereign bond
exposures compared to non-intervened banks and also more funding risk. However, GIPSI
banks that have not been bailed out have significant exposures to GIPSI debt (column (2)),
which indicates that our earlier results relating to moral hazard and regulatory arbitrage cannot
be explained as moral suasion of GIPSI banks. Interestingly, non-GIPSI banks have larger
GIPSI exposure and higher funding risk if they have been bailed out. European governments
bailed out domestic banks using debt guarantees rather than recapitalizing them, which left the
banking system severely under-capitalized. In other words, the design of European bailout
programs might play an important role in explaining banks’ carry trade behavior. We leave this
hypothesis for future research.
Columns (4) and (5) in Table 9 show that also in the subsample of non-intervened
banks, weakly capitalized banks had higher carry trade exposures, which is consistent with our
moral hazard and regulatory arbitrage hypotheses.
including bank fixed effects in these regressions will eliminate virtually all of the variation in sovereign bond
holdings.
36
7. Profitability of carry trades
Figure 1 shows that the yield spreads between German bunds and GIPSI bonds have
substantially compressed since summer 2012, which is likely due to unconventional measures
taken by the ECB and EU officials to contain the sovereign debt crisis. In this section, we
investigate the effects of some of these measures on sovereign bond yields and bank equity
returns.
A. Cumulative abnormal returns of sovereign bond portfolios
Panel A in Figure 6 displays the value of €1 invested in a 10-year Italian sovereign
bond on January 1, 2011 until end of June 2013. Evidently, a declining trend in the market value
of this portfolio only reversed in the second half of 2012 and this investment was not profitable.
Similarly, Panel B shows the value of €1 invested in a 10-year Italian sovereign bond on
December 21, 2011, the allotment date of the first tranche of the LTRO funds. The second
tranche was allotted on February 29, 2012. The three red lines indicate specific events that
might have helped to mitigate the fallout from the sovereign debt crisis: (1) the EU summit on
June 29, 2012, where the European Commission proposed that direct financing of banks
through the European Stability Mechanism (ESM) should be possible; (2) the announcement of
ECB chief Draghi on July 26, 2012 that he would do everything to save the euro (“Draghi
speech”); and (3) the announcement of the details of the Outright Monetary Transaction (OMT)
program in September 2012. The OMT program enables the ECB to purchase (an unlimited
amount of) sovereign bonds in the secondary market to stabilize asset prices.51 Overall, the
profitability of the trades was ultimately due to the “Draghi speech” and the OMT
announcement.
[Figure 6]
It is thus a conservative approach to assess the profitability of the purchases of
51 The ECB purchased Italian and Spanish bonds earlier in 2011. The OMT, however, differs substantially because
claims of the ECB will (for the first time) rank pari passu, that is, ECB purchases will not make other bondholders
junior claimants.
37
sovereign bonds by analyzing cumulative abnormal returns (CARs) around these events in
2012.52 We report the results in Table 10. We calculate the CARs of sovereign bonds (Panel A)
and average the CARs c for our public sample banks (Panel B) around five events: (1) LTRO
1, (2) LTRO 2, (3) the EU summit, (4) the Draghi speech, and (5) the OMT announcement.
[Table 10]
In Panel A of Table 10, we report the CARs of 10-year GIPSI bonds and German 10-
year sovereign bonds for these events.53 Interestingly, the €1 trillion injected into the financial
system in both LTRO transactions did not have a major effect on sovereign bond yields despite
some effect on Italian sovereign bond prices in the second LTRO tranche. However, the first
LTRO had a significant negative effect on German bund returns, which is consistent with the
interpretation that it substantially reduced the funding pressure of European banks. The EU
summit in June 2012 did not affect returns. In line with our observations in Figure 6, we find
significant positive CARs following the Draghi speech and, in particular, after the OMT
announcement. For example, the two-day CAR of Spanish bonds around the OMT
announcement is 4.8% and increases to 10.8% using the five-day CAR. Italian sovereign bonds
show similar CARs. German bund returns, on the other hand, exhibit significant negative
CARs, which indicates that both ECB actions helped to reduce the flight-to-quality in German
bunds. Overall, these results highlight the importance of ECB interventions designed to reduce
the bond yields of the periphery and to understand why the carry trades eventually became
profitable.
52 We ignore the funding side of the trades by assuming that they used LTRO money at an interest rate of 1%. 53 The results are based on market model adjusted abnormal bond returns. We use the Lehman Brothers EU
Sovereign Bond Index (obtained from Bloomberg) as the benchmark bond market index in computing these
abnormal returns.
38
B. Cumulative abnormal equity returns
We perform a related analysis in Panel B of Table 10, investigating average
cumulative abnormal returns (ACAR) of European public banks around the same events.54 We
also find that banks have significant abnormal return around the first tranche of the LTROs and
the OMT announcement. For example, the two-day CAR around LTRO is about 1.4%. The
results are consistent with banks benefiting from less funding pressure and suppressed
sovereign bond yields following the OMT.
C. Understanding CARs
To understand the drivers behind the abnormal returns, we regress the two-day CAR
of each bank around all five events on sovereign bond portfolio holdings (as reported in the
most recent stress test of each event) and bank characteristics (Log-Assets, Tier 1 ratio,
RWA/Assets). The number of observations corresponds to the number of banks in the stress
tests for which data are available. We report the results in Panel C of Table 10. The banks with
higher German bond holdings have somewhat lower CARs around the first LTRO tranche,
which is consistent with the interpretation that the LTRO funds reduced funding pressure for
these banks but did not help in decreasing peripheral sovereign yields. However, we find that
banks that have large holdings of Spanish and Italian sovereign debt have substantially higher
CARs around Draghi’s speech in July 2012 and the OMT announcement, which is consistent
with the CARs we reported for Italian and Spanish sovereign bonds. The measures taken by the
ECB made carry trades profitable, which increased the market value of the banks invested in
these trades.
54 The results are based on market model adjusted abnormal bond returns. We use the MSCI Europe Index
(obtained from Bloomberg) as the benchmark stock market index in computing these abnormal returns.
39
8. Conclusion
In the wake of the recent financial crisis, increasing economic divergence between the
core of Europe and the periphery have caused a surge in the yield spread of peripheral countries
(e.g., Greece, Italy, Ireland, Portugal, and Spain) and a flight to German bunds. We suggest that
European banks have placed bets on the opposite economic development — convergence —
within the euro area expecting yield spreads between, for example, Italy and Germany or Spain
and Germany to converge. These bets or “carry trades” were designed as investments in GIPSI
government bonds financed with short-term debt. As the sovereign debt crisis deepened,
European banks lost a substantial portion of their market value. In a series of cross-sectional
and time series tests, we find evidence that these trades have been widespread among European
banks, not just GIPSI banks but even non-GIPSI European banks. We find convincing evidence
for bank moral hazard and regulatory capital arbitrage in that large banks, banks with more
short-term debt, and undercapitalized banks with high risk-weighted assets, are more likely to
engage in carry trades employing low risk-weight GIPSI government bonds to earn higher and
riskier returns on their diminished economic capital while meeting regulatory capital
requirements.
Several policy implications stem from our empirical findings. First, under-capitalized
banking sectors as the European countries had at the end of the financial crisis of 2007-2009
can lead to subsequent problems through excess risk taking, a theme that is reminiscent of the
Japanese banking crisis of the 1990s (see Caballero, Hoshi and Kashyap, 2008). The European
response in Fall of 2008 and early 2009 featured more debt and asset guarantees than bank
recapitalization, unlike the U.S., and the ongoing sovereign crisis left several banks under-
capitalized to the point that their market funding dried up. The lack of capital prevents a
cleaning-up of European banks’ balance sheets and an efficient allocation of credit throughout
the economy. Popov and van Horen (2013) report that it has taken European banks much longer
to recover in terms of their global syndicated lending than other banks, largely due to the GIPSI
40
holdings.
Second, simply restoring bank capitalizations up to regulatory risk weight-based
requirements does not suffice in environments where the regulatory risk weights have become
out of sync with the market’s perception of asset risk and indeed the underlying fundamental
asset risk, the zero-risk weights on sovereign bonds of peripheral countries being far from being
risk-free to deserve such regulatory capital treatment. Worse, the continued reliance on such
outdated risk weights, as in the first two stress tests of 2010 in Europe, can give under-
capitalized banks perverse incentives to shift portfolios toward assets that have high economic
risk and return. In the case of Europe, this created a strengthening of the nexus between
sovereign and financial sectors, making sovereign debt crises in southern periphery a pan-
European concern. The stress tests of July 2011 in Europe did address the zero-risk-weight issue
more seriously and the outcomes — at least for non-GIPSI banks — have been more salubrious
and their GIPSI bond holdings have declined.
Third, the ECB’s LTRO interventions appear to have provided funding to domestic
Spanish and Italian banks to significantly build up their exposures to their sovereign debt, a
move that should have helped the sovereigns in question. However, the resulting “home bias”
in the debt holdings of these sovereigns has nevertheless strengthened the financial sector and
the sovereign’s nexus in the periphery, implying that a further deterioration of the sovereign’s
health would lead to a significant peripheral crisis, even if not a fully pan-European one in
similar magnitude [Battistini et al. (2013) provide corroborating evidence]. Again, this form of
ECB funding does not address the problem of bank recapitalization for GIPSI banks and their
incentives to load up on sovereign debt — and of their sovereigns to encourage (or not
discourage) such home bias — continue unabated.
Finally, our results highlight the link between asset-side risk and the short-term funding
problems of banks, which has been ignored in the Basel II recommendations. The Basel III
framework addresses the liquidity problems of banks by requiring them to comply with new
41
liquidity ratios. However, it is still heavily debated as to which assets count as being “liquid.”
If sovereign bonds and other risky securities fall into that category, banks will have similar
incentives to load-up on these assets as when they had zero-risk weights for capital
requirements. Going forward it will be important to investigate how bank solvency and liquidity
risk interact. When assets held by banks are risky, this generates funding problems for these
banks if they heavily rely on short-term wholesale funding. The months following the third
European stress-test showed some relief for non-GIPSI banks’ funding conditions. For the first
time, regulators stressed sovereign risk and eventually required banks to increase their
regulatory capital, which has been addressed at least by some banks issuing new equity. Non-
GIPSI banks also broadly reduced their risky sovereign debt positions. Again, this suggests that
banks’ incentives to accumulate risky assets is driven by low capital requirements to hold them
on their balance sheets and similar regulatory arbitrage of Basel III liquidity requirements will
have to be addressed by the regulators.
42
References
Acharya, V., Drechsler, I. and Schnabl, P. (2013) ‘A Pyrrhic Victory? – Bank Bailouts and
Sovereign Credit Risk’, Journal of Finance, forthcoming.
Acharya, V., Engle, R. and D. Pierret. (2013) ‘Testing Macroprudential Stress Tests: The Risk
of Regulatory Risk Weights’, working paper, NYU-Stern.
Acharya, V. and Rajan, R.G. (2011) ‘Sovereign Debt, Government Myopia and the Financial
Sector’, Review of Financial Studies, forthcoming.
Acharya, V., Schnabl, P. and Suarez, G. (2011) ‘Securitization without Risk Transfer’, Journal
of Financial Economics, forthcoming.
A&S (2013) ‘Bank of Cyprus – Holdings of Greek Government Bonds (Prepared for the Central
Bank of Cyprus)’, Investigation Report Alvarez & Marsal Global Forensic and Dispute
Services, LLP.
Battistini, N., M. Pagano, and S. Simonelli (2013) ‘Systemic Risk, Sovereign Yields and Bank
Exposures in the Euro Crisis’, Working Paper.
Becker, Bo and Ivashina, V. (2013) ‘Reaching for Yield in the Bond Market’, Journal of
Finance, forthcoming.
Bolton, P. and Jeanne, O. (2011) ‘Sovereign default and bank fragility in financially integrated
economies’, NBER working paper, 16899.
Boyson, N.M., Fahlenbrach, R., and Stulz, R. (2013) ‘Trust Preferred Securities and Regulatory
Arbitrage’, working paper.
Broner, F., Martin, A. and Ventura, J. (2010) ‘Sovereign risk and secondary markets’, American
Economic Review 100, pp. 1523–1555.
Caballero, R.J., Hoshi, T., and Kashyap, A.K. (2008) ‘Zombie Lending and Depressed
Restructuring in Japan’ American Economic Review 98 (5), 1943 – 1977.
Chernenko S., and A. Sunderam (2012) ‘Frictions in Shadow Banking: Evidence from Lending
Behavior of Money Market Funds’, Working Paper, Ohio State University.
Diamond, D. and Rajan, R.G. (2011) ‘Fear of Fire Sales and the Credit Freeze’, Quarterly
Journal of Economics, 126(2), pp. 557–591.
Duffie, D. (2011). ‘How Big Banks Fail and What to Do About It’, Princeton University Press,
Princeton and Oxford.
EBA, (2010) ‘Aggregate outcome of the 2010 EU wide stress test exercise coordinated by
CEBS in cooperation with the ECB’, available at: http://stress-test.c-
ebs.org/documents/Summaryreport.pdf.
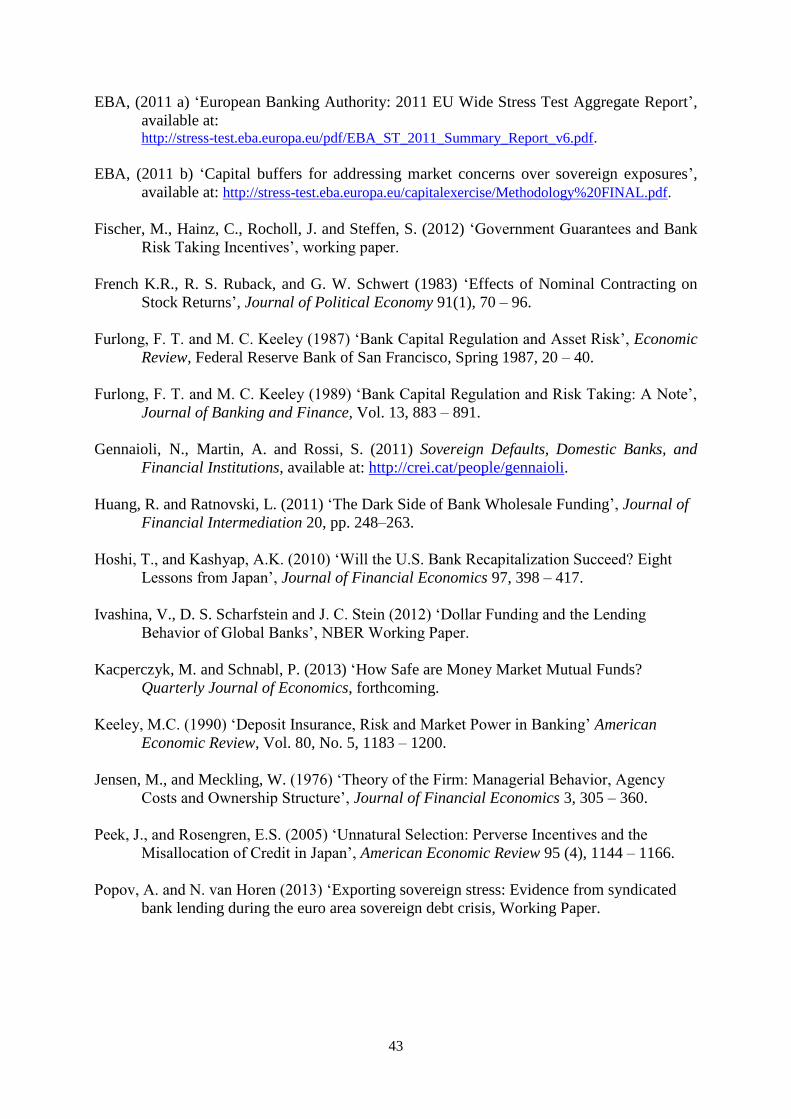
43
EBA, (2011 a) ‘European Banking Authority: 2011 EU Wide Stress Test Aggregate Report’,
available at: http://stress-test.eba.europa.eu/pdf/EBA_ST_2011_Summary_Report_v6.pdf.
EBA, (2011 b) ‘Capital buffers for addressing market concerns over sovereign exposures’,
available at: http://stress-test.eba.europa.eu/capitalexercise/Methodology%20FINAL.pdf.
Fischer, M., Hainz, C., Rocholl, J. and Steffen, S. (2012) ‘Government Guarantees and Bank
Risk Taking Incentives’, working paper.
French K.R., R. S. Ruback, and G. W. Schwert (1983) ‘Effects of Nominal Contracting on
Stock Returns’, Journal of Political Economy 91(1), 70 – 96.
Furlong, F. T. and M. C. Keeley (1987) ‘Bank Capital Regulation and Asset Risk’, Economic
Review, Federal Reserve Bank of San Francisco, Spring 1987, 20 – 40.
Furlong, F. T. and M. C. Keeley (1989) ‘Bank Capital Regulation and Risk Taking: A Note’,
Journal of Banking and Finance, Vol. 13, 883 – 891.
Gennaioli, N., Martin, A. and Rossi, S. (2011) Sovereign Defaults, Domestic Banks, and
Financial Institutions, available at: http://crei.cat/people/gennaioli.
Huang, R. and Ratnovski, L. (2011) ‘The Dark Side of Bank Wholesale Funding’, Journal of
Financial Intermediation 20, pp. 248–263.
Hoshi, T., and Kashyap, A.K. (2010) ‘Will the U.S. Bank Recapitalization Succeed? Eight
Lessons from Japan’, Journal of Financial Economics 97, 398 – 417.
Ivashina, V., D. S. Scharfstein and J. C. Stein (2012) ‘Dollar Funding and the Lending
Behavior of Global Banks’, NBER Working Paper.
Kacperczyk, M. and Schnabl, P. (2013) ‘How Safe are Money Market Mutual Funds?
Quarterly Journal of Economics, forthcoming.
Keeley, M.C. (1990) ‘Deposit Insurance, Risk and Market Power in Banking’ American
Economic Review, Vol. 80, No. 5, 1183 – 1200.
Jensen, M., and Meckling, W. (1976) ‘Theory of the Firm: Managerial Behavior, Agency
Costs and Ownership Structure’, Journal of Financial Economics 3, 305 – 360.
Peek, J., and Rosengren, E.S. (2005) ‘Unnatural Selection: Perverse Incentives and the
Misallocation of Credit in Japan’, American Economic Review 95 (4), 1144 – 1166.
Popov, A. and N. van Horen (2013) ‘Exporting sovereign stress: Evidence from syndicated
bank lending during the euro area sovereign debt crisis, Working Paper.
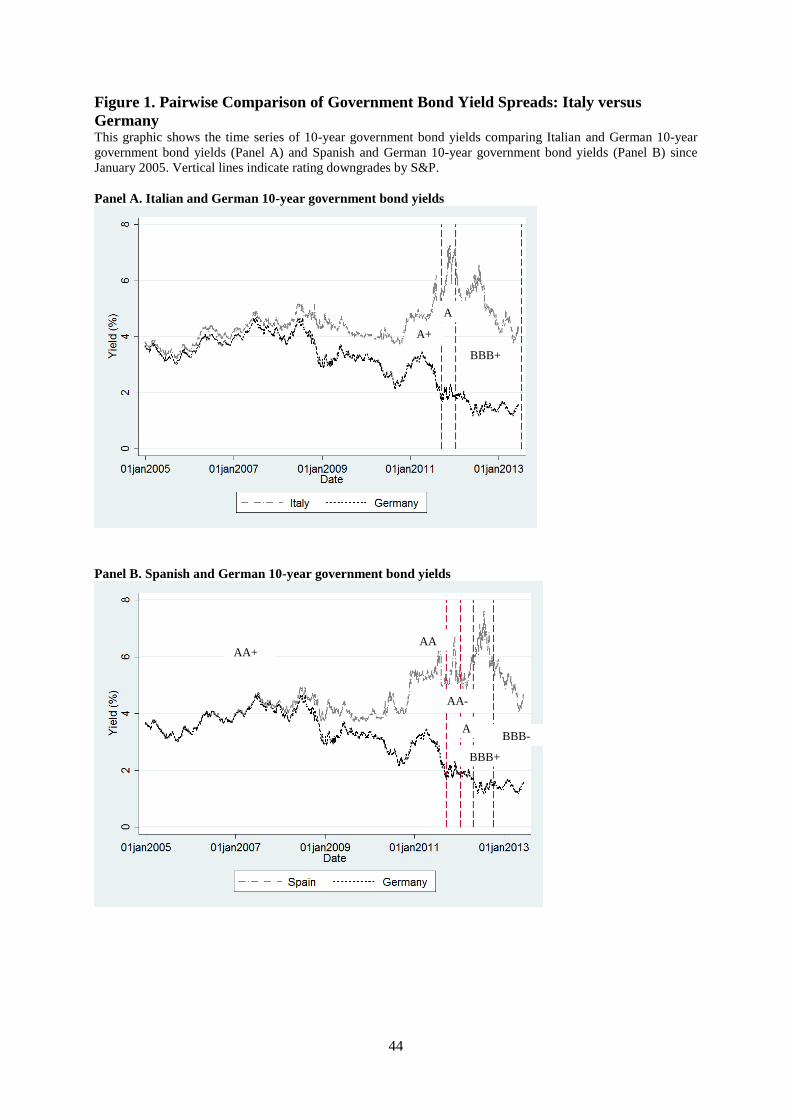
44
Figure 1. Pairwise Comparison of Government Bond Yield Spreads: Italy versus
Germany This graphic shows the time series of 10-year government bond yields comparing Italian and German 10-year
government bond yields (Panel A) and Spanish and German 10-year government bond yields (Panel B) since
January 2005. Vertical lines indicate rating downgrades by S&P.
Panel A. Italian and German 10-year government bond yields
Panel B. Spanish and German 10-year government bond yields
A
BBB+
A+
+A
AA+ AA
AA-
AA_
AA- A
A
A
_
A
A
-
BBB+
BBB-
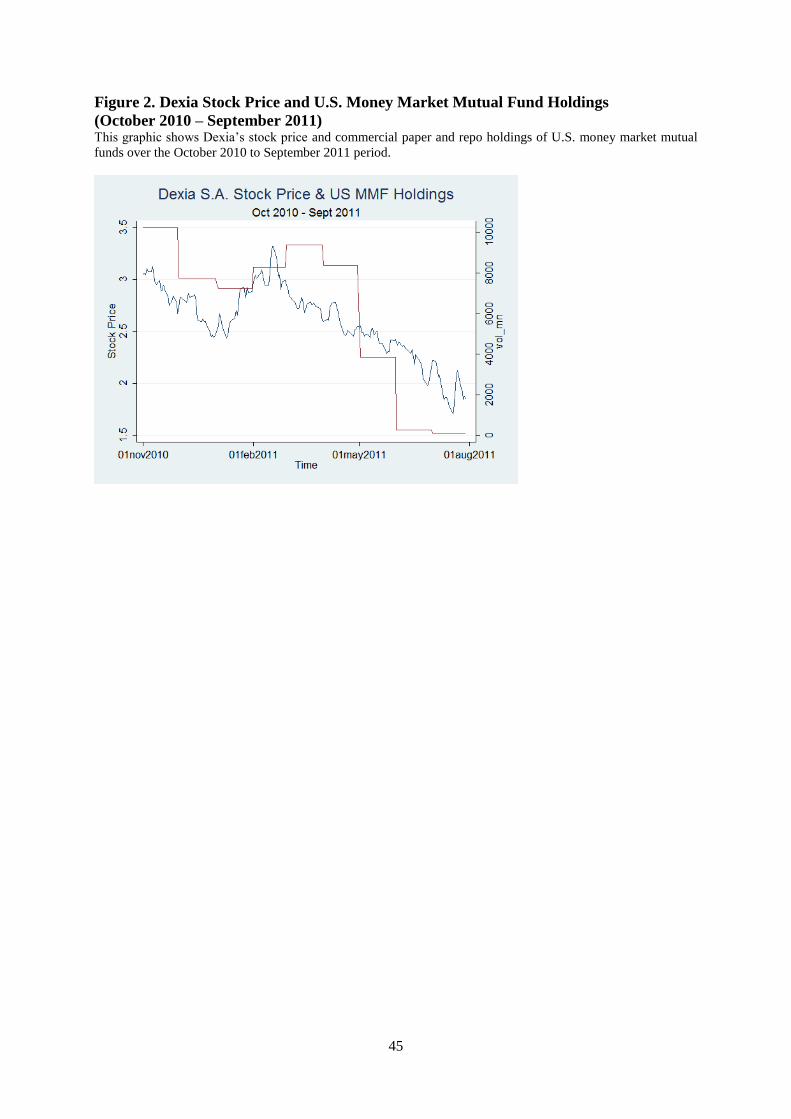
45
Figure 2. Dexia Stock Price and U.S. Money Market Mutual Fund Holdings
(October 2010 – September 2011) This graphic shows Dexia’s stock price and commercial paper and repo holdings of U.S. money market mutual
funds over the October 2010 to September 2011 period.
46
Figure 3. A. Factor Loadings and Bond Portfolio Holdings This figure is a scatter plot of beta (GIPSI) estimated during the EBA stress test periods on average GIPSI
sovereign bond holdings during this period scaled by lagged total assets. Panel A shows this separately for GIPSI
and non-GIPSI banks.
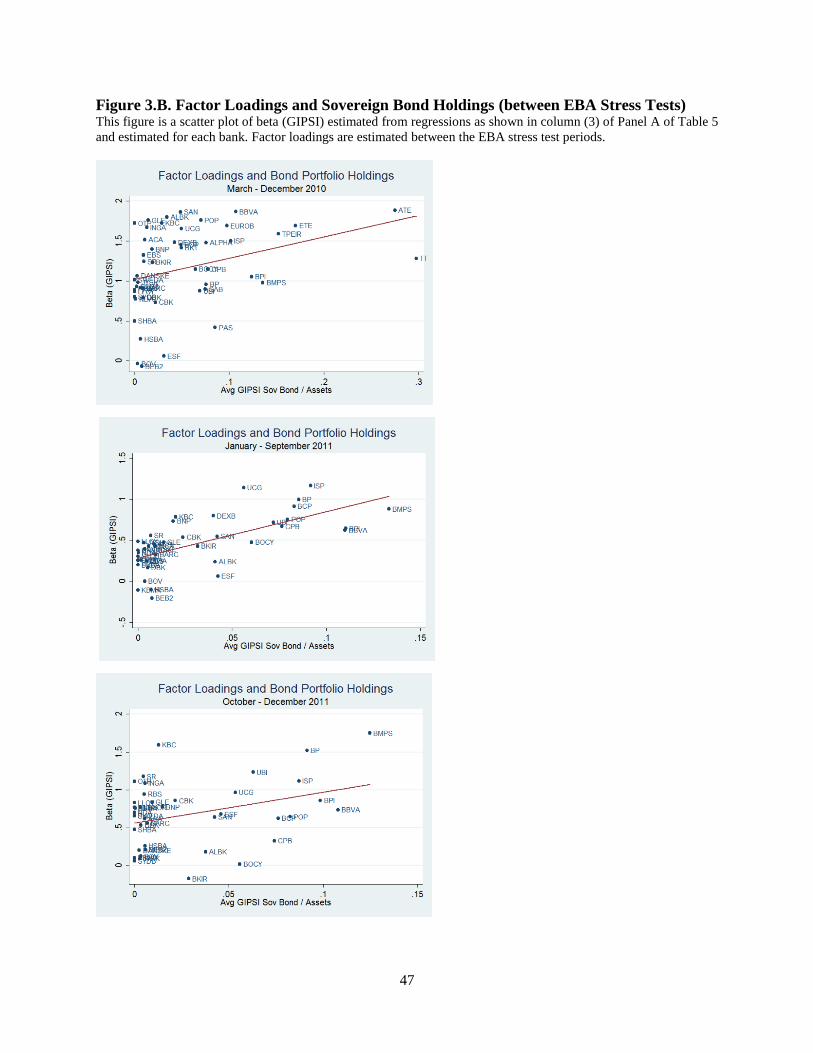
47
Figure 3.B. Factor Loadings and Sovereign Bond Holdings (between EBA Stress Tests) This figure is a scatter plot of beta (GIPSI) estimated from regressions as shown in column (3) of Panel A of Table 5
and estimated for each bank. Factor loadings are estimated between the EBA stress test periods.
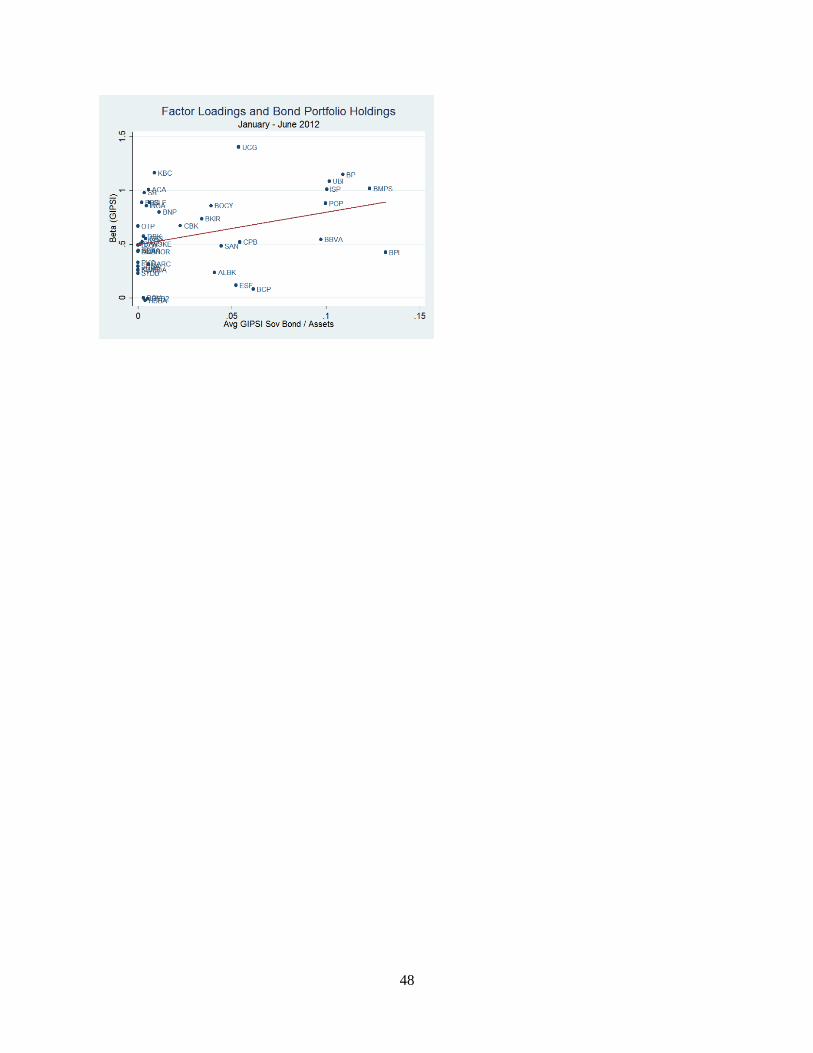
48
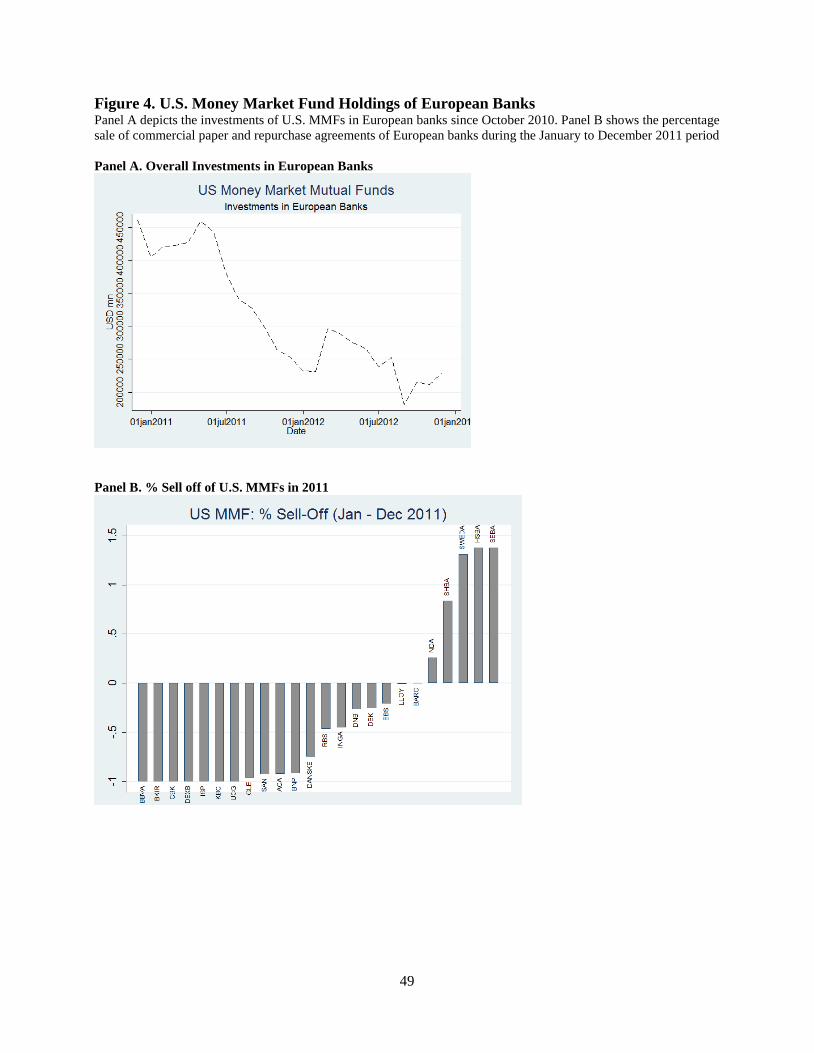
49
Figure 4. U.S. Money Market Fund Holdings of European Banks Panel A depicts the investments of U.S. MMFs in European banks since October 2010. Panel B shows the percentage
sale of commercial paper and repurchase agreements of European banks during the January to December 2011 period
Panel A. Overall Investments in European Banks
Panel B. % Sell off of U.S. MMFs in 2011
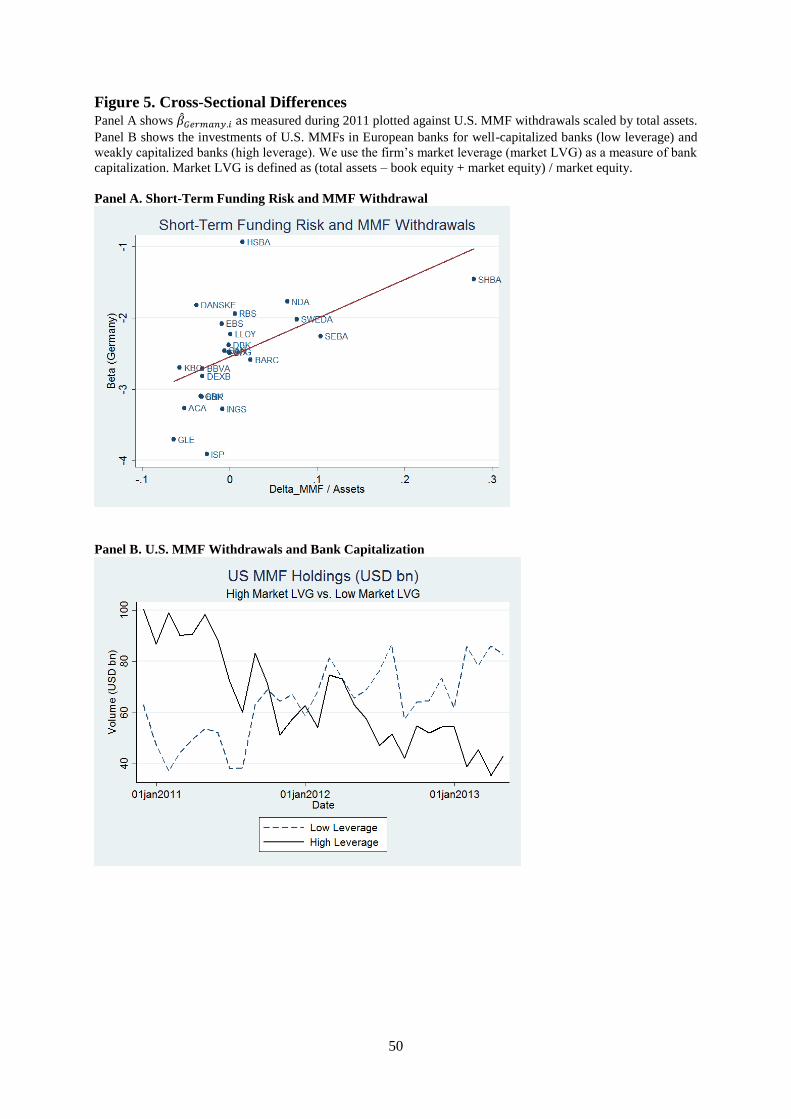
50
Figure 5. Cross-Sectional Differences Panel A shows �̂�𝐺𝑒𝑟𝑚𝑎𝑛𝑦.𝑖 as measured during 2011 plotted against U.S. MMF withdrawals scaled by total assets.
Panel B shows the investments of U.S. MMFs in European banks for well-capitalized banks (low leverage) and
weakly capitalized banks (high leverage). We use the firm’s market leverage (market LVG) as a measure of bank
capitalization. Market LVG is defined as (total assets – book equity + market equity) / market equity.
Panel A. Short-Term Funding Risk and MMF Withdrawal
Panel B. U.S. MMF Withdrawals and Bank Capitalization
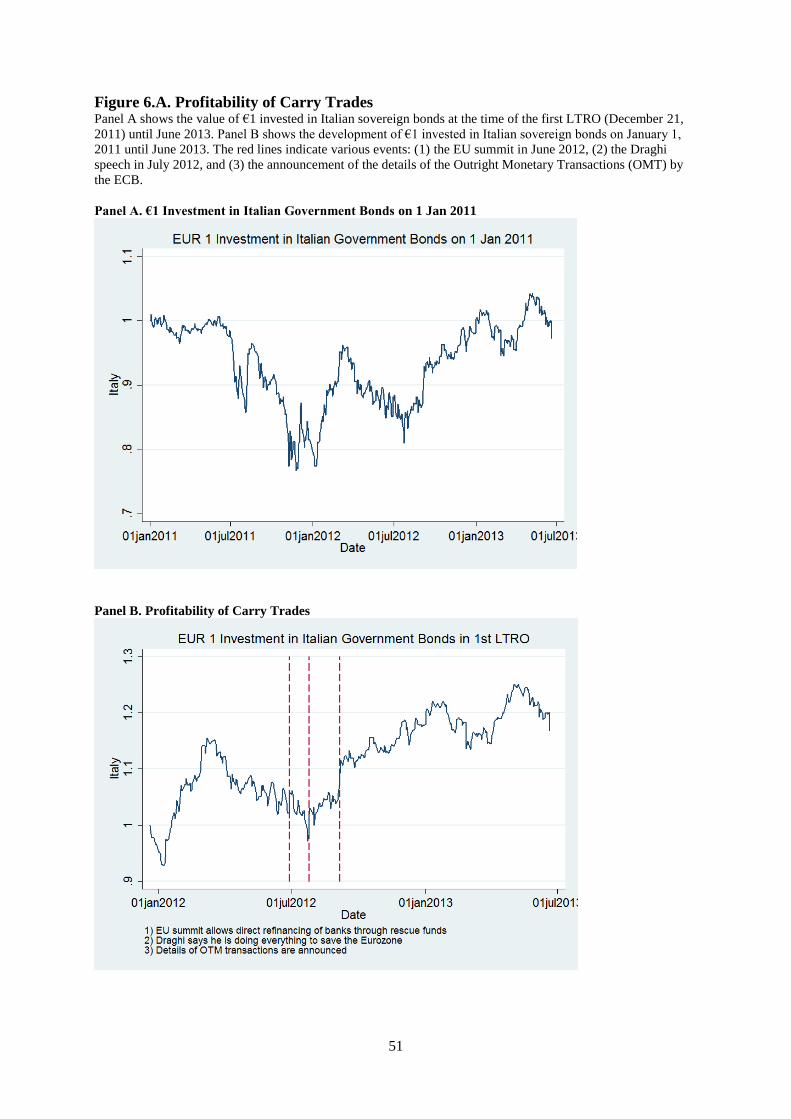
51
Figure 6.A. Profitability of Carry Trades Panel A shows the value of €1 invested in Italian sovereign bonds at the time of the first LTRO (December 21,
2011) until June 2013. Panel B shows the development of €1 invested in Italian sovereign bonds on January 1,
2011 until June 2013. The red lines indicate various events: (1) the EU summit in June 2012, (2) the Draghi
speech in July 2012, and (3) the announcement of the details of the Outright Monetary Transactions (OMT) by
the ECB.
Panel A. €1 Investment in Italian Government Bonds on 1 Jan 2011
Panel B. Profitability of Carry Trades
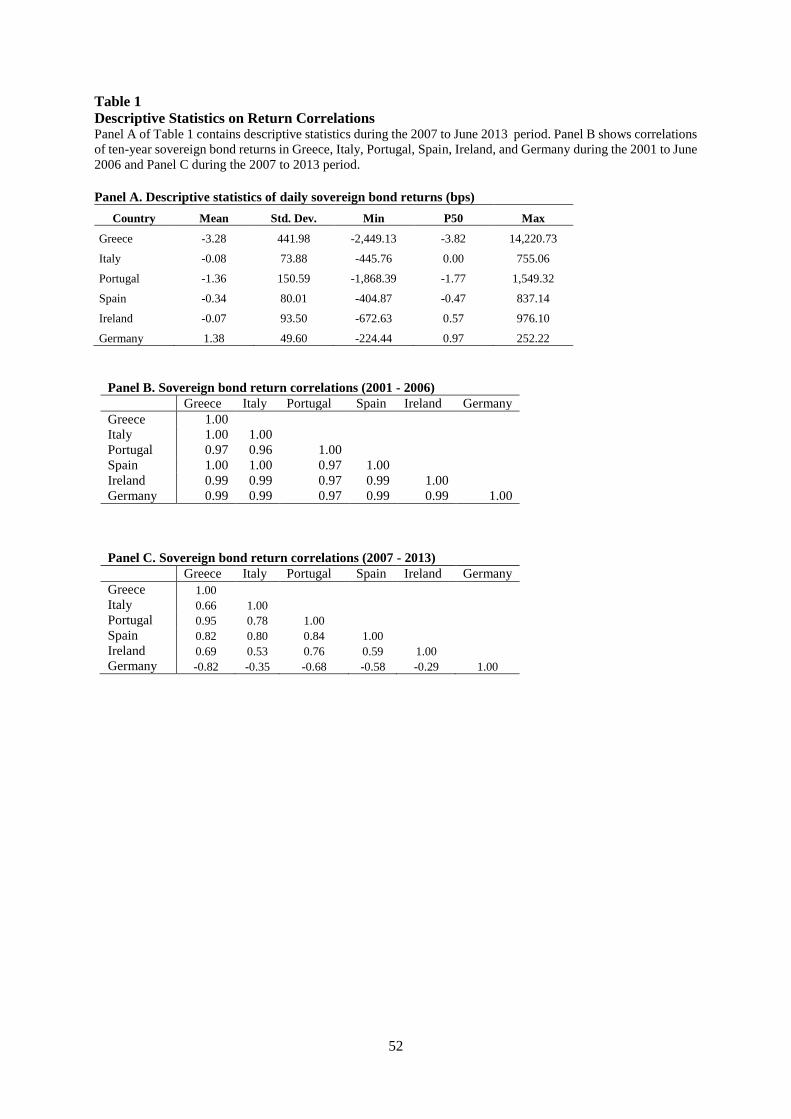
52
Table 1
Descriptive Statistics on Return Correlations Panel A of Table 1 contains descriptive statistics during the 2007 to June 2013 period. Panel B shows correlations
of ten-year sovereign bond returns in Greece, Italy, Portugal, Spain, Ireland, and Germany during the 2001 to June
2006 and Panel C during the 2007 to 2013 period. Panel A. Descriptive statistics of daily sovereign bond returns (bps)
Country Mean Std. Dev. Min P50 Max
Greece -3.28 441.98 -2,449.13 -3.82 14,220.73
Italy -0.08 73.88 -445.76 0.00 755.06
Portugal -1.36 150.59 -1,868.39 -1.77 1,549.32
Spain -0.34 80.01 -404.87 -0.47 837.14
Ireland -0.07 93.50 -672.63 0.57 976.10
Germany 1.38 49.60 -224.44 0.97 252.22
Panel B. Sovereign bond return correlations (2001 - 2006)
Greece Italy Portugal Spain Ireland Germany
Greece 1.00
Italy 1.00 1.00
Portugal 0.97 0.96 1.00
Spain 1.00 1.00 0.97 1.00
Ireland 0.99 0.99 0.97 0.99 1.00
Germany 0.99 0.99 0.97 0.99 0.99 1.00
Panel C. Sovereign bond return correlations (2007 - 2013)
Greece Italy Portugal Spain Ireland Germany
Greece 1.00
Italy 0.66 1.00
Portugal 0.95 0.78 1.00
Spain 0.82 0.80 0.84 1.00
Ireland 0.69 0.53 0.76 0.59 1.00
Germany -0.82 -0.35 -0.68 -0.58 -0.29 1.00
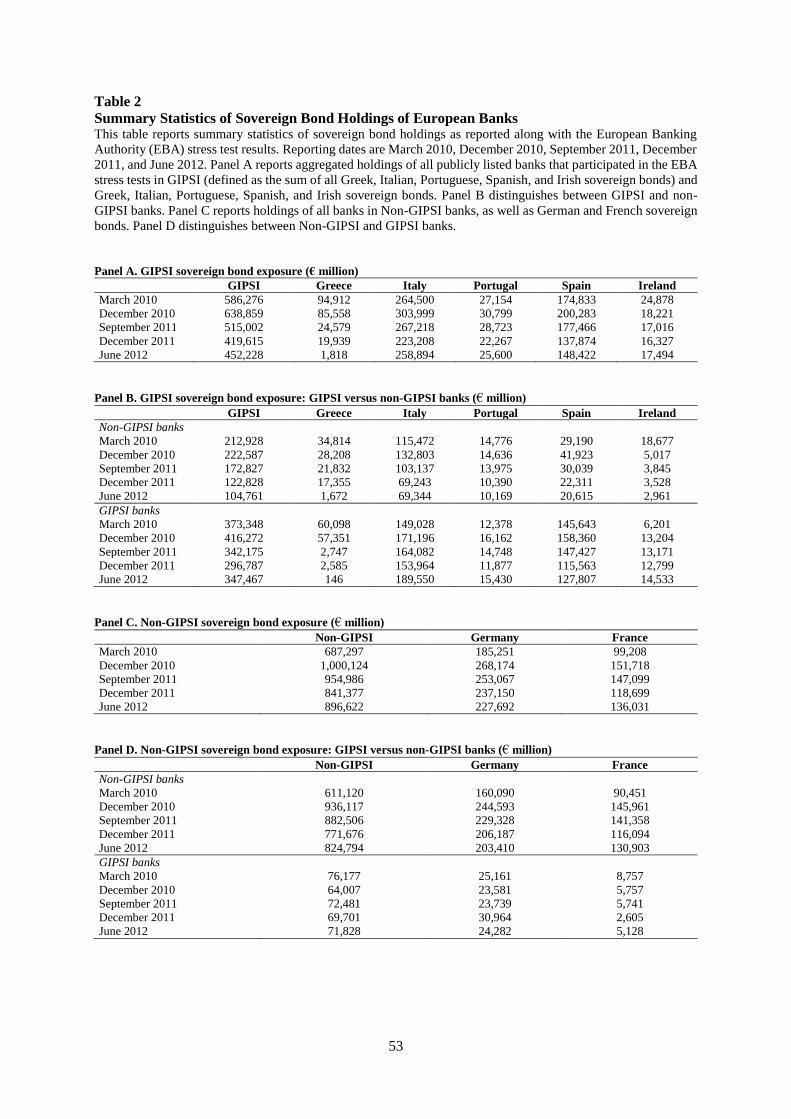
53
Table 2
Summary Statistics of Sovereign Bond Holdings of European Banks This table reports summary statistics of sovereign bond holdings as reported along with the European Banking
Authority (EBA) stress test results. Reporting dates are March 2010, December 2010, September 2011, December
2011, and June 2012. Panel A reports aggregated holdings of all publicly listed banks that participated in the EBA
stress tests in GIPSI (defined as the sum of all Greek, Italian, Portuguese, Spanish, and Irish sovereign bonds) and
Greek, Italian, Portuguese, Spanish, and Irish sovereign bonds. Panel B distinguishes between GIPSI and non-
GIPSI banks. Panel C reports holdings of all banks in Non-GIPSI banks, as well as German and French sovereign
bonds. Panel D distinguishes between Non-GIPSI and GIPSI banks.
Panel A. GIPSI sovereign bond exposure (€ million)
GIPSI Greece Italy Portugal Spain Ireland
March 2010 586,276 94,912 264,500 27,154 174,833 24,878
December 2010 638,859 85,558 303,999 30,799 200,283 18,221
September 2011 515,002 24,579 267,218 28,723 177,466 17,016
December 2011 419,615 19,939 223,208 22,267 137,874 16,327
June 2012 452,228 1,818 258,894 25,600 148,422 17,494
Panel B. GIPSI sovereign bond exposure: GIPSI versus non-GIPSI banks (€ million)
GIPSI Greece Italy Portugal Spain Ireland
Non-GIPSI banks
March 2010 212,928 34,814 115,472 14,776 29,190 18,677
December 2010 222,587 28,208 132,803 14,636 41,923 5,017
September 2011 172,827 21,832 103,137 13,975 30,039 3,845
December 2011 122,828 17,355 69,243 10,390 22,311 3,528
June 2012 104,761 1,672 69,344 10,169 20,615 2,961
GIPSI banks
March 2010 373,348 60,098 149,028 12,378 145,643 6,201
December 2010 416,272 57,351 171,196 16,162 158,360 13,204
September 2011 342,175 2,747 164,082 14,748 147,427 13,171
December 2011 296,787 2,585 153,964 11,877 115,563 12,799
June 2012 347,467 146 189,550 15,430 127,807 14,533
Panel C. Non-GIPSI sovereign bond exposure (€ million)
Non-GIPSI Germany France
March 2010 687,297 185,251 99,208
December 2010 1,000,124 268,174 151,718
September 2011 954,986 253,067 147,099
December 2011 841,377 237,150 118,699
June 2012 896,622 227,692 136,031
Panel D. Non-GIPSI sovereign bond exposure: GIPSI versus non-GIPSI banks (€ million)
Non-GIPSI Germany France
Non-GIPSI banks
March 2010 611,120 160,090 90,451
December 2010 936,117 244,593 145,961
September 2011 882,506 229,328 141,358
December 2011 771,676 206,187 116,094
June 2012 824,794 203,410 130,903
GIPSI banks
March 2010 76,177 25,161 8,757
December 2010 64,007 23,581 5,757
September 2011 72,481 23,739 5,741
December 2011 69,701 30,964 2,605
June 2012 71,828 24,282 5,128
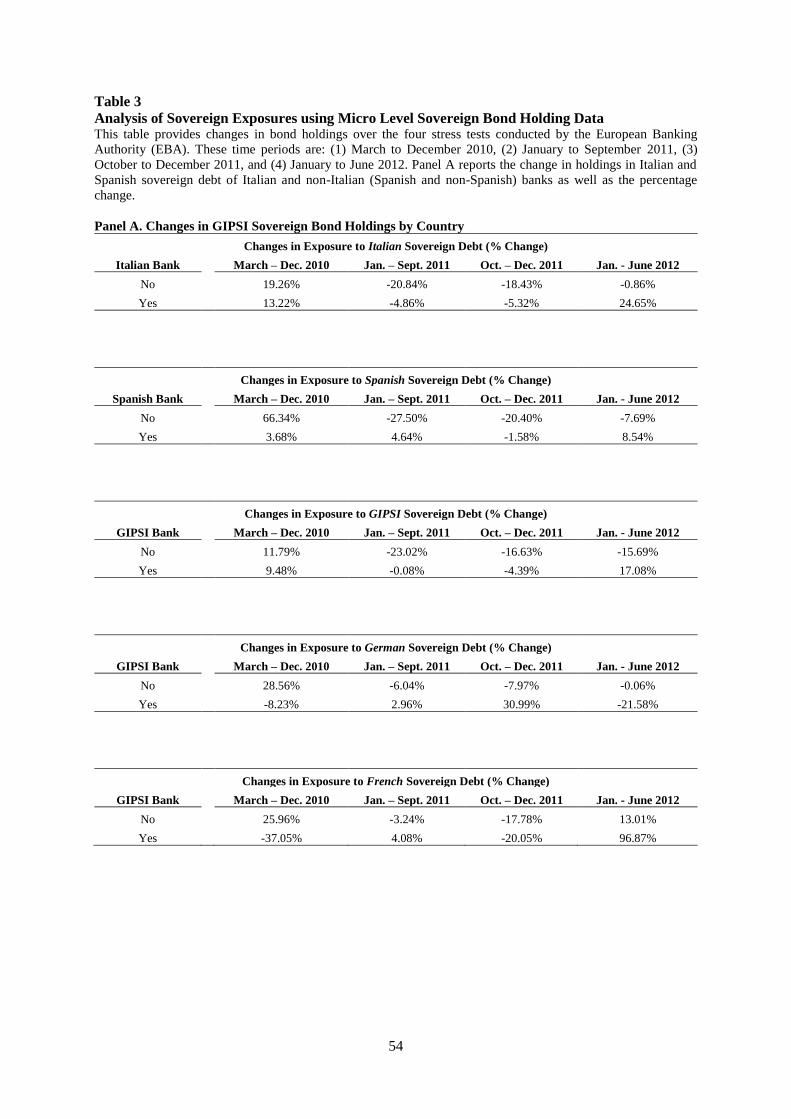
54
Table 3
Analysis of Sovereign Exposures using Micro Level Sovereign Bond Holding Data This table provides changes in bond holdings over the four stress tests conducted by the European Banking
Authority (EBA). These time periods are: (1) March to December 2010, (2) January to September 2011, (3)
October to December 2011, and (4) January to June 2012. Panel A reports the change in holdings in Italian and
Spanish sovereign debt of Italian and non-Italian (Spanish and non-Spanish) banks as well as the percentage
change.
Panel A. Changes in GIPSI Sovereign Bond Holdings by Country
Changes in Exposure to Italian Sovereign Debt (% Change)
Italian Bank March – Dec. 2010 Jan. – Sept. 2011 Oct. – Dec. 2011 Jan. - June 2012
No 19.26% -20.84% -18.43% -0.86%
Yes 13.22% -4.86% -5.32% 24.65%
Changes in Exposure to Spanish Sovereign Debt (% Change)
Spanish Bank March – Dec. 2010 Jan. – Sept. 2011 Oct. – Dec. 2011 Jan. - June 2012
No 66.34% -27.50% -20.40% -7.69%
Yes 3.68% 4.64% -1.58% 8.54%
Changes in Exposure to GIPSI Sovereign Debt (% Change)
GIPSI Bank March – Dec. 2010 Jan. – Sept. 2011 Oct. – Dec. 2011 Jan. - June 2012
No 11.79% -23.02% -16.63% -15.69%
Yes 9.48% -0.08% -4.39% 17.08%
Changes in Exposure to German Sovereign Debt (% Change)
GIPSI Bank March – Dec. 2010 Jan. – Sept. 2011 Oct. – Dec. 2011 Jan. - June 2012
No 28.56% -6.04% -7.97% -0.06%
Yes -8.23% 2.96% 30.99% -21.58%
Changes in Exposure to French Sovereign Debt (% Change)
GIPSI Bank March – Dec. 2010 Jan. – Sept. 2011 Oct. – Dec. 2011 Jan. - June 2012
No 25.96% -3.24% -17.78% 13.01%
Yes -37.05% 4.08% -20.05% 96.87%
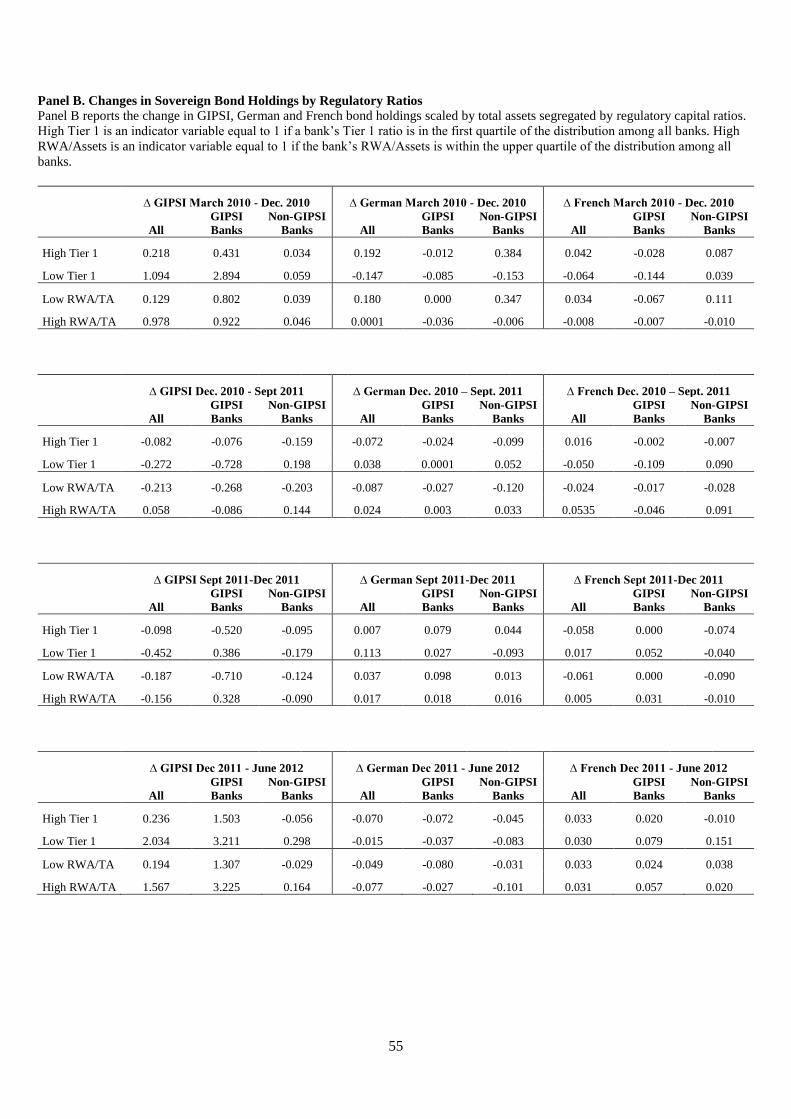
55
Panel B. Changes in Sovereign Bond Holdings by Regulatory Ratios
Panel B reports the change in GIPSI, German and French bond holdings scaled by total assets segregated by regulatory capital ratios.
High Tier 1 is an indicator variable equal to 1 if a bank’s Tier 1 ratio is in the first quartile of the distribution among all banks. High
RWA/Assets is an indicator variable equal to 1 if the bank’s RWA/Assets is within the upper quartile of the distribution among all
banks.
∆ GIPSI March 2010 - Dec. 2010 ∆ German March 2010 - Dec. 2010 ∆ French March 2010 - Dec. 2010
All
GIPSI
Banks
Non-GIPSI
Banks All
GIPSI
Banks
Non-GIPSI
Banks All
GIPSI
Banks
Non-GIPSI
Banks
High Tier 1 0.218 0.431 0.034 0.192 -0.012 0.384 0.042 -0.028 0.087
Low Tier 1 1.094 2.894 0.059 -0.147 -0.085 -0.153 -0.064 -0.144 0.039
Low RWA/TA 0.129 0.802 0.039 0.180 0.000 0.347 0.034 -0.067 0.111
High RWA/TA 0.978 0.922 0.046 0.0001 -0.036 -0.006 -0.008 -0.007 -0.010
∆ GIPSI Dec. 2010 - Sept 2011 ∆ German Dec. 2010 – Sept. 2011 ∆ French Dec. 2010 – Sept. 2011
All
GIPSI
Banks
Non-GIPSI
Banks All
GIPSI
Banks
Non-GIPSI
Banks All
GIPSI
Banks
Non-GIPSI
Banks
High Tier 1 -0.082 -0.076 -0.159 -0.072 -0.024 -0.099 0.016 -0.002 -0.007
Low Tier 1 -0.272 -0.728 0.198 0.038 0.0001 0.052 -0.050 -0.109 0.090
Low RWA/TA -0.213 -0.268 -0.203 -0.087 -0.027 -0.120 -0.024 -0.017 -0.028
High RWA/TA 0.058 -0.086 0.144 0.024 0.003 0.033 0.0535 -0.046 0.091
∆ GIPSI Sept 2011-Dec 2011 ∆ German Sept 2011-Dec 2011 ∆ French Sept 2011-Dec 2011
All
GIPSI
Banks
Non-GIPSI
Banks All
GIPSI
Banks
Non-GIPSI
Banks All
GIPSI
Banks
Non-GIPSI
Banks
High Tier 1 -0.098 -0.520 -0.095 0.007 0.079 0.044 -0.058 0.000 -0.074
Low Tier 1 -0.452 0.386 -0.179 0.113 0.027 -0.093 0.017 0.052 -0.040
Low RWA/TA -0.187 -0.710 -0.124 0.037 0.098 0.013 -0.061 0.000 -0.090
High RWA/TA -0.156 0.328 -0.090 0.017 0.018 0.016 0.005 0.031 -0.010
∆ GIPSI Dec 2011 - June 2012 ∆ German Dec 2011 - June 2012 ∆ French Dec 2011 - June 2012
All
GIPSI
Banks
Non-GIPSI
Banks All
GIPSI
Banks
Non-GIPSI
Banks All
GIPSI
Banks
Non-GIPSI
Banks
High Tier 1 0.236 1.503 -0.056 -0.070 -0.072 -0.045 0.033 0.020 -0.010
Low Tier 1 2.034 3.211 0.298 -0.015 -0.037 -0.083 0.030 0.079 0.151
Low RWA/TA 0.194 1.307 -0.029 -0.049 -0.080 -0.031 0.033 0.024 0.038
High RWA/TA 1.567 3.225 0.164 -0.077 -0.027 -0.101 0.031 0.057 0.020
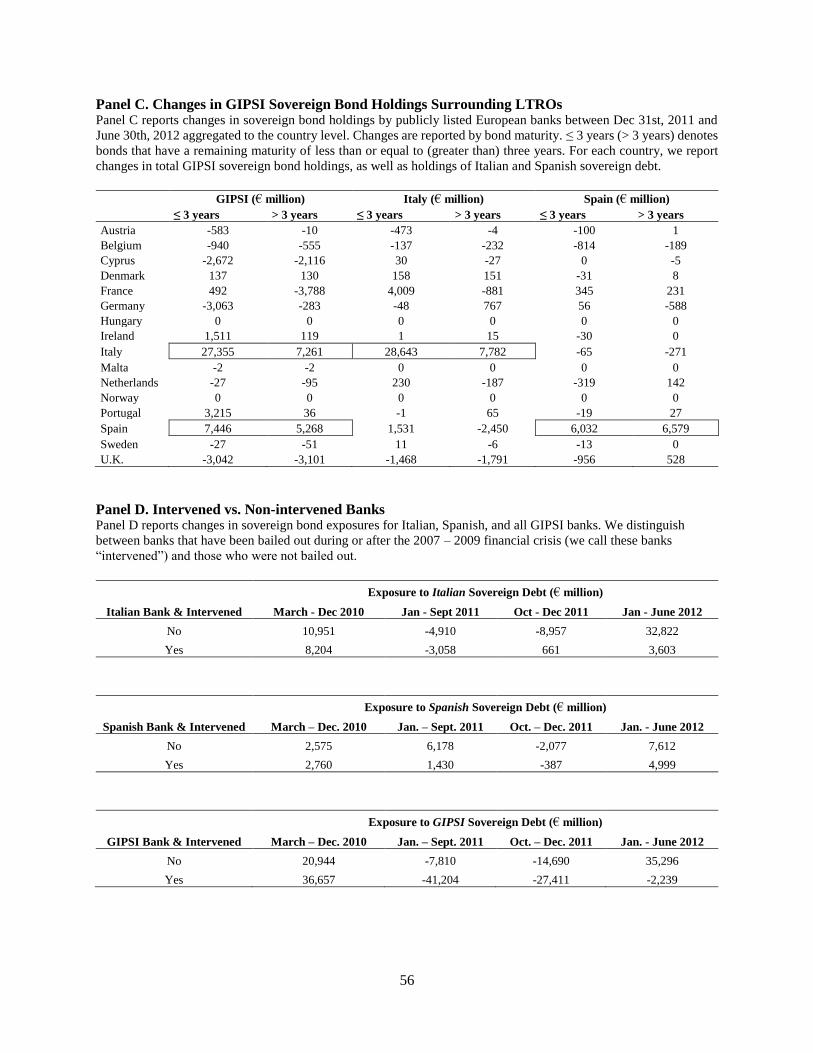
56
Panel C. Changes in GIPSI Sovereign Bond Holdings Surrounding LTROs Panel C reports changes in sovereign bond holdings by publicly listed European banks between Dec 31st, 2011 and
June 30th, 2012 aggregated to the country level. Changes are reported by bond maturity. ≤ 3 years (> 3 years) denotes
bonds that have a remaining maturity of less than or equal to (greater than) three years. For each country, we report
changes in total GIPSI sovereign bond holdings, as well as holdings of Italian and Spanish sovereign debt.
GIPSI (€ million) Italy (€ million) Spain (€ million)
≤ 3 years > 3 years ≤ 3 years > 3 years ≤ 3 years > 3 years
Austria -583 -10 -473 -4 -100 1
Belgium -940 -555 -137 -232 -814 -189
Cyprus -2,672 -2,116 30 -27 0 -5
Denmark 137 130 158 151 -31 8
France 492 -3,788 4,009 -881 345 231
Germany -3,063 -283 -48 767 56 -588
Hungary 0 0 0 0 0 0
Ireland 1,511 119 1 15 -30 0
Italy 27,355 7,261 28,643 7,782 -65 -271
Malta -2 -2 0 0 0 0
Netherlands -27 -95 230 -187 -319 142
Norway 0 0 0 0 0 0
Portugal 3,215 36 -1 65 -19 27
Spain 7,446 5,268 1,531 -2,450 6,032 6,579
Sweden -27 -51 11 -6 -13 0
U.K. -3,042 -3,101 -1,468 -1,791 -956 528
Panel D. Intervened vs. Non-intervened Banks Panel D reports changes in sovereign bond exposures for Italian, Spanish, and all GIPSI banks. We distinguish
between banks that have been bailed out during or after the 2007 – 2009 financial crisis (we call these banks
“intervened”) and those who were not bailed out.
Exposure to Italian Sovereign Debt (€ million)
Italian Bank & Intervened March - Dec 2010 Jan - Sept 2011 Oct - Dec 2011 Jan - June 2012
No 10,951 -4,910 -8,957 32,822
Yes 8,204 -3,058 661 3,603
Exposure to Spanish Sovereign Debt (€ million)
Spanish Bank & Intervened March – Dec. 2010 Jan. – Sept. 2011 Oct. – Dec. 2011 Jan. - June 2012
No 2,575 6,178 -2,077 7,612
Yes 2,760 1,430 -387 4,999
Exposure to GIPSI Sovereign Debt (€ million)
GIPSI Bank & Intervened March – Dec. 2010 Jan. – Sept. 2011 Oct. – Dec. 2011 Jan. - June 2012
No 20,944 -7,810 -14,690 35,296
Yes 36,657 -41,204 -27,411 -2,239
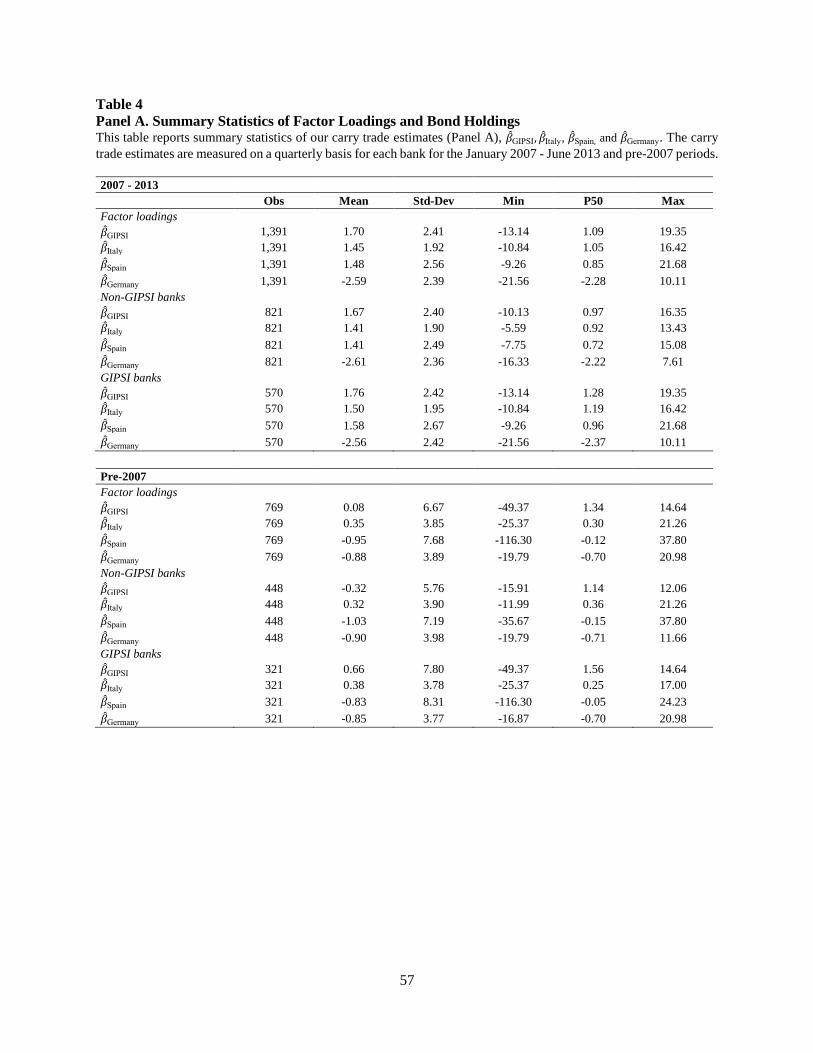
57
Table 4
Panel A. Summary Statistics of Factor Loadings and Bond Holdings This table reports summary statistics of our carry trade estimates (Panel A), �̂�GIPSI, �̂�Italy, �̂�Spain, and �̂�Germany. The carry
trade estimates are measured on a quarterly basis for each bank for the January 2007 - June 2013 and pre-2007 periods.
2007 - 2013
Obs Mean Std-Dev Min P50 Max
Factor loadings
�̂�GIPSI 1,391 1.70 2.41 -13.14 1.09 19.35
�̂�Italy 1,391 1.45 1.92 -10.84 1.05 16.42
�̂�Spain 1,391 1.48 2.56 -9.26 0.85 21.68
�̂�Germany 1,391 -2.59 2.39 -21.56 -2.28 10.11
Non-GIPSI banks
�̂�GIPSI 821 1.67 2.40 -10.13 0.97 16.35
�̂�Italy 821 1.41 1.90 -5.59 0.92 13.43
�̂�Spain 821 1.41 2.49 -7.75 0.72 15.08
�̂�Germany 821 -2.61 2.36 -16.33 -2.22 7.61
GIPSI banks
�̂�GIPSI 570 1.76 2.42 -13.14 1.28 19.35
�̂�Italy 570 1.50 1.95 -10.84 1.19 16.42
�̂�Spain 570 1.58 2.67 -9.26 0.96 21.68
�̂�Germany 570 -2.56 2.42 -21.56 -2.37 10.11
Pre-2007
Factor loadings
�̂�GIPSI 769 0.08 6.67 -49.37 1.34 14.64
�̂�Italy 769 0.35 3.85 -25.37 0.30 21.26
�̂�Spain 769 -0.95 7.68 -116.30 -0.12 37.80
�̂�Germany 769 -0.88 3.89 -19.79 -0.70 20.98
Non-GIPSI banks
�̂�GIPSI 448 -0.32 5.76 -15.91 1.14 12.06
�̂�Italy 448 0.32 3.90 -11.99 0.36 21.26
�̂�Spain 448 -1.03 7.19 -35.67 -0.15 37.80
�̂�Germany 448 -0.90 3.98 -19.79 -0.71 11.66
GIPSI banks
�̂�GIPSI 321 0.66 7.80 -49.37 1.56 14.64
�̂�Italy 321 0.38 3.78 -25.37 0.25 17.00
�̂�Spain 321 -0.83 8.31 -116.30 -0.05 24.23
�̂�Germany 321 -0.85 3.77 -16.87 -0.70 20.98
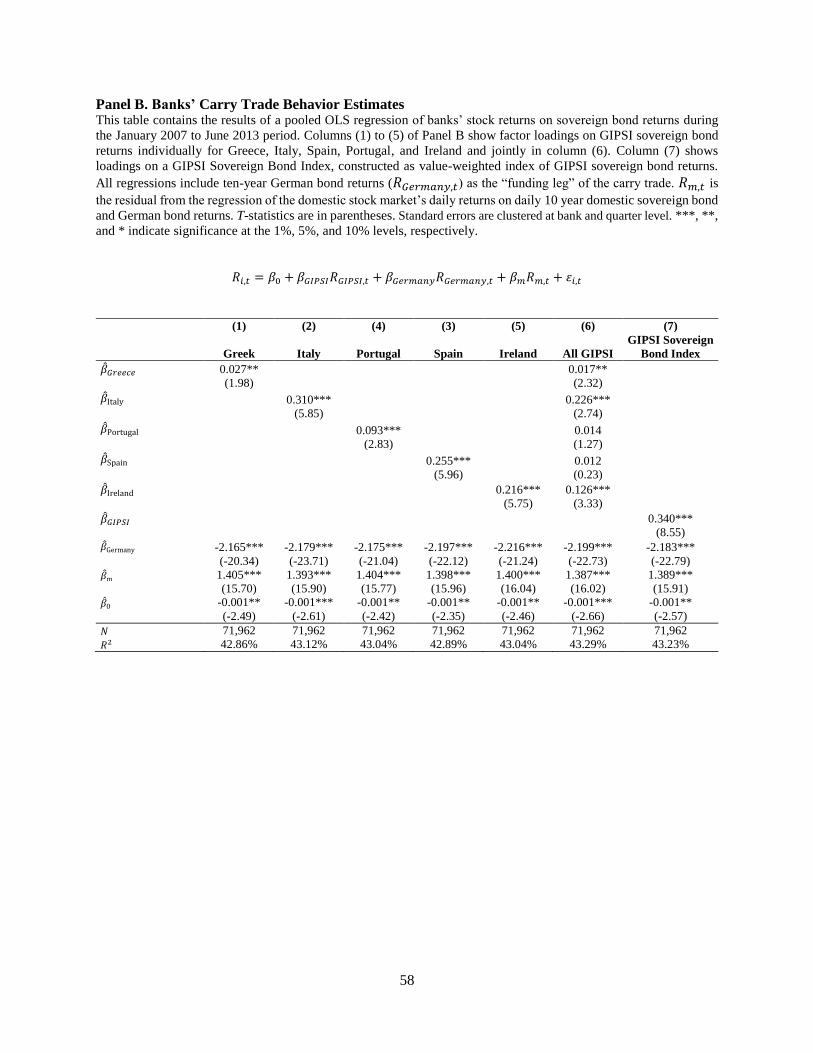
58
Panel B. Banks’ Carry Trade Behavior Estimates This table contains the results of a pooled OLS regression of banks’ stock returns on sovereign bond returns during
the January 2007 to June 2013 period. Columns (1) to (5) of Panel B show factor loadings on GIPSI sovereign bond
returns individually for Greece, Italy, Spain, Portugal, and Ireland and jointly in column (6). Column (7) shows
loadings on a GIPSI Sovereign Bond Index, constructed as value-weighted index of GIPSI sovereign bond returns.
All regressions include ten-year German bond returns (𝑅𝐺𝑒𝑟𝑚𝑎𝑛𝑦,𝑡) as the “funding leg” of the carry trade. 𝑅𝑚,𝑡 is
the residual from the regression of the domestic stock market’s daily returns on daily 10 year domestic sovereign bond
and German bond returns. T-statistics are in parentheses. Standard errors are clustered at bank and quarter level. ***, **,
and * indicate significance at the 1%, 5%, and 10% levels, respectively.
𝑅𝑖,𝑡 = 𝛽0 + 𝛽𝐺𝐼𝑃𝑆𝐼𝑅𝐺𝐼𝑃𝑆𝐼,𝑡 + 𝛽𝐺𝑒𝑟𝑚𝑎𝑛𝑦𝑅𝐺𝑒𝑟𝑚𝑎𝑛𝑦,𝑡 + 𝛽𝑚𝑅𝑚,𝑡 + 𝜀𝑖,𝑡
(1) (2) (4) (3) (5) (6) (7)
Greek Italy Portugal Spain Ireland All GIPSI
GIPSI Sovereign
Bond Index
�̂�𝐺𝑟𝑒𝑒𝑐𝑒 0.027** 0.017**
(1.98) (2.32)
�̂�Italy 0.310*** 0.226***
(5.85) (2.74)
�̂�Portugal 0.093*** 0.014
(2.83) (1.27)
�̂�Spain 0.255*** 0.012
(5.96) (0.23)
�̂�Ireland 0.216*** 0.126***
(5.75) (3.33)
�̂�𝐺𝐼𝑃𝑆𝐼 0.340***
(8.55)
�̂�Germany -2.165*** -2.179*** -2.175*** -2.197*** -2.216*** -2.199*** -2.183***
(-20.34) (-23.71) (-21.04) (-22.12) (-21.24) (-22.73) (-22.79)
�̂�m 1.405*** 1.393*** 1.404*** 1.398*** 1.400*** 1.387*** 1.389***
(15.70) (15.90) (15.77) (15.96) (16.04) (16.02) (15.91)
�̂�0 -0.001** -0.001*** -0.001** -0.001** -0.001** -0.001*** -0.001**
(-2.49) (-2.61) (-2.42) (-2.35) (-2.46) (-2.66) (-2.57)
𝑁 71,962 71,962 71,962 71,962 71,962 71,962 71,962
𝑅2 42.86% 43.12% 43.04% 42.89% 43.04% 43.29% 43.23%
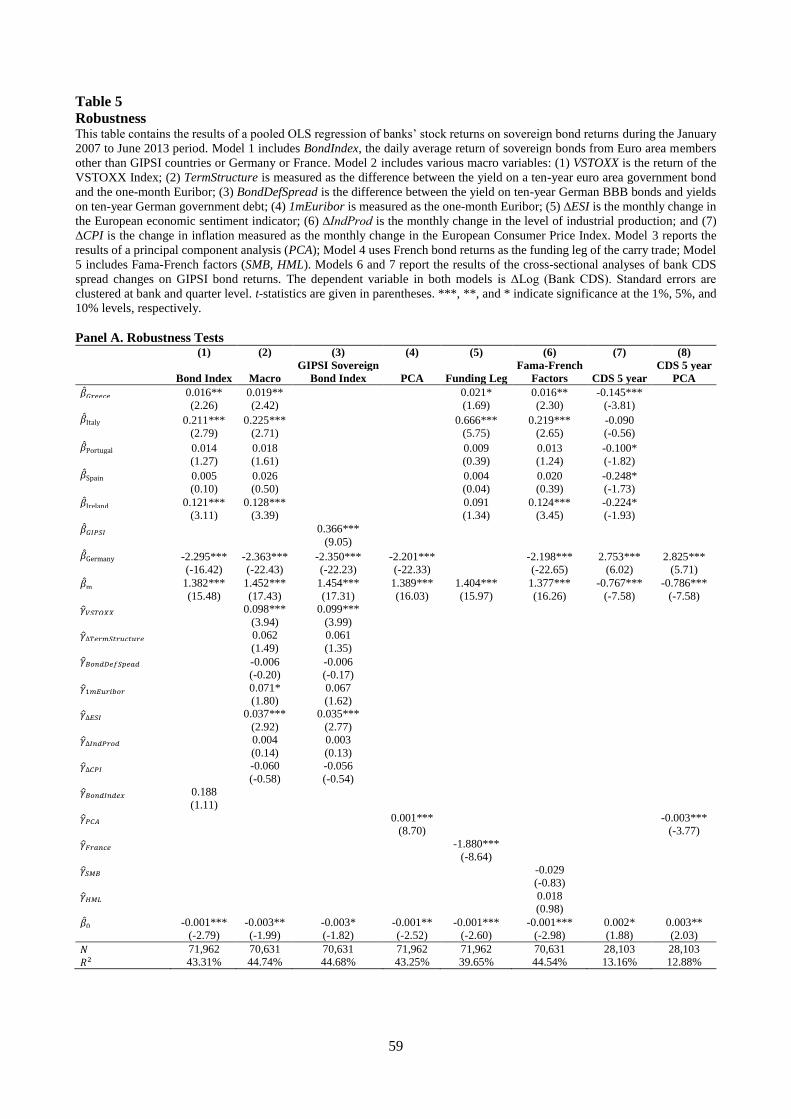
59
Table 5
Robustness This table contains the results of a pooled OLS regression of banks’ stock returns on sovereign bond returns during the January
2007 to June 2013 period. Model 1 includes BondIndex, the daily average return of sovereign bonds from Euro area members
other than GIPSI countries or Germany or France. Model 2 includes various macro variables: (1) VSTOXX is the return of the
VSTOXX Index; (2) TermStructure is measured as the difference between the yield on a ten-year euro area government bond
and the one-month Euribor; (3) BondDefSpread is the difference between the yield on ten-year German BBB bonds and yields
on ten-year German government debt; (4) 1mEuribor is measured as the one-month Euribor; (5) ∆ESI is the monthly change in
the European economic sentiment indicator; (6) ∆IndProd is the monthly change in the level of industrial production; and (7)
∆CPI is the change in inflation measured as the monthly change in the European Consumer Price Index. Model 3 reports the
results of a principal component analysis (PCA); Model 4 uses French bond returns as the funding leg of the carry trade; Model
5 includes Fama-French factors (SMB, HML). Models 6 and 7 report the results of the cross-sectional analyses of bank CDS
spread changes on GIPSI bond returns. The dependent variable in both models is ΔLog (Bank CDS). Standard errors are
clustered at bank and quarter level. t-statistics are given in parentheses. ***, **, and * indicate significance at the 1%, 5%, and
10% levels, respectively.
Panel A. Robustness Tests (1) (2) (3) (4) (5) (6) (7) (8)
GIPSI Sovereign Fama-French CDS 5 year
Bond Index Macro Bond Index PCA Funding Leg Factors CDS 5 year PCA
�̂�𝐺𝑟𝑒𝑒𝑐𝑒 0.016** 0.019** 0.021* 0.016** -0.145***
(2.26) (2.42) (1.69) (2.30) (-3.81)
�̂�Italy 0.211*** 0.225*** 0.666*** 0.219*** -0.090
(2.79) (2.71) (5.75) (2.65) (-0.56)
�̂�Portugal 0.014 0.018 0.009 0.013 -0.100*
(1.27) (1.61) (0.39) (1.24) (-1.82)
�̂�Spain 0.005 0.026 0.004 0.020 -0.248*
(0.10) (0.50) (0.04) (0.39) (-1.73)
�̂�Ireland 0.121*** 0.128*** 0.091 0.124*** -0.224*
(3.11) (3.39) (1.34) (3.45) (-1.93)
�̂�𝐺𝐼𝑃𝑆𝐼 0.366***
(9.05)
�̂�Germany -2.295*** -2.363*** -2.350*** -2.201*** -2.198*** 2.753*** 2.825***
(-16.42) (-22.43) (-22.23) (-22.33) (-22.65) (6.02) (5.71)
�̂�m 1.382*** 1.452*** 1.454*** 1.389*** 1.404*** 1.377*** -0.767*** -0.786***
(15.48) (17.43) (17.31) (16.03) (15.97) (16.26) (-7.58) (-7.58)
𝛾𝑉𝑆𝑇𝑂𝑋𝑋 0.098*** 0.099***
(3.94) (3.99)
𝛾∆𝑇𝑒𝑟𝑚𝑆𝑡𝑟𝑢𝑐𝑡𝑢𝑟𝑒 0.062 0.061
(1.49) (1.35) 𝛾𝐵𝑜𝑛𝑑𝐷𝑒𝑓𝑆𝑝𝑒𝑎𝑑 -0.006 -0.006
(-0.20) (-0.17)
𝛾1𝑚𝐸𝑢𝑟𝑖𝑏𝑜𝑟 0.071* 0.067
(1.80) (1.62)
𝛾∆𝐸𝑆𝐼 0.037*** 0.035***
(2.92) (2.77)
𝛾∆𝐼𝑛𝑑𝑃𝑟𝑜𝑑 0.004 0.003
(0.14) (0.13)
𝛾∆𝐶𝑃𝐼 -0.060 -0.056
(-0.58) (-0.54)
𝛾𝐵𝑜𝑛𝑑𝐼𝑛𝑑𝑒𝑥 0.188
(1.11)
𝛾𝑃𝐶𝐴 0.001*** -0.003***
(8.70) (-3.77)
𝛾𝐹𝑟𝑎𝑛𝑐𝑒 -1.880***
(-8.64)
𝛾𝑆𝑀𝐵 -0.029
(-0.83)
𝛾𝐻𝑀𝐿 0.018
(0.98)
�̂�0 -0.001*** -0.003** -0.003* -0.001** -0.001*** -0.001*** 0.002* 0.003**
(-2.79) (-1.99) (-1.82) (-2.52) (-2.60) (-2.98) (1.88) (2.03)
𝑁 71,962 70,631 70,631 71,962 71,962 70,631 28,103 28,103
𝑅2 43.31% 44.74% 44.68% 43.25% 39.65% 44.54% 13.16% 12.88%
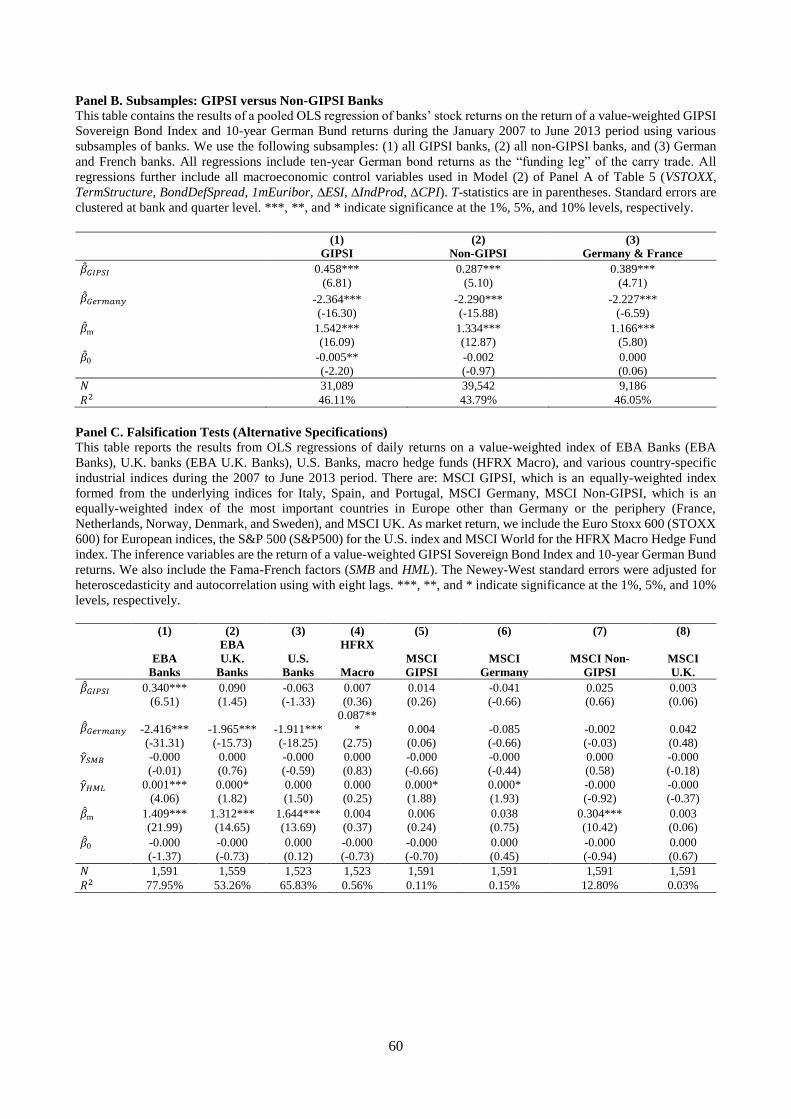
60
Panel B. Subsamples: GIPSI versus Non-GIPSI Banks
This table contains the results of a pooled OLS regression of banks’ stock returns on the return of a value-weighted GIPSI
Sovereign Bond Index and 10-year German Bund returns during the January 2007 to June 2013 period using various
subsamples of banks. We use the following subsamples: (1) all GIPSI banks, (2) all non-GIPSI banks, and (3) German
and French banks. All regressions include ten-year German bond returns as the “funding leg” of the carry trade. All
regressions further include all macroeconomic control variables used in Model (2) of Panel A of Table 5 (VSTOXX,
TermStructure, BondDefSpread, 1mEuribor, ∆ESI, ∆IndProd, ∆CPI). T-statistics are in parentheses. Standard errors are
clustered at bank and quarter level. ***, **, and * indicate significance at the 1%, 5%, and 10% levels, respectively.
(1) (2) (3)
GIPSI Non-GIPSI Germany & France
�̂�𝐺𝐼𝑃𝑆𝐼 0.458*** 0.287*** 0.389***
(6.81) (5.10) (4.71)
�̂�𝐺𝑒𝑟𝑚𝑎𝑛𝑦 -2.364*** -2.290*** -2.227***
(-16.30) (-15.88) (-6.59)
�̂�m 1.542*** 1.334*** 1.166***
(16.09) (12.87) (5.80)
�̂�0 -0.005** -0.002 0.000
(-2.20) (-0.97) (0.06)
𝑁 31,089 39,542 9,186
𝑅2 46.11% 43.79% 46.05%
Panel C. Falsification Tests (Alternative Specifications)
This table reports the results from OLS regressions of daily returns on a value-weighted index of EBA Banks (EBA
Banks), U.K. banks (EBA U.K. Banks), U.S. Banks, macro hedge funds (HFRX Macro), and various country-specific
industrial indices during the 2007 to June 2013 period. There are: MSCI GIPSI, which is an equally-weighted index
formed from the underlying indices for Italy, Spain, and Portugal, MSCI Germany, MSCI Non-GIPSI, which is an
equally-weighted index of the most important countries in Europe other than Germany or the periphery (France,
Netherlands, Norway, Denmark, and Sweden), and MSCI UK. As market return, we include the Euro Stoxx 600 (STOXX
600) for European indices, the S&P 500 (S&P500) for the U.S. index and MSCI World for the HFRX Macro Hedge Fund
index. The inference variables are the return of a value-weighted GIPSI Sovereign Bond Index and 10-year German Bund
returns. We also include the Fama-French factors (SMB and HML). The Newey-West standard errors were adjusted for
heteroscedasticity and autocorrelation using with eight lags. ***, **, and * indicate significance at the 1%, 5%, and 10%
levels, respectively.
(1) (2) (3) (4) (5) (6) (7) (8)
EBA HFRX
EBA
Banks
U.K.
Banks
U.S.
Banks Macro
MSCI
GIPSI
MSCI
Germany
MSCI Non-
GIPSI
MSCI
U.K.
�̂�𝐺𝐼𝑃𝑆𝐼 0.340*** 0.090 -0.063 0.007 0.014 -0.041 0.025 0.003
(6.51) (1.45) (-1.33) (0.36) (0.26) (-0.66) (0.66) (0.06)
�̂�𝐺𝑒𝑟𝑚𝑎𝑛𝑦 -2.416*** -1.965*** -1.911***
0.087**
* 0.004 -0.085 -0.002 0.042
(-31.31) (-15.73) (-18.25) (2.75) (0.06) (-0.66) (-0.03) (0.48)
𝛾𝑆𝑀𝐵 -0.000 0.000 -0.000 0.000 -0.000 -0.000 0.000 -0.000
(-0.01) (0.76) (-0.59) (0.83) (-0.66) (-0.44) (0.58) (-0.18)
𝛾𝐻𝑀𝐿 0.001*** 0.000* 0.000 0.000 0.000* 0.000* -0.000 -0.000
(4.06) (1.82) (1.50) (0.25) (1.88) (1.93) (-0.92) (-0.37)
�̂�m 1.409*** 1.312*** 1.644*** 0.004 0.006 0.038 0.304*** 0.003
(21.99) (14.65) (13.69) (0.37) (0.24) (0.75) (10.42) (0.06)
�̂�0 -0.000 -0.000 0.000 -0.000 -0.000 0.000 -0.000 0.000
(-1.37) (-0.73) (0.12) (-0.73) (-0.70) (0.45) (-0.94) (0.67)
𝑁 1,591 1,559 1,523 1,523 1,591 1,591 1,591 1,591
𝑅2 77.95% 53.26% 65.83% 0.56% 0.11% 0.15% 12.80% 0.03%
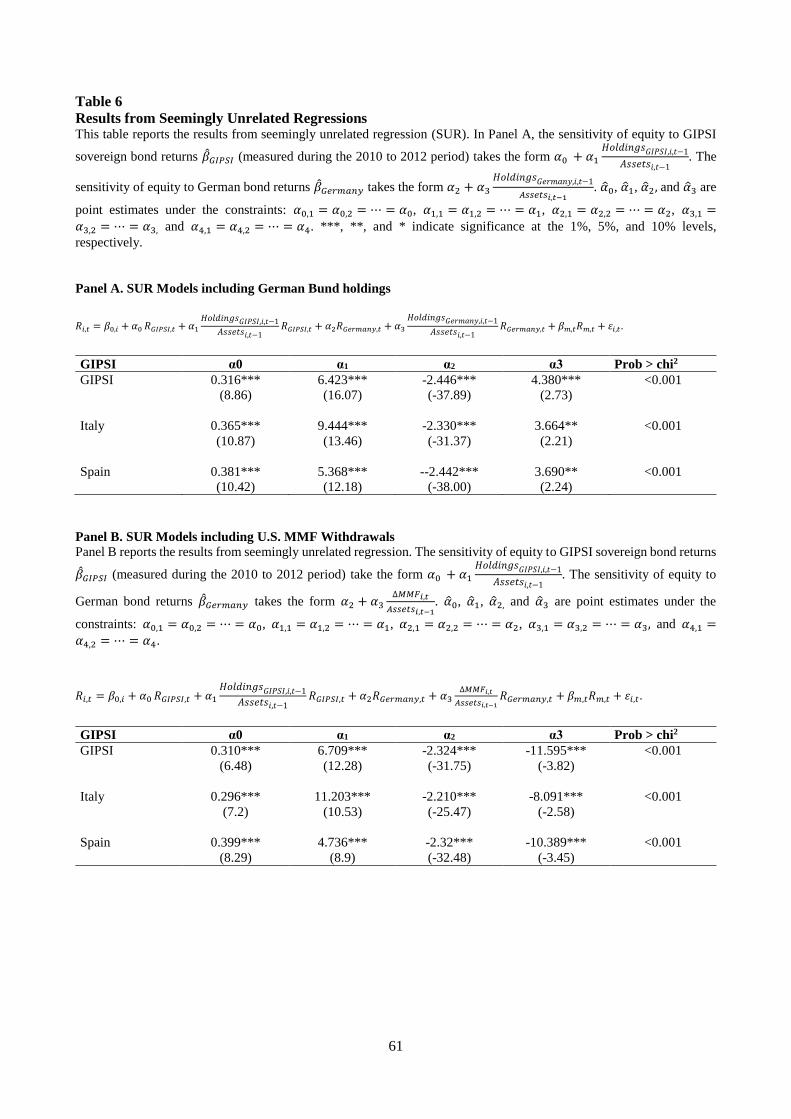
61
Table 6
Results from Seemingly Unrelated Regressions This table reports the results from seemingly unrelated regression (SUR). In Panel A, the sensitivity of equity to GIPSI
sovereign bond returns �̂�𝐺𝐼𝑃𝑆𝐼 (measured during the 2010 to 2012 period) takes the form 𝛼0 + 𝛼1
𝐻𝑜𝑙𝑑𝑖𝑛𝑔𝑠𝐺𝐼𝑃𝑆𝐼,𝑖,𝑡−1
𝐴𝑠𝑠𝑒𝑡𝑠𝑖,𝑡−1. The
sensitivity of equity to German bond returns �̂�𝐺𝑒𝑟𝑚𝑎𝑛𝑦 takes the form 𝛼2 + 𝛼3
𝐻𝑜𝑙𝑑𝑖𝑛𝑔𝑠𝐺𝑒𝑟𝑚𝑎𝑛𝑦,𝑖,𝑡−1
𝐴𝑠𝑠𝑒𝑡𝑠𝑖,𝑡−1. �̂�0, �̂�1, �̂�2, and �̂�3 are
point estimates under the constraints: 𝛼0,1 = 𝛼0,2 = ⋯ = 𝛼0, 𝛼1,1 = 𝛼1,2 = ⋯ = 𝛼1, 𝛼2,1 = 𝛼2,2 = ⋯ = 𝛼2, 𝛼3,1 =
𝛼3,2 = ⋯ = 𝛼3, and 𝛼4,1 = 𝛼4,2 = ⋯ = 𝛼4. ***, **, and * indicate significance at the 1%, 5%, and 10% levels,
respectively.
Panel A. SUR Models including German Bund holdings
𝑅𝑖,𝑡 = 𝛽0,𝑖 + 𝛼0 𝑅𝐺𝐼𝑃𝑆𝐼,𝑡 + 𝛼1
𝐻𝑜𝑙𝑑𝑖𝑛𝑔𝑠𝐺𝐼𝑃𝑆𝐼,𝑖,𝑡−1
𝐴𝑠𝑠𝑒𝑡𝑠𝑖,𝑡−1𝑅𝐺𝐼𝑃𝑆𝐼,𝑡 + 𝛼2𝑅𝐺𝑒𝑟𝑚𝑎𝑛𝑦,𝑡 + 𝛼3
𝐻𝑜𝑙𝑑𝑖𝑛𝑔𝑠𝐺𝑒𝑟𝑚𝑎𝑛𝑦,𝑖,𝑡−1
𝐴𝑠𝑠𝑒𝑡𝑠𝑖,𝑡−1𝑅𝐺𝑒𝑟𝑚𝑎𝑛𝑦,𝑡 + 𝛽𝑚,𝑡𝑅𝑚,𝑡 + 𝜀𝑖,𝑡.
GIPSI α0 α1 α2 α3 Prob > chi2
GIPSI 0.316*** 6.423*** -2.446*** 4.380*** <0.001
(8.86) (16.07) (-37.89) (2.73)
Italy 0.365*** 9.444*** -2.330*** 3.664** <0.001
(10.87) (13.46) (-31.37) (2.21)
Spain 0.381*** 5.368*** --2.442*** 3.690** <0.001
(10.42) (12.18) (-38.00) (2.24)
Panel B. SUR Models including U.S. MMF Withdrawals
Panel B reports the results from seemingly unrelated regression. The sensitivity of equity to GIPSI sovereign bond returns
�̂�𝐺𝐼𝑃𝑆𝐼 (measured during the 2010 to 2012 period) take the form 𝛼0 + 𝛼1
𝐻𝑜𝑙𝑑𝑖𝑛𝑔𝑠𝐺𝐼𝑃𝑆𝐼,𝑖,𝑡−1
𝐴𝑠𝑠𝑒𝑡𝑠𝑖,𝑡−1. The sensitivity of equity to
German bond returns �̂�𝐺𝑒𝑟𝑚𝑎𝑛𝑦 takes the form 𝛼2 + 𝛼3∆𝑀𝑀𝐹𝑖,𝑡
𝐴𝑠𝑠𝑒𝑡𝑠𝑖,𝑡−1. �̂�0, �̂�1, �̂�2, and �̂�3 are point estimates under the
constraints: 𝛼0,1 = 𝛼0,2 = ⋯ = 𝛼0, 𝛼1,1 = 𝛼1,2 = ⋯ = 𝛼1, 𝛼2,1 = 𝛼2,2 = ⋯ = 𝛼2, 𝛼3,1 = 𝛼3,2 = ⋯ = 𝛼3, and 𝛼4,1 =
𝛼4,2 = ⋯ = 𝛼4.
𝑅𝑖,𝑡 = 𝛽0,𝑖 + 𝛼0 𝑅𝐺𝐼𝑃𝑆𝐼,𝑡 + 𝛼1
𝐻𝑜𝑙𝑑𝑖𝑛𝑔𝑠𝐺𝐼𝑃𝑆𝐼,𝑖,𝑡−1
𝐴𝑠𝑠𝑒𝑡𝑠𝑖,𝑡−1𝑅𝐺𝐼𝑃𝑆𝐼,𝑡 + 𝛼2𝑅𝐺𝑒𝑟𝑚𝑎𝑛𝑦,𝑡 + 𝛼3
∆𝑀𝑀𝐹𝑖,𝑡
𝐴𝑠𝑠𝑒𝑡𝑠𝑖,𝑡−1𝑅𝐺𝑒𝑟𝑚𝑎𝑛𝑦,𝑡 + 𝛽𝑚,𝑡𝑅𝑚,𝑡 + 𝜀𝑖,𝑡.
GIPSI α0 α1 α2 α3 Prob > chi2
GIPSI 0.310*** 6.709*** -2.324*** -11.595*** <0.001
(6.48) (12.28) (-31.75) (-3.82)
Italy 0.296*** 11.203*** -2.210*** -8.091*** <0.001
(7.2) (10.53) (-25.47) (-2.58)
Spain 0.399*** 4.736*** -2.32*** -10.389*** <0.001
(8.29) (8.9) (-32.48) (-3.45)
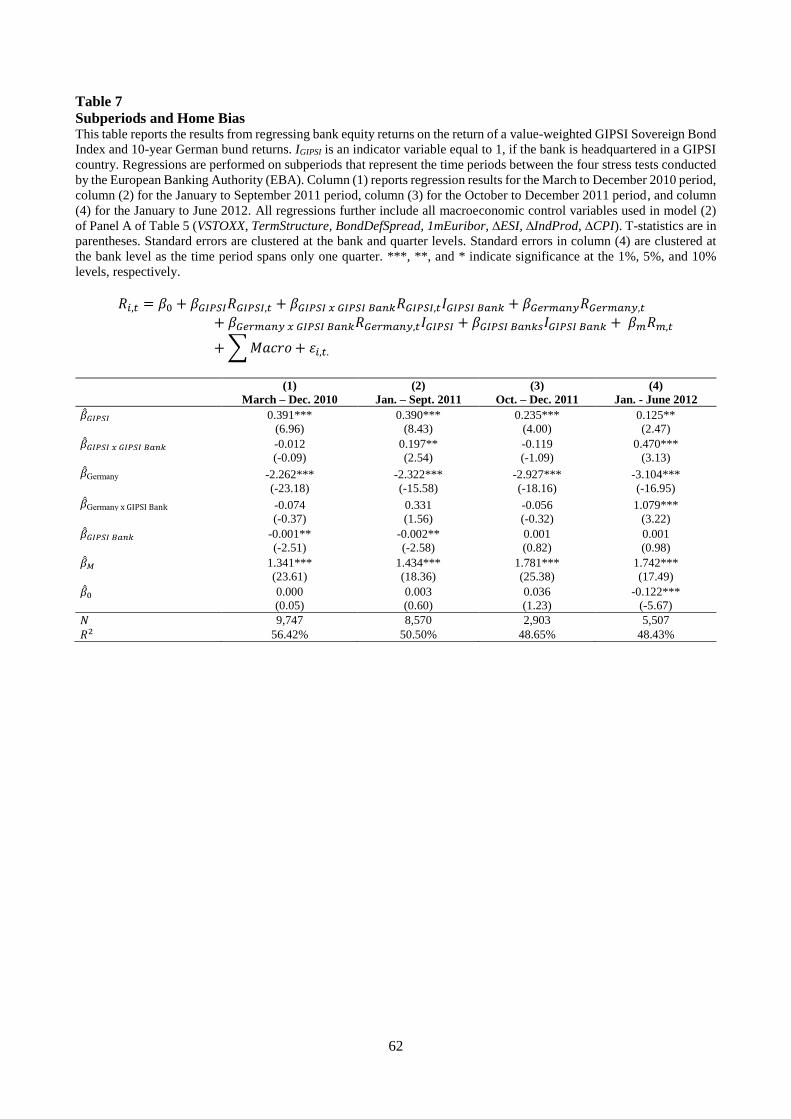
62
Table 7
Subperiods and Home Bias This table reports the results from regressing bank equity returns on the return of a value-weighted GIPSI Sovereign Bond
Index and 10-year German bund returns. IGIPSI is an indicator variable equal to 1, if the bank is headquartered in a GIPSI
country. Regressions are performed on subperiods that represent the time periods between the four stress tests conducted
by the European Banking Authority (EBA). Column (1) reports regression results for the March to December 2010 period,
column (2) for the January to September 2011 period, column (3) for the October to December 2011 period, and column
(4) for the January to June 2012. All regressions further include all macroeconomic control variables used in model (2)
of Panel A of Table 5 (VSTOXX, TermStructure, BondDefSpread, 1mEuribor, ∆ESI, ∆IndProd, ∆CPI). T-statistics are in
parentheses. Standard errors are clustered at the bank and quarter levels. Standard errors in column (4) are clustered at
the bank level as the time period spans only one quarter. ***, **, and * indicate significance at the 1%, 5%, and 10%
levels, respectively.
𝑅𝑖,𝑡 = 𝛽0 + 𝛽𝐺𝐼𝑃𝑆𝐼𝑅𝐺𝐼𝑃𝑆𝐼,𝑡 + 𝛽𝐺𝐼𝑃𝑆𝐼 𝑥 𝐺𝐼𝑃𝑆𝐼 𝐵𝑎𝑛𝑘𝑅𝐺𝐼𝑃𝑆𝐼,𝑡𝐼𝐺𝐼𝑃𝑆𝐼 𝐵𝑎𝑛𝑘 + 𝛽𝐺𝑒𝑟𝑚𝑎𝑛𝑦𝑅𝐺𝑒𝑟𝑚𝑎𝑛𝑦,𝑡
+ 𝛽𝐺𝑒𝑟𝑚𝑎𝑛𝑦 𝑥 𝐺𝐼𝑃𝑆𝐼 𝐵𝑎𝑛𝑘𝑅𝐺𝑒𝑟𝑚𝑎𝑛𝑦,𝑡𝐼𝐺𝐼𝑃𝑆𝐼 + 𝛽𝐺𝐼𝑃𝑆𝐼 𝐵𝑎𝑛𝑘𝑠𝐼𝐺𝐼𝑃𝑆𝐼 𝐵𝑎𝑛𝑘 + 𝛽𝑚𝑅𝑚,𝑡
+ ∑ 𝑀𝑎𝑐𝑟𝑜 + 𝜀𝑖,𝑡.
(1) (2) (3) (4)
March – Dec. 2010 Jan. – Sept. 2011 Oct. – Dec. 2011 Jan. - June 2012
�̂�𝐺𝐼𝑃𝑆𝐼 0.391*** 0.390*** 0.235*** 0.125**
(6.96) (8.43) (4.00) (2.47)
�̂�𝐺𝐼𝑃𝑆𝐼 𝑥 𝐺𝐼𝑃𝑆𝐼 𝐵𝑎𝑛𝑘 -0.012 0.197** -0.119 0.470***
(-0.09) (2.54) (-1.09) (3.13)
�̂�Germany -2.262*** -2.322*** -2.927*** -3.104***
(-23.18) (-15.58) (-18.16) (-16.95)
�̂�Germany x GIPSI Bank -0.074 0.331 -0.056 1.079***
(-0.37) (1.56) (-0.32) (3.22)
�̂�𝐺𝐼𝑃𝑆𝐼 𝐵𝑎𝑛𝑘 -0.001** -0.002** 0.001 0.001
(-2.51) (-2.58) (0.82) (0.98)
�̂�𝑀 1.341*** 1.434*** 1.781*** 1.742***
(23.61) (18.36) (25.38) (17.49)
�̂�0 0.000 0.003 0.036 -0.122***
(0.05) (0.60) (1.23) (-5.67)
𝑁 9,747 8,570 2,903 5,507
𝑅2 56.42% 50.50% 48.65% 48.43%
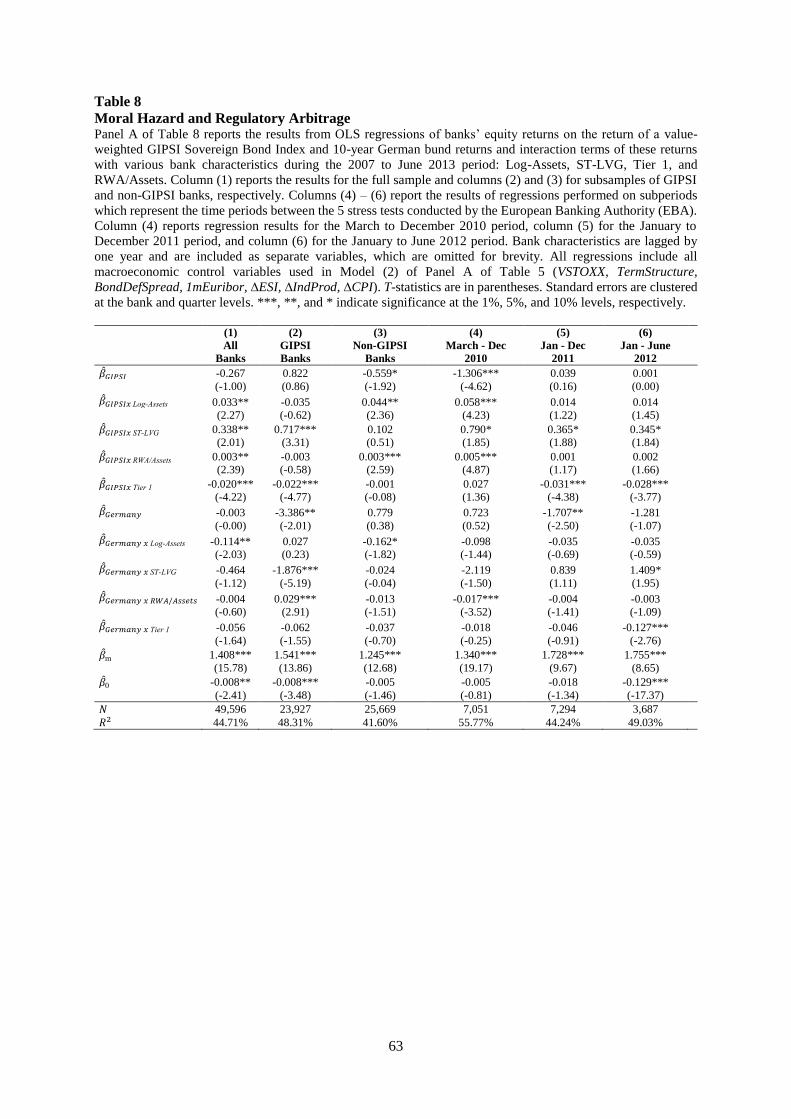
63
Table 8
Moral Hazard and Regulatory Arbitrage Panel A of Table 8 reports the results from OLS regressions of banks’ equity returns on the return of a value-
weighted GIPSI Sovereign Bond Index and 10-year German bund returns and interaction terms of these returns
with various bank characteristics during the 2007 to June 2013 period: Log-Assets, ST-LVG, Tier 1, and
RWA/Assets. Column (1) reports the results for the full sample and columns (2) and (3) for subsamples of GIPSI
and non-GIPSI banks, respectively. Columns (4) – (6) report the results of regressions performed on subperiods
which represent the time periods between the 5 stress tests conducted by the European Banking Authority (EBA).
Column (4) reports regression results for the March to December 2010 period, column (5) for the January to
December 2011 period, and column (6) for the January to June 2012 period. Bank characteristics are lagged by
one year and are included as separate variables, which are omitted for brevity. All regressions include all
macroeconomic control variables used in Model (2) of Panel A of Table 5 (VSTOXX, TermStructure,
BondDefSpread, 1mEuribor, ∆ESI, ∆IndProd, ∆CPI). T-statistics are in parentheses. Standard errors are clustered
at the bank and quarter levels. ***, **, and * indicate significance at the 1%, 5%, and 10% levels, respectively.
(1) (2) (3) (4) (5) (6)
All
Banks
GIPSI
Banks
Non-GIPSI
Banks
March - Dec
2010
Jan - Dec
2011
Jan - June
2012
�̂�𝐺𝐼𝑃𝑆𝐼 -0.267 0.822 -0.559* -1.306*** 0.039 0.001
(-1.00) (0.86) (-1.92) (-4.62) (0.16) (0.00)
�̂�𝐺𝐼𝑃𝑆𝐼𝑥 Log-Assets 0.033** -0.035 0.044** 0.058*** 0.014 0.014
(2.27) (-0.62) (2.36) (4.23) (1.22) (1.45)
�̂�𝐺𝐼𝑃𝑆𝐼𝑥 ST-LVG 0.338** 0.717*** 0.102 0.790* 0.365* 0.345*
(2.01) (3.31) (0.51) (1.85) (1.88) (1.84)
�̂�𝐺𝐼𝑃𝑆𝐼𝑥 RWA/Assets 0.003** -0.003 0.003*** 0.005*** 0.001 0.002
(2.39) (-0.58) (2.59) (4.87) (1.17) (1.66)
�̂�𝐺𝐼𝑃𝑆𝐼𝑥 Tier 1 -0.020*** -0.022*** -0.001 0.027 -0.031*** -0.028***
(-4.22) (-4.77) (-0.08) (1.36) (-4.38) (-3.77)
�̂�𝐺𝑒𝑟𝑚𝑎𝑛𝑦 -0.003 -3.386** 0.779 0.723 -1.707** -1.281
(-0.00) (-2.01) (0.38) (0.52) (-2.50) (-1.07)
�̂�𝐺𝑒𝑟𝑚𝑎𝑛𝑦 𝑥 Log-Assets -0.114** 0.027 -0.162* -0.098 -0.035 -0.035
(-2.03) (0.23) (-1.82) (-1.44) (-0.69) (-0.59)
�̂�𝐺𝑒𝑟𝑚𝑎𝑛𝑦 𝑥 ST-LVG -0.464 -1.876*** -0.024 -2.119 0.839 1.409*
(-1.12) (-5.19) (-0.04) (-1.50) (1.11) (1.95)
�̂�𝐺𝑒𝑟𝑚𝑎𝑛𝑦 𝑥 𝑅𝑊𝐴/𝐴𝑠𝑠𝑒𝑡𝑠 -0.004 0.029*** -0.013 -0.017*** -0.004 -0.003
(-0.60) (2.91) (-1.51) (-3.52) (-1.41) (-1.09)
�̂�𝐺𝑒𝑟𝑚𝑎𝑛𝑦 𝑥 Tier 1 -0.056 -0.062 -0.037 -0.018 -0.046 -0.127***
(-1.64) (-1.55) (-0.70) (-0.25) (-0.91) (-2.76)
�̂�m 1.408*** 1.541*** 1.245*** 1.340*** 1.728*** 1.755***
(15.78) (13.86) (12.68) (19.17) (9.67) (8.65)
�̂�0 -0.008** -0.008*** -0.005 -0.005 -0.018 -0.129***
(-2.41) (-3.48) (-1.46) (-0.81) (-1.34) (-17.37)
𝑁 49,596 23,927 25,669 7,051 7,294 3,687
𝑅2 44.71% 48.31% 41.60% 55.77% 44.24% 49.03%
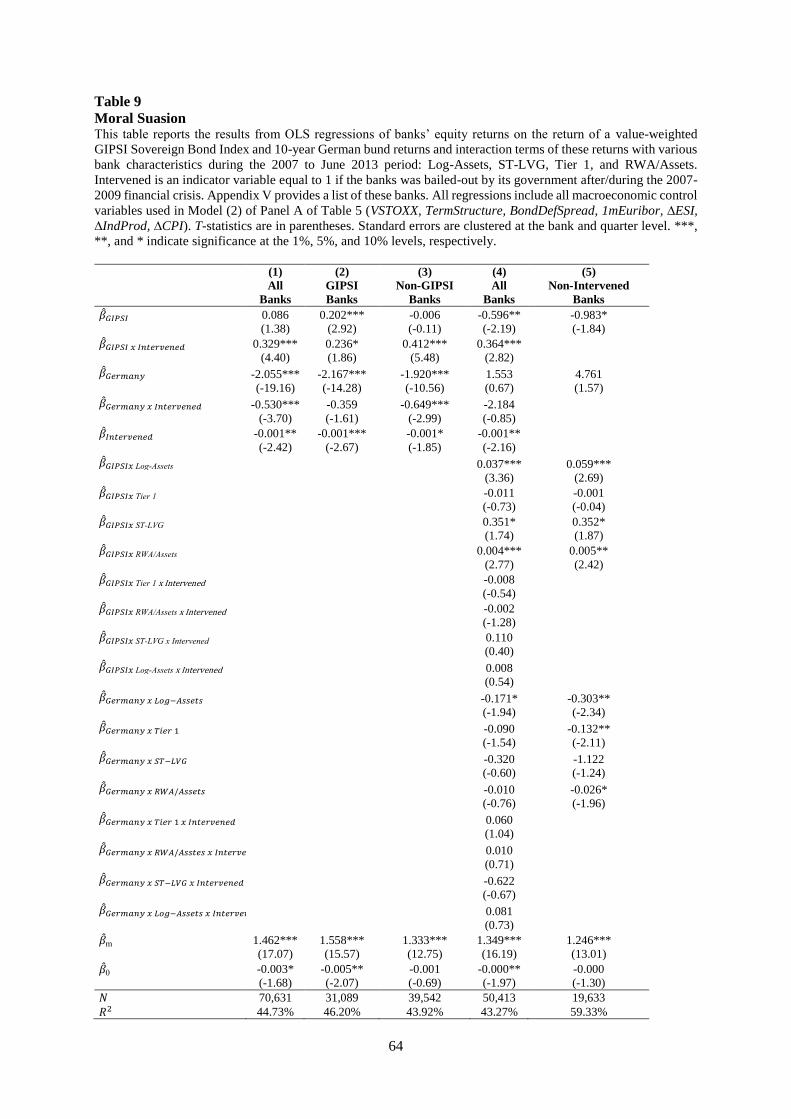
64
Table 9
Moral Suasion This table reports the results from OLS regressions of banks’ equity returns on the return of a value-weighted
GIPSI Sovereign Bond Index and 10-year German bund returns and interaction terms of these returns with various
bank characteristics during the 2007 to June 2013 period: Log-Assets, ST-LVG, Tier 1, and RWA/Assets.
Intervened is an indicator variable equal to 1 if the banks was bailed-out by its government after/during the 2007-
2009 financial crisis. Appendix V provides a list of these banks. All regressions include all macroeconomic control
variables used in Model (2) of Panel A of Table 5 (VSTOXX, TermStructure, BondDefSpread, 1mEuribor, ∆ESI,
∆IndProd, ∆CPI). T-statistics are in parentheses. Standard errors are clustered at the bank and quarter level. ***,
**, and * indicate significance at the 1%, 5%, and 10% levels, respectively.
(1) (2) (3) (4) (5)
All
Banks
GIPSI
Banks
Non-GIPSI
Banks
All
Banks
Non-Intervened
Banks
�̂�𝐺𝐼𝑃𝑆𝐼 0.086 0.202*** -0.006 -0.596** -0.983*
(1.38) (2.92) (-0.11) (-2.19) (-1.84)
�̂�𝐺𝐼𝑃𝑆𝐼 𝑥 𝐼𝑛𝑡𝑒𝑟𝑣𝑒𝑛𝑒𝑑 0.329*** 0.236* 0.412*** 0.364***
(4.40) (1.86) (5.48) (2.82)
�̂�𝐺𝑒𝑟𝑚𝑎𝑛𝑦 -2.055*** -2.167*** -1.920*** 1.553 4.761
(-19.16) (-14.28) (-10.56) (0.67) (1.57)
�̂�𝐺𝑒𝑟𝑚𝑎𝑛𝑦 𝑥 𝐼𝑛𝑡𝑒𝑟𝑣𝑒𝑛𝑒𝑑 -0.530*** -0.359 -0.649*** -2.184
(-3.70) (-1.61) (-2.99) (-0.85)
�̂�𝐼𝑛𝑡𝑒𝑟𝑣𝑒𝑛𝑒𝑑 -0.001** -0.001*** -0.001* -0.001**
(-2.42) (-2.67) (-1.85) (-2.16)
�̂�𝐺𝐼𝑃𝑆𝐼𝑥 Log-Assets 0.037*** 0.059***
(3.36) (2.69)
�̂�𝐺𝐼𝑃𝑆𝐼𝑥 Tier 1 -0.011 -0.001
(-0.73) (-0.04)
�̂�𝐺𝐼𝑃𝑆𝐼𝑥 ST-LVG 0.351* 0.352*
(1.74) (1.87)
�̂�𝐺𝐼𝑃𝑆𝐼𝑥 RWA/Assets 0.004*** 0.005**
(2.77) (2.42)
�̂�𝐺𝐼𝑃𝑆𝐼𝑥 Tier 1 x Intervened -0.008
(-0.54)
�̂�𝐺𝐼𝑃𝑆𝐼𝑥 RWA/Assets x Intervened -0.002
(-1.28)
�̂�𝐺𝐼𝑃𝑆𝐼𝑥 ST-LVG x Intervened 0.110
(0.40)
�̂�𝐺𝐼𝑃𝑆𝐼𝑥 Log-Assets x Intervened 0.008
(0.54)
�̂�𝐺𝑒𝑟𝑚𝑎𝑛𝑦 𝑥 𝐿𝑜𝑔−𝐴𝑠𝑠𝑒𝑡𝑠 -0.171* -0.303**
(-1.94) (-2.34)
�̂�𝐺𝑒𝑟𝑚𝑎𝑛𝑦 𝑥 𝑇𝑖𝑒𝑟 1 -0.090 -0.132**
(-1.54) (-2.11)
�̂�𝐺𝑒𝑟𝑚𝑎𝑛𝑦 𝑥 𝑆𝑇−𝐿𝑉𝐺 -0.320 -1.122
(-0.60) (-1.24)
�̂�𝐺𝑒𝑟𝑚𝑎𝑛𝑦 𝑥 𝑅𝑊𝐴/𝐴𝑠𝑠𝑒𝑡𝑠 -0.010 -0.026*
(-0.76) (-1.96)
�̂�𝐺𝑒𝑟𝑚𝑎𝑛𝑦 𝑥 𝑇𝑖𝑒𝑟 1 𝑥 𝐼𝑛𝑡𝑒𝑟𝑣𝑒𝑛𝑒𝑑 0.060
(1.04)
�̂�𝐺𝑒𝑟𝑚𝑎𝑛𝑦 𝑥 𝑅𝑊𝐴/𝐴𝑠𝑠𝑡𝑒𝑠 𝑥 𝐼𝑛𝑡𝑒𝑟𝑣𝑒𝑛𝑒𝑑 0.010
(0.71)
�̂�𝐺𝑒𝑟𝑚𝑎𝑛𝑦 𝑥 𝑆𝑇−𝐿𝑉𝐺 𝑥 𝐼𝑛𝑡𝑒𝑟𝑣𝑒𝑛𝑒𝑑 -0.622
(-0.67)
�̂�𝐺𝑒𝑟𝑚𝑎𝑛𝑦 𝑥 𝐿𝑜𝑔−𝐴𝑠𝑠𝑒𝑡𝑠 𝑥 𝐼𝑛𝑡𝑒𝑟𝑣𝑒𝑛𝑒𝑑 0.081
(0.73)
�̂�m 1.462*** 1.558*** 1.333*** 1.349*** 1.246***
(17.07) (15.57) (12.75) (16.19) (13.01)
�̂�0 -0.003* -0.005** -0.001 -0.000** -0.000
(-1.68) (-2.07) (-0.69) (-1.97) (-1.30)
𝑁 70,631 31,089 39,542 50,413 19,633
𝑅2 44.73% 46.20% 43.92% 43.27% 59.33%
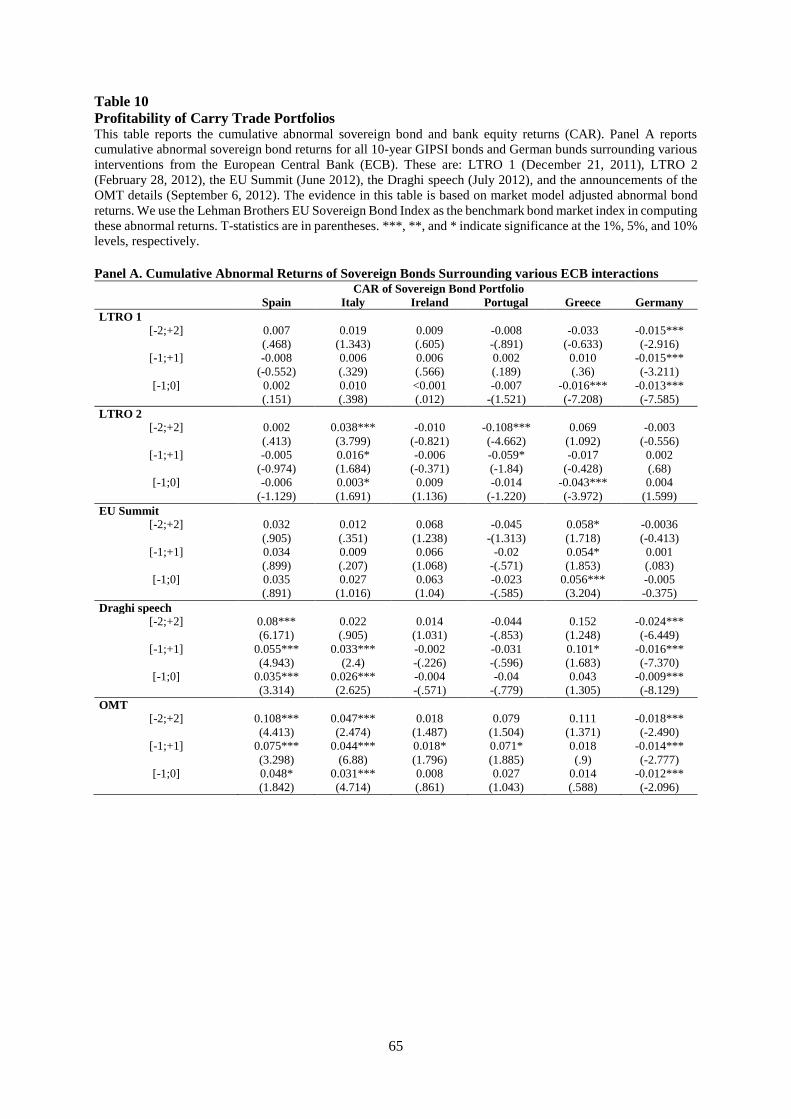
65
Table 10
Profitability of Carry Trade Portfolios This table reports the cumulative abnormal sovereign bond and bank equity returns (CAR). Panel A reports
cumulative abnormal sovereign bond returns for all 10-year GIPSI bonds and German bunds surrounding various
interventions from the European Central Bank (ECB). These are: LTRO 1 (December 21, 2011), LTRO 2
(February 28, 2012), the EU Summit (June 2012), the Draghi speech (July 2012), and the announcements of the
OMT details (September 6, 2012). The evidence in this table is based on market model adjusted abnormal bond
returns. We use the Lehman Brothers EU Sovereign Bond Index as the benchmark bond market index in computing
these abnormal returns. T-statistics are in parentheses. ***, **, and * indicate significance at the 1%, 5%, and 10%
levels, respectively.
Panel A. Cumulative Abnormal Returns of Sovereign Bonds Surrounding various ECB interactions CAR of Sovereign Bond Portfolio
Spain Italy Ireland Portugal Greece Germany
LTRO 1
[-2;+2] 0.007 0.019 0.009 -0.008 -0.033 -0.015***
(.468) (1.343) (.605) -(.891) (-0.633) (-2.916)
[-1;+1] -0.008 0.006 0.006 0.002 0.010 -0.015***
(-0.552) (.329) (.566) (.189) (.36) (-3.211)
[-1;0] 0.002 0.010 <0.001 -0.007 -0.016*** -0.013***
(.151) (.398) (.012) -(1.521) (-7.208) (-7.585)
LTRO 2
[-2;+2] 0.002 0.038*** -0.010 -0.108*** 0.069 -0.003
(.413) (3.799) (-0.821) (-4.662) (1.092) (-0.556)
[-1;+1] -0.005 0.016* -0.006 -0.059* -0.017 0.002
(-0.974) (1.684) (-0.371) (-1.84) (-0.428) (.68)
[-1;0] -0.006 0.003* 0.009 -0.014 -0.043*** 0.004
(-1.129) (1.691) (1.136) (-1.220) (-3.972) (1.599)
EU Summit
[-2;+2] 0.032 0.012 0.068 -0.045 0.058* -0.0036
(.905) (.351) (1.238) -(1.313) (1.718) (-0.413)
[-1;+1] 0.034 0.009 0.066 -0.02 0.054* 0.001
(.899) (.207) (1.068) -(.571) (1.853) (.083)
[-1;0] 0.035 0.027 0.063 -0.023 0.056*** -0.005
(.891) (1.016) (1.04) -(.585) (3.204) -0.375)
Draghi speech
[-2;+2] 0.08*** 0.022 0.014 -0.044 0.152 -0.024***
(6.171) (.905) (1.031) -(.853) (1.248) (-6.449)
[-1;+1] 0.055*** 0.033*** -0.002 -0.031 0.101* -0.016***
(4.943) (2.4) -(.226) -(.596) (1.683) (-7.370)
[-1;0] 0.035*** 0.026*** -0.004 -0.04 0.043 -0.009***
(3.314) (2.625) -(.571) -(.779) (1.305) (-8.129)
OMT
[-2;+2] 0.108*** 0.047*** 0.018 0.079 0.111 -0.018***
(4.413) (2.474) (1.487) (1.504) (1.371) (-2.490)
[-1;+1] 0.075*** 0.044*** 0.018* 0.071* 0.018 -0.014***
(3.298) (6.88) (1.796) (1.885) (.9) (-2.777)
[-1;0] 0.048* 0.031*** 0.008 0.027 0.014 -0.012***
(1.842) (4.714) (.861) (1.043) (.588) (-2.096)
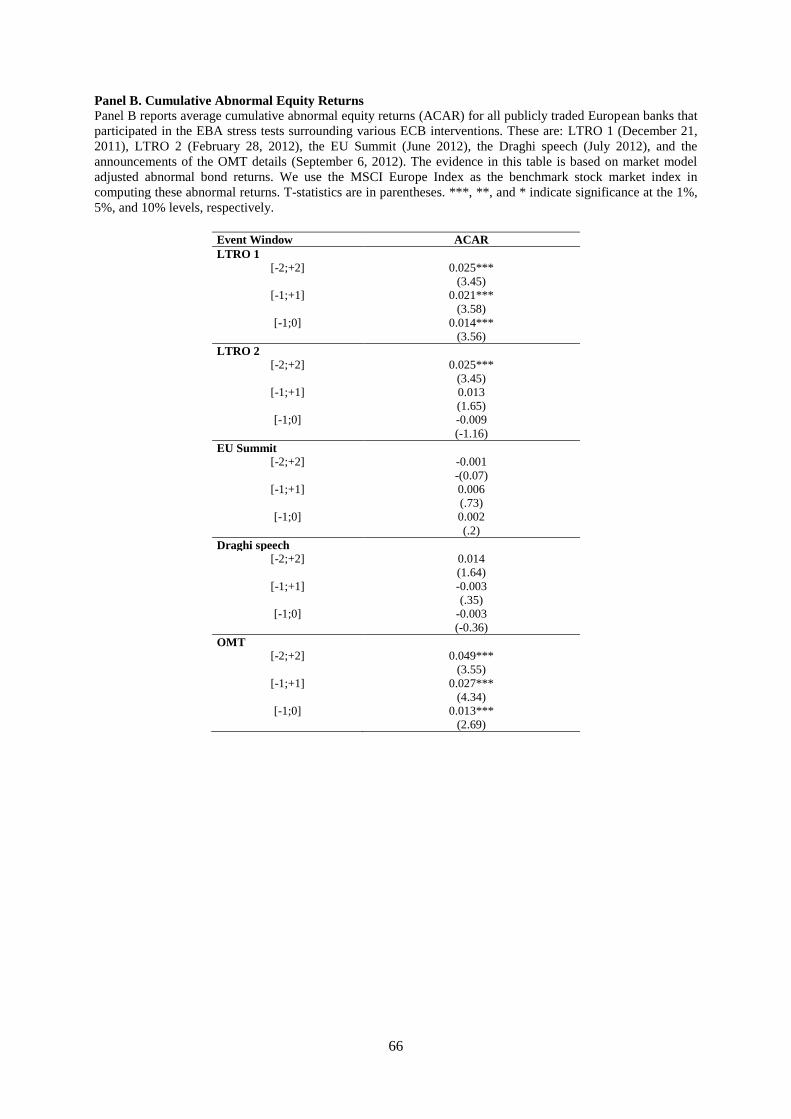
66
Panel B. Cumulative Abnormal Equity Returns
Panel B reports average cumulative abnormal equity returns (ACAR) for all publicly traded European banks that
participated in the EBA stress tests surrounding various ECB interventions. These are: LTRO 1 (December 21,
2011), LTRO 2 (February 28, 2012), the EU Summit (June 2012), the Draghi speech (July 2012), and the
announcements of the OMT details (September 6, 2012). The evidence in this table is based on market model
adjusted abnormal bond returns. We use the MSCI Europe Index as the benchmark stock market index in
computing these abnormal returns. T-statistics are in parentheses. ***, **, and * indicate significance at the 1%,
5%, and 10% levels, respectively.
Event Window ACAR
LTRO 1
[-2;+2] 0.025***
(3.45)
[-1;+1] 0.021***
(3.58)
[-1;0] 0.014***
(3.56)
LTRO 2
[-2;+2] 0.025***
(3.45)
[-1;+1] 0.013
(1.65)
[-1;0] -0.009
(-1.16)
EU Summit
[-2;+2] -0.001
-(0.07)
[-1;+1] 0.006
(.73)
[-1;0] 0.002
(.2)
Draghi speech
[-2;+2] 0.014
(1.64)
[-1;+1] -0.003
(.35)
[-1;0] -0.003
(-0.36)
OMT
[-2;+2] 0.049***
(3.55)
[-1;+1] 0.027***
(4.34)
[-1;0] 0.013***
(2.69)
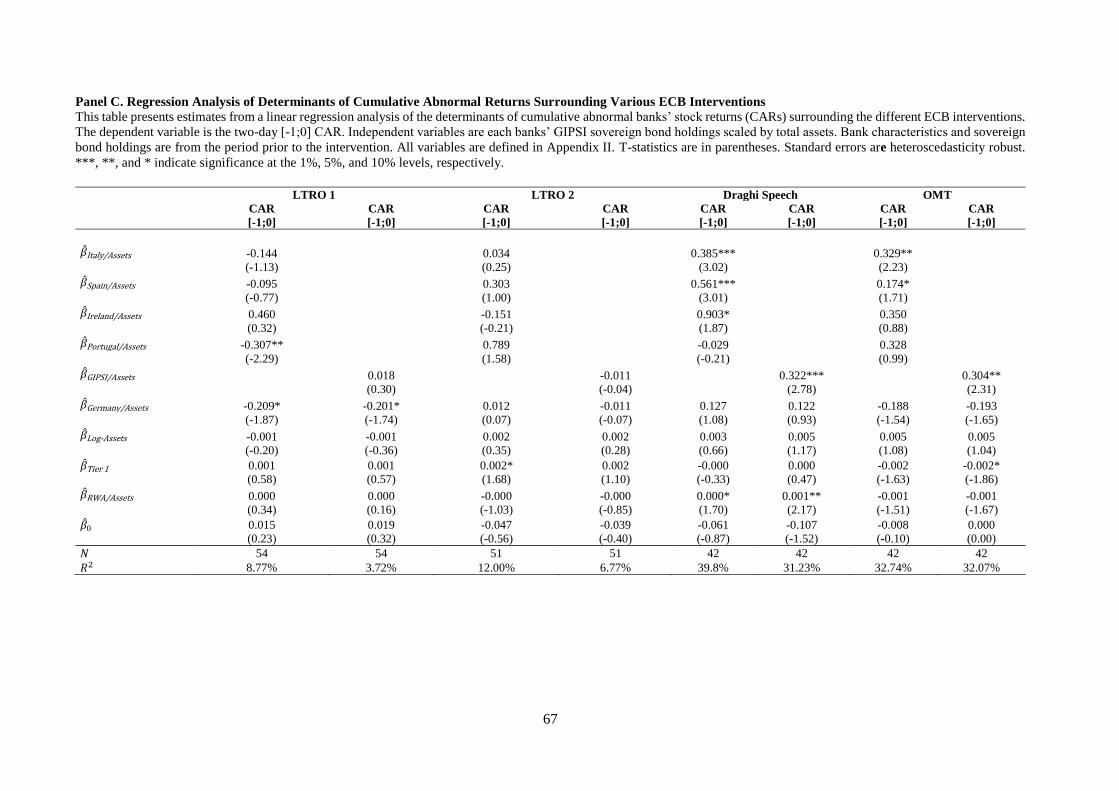
67
Panel C. Regression Analysis of Determinants of Cumulative Abnormal Returns Surrounding Various ECB Interventions
This table presents estimates from a linear regression analysis of the determinants of cumulative abnormal banks’ stock returns (CARs) surrounding the different ECB interventions.
The dependent variable is the two-day [-1;0] CAR. Independent variables are each banks’ GIPSI sovereign bond holdings scaled by total assets. Bank characteristics and sovereign
bond holdings are from the period prior to the intervention. All variables are defined in Appendix II. T-statistics are in parentheses. Standard errors are heteroscedasticity robust.
***, **, and * indicate significance at the 1%, 5%, and 10% levels, respectively.
LTRO 1 LTRO 2 Draghi Speech OMT
CAR CAR CAR CAR CAR CAR CAR CAR
[-1;0] [-1;0] [-1;0] [-1;0] [-1;0] [-1;0] [-1;0] [-1;0]
�̂�Italy/Assets -0.144 0.034 0.385*** 0.329**
(-1.13) (0.25) (3.02) (2.23)
�̂�Spain/Assets -0.095 0.303 0.561*** 0.174*
(-0.77) (1.00) (3.01) (1.71)
�̂�Ireland/Assets 0.460 -0.151 0.903* 0.350
(0.32) (-0.21) (1.87) (0.88)
�̂�Portugal/Assets -0.307** 0.789 -0.029 0.328
(-2.29) (1.58) (-0.21) (0.99)
�̂�GIPSI/Assets 0.018 -0.011 0.322*** 0.304**
(0.30) (-0.04) (2.78) (2.31)
�̂�Germany/Assets -0.209* -0.201* 0.012 -0.011 0.127 0.122 -0.188 -0.193
(-1.87) (-1.74) (0.07) (-0.07) (1.08) (0.93) (-1.54) (-1.65)
�̂�Log-Assets -0.001 -0.001 0.002 0.002 0.003 0.005 0.005 0.005
(-0.20) (-0.36) (0.35) (0.28) (0.66) (1.17) (1.08) (1.04)
�̂�Tier 1 0.001 0.001 0.002* 0.002 -0.000 0.000 -0.002 -0.002*
(0.58) (0.57) (1.68) (1.10) (-0.33) (0.47) (-1.63) (-1.86)
�̂�RWA/Assets 0.000 0.000 -0.000 -0.000 0.000* 0.001** -0.001 -0.001
(0.34) (0.16) (-1.03) (-0.85) (1.70) (2.17) (-1.51) (-1.67)
�̂�0 0.015 0.019 -0.047 -0.039 -0.061 -0.107 -0.008 0.000
(0.23) (0.32) (-0.56) (-0.40) (-0.87) (-1.52) (-0.10) (0.00)
𝑁 54 54 51 51 42 42 42 42
𝑅2 8.77% 3.72% 12.00% 6.77% 39.8% 31.23% 32.74% 32.07%
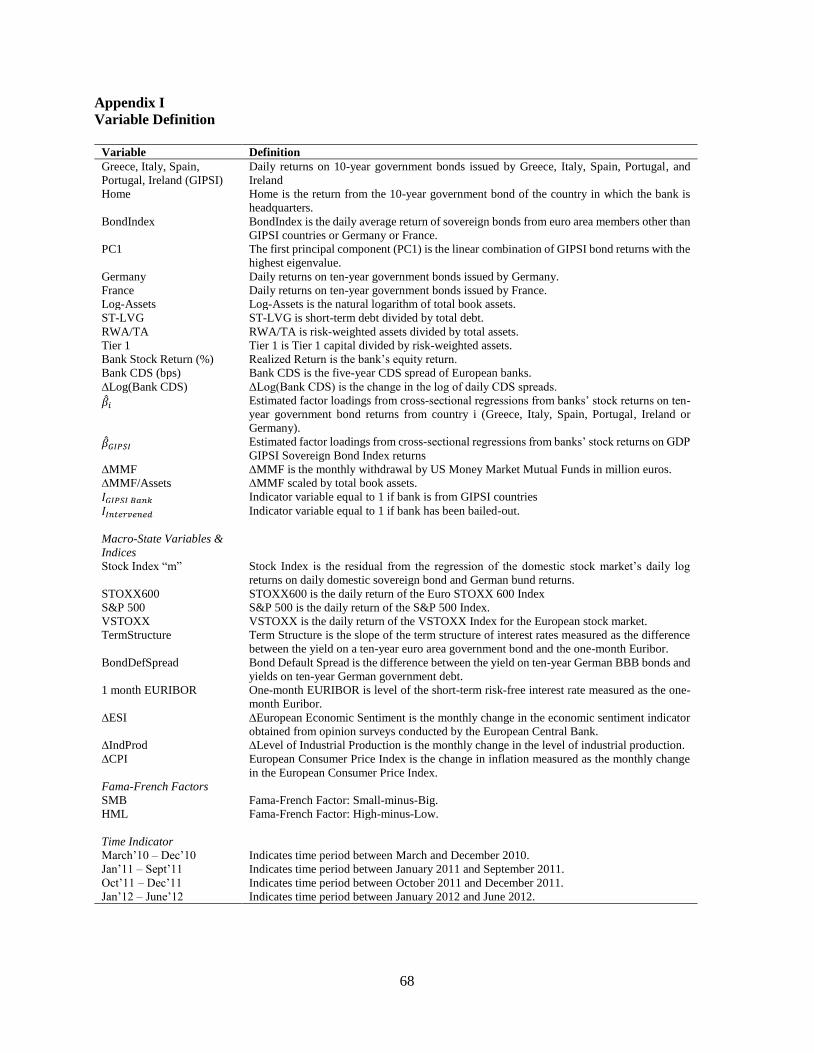
68
Appendix I
Variable Definition
Variable Definition
Greece, Italy, Spain,
Portugal, Ireland (GIPSI)
Daily returns on 10-year government bonds issued by Greece, Italy, Spain, Portugal, and
Ireland
Home Home is the return from the 10-year government bond of the country in which the bank is
headquarters.
BondIndex BondIndex is the daily average return of sovereign bonds from euro area members other than
GIPSI countries or Germany or France.
PC1 The first principal component (PC1) is the linear combination of GIPSI bond returns with the
highest eigenvalue.
Germany Daily returns on ten-year government bonds issued by Germany.
France Daily returns on ten-year government bonds issued by France.
Log-Assets Log-Assets is the natural logarithm of total book assets.
ST-LVG ST-LVG is short-term debt divided by total debt.
RWA/TA RWA/TA is risk-weighted assets divided by total assets.
Tier 1 Tier 1 is Tier 1 capital divided by risk-weighted assets.
Bank Stock Return (%) Realized Return is the bank’s equity return.
Bank CDS (bps) Bank CDS is the five-year CDS spread of European banks.
∆Log(Bank CDS) ΔLog(Bank CDS) is the change in the log of daily CDS spreads.
�̂�𝑖 Estimated factor loadings from cross-sectional regressions from banks’ stock returns on ten-
year government bond returns from country i (Greece, Italy, Spain, Portugal, Ireland or
Germany).
�̂�𝐺𝐼𝑃𝑆𝐼 Estimated factor loadings from cross-sectional regressions from banks’ stock returns on GDP
GIPSI Sovereign Bond Index returns
∆MMF ∆MMF is the monthly withdrawal by US Money Market Mutual Funds in million euros.
∆MMF/Assets ∆MMF scaled by total book assets.
𝐼𝐺𝐼𝑃𝑆𝐼 𝐵𝑎𝑛𝑘 Indicator variable equal to 1 if bank is from GIPSI countries
𝐼𝐼𝑛𝑡𝑒𝑟𝑣𝑒𝑛𝑒𝑑 Indicator variable equal to 1 if bank has been bailed-out.
Macro-State Variables &
Indices
Stock Index “m” Stock Index is the residual from the regression of the domestic stock market’s daily log
returns on daily domestic sovereign bond and German bund returns.
STOXX600 STOXX600 is the daily return of the Euro STOXX 600 Index
S&P 500 S&P 500 is the daily return of the S&P 500 Index.
VSTOXX VSTOXX is the daily return of the VSTOXX Index for the European stock market.
TermStructure Term Structure is the slope of the term structure of interest rates measured as the difference
between the yield on a ten-year euro area government bond and the one-month Euribor.
BondDefSpread Bond Default Spread is the difference between the yield on ten-year German BBB bonds and
yields on ten-year German government debt.
1 month EURIBOR One-month EURIBOR is level of the short-term risk-free interest rate measured as the one-
month Euribor.
∆ESI ∆European Economic Sentiment is the monthly change in the economic sentiment indicator
obtained from opinion surveys conducted by the European Central Bank.
∆IndProd ∆Level of Industrial Production is the monthly change in the level of industrial production.
∆CPI European Consumer Price Index is the change in inflation measured as the monthly change
in the European Consumer Price Index.
Fama-French Factors
SMB Fama-French Factor: Small-minus-Big.
HML Fama-French Factor: High-minus-Low.
Time Indicator
March’10 – Dec’10 Indicates time period between March and December 2010.
Jan’11 – Sept’11 Indicates time period between January 2011 and September 2011.
Oct’11 – Dec’11 Indicates time period between October 2011 and December 2011.
Jan’12 – June’12 Indicates time period between January 2012 and June 2012.
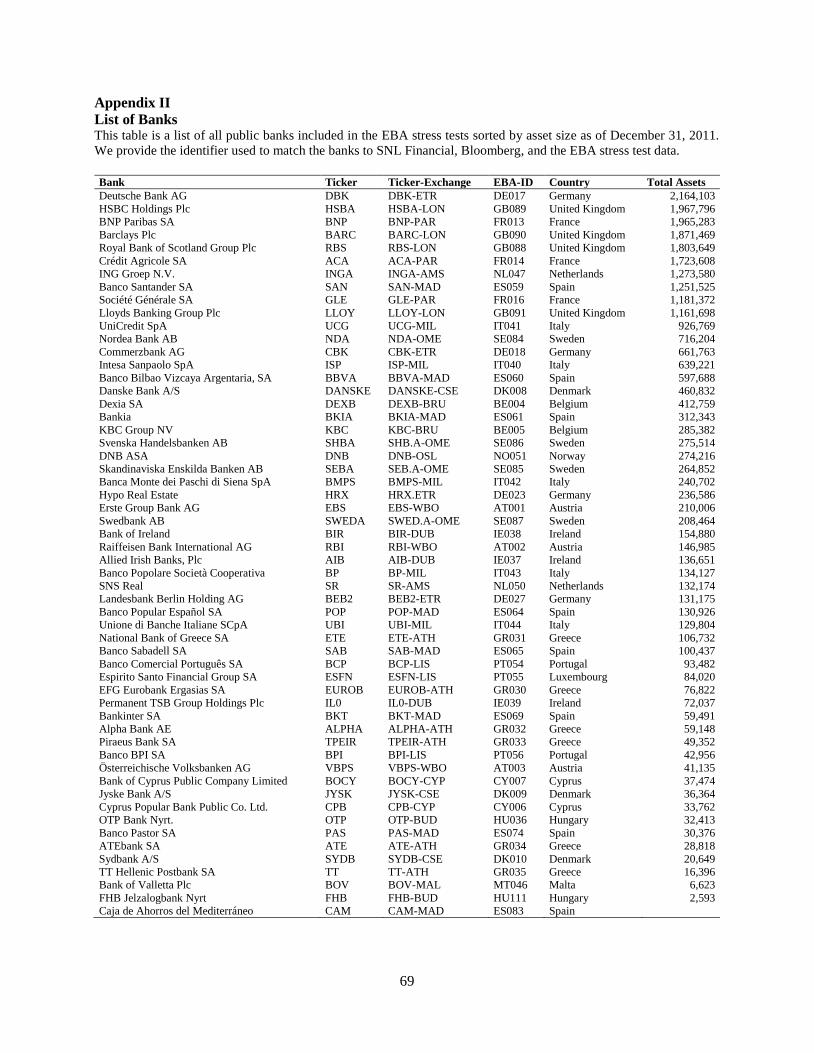
69
Appendix II
List of Banks This table is a list of all public banks included in the EBA stress tests sorted by asset size as of December 31, 2011.
We provide the identifier used to match the banks to SNL Financial, Bloomberg, and the EBA stress test data.
Bank Ticker Ticker-Exchange EBA-ID Country Total Assets
Deutsche Bank AG DBK DBK-ETR DE017 Germany 2,164,103
HSBC Holdings Plc HSBA HSBA-LON GB089 United Kingdom 1,967,796
BNP Paribas SA BNP BNP-PAR FR013 France 1,965,283
Barclays Plc BARC BARC-LON GB090 United Kingdom 1,871,469
Royal Bank of Scotland Group Plc RBS RBS-LON GB088 United Kingdom 1,803,649
Crédit Agricole SA ACA ACA-PAR FR014 France 1,723,608
ING Groep N.V. INGA INGA-AMS NL047 Netherlands 1,273,580
Banco Santander SA SAN SAN-MAD ES059 Spain 1,251,525
Société Générale SA GLE GLE-PAR FR016 France 1,181,372
Lloyds Banking Group Plc LLOY LLOY-LON GB091 United Kingdom 1,161,698
UniCredit SpA UCG UCG-MIL IT041 Italy 926,769
Nordea Bank AB NDA NDA-OME SE084 Sweden 716,204
Commerzbank AG CBK CBK-ETR DE018 Germany 661,763
Intesa Sanpaolo SpA ISP ISP-MIL IT040 Italy 639,221
Banco Bilbao Vizcaya Argentaria, SA BBVA BBVA-MAD ES060 Spain 597,688
Danske Bank A/S DANSKE DANSKE-CSE DK008 Denmark 460,832
Dexia SA DEXB DEXB-BRU BE004 Belgium 412,759
Bankia BKIA BKIA-MAD ES061 Spain 312,343
KBC Group NV KBC KBC-BRU BE005 Belgium 285,382
Svenska Handelsbanken AB SHBA SHB.A-OME SE086 Sweden 275,514
DNB ASA DNB DNB-OSL NO051 Norway 274,216
Skandinaviska Enskilda Banken AB SEBA SEB.A-OME SE085 Sweden 264,852
Banca Monte dei Paschi di Siena SpA BMPS BMPS-MIL IT042 Italy 240,702
Hypo Real Estate HRX HRX.ETR DE023 Germany 236,586
Erste Group Bank AG EBS EBS-WBO AT001 Austria 210,006
Swedbank AB SWEDA SWED.A-OME SE087 Sweden 208,464
Bank of Ireland BIR BIR-DUB IE038 Ireland 154,880
Raiffeisen Bank International AG RBI RBI-WBO AT002 Austria 146,985
Allied Irish Banks, Plc AIB AIB-DUB IE037 Ireland 136,651
Banco Popolare Società Cooperativa BP BP-MIL IT043 Italy 134,127
SNS Real SR SR-AMS NL050 Netherlands 132,174
Landesbank Berlin Holding AG BEB2 BEB2-ETR DE027 Germany 131,175
Banco Popular Español SA POP POP-MAD ES064 Spain 130,926
Unione di Banche Italiane SCpA UBI UBI-MIL IT044 Italy 129,804
National Bank of Greece SA ETE ETE-ATH GR031 Greece 106,732
Banco Sabadell SA SAB SAB-MAD ES065 Spain 100,437
Banco Comercial Português SA BCP BCP-LIS PT054 Portugal 93,482
Espirito Santo Financial Group SA ESFN ESFN-LIS PT055 Luxembourg 84,020
EFG Eurobank Ergasias SA EUROB EUROB-ATH GR030 Greece 76,822
Permanent TSB Group Holdings Plc IL0 IL0-DUB IE039 Ireland 72,037
Bankinter SA BKT BKT-MAD ES069 Spain 59,491
Alpha Bank AE ALPHA ALPHA-ATH GR032 Greece 59,148
Piraeus Bank SA TPEIR TPEIR-ATH GR033 Greece 49,352
Banco BPI SA BPI BPI-LIS PT056 Portugal 42,956
Österreichische Volksbanken AG VBPS VBPS-WBO AT003 Austria 41,135
Bank of Cyprus Public Company Limited BOCY BOCY-CYP CY007 Cyprus 37,474
Jyske Bank A/S JYSK JYSK-CSE DK009 Denmark 36,364
Cyprus Popular Bank Public Co. Ltd. CPB CPB-CYP CY006 Cyprus 33,762
OTP Bank Nyrt. OTP OTP-BUD HU036 Hungary 32,413
Banco Pastor SA PAS PAS-MAD ES074 Spain 30,376
ATEbank SA ATE ATE-ATH GR034 Greece 28,818
Sydbank A/S SYDB SYDB-CSE DK010 Denmark 20,649
TT Hellenic Postbank SA TT TT-ATH GR035 Greece 16,396
Bank of Valletta Plc BOV BOV-MAL MT046 Malta 6,623
FHB Jelzalogbank Nyrt FHB FHB-BUD HU111 Hungary 2,593
Caja de Ahorros del Mediterráneo CAM CAM-MAD ES083 Spain
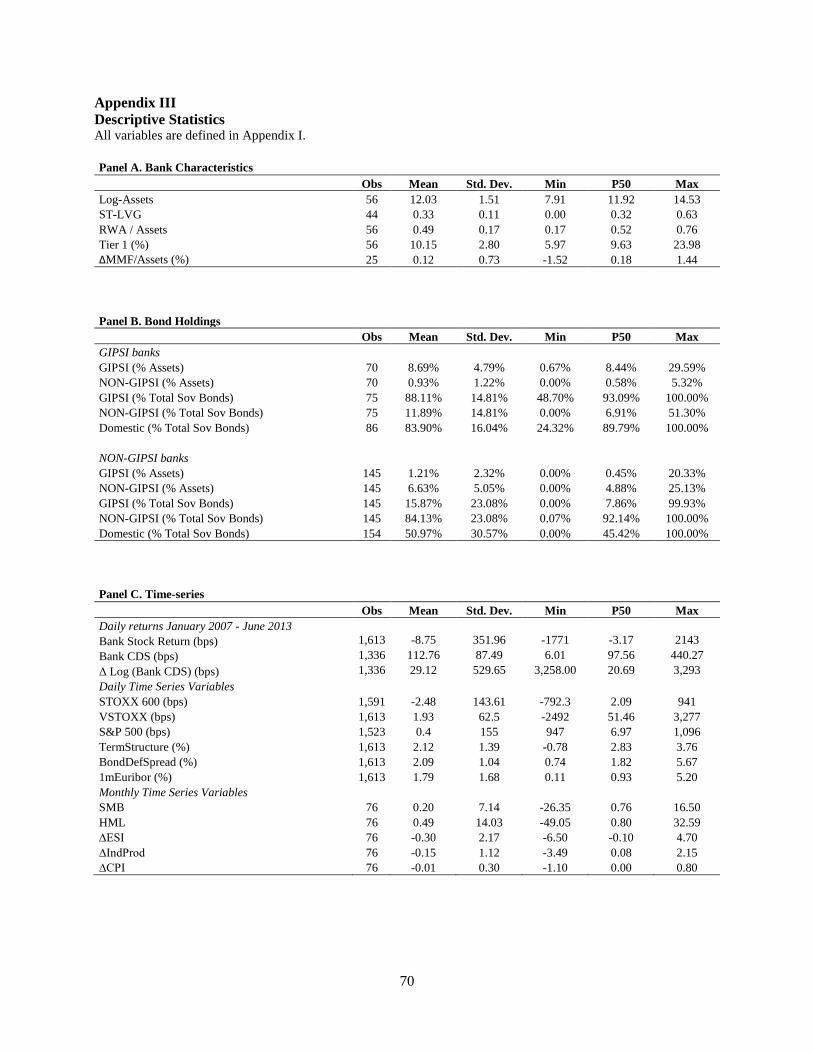
70
Appendix III
Descriptive Statistics All variables are defined in Appendix I.
Panel A. Bank Characteristics
Obs Mean Std. Dev. Min P50 Max
Log-Assets 56 12.03 1.51 7.91 11.92 14.53
ST-LVG 44 0.33 0.11 0.00 0.32 0.63
RWA / Assets 56 0.49 0.17 0.17 0.52 0.76
Tier 1 (%) 56 10.15 2.80 5.97 9.63 23.98
∆MMF/Assets (%) 25 0.12 0.73 -1.52 0.18 1.44
Panel B. Bond Holdings
Obs Mean Std. Dev. Min P50 Max
GIPSI banks
GIPSI (% Assets) 70 8.69% 4.79% 0.67% 8.44% 29.59%
NON-GIPSI (% Assets) 70 0.93% 1.22% 0.00% 0.58% 5.32%
GIPSI (% Total Sov Bonds) 75 88.11% 14.81% 48.70% 93.09% 100.00%
NON-GIPSI (% Total Sov Bonds) 75 11.89% 14.81% 0.00% 6.91% 51.30%
Domestic (% Total Sov Bonds) 86 83.90% 16.04% 24.32% 89.79% 100.00%
NON-GIPSI banks
GIPSI (% Assets) 145 1.21% 2.32% 0.00% 0.45% 20.33%
NON-GIPSI (% Assets) 145 6.63% 5.05% 0.00% 4.88% 25.13%
GIPSI (% Total Sov Bonds) 145 15.87% 23.08% 0.00% 7.86% 99.93%
NON-GIPSI (% Total Sov Bonds) 145 84.13% 23.08% 0.07% 92.14% 100.00%
Domestic (% Total Sov Bonds) 154 50.97% 30.57% 0.00% 45.42% 100.00%
Panel C. Time-series
Obs Mean Std. Dev. Min P50 Max
Daily returns January 2007 - June 2013
Bank Stock Return (bps) 1,613 -8.75 351.96 -1771 -3.17 2143
Bank CDS (bps) 1,336 112.76 87.49 6.01 97.56 440.27
Δ Log (Bank CDS) (bps) 1,336 29.12 529.65 3,258.00 20.69 3,293
Daily Time Series Variables
STOXX 600 (bps) 1,591 -2.48 143.61 -792.3 2.09 941
VSTOXX (bps) 1,613 1.93 62.5 -2492 51.46 3,277
S&P 500 (bps) 1,523 0.4 155 947 6.97 1,096
TermStructure (%) 1,613 2.12 1.39 -0.78 2.83 3.76
BondDefSpread (%) 1,613 2.09 1.04 0.74 1.82 5.67
1mEuribor (%) 1,613 1.79 1.68 0.11 0.93 5.20
Monthly Time Series Variables
SMB 76 0.20 7.14 -26.35 0.76 16.50
HML 76 0.49 14.03 -49.05 0.80 32.59
∆ESI 76 -0.30 2.17 -6.50 -0.10 4.70
∆IndProd 76 -0.15 1.12 -3.49 0.08 2.15
∆CPI 76 -0.01 0.30 -1.10 0.00 0.80
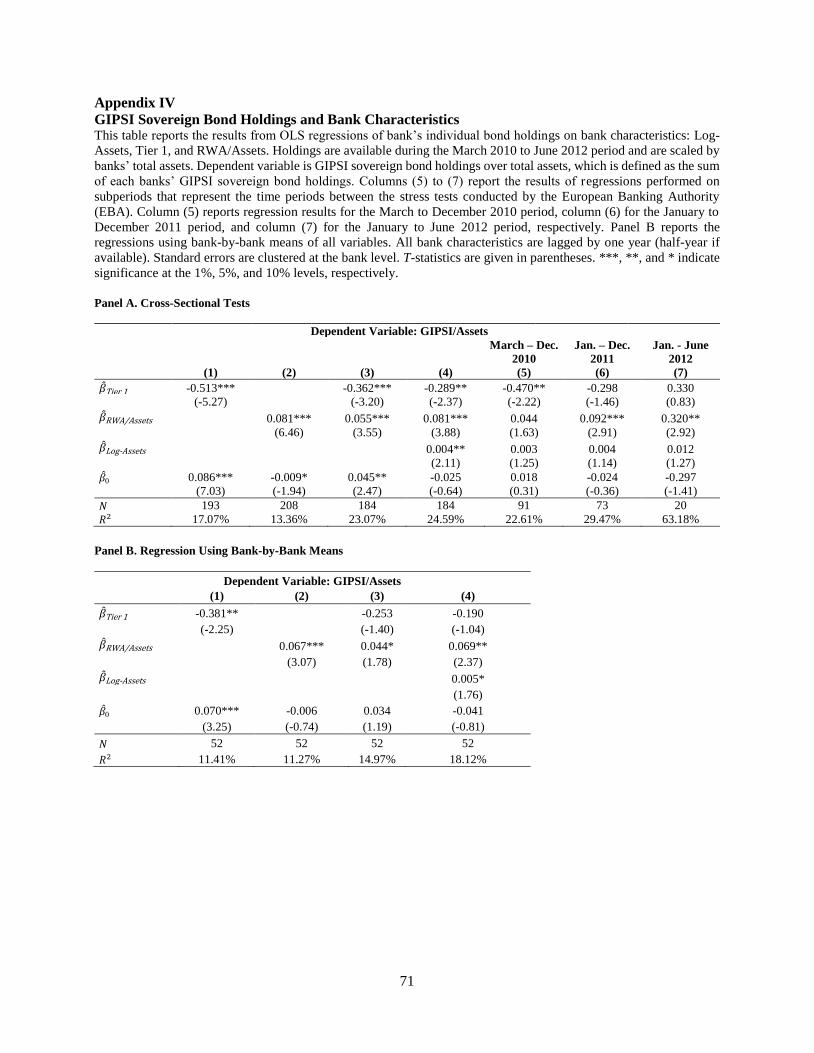
71
Appendix IV
GIPSI Sovereign Bond Holdings and Bank Characteristics This table reports the results from OLS regressions of bank’s individual bond holdings on bank characteristics: Log-
Assets, Tier 1, and RWA/Assets. Holdings are available during the March 2010 to June 2012 period and are scaled by
banks’ total assets. Dependent variable is GIPSI sovereign bond holdings over total assets, which is defined as the sum
of each banks’ GIPSI sovereign bond holdings. Columns (5) to (7) report the results of regressions performed on
subperiods that represent the time periods between the stress tests conducted by the European Banking Authority
(EBA). Column (5) reports regression results for the March to December 2010 period, column (6) for the January to
December 2011 period, and column (7) for the January to June 2012 period, respectively. Panel B reports the
regressions using bank-by-bank means of all variables. All bank characteristics are lagged by one year (half-year if
available). Standard errors are clustered at the bank level. T-statistics are given in parentheses. ***, **, and * indicate
significance at the 1%, 5%, and 10% levels, respectively.
Panel A. Cross-Sectional Tests
Dependent Variable: GIPSI/Assets
March – Dec.
2010
Jan. – Dec.
2011
Jan. - June
2012
(1) (2) (3) (4) (5) (6) (7)
�̂�Tier 1 -0.513*** -0.362*** -0.289** -0.470** -0.298 0.330
(-5.27) (-3.20) (-2.37) (-2.22) (-1.46) (0.83)
�̂�RWA/Assets 0.081*** 0.055*** 0.081*** 0.044 0.092*** 0.320**
(6.46) (3.55) (3.88) (1.63) (2.91) (2.92)
�̂�Log-Assets 0.004** 0.003 0.004 0.012
(2.11) (1.25) (1.14) (1.27)
�̂�0 0.086*** -0.009* 0.045** -0.025 0.018 -0.024 -0.297
(7.03) (-1.94) (2.47) (-0.64) (0.31) (-0.36) (-1.41)
𝑁 193 208 184 184 91 73 20
𝑅2 17.07% 13.36% 23.07% 24.59% 22.61% 29.47% 63.18%
Panel B. Regression Using Bank-by-Bank Means
Dependent Variable: GIPSI/Assets
(1) (2) (3) (4)
�̂�Tier 1 -0.381** -0.253 -0.190
(-2.25) (-1.40) (-1.04)
�̂�RWA/Assets 0.067*** 0.044* 0.069**
(3.07) (1.78) (2.37)
�̂�Log-Assets 0.005*
(1.76)
�̂�0 0.070*** -0.006 0.034 -0.041
(3.25) (-0.74) (1.19) (-0.81)
𝑁 52 52 52 52
𝑅2 11.41% 11.27% 14.97% 18.12%
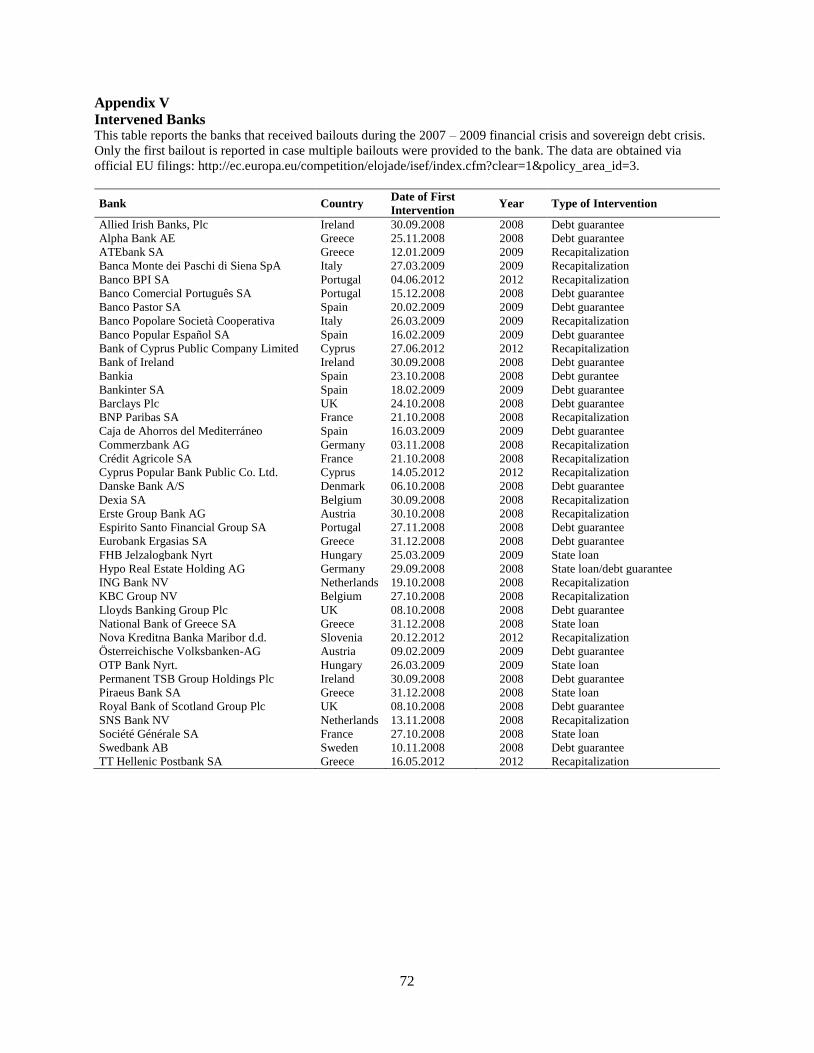
72
Appendix V
Intervened Banks This table reports the banks that received bailouts during the 2007 – 2009 financial crisis and sovereign debt crisis.
Only the first bailout is reported in case multiple bailouts were provided to the bank. The data are obtained via
official EU filings: http://ec.europa.eu/competition/elojade/isef/index.cfm?clear=1&policy_area_id=3.
Bank Country Date of First
Intervention Year Type of Intervention
Allied Irish Banks, Plc Ireland 30.09.2008 2008 Debt guarantee
Alpha Bank AE Greece 25.11.2008 2008 Debt guarantee
ATEbank SA Greece 12.01.2009 2009 Recapitalization
Banca Monte dei Paschi di Siena SpA Italy 27.03.2009 2009 Recapitalization
Banco BPI SA Portugal 04.06.2012 2012 Recapitalization
Banco Comercial Português SA Portugal 15.12.2008 2008 Debt guarantee
Banco Pastor SA Spain 20.02.2009 2009 Debt guarantee
Banco Popolare Società Cooperativa Italy 26.03.2009 2009 Recapitalization
Banco Popular Español SA Spain 16.02.2009 2009 Debt guarantee
Bank of Cyprus Public Company Limited Cyprus 27.06.2012 2012 Recapitalization
Bank of Ireland Ireland 30.09.2008 2008 Debt guarantee
Bankia Spain 23.10.2008 2008 Debt gurantee
Bankinter SA Spain 18.02.2009 2009 Debt guarantee
Barclays Plc UK 24.10.2008 2008 Debt guarantee
BNP Paribas SA France 21.10.2008 2008 Recapitalization
Caja de Ahorros del Mediterráneo Spain 16.03.2009 2009 Debt guarantee
Commerzbank AG Germany 03.11.2008 2008 Recapitalization
Crédit Agricole SA France 21.10.2008 2008 Recapitalization
Cyprus Popular Bank Public Co. Ltd. Cyprus 14.05.2012 2012 Recapitalization
Danske Bank A/S Denmark 06.10.2008 2008 Debt guarantee
Dexia SA Belgium 30.09.2008 2008 Recapitalization
Erste Group Bank AG Austria 30.10.2008 2008 Recapitalization
Espirito Santo Financial Group SA Portugal 27.11.2008 2008 Debt guarantee
Eurobank Ergasias SA Greece 31.12.2008 2008 Debt guarantee
FHB Jelzalogbank Nyrt Hungary 25.03.2009 2009 State loan
Hypo Real Estate Holding AG Germany 29.09.2008 2008 State loan/debt guarantee
ING Bank NV Netherlands 19.10.2008 2008 Recapitalization
KBC Group NV Belgium 27.10.2008 2008 Recapitalization
Lloyds Banking Group Plc UK 08.10.2008 2008 Debt guarantee
National Bank of Greece SA Greece 31.12.2008 2008 State loan
Nova Kreditna Banka Maribor d.d. Slovenia 20.12.2012 2012 Recapitalization
Österreichische Volksbanken-AG Austria 09.02.2009 2009 Debt guarantee
OTP Bank Nyrt. Hungary 26.03.2009 2009 State loan
Permanent TSB Group Holdings Plc Ireland 30.09.2008 2008 Debt guarantee
Piraeus Bank SA Greece 31.12.2008 2008 State loan
Royal Bank of Scotland Group Plc UK 08.10.2008 2008 Debt guarantee
SNS Bank NV Netherlands 13.11.2008 2008 Recapitalization
Société Générale SA France 27.10.2008 2008 State loan
Swedbank AB Sweden 10.11.2008 2008 Debt guarantee
TT Hellenic Postbank SA Greece 16.05.2012 2012 Recapitalization