Embed Size (px)
Citation preview

The ‘Greening’ of China: Progress, Limitations, and Contradictions
Chiara Piovani
Assistant Professor Department of Economics – University of Denver
2000 E. Asbury Denver, CO 80208
E-mail: [email protected] Abstract China’s rapid economic growth in the last three decades has been fueled by energy-intensive investment and manufacturing, which have become instrumental for China to become the world’s largest economy based on purchasing power parity, and for the United States and the EU to have access to cheap consumer goods. China’s strategy of development, however, has generated a serious domestic environmental crisis, which has also greatly accelerated the global climate emergency. In addition, the Great Recession has led to a collapse of China’s external demand, inducing the Chinese leadership to support domestic investment – including investment in environmental projects – as an alternative source of effective demand. By setting ambitious green targets and by adopting strategic policy initiatives, China has now become the world’s largest investor in renewable energy. In this context, however, China remains the world’s largest coal consumer and the world’s largest carbon dioxide emitter. The Chinese economy nears a crossroad: will it be able to maintain its commitment to green energies or will it fall back to its historical reliance on fossil fuels to sustain economic growth? This paper evaluates the interplay between China’s economy and China’s environment over the course of the reform period, and investigates the set of forces that impinge upon China’s ecological future. JEL classification: Q4; Q56; Q58 Keywords: China; climate change; energy; environment; global crisis.
1
1. Introduction
Since the adoption of the economic reforms in 1978, China has experienced what is
referred to in the mainstream literature as an ‘economic miracle.’ Between 1980 and 2007, the
Chinese economy grew at an average annual rate of 10 percent, leading China – based on
purchasing power parity – to become the world’s largest economy in 2014 (IMF 2014). China’s
economic ascendancy, however, has occurred at the expense of China’s environmental
conditions. In the recent years, air pollution in China’s major cities has reached hazardous levels
several times per year, causing in Beijing alone 2,589 deaths in 2012 because of PM2.5
concentration in the air well beyond the World Health Organization (WHO) recommendations
(Greenpeace 2012).1 China’s water system is in a severe state of crisis; about 300 million rural
citizens lack access to safe drinking water and over 60 percent of the cities experience water
shortages (Liu and Yang 2012). China’s Ministry of Agriculture estimates that 3.3 million
hectares of land are now polluted due to overuse of fertilizers and pesticides and contamination
with heavy metals, which in turn has made national food security one of the policy priorities of
the government.
Statistics on China’s environmental damage are aggravated by China’s scarce endowment
of natural resources in relation to its population. It is estimated that China’s arable land and fresh
water availability are about one-third of the world’s average (Tisdall 2001). In addition, the
government’s plan to reach an urbanization rate of 60 percent by 2020 – corresponding to 1.4
billion people – makes environmental challenges extremely compelling (Tiezzi 2013).
As China has become a major player in the world economy over the last thirty years,
China’s environmental problems have also acquired a global dimension. In 2007, China became
the world’s leading emitter of carbon dioxide emissions, greatly accelerating the world’s climate
1 PM2.5 refers to particles in the air that are less than 2.5 micrometers in diameter. Because of their small size, they referred to as "fine" particles, and are considered to the most dangerous type of air pollution for public health.
2

emergency and raising both equity and efficiency challenges in international climate negotiations
(Argawal 2002).2
In recent years, especially in response to the Great Recession and the subsequent need to
support effective demand through domestic investment, the Chinese government has pursued
policies that aim to improve energy conservation and promote low-carbon energy sources. As a
result of these efforts, China is now the world’s leader in renewable energy capacity, while it
also remains the world’s largest consumer of fossil fuels.
Is China’s current leadership in renewable energy the sign that China is on the road to
embrace a more ecologically sustainable model of development? This paper provides an
exploration of the major issues that impinge upon China’s aspiration of becoming “green.”
Towards this goal, this paper is organized as follows. Section 2 discusses the interplay between
China’s environment and China’s economy over the course of the reform period, and evaluates
the ecological, human and economic consequences of China’s ecological crisis. Section 3
presents the key policies that the Chinese government has used to protect the environment and
promote renewable energy. 3 Section 4 provides a critical assessment of the forces affecting
China’s prospects of “green development.” Section 5 concludes.
2. China’s ‘Economic Miracle:’ Resource and Energy Requirements and the
Environmental Consequences of China’s Rapid Economic Growth
2 The problem of climate change is mostly the result of the process of development of Western countries. As a result of rapid economic growth in emerging countries over the last few decades, however, China and India have become major contributors to climate change. All the attempts to arrive to an international climate agreement since 2009 have left negotiations at a deadlock: from an efficiency point of view, emerging countries should proceed with emission reductions at par with Western nations; from an equity point of view, emerging countries should be allowed to rely on fossil fuels as rich nations have done in the their own development experience to support industrialization. 3 Conventionally, renewable energy refers to the following low-carbon energy sources: solar, wind, geothermal, biomass, and hydropower.
3
China’s process of economic development over the course of the reform period has been
highly resource and energy intensive. Growth in resource and energy use has become especially
rapid since the early 2000s, when investment became a primary engine for China’s economic
growth (Piovani and Li 2011).
In the last thirty years, China has become a large consumer of a broad range of primary
commodities. Figure 1 shows China’s escalating trend in the consumption of four key minerals,
aluminum, iron ore, steel, and cement, between 1995 and 2012. To satisfy this growing demand,
in recent years China has dramatically increased domestic production of these resources. Figure
2 shows China’s production of each of these minerals between 2002 and 2012 against the US and
world’s production over the same time period. These figures point to the same direction. China
has contributed to a growing share of the world’s production of these resources (while U.S.
production has remained substantially unchanged). In 2012, China generated around 45 percent
of the world’s production of steel, iron ore and aluminum, and 58 percent of the world’s
production of cement. In spite of rapidly growing production, China has a positive trade balance
only for steel, whereas for aluminum, iron ore, and cement China has become dependent on net
imports to fulfill its growing demand (USGS 2014).
Over the course of the reforms, China has also faced rapid growth in energy consumption.
Based on EIA data (2014), between 1980 and 2012 China’s share of the world’s primary energy
use increased from 6 percent to 20 percent, and in 2010 China became the world’s largest energy
consumer. These outcomes are primarily driven by China’s massive coal consumption. Between
1980 and 2012, China’s coal consumption as a share of total world’s coal consumption increased
from 17 to 50 percent, indicating that China now consumes as much coal as the rest of the world
altogether. Since the early 2000s, however, China’s consumption of oil and natural gas has also
increased substantially. Between 2002 and 2012, China’s oil consumption increased by over 130
4

percent, and in 2009 China became the world’s second largest oil consumer. In addition, over the
same period, consumption of natural gas increased by over 5 times (EIA 2014).
China’s massive growth in both resource and energy consumption over the time span of just
over thirty years is unprecedented in the development experience of any other country. Such
massive demands on China’s environmental base has led to the accumulation of serious
ecological challenges that now threaten the long-term prospects of development of the Chinese
economy (Vennemo 2009; World Bank 2007). Among the various indicators that can be used to
assess a country’s environmental state, the “Ecological Footprint” and the “Environmental
Performance Index” (EPI) provide a poignant indication of the magnitude of China’s ecological
crisis.
The Ecological Footprint refers to the amount of biologically productive land (including
fishing grounds) required to provide the resources demanded by human activities and to
sequester carbon emissions.4 As of 2014, China is responsible for 19 percent of the world’s total
Ecological Footprint, the largest world’s share owned by a single nation. Following China’s
rapid growth of energy use in the recent decades, the carbon footprint is the component of
China’s Ecological Footprint that has been growing at the fastest rate. Between 1961 and 2014,
China’s carbon footprint, as a share of the national Ecological Footprint, increased from 10
percent to 51 percent (WWF 2012, 2014).
The Ecological Footprint can be compared to the concept of ‘biocapacity,’ which consists of
the amount of productive land and water that is available to generate the resources demanded by
the economy, and to absorb the relative waste. Measured in per-capita terms, since the early
1970s, China’s Ecological Footprint has systematically exceeded the value of the national
4 The Ecological Footprint is made of six components: carbon, forest, cropland, grazing land, fishing grounds, and land covered by infrastructures. For a full account of the methodology used to calculate the Ecological Footprint, see Borucke et al. (2013).
5

biocapacity, leading to the accumulation of an ecological deficit every single year (Halle, 2014).
In 2009, China’s Ecological Footprint in per-capita terms (2.2 gha) was over 144 percent the
value of China’s per-capita biocapacity (0.9 gha) (Global Footprint Network 2014).5 As a result,
China is now confronted with an ecological debt, which – unless seriously addressed – may
jeopardize the future development possibilities of the Chinese economy, and threaten to rapidly
aggravate the state of ecological overshoot of the world economy as a whole.6
The “Environmental Performance Index” (EPI) can be interpreted as a complementary
indicator to the Ecological Footprint; it targets the effectiveness of environmental policies
implemented within a nation’s borders. More specifically, the latest EPI Report ranked 178
countries according to their performance in the protection of human health from environmental
degradation and protection of ecosystems (Yale Center for Environmental Law & Policy and
Center for International Earth Science Information Network 2014). 7 According to this latest
assessment, China is one of the worst performers. It ranked 118th, the second worst performance
among the BRIC nations. Both Russia and Brazil did better, ranking 73th and 77th, respectively;
only India showed a worse performance, ranking 155th. The nations positioned low in the
ranking are countries facing political or economic disputes, suggesting that environmental policy
is a secondary issue when a country faces more direct emergencies. In the case of China,
5 The 2009 data referring to both Ecological Footprint and biocapacity is the latest available (Global Footprint Network, 2014). Both the Ecological Footprint and biocapacity are reported in ‘global hectares’ (gha), which measure areas of different types of land adjusted for productivity. China has the world's largest population, but its rate of growth has been declining over the last forty years. Over the course of the reform period, however, China’s per-capita resource consumption has significantly increased. According to an analysis of Gaodi et al. (2012), until the end of the 20th century, the average annual increase in the per-capita Ecological Footprint was 0.02 gha per person. This rate increased to 0.07 gha between 2000 and 2008, leading to a rapidly growing gap between the national Ecological Footprint and national biocapacity. 6 Since the early 1970s, the world economy as a whole has been demanding more resources than what the planet can regenerate. The WWF (2014) calculates that 1.5 Earths would be required to provide all the resources that humanity currently demands. 7 Within these two policy domains, the EPI identifies nine issues (health impact, air quality, water and sanitation, water resources, agriculture, forests, fisheries, biodiversity and habitat, climate and energy), all measured by twenty indicators (Yale Center for Environmental Law & Policy and Center for International Earth Science Information Network 2014).
6

however, its position in the ranking is the result of neglect for the quality of the environment for
a great part of the reform era. Policy measures to protect the environment and reduce dependency
on fossil fuels have only been introduced in the early 2000, when the consequences of rapid
economic growth and massive energy demand became compelling. Four dimensions have
contributed to shift the attention of the Chinese government towards environmental issues and
their potential impact on China’s development prospects: first, the escalation in the number of
environmental protests; second, the growing research showing the adverse health effects of
pollution on the Chinese population; third, the impact of climate change on the national territory;
finally, the urgency to guarantee energy security.
As the Chinese citizens are becoming increasingly aware of the heavy environmental costs
associated with China’s rapid economic growth, the number of “mass incidents” against
pollution has rapidly accumulated, both in rural and urban areas (Zhifeng 2009).8 According to
the 2013 annual Report released by China’s Ministry of Environmental Protection, 712 cases of
“abrupt environmental incidents” – many of which are in fact citizens’ protests – occurred in
2013 alone, an increase by 31 percent with respect to 2012. Even though the government does
not release official statistics on citizens’ strikes and protests, there is widespread consensus that
discontent for China’s environmental degradation has become a major cause of social unrest in
China, and has intensified the tension between the government and the civil society (Tong and
Lei 2010; Goron 2012).
The rise in environmental activism is closely tied to the growing number of studies showing
a link between pollution and public health risks. According to the World Bank (2007), in 2003
the health costs of outdoor air pollution in urban areas were between 157 and 520 billion yuan,
corresponding to 1.2 – 3.3 percent of China’s GDP in 2003. More recently, the Global Burden of
8 The first significant environmental demonstrations started in 2005 (Deng and O’Brian 2013). “Mass incidents” is the official term that is used to refer to protests involving at least 100 people.
7

Disease Study 2010 by Lim et al. (2012) estimates that exposure to outdoor air pollution is the
fourth leading cause of life expectancy loss in China, and is responsible for 1.2 million
premature deaths, around 38 percent of the total number of premature deaths worldwide. In
addition, due to a combination of both smoking habits and pollution, lung cancer has become the
leading cause of death in China. According to a study by Stewart and Wild (2014) at the
International Agency for Research on Cancer (IARC), one-third of the global cases of lung
cancer happen in China (Stewart and Wild, 2014).
Other forms of pollutions in China are health hazards as well. Water and farmland
contamination with toxic chemical pollutants and heavy metals have contributed to the
emergence of over 450 “cancer villages,” which is the term officially adopted by Chinese
authorities to refer to local cancer epidemics (Mosbergen 2013). In the last thirty years, cancer
rates in China have increased by over 80 percent (Zhao et al. 2009). Environmental pollution is
also pointed at as a major contributor to the observed increase in birth defects, infertility,
respiratory infections, and cardiovascular diseases (Balabanič et al. 2011; Kan et al. 2009; Perera
et al. 2008; Zhang et al. 2014; Zhou et al. 2011).
In addition to the impact on public health, China’s massive fossil fuel consumption over the
last thirty years has strongly accelerated the global climate emergency. On the one hand, as
shown in Figure 3, China’s exponential rise in carbon emissions has paralleled China’s GDP,
suggesting that energy consumption has been closely related with China’s stunning rise in
income; on the other hand, however, China has also become the world’s leading emitter of
carbon dioxide due to massive fossil fuel consumption, which is by now proven to be the major
cause of the increase in global average temperatures (IPCC 2007).
China is estimated to be one of the countries that are more vulnerable to the effects of climate
change. Due to climate change, China has already been experiencing severe droughts and floods,
8
and more recurrent extreme weather patterns, which are expected to get worse in the coming
years (HSBC 2011; National Development and Reform Commission 2012; Tiezzi 2014). As a
result, over the last decade, China has experienced a rapid increase in the number of natural
disasters; in 2011, 430 million people in China were victims of weather and climate calamities
(Guha-Sapir, Hoyois, and Below 2013; National Development and Reform Commission 2012).
According to the National Bureau of Statistics of China (2013, 2014), the economic losses from
natural disasters in 2013 amounted to 421 billion yuan, an increase by 62 percent from 2012. The
effects of climate change have made the need to reduce the dependency on fossil fuels a policy
priority for the Chinese authorities (National Development and Reform Commission 2012,
2013).
Energy has become a prominent issue in China since 1993, when China for the first time
became a net oil importer, ending energy self-sufficiency. Following rapid growth of China’s oil
consumption, in 2013 China became the world’s largest net oil importer. With respect to coal –
the nation’s primary energy source – China has been historically a net exporter; since 2009,
China has become dependent on international trade to meet its coal demand. Since 2007, China
has also been a net natural gas importer. Based on BP projections (2014), China’s energy balance
– measured by the difference between energy production and energy consumption – is expected
to rapidly deteriorate in the coming decades, from -372 Mtoe in 2015 to -918 Mtoe in 2030.
China is thus expected to become increasingly dependent on foreign supplies to fulfill its energy
demand, making energy security a fundamental concern for the Chinese authorities.
In response to China’s environmental challenges and to the fear that China’s economic
development may not be sustained if China’s environmental problems are not addressed, the
Chinese government has taken two types of actions to guarantee both a steady supply of energy
and primary resources and reduce the high level of domestic pollution. One strategy has involved
9
securing primary resources in the developing world. China has rapidly increased its outward
foreign direct investment (FDI) in extractive industries in both Latina America and Africa.9
Since 2010, Chinese enterprises have invested an average of US$10 billion per year in Latin
American countries. In Africa, China’s FDI increased from around US$320 million in 2005 to
US$5.2 billion in 2012. In both cases, around 30 percent of China’s total FDI is invested in oil,
minerals and other natural resources (ECLAC 2013; MOFCOM 2012). China has also proceeded
to lock in relations with those developing countries that are major exporters of primary
commodities or are recipients of China’s FDI by committing to bilateral trade agreements,
financial intermediation, and foreign assistance. In this direction, as of 2014, China holds free
trade agreements with Chile and Peru, for both of which China is the primary export market of
copper and other metals. China has committed to US$35 billion in loans to finance construction
of infrastructure in Latin America (Xiaoyuan 2014), and has approved to increase loans to
African countries to US$30 billion to support infrastructural projects (Qi 2014). Between 2010
and 2012, China also spent about US$14.4 billion in foreign aid, consisting of grants, interest-
free loans, and concessional loans, mostly destined to Latin America and Africa (Taidong 2014).
As a second strategy to address environmental problems, since the early 2000s China has
begun to tackle its rapid growth of carbon emissions. To understand which measures a country
can consider to confront its carbon emissions, it is useful to look at the “Kaya Identity” (Kaya
and Yokobori 1997). The Kaya Identity provides a decomposition of carbon emissions, which
allows to identify the drivers of greenhouse gas emissions and possible policy options:10
CO2 = (CO2 / E) × (E / GDP) × (GDP / POP) × POP
9 Beginning in 1999, China began to liberalize and deregulate outward FDI through the so-called “Go Out Policy” or “Going Global Strategy” (Luo et al., 2010). 10 The “Kaya Identity” is reported every year by the International Energy Agency (IEA) in the World Energy Outlook; it is used by the IEA to formulate future scenarios of emission growth.
10

Where:
(CO2 / E) = carbon intensity of energy consumption;
(E / GDP) = energy intensity;
(GDP / POP) = GDP-per-capita;
POP = population.
This equation indicates that, if a country intends to reduce carbon emissions, the possible
measures are based on the following options: first, diversifying the energy base away from fossil
fuels towards renewable energy; second, reduce the amount of energy required by each unit of
output; finally, accept a reduction of income per capita or a decline in the population level.
In the case of China, the last two options have been outside the domain of consideration; for
most of the reform period, the Chinese officials have not demonstrated the willingness to give up
improvements in standards of living through growth in GDP per capita; in addition, the “One
Child Policy” has recently been revised to allow faster population growth.11,12 China has relied
on the first two variables of the Kaya identity to contribute to climate stabilization and improve
domestic environmental conditions. The product of the first two variables is CO2-to-GDP ratio,
or the carbon intensity of GDP. At the Climate Conference in Copenhagen in 2009, China has
made a pledge to reduce its emission intensity (or CO2 emissions per unit of GDP) by 40-45
percent by 2020 compared to 2005 levels. Even though at this point of the climate emergency
scientists indicate only an absolute level in emissions can tackle the climate crisis, China has
committed not to reduce the absolute level of its emissions, but to curb their growth rate. To
11 In the discourse, over the last ten years the Chinese authorities have periodically made the claim GDP growth is not sufficient for development, suggesting that social and environmental indicators are as important; in practice, however, GDP growth has remained the key indicator that the Chinese officials have used to evaluate China’s development performance. See Section 4. 12 In November 2013, following the Third Plenum of the 18th Central Committee of the Chinese Communist Party, China announced the decision to make the one-child policy less restrictive. Under the new policy, Chinese families can have two children if one parent does not have siblings (Kaiman 2013).
11
fulfill this commitment, improvement in energy efficiency and investment in renewable energy
have become the two key dimensions targeted by the policy measures that the government has
established.
3. China’s Ascendency to the World’s Leadership in Renewable Energy Capacity
Beginning in the early 2000s, the Communist Party began to demonstrate commitment to the
environment through a variety of directives, pledges, and laws. In September 2003, the 16th
Party Congress announced the intention to pursue a “scientific approach to development” to
achieve “common prosperity” and a “harmonious society.” Within this framework, the Chinese
leadership promised to pay greater attention to social equity and environmental sustainability,
shifting away from the commitment to economic growth only as an instrument for development.
This new political agenda led to research on “green national economic accounting” – which
ultimately only produced marginal results – and set the foundations of a series of policy
initiatives targeting energy use and environmental protection (Wang, Jiang, and Yu 2004; Rauch
and Chi 2010; Worldwatch 2010).13
In November 2004, the Chinese National Development and Reform Commission (NDRC)
issued the Medium and Long-Term Energy Conservation Plan, which constitutes the first critical
recognition on the part of the Chinese government of the importance of energy saving for
China’s long-term development. The plan targeted a reduction in energy intensity by an average
annual rate of 2.2 percent from 2003 to 2010, and by 3 percent from 2003 to 2020. In addition,
the plan introduced energy efficiency standards for major energy-consuming appliances, and
13 Green national accounting refers to a system of accounting for the national economy, which requires subtracting the costs of environmental degradation, depletion of national resources, and environmental restoration plans from traditional GDP.
12

identified the key sectors and projects that should be tackled to fulfill the energy intensity
targets.14
In 2005, China’s National People’s Congress approved the Renewable Energy Law (amended
in 2009), which sanctioned China’s commitment to renewable energy development and provided
the following guiding mechanisms for the promotion of renewable energy in China: first, setting
renewable energy development and utilization targets; second, introducing a mandatory purchase
policy for grid companies and gas and heat operators; third, adopting an on-grid electricity price
for renewables to be set by the National Development and Reform Commission (NDRC); lastly,
using a cost-sharing mechanism to ensure grid companies are able to recover the additional cost
of renewables with respect to traditional fossil fuels (Schuman and Lin 2010).15
Energy was also at the core of the 11th Five-Year Plan (2006-2010), which pledged an even
more ambitious energy saving target than what stated in the 2004 Medium and Long-Term
Energy Conservation Plan. The new goal consisted in a reduction in energy intensity by 20
percent from 2005 levels by 2010.16 The plan also contained a series of commitments towards
environmental protection, including more investment in water quality and conservation, and a
reduction of major pollutants by 10 percent from 2005 levels by 2010 (Fan 2006; Naughton
2005; Zhou 2010).
14 The Medium and Long-Term Energy Conservation Plan specifies possible measures for energy conservation in individual energy intensive industries, different forms of transportation, in addition to construction, commercial and residential buildings. 15 The 2009 amendment introduced three key new principles: first, in response to the observed systematic violation of the mandatory purchase policy, grid companies were required to provide a fixed share of their total power generation with renewables (where the share was left to be determined by specific government agencies); second, a “Renewable Energy Development Fund” was set up to support both grid companies and new investments and research in renewable energy. It was determined that the fund would be financed through a surcharge imposed on electricity bills (Schuman 2010). 16 This target was introduced in response to an increase in energy intensity experienced between 2003 and 2005, which broke the trend of declining energy intensity that had been steadily observed since the beginning of the reform period.
13

Based on these guidelines, the 2007 Mid-and Long-Term Energy Development Plan for
Renewable Energy stated that the national share of primary energy consumption from renewables
should rise to 10 percent by 2010 and to 15 percent by 2020. It also specified that non-hydro
renewables should provide for 1 percent of total power generation by 2010 and for 3 percent by
2020. In the same year, the Chinese leadership introduced a new Energy Conservation Law –
amending the provisions of the same law enacted in 1997, which remained largely ignored –
requiring that all new fixed investment considered by the government should undergo an energy
efficiency evaluation before receiving approval. This new policy has intended to shift public
investment towards low-carbon and energy saving projects.
China’s commitment to energy conservation and emission reduction was confirmed in the
context of the global economic crisis. When the Great Recession hit the world economy in 2008,
China responded with a stimulus package of 4 trillion yuan (US$586 billion) – 14 percent of
China’s GDP in 2008 – to be spent through 2010 to offset the collapse of exports with domestic
demand, preventing a sharp decline of economic growth. 17 Around 38 percent of China’s
stimulus was directed towards environmental goals, including rail, grid, and water infrastructure,
as well as energy efficiency improvements, waste management, and pollution control (Jianlong
et al. 2010; Wong 2011).18 The fiscal package was accommodated by a rapid growth of bank
loans; about 75 percent of the plan was designed to become effective through bank credit rather
than direct government outlays, and the People’s Bank of China (PBC) supported this process by
lowering interest rates (Yueh 2010).
17 The major areas targeted by China’s stimulus plan are the following: (1) low-income housing; (2) rural infrastructure; (3) transportation (including railways, highways, and airports); (4) health, culture, and education; (5) environmental protection; (6) technology innovation and industrial reconstructing; (7) post-earthquake reconstruction. The plan was also accompanied by income support for rural and urban citizens, a value added reform tax to reduce the fiscal burden on enterprises by 210 billion yuan, and a financial reform (including removing ceilings on banks’ credit) (Wong 2011). 18 Among the countries that implemented a fiscal stimulus plan during the global crisis, only the Republic of Korea introduced a greater share than China’s for environmental projects (81 percent) (Strand and Toman 2010).
14

The dirigiste nature of the Chinese financial system has played an important role in
supporting the Party’s environmental commitments.19 In 2007, the Ministry of Environmental
Protection (MEP), the China Banking Regulatory Commission (CBRC) and the People’s Bank of
China (PBOC) jointly issued a “Green Credit” policy (whose specific guidelines were introduced
in 2012), requiring banks to strictly control credit issuance to energy intensive or polluting
industries and to support investments in energy saving, environmental protection, and renewable
energy. Based on these principles, banks have been critical in financing large-scale investment in
clean energy and energy efficiency in China in the years following the global crisis. At the
Industrial and Commercial Bank of China (ICBC), one of China’s four state-owned banks and
the largest bank in the world for total assets, loans to finance energy efficiency and low-carbon
projects have increased from 63 billion yuan in 2010 to 598 billion yuan in 2013.20,21
The 12th Five-Year Plan (2011-2015) adopted by the Chinese government in 2011 made
further steps towards promoting low-carbon energy sources. The plan included a set of ambitious
targets to be achieved by 2015: reducing energy intensity by 16 percent; raising the share of non-
fossil fuel energy consumption (including nuclear, hydro, and other renewable energy sources) to
11.4 percent; and reducing carbon intensity – defined by the ratio of carbon emissions to GDP –
19 This is clearly in contrast with the situation of a market-oriented economy such as the United States, in which it has been more difficult for environmental initiatives to gain financing. In the United States, there is in fact a growing discussion on the opportunity to increase the number of state green banks to expand the amount of financing for clean energy projects (Kennan 2014). 20 According to China’s classification, low-carbon projects also include nuclear energy. 21 The China Development Bank – which since 2009 has lent more money to other developing countries than the World Bank – has financed over the past several years projects in natural resources (especially, metals and mining and oil and gas) and infrastructural construction abroad. This is in line with China’s objective to secure natural resources in other countries to fulfill its internal demand. More recently, the China Development Bank has also begun to strongly finance renewable energy investment to support Chinese companies producing solar and wind power, and the purchase by foreign enterprises of renewable energy infrastructure made in China. Following the new guidelines introduced by the Chinese government in 2007, China Export and Import Bank – China’s official State Bank providing export credit to Chinese firms and loans for investment projects in foreign countries – is required to include a social and environmental assessment before approving loans for projects overseas. In addition, after the introduction of the green credit guidelines established in 2012, China Export and Import Bank is further constrained by the commitment to support a green and low-carbon economy.
15

by 17 percent (Lewis 2011).22 The plan also stated the goal of gradually establishing a carbon
market. As of 2014, seven carbon-trading pilots have been established in China, and a national
emission-trading scheme has been announced for 2016 (Qiu 2013).23
To support the targets indicated in the 12th Five-Year Plan, in 2013 the Chinese government
introduced two important pieces of legislation to tackle pollution and climate change. First,
China’s State Council issued an Action Plan for Air Pollution Prevention and Control, which
committed to a specific set of measures to improve air quality in China over the following five
years, including a pledge to reduce China’s share of coal consumption in total energy
consumption to 65 percent by 2017. Second, China’s State Council approved China’s first major
blueprint for tackling climate change – National Plan for Addressing Climate Change (2013-
2020) – which outlined a set of targets to be achieved by 2020 to mitigate and adapt to the effects
of climate change, including raising the share of non-fossil fuel energy to 15 percent (confirming
the commitment made in 2007), fulfilling the carbon intensity target declared at the 2009
Copenhagen conference, and undertaking extensive reforestation programs. To tackle climate
change, in November 2014 China also signed a major international agreement on emission
reduction with the United States. China committed to increase its share of renewable energy
consumption to 20 percent by 2030, and pledged that domestic carbon emissions would peak in
the same year (Landler 2014).
To support the declared commitment to reduce the dependency on fossil fuels, China has
adopted specific measures to succeed in the manufacturing of renewable energy equipment. On
the one hand, Chinese manufacturing firms have succeeded in lowering the costs of production
of certain technologies originally developed in industrialized countries, which allowed them to
22 The carbon intensity target set in the 12th Five-Year Plan should be interpreted as an inter-term target to fulfill the pledge made at the Copenhagen conference in 2009. 23 The pilot schemes have been introduced in five cities (Beijing, Tianjin, Shanghai, Chongqing and Shenzhen) and in two provinces (Hubei and Guangdong).
16

obtain a competitive advantage in the global markets. On the other hand, Chinese firms have
established joint ventures or have been involved in investment or acquisition of foreign firms in
the wind and solar industries to gain access to new technologies and new markets; the United
States and Germany are the primary countries of destination of China’s investment overseas in
these industries (Knight 2012; Gallagher 2014; Tan et al. 2013).24
Since 2012, China has become the world’s leader for total installed capacity of renewable
energy power, both inclusive and not inclusive of hydropower (REN21 2014). Figure 4 shows
the level of China’s renewable energy capacity from 1990 to 2011.25 Renewable energy capacity,
driven by hydropower, has kept growing since the beginning of the reform period. In the recent
years, however, non-hydro renewable energy capacity has begun to increase very rapidly. 26
Figure 5 shows the installed capacity level of solar PV and wind turbines (the two largest non-
hydro energy sources) from 2003 to 2013. Solar PV has more than doubled on an annual basis
after the global crisis. Starting in 2008, the installation of wind power in China has also shown a
dramatic increase; as of 2013, China’s wind power capacity is 30 percent of the world’s total
wind energy capacity.
4. China’s Prospects of ‘Green’ Development: Limitations and Challenges
In the recent years, China has introduced a large number of measures to improve the quality
of its environment and shift away from the dependency on fossil fuels. Following the
introduction of these initiatives, China has been praised for having become the global leader in
clean energy and for potentially being on the road to embrace a ‘green’ model of development
24 China’s investment in the wind and solar industry in developing countries complements China’s strategy of investing in extractive industries in developing countries to secure energy and other primary resources (Tan et al. 2013). 25 2011 is the latest year for which this EIA data is available. 26 According to the classification used by the EIA, non-hydro energy sources include biomass, geothermal, solar, wind, ocean thermal, wave action, and tidal action.
17

(Hu 2011; Liu, Henry, and Huang 2013). In reality, however, China’s recent development
strategy is characterized by significant contradictions and imbalances, which threaten the
sustainability of China’s commitment to environmental concerns and put in question the long-
term effectiveness of China’s environmental policies. The key relevant issues comprise domestic
and international factors, both of which encompass economic and political dimensions.
Domestically, there are powerful major economic forces that challenge China’s potential to
move to a ‘green’ development path. Since 2012, China’s economic growth has begun to
slowdown, and the expectations are for China’s GDP growth to continue to decelerate in the
coming years (Davis 2014). In 2014, for the first time in fifteen years, China’s economic growth
fell short of the 7.5 percent target set by the Chinese government. A reduction in China’s income
growth implies that the Chinese government is going to face more binding constraints in the use
of resources and in the setting of policy priorities. As a result, the government may come to act
on the presumption that it has to pursue growth at all costs, even if at the cost of environmental
degradation.
Poverty reduction, for example, which has already proceeded at a slower pace after China’s
transition to full-scale market liberalization and privatization in the early 1990s (Ravallion and
Chen 2007), is likely to become even more challenging in a slowing economy. Granted that
economic growth per se is not sufficient for poverty reduction, specific policy interventions are
even more compelling in the context of lower GDP growth. In China, according to the official
statistics, over 80 million of rural citizen still live in poverty; addressing the problem may come
to crowd out China’s competing commitment to environment protection, especially if the
slowdown persists. Under these circumstances other pressing policy areas – such as education,
technological innovation, health care, and social security – could end up being in conflict with
environmental targets as well.
18

Already in 2013, despite the discourse on pollution reduction and low-carbon promotion, the
central and local governments’ expenditure for energy saving and environmental protection
dropped by 9.7 percent from 2012 (Ministry of Finance of the People’s Republic of China 2014).
China’s spending for environmental purposes – US$30 billion in 2013 – remains inadequate in
the face of the magnitude of China’s environmental challenges. It is estimated that China should
spend at least 2 – 4 percent if its annual GDP (between about US$185 and US$277 billion in
2013) to effectively achieve a discernible improvement in environmental conditions (Lin 2014).
The government has also recently announced the intention to phase out state support for the
production of solar and wind equipment by 2020. Based on the current technological capabilities
of these industries, their economic viability without government support is precarious; in turn,
this means that the comparative advantage that China was starting to attain may not be
maintained (Young 2014).
A critical variable to address environmental and climate challenges is energy efficiency. As
shown in Figure 6, China’s energy intensity – as measured by energy consumption per unit of
GDP – has dramatically decreased between 1980 and the early 2000s.27 Since the early 2000s,
however, the reduction in China’s energy intensity has proceeded at a much slower pace (with an
actual increase recorded in 2003 and 2004). As of 2011, China’s energy intensity is 40 percent
higher than the world’s average. Based on purchasing power parities, China’s energy intensity is
higher than energy intensity in Europe and in the United States – arguably at a different income
level, and therefore potentially being able to utilize more advanced technological capabilities.
China’s energy intensity, however, is also significantly higher than in other key emerging
27 The reduction in China’s energy intensity over the reform period has been largely the result of a conscious effort on the part of the Chinese leadership; energy conservation agencies were established by the government to support enterprises in setting up and implementing energy efficiency plans (Crossley 2013).
19

countries, like India and Brazil.28 Over the last decade, the Chinese leadership has made energy
efficiency and energy conservation a high priority in multiple rounds of legislation (as indicated
in Section 3). The shift to more efficient infrastructures, equipment, and engineering designs,
however, requires time and resources, and – at the current rate of transformation – the transition
may not be completed within the window of time that remains to prevent the occurrence of a
major climate crisis.
In addition to the challenges associated with low energy efficiency, China’s commitment to
shift to a low-carbon economy is constrained by the current state of China’s electric grids and by
the typical enforcement problems of China’s legislation. In the recent years, China has set
national targets for the development of renewable energy, and enterprises are provided with
financial subsidies, preferential loans, and tax incentives to comply with the national policies.
China’s infrastructure system for electricity distribution, however, represents a major obstacle
for the development of renewable energy in China (REN21 2009).29 China’s largest wind power
plants are located in the North and the large-scale photovoltaic power plants have been built in
Western China, Tibet, and Mongolia; the largest share of demand, however, comes from the
industrialized areas in the East and the South (IEA and Energy Research Institute 2011; RENI
2013; Wang et al. 2010). Grid connectivity between renewable power plants and the main power
grids remains inadequate. Each regional grid unit is accountable for their own financial records,
and therefore – based on the current institutional arrangement – there is insufficient incentive for
cooperation across regions and for long-term planning; in addition, traditional energy dispatch
rules provide each coal power plant an equal number of operating hours, independent of the level
of efficiency and the environmental impact of each power plant. Although portfolio mandate
28 China’s energy intensity is 76 percent higher than Brazil’s, and 66 percent higher than India’s (EIA 2014). 29 Since 2002, power grids in China have been controlled by two state-owned enterprises, the China Southern Power Grid Company and the State Grid Corporation of China, both divided in regional grid enterprises.
20
schemes assign priority to renewables and “clean” coal power plants and the government has
committed to the construction of new smart grids to specifically allow the transmission of wind
and solar energy coming power plants located in remote areas, thus far these efforts are not
expected to contribute to a reduction in carbon emissions and may only lead to a significant
increase in electricity prices for consumers (Madrigal and Porter 2013; Chandler et. al. 2012;
Wang et al. 2010).
A major challenge for China’s environmental legislation is enforcement. The growing
decentralization of the central government observed during the reform period has brought greater
relative autonomy to local governments. Such political restructuring, however, has generated
enforcement problems at the local level, primarily due to widespread corruption and inadequate
supervision, guidance, and incentives from the central government. Several proposals have been
advanced to repair this deficiency, but enforcement remains a critical institutional barrier for
environmental protection (Lo et al. 2012; He et al. 2012).
Enforcement issues also magnify the challenges associated with the urbanization targets set
by the Chinese government for the coming years. As part of poverty reduction plans, the Chinese
government has stated the intention to increase the urbanization rate to 60 percent by 2020.30
This implies that by 2020, more than 100 additional million people are expected to relocate away
from the countryside to urban areas. To fulfill this target, the Chinese government has committed
to spending US$6.8 trillion for the construction of new cities and new urban infrastructures
(Roberts 2014). As of 2009, 75 percent of China’s total energy consumption is absorbed by the
industrial sector, while the remaining 25 percent is distributed, in order of importance, among
30 In China, 2011 represents the first year in which the number of people living in cities has exceeded the number of people living in the countryside.
21
residential, transportation, and commercial needs (Department of Energy Statistics – National
Bureau of Energy Statistics 2010).31
As China’s urbanization rate rises, inevitably China’s energy composition is going to be
altered. Looking at energy composition in the United States in the same year as a reference – the
urbanization rate in the United States is around 82 percent – the industrial sector absorbs around
30 percent of the total US energy consumption, whereas the shares of residential, commercial
and transportation are about 22, 19, and 29 percent, respectively (EIA, 2014). These last three
sectors are thus clearly going to acquire a great weight in China in the coming years. Whether
China will be able to satisfy these growing demands with a high proportion of renewable cannot
be anticipated. Certainly, however, this is a major challenge that has never been attempted by
any other country.
As of 2012, the ratio of non-hydro renewables to China’s total primary energy consumption
is approximately 1.2 percent (BP 2014). 32 Despite a growing share of non-hydro renewable
electricity capacity in total electricity capacity – which increased from 0.5 percent in 2004 to 6.1
percent in 2012 – the contribution of renewables (excluding hydropower) to China’s energy
needs remains very small and behind both the United States and the European Union (BP
2014).33
On these foundations, China is indeed showing difficulties in meeting the pledge that it made
at the Copenhagen conference in 2009. Figure 7 compares the historical rate of change of
China’s emission intensity – as measured by the ratio of carbon dioxide emissions to real GDP –
with the average annual reduction rates of emission intensity required by China’s commitment in
31 The latest available China Energy Statistical Yearbook is for year 2010. 32 In 2012, the share of hydropower in China’s total primary energy consumption was 7.2 percent (BP 2014). 33 As a term of comparison, in 2012 the share of renewables in total primary energy consumption was 2.3 percent for the United States and 5.8 percent for the European Union (BP 2014).
22
2009. To ensure a reduction in emission intensity by 40-45 percent from 2005 by 2020, China’s
emission intensity should decline by an average rate of around 3.3 and 4 percent per year,
respectively. After a reduction in emission intensity by over 5 percent in 2008, between 2009 and
2013 China did keep reducing its emission intensity; the observed reduction rate, however, only
narrowly met the minimum average annual reduction rate required by China’s pledge in
Copenhagen in 2013. This indicates that very significant efforts will need to be made to fulfill
China’s urbanization and other development plans while meeting climate stabilization goals.
In addition to the factors discussed above creating impediments to an effective shift to
ecological sustainability in China, there is also a set of international factors that need to be
considered. On the one hand, renewable energy technology and equipment have become for
China not only instruments for ‘greener’ development, but also a source of profit. Figure 8 and 9
provide an international perspective on the relative magnitude of annual manufacturing capacity
of PV modules and wind turbines with respect to annual installations of the same items in 2011
for China, Germany, Japan, India, and the United States. It clearly emerges that, in comparison
to all these other countries, China produces per year a far higher amount of solar PV and wind
turbines than the amount that gets installed domestically. The difference constitutes commodities
that are available for exports. It has been argued that China is pursuing “green mercantilism,”
hinting that a prominent component of China’s interest in green technology lies in the desire to
exploit the market of renewable energy for wealth rather than for building a genuinely
sustainable economy. In particular, China has been singled out for using unfair trade and
technology practices to build a competitive advantage in the solar and wind industry, which is
23

seen as profitable for China in the short run but detrimental for incentives to invest in clean
energy innovation in the industry as a whole.34
On the other hand, China’s rising trade, financial, and investment relations with both Latin
America and Africa, while being instrumental for the provision of critical primary commodities
to the Chinese economy, has also been an opportunity for China to externalize pollution and
carbon emissions. 35 China’s growing presence in Latin America, primarily targeting natural
resources, is already perceived as a threat for the adoption of climate change policy in Latin
America and for a shift to a low-carbon development model in the region (Edwards and Roberts
2014).
China’s expansion in Africa is subject to similar concerns. There is evidence that China’s
trade and investment in extractive industries in African countries has been associated with
growing environmental degradation and ecological footprint; lack of systematic data, however, is
still a key constraint for reaching an accurate assessment of these environmental costs (Peh and
Eyal 2010). The focus on domestic environmental issues on the part of the Chinese government
has thus been accompanied with the shift of certain environmental costs to other countries rather
than with their absolute reductions. Given that the environment is a global commons, however, it
is only absolute decoupling that matters for ecological sustainability and climate stabilization
(Jackson 2009).36
34 Innovation is a critical variable for fostering competitiveness of renewable energy with respect to traditional fossil fuels (Stepp and Atkinson 2012). In the years following the global crisis, the United States, the EU, China, Japan, Canada, along with other countries, have been involved in an ongoing series of trade disputes related to renewable energy products (UNCTAD 2014). 35 This process of externalization is exactly what currently rich nations have done as well over the course of the globalization process by relocating manufacturing production to developing countries. 36 Absolute decoupling is defined as the absolute reduction in material and energy consumption.
24

5. Conclusion
China’s rapid economic growth over the last three decades has led China to become a global
economic powerhouse. This growth, however, has been associated with massive increase in the
consumption of both energy and primary commodities, and has generated a severe deterioration
in the country’s environmental conditions. Since the early 2000s, China’s leadership has taken
steps to address China’s environmental problems and use of natural resources. As a result, China
has become the world’s largest investor in renewable energy sources. Nonetheless, the
effectiveness and sustainability of China’s efforts remain questionable.
An analysis of both domestic and international forces suggests that China’s prospects of
moving toward a more ecologically sustainable model of development are challenged by sturdy
limitations and contradictions. Beginning in 2014, China has also become a major driver of
infrastructure investment in the region as evidenced in its role in the new Asian Infrastructure
Investment Bank and the Silk Road Initiative. Some civil society organizations have raised
questions about whether or not there are appropriate environmental safeguards in the
infrastructure projects to be financed through these mechanisms (Alexander 2014). If an Asian
infrastructure boom does emerge, as many analysts suggest it will, this may well aggravate the
global, regional, and environmental challenges that China’s growth has already induced. In the
context of the ongoing global environmental crisis, however, climate stabilization and ecological
responsibility cannot wait.
Following the restructuring of global capitalism that has occurred since the early 1980s
(Robinson 2004), China’s environmental crisis is not simply the product of a faulty
developmental strategy undertaken by the Chinese government. In contrast, it is also the result of
externalization of pollution on the part of high-income economies. This process has allowed
high-income countries to benefit from cheap manufacturing relocated to China – and other Asian
25

nations – without experiencing the direct environmental costs associated with the industrial
production of these commodities.37 Indeed, Ackerman (2011) demonstrates that a large share of
China’s carbon emissions are embedded in its net exports due to China’s higher carbon intensity
with respect to high-income countries.
Given the lasting global implications of China’s environmental crisis and the failure of any
attempt to generate an international climate agreement since 2009, a different climate negotiation
strategy could prove to be both more equitable and more effective. If emission reduction
negotiations were to be made on the basis of carbon consumption (as embedded in a country’s
net exports), high-income countries could have a greater incentive to support emission reduction
in developing countries through technology and income transfers. This could favor greater
international cooperation in climate stabilization and promotion of a low-carbon development
path, and would represent one important step in responding to the enduring environmental
challenge of our time (Ackerman 2011; Grasso and Roberts 2014).
37 Such production of low cost goods has also sustained living standards and consumption patterns in wealthy countries during a time of wage compression and rising inequality.
26

Figure 1 – China’s Consumption of Minerals, 1995-2012 (Thousand Metric Tons)
Source: Author’s processing of USGS data, 2014
27
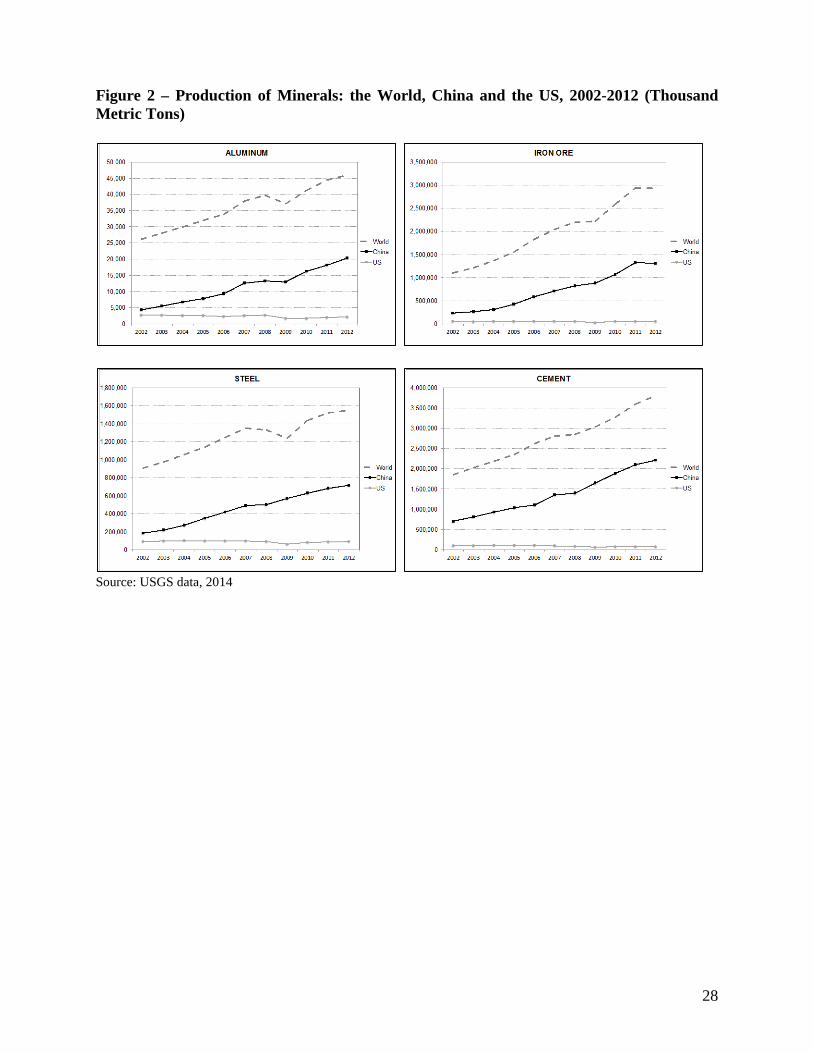
Figure 2 – Production of Minerals: the World, China and the US, 2002-2012 (Thousand Metric Tons)
Source: USGS data, 2014
28

Figure 3 – China’s CO2 Emissions and GDP, 1980-2012
Source: EIA, 2014
29

Figure 4 – China’s Renewable Energy Installed Capacity, 1980-2011 (Megawatts)
Source: EIA, 2014
30
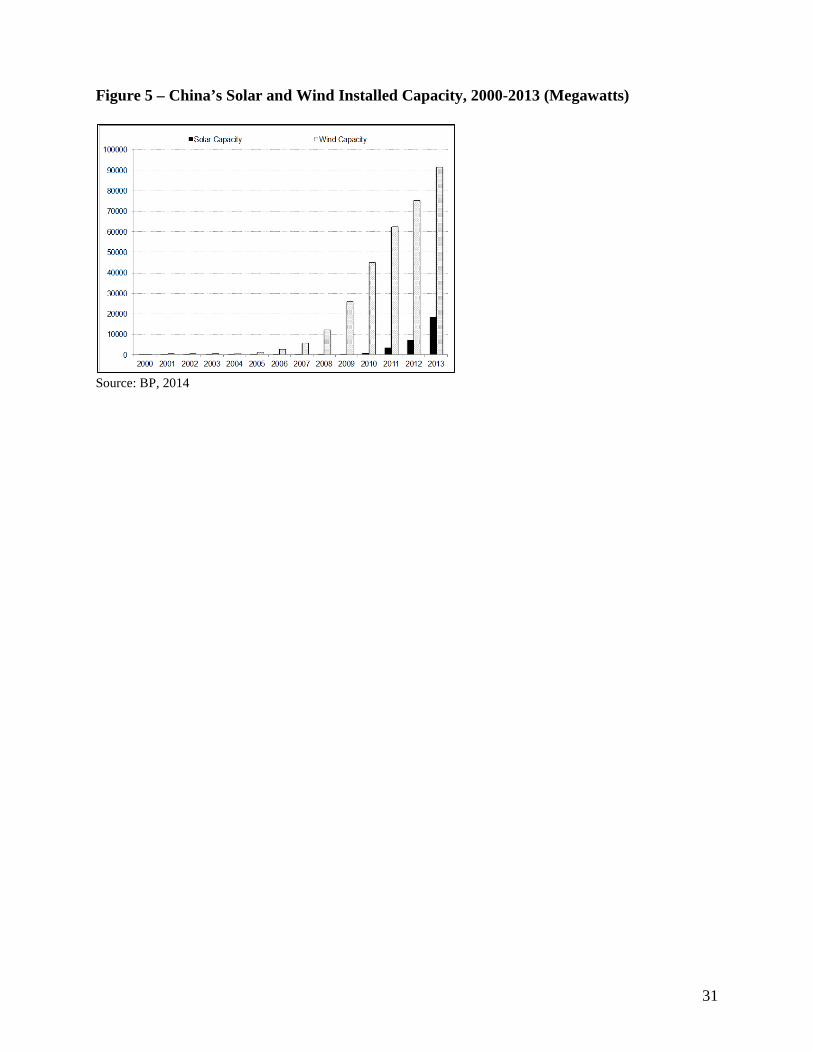
Figure 5 – China’s Solar and Wind Installed Capacity, 2000-2013 (Megawatts)
Source: BP, 2014
31

Figure 6 - Energy intensity: Ratio of Total Primary Energy Consumption to GDP (Btu per 2005 U.S. Dollars - Purchasing Power Parities): 1980-2011
Source: EIA, 2014
32
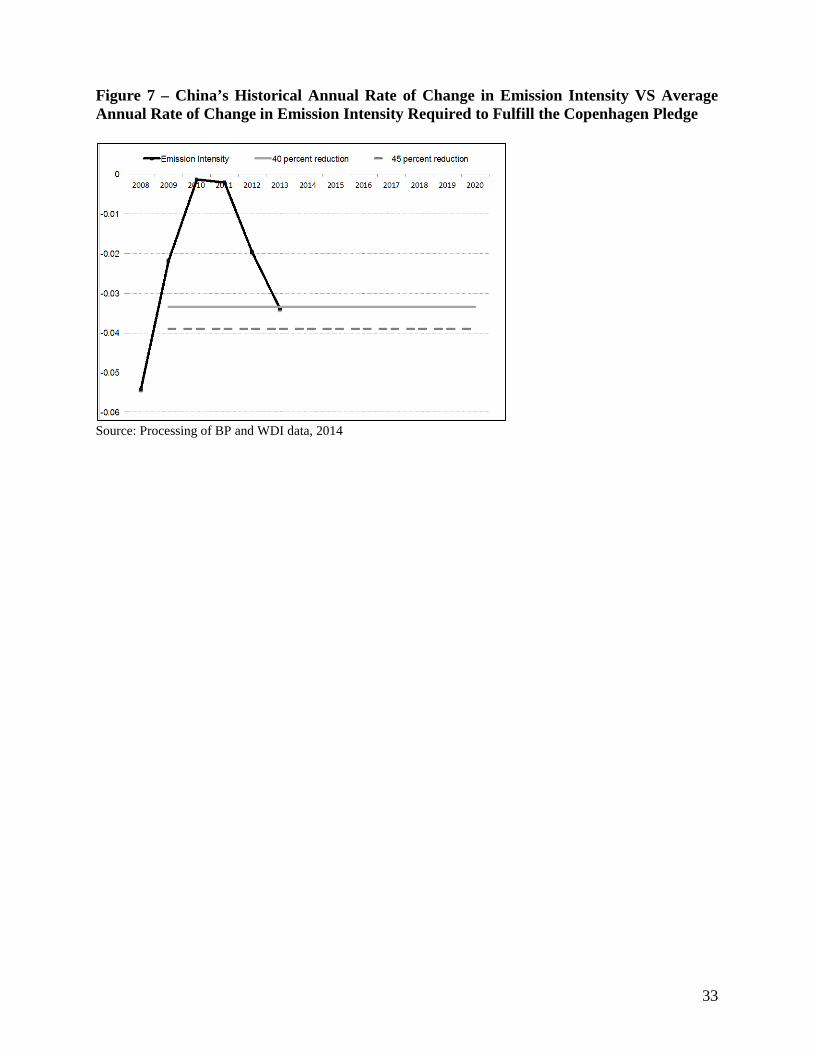
Figure 7 – China’s Historical Annual Rate of Change in Emission Intensity VS Average Annual Rate of Change in Emission Intensity Required to Fulfill the Copenhagen Pledge
Source: Processing of BP and WDI data, 2014
33

Figure 8 – Annual Manufacturing Capacity of PV Modules and Annual Additions of Installed Solar PV: An International Comparison, 2011 (Megawatts)
Source: World Resource Institute, 2014
34

Figure 9 – Annual Manufacturing Capacity of Wind Turbines and Annual Additions of Installed Wind Capacity: An International Comparison, 2011 (Megawatts)
Source: World Resource Institute, 2014
35
References Ackerman, F. 2011. “Carbon Embedded in China’s Trade.” In The Economics of Climate Change in China: Towards a Low-Carbon Economy, edited by F. Gang and N. Stern, New York: Earthscan. Alexander, N. 2014. “The Emerging Multi-Polar World Order: Its Unprecedented Consensus on a New Model for Financing Infrastructure Investment and Development.” Heinrich Böll Foundation – North America. Washington, DC: Heinrich Böll Stiftung. Balabanič D., M. Rupnik M, and A.K. Klemenčič. 2011. “Negative impact of endocrine-disrupting compounds on human reproductive health.” Reproductive Fertility Development. 23(3): 403-16. Boruckea, M., D. Mooreb, G. Cranstonb, K. Graceya, K. Ihaa, J. Larsona, E. Lazarusa, J.C. Moralesa, M. Wackernagela, and A. Gallib. 2013. “Accounting for demand and supply of the biosphere's regenerative capacity: The National Footprint Accounts’ underlying methodology and framework.” Ecological Indicators 24: 518-533. BP. British Petroleum. 2014. “Statistical Review of World Energy.” Accessed June 2014. Available at http://www.bp.com/statisticalreview Chandler, W., C. Shiping, H. Gwin, and W. Yanjia. 2012. China Power - Benefits and Costs of the “Strong, Smart Grid.” Annapolis, MD: Energy Transition Research Institute. Crossley, D. 2014. “China's History of Battling Energy Waste.” Climate Spectator. 13 Feb. Davis, B. 2014. “China Growth Seen Slowing Sharply Over Decade.” The Wall Street Journal 20 October. Deng, Y. and K.J. O’Brian (2013). “Relational Repression in China: Using Social Ties to Demobilize Protesters.” The China Quarterly 215: 533-552. Department of Energy Statistics – National Bureau of Energy Statistics. 2010. China Energy Statistical Yearbook 2010. ECLAC. 2013. “Chinese foreign direct investment in Latin America and the Caribbean China-Latin America cross-council taskforce.” Paper presented at the Summit on the Global Agenda World Economic Forum, Abu Dhabi, 18-20 November. Edwards, G. and J.T. Roberts. 2014. “A High Carbon Partnership? Chinese-Latin American Relations in a Carbon-Constrained World. Global Economy and Development.” Washington, DC: Brookings. Working Paper No. 72. EIA (US Energy Information Administration). 2014. International Energy Statistics. Available at http://www.eia.gov/cfapps/ipdbproject/IEDIndex3.cfm
36

Fan, C.C. 2006. “China’s Eleventh Five-Year Plan (2006–2010): From “Getting Rich First” to “Common Prosperity.” Eurasian Geography and Economics 47(6): 708–723. Gallagher, K.S. 2014. The Globalization of Clean Energy Technology – Lessons from China. Cambridge, MA: The MIT Press. Gaodi, X., C. Shuyan, Y. Oisen, X. Lin, F. Zhiyong, C. Boping, Z. Shuang et al. China Ecological Footprint Report 2012 - Consumption, Production and Sustainable Development. Beijing: World Wildlife Fund (in partnership with the Institute of Geographic Sciences and Natural Resources Research, Global Footprint Network, Institute of Zoology, and Zoological Society of London).
Global Footprint Network. 2014. National Footprint Accounts, 2012 Edition. Available at http://www.footprintnetwork.org. Goron, C. 2012. “From Environmental Crisis to Social Unrest in China.” European Institute for Asian Studies. 30 October. Available at http://www.eias.org/sites/default/files/EU_Asia_at_glance_CG_From_Environmental_Crisis_to_Social_Unrest_in_China_0.pdf Grasso, M. and T. Roberts. 2014. “A Compromise to Break the Climate Impasse.” Nature Climate Change 4: 543–549. Greenpeace. 2012. Dangerous Breathing. Available at http://www.greenpeace.org/eastasia/Global/eastasia/publications/reports/climate-energy/2012/Briefing%20Dangerous%20Breathing%20-%20Greenpeace.pdf Guha-Sapir, D., P. Hoyois, and R. Below. 2013. Annual Disaster Statistical Review 2012 - The Numbers and Trends. Louvain-la-Neuve, Belgium: Ciaco Imprimerie. Available at http://reliefweb.int/sites/reliefweb.int/files/resources/ADSR_2012.pdf HSBC. 2011. Scoring Climate Change Risk - Which countries are most vulnerable? He, G., Y. Lu, A. P. J. Mol, and T. Beckers. 2012. “Changes and Challenges: China’s Environmental Management in Transition.” Environmental Development 3: 25-38. Hu, A. 2011. “Global Climate Change and China’s Green Development.” Chinese Journal of Population Resources and Environment 9(4): 9-15. Industrial and Commercial Bank of China. 2011. 2010 Corporate Social Responsibility Report. Available at http://www.icbc-ltd.com/ICBCLtd/SocialResponsibility/Corporate%20Social%20Responsibility/2010/ Industrial and Commercial Bank of China. 2014. 2013 Corporate Social Responsibility Report. Available at http://www.icbc-ltd.com/ICBCLtd/SocialResponsibility/Corporate%20Social%20Responsibility/2013/ International Energy Agency and Energy Research Institute. 2011. Technology Roadmap
37

- China Wind Energy Development Roadmap 2050. OECD/International Energy Agency. International Monetary Fund. World Economic Outlook – Legacies, Clouds, Uncertainties. Washington DC: International Monetary Fund. Intergovernmental Panel on Climate Change. 2007. “Climate change 2007: Synthesis report.” Contribution of Working Groups I, II, and III to the Fourth Assessment Report of the Intergovernmental Panel on Climate Change. Jackson, T. 2011. “The Myth of Decoupling,” in Prosperity Without Growth. New York: Earthscan. Jianlong, Y., Z. Ke, C. Yu, H. Weijie, X. Chang, and W. Qiong. 2010. Climate and Energy Impacts of China’s Stimulus Package. Development Research Center of the State Council. WWF. Kaiman, J. 2013. “China's one-child policy to be relaxed as part of reforms package.” The Guardian. 15 November. Available at http://www.theguardian.com/world/2013/nov/15/china-one-child-policy-relaxed-reforms Kana, H., W. Huangb, B. Chena, and N. Zhaoc. 2009. “Impact of outdoor air pollution on cardiovascular health in Mainland China.” CVD Prevention and Control 4(1): 71-78. Kaya, Y., and K. Yokobori. 1990. Environment, Energy, and Economy: Strategies for Sustainability. Tokyo: United Nations University Press. Kennan, H. 2014. “State Green Banks for Clean Energy.” Energy Innovation: Policy and Technology LLC. January. Knight, E. 2012. “China’s New Approach to Renewable Energy.” Asian Scientist. 31 December. Available at http://www.asianscientist.com/2012/12/tech/chinas-approach-to-renewable-energy-2012/ Landler, M. 2014. “U.S. and China Reach Climate Accord After Months of Talks.” The New York Times. 11 November. Lewis, J. 2011. “Energy and Climate Goals of China’s 12th Five-Year Plan.” Center for Climate and Energy Solutions. Available at http://www.c2es.org/international/key-country-policies/china/energy-climate-goals-twelfth-five-year-plan Li, W., B. Chen, and X. Ding. 2012. “Environment and Reproductive Health in China: Challenges and Opportunities.” Environmental Health Perspectives 120(5): 184-185. Lim, S.S., et al. 2012. “A comparative risk assessment of burden of disease and injury attributable to 67 risk factors and risk factor clusters in 21 regions, 1990–2010: a systematic analysis for the Global Burden of Disease Study 2010.” Lancet 380(9859): 2224-2260.
38

Lin, J., S. D. Pan, S. J. Davis, Q. Zhang, K. He, C. Wang, D. G. Streets, D. J. Wuebbles, and D. G. Wuebbles, and D. Guan. “China’s international trade and air pollution in the United States.” Proceedings of the National Academy of Sciences of the United States of America 111(5), 1736-1741. Lin, L. 2014. “Is China Underfunding Its ‘War On Pollution’?” Chinadialogue. 17 March. Liu, J. and W. Yang. 2012. “Water Sustainability for China and Beyond.” Science 337. 10 August. Liu, M.M., M. Henry, and H. Huang. 2013. Renewable Energy in China, Volume 1: Towards a Green Economy. Hong Kong: Enrich Professional Publishing. Lo, C. W-H, G. E. Fryxell, B. van Rooij, W. Wang, and P. H. Li. 2012. “Explaining the Enforcement Gap in China: Local Government Support and Internal Agency Obstacles and Predictor of Enforcement Actions in Guangzhou.” Journal of Environmental Management, 111: 227-235. Luo, Y., Q. Xue, and B. Han. 2010. “How emerging market governments promote outward FDI: Experience from China.” Journal of World Business 45: 68-79. Madrigal, M., and K. Porter. 2013. Operating and Planning Electricity Grids with Variable Renewable Generation. Washington DC: The World Bank. Ministry of Environmental Protection – The People’s Republic of China. 2013. “Report on the State of the Environment in China.” Available at http://www.mep.gov.cn/zhxx/hjyw/201406/W020140605385940287254.pdf MOFCOM. 2012. 2012 Statistical Bulletin of China's Outward Foreign Direct Investment. Ministry of Finance of the People’s Republic of China. 2014. “关于 2013 年中央和地方预算执
行情况与 2014 年中央和地方预算草案的报告(摘要).” Available at http://www.mof.gov.cn/zhengwuxinxi/caizhengxinwen/201403/t20140306_1052323.html Mosbergen, D. 2013. “China Admits Existence Of 'Cancer Villages' In Report, As Pollution Concerns Mount.” The World Post. 23 February. Available at http://www.huffingtonpost.com/2013/02/23/china-cancer-villages-pollution_n_2744879.html National Bureau of Statistics of China. 2014. “Statistical Communiqué of the People's Republic of China on the 2013 National Economic and Social Development.” Available at http://www.stats.gov.cn/english/PressRelease/201402/t20140224_515103.html National Bureau of Statistics of China. 2013. “Statistical Communiqué of the People's Republic of China on the 2012 National Economic and Social Development.” Available at http://www.stats.gov.cn/english../NewsEvents/201302/t20130222_26962.html
39

National Development and Reform Commission. 2012. “China's Policies and Actions for Addressing Climate Change.” Available at http://www.ccchina.gov.cn/WebSite/CCChina/UpFile/File1324.pdf National Development and Reform Commission. 2013. “China's Policies and Actions for Addressing Climate Change.” Available at http://en.ndrc.gov.cn/newsrelease/201311/P020131108611533042884.pdf Naughton, B. 2005. “The New Common Economic Program: China's Eleventh Five Year Plan and What It Means.” China Leadership Monitor 16. Peh, K.S – H., and J. Eyal. 2005. “Unveiling China’s Impact on African Environment.” Energy Policy 38(8): 4729–4730. Perera F, Li TY, Zhou ZJ, Yuan T, Chen YH, Qu L, et al. 2008. Benefits of reducing prenatal exposure to coal-burning pollutants to children’s neurodevelopment in China. Environmental Health Perspectives 116:1396–1400. Piovani, C., and M. Li. 2011. “One Hundred Million Jobs for the Chinese Workers: Why China’s Current Model of Development Is Unsustainable and How A Progressive Economic Program Can Help the Chinese Workers, the Chinese Economy, and China’s Environment." Review of Radical Political Economics 43(3): 77-94. Qi, L. 2014. “China to Increase Loans to Africa by $10 Billion.” The Wall Street Journal. 5 May. Qiu, J. 2013. “China Gets Tough on Carbon - Cap-and-trade pilot schemes set stage for nationwide roll-out.” Nature 498: 145–146. 13 June. Rauch, J.N., and Y.F. Chi. 2010. “The Plight of Green GDP in China." Consilience: The Journal of Sustainable Development 3(1): 102-116. Ravallion, M., and S. Chen. 2007. “China’s (Uneven) Progress Against Poverty.” Journal of Development Economics 82: 1-42. REN 21. 2009. “Background Paper: Chinese Renewables Status Report.” Available at http://www.ren21.net/Portals/0/documents/Resources/Background_Paper_Chinese_Renewables_Status_Report_2009.pdf REN21. 2014. “Renewables 2014 – Global Status Report.” Available at http://www.ren21.net/Portals/0/documents/Resources/GSR/2014/GSR2014_full%20report_low%20res.pdf Renewables Insight – Energy Industry Guides. 2013. PV Power Plants 2013 – Industry Guide. Roberts, D. 2014. “A $6.8 Trillion Price Tag for China's Urbanization.” Bloomberg Businessweek. 25 March. Available at http://www.businessweek.com/articles/2014-03-25/6-dot-8-trillion-price-tag-for-chinas-urbanization
40
Robinson, 2004. A Theory of Global Capitalism: Production, Class, and State in a Transnational World. Baltimore: The Johns Hopkins University Press. Schuman, S. 2010. “Improving China’s Existing Renewable Energy Legal Framework: Lessons from the International and Domestic Experience.” NRDC White Paper. October. Schuman, S., and A. Lin. 2010. “China's Renewable Energy Law and its impact on renewable power in China: Progress, challenges and recommendations for improving implementation.” Energy Policy 51: 89-109. Stepp, M., and R.D. Atkinson. 2012. “Green Mercantilism: Threat to the Clean Energy Economy.” The Innovation Technology and Innovation Foundation. June. Available at http://www.itif.org/publications/enough-enough-confronting-chinese-innovation-mercantilism Stewart, B.W., S. Wild, and C. P. Wild, ed. 2014. World Cancer Report 2014. Lyon, France: International Agency for Research on Cancer (World Health Organization).
Strand, J., and M. Toman. 2010. ““Green Stimulus,” Economic Recovery, and Long-Term Sustainable Development.” Washington, D.C.: The World Bank. Working Paper 5163. Taidong, Z. 2014. “China’s Second White Paper on Foreign Aid Signals Key Shift in Aid Delivery Strategy.” Weekly Insight and Analysis - In Asia. 23 July. Available at http://asiafoundation.org/in-asia/2014/07/23/chinas-second-white-paper-on-foreign-aid-signals-key-shift-in-aid-delivery-strategy/ Tan, X., Y. Zhao, C. Polycarp, and J. Bai. 2013. “China’s Overseas Investments in the Wind and Solar Industries: Trends and Drivers.” World Resources Institute. Available at http://www.wri.org/sites/default/files/pdf/chinas_overseas_investments_in_wind_and_solar_trends_and_drivers.pdf Tiezzi, S. 2013. “China’s New Urbanization Plan.” The Diplomat. 13 December. Available at http://thediplomat.com/2013/12/chinas-new-urbanization-plan/ Tiezzi, S. 2014. “In China, Climate Change Is Already Here.” The Diplomat. 14 August. Available at http://thediplomat.com/2014/08/in-china-climate-change-is-already-here/ Tisdall, C. 2001. “Economic Growth in China: Can China Cope with Its Environmental Constraints and Problems?” Asia Pacific Journal on Environment and Development 8(1): 15-35. Tong, and Lei. 2010. “Large-Scale Mass Incidents and Government Responses in China.” International Journal of China Studies. 1(2): 487-508. October. UNCTAD. 2014. Trade Remedies: Targeting the Renewable Energy Sector. New York: United Nations.
USGS. 2014. Minerals Yearbook, Vol. III. International. Washington, DC: Interior Dept., Geological Survey.
41

Vennemo, H., K. Aunan, H. Lindhjem, and H.M. Seip. 2009.” Environmental Pollution in China: Status and Trends.” Review of Environmental Economy and Policy 3(2): 209-230. Wang, J., H. Jiang, and F. Yu. 2004. “Green GDP Accounting in China: Review and Outlook.” Working Paper. Available at http://unstats.un.org/unsd/envaccounting/londongroup/meeting9/china_country_report_2004.pdf
Wang, F., H. Yin, and S. Li. 2010. “China’s Renewable Energy Policy: Commitments and Challenges.” Energy Policy 38: 1872-1878. Wong, C. 2011. “The Fiscal Stimulus Programme and Public Governance Issues in China.” OECD Journal on Budgeting 2011(3).
World Bank. 2007. Costs of Pollution in China - Economic Estimates of Physical Damages. Washington, D.C.: The World Bank.
Worldwatch. 2010. “Renewable Energy and Energy Efficiency in China: Current Status and Prospects for 2020.” Worldwatch Report 182.
World Resource Institute. 2014. “CAIT – Country Clean Technology Data.” Available at http://cait2.wri.org/wri/Country%20Clean%20Technology%20Data.
WWF. 2014. Living Planet Report 2014 - Species and Spaces, People and Places. Gland, Switzerland: WWF International (in partnership with the Global Footprint Network, Institute of Zoology, and Water Footprint Network). Xiaoyuan, Z. 2014. “China’s new Ambitions in Latin America are not Without Their Challenges.” News China. 14 September. Yale Center for Environmental Law & Policy and Center for International Earth Science Information Network, 2014. 2014 Environmental Performance Index – Full Report and Analysis. Young, D. 2014. “China Finally Acknowledges Unfair Pricing, To Sharply Lower Renewable Tariffs by 2020.” Renewable Energy World. 13 October. Available at http://www.renewableenergyworld.com/rea/blog/post/2014/10/china-finally-acknowledges-unfair-pricing-to-sharply-lower-renewable-tariffs-by-2020 Yueh, L. 2010. “A Stronger China.” Finance & Development 47(2). June. Zhang, Y., G-Q. Zang, Z-H. Tang, X-H Chen, andY-S. Yu. 2014. “Burning Straw, Air Pollution, and Respiratory Infections in China.” American Journal of Infection Control 42(7): 815. Zhao, P., M. Dai, W. Chen and N. Li. 2009. “Cancer Trends in China.” Japanese Journal of Clinical Oncology 40(4): 281-285. Zhifeng, T. 2009. “Reflections on Environmental Mass Incidents in China” in The China Environment Yearbook, Volume 3, edited by Y. Dongping.
42
Zhou, N., M.D. Levine, and L. Price. 2010. “Overview of Current Energy-Efficient Policies in China.” Energy Policy 38: 6439-6452. Zhou Y., C. Pang, D. He, N. Ji, L. Hou, and Y. Cheng. 2011. “The Epidemiology of Infertility in China.” Chinese Journal of Family Planning 19(7): 445–446.
43


![[Doi 10.1159%2F000355906] Peters, S.; Stahel, R.a. -- [Progress in Tumor Research] Successes and Limitations of Targeted Cancer Therapy Volume 41 () Successes and Limitations of T](https://img.pdfslide.net/doc/110x75/55cf8def550346703b8cd179/doi-1011592f000355906-peters-s-stahel-ra-progress-in-tumor-research.jpg)