Embed Size (px)
Citation preview

Just et al. Microbiome (2018) 6:134 https://doi.org/10.1186/s40168-018-0510-8
RESEARCH Open Access
The gut microbiota drives the impact ofbile acids and fat source in diet on mousemetabolism
Sarah Just1, Stanislas Mondot2, Josef Ecker3, Katrin Wegner4, Eva Rath5, Laura Gau4, Theresa Streidl6,Genevieve Hery-Arnaud2, Sinah Schmidt7, Till Robin Lesker8, Valentin Bieth1, Andreas Dunkel7, Till Strowig8,Thomas Hofmann1,7, Dirk Haller1,5, Gerhard Liebisch9, Philippe Gérard2, Sascha Rohn4, Patricia Lepage2†and Thomas Clavel1,6*†
Abstract
Background: As the gut microbiota contributes to metabolic health, it is important to determine specific diet-microbiota interactions that influence host metabolism. Bile acids and dietary fat source can alter phenotypes ofdiet-induced obesity, but the interplay with intestinal microorganisms is unclear. Here, we investigated metabolicconsequences of diets enriched in primary bile acids with or without addition of lard or palm oil, and studied gutmicrobiota structure and functions in mice.
Results: In combination with bile acids, dietary lard fed to male C57BL/6N mice for a period of 8 weeks enhancedfat mass accumulation in colonized, but not in germ-free mice when compared to palm oil. This was associatedwith impaired glucose tolerance, lower fasting insulin levels, lower counts of enteroendocrine cells, fatty liver, andelevated amounts of hepatic triglycerides, cholesteryl esters, and monounsaturated fatty acids. Lard- and bile acid-fedmice were characterized by shifts in dominant gut bacterial communities, including decreased relativeabundances of Lachnospiraceae and increased occurrence of Desulfovibrionaceae and the species Clostridiumlactatifermentans and Flintibacter butyricus. Metatranscriptomic analysis revealed shifts in microbial functions,including lipid and amino acid metabolism.
Conclusions: Caution is required when interpreting data from diet-induced obesity models due to varyingeffects of dietary fat source. Detrimental metabolic consequences of a diet enriched with lard and primarybile acids were dependent on microbial colonization of the host and were linked to hepatic lipid rearrangements andto alterations of dominant bacterial communities in the cecum.
Keywords: Metabolic diseases, Diet-induced obesity, Gut microbiota, Germ-free mice, Bile acids, Dietary fat, Lard,Lipidomics, 16S rRNA gene amplicon sequencing, Metatranscriptomics
BackgroundThe human intestinal tract harbors trillions of microor-ganisms referred to as the gut microbiota, which playsan important role in digestion and host metabolism [1]
* Correspondence: [email protected]†Patricia Lepage and Thomas Clavel contributed equally to this work.1ZIEL–Institute for Food and Health, Technical University of Munich, Freising,Germany6Institute of Medical Microbiology, Functional Microbiome Research Group,University Hospital of RWTH Aachen, Pauwelsstrasse 30, 52074 Aachen,GermanyFull list of author information is available at the end of the article
© The Author(s). 2018 Open Access This articInternational License (http://creativecommonsreproduction in any medium, provided you gthe Creative Commons license, and indicate if(http://creativecommons.org/publicdomain/ze
and has been implicated in the development of meta-bolic diseases, including obesity and type-2 diabetes [2,3]. However, there is a gap between the increasing num-ber of studies describing changes in ecosystem structureas obtained by sequencing [4] and knowledge about mi-crobial functions and their interactions with diet andhost metabolism [5, 6].Mouse models of diet-induced obesity have been
widely used to study microbe-host crosstalk in metabolicdiseases. Recent findings pointed at issues related to therobustness of such models, i.e., results are dependent on
le is distributed under the terms of the Creative Commons Attribution 4.0.org/licenses/by/4.0/), which permits unrestricted use, distribution, andive appropriate credit to the original author(s) and the source, provide a link tochanges were made. The Creative Commons Public Domain Dedication waiverro/1.0/) applies to the data made available in this article, unless otherwise stated.
Just et al. Microbiome (2018) 6:134 Page 2 of 18
experimental settings, including animal facilities or dietcomposition and texture [5, 7–10]. Nonetheless, mousemodels are very helpful to test the impact of interven-tions otherwise not possible in human subjects in termsof, e.g., controlled conditions, invasive sampling, and theability to address the causal role of changes in the gutmicrobiome [11–13]. Mouse studies have also helpedhighlighting the role of single bacterial species in meta-bolic diseases, such as Akkermansia muciniphila, Chris-tensenella minuta, Clostridium ramosum (recentlyproposed to be reclassified as Erysipelatoclostridiumramosum [14]), Enterobacter cloacae, and Prevotellacopri, including the investigation of underlying molecu-lar mechanisms [15–19].Several mechanisms by which gut microorganisms can
modulate the development of metabolic diseases havebeen proposed. Interaction with the host via metaboliccapacities of the gut microbiota is a particular area ofinterest, as microbiota members produce myriads of me-tabolites having many different bioactive properties (e.g.,regulation of inflammatory and metabolic responses).Some of the studies aforementioned and several othershave demonstrated the importance of short-chain fattyacids (SCFA), branched-chain amino acids, or cholinemetabolism [18, 20–22]. Bile acid conversion is anotherimportant metabolic feature of the gut microbiota withmajor impact on host metabolism, and the therapeuticpotential of intervening with bile acid-dependent path-ways has already been exploited in metabolic and in-flammatory disorders [23, 24].Bile acids are cholesterol-derived compounds synthe-
sized in the liver, which facilitate the intestinal absorp-tion of lipids but also influence metabolic andinflammatory signaling pathways, mainly via the farne-soid X receptor (FXR) and G protein-coupled receptorTGR5 [24]. Metabolic disorders have been associatedwith changes in bile acid composition and concentra-tions [25, 26]. Moreover, feeding experiments in micedemonstrated that the addition of 0.5% (w/w) cholic acid(CA) to a high-fat diet (HFD) prevented weight gain andassociated comorbidities [27, 28], although underlyinginteractions with the gut microbiota are unclear. Otherstudies in rodents demonstrated positive effects of fattyand bile acid conjugates on diet-induced non-alcoholicfatty liver (NAFLD) and hypercholesterolemia [29, 30].In humans, oral bile acid treatment is common in pa-tients with primary bile acid synthesis deficiency [31],but effects on the gut microbiota are unknown.Germ-free (GF) and conventional mice markedly differ
with respect to bile acid profiles [32]. Intestinal bacteriacan transform primary bile acids via deconjugation, de-hydroxylation, or dehydrogenation to form the so-calledsecondary bile acids [33, 34]. Deconjugation reactionsare catalyzed by multiple bacterial lineages [35]. In
contrast, only a few members of the family Coriobacter-iaceae, Clostridiaceae, Lachnospiraceae, or Ruminococ-caceae are known to produce secondary bile acids, andmany of the active strains within these families are notavailable from public collections for performing down-stream experiments to test causal effects [36–38]. Des-pite this potential of gut microbiota to modulate bileacid bioavailability and the known anti-microbial proper-ties of bile acids [39], only few studies have investigatedthe impact of primary bile acid supplementation on thegut microbial ecosystem [40, 41].The source of dietary fat has also been shown to influ-
ence host metabolism and microbiota-dependent pheno-types of diet-induced obesity [9, 42, 43]. The response ofGF mice to HFD, i.e., their susceptibility to developdiet-induced obesity, depends on the type of high-caloriediet given to the animals, with a particular importanceof dietary fat source [8]. Kübeck et al. [9] demonstratedthat GF mice fed a HFD based on lard were resistant todiet-induced obesity, whereas those fed palm oil werenot due to lower metabolic rate and more efficient fatabsorption. The main difference between the two dietswas their cholesterol content, with lard-based HFD con-taining 10 times more. As cholesterol can modulate bileacid and lipid metabolism, these and other authors pro-posed that dietary cholesterol content drives the re-sponse of mice to high-fat diets [9, 44]. Furthermore,dietary fatty acid (FA) composition can modulate bodyweight gain as well as host metabolism [43, 45]. How-ever, functional implication for the gut microbiota hasnot yet been described.The data introduced above indicate that little is known
about microbiota-host interactions in response to bileacids and different dietary fat sources. Therefore, themajor goal of the present study was to determine theimportance of the gut microbiota in regulating the im-pact of dietary bile acid supplementation on the meta-bolic status of mice and to test the plasticity of theseinteractions under conditions of metabolic challenges byusing HFDs varying in fat sources (plant or animal). Weused both GF and specific pathogen-free (SPF) mice toinvestigate the impact of microbial colonization. A com-bination of molecular techniques allowed assessing ef-fects on the host (in particular lipid profiles) and on thecomposition and functions of intestinal microbialcommunities.
MethodsMouse experimentsAnimal use was approved by the local institution incharge (Regierung von Oberbayern, approval no.55.2.1.54-2532-156-13). All mice were maintained at theSchool of Life Sciences Weihenstephan of the TechnicalUniversity Munich. Male C57BL/6N GF and SPF mice

Just et al. Microbiome (2018) 6:134 Page 3 of 18
were housed at 22 ± 1 °C and 50–60% relative humiditywith a 12-h light/dark cycle and were fed a standardchow diet (V1124-300, Ssniff Spezialdiäten GmbH,Germany). SPF mice were housed in individually venti-lated cages whereas cages hosting GF mice were kept inflexible film isolators (North Kent Plastics, UK) venti-lated via HEPA-filtered air. To exclude litter and cage ef-fects, mice in each experimental feeding grouporiginated from different litters (three to six litters pergroup) and were housed in at least three separate cages(one to five mice per cage) (Additional file 1: FigureS1a). Sterility of GF mice was routinely confirmed byculturing and microscopic observation of feces afterGram staining. In addition, 16S rRNA gene-targetedPCR of GF cecal content was performed at the end ofthe study.A schematic view of the experimental feeding design is
shown in Additional file 1: Figure S1b. Briefly, mice werefed a purified control diet (CD) (Table 1) at 8 weeks ofage. After 2 weeks of adaptation to this diet, they wererandomly divided into four feeding groups (n = 9–12mice per colonization status per diet) (see all diet com-positions in Table 1): (I) CD; (II) CD supplemented with0.1% (w/w) cholic acid and 0.1% chenodeoxycholic acid(both ≥ 97% purity; Sigma-Aldrich, Germany) (BA), (III)palm oil-, or (IV) lard-based high-fat diet with 48 kJ%from fat, both supplemented with bile acids as above (P-and LHB, respectively). All diets were purchased fromSsniff Spezialdiäten GmbH, γ-irradiated with 50 kGy,stored at 4 °C after being freshly purchased prior to ex-periment start, and fed ad libitum to both GF and SPFmice for 8 weeks. At the end of this experimental feed-ing period, mice were fasted for 6 h. Half of the micewere sacrificed after measurement of fasting blood glu-cose levels from the tail vein; the other half were usedfor an oral glucose tolerance test (OGTT) and receivedtherefore 2 g glucose per kg body weight via gavage.Blood glucose levels were measured from the tail vein at0, 15, 30, 60, and 120 min after gavage and areas underthe curve (AUC) of blood glucose levels were calculatedfor each animal.
SamplingAll mice were sacrificed with carbon dioxide. SystemicEDTA blood was collected from the vena cava and cen-trifuged (3000×g, 4 °C, 10 min). Plasma was aliquotedand snap-frozen in liquid nitrogen. Organs were dis-sected, their weight was recorded, and they were eitherdirectly snap-frozen in liquid nitrogen or fixed in 4% for-malin for 48 h. Epididymal, mesenterial, and inguinalwhite adipose tissues (WAT) were collected andweighed, and total WAT mass, i.e., the sum of all threetissues referred to as “WAT mass” hereon, was calcu-lated. Intestinal content or tissue from different gut
regions was collected into sterile tubes and immediatelysnap-frozen in liquid nitrogen. Frozen samples werestored at − 80 °C until analysis.
Serum insulin and leptin measurementSystemic plasma insulin and leptin concentrationswere determined using a Luminex 100 IS system(Luminex Corporation) with a Milliplex MAP mouseserum adipokine panel kit (Merck Millipore), as de-scribed previously [46].
Liver histopathologyFormalin-fixed paraffin-embedded liver samples werecut into 5-μm-thick sections using a Leica rotary micro-tome RM2255, mounted on SuperFrost® microscopeslides (Thermo Fisher Scientific) and dried overnight.Sections were then heat-treated (15 min, 60 °C) to meltparaffin and trichromatically stained with hematoxylin,eosin, and saffron dyes with a multistainer station (Varis-tain™, Thermo Fisher Scientific Inc., Germany). Oncecovered with a glass cover slip, virtual slides were madeby using the Pannoramic Scan 150 (3DHISTECHLtd., Hungary) and examined in a blinded mannerusing a semi-quantitative scoring system. Briefly, stea-tosis (0–3 points), lobular inflammation (0–3), andballooning (0–2) of hepatocytes were evaluated. Pointswere summed up to obtain a total fatty liver activityscore, which ranged from 0 (no pathology) to 8 (se-vere disease) [47].
Immunohistochemical staining for glucagon-like peptide1 and chromogranin ASections (5 μm) of paraffin-embedded tissue from theproximal colon were used. At least three non-consecutivesections were stained from each mouse. After deparaffini-zation, antigen retrieval was performed by boiling incitrate buffer. Glucagon-like peptide (GLP) 1 and chromo-granin A (ChgA) antibodies (Santa Cruz Biotechnology)were diluted 1:75 and applied overnight at 4 °C. Thesecondary antibody (mouse anti-goat, dianova) wasdiluted 1:300 and slides were incubated for 1 h at roomtemperature. For development, 3,3′-diaminobenzidine(DAB) or enhanced DAB (Sigma Aldrich) wereapplied for ChgA and GLP-1 stainings, respectively.Slides were subsequently counterstained withhematoxylin and mounted with xylol-based mountingmedium (Roti®-Histokitt). GLP1-positive (GLP1+) andChgA-positive (ChgA+) cells were quantified using aPreciPoint M8 microscope.
qPCR analysis of liver mRNA expressionTotal RNA was extracted from liver samples using theRNeasy Mini kit (Qiagen). RIN (RNA integrity number)values were assessed with an Agilent 2100 Bioanalyzer
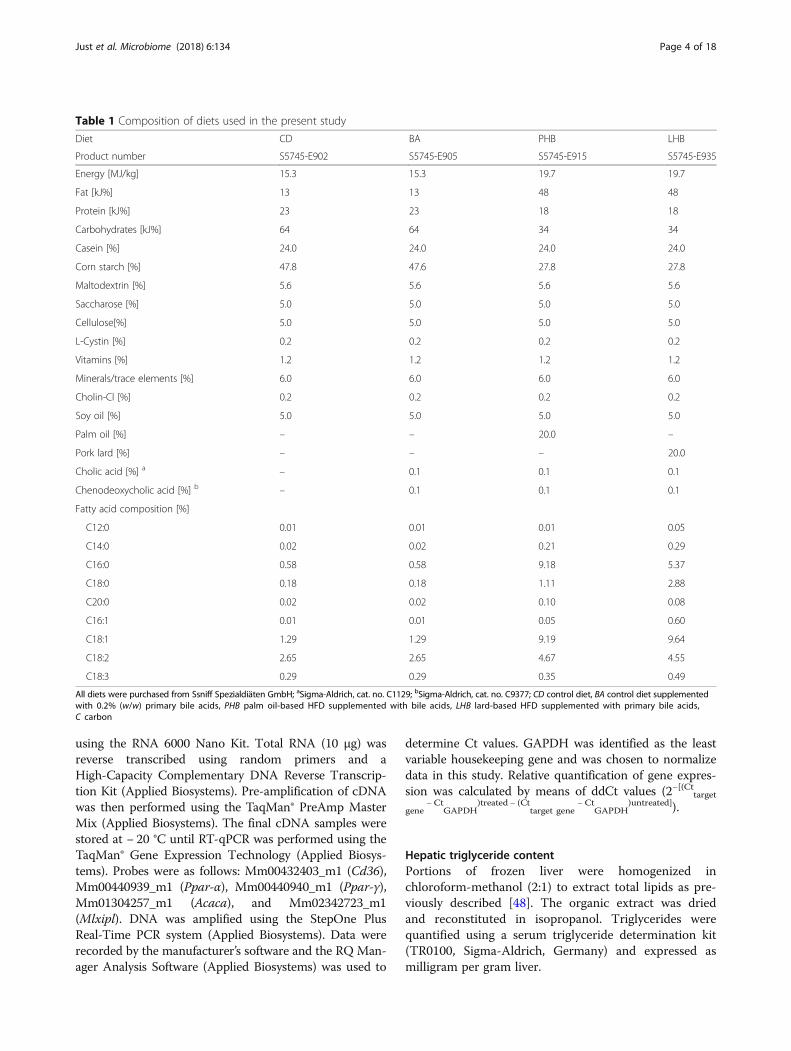
Table 1 Composition of diets used in the present study
Diet CD BA PHB LHB
Product number S5745-E902 S5745-E905 S5745-E915 S5745-E935
Energy [MJ/kg] 15.3 15.3 19.7 19.7
Fat [kJ%] 13 13 48 48
Protein [kJ%] 23 23 18 18
Carbohydrates [kJ%] 64 64 34 34
Casein [%] 24.0 24.0 24.0 24.0
Corn starch [%] 47.8 47.6 27.8 27.8
Maltodextrin [%] 5.6 5.6 5.6 5.6
Saccharose [%] 5.0 5.0 5.0 5.0
Cellulose[%] 5.0 5.0 5.0 5.0
L-Cystin [%] 0.2 0.2 0.2 0.2
Vitamins [%] 1.2 1.2 1.2 1.2
Minerals/trace elements [%] 6.0 6.0 6.0 6.0
Cholin-Cl [%] 0.2 0.2 0.2 0.2
Soy oil [%] 5.0 5.0 5.0 5.0
Palm oil [%] – – 20.0 –
Pork lard [%] – – – 20.0
Cholic acid [%] a – 0.1 0.1 0.1
Chenodeoxycholic acid [%] b – 0.1 0.1 0.1
Fatty acid composition [%]
C12:0 0.01 0.01 0.01 0.05
C14:0 0.02 0.02 0.21 0.29
C16:0 0.58 0.58 9.18 5.37
C18:0 0.18 0.18 1.11 2.88
C20:0 0.02 0.02 0.10 0.08
C16:1 0.01 0.01 0.05 0.60
C18:1 1.29 1.29 9.19 9.64
C18:2 2.65 2.65 4.67 4.55
C18:3 0.29 0.29 0.35 0.49
All diets were purchased from Ssniff Spezialdiäten GmbH; aSigma-Aldrich, cat. no. C1129; bSigma-Aldrich, cat. no. C9377; CD control diet, BA control diet supplementedwith 0.2% (w/w) primary bile acids, PHB palm oil-based HFD supplemented with bile acids, LHB lard-based HFD supplemented with primary bile acids,C carbon
Just et al. Microbiome (2018) 6:134 Page 4 of 18
using the RNA 6000 Nano Kit. Total RNA (10 μg) wasreverse transcribed using random primers and aHigh-Capacity Complementary DNA Reverse Transcrip-tion Kit (Applied Biosystems). Pre-amplification of cDNAwas then performed using the TaqMan® PreAmp MasterMix (Applied Biosystems). The final cDNA samples werestored at − 20 °C until RT-qPCR was performed using theTaqMan® Gene Expression Technology (Applied Biosys-tems). Probes were as follows: Mm00432403_m1 (Cd36),Mm00440939_m1 (Ppar-α), Mm00440940_m1 (Ppar-γ),Mm01304257_m1 (Acaca), and Mm02342723_m1(Mlxipl). DNA was amplified using the StepOne PlusReal-Time PCR system (Applied Biosystems). Data wererecorded by the manufacturer’s software and the RQ Man-ager Analysis Software (Applied Biosystems) was used to
determine Ct values. GAPDH was identified as the leastvariable housekeeping gene and was chosen to normalizedata in this study. Relative quantification of gene expres-sion was calculated by means of ddCt values (2−[(Cttargetgene
−CtGAPDH
)treated − (Cttarget gene
−CtGAPDH
)untreated]).
Hepatic triglyceride contentPortions of frozen liver were homogenized inchloroform-methanol (2:1) to extract total lipids as pre-viously described [48]. The organic extract was driedand reconstituted in isopropanol. Triglycerides werequantified using a serum triglyceride determination kit(TR0100, Sigma-Aldrich, Germany) and expressed asmilligram per gram liver.

Just et al. Microbiome (2018) 6:134 Page 5 of 18
Fatty acid analysisAnalysis of total fatty acids (FA) was performed as de-scribed previously [49]. Briefly, fatty acid methyl esters(FAMEs) were generated with acetyl chloride andmethanol overnight at room temperature and extractedwith hexane. Total FA analysis was carried out using aShimadzu 2010 GC-MS system (Shimadzu DeutschlandGmbH, Germany). FAMEs were separated using aBPX70 column (10-m length, 0.10-mm diameter,0.20-μm film thickness; SGE Analytical Science EuropeLtd., UK) using helium as carrier gas. The initial oventemperature was 50 °C, which was programmed to in-crease with 40 °C per min to 155 °C, with 6 °C per minto 210 °C, and with 15 °C per min to finally reach 250 °C. FA species and their positional and cis/trans isomerswere characterized in scan mode and quantified bysingle-ion monitoring mode detecting the specific frag-ments of saturated and unsaturated FAs (saturated: m/z74; monounsaturated: m/z 55; diunsaturated: m/z 67;polyunsaturated: m/z 79). Non-naturally occurringiso-C21:0 was used as an internal standard.
Glycerophospholipid and cholesterol analysisLipids were extracted according to a procedure de-scribed by Bligh and Dyer in the presence ofnon-naturally occurring lipid species as internal stan-dards [50]. Lipids were quantified by electrosprayionization tandem mass spectrometry (ESI-MS/MS) inpositive ion mode as described previously [51]. In brief,samples were analyzed by direct flow injection using aHTS PAL autosampler, an Agilent 1100 binary pump(Germany), and triple quadrupole mass spectrometer(Quattro Ultima, Micromass, Germany). A precursor ionscan of m/z 184 specific for phosphocholine containinglipids was used for phosphatidylcholine (PC), sphingo-myelin (SM), and lysophosphatidylcholine (LPC) [52].The following neutral losses were applied: phosphatidyl-ethanolamine (PE) 141, phosphatidylserine (PS) 185,phosphatidylglycerol (PG) 189, and phosphatidylinositol(PI) 277 [53, 54]. PE-based plasmalogens (PEP) were an-alyzed according to the principles described byZemski-Berry [55]. Sphingosine-based ceramides (Cer)were analyzed using a fragment ion of m/z 264 [56]. Freecholesterol (FC) and cholesteryl ester (CE) were quanti-fied using a fragment ion of m/z 369 after selective de-rivatization of FC using acetyl chloride [57]. Correctionof isotopic overlap of lipid species and data analysis byExcel Macros was performed for all lipid classes. Quanti-fication was performed by standard addition calibrationto cell homogenates using a number of naturally occur-ring lipid species for each lipid class. Lipid species wereannotated according to the recently published proposalfor shorthand notation of lipid structures that are de-rived from mass spectrometry [58]. Glycerophospholipid
species annotation was based on the assumption ofeven-numbered carbon chains only.
Bile acid measurementBile acids were quantified in blood according to ourrecently described method [38]. Briefly, 50 μlEDTA-plasma was mixed with 125 μl methanol and25 μl internal standard (IS) working solution (100 μMd4-CA, 100 μM d4-GCDCA, and 1000 μM d7-Chol),vortexed, and shaken continuously for 10 min. Aftercentrifugation (12,000×g, 4 °C, 10 min), 100 μlsupernatant were transferred into a new glass vial, evap-orated to dryness under a gentle stream of nitrogen, andredissolved in 50 μl methanol. The analysis of bile acidsand cholesterol was performed on an Agilent 1260 Infin-ity Quaternary LC System (Agilent TechnologiesDeutschland GmbH & Co. KG, Germany) coupled to atriple quadrupole API 4000 QTRAP® MS (AB SciexGermany GmbH) equipped with a turbo ion spraysource, operating either in positive or negative ion mode.A Kinetex® C18 reversed phase column equipped with aKinetex® C18 security guard column (Phenomenex Inc.,Germany) was used for separation of the analytes(constant flow rate of 200 μl/min).
Quantitation of short-chain fatty acids (SCFAs)SCFA measurement was performed by LC-MS/MS after3-nitrophenylhydrazine derivatization using a recentlyreported method with some modifications [59]. Frozenfecal samples (5–20 mg) were precisely weighed, sus-pended in 1 ml of an internal standard solution contain-ing propionic acid-d5, 13C2-acetate, and
13C4-butyrate inacetonitrile/water (1 + 1, v/v, 1 ml), and homogenized byvortexing after addition of glass beads (10 beads, diam-eter 2 mm). After equilibration (30 min) on an orbitalshaker, samples were centrifuged (12,000 rpm, 4 °C), andsupernatants (40 μl) were placed into autosampler vials,mixed with 20 μl of 3-nitrophenylhydrazine hydrochlor-ide (200 mmol/l) in acetonitrile/water (1/1, v/v) and20 μl of N-(3-dimethylaminopropyl)-N′-ethylcarbodii-mide hydrochloride (120 mmol/L) in acetonitrile/water(1/1, v/v) containing 6% pyridine. After 30 min at 40 °C,samples were diluted with acetonitrile/water (1/9, v/v;200 μl) and aliquots (1 μl) were used for UHPLC-MS/MS analysis.A Nexera X2 UHPLC system (Shimadzu, Duisburg,
Germany), consisting of two LC pumps LC30AD, aDGU-20 degasser, a SIL-30AC autosampler, a CTO-30Acolumn oven, and a CBM-20A system controller, washyphenated with a QTRAP 6500 LC-MS/MS system(Sciex, Darmstadt, Germany). Chromatographic separ-ation was performed on a Kinetex C18 column (100 ×2.1 mm, 1.7 μm, 100 Ǻ, Phenomenex, Aschaffenburg,Germany) using water/formic acid (100/0.1, v/v) as solvent
Just et al. Microbiome (2018) 6:134 Page 6 of 18
A and acetonitrile/formic acid (100/0.1, v/v) as solvent Bat a flow rate of 0.35 ml/min and a column temperature of40 °C. Starting with initial conditions of 17% B for 2 min,the content of B in the mobile phase was increased to 60%within 9 min, followed by an immediate switch to 100% B(held for 1 min), and re-equilibration at starting conditionsfor 3 min.The mass spectrometer was operated in the negative
electrospray ionization and low mass mode, and the ionspray voltage was set at − 4500 V. Nitrogen served asnebulizer gas (55 psi), turbo gas (500 °C) for solvent dry-ing (65 psi), curtain gas (35 psi), and collision gas (1.9 ×10− 5 Torr). The MS/MS parameters, declustering poten-tial, entrance potential, collision cell entrance potential,collision energy, and cell exit potential were tuned foreach individual compound after derivatization by flowinjection (10 μl/min), detecting the fragmentation of the[M-H]-molecular ions into specific product ions aftercollision with nitrogen (4.5 × 10− 5 Torr). Mass spectro-metric data were analyzed using Analyst software 1.6.2(Sciex). Target analytes were detected based on sched-uled MRM mode using the following mass transitions:3-NPH-acetate (m/z 193.9→ 136.8), 3-NPH-propanoate(m/z 207.9→ 136.8), 3-NPH-butyrate (m/z 221.9→136.9), 3-NPH-isobutyrate (m/z 222.0→ 136.9), 3-NPH-valerate (m/z 236.0→ 136.8), 3-NPH-isovalerate (m/z236.0→ 137.0), 3-NPH-2-methylbutyrate (m/z 236.0→136.8), 3-NPH-hexanoate (m/z 250.0→ 136.7), and3-NPH-4-methylvalerate (m/z 250.0→ 136.9). Whileacetate and propanoate were quantified using their iso-topologues 3-NPH-13C2-acetate (m/z 196.0→ 136.9) and3-NPH-d5-propionate (m/z 213.0→ 136.9), theremaining SCFAs were determined using 3-NPH-13C4-butyrate (m/z 226.0→ 137.0) as internal standard. AfterUHPLC-MS/MS analysis, calibration curves (0.0001–1.6 mg/l; eight-point calibration) were prepared by plot-ting peak area ratios of analyte to internal standardagainst concentration ratios of each analyte to the in-ternal standard using linear regression (R2 > 0.997). Foreach sample, data were calculated as the means of tripli-cate analysis.
Bacterial cultivationFor determination of viable bacterial cell counts, sampleprocessing and incubation were carried out under anaer-obic conditions (N2/H2, 90:10) in a Whitley H85 work-station. Materials were brought into the workstation atleast 24 h prior to experiments. Fresh cecal content wasweighed and diluted 1:10 with filter-sterilized phosphate-buffered saline (PBS) containing 0.02% (w/v) peptoneand 0.05% L-cystein. After preparation of serial 1:10-di-lution series (one per sample), 10 μl of each dilutionwere plated onto Wilkins-Chalgren-Anaerobe (WCA)agar (Oxoid) supplemented with filter-sterilized 0.02%
dithiothreitol (DTT) and 0.05% L-cystein. Plates were in-cubated at 37 °C for 1 week (SPF mice) or 2 weeks (GFmice). Colony-forming units (CFUs) were enumeratedand expressed per gram of cecal content (wet weight).
DNA isolationMetagenomic DNA was obtained from cecal content offasted SPF mice after mechanical lysis followed by purifi-cation according to a published protocol [60] modifiedas follows: cecal content in 600 μl stool DNA stabilizer(Stratec Biomedical AG) was transferred into a 2-mlscrew-cap tube containing 500 mg zirconia/silica beads(0.1 mm; BioSpec Products), 250 μl 4 M Guanidinethio-cyanate (Sigma-Aldrich, Germany), and 500 μl 5%N-lauroylsarcosine (Sigma-Aldrich, Germany). Sampleswere mixed and incubated for 60 min at 70 °C with con-stant shaking, and bacterial cells were disrupted bymechanical lysis using a FastPrep®-24 (three times, 40 s,6.5 m/sec) (MP Biomedicals) fitted with a coolingadaptor. After addition of 15 mg polyvinylpolypyrroli-done (PVPP, Sigma-Aldrich, Germany), the suspensionwas vortexed and centrifuged (3 min, 15,000×g, 4 °C).The supernatant (500 μl) was transferred into a newEppendorf tube, mixed with 5 μl RNase (VWR Inter-national, stock concentration 10 mg/ml) and incubatedfor 20 min at 37 °C with constant shaking. GenomicDNA was purified using NucleoSpin® gDNA columns(Macherey Nagel GmbH & Co. KG, Germany) followingthe manufacturer’s instructions. DNA quantity and qual-ity were measured with a NanoDrop® instrument(Thermo Fisher Scientific Inc., Germany).
16S rRNA gene-targeted PCRTo test the sterility of GF mice, 16S rRNA genes wereamplified using primer 27F (5′-agagtttgatcctggctcag) and1492R (5′-ggttaccttgttacgactt) [61]. For each sample, thePCR mixture contained 25 ng DNA, 20 μl 2× DreamTaqgreen PCR mastermix (Thermo Fisher Scientific Inc.,Germany), and 1 μl of each primer stock solution(20 μM). PCR conditions were 3 min at 95 °C followedby 25 cycles of 95 °C for 30 s, 55 °C for 30 s, 72 °C for90 s, and a final extension at 72 °C for 5 min. PCR prod-ucts were separated by electrophoresis in 1% agarosegels and visualized using the GeneFlash system (SyngeneInternational Ltd.).
High-throughput 16S rRNA gene amplicon analysisLibraries were constructed in a semi-automated mannerusing a Biomek-4000 pipetting robot (Beckmann CoulterBiomedical GmbH). The V3/V4 region of 16S rRNAgenes was amplified (25 cycles) from 24 ng of metage-nomic DNA using primer 341F and 785R in a two-stepprocedure to limit amplification bias [62, 63]. Librarieswere double-barcoded (8-nt index on each of the

Just et al. Microbiome (2018) 6:134 Page 7 of 18
forward and reverse 2nd-step primer) [64, 65]. Ampli-cons were purified using the AMPure XP system (Beck-mann Coulter Biomedical GmbH), pooled in anequimolar amount with addition of 25% (v/v) PhiX li-brary, and sequenced in paired-end modus (PE275)using a MiSeq system (Illumina).Data were analyzed as described in detail previously
[66]. Raw sequence reads were processed using IMNGS(www.imngs.org) [67], an in-house-developed pipelinebased on UPARSE [68]. Parameters were as follows: bar-code mismatches, 2; expected error, 3; Phred qualitythreshold, ≥ 3; trimming score, 3; trimming length,10 nt; min. sequence length, 300 nt; max. sequencelength, 600 nt (see IMNGS website for further informa-tion). Operational taxonomic units (OTUs) were clus-tered at 97% sequence similarity and only thoseoccurring at a relative abundance ≥ 0.25% total reads inat least one sample were further analyzed. For eachOTU, the final taxonomy was assigned using the mostdetailed classification among SILVA [69] and RDP [70].
MetatranscriptomicsTotal RNA was extracted from frozen cecal contents asfollows: approx. 50 mg content was mixed with 300 μlRLT buffer supplemented with B-mercaptoethanol(10 μl/ml, Sigma-Aldrich, cat. no. M3148) and 1 ml Tri-zol (Invitrogen, cat. no. 15596-18) and vortexed for 15 s.RNase- and DNase-free glass beads (600 mg,Sigma-Aldrich, cat. no. G4649-100G) were added priorto cell disruption using a FastPrep®-24 (40 s then 20 s at6.5 m/sec) (MP Biomedicals). After 5 min at roomtemperature and centrifugation (1 min, 12,000×g, 4 °C),supernatants were transferred into a tube containing300 μl chloroform (VWR, cat. no. 22711290), vortexed,incubated 3 min at room temperature, and centrifuged(15 min, 12,000×g, 4 °C). The aqueous phase was care-fully collected and transferred into a new tube contain-ing 1 ml of freshly prepared 70% ethanol solution. Tubeswere inverted five times and the mixture was loadedonto a RNeasy spin column (RNeasy mini kit, Qiagen,cat. no. 74104). RNA extraction was completed as de-scribed by the manufacturer including on-column DNAdigestion using the RNase-free DNAse set (Qiagen, cat.no. 79254). Total RNA was depleted from rRNA usingthe Ribo-Zero™ Bacteria Kit (Illumina, cat. no.MRZB12424) as recommended by the manufacturer.rRNA-depleted RNA was purified using the RNeasyMinElute CleanUp Kit (Qiagen, cat.no. 74204). cDNAsynthesis and library preparation were performed usingthe ScriptSeq™v2 RNA-Seq Library Preparation Kit (epi-center, cat. no. SSV21106/SSV21124). cDNA was puri-fied using the MinElute PCR Purification Kit (Qiagen,cat. no. 28004). Libraries were multiplexed and se-quenced on a HiSeq2500 sequencer (Illumina) with
Rapid v2 chemistry and the 2×150 bp paired-end readmodule. Raw reads were checked for quality scores(Q ≥ 25) and length (L ≥ 100 bp) using sickle (https://github.com/najoshi/sickle). Residual ribosomal readswere removed using SortMeRNA [71]. mRNA readswere mapped onto an in-house-implemented mousemetagenome catalog based on Xiao et al. [72] andcontaining 4.5 million genes using bwa [73]. Mappingresults of the metatranscriptomic dataset were ana-lyzed using DESeq2 [74].
StatisticsUnless otherwise stated, data are presented as mean ±SD. Statistics were performed in R or using Prism ver-sion 7.00 (GraphPad). The latter software was also usedfor generating graphs. The following statistical tests wereused: (I) Effects of feeding and colonization groups werecompared using two-way ANOVA followed by pairwisetesting (Holm-Sidak; *p < 0.05; **p < 0.01; ***p < 0.001),(II) Effects of diets within one colonization group or ofcolonization status for a given diet were compared usingone-way ANOVA followed by pairwise testing (Holm-Si-dak; #p < 0.05; ##p < 0.01; ###p < 0.001). Regression ana-lysis was performed by ANCOVA in Microsoft OfficeExcel 2016 with pairwise comparison. Statistical analysisof microbiota data was performed in Rhea [75]. EzTaxon[76] was used for the identification of OTUs showingsignificant differences (p < 0.05) in relative abundancesbetween feeding groups.
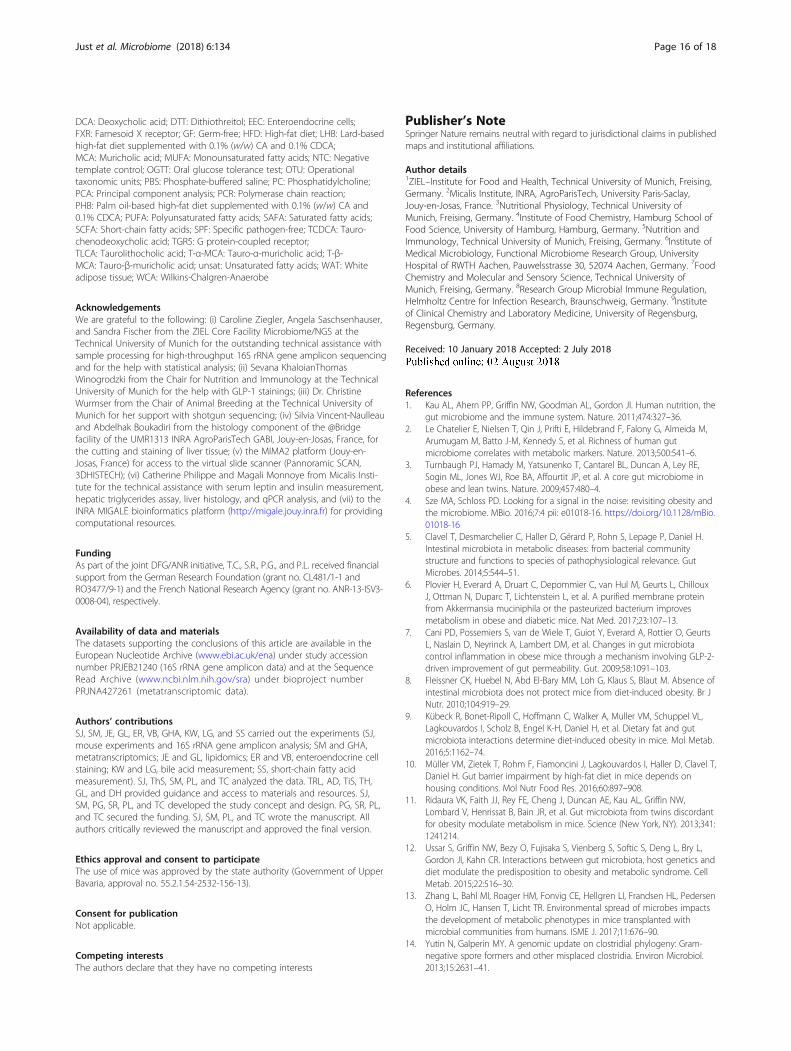
ResultsMetabolic state depends on dietary fat source and thepresence of intestinal microbesWe first characterized the metabolic status of mice fol-lowing dietary bile acid supplementation with or withoutaddition of fat (derived from plant or animal) in thepresence (SPF) or absence (GF) of gut commensals.SPF mice were significantly heavier than age-matched
GF mice in all diet groups at the end of the feedingperiod (18 weeks of age) (Fig. 1a). Bile acid supplementa-tion did not influence body weight, whereas both HFDsincreased body weight when combined with BA for8 weeks. This HFD-induced body weight gain wasobserved only in SPF, not in GF mice (Fig. 1a andAdditional file 2: Figure S2a). Interestingly, SPF mice fedlard (LHB) were characterized by a higher increase inWAT mass compared to palm oil (PHB) (3.2 ± 0.9 vs.2.0 ± 1.3 g; p = 0.0014) (Fig. 1b). This observation wasconfirmed by regression and ANCOVA analyses (Fig. 1c).To assess metabolic consequences of this difference infat mass, we performed an OGTT that revealed a signifi-cant effect of dietary fat: lard-fed SPF mice were charac-terized by impaired glucose tolerance when compared to

blo
od
glu
cose
[m
g/d
l]
SPF (n=6)GF (n=5-6)
bo
dy
wei
gh
t [g
]
25
30
35
40
45 *****
***
*
******
(n=10) (n=12)(n=10) (n=12) (n=9) (n=12) (n=11) (n=12)
WA
T m
ass
[g]
GF SPF GF SPF GF SPF GF SPF 0
1
2
3
4
5
6***
***
****** **
a
b d
c
WA
T m
ass
[g]
body weight [g]30 32 34 36 38 40 42
1
2
3
4
5 PHBLHB
p = 0.01 (ANCOVA)
GF(n=5)
SPF(n=6)
GF(n=5)
SPF(n=6)
GF(n=6)
SPF(n=6)
GF(n=5)
SPF(n=6)
10
15
20
25
30
35
40**
****** *
AU
C [
mg
/dl x
min
x 1
000]
0 30 60 90 120
100
200
300
400
minutes
CDBAPHBLHB
GF
SP
F
mWAT eWAT iWATPHB LHB
mWAT eWAT iWAT
1 cme
SPF
CD BA PHB LHB0 .0
0 .1
0 .2
0 .3
0 .4
0 .5
GL
P-1
+ c
ell
s/o
pe
n c
ryp
t
****
PHB LHB
Fig. 1 Impact of experimental feedings and microbial colonization on mouse metabolism. a Final body weight (at the age of 18 weeks after8 weeks of feeding). b WAT mass for all groups and representative pictures of respective fat depots collected from SPF mice fed the palm oil- orlard-based diets. c Corresponding regression analysis of WAT mass and body weight. d Blood glucose concentrations during OGTT withcorresponding areas under the curve. Color code for diets: CD, black; BA, red; PHB, dark blue; LHB, cyan blue. Symbols for colonization status: GF,diamonds; SPF, filled triangles. All mice used in the experiments are shown (group size varied as indicated below the x-axis). See the “Methods”section for description of statistical analyses. e Quantification of glucagon-like peptide (GLP) 1-positive cells in colonic tissue sections of SPF micefrom the different feeding groups. At least three non-consecutive sections were stained from each mouse and quantified. Symbols representaverage values from individual mice. Representative pictures of immunohistochemical staining acquired with a confocal microscope are shown(for the sake of space and appropriate size of images, picture for CD and BA are not shown but are equivalent to LHB group). Arrows indicatecells positive for GLP1. The black bars indicate 100 μm. ***p < 0.01, one-way ANOVA followed by the Tukey test (performed using Graph Pad Prism)
Just et al. Microbiome (2018) 6:134 Page 8 of 18
the palm oil group (Fig. 1d). Similar to body weight gain,glucose tolerance was not affected by the different dietsin GF mice. Regression and ANCOVA analyses of fastingblood insulin and leptin levels indicated lower concen-trations of insulin in LHB- vs. PHB-fed SPF mice (p =0.0009) (Additional file 2: Figure S2b). There was no dif-ference for leptin (p = 0.523).
Gut-derived incretin hormones produced by enteroen-docrine cells (EEC) influence glucose tolerance and insu-lin secretion. Because GLP-1 is produced by a subset ofenteroendocrine cells (EEC) located in the epithelium ofthe lower gastrointestinal tract, we quantified numbersof cells positive for GLP-1 and the EEC-marker chromo-granin A (ChgA) in colonic sections from the different

Just et al. Microbiome (2018) 6:134 Page 9 of 18
feeding groups. Palm oil feeding combined with bileacids was associated with an increase in bothGLP1-positive cells (Fig. 1e) and total EEC numbers(Additional file 2: Figure S2c), whereas lard showed noalterations compared to the CD and BA groups.Altogether, the data aforementioned indicate that lard
in the diet had a detrimental impact on host metabolismwhen combined with bile acids, but only in the presenceof endogenous gut microbes.
a
c fatty acids GF PHB (n=4) SPF PHB (n=7)
PC1 48.25%
PC
2 19
.34%
lipid classes
C16:0 C18:0 C16:1 C18:1(n-9)
C1(n
0
5
10
15
20
30
40
50compositio
**
***
d
[mg
/g]
30
40
50
60
70
80
******
*
******
*
liver to body weight ratio
[nm
ol/
mg
tis
sue]
total amounts
PHB LHB0
200
400
600
800
1000
*
PHB LHB
CE
0
2
4
6
8
10
12 ******
*
% l
ipid
cla
sses
16:0 16:1
CE spec
0
5
10
15
205055606570
******
***
*****
% C
Es
GF SPF GF SPF GF SPF GF SPF
% o
f al
l det
ecte
d f
atty
aci
ds
Fig. 2 Modulation of hepatic lipid profiles. a Liver to body weight ratio. bfatty acids measured in fasted mice (n = 4–7 as indicated in the figure). d Atotal amounts were considered for statistical analysis. Color code is as in FiPUFA polyunsaturated fatty acids, unsat unsaturated fatty acids, PC phosphdescription of mass spectrometric measurements and for statistical analyseused as housekeeping gene for the normalization. GF mice fed the PHB diestatistical significance as follows: *p < 0.05; **p < 0.01; ***p < 0.001 (two-way
Dietary lard alters host lipid profilesWe then looked more specifically at the liver as the cen-tral organ for lipid, bile acid, and cholesterol metabol-ism. The combination of HFD and BA feeding for8 weeks reduced liver to body weight ratios, independentof dietary fat source (Fig. 2a). This decrease was not duesolely to increased body weight but indeed to lower liverweight, as shown by regression analysis (Additional file 3:Figure S3a). Liver histopathology revealed that HFD-
b
[mg
/ g li
ver]
0
5
10
15
20
25
30
35triglyceride concentrations
GF SPF GF SPF GF SPF GF SPF
*
GF LHB (n=5) SPF LHB (n=6)
SAFA MUFA PUFA0
20
40
60distribution
% o
f al
l det
ecte
d f
atty
aci
ds **
*
8:1-7)
C18:2(n-6)
C20:4(n-6)
C22:6(n-3)
n
****
PHB LHB
PC
26
28
30
32
34
36
**
***
% l
ipid
cla
sses
36:4 36:2
PC species
0
2
4
6
8
15
20
25
30***
***
*
% P
Cs
18:1
ies***
****
e
PHB LHB
0 .0
0 .5
1 .0
1 .5
2 .0
cd36mRNA
fold
ch
ang
e
****
GF(4)
SPF (7)
SPF (6)
GF(4)
Triglyceride content. c Amounts, composition, and distribution of totallterations in lipid classes and species. Only lipids representing > 1%g. 1. SAFA saturated fatty acids, MUFA monounsaturated fatty acids,atidylcholine, CE cholesteryl esters. See the “Methods” section fors. e mRNA relative expression of Cd36 in the liver of mice. GAPDH wast were used as reference group. In all figure panels, stars indicateANOVA followed by Holm-Sidak)

Just et al. Microbiome (2018) 6:134 Page 10 of 18
induced fatty liver activity scores were higher in SPF vs.GF mice, which was significant only for the lard diet(Additional file 3: Figure S3b). This was due to more se-vere steatosis but not to inflammation and ballooning(data not shown). In line with the changes observed inbody weight between GF and SPF mice, the colonizationstatus of mice influenced hepatic triglyceride concentra-tions, which were higher in SPF vs. GF mice fed the CD,PHB, and LHB diets, yet significance was reached onlyfor the lard-fed group (Fig. 2b).To pinpoint specific changes associated with the
lard-induced metabolic effects described in Fig. 1, we de-termined hepatic lipid profiles in GF and SPF mice fed thePHB vs. LHB diets. Total amounts of fatty acids were 3.3-(PHB) and 1.7-fold (LHB) higher in the liver of SPF vs. GFmice, without significant changes between the two HFDs(Fig. 2c). With respect to fatty acid composition, the amp-litude of colonization-induced changes (SPF vs. GF) washigher in the lard-fed group. SPF LHB mice showed sig-nificantly higher proportions of monounsaturated fattyacids (MUFA), in particular oleic acid (FA 18:1 n-9), andlower proportions of poly-unsaturated fatty acids (PUFA),in particular arachidonic acid (FA 20:4 n-6) (Fig. 2c). Sincethe major fraction of hepatic fatty acids are esterified tocell membrane lipids and sterols, we next analyzed glycer-ophospholipid, sphingolipid, and cholesteryl ester (CE)species. Principal component analysis (PCA) highlightedcolonization- and diet-specific profiles (Fig. 2d). Dietary
Table 2 Bile acid and cholesterol concentrations in systemic plasma
Colonization status GF
Diet PHB
T-α-MCA [nM] 107 ± 60
T-β-MCA [nM] 358 ± 125a
TCA [nM] 186 ± 116
TCDCA [nM] 23 ± 28
TDCA [nM] BQ
β-MCA [nM] 29 ± 26
12-DHCA [nM] BQ
CA [nM] 3.8 ± 6.5
TLCA [nM] BQ
DCA [nM] BQ
SUM of all bile acids [nM] 706 ± 348
Primary [nM] 706 ± 348
Secondary [nM] BQ
Tauro-conjugated [nM] 673 ± 326
Unconjugated [nM] 33 ± 28
Cholesterol [μM] 628 ± 241
Data are mean ± SD. Diets are as in Table 1. Italicized data indicate differences betwtwo-way ANOVA with Holm-Sidak for multiple comparison; t test for LHB vs. PHB compLHB among SPF mice; cGF vs. SPF for PHB diet; dGF vs. SPF for LHB diet. CA cholic acidLCA lithocholic acid, MCAmuricholic acid, T tauro-conjugated, BQ below quantification
fat source significantly affected total phosphatidylcholine(PC) and CE levels in SPF mice. Total CE fractions were1.8-fold higher in LHB mice (including higher proportionsof CE 16:1 and CE 18:1), while PC proportions were de-creased, with higher representation of PC 36:2 vs. 36:4.As we observed significant changes in hepatic lipid
profiles between animals fed the two HFDs, we quanti-fied the expression of genes involved in lipid transportand metabolism in liver samples. The expression ofCd36, encoding a scavenger receptor involved inlong-chain fatty acid transport, was decreased approx.ten- and twofold in SPF mice fed the PHB and LHB, re-spectively, when compared to corresponding GF mice,without statistically significant difference between thetwo HFDs (Fig. 2e). There was also no significantcolonization- or diet-induced differences in expressionof the other genes measured (Ppar-α, Ppar-γ, Acaca,Mlxipl). Lipid analysis also included the quantification ofcholesterol and bile acids in the blood (Table 2) [38].The sole fat source-dependent difference in SPF micewas significantly increased systemic concentrations oftauro-chenodeoxycholic acid (TCDCA) in lard- vs. palmoil-fed animals (21.5 ± 12.6 nM vs. 7.1 ± 8.4 nM, p =0.0415, t test). Cholesterol levels were neither affectedby the colonization status nor by the diet.In summary, alterations of the mouse metabolic status
associated with dietary lard in combination with bile acidswere accompanied by significant changes in lipid profiles.
of fasted mice
SPF
LHB PHB LHB
163 ± 128 31 ± 11 53 ± 31
780 ± 617 36 ± 10c 34 ± 17d
236 ± 173 39 ± 54 35 ± 23d
43 ± 51 7.1 ± 8.4 22 ± 13b
BQ 53 ± 19 83 ± 32
134 ± 225 31 ± 40 21 ± 37
BQ 2.2 ± 4.0 1.6 ± 3.8
7.6 ± 10.8 45 ± 39 37 ± 25
BQ BQ BQ
BQ 103 ± 32 142 ± 55
1363 ± 1179 347 ± 95 429 ± 151d
1363 ± 1179 189 ± 87 202 ± 103d
BQ 159 ± 48 227 ± 85
1221 ± 963 166 ± 59 228 ± 61d
142 ± 220 181 ± 83 201 ± 104
539 ± 234 775 ± 242 790 ± 235
een groups. Superscript letters indicate statistical significance (p < 0.05, n = 4–6;arisons within colonization groups) as follows: aP- vs. LHB among GF mice; bP- vs., CDCA chenodeoxycholic acid, DCA deoxycholic acid, DHCA dihydroxycholic acid,limit [38]

Just et al. Microbiome (2018) 6:134 Page 11 of 18
The observation that diet effects were absent in GF miceimplied that microbial colonization is at least partly re-sponsible for the changes observed, which prompted us toanalyze gut microbiota structure and functions.
Dietary fat and bile acid supplementation modulates themouse cecal microbiotaMicrobiota structureOne known major difference between GF and SPF miceis reduced cecum weight under SPF conditions, whichwas also observed in the present study (Additional file 4:Figure S4A). In contrast, the effect of bile acid supple-mentation on cecum weight had not been investigatedso far. BA feeding significantly reduced cecum weight inboth GF and SPF mice, and this decrease was accentu-ated by HFDs. Anaerobic cultivation of cecal contentsconfirmed the germ-free status of GF mice(Additional file 4: Figure S4B), which was also supportedby negative 16S rRNA gene-targeted PCRs(Additional file 4: Figure S4C). Cultivation also showedthat the different diets did not significantly alter viable bac-terial counts in SPF mice (Additional file 4: Figure S4B).High-throughput sequencing of 16S rRNA gene ampli-
con libraries was performed to obtain first insights intodiet-induced shifts in gut bacterial profiles. We analyzedsamples from fasted SPF mice only (n = 6–7) to excludeconfounding effects of oral glucose in the group sub-jected to OGTT. A total of 475,710 quality- andchimera-checked sequences (19,028 ± 2768 per sample)representing a total of 153 operational taxonomic units(OTUs) (125 ± 6 per sample) were obtained and furtheranalyzed (Additional file 5: Table S1).LHB feeding was associated with increased richness
(ca. 10 molecular species) when compared to both BA andCD, but not significantly to PHB (Fig. 3a). BA did notaffect richness, yet Shannon effective counts were de-creased significantly, which suggests shifts in the evennessof dominant species distribution. Beta-diversity analysisrevealed a significant clustering of samples according todiet (Fig. 3b). In particular, all experimental diets increasedinter-individual differences in the phylogenetic makeup ofcecal microbiota (i.e., within group heterogeneity) whencompared to the control diet, suggesting less stable statesof the ecosystem. Diet-induced shifts in microbiota com-position were clearly visible at the family level: all dietaryinterventions (BA, PHB, and LHB) were associated withincreased proportions of Desulfovibrionaceae, whereasErysipelotrichaceae were not detected in these mice(Fig. 3c). The relative abundance of Lachnospiraceae wasdiscriminative between the palm- and lard-based interven-tion (ca. 15% decrease in the latter group) and that ofRuminococcaceae was higher in LHB vs. CD. Both PHBand LHB showed lower relative abundances ofRikenellaceae.
A deeper look at the level of single molecular speciesshowed that the four dietary interventions were character-ized by the presence of specific OTUs (Fig. 3d). Within thefamily Erysipelotrichaceae, Faecalibaculum rodentium wasspecific to the control diet, while BA-fed mice exhibitedhigher proportions of OTUs most closely related to Alistipesand Muribaculum species. Significant differences were alsoobserved between the two HFDs: palm oil feeding increasedthe relative abundance of one OTU with closest match toAcetatifactor muris, whereas Oscillibacter ruminantium wasnot detectable in this group. Mice fed the lard-based dietwere characterized by increased relative abundances ofClostridium lactatifermentans and Flintibacter butyricus.Taken together, bile acids and dietary fat source af-
fected cecal microbiota structure. Hence, we further in-vestigated microbial functions. Measurement ofshort-chain fatty acid (SCFA) in colonic content of SPFmice indicated higher concentrations of acetate in PHBmice, but results did not reach significance and the co-lonic concentrations of all other SCFA were also not af-fected (Additional file 6: Figure S5). In order to obtain acomprehensive view of microbial functions, cecal con-tents were further analyzed using metatranscriptomics.
Microbiota functionsCecal content from 22 fasted mice (CD, n = 7; BA, n = 4;PHB, n = 7; LHB, n = 5) were analyzed using microbialmetatranscriptomics. On average, 14,906,345 ± 2,029,931high-quality mRNA reads were obtained per mice and2,424,413 ± 741,203 were mapped onto 180,412 ± 34,440genes from the mouse metagenome catalog. Overall, thedietary interventions had a substantial impact on microbialactivities: major clusters of mice according to microbialgene expression in the cecum were discriminated by HFDintake (Fig. 4a). Looking more specifically at differences be-tween the two HFDs according to the metabolic pheno-types observed in mice, 266 genes were characterized bydifferent levels of expression between LHB and PHB(Fig. 4b). Genes classified in the categories ether lipid me-tabolism (map00565), autophagy (map04138), and galactosemetabolism (map00052) were overexpressed in mice fedpalm oil compared with those fed lard (Fig. 4b). At the levelof single KEGG Orthologies (KO) within the ether lipidmetabolism pathway, two KOs were more prevalent inpalm oil-fed mice: sucrose phosphorylase [K01058] and glo-boside alpha-N-acetylgalactosaminyltransferase (GBGT1)[K01114]. Among the top five differentially expressedgenes, transcripts encoding enzymes linked to hyaluronicacid metabolism such as hyaluronate lyase [K01727] andhyaluronoglucosaminidase [K01197] were also moreexpressed (eight- and sevenfold, respectively) in palmoil-fed mice (Additional file 7: Table S2). On the otherhand, 15 functional categories had a significantly higher ex-pression in mice fed lard, including fatty acid biosynthesis

a
c
d
b
Fig. 3 Diet-induced alteration of cecal microbiota profiles. a Alpha-diversity shown as richness and Shannon effective counts. b Beta-diversityanalysis via multidimensional scaling analysis of generalized UniFrac distances. The p value was obtained by PERMANOVA for testing thesignificance of separation between sample groups. c Boxplots of significantly altered taxonomic groups at the family level. Erysipelotrichaceaewere detected in four of six CD-fed mice. d Relative abundances of dietary group-specific OTUs shown as a heat map. OTU sequences (ca.450 bp of the V3/V4 region) were classified using EzTaxon. The range of relative abundances of each OTU is given in square brackets next to thecorresponding OTU identification number. Statistics were performed and original graphs were generated in the R programming environmentusing Rhea [67]: *p < 0.05; **p < 0.01; ***p < 0.001. Number of mice: CD, 6; BA, 6; PHB, 7; LHB, 6
Just et al. Microbiome (2018) 6:134 Page 12 of 18
(map00061), amino acid metabolism (alanine, aspartate,and glutamate metabolism, map00250; arginine biosyn-thesis, map00220; D-alanine metabolism, map00473;arginine and proline metabolism, map00330; lysinebiosynthesis, map00300; taurine and hypotaurine metabol-ism, map00430; beta-alanine metabolism map00410), andsulfur metabolism (map00920) (Fig. 4c). In terms ofKEGG Orthologies, glyceraldehyde 3-phosphate dehydro-genase (GAPDH) transcripts [K00134] were most highlyregulated in lard-fed mice (ca. 4.5-fold overexpression)(Additional file 7: Table S2).
DiscussionThe major goal of the present study was to determinethe functional implication of gut microbial populations
for metabolic responses to bile acids and fat source inthe diet of mice. Whereas germ-free mice appeared tobe protected, colonized mice showed signs of metabolicdisturbances when fat was provided as lard in a diet con-taining primary bile acids, which was accompanied byspecific gut microbiota signatures.
Gut microbial colonization and host metabolismThe fact that the body weight of germ-free mice waslower than that of colonized counterparts in our experi-ments is consistent with the literature [77]. We alsodemonstrate that the presence of gut microbes modu-lates hepatic lipid profiles: colonization was generallylinked to elevated amounts of triglycerides and total fattyacids in the liver. Higher ratios of mono- to

a
b
Fig. 4 Diet-induced shifts in the metatranscriptome of mouse cecal microbiota. a Heat map of the 1207 genes with differential expression levelsbetween the four diets. Genes were selected according to adjusted p values ≤ 0.001 and absolute(log2FC)≥ 5. Mice were grouped into two mainclusters corresponding to the BA/CD diets or the HFDs supplemented with BA. b Heat map depicting the expression of 266 genesshowing differential expression level between the lard- and palm oil-based HFD. Genes were selected according to adjusted p values≤ 0.001 and absolute(log2FC) ≥ 2.5. c Main metabolic pathways with significantly different expression level between the two HFDs
Just et al. Microbiome (2018) 6:134 Page 13 of 18
polyunsaturated fatty acids in colonized vs. germ-freeanimals suggest an increased fatty acid synthesis. It hasbeen known for a while that the gut microbiota influ-ences host lipid metabolism [77], but the interplay be-tween gut microbes and dietary fat source has beenhighlighted more recently [9]. Our study confirms thatthe impact of diets containing fat of either animal orplant origin is dependent on intestinal microbialcolonization. As reported by others [32], germ-free mice
were characterized by high amounts oftauro-β-muricholic acid (TCDCA) even when feedingprimary bile acids as in our study.
Shifts in host metabolism and gut microbiota structuredue to primary bile acid supplementationRecently, Zheng et al. [78] reported that supplementa-tion of bile acids alone in diet triggered metabolic distur-bances similar to a HFD based on coconut oil (increased
Just et al. Microbiome (2018) 6:134 Page 14 of 18
body weight, adipose tissue, hypercholesterolemia). Nei-ther we nor Watanebe et al. [27] observed such an effectof bile acids. Methodological differences between thestudies may explain this discrepancy, including the typeand dose of bile acids supplemented to diets (e.g., 0.1%conjugated cholic acid in Zheng et al. vs. 0.2% free pri-mary bile acids in our study), the genetic background ofmice, or their age at feeding start (male C57BL/6J at3 weeks of age vs. male C57BL/6N at 10 weeks of age).Moreover, Zheng et al. [78] reported mean relative abun-dances of 30 to 40% Proteobacteria in the cecum of miceon control diet (including members of the followingvarious taxa: class Campylobacterales; family Helicobac-teraceae; genus Desulfovibrio), which is rather unusualfor laboratory mice and may also explain the differentphenotypes observed [79, 80].Only few studies have assessed gut microbiota changes
induced by bile acids and findings seem to bestudy-dependent, most likely due to different experimen-tal protocols and varying colonization status of mice atbaseline. Islam et al. [40] investigated the impact of feed-ing approx. 0.2% cholic acid on the cecal microbiota ofrats based on microscopic counts, clone libraries, and insitu hybridization. They reported decreased cell countsand Shannon diversity index whereas proportions ofLachnospiraceae and Erysipelotrichaceae were increased.In our study, primary bile acids alone reduced Shannoneffective counts, but Erysipelotrichaceae were not de-tected at all in mice fed bile acids. Moreover, relativeabundances of Lachnospiraceae were lower, except inthe group fed palm oil. In another study, feeding 1%cholic acid to mice increased the density of bacterialpopulations capable of producing the secondary bile aciddeoxycholic acid by 7-α-dehydroxylation, as determinedin vitro using radioactively labelled substrate [81]. Via16S rRNA amplicon sequencing, we did not find signifi-cant increase in the occurrence of known secondary bileacid-producing bacterial species, even though some ofthe yet uncultured species detected (e.g., dominantmembers of family S24-7) may be able to do so. Relativeabundances of the family Desulfovibrionaceae (withinthe class Deltaproteobacteria) were increased inresponse to bile acid supplementation. In line with thisfinding, others found that relative abundances of Desul-fovibrionaceae, which are Gram-negative sulphate-reducing bacteria, significantly increased in obese andmetabolically impaired mice [82, 83].
Impact of dietary fat sources on host metabolismPublished data showed that germ-free mice are per senot resistant to diet-induced obesity, i.e., their propensityto gain weight depends on the type of high-calorie dietused [8]. Kübeck et al. [9] recently reported thatgerm-free mice fed a lard-based HFD were resistant to
diet-induced obesity partly due to increased energy ex-penditure, in contrast to mice fed a palm oil-based HFD.Interestingly, germ-free mice fed HFDs did not gainweight significantly in our experiments, neither based onlard nor palm oil and despite a feeding period similar toKübeck et al. (8 weeks). This suggests that the additionof primary bile acids in the same HFD as in Kübecket al. was sufficient to prevent obesity development ingerm-free mice fed palm oil. This is in agreement withfindings from 2006 by Watanabe et al. [27], whoreported that a 7-week-long feeding of 0.5% (w/w) cholicacid to conventional C57BL/6J mice induced energyexpenditure, which counteracted body weight gain in-duced by a high-fat diet. Even though information on fatsource was not provided in this paper, colonized micefed both a HFD and bile acids were as lean as controlmice on a chow diet. In our experiments, however, thisphenomenon was observed only in germ-free mice,which stayed lean, whereas conventional mice fed bothbile acids and HFDs gained weight significantly whencompared with mice on the control or BA diet. Add-itional experiments will be required to clarify whetherthe fat source in HFDs determines the possibleanti-obesity effects of primary bile acids.The gut-derived incretin hormones glucagon-like pep-
tide 1 (GLP1) and glucose-dependent insulinotropicpolypetide (GIP) are important factors determining glu-cose tolerance and insulin secretion from the pancreas.GIP and GLP1 show distinct expression patterns alongthe intestinal tract, GIP being produced in the proximalsmall intestine and GLP1 in distal parts of the small in-testine and in the colon [84]. A subset of enteroendo-crine cells (EEC), so-called L-cells, secretes GLP1 andtheir density was shown to be increased by dietary lipidsboth in mice and humans [85]. In the present study,quantifying the number of cells positive for GLP1 andthe pan-EEC-marker chromogranin A in mouse colonicsections revealed that palm-based HFD feeding was as-sociated with a significant increase in GLP1-producingEEC compared with all other diets, including lard-basedHFD. Unchanged EEC numbers in the colon of LHBmice is in line with published data by Beyaz et al. [86]reporting no alteration in ChgA-positive cells in the je-junum of mice fed a 60%-kcal high-fat diet based onlard. Our results suggest that various dietary fat sourceshave different abilities to promote L-cell differentiation,the increased number of GLP1-producing EEC in thecolon of PHB-fed mice possibly contributing to the im-proved glucose tolerance observed in these mice.To the best of our knowledge, there is only one study
that previously analyzed lipid profiles in the liver of GFand SPF mice fed different diets: Caesar et al. [87] investi-gated the impact of a lard-based or fish oil-based HFD fedto adult C57BL/6 mice for 11 weeks. The authors reported

Just et al. Microbiome (2018) 6:134 Page 15 of 18
a dominant impact of diet compared with colonization sta-tus, which was not the case in our study, likely because bileacids were fed to mice in addition to HFDs. Nonetheless,the data by Caesar et al. support our finding that triglycer-ides and cholesteryl esters are elevated in the liver of micefed lard. Decreased proportions of phosphatidylcholine inlard-fed mice characterized by detrimental metabolic re-sponses are also in agreement with the literature [88].
Impact of dietary fat sources on the gut microbiotaAmplicon sequencing of 16S rRNA genes from the cecalcontent of fasted SPF mice revealed diet-inducedchanges in gut microbiota diversity and composition.When comparing the two HFDs, PHB was linked toincreased relative abundances of Lachnospiraceae, in-cluding one specific OTU with 92.6% similarity to Aceta-tifactor muris, a bacterium originally isolated from thececum of an obese mouse [89]. This species is the clos-est relative to our OTU, yet at a sequence identity belowgenus-level thresholds. Other studies reported changesin the occurrence of A. muris relatives in the context ofdiet-induced obesity [9, 10, 67, 82]. The diversity androle of these bacteria in host metabolism will warrantfurther investigations. Two OTUs characterized byhigher relative abundances following LHB feeding wereidentified at the species level as Clostridium lactatifer-mentans and Flintibacter butyricus. The former speciesis a lactate-fermenting bacterium producing the short-chain fatty acids acetate and propionate with traces ofbutyrate and isovalerate [90]. The latter species is cap-able of producing butyrate from amino acids [91], themetabolism of which seems to be affected by HFD asfound in the present work by metatranscriptomics andin one of our previous study [92]. Nonetheless, no differ-ences in colonic SCFA levels were observed in coloniccontent of the mice. The HFDs affected mouse cecalmicrobiota also at the functional level, as the metatran-scriptomic approach identified genes and pathways af-fected by fat source. The expression of genes involved inether lipid metabolism was similar between control andlard-fed mice but was significantly higher under palm oilfeeding. Changes in ether lipid levels have been associ-ated with host metabolic conditions, including nonalco-holic steatohepatitis, hypertension, obesity, and type-1diabetes [93]. On the other hand, GAPDH transcriptlevels were higher in LHB vs. PHB mice; this gene andits activity were linked to obesity in rat models [94, 95].Although speculative, these observations may partly ex-plain the differential metabolic phenotypes observed incolonized mice fed palm oil vs. lard.
ConclusionsWe found that dietary fat source is an important factorthat can substantially impact phenotypes in mouse
models of diet-induced obesity. Lard in combinationwith primary bile acids in the diet had detrimental ef-fects on the host metabolic state in colonized mice. Thefinding that germ-free mice were protected demon-strates the involvement of the gut microbiota, which wasdifferentially affected at both the structural and func-tional level by the two high-fat diets.
Additional files
Additional file 1: Figure S1. Experimental setup of the mouse trial. aLitter and cage distribution of mice used in the experiments. b Schemeof the experimental procedure. After a feeding period on controlexperimental diet (CD) between the age of 8 and 10 weeks for the sakeof metabolic adaptation, GF and SPF mice were randomly divided intofour different feeding groups (n = 9–12 per diet per colonization status):(I) CD; (II) CD supplemented with 0.2% (w/w) primary bile acids (BA); (III)palm oil-, or (IV) lard-based high-fat diet with 48 kJ% from fat, both sup-plemented with bile acids as above (P- and LHB, respectively). All dietswere fed ad libitum for 8 weeks. At the end of the experimental feedingperiod, mice were divided into two groups prior to sampling: (I) fastedfor 6 h and sacrificed immediately; (II) fasted for 6 h followed by oral glu-cose tolerance test (OGTT). (PNG 66 kb)
Additional file 2: Figure S2. Impact of experimental feedings andmicrobial colonization on mouse metabolism. a Body weightdevelopment over time. b Regression analysis of fasting blood insulinand leptin concentrations in P- and LHB-fed SPF mice. See the “Methods”section for description of statistical analyses. c Quantification ofchromogranin A-positive (ChgA+) cells in colonic tissue sections ofSPF mice from the different feeding groups. Description is as Fig. 1e.***p < 0.01, one-way ANOVA followed by the Tukey test (performed usingGraph Pad Prism). (PDF 9366 kb)
Additional file 3: Figure S3. Impact of experimental feedings andmicrobial colonization on the liver. a Liver to body weight ratio andcorresponding regression analysis. b Liver histopathology. c Hepatictriglyceride concentrations. For detailed description of the statisticalanalysis see the “Methods” section. (PNG 576 kb)
Additional file 4: Figure S4. Colonization status of SPF and GF mice. aCecum to body weight ratio. b Viable bacterial counts were determinedby anaerobic cultivation. C 16S rRNA gene-targeted PCR of cecal contentDNA from GF and SPF mice. Two representative samples per dietarygroup are shown for each colonization status. Bands at 1.5 kbp indicatethe presence of microbes. Water was used as negative template control(NTC); number of mice: between 9 and 12 per group; for detailed descriptionof the statistical analysis see the “Methods” section. (PNG 135 kb)
Additional file 5: Table S1. OTU-table based on high-throughput 16SrRNA amplicon analysis. Data were obtained and analyzed as described inthe text. Data are sequence counts after quality checks. Only those OTUsoccurrding at > 0.25% relative abundance in at least one sample wereretained. Columns are individual mice per dietary groups as abbreviatedin the text and in other illustrations. (PNG 78 kb)
Additional file 6: Figure S5. SCFA concentrations in colonic content of(XLSX 43 kb)
Additional file 7: Table S2. List of microbial genes differentiallyexpressed in the cecum of mice fed high-fat diets supplemented withprimary bile acids and with either palm oil (PHB) or lard (LHB) as fatsource. Genes included in this table are significantly (q-value < 0.05) andsubstantially (>2.5-fold) overexpressed in one condition as compared tothe other.Gene annotation (KEGG) refers to the Kyoto Encyclopedia ofGenes and Genomes database annotation. (XLSX 34 kb)
Abbreviations12-DHCA: 12-Dihydroxycholic acid; AUC: Area under the curve; BA: CDsupplemented with 0.1% (w/w) CA and 0.1% CDCA; C: Carbon; CA: Cholicacid; CD: Control diet; CE: Cholesteryl esters; CFU: Colony-forming unit;
Just et al. Microbiome (2018) 6:134 Page 16 of 18
DCA: Deoxycholic acid; DTT: Dithiothreitol; EEC: Enteroendocrine cells;FXR: Farnesoid X receptor; GF: Germ-free; HFD: High-fat diet; LHB: Lard-basedhigh-fat diet supplemented with 0.1% (w/w) CA and 0.1% CDCA;MCA: Muricholic acid; MUFA: Monounsaturated fatty acids; NTC: Negativetemplate control; OGTT: Oral glucose tolerance test; OTU: Operationaltaxonomic units; PBS: Phosphate-buffered saline; PC: Phosphatidylcholine;PCA: Principal component analysis; PCR: Polymerase chain reaction;PHB: Palm oil-based high-fat diet supplemented with 0.1% (w/w) CA and0.1% CDCA; PUFA: Polyunsaturated fatty acids; SAFA: Saturated fatty acids;SCFA: Short-chain fatty acids; SPF: Specific pathogen-free; TCDCA: Tauro-chenodeoxycholic acid; TGR5: G protein-coupled receptor;TLCA: Taurolithocholic acid; T-α-MCA: Tauro-α-muricholic acid; T-β-MCA: Tauro-β-muricholic acid; unsat: Unsaturated fatty acids; WAT: Whiteadipose tissue; WCA: Wilkins-Chalgren-Anaerobe
AcknowledgementsWe are grateful to the following: (i) Caroline Ziegler, Angela Saschsenhauser,and Sandra Fischer from the ZIEL Core Facility Microbiome/NGS at theTechnical University of Munich for the outstanding technical assistance withsample processing for high-throughput 16S rRNA gene amplicon sequencingand for the help with statistical analysis; (ii) Sevana KhaloianThomasWinogrodzki from the Chair for Nutrition and Immunology at the TechnicalUniversity of Munich for the help with GLP-1 stainings; (iii) Dr. ChristineWurmser from the Chair of Animal Breeding at the Technical University ofMunich for her support with shotgun sequencing; (iv) Silvia Vincent-Naulleauand Abdelhak Boukadiri from the histology component of the @Bridgefacility of the UMR1313 INRA AgroParisTech GABI, Jouy-en-Josas, France, forthe cutting and staining of liver tissue; (v) the MIMA2 platform (Jouy-en-Josas, France) for access to the virtual slide scanner (Pannoramic SCAN,3DHISTECH); (vi) Catherine Philippe and Magali Monnoye from Micalis Insti-tute for the technical assistance with serum leptin and insulin measurement,hepatic triglycerides assay, liver histology, and qPCR analysis, and (vii) to theINRA MIGALE bioinformatics platform (http://migale.jouy.inra.fr) for providingcomputational resources.
FundingAs part of the joint DFG/ANR initiative, T.C., S.R., P.G., and P.L. received financialsupport from the German Research Foundation (grant no. CL481/1-1 andRO3477/9-1) and the French National Research Agency (grant no. ANR-13-ISV3-0008-04), respectively.
Availability of data and materialsThe datasets supporting the conclusions of this article are available in theEuropean Nucleotide Archive (www.ebi.ac.uk/ena) under study accessionnumber PRJEB21240 (16S rRNA gene amplicon data) and at the SequenceRead Archive (www.ncbi.nlm.nih.gov/sra) under bioproject numberPRJNA427261 (metatranscriptomic data).
Authors’ contributionsSJ, SM, JE, GL, ER, VB, GHA, KW, LG, and SS carried out the experiments (SJ,mouse experiments and 16S rRNA gene amplicon analysis; SM and GHA,metatranscriptomics; JE and GL, lipidomics; ER and VB, enteroendocrine cellstaining; KW and LG, bile acid measurement; SS, short-chain fatty acidmeasurement). SJ, ThS, SM, PL, and TC analyzed the data. TRL, AD, TiS, TH,GL, and DH provided guidance and access to materials and resources. SJ,SM, PG, SR, PL, and TC developed the study concept and design. PG, SR, PL,and TC secured the funding. SJ, SM, PL, and TC wrote the manuscript. Allauthors critically reviewed the manuscript and approved the final version.
Ethics approval and consent to participateThe use of mice was approved by the state authority (Government of UpperBavaria, approval no. 55.2.1.54-2532-156-13).
Consent for publicationNot applicable.
Competing interestsThe authors declare that they have no competing interests
Publisher’s NoteSpringer Nature remains neutral with regard to jurisdictional claims in publishedmaps and institutional affiliations.
Author details1ZIEL–Institute for Food and Health, Technical University of Munich, Freising,Germany. 2Micalis Institute, INRA, AgroParisTech, University Paris-Saclay,Jouy-en-Josas, France. 3Nutritional Physiology, Technical University ofMunich, Freising, Germany. 4Institute of Food Chemistry, Hamburg School ofFood Science, University of Hamburg, Hamburg, Germany. 5Nutrition andImmunology, Technical University of Munich, Freising, Germany. 6Institute ofMedical Microbiology, Functional Microbiome Research Group, UniversityHospital of RWTH Aachen, Pauwelsstrasse 30, 52074 Aachen, Germany. 7FoodChemistry and Molecular and Sensory Science, Technical University ofMunich, Freising, Germany. 8Research Group Microbial Immune Regulation,Helmholtz Centre for Infection Research, Braunschweig, Germany. 9Instituteof Clinical Chemistry and Laboratory Medicine, University of Regensburg,Regensburg, Germany.
Received: 10 January 2018 Accepted: 2 July 2018
References1. Kau AL, Ahern PP, Griffin NW, Goodman AL, Gordon JI. Human nutrition, the
gut microbiome and the immune system. Nature. 2011;474:327–36.2. Le Chatelier E, Nielsen T, Qin J, Prifti E, Hildebrand F, Falony G, Almeida M,
Arumugam M, Batto J-M, Kennedy S, et al. Richness of human gutmicrobiome correlates with metabolic markers. Nature. 2013;500:541–6.
3. Turnbaugh PJ, Hamady M, Yatsunenko T, Cantarel BL, Duncan A, Ley RE,Sogin ML, Jones WJ, Roe BA, Affourtit JP, et al. A core gut microbiome inobese and lean twins. Nature. 2009;457:480–4.
4. Sze MA, Schloss PD. Looking for a signal in the noise: revisiting obesity andthe microbiome. MBio. 2016;7:4 pii: e01018-16. https://doi.org/10.1128/mBio.01018-16
5. Clavel T, Desmarchelier C, Haller D, Gérard P, Rohn S, Lepage P, Daniel H.Intestinal microbiota in metabolic diseases: from bacterial communitystructure and functions to species of pathophysiological relevance. GutMicrobes. 2014;5:544–51.
6. Plovier H, Everard A, Druart C, Depommier C, van Hul M, Geurts L, ChillouxJ, Ottman N, Duparc T, Lichtenstein L, et al. A purified membrane proteinfrom Akkermansia muciniphila or the pasteurized bacterium improvesmetabolism in obese and diabetic mice. Nat Med. 2017;23:107–13.
7. Cani PD, Possemiers S, van de Wiele T, Guiot Y, Everard A, Rottier O, GeurtsL, Naslain D, Neyrinck A, Lambert DM, et al. Changes in gut microbiotacontrol inflammation in obese mice through a mechanism involving GLP-2-driven improvement of gut permeability. Gut. 2009;58:1091–103.
8. Fleissner CK, Huebel N, Abd El-Bary MM, Loh G, Klaus S, Blaut M. Absence ofintestinal microbiota does not protect mice from diet-induced obesity. Br JNutr. 2010;104:919–29.
9. Kübeck R, Bonet-Ripoll C, Hoffmann C, Walker A, Muller VM, Schuppel VL,Lagkouvardos I, Scholz B, Engel K-H, Daniel H, et al. Dietary fat and gutmicrobiota interactions determine diet-induced obesity in mice. Mol Metab.2016;5:1162–74.
10. Müller VM, Zietek T, Rohm F, Fiamoncini J, Lagkouvardos I, Haller D, Clavel T,Daniel H. Gut barrier impairment by high-fat diet in mice depends onhousing conditions. Mol Nutr Food Res. 2016;60:897–908.
11. Ridaura VK, Faith JJ, Rey FE, Cheng J, Duncan AE, Kau AL, Griffin NW,Lombard V, Henrissat B, Bain JR, et al. Gut microbiota from twins discordantfor obesity modulate metabolism in mice. Science (New York, NY). 2013;341:1241214.
12. Ussar S, Griffin NW, Bezy O, Fujisaka S, Vienberg S, Softic S, Deng L, Bry L,Gordon JI, Kahn CR. Interactions between gut microbiota, host genetics anddiet modulate the predisposition to obesity and metabolic syndrome. CellMetab. 2015;22:516–30.
13. Zhang L, Bahl MI, Roager HM, Fonvig CE, Hellgren LI, Frandsen HL, PedersenO, Holm JC, Hansen T, Licht TR. Environmental spread of microbes impactsthe development of metabolic phenotypes in mice transplanted withmicrobial communities from humans. ISME J. 2017;11:676–90.
14. Yutin N, Galperin MY. A genomic update on clostridial phylogeny: Gram-negative spore formers and other misplaced clostridia. Environ Microbiol.2013;15:2631–41.

Just et al. Microbiome (2018) 6:134 Page 17 of 18
15. Dao MC, Everard A, Aron-Wisnewsky J, Sokolovska N, Prifti E, Verger EO, KayserBD, Levenez F, Chilloux J, Hoyles L, et al. Akkermansia muciniphila andimproved metabolic health during a dietary intervention in obesity:relationship with gut microbiome richness and ecology. Gut. 2016;65:426–36.
16. Fei N, Zhao L. An opportunistic pathogen isolated from the gut of an obesehuman causes obesity in germfree mice. ISME J. 2013;7:880–4.
17. Goodrich JK, Waters JL, Poole AC, Sutter JL, Koren O, Blekhman R, BeaumontM, Van Treuren W, Knight R, Bell JT, et al. Human genetics shape the gutmicrobiome. Cell. 2014;159:789–99.
18. Pedersen HK, Gudmundsdottir V, Nielsen HB, Hyotylainen T, Nielsen T,Jensen BAH, Forslund K, Hildebrand F, Prifti E, Falony G, et al. Human gutmicrobes impact host serum metabolome and insulin sensitivity. Nature.2016;535:376–81.
19. Woting A, Pfeiffer N, Loh G, Klaus S, Blaut M. Clostridium ramosumpromotes high-fat diet-induced obesity in gnotobiotic mouse models. MBio.2014;5:e01530–14.
20. den Besten G, Bleeker A, Gerding A, van Eunen K, Havinga R, van Dijk TH,Oosterveer MH, Jonker JW, Groen AK, Reijngoud D-J, Bakker BM. Short-chain fattyacids protect against high-fat diet-induced obesity via a PPARgamma-dependentswitch from lipogenesis to fat oxidation. Diabetes. 2015;64:2398–408.
21. Dumas M-E, Barton RH, Toye A, Cloarec O, Blancher C, Rothwell A, FearnsideJ, Tatoud R, Blanc V, Lindon JC, et al. Metabolic profiling reveals acontribution of gut microbiota to fatty liver phenotype in insulin-resistantmice. Proc Natl Acad Sci U S A. 2006;103:12511–6.
22. Shah SH, Crosslin DR, Haynes CS, Nelson S, Turer CB, Stevens RD,Muehlbauer MJ, Wenner BR, Bain JR, Laferrere B, et al. Branched-chainamino acid levels are associated with improvement in insulin resistancewith weight loss. Diabetologia. 2012;55:321–30.
23. Neuschwander-Tetri BA, Loomba R, Sanyal AJ, Lavine JE, van Natta ML,Abdelmalek MF, Chalasani N, Dasarathy S, Diehl AM, Hameed B, et al.Farnesoid X nuclear receptor ligand obeticholic acid for non-cirrhotic, non-alcoholic steatohepatitis (FLINT): a multicentre, randomised, placebo-controlled trial. Lancet. 2015;385:956–65.
24. Perino A, Schoonjans K. TGR5 and immunometabolism: insights fromphysiology and pharmacology. Trends Pharmacol Sci. 2015;36:847–57.
25. Haeusler RA, Astiarraga B, Camastra S, Accili D, Ferrannini E. Human insulinresistance is associated with increased plasma levels of 12alpha-hydroxylated bile acids. Diabetes. 2013;62:4184–91.
26. Wewalka M, Patti M-E, Barbato C, Houten SM, Goldfine AB. Fasting serumtaurine-conjugated bile acids are elevated in type 2 diabetes and do notchange with intensification of insulin. J Clin Endocrinol Metab. 2014;99:1442–51.
27. Watanabe M, Houten SM, Mataki C, Christoffolete MA, Kim BW, Sato H,Messaddeq N, Harney JW, Ezaki O, Kodama T, et al. Bile acids induce energyexpenditure by promoting intracellular thyroid hormone activation. Nature.2006;439:484–9.
28. Watanabe M, Houten SM, Wang L, Moschetta A, Mangelsdorf DJ, HeymanRA, Moore DD, Auwerx J. Bile acids lower triglyceride levels via a pathwayinvolving FXR, SHP, and SREBP-1c. J Clin Investig. 2004;113:1408–18.
29. Gilat T, Leikin-Frenkel A, Goldiner I, Juhel C, Lafont H, Gobbi D, Konikoff FM.Prevention of diet-induced fatty liver in experimental animals by the oraladministration of a fatty acid bile acid conjugate (FABAC). Hepatology(Baltimore, Md). 2003;38:436–42.
30. Leikin-Frenkel A, Parini P, Konikoff FM, Benthin L, Leikin-Gobbi D, Goldiner I,Einarsson C, Gilat T. Hypocholesterolemic effects of fatty acid bile acidconjugates (FABACs) in mice. Arch Biochem Biophys. 2008;471:63–71.
31. Gonzales E, Gerhardt MF, Fabre M, Setchell KDR, Davit-Spraul A, Vincent I,Heubi JE, Bernard O, Jacquemin E. Oral cholic acid for hereditary defects ofprimary bile acid synthesis: a safe and effective long-term therapy.Gastroenterology. 2009;137:1310–1320.e1311–1313.
32. Sayin SI, Wahlström A, Felin J, Jäntti S, Marschall H-U, Bamberg K, Angelin B,Hyötyläinen T, Orešič M, Bäckhed F. Gut microbiota regulates bile acidmetabolism by reducing the levels of tauro-beta-muricholic acid, a naturallyoccurring FXR antagonist. Cell Metab. 2013;17:225–35.
33. Gérard P. Metabolism of cholesterol and bile acids by the gut microbiota.Pathogens. 2014;3:14–24.
34. Ridlon JM, Kang DJ, Hylemon PB. Bile salt biotransformations by humanintestinal bacteria. J Lipid Res. 2006;47:241–59.
35. Jones BV, Begley M, Hill C, Gahan CGM, Marchesi JR. Functional andcomparative metagenomic analysis of bile salt hydrolase activity in thehuman gut microbiome. Proc Natl Acad Sci U S A. 2008;105:13580–5.
36. Devlin AS, Fischbach MA. A biosynthetic pathway for a prominent class ofmicrobiota-derived bile acids. Nat Chem Biol. 2015;11:685–90.
37. Hill MJ, Drasar BS. Degradation of bile salts by human intestinal bacteria.Gut. 1968;9:22–7.
38. Wegner K, Just S, Gau L, Mueller H, Gerard P, Lepage P, Clavel T, Rohn S.Rapid analysis of bile acids in different biological matrices using LC-ESI-MS/MS for the investigation of bile acid transformation by mammalian gutbacteria. Anal Bioanal Chem. 2017;409(5):1231–45. https://doi.org/10.1007/s00216-016-0048-1
39. Begley M, Gahan CGM, Hill C. The interaction between bacteria and bile.FEMS Microbiol Rev. 2005;29:625–51.
40. Islam S, Fukiya S, Hagio M, Fujii N, Ishizuka S, Ooka T, Ogura Y, Hayashi T,Yokota A. Bile acid is a host factor that regulates the composition of thececal microbiota in rats. Gastroenterology. 2011;141:1773–81.
41. Zhang L, Xie C, Nichols RG, Chan SHJ, Jiang C, Hao R, Smith PB, Cai J,Simons MN, Hatzakis E, et al. Farnesoid X receptor signaling shapes the gutmicrobiota and controls hepatic lipid metabolism. mSystems. 2016;1(5): pii:e00070-16
42. Huang EY, Leone VA, Devkota S, Wang Y, Brady MJ, Chang EB. Compositionof dietary fat source shapes gut microbiota architecture and alters hostinflammatory mediators in mouse adipose tissue. JPEN J Parenter EnteralNutr. 2013;37:746–54.
43. Lovejoy JC, Smith SR, Champagne CM, Most MM, Lefevre M, DeLany JP,Denkins YM, Rood JC, Veldhuis J, Bray GA. Effects of diets enriched insaturated (palmitic), monounsaturated (oleic), or trans (elaidic) fatty acids oninsulin sensitivity and substrate oxidation in healthy adults. Diabetes Care.2002;25:1283–8.
44. Martínez I, Perdicaro DJ, Brown AW, Hammons S, Carden TJ, Carr TP,Eskridge KM, Walter J. Diet-induced alterations of host cholesterolmetabolism are likely to affect the gut microbiota composition in hamsters.Appl Environ Microbiol. 2013;79:516–24.
45. de Wit N, Derrien M, Bosch-Vermeulen H, Oosterink E, Keshtkar S, Duval C,Jd V-v d B, Kleerebezem M, Muller M, van der Meer R. Saturated fatstimulates obesity and hepatic steatosis and affects gut microbiotacomposition by an enhanced overflow of dietary fat to the distal intestine.Am J Physiol Gastrointest Liver Physiol. 2012;303:G589–99.
46. Le Roy T, Llopis M, Lepage P, Bruneau A, Rabot S, Bevilacqua C, Martin P,Philippe C, Walker F, Bado A, et al. Intestinal microbiota determinesdevelopment of non-alcoholic fatty liver disease in mice. Gut. 2013;62:1787–94.
47. Burt AD, Lackner C, Tiniakos DG. Diagnosis and assessment of NAFLD:definitions and histopathological classification. Semin Liver Dis. 2015;35:207–20.
48. Folch J, Lees M, Stanley GHS. A simple method for the isolation andpurification of total lipids from animal tissues. J Biol Chem 1957; 226:497–509.
49. Ecker J, Scherer M, Schmitz G, Liebisch G. A rapid GC-MS method forquantification of positional and geometric isomers of fatty acid methylesters. J Chrom B Anal Technol Biomed Life Sci. 2012;897:98–104.
50. Bligh EG, Dyer WJ. A rapid method of total lipid extraction and purification.Can J Biochem Physiol. 1959;37:911–7.
51. Ecker J, Liebisch G, Scherer M, Schmitz G. Differential effects of conjugatedlinoleic acid isomers on macrophage glycerophospholipid metabolism.J Lipid Res. 2010;51:2686–94.
52. Liebisch G, Lieser B, Rathenberg J, Drobnik W, Schmitz G. High-throughputquantification of phosphatidylcholine and sphingomyelin by electrosprayionization tandem mass spectrometry coupled with isotope correctionalgorithm. Biochim Biophys Acta. 2004;1686:108–17.
53. Brügger B, Erben G, Sandhoff R, Wieland FT, Lehmann WD. Quantitativeanalysis of biological membrane lipids at the low picomole level by nano-electrospray ionization tandem mass spectrometry. Proc Natl Acad Sci. 1997;94:2339–44.
54. Matyash V, Liebisch G, Kurzchalia TV, Shevchenko A, Schwudke D. Lipidextraction by methyl-tert-butyl ether for high-throughput lipidomics. J LipidRes. 2008;49:1137–46.
55. Zemski Berry KA, Murphy RC. Electrospray ionization tandem massspectrometry of glycerophosphoethanolamine plasmalogen phospholipids.J Am Soc Mass Spectrom. 2004;15:1499–508.
56. Liebisch G, Drobnik W, Reil M, Trümbach B, Arnecke R, Olgemöller B,Roscher A, Schmitz G. Quantitative measurement of different ceramidespecies from crude cellular extracts by electrospray ionization tandem massspectrometry (ESI-MS/MS). J Lipid Res. 1999;40:1539–46.
57. Liebisch G, Binder M, Schifferer R, Langmann T, Schulz B, Schmitz G. Highthroughput quantification of cholesterol and cholesteryl ester by
Just et al. Microbiome (2018) 6:134 Page 18 of 18
electrospray ionization tandem mass spectrometry (ESI-MS/MS). BiochimBiophys Acta. 2006;1761:121–8.
58. Liebisch G, Vizcaíno JA, Köfeler H, Trötzmüller M, Griffiths WJ, Schmitz G,Spener F, Wakelam MJO. Shorthand notation for lipid structures derivedfrom mass spectrometry. J Lipid Res. 2013;54:1523–30.
59. Han J, Lin K, Sequeira C, Borchers CH. An isotope-labeled chemicalderivatization method for the quantitation of short-chain fatty acids inhuman feces by liquid chromatography-tandem mass spectrometry. AnalChim Acta. 2015;854:86–94.
60. Godon JJ, Zumstein E, Dabert P, Habouzit F, Moletta R. Molecular microbialdiversity of an anaerobic digestor as determined by small-subunit rDNAsequence analysis. Appl Environ Microbiol. 1997;63:2802–13.
61. Suzuki MT, Giovannoni SJ. Bias caused by template annealing in theamplification of mixtures of 16S rRNA genes by PCR. Appl EnvironMicrobiol. 1996;62:625–30.
62. Berry D, Ben Mahfoudh K, Wagner M, Loy A. Barcoded primers used inmultiplex amplicon pyrosequencing bias amplification. Appl EnvironMicrobiol. 2011;77:7846–9.
63. Klindworth A, Pruesse E, Schweer T, Peplies J, Quast C, Horn M, Glöckner FO.Evaluation of general 16S ribosomal RNA gene PCR primers for classical andnext-generation sequencing-based diversity studies. Nucleic Acids Res. 2013;41:e1.
64. Bartram J, Mountjoy E, Brooks T, Hancock J, Williamson H, Wright G,Moppett J, Goulden N, Hubank M. Accurate sample assignment in amultiplexed, ultrasensitive, high-throughput sequencing assay for minimalresidual disease. J Mol Diagn JMD. 2016;18:494–506.
65. Kozich JJ, Westcott SL, Baxter NT, Highlander SK, Schloss PD. Developmentof a dual-index sequencing strategy and curation pipeline for analyzingamplicon sequence data on the MiSeq Illumina sequencing platform. ApplEnviron Microbiol. 2013;79:5112–20.
66. Lagkouvardos I, Kläring K, Heinzmann SS, Platz S, Scholz B, Engel KH,Schmitt-Kopplin P, Haller D, Rohn S, Skurk T, Clavel T. Gut metabolites andbacterial community networks during a pilot intervention study withflaxseeds in healthy adult men. Mol Nutr Food Res. 2015;59(8):1614–28.https://doi.org/10.1002/mnfr.201500125
67. Lagkouvardos I, Joseph D, Kapfhammer M, Giritli S, Horn M, Haller D, ClavelT. IMNGS: a comprehensive open resource of processed 16S rRNA microbialprofiles for ecology and diversity studies. Sci Rep. 2016;6:33721.
68. Edgar RC. UPARSE: highly accurate OTU sequences from microbial ampliconreads. Nat Methods. 2013;10:996–8.
69. Quast C, Pruesse E, Yilmaz P, Gerken J, Schweer T, Yarza P, Peplies J,Glöckner FO. The SILVA ribosomal RNA gene database project: improveddata processing and web-based tools. Nucleic Acids Res. 2013;41:D590–6.
70. Wang Q, Garrity GM, Tiedje JM, Cole JR. Naive Bayesian classifier for rapidassignment of rRNA sequences into the new bacterial taxonomy. ApplEnviron Microbiol. 2007;73:5261–7.
71. Kopylova E, Noe L, Touzet H. SortMeRNA: fast and accurate filtering ofribosomal RNAs in metatranscriptomic data. Bioinformatics (Oxford,England). 2012;28:3211–7.
72. Xiao L, Feng Q, Liang S, Sonne SB, Xia Z, Qiu X, Li X, Long H, Zhang J,Zhang D, et al. A catalog of the mouse gut metagenome. Nat Biotechnol.2015;33:1103–8.
73. Li H, Durbin R. Fast and accurate short read alignment with Burrows-Wheeler transform. Bioinformatics (Oxford, England). 2009;25:1754–60.
74. Love MI, Huber W, Anders S. Moderated estimation of fold change anddispersion for RNA-seq data with DESeq2. Genome Biol. 2014;15:550.
75. Lagkouvardos I, Fischer S, Kumar N, Clavel T. Rhea: a transparent andmodular R pipeline for microbial profiling based on 16S rRNA geneamplicons. PeerJ. 2017;5:e2836.
76. Chun J, Lee J-H, Jung Y, Kim M, Kim S, Kim BK, Lim Y-W. EzTaxon: a web-based tool for the identification of prokaryotes based on 16S ribosomalRNA gene sequences. Int J Syst Evol Microbiol. 2007;57:2259–61.
77. Bäckhed F, Ding H, Wang T, Hooper LV, Koh GY, Nagy A, Semenkovich CF,Gordon JI. The gut microbiota as an environmental factor that regulates fatstorage. Proc Natl Acad Sci U S A. 2004;101:15718–23.
78. Zheng X, Huang F, Zhao A, Lei S, Zhang Y, Xie G, Chen T, Qu C, Rajani C,Dong B, et al. Bile acid is a significant host factor shaping the gutmicrobiome of diet-induced obese mice. BMC Biol. 2017;15:120.
79. Clavel T, Lagkouvardos I, Blaut M, Stecher B. The mouse gut microbiomerevisited: from complex diversity to model ecosystems. Int J Med Microbiol.2016;306:316–27.
80. Rosshart SP, Vassallo BG, Angeletti D, Hutchinson DS, Morgan AP, Takeda K,Hickman HD, McCulloch JA, Badger JH, Ajami NJ, et al. Wild mouse gutmicrobiota promotes host fitness and improves disease resistance. Cell.2017;171:1015–1028 e1013.
81. Ridlon JM, Alves JM, Hylemon PB, Bajaj JS. Cirrhosis, bile acids and gutmicrobiota: unraveling a complex relationship. Gut Microbes. 2013;4:382–7.
82. Hildebrandt MA, Hoffmann C, Sherrill-Mix SA, Keilbaugh SA, Hamady M,Chen Y-Y, Knight R, Ahima RS, Bushman F, Wu GD. High-fat diet determinesthe composition of the murine gut microbiome independently of obesity.Gastroenterology. 2009;137:1716–1724.e1711–1712.
83. Zhang C, Zhang M, Pang X, Zhao Y, Wang L, Zhao L. Structural resilience ofthe gut microbiota in adult mice under high-fat dietary perturbations. ISMEJ. 2012;6:1848–57.
84. Zietek T, Daniel H. Intestinal nutrient sensing and blood glucose control.Curr Opin Clin Nutr Metab Care. 2015;18:381–8.
85. Aranias T, Grosfeld A, Poitou C, Omar AA, Le Gall M, Miquel S, Garbin K,Ribeiro A, Bouillot JL, Bado A, et al. Lipid-rich diet enhances L-cell density inobese subjects and in mice through improved L-cell differentiation. J NutrSci. 2015;4:e22.
86. Beyaz S, Mana MD, Roper J, Kedrin D, Saadatpour A, Hong SJ, Bauer-RoweKE, Xifaras ME, Akkad A, Arias E, et al. High-fat diet enhances stemness andtumorigenicity of intestinal progenitors. Nature. 2016;531:53–8.
87. Caesar R, Nygren H, Oresic M, Backhed F. Interaction between dietary lipidsand gut microbiota regulates hepatic cholesterol metabolism. J Lipid Res.2016;57:474–81.
88. Eisinger K, Krautbauer S, Hebel T, Schmitz G, Aslanidis C, Liebisch G, Buechler C.Lipidomic analysis of the liver from high-fat diet induced obese mice identifieschanges in multiple lipid classes. Exp Mol Pathol. 2014;97:37–43.
89. Pfeiffer N, Desmarchelier C, Blaut M, Daniel H, Haller D, Clavel T.Acetatifactor muris gen. nov., sp. nov., a novel bacterium isolated from theintestine of an obese mouse. Arch Microbiol. 2012;194:901–7.
90. van der Wielen PW, Rovers GM, Scheepens JM, Biesterveld S. Clostridiumlactatifermen tans sp. nov., a lactate-fermenting anaerobe isolated from thecaeca of a chicken. Int J Syst Evol Microbiol. 2002;52:921–5.
91. Lagkouvardos I, Pukall R, Abt B, Foesel BU, Meier-Kolthoff JP, Kumar N,Bresciani A, Martinez I, Just S, Ziegler C, et al. The Mouse Intestinal BacterialCollection (miBC) provides host-specific insight into cultured diversity andfunctional potential of the gut microbiota. Nat Microbiol. 2016;1:16131.
92. Daniel H, Gholami AM, Berry D, Desmarchelier C, Hahne H, Loh G, MondotS, Lepage P, Rothballer M, Walker A, et al. High-fat diet alters gut microbiotaphysiology in mice. ISME J. 2014;8:295–308.
93. Dean JM, Lodhi IJ. Structural and functional roles of ether lipids. Protein Cell.2018;9(2):196–206. https://doi.org/10.1007/s13238-017-0423-5
94. Dugail I, Quignard-Boulange A, Bazin R, Le Liepvre X, Lavau M. Adipose-tissue-specific increase in glyceraldehyde-3-phosphate dehydrogenaseactivity and mRNA amounts in suckling pre-obese Zucker rats. Effect ofweaning. Biochem J. 1988;254:483–7.
95. Rolland V, Dugail I, Le Liepvre X, Lavau M. Evidence of increasedglyceraldehyde-3-phosphate dehydrogenase and fatty acid synthetasepromoter activities in transiently transfected adipocytes from geneticallyobese rats. J Biol Chem. 1995;270:1102–6.