Embed Size (px)
Citation preview

The Healthy Eating Index: 1994-96
Bowman, S.A., Lino, M., Gerrior, S.A., Basiotis, P.P. 1998. The Healthy EatingIndex: 1994-96. U.S. Department of Agriculture, Center for Nutrition Policyand Promotion. CNPP-5.
Abstract
To assess and monitor the dietary status of Americans, the United States Departmentof Agriculture’s (USDA) Center for Nutrition Policy and Promotion developed theHealthy Eating Index (HEI). The HEI is composed of 10 components, each repre-senting different aspects of a healthful diet: Components 1-5 measure the degree towhich a person’s diet conforms to USDA’s Food Guide Pyramid serving recommen-dations for the five major food groups (grains, vegetables, fruits, milk, and meat);Components 6 and 7 measure total fat and saturated fat consumption as a percentageof total food energy intake; Components 8 and 9 measure total cholesterol and sodium intake; and Component 10 examines variety in a person’s diet. The HEI was computed for people 2 years of age and over and subgroups of the populationusing data from the 1994-96 Continuing Survey of Food Intakes by Individuals.Most people have a diet that needs improvement. Approximately 12 percent of thepopulation have a good diet, and 18 percent of people have a poor diet. Americans especially need to improve their fruit and milk products consumption. Males age 15to 18, in particular, tend to have lower quality diets. African Americans, people withlow income, and those with a high school diploma or less education also have lowerquality diets. These findings provide an awareness and better understanding of thetypes of dietary changes needed to improve people’s eating patterns.
July 1998
USDA prohibits discrimination in all its programs and activities on the basis of race, color, nationalorigin, gender, religion, age, disability, political beliefs, sexual orientation, or marital or familystatus. (Not all prohibited bases apply to all programs.) Persons with disabilities who require alterna-tive means for communication of program information (Braille, large print, audiotape, etc.) shouldcontact USDA’s TARGET Center at (202) 720-2600 (voice and TDD).
To file a complaint of discrimination, write USDA, Director, Office of Civil Rights, Room 326W,Whitten Building, 14th and Independence Avenue, SW, Washington, DC 20250-9410 or call(202) 720-5964 (voice and TDD). USDA is an equal opportunity provider and employer.
The HealthyEating Index
1994-96
Shanthy A. Bowman, Ph.D.Mark Lino, Ph.D.
Shirley A. Gerrior, Ph.D.P. Peter Basiotis, Ph.D.
United States Department of AgricultureCenter for Nutrition Policy and Promotion
CNPP-5

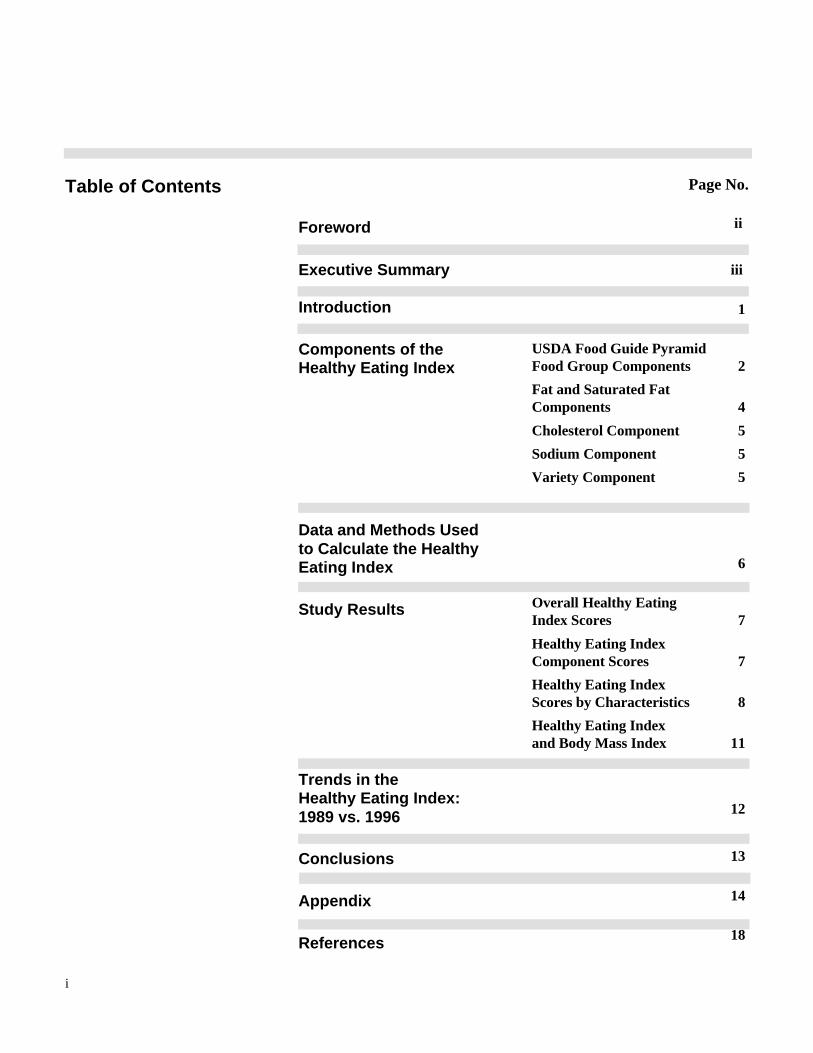
Table of Contents
Foreword
Executive Summary
Introduction
Components of the Healthy Eating Index
Data and Methods Usedto Calculate the HealthyEating Index
Study Results
Trends in the Healthy Eating Index:1989 vs. 1996
Conclusions
Appendix
References
Page No. ii
iii
1
USDA Food Guide PyramidFood Group Components 2
Fat and Saturated FatComponents 4
Cholesterol Component 5
Sodium Component 5
Variety Component 5
6
Overall Healthy EatingIndex Scores 7
Healthy Eating IndexComponent Scores 7
Healthy Eating IndexScores by Characteristics 8
Healthy Eating Index and Body Mass Index 11
12
13
14
18
i
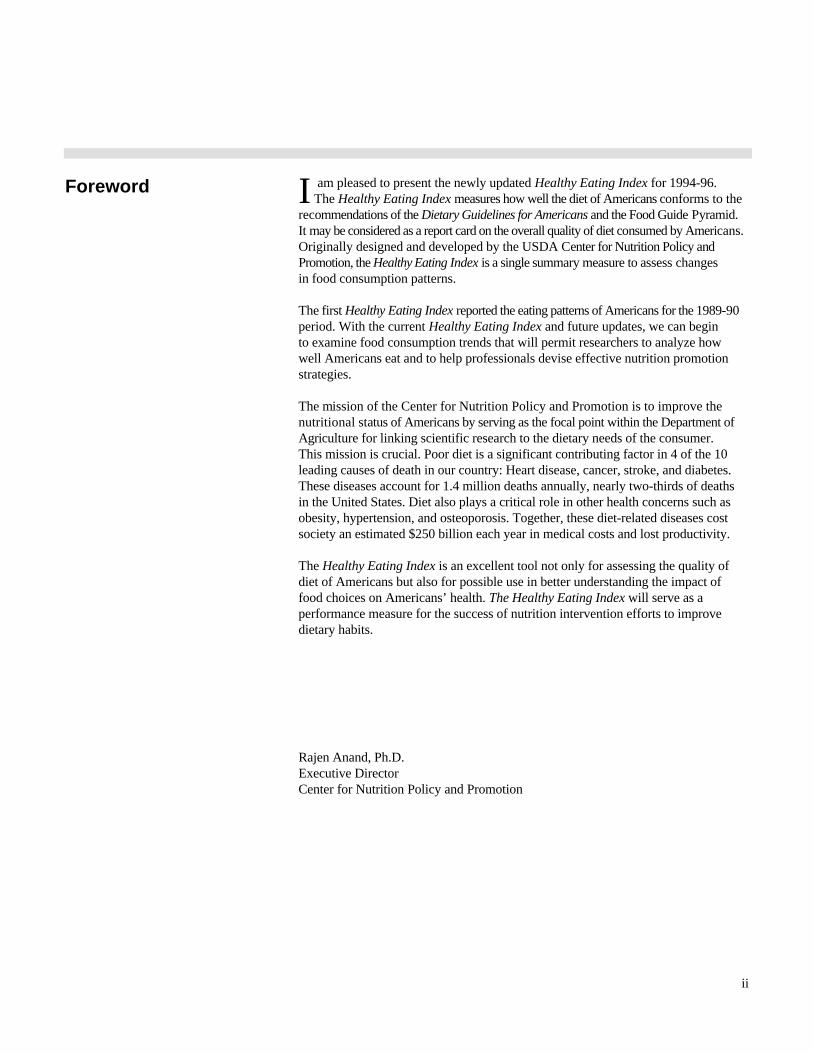
Foreword I am pleased to present the newly updated Healthy Eating Index for 1994-96. The Healthy Eating Index measures how well the diet of Americans conforms to the
recommendations of the Dietary Guidelines for Americans and the Food Guide Pyramid.It may be considered as a report card on the overall quality of diet consumed by Americans.Originally designed and developed by the USDA Center for Nutrition Policy and Promotion, the Healthy Eating Index is a single summary measure to assess changes in food consumption patterns.
The first Healthy Eating Index reported the eating patterns of Americans for the 1989-90period. With the current Healthy Eating Index and future updates, we can begin to examine food consumption trends that will permit researchers to analyze howwell Americans eat and to help professionals devise effective nutrition promotionstrategies.
The mission of the Center for Nutrition Policy and Promotion is to improve the nutritional status of Americans by serving as the focal point within the Department of Agriculture for linking scientific research to the dietary needs of the consumer. This mission is crucial. Poor diet is a significant contributing factor in 4 of the 10leading causes of death in our country: Heart disease, cancer, stroke, and diabetes.These diseases account for 1.4 million deaths annually, nearly two-thirds of deathsin the United States. Diet also plays a critical role in other health concerns such asobesity, hypertension, and osteoporosis. Together, these diet-related diseases cost society an estimated $250 billion each year in medical costs and lost productivity.
The Healthy Eating Index is an excellent tool not only for assessing the quality ofdiet of Americans but also for possible use in better understanding the impact of food choices on Americans’ health. The Healthy Eating Index will serve as a performance measure for the success of nutrition intervention efforts to improve dietary habits.
Rajen Anand, Ph.D.Executive DirectorCenter for Nutrition Policy and Promotion
ii
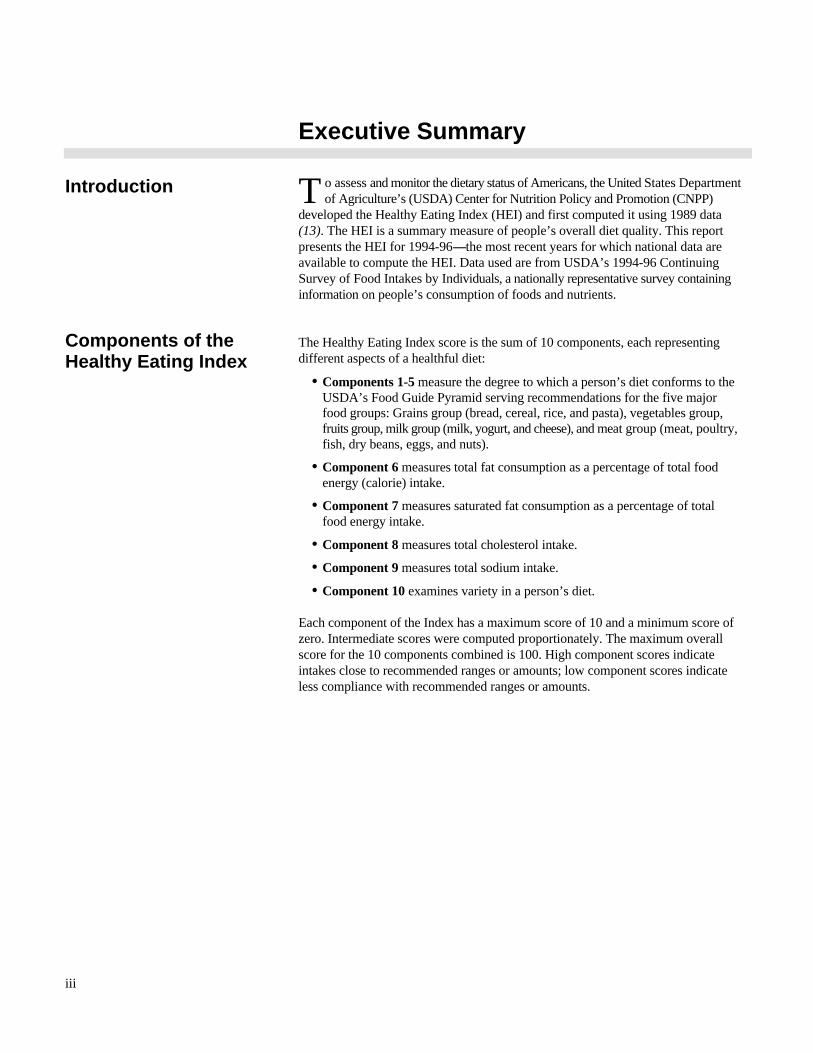
Introduction
Components of theHealthy Eating Index
T o assess and monitor the dietary status of Americans, the United States Department of Agriculture’s (USDA) Center for Nutrition Policy and Promotion (CNPP)
developed the Healthy Eating Index (HEI) and first computed it using 1989 data(13). The HEI is a summary measure of people’s overall diet quality. This report presents the HEI for 1994-96----the most recent years for which national data areavailable to compute the HEI. Data used are from USDA’s 1994-96 Continuing Survey of Food Intakes by Individuals, a nationally representative survey containing information on people’s consumption of foods and nutrients.
The Healthy Eating Index score is the sum of 10 components, each representing different aspects of a healthful diet:
• Components 1-5 measure the degree to which a person’s diet conforms to theUSDA’s Food Guide Pyramid serving recommendations for the five major food groups: Grains group (bread, cereal, rice, and pasta), vegetables group,fruits group, milk group (milk, yogurt, and cheese), and meat group (meat, poultry,fish, dry beans, eggs, and nuts).
• Component 6 measures total fat consumption as a percentage of total food energy (calorie) intake.
• Component 7 measures saturated fat consumption as a percentage of total food energy intake.
• Component 8 measures total cholesterol intake.
• Component 9 measures total sodium intake.
• Component 10 examines variety in a person’s diet.
Each component of the Index has a maximum score of 10 and a minimum score ofzero. Intermediate scores were computed proportionately. The maximum overallscore for the 10 components combined is 100. High component scores indicate intakes close to recommended ranges or amounts; low component scores indicateless compliance with recommended ranges or amounts.
Executive Summary
iii

Findings Overall HEI ScoreThe mean HEI score is 63.6 for 1994, 63.5 for 1995, and 63.8 for 1996 (table ES-1).An HEI score over 80 implies a ‘‘good’’ diet, an HEI score between 51 and 80 implies a diet that ‘‘needs improvement,’’ and an HEI score less than 51 implies a ‘‘poor’’diet. Between 1994 and 1996, the diets of most people (70 percent) were in the‘‘needs improvement’’ range. Approximately 12 percent of the population had agood diet, and 18 percent had a poor diet.
Table ES-1. Healthy Eating Index: Overall and componentmean scores, 1994-96
Year
1994 1995 1996 1994-96
Overall 63.6 63.5 63.8 63.6
Components
Grains 6.6 6.7 6.7 6.7
Vegetables 6.1 6.2 6.3 6.2
Fruits 3.9 3.9 3.8 3.9
Milk 5.4 5.4 5.4 5.4
Meat 6.6 6.5 6.4 6.5
Total fat 6.8 6.8 6.9 6.8
Saturated fat 6.4 6.3 6.4 6.4
Cholesterol 7.9 7.7 7.9 7.8
Sodium 6.3 6.3 6.3 6.3
Variety 7.7 7.6 7.6 7.6
Note: The overall HEI score ranges from 0-100. An HEI score over 80 implies a "good" diet,an HEI score between 51 and 80 implies a diet that "needs improvement," and an HEIscore less than 51 implies a "poor" diet. HEI component scores range from 0-10. Highcomponent scores indicate intakes close to recommended ranges or amounts; lowcomponent scores indicate less compliance with recommended ranges or amounts.
iv
HEI Component ScoresOver the 1994-96 period, mean HEI component scores for the U.S. populationwere highest for cholesterol. The cholesterol score averaged 7.8 on a scale of zeroto 10. With an average score of 7.6, the variety score was the second highest. Thefruits component of the HEI had the lowest mean score (3.9), and the milk compo-nent accounted for the second lowest score (5.4). For the other HEI components, average scores were generally between 6 and 7 for the population. Overall, 71 percent of people had a maximum score of 10 for cholesterol----that is, they met thedietary recommendation. Fifty-two percent had a maximum score for variety overthe 3 years. For the other HEI components, only 17 to 40 percent of the populationmet the dietary recommendations on a given day
HEI Scores by Selected CharacteristicsHEI scores varied by demographic and socioeconomic characteristics. Over the1994-96 period, females had an average HEI score about one point higher thanthat of males (64 vs. 63). Children age 2 to 3 had the highest average HEI score(74) among all age/gender groups, and as children aged, their HEI scores declined.
HEI scores generally increased as the level of income and education increased.People with household income 50 percent of the poverty threshold or below hadan average HEI score of 60. By comparison, people with household income overthree times the poverty threshold had an average HEI score of 65. Whites had ahigher average HEI score than African Americans had for 1994-96 (64 vs. 59). Byregion, people who lived in the Northeast had the highest HEI score, an average of65 for 1994-96, and those who lived in the South had the lowest score, an averageof 62.
HEI: 1989 vs. 1996 The diets of Americans have slightly, but significantly, improved since 1989. However, people’s diets need further improvement. In 1989, the HEI score for allpeople 2 years of age and over was 61.5 compared with 63.8 in 1996----a 4-percentincrease. Between 1989 and 1996, the Federal Government introduced nutritioneducation initiatives, such as the Food Guide Pyramid, the Nutrition Labeling andEducation Act, and the revised Dietary Guidelines for Americans, which may havecontributed to this increase. Scores increased for all HEI components from 1989 to1996, except for milk, meat, and sodium. Scores improved the most for the satu-rated fat and variety components of the Index.
v

S ome recent reports have indicated that in 4 of the 10 leading causes of
death in the United States (cardiovasculardisease, certain types of cancer, stroke,and diabetes) diet and lack of physicalactivity are significant contributing factors(4,11). It has been well documented thata healthful diet reduces the risk of chronicdiseases such as cardiovascular diseaseand certain forms of cancer (7,16). Astudy using a healthy diet indicator, basedon the World Health Organization’s dietaryrecommendations, found that mortalitywas lowest in people with the healthiestdiets (5). Major improvements in thehealth of the American public can, there-fore, be made by improving people’sdietary patterns.
To assess the dietary status of Americansand monitor changes in these patterns,the U.S. Department of Agriculture’s(USDA) Center for Nutrition Policy andPromotion (CNPP) developed the HealthyEating Index (HEI), based on the work ofKennedy et al. (6), and first computedthe Index using 1989 data. The HEI is a
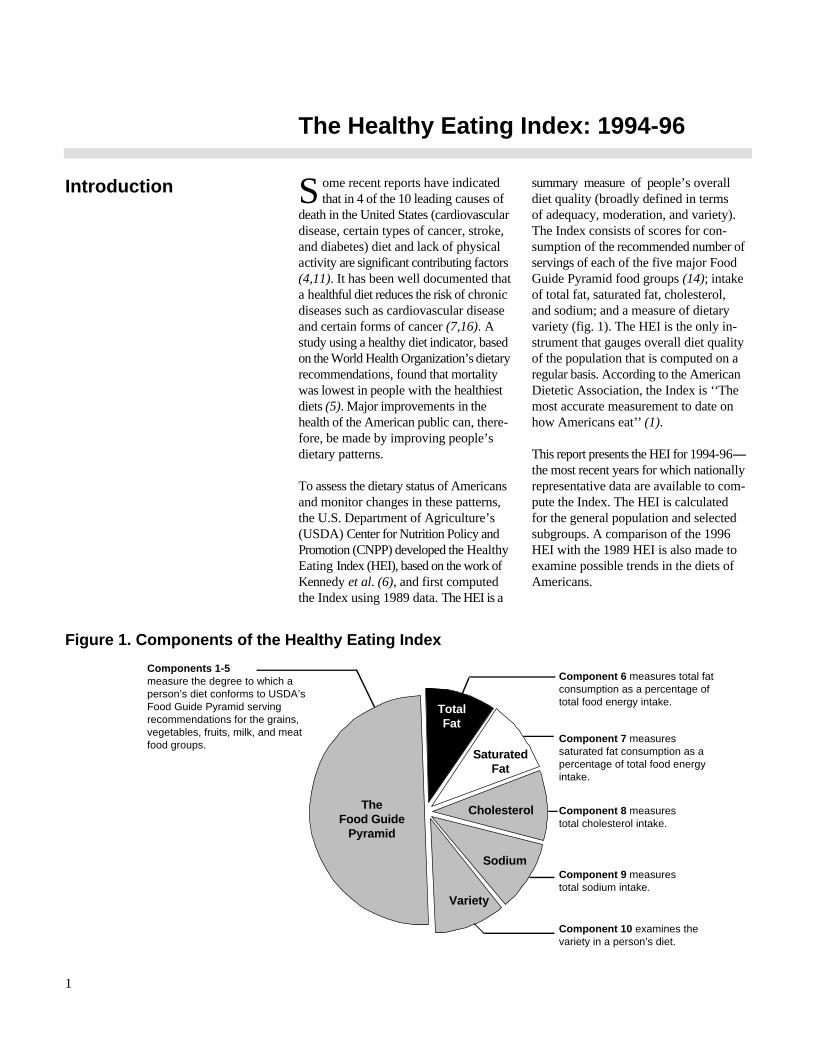
summary measure of people’s overalldiet quality (broadly defined in terms of adequacy, moderation, and variety). The Index consists of scores for con-sumption of the recommended number ofservings of each of the five major FoodGuide Pyramid food groups (14); intakeof total fat, saturated fat, cholesterol,and sodium; and a measure of dietaryvariety (fig. 1). The HEI is the only in-strument that gauges overall diet qualityof the population that is computed on aregular basis. According to the AmericanDietetic Association, the Index is ‘‘Themost accurate measurement to date onhow Americans eat’’ (1).
This report presents the HEI for 1994-96----the most recent years for which nationallyrepresentative data are available to com-pute the Index. The HEI is calculatedfor the general population and selectedsubgroups. A comparison of the 1996HEI with the 1989 HEI is also made toexamine possible trends in the diets ofAmericans.
Introduction
The Healthy Eating Index: 1994-96
Figure 1. Components of the Healthy Eating Index
Components 1-5measure the degree to which a person’s diet conforms to USDA’sFood Guide Pyramid serving recommendations for the grains,vegetables, fruits, milk, and meatfood groups.
TheFood Guide
Pyramid
Component 6 measures total fatconsumption as a percentage oftotal food energy intake.
Component 7 measuressaturated fat consumption as apercentage of total food energy intake.
Component 8 measurestotal cholesterol intake.
Component 9 measurestotal sodium intake.
Component 10 examines the variety in a person’s diet.
TotalFat
SaturatedFat
Cholesterol
Sodium
Variety
1
T he Healthy Eating Index provides an overall picture of the type and
quantity of foods people eat, their com-pliance with specific dietary recommen-dations, and the variety in their diets.The total Index score is the sum of 10dietary components, weighted equally.Each component of the Index has a maxi-mum score of 10 and a minimum scoreof zero (table 1). The maximum overallHEI score is 100. High component scoresindicate intakes close to the recommendedranges or amounts; low component scoresindicate less compliance with the recom-mended ranges or amounts. The 10 components represent various aspects of a healthful diet. These componentsare
• Components 1-5 measure the degree to which a person’s diet conforms to the USDA Food GuidePyramid serving recommendationsfor the five major food groups:Grains group (bread, cereal, rice,and pasta), vegetables group, fruitsgroup, milk group (milk, yogurt,and cheese), and meat group (meat,poultry, fish, dry beans, eggs, andnuts).
• Component 6 measures total fatconsumption as a percentage of total food energy (calorie) intake.
• Component 7 measures saturatedfat consumption as a percentage of total food energy intake.
• Component 8 measures total cholesterol intake.
• Component 9 measures total sodium intake.
• Component 10 examines the variety in a person’s diet.
USDA Food Guide PyramidFood Group ComponentsThe USDA Food Guide Pyramid trans-lates recommendations from the DietaryGuidelines for Americans (15) intotypes and amounts of foods people caneat to achieve a healthful diet. The HEIexamines dietary intake in relation toservings of the five major groups in theFood Guide Pyramid: Grains, vegetables,fruits, milk, and meat. The recommendednumber of servings depends on a person’scaloric requirement. Table 2 shows therecommended number of servings forthe five groups for different age/gendergroups and for caloric levels of 1600,2200, and 2800.
A maximum score of 10 was assignedto each of the five food group compo-nents of the Index if a person’s diet metor exceeded the recommended number ofservings for a food group, as indicated intable 2, p. 4. For example, if a person’sdiet met the fruits group serving recom-mendations, then that person’s diet wasawarded 10 points. For each of the fivemajor food groups, a score of zero wasassigned to the respective components if a person did not consume any itemfrom the food group. Intermediate scoreswere computed proportionately to thenumber of servings consumed. For example, if the serving recommendationfor a food group was eight and a personconsumed four servings, the componentscore was 5 points. Similarly, if six servings were consumed, a score of 7.5 was assigned.
Components of theHealthy Eating Index
2
In developing the Index, the researchersused serving recommendations from theFood Guide Pyramid for 1600, 2200,and 2800 kilocalories as the basis to interpolate serving recommendations forpeople with other food energy recommen-dations. The Recommended Energy Allowance (REA) (8) for children 2 to 3years of age is less than 1600 kilocalories.The recommended number of servingswas kept at the minimum serving levelfor these children, but the serving size
was scaled downward to be proportionatewith their food energy recommendations.This approach is consistent with FoodGuide Pyramid guidance. In contrast,adult males 15 to 50 years old have an REAslightly greater than 2800 kilocalories(8). Since the Food Guide Pyramid doesnot specify additional food group servingsfor caloric levels above 2800 kilocalories,researchers decided that food portionsfor these individuals would be truncatedat the maximum levels recommended in
the Food Guide Pyramid. The Appendixincludes more details on determinationof Food Guide Pyramid serving defini-tions, estimation of food group servingrequirements by age and gender, and design alternatives.
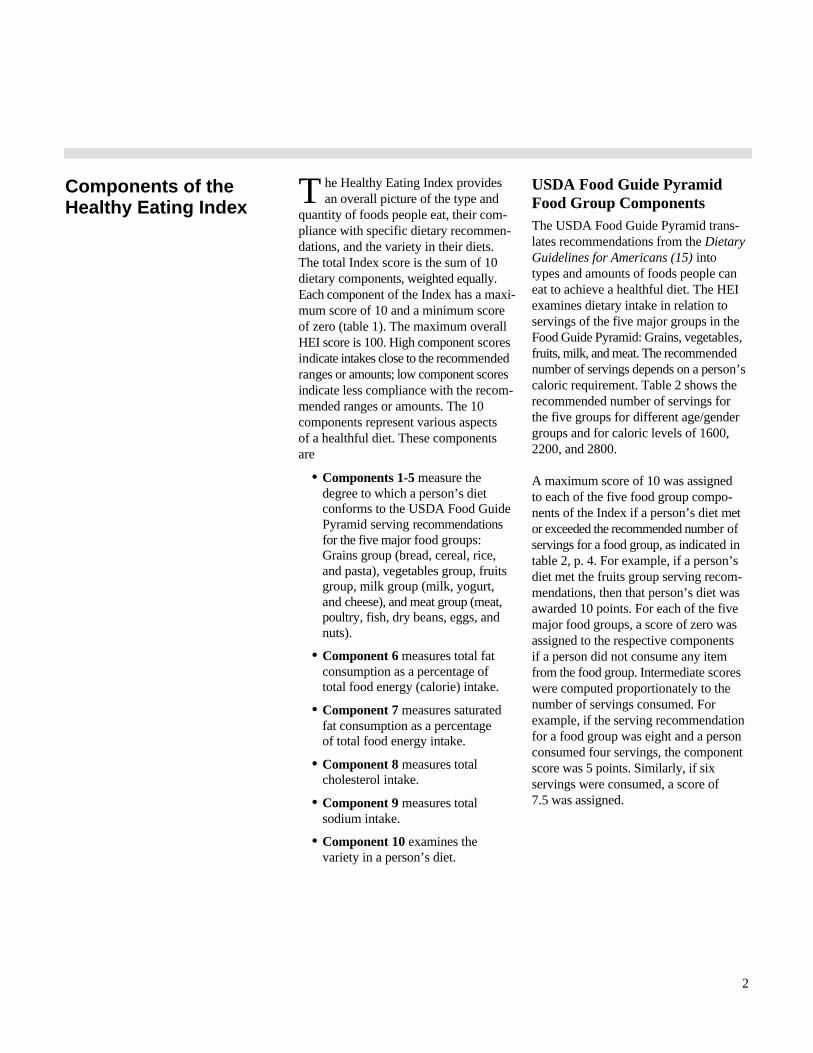
Table 1. Components of the Healthy Eating Index and scoring system
Score Ranges1Criteria for Maximum
Score of 10Criteria for Minimum
Score of 0
Grain consumption 0 to 10 6 - 11 servings2 0 servings
Vegetable consumption 0 to 10 3 - 5 servings2 0 servings
Fruit consumption 0 to 10 2 - 4 servings2 0 servings
Milk consumption 0 to 10 2 - 3 servings2 0 servings
Meat consumption 0 to 10 2 - 3 servings2 0 servings
Total fat intake 0 to 10 30% or less energy fromfat
45% or more energy fromfat
Saturated fat intake 0 to 10 Less than 10% energyfrom saturated fat
15% or more energy fromsaturated fat
Cholesterol intake 0 to 10 300 mg or less 450 mg or more
Sodium intake 0 to 10 2400 mg or less 4800 mg or more
Food variety 0 to 10 8 or more different itemsin a day
3 or fewer different itemsin a day
1People with consumption or intakes between the maximum and minimum ranges or amounts were assigned scores proportionately.2Number of servings depends on Recommended Energy Allowance----see table 2. All amounts are on a per day basis.
3

Fat and Saturated Fat ComponentsIndex scores for fat and saturated fat intakes were examined in proportion tototal food energy expressed as kilocalories.Total fat intake of less than or equal to30 percent of total calories in a day wasassigned a maximum score of 10 points.This percentage is based on the 1995recommendations of the Dietary Guide-lines for Americans. Fat intake equal to
or greater than 45 percent of total caloriesin a day, was assigned a score of zero. Intake of fat between 30 and 45 percentwas scored proportionately.
Saturated fat intake of less than 10 percentof total calories in a day was assigned amaximum score of 10 points. This per-centage is also based on the 1995 recom-mendations of the Dietary Guidelinesfor Americans. Saturated fat intake equalto or greater than 15 percent of total
calories in a day, was assigned a score of zero. Intake of saturated fat between10 and 15 percent was scored propor-tionately. The upper limit percentagesfor fat (45 percent) and saturated fat (15 percent) were based on consultationwith nutrition researchers and explora-tion of the consumption distribution ofthese components.
Table 2. Recommended number of USDA Food Guide Pyramid servings per day, byage/gender categories
Age/gender category
Energy(kilocalories) Grains Vegetables Fruits Milk Meat1
Children 2-32 1300 6 3 2 2 2
† 1600 6 3 2 2 2
Children 4-6 1800 7 3.3 2.3 2 2.1
Females 51+ 1900 7.4 3.5 2.5 2 2.2
Children 7-10 2000 7.8 3.7 2.7 2 2.3
Females 11-24 2200 9 4 3 3 2.4
† 2200 9 4 3 2 2.4
Females 25-50 2200 9 4 3 2 2.4
Males 51+ 2300 9.1 4.2 3.2 2 2.5
Males 11-14 2500 9.9 4.5 3.5 3 2.6
† 2800 11 5 4 2 2.8
Males 19-24 2900 11 5 4 3 2.8
Males 25-50 2900 11 5 4 2 2.8
Males 15-18 3000 11 5 4 3 2.8
1One serving of meat equals 2.5 ounces of lean meat.2Portion sizes were reduced to two-thirds of adult servings except for milk for children age 2-3.† Recommended number of servings per day at food energy levels specified in the Food Guide Pyramid (14).
4

Cholesterol ComponentThe score for cholesterol was based onthe amount consumed in milligrams. Ascore of 10 points was assigned whendaily cholesterol intake was 300 milli-grams or less. This amount is based onrecommendations of the Committee onDiet and Health of the National ResearchCouncil and represents a consensus ofexperts in foods and nutrition, medicine,epidemiology, public health, and relatedfields (7). A score of zero was assignedwhen daily intake reached a level of450 milligrams or more. Intake between300 and 450 milligrams was scored pro-portionately. The upper limit amount for cholesterol intake was based on consultation with nutrition researchersand exploration of the consumption distribution of this component.
Sodium ComponentThe score for sodium was based on theamount consumed in milligrams per day.A score of 10 points was assigned whendaily sodium intake was 2400 milligramsor less, the amount based on recommen-dations of the Committee on Diet andHealth of the National Research Council(7). A daily intake of 4800 milligramsor more received zero points. Intake between 2400 and 4800 milligrams wasscored proportionately. The upper limitamount for sodium intake was based onconsultation with nutrition researchersand exploration of the consumption distribution of this component.
Variety ComponentThe Dietary Guidelines, the Food GuidePyramid, and the National ResearchCouncil’s diet and health report all stressthe importance of variety in a diet (3,7,14).There is no consensus, however, on howto quantify variety. Dietary variety was assessed by totaling the number of different foods that a person ate in aday in amounts sufficient to contributeat least one-half of a serving in a foodgroup. Food mixtures were disaggregatedinto their food ingredients and assignedto the appropriate food category. Foodsthat differed only by preparation methodwere grouped together and counted asone type of food. For example, baked,fried, or boiled potatoes were countedonce. Different types of a food weregrouped separately. For example, eachtype of fish----mackerel, tuna, andtrout----was considered to be a differentfood.
A maximum variety score of 10 pointswas assigned if a person consumed atleast half a serving each of 8 or moredifferent kinds of foods in a day. Ascore of zero was assigned if 3 or fewerdifferent foods were consumed by a per-son in a day. Intermediate scores werecomputed proportionately. These upperand lower limit amounts to gauge foodvariety were based on consultation withnutrition researchers. The Appendix includes more detail on the coding structure used to compute the varietycomponent of the HEI.
5
U SDA’s Continuing Survey of Food Intakes by Individuals (CSFII)
provides information on people’s con-sumption of foods and nutrients. In addi-tion to dietary intake information, theCSFII contains extensive informationabout Americans’ demographic and socioeconomic characteristics. CSFII data for 1994-96----the most recent dataavailable----were used to compute theHEI.
For the 1994-96 CSFII (12), dietary intakes of individuals were collected on 2 nonconsecutive days. Data werecollected through an in-person interviewusing the 24-hour dietary recall method.For individuals under age 12, informationwas provided by the parent or main mealprovider. The survey was designed to be representative of the U.S. populationliving in households. Lower income house-holds were oversampled to increase theprecision level in analyses of this group.Weights were used to make the samplerepresentative of the U.S. population.
The HEI was computed for people withcomplete food intake records for thefirst day of the survey. This allows forcomparisons across the years. Prior research has indicated that food intakedata based on 1-day dietary recall are reliable measures of usual intakes ofgroups of people (2). The HEI was computed for all individuals 2 years and older, because dietary guidelinesare applicable to people of these agesonly. Pregnant and lactating womenwere excluded because of their specialdietary needs. Final sample sizes wereapproximately 5,200 in 1994, 4,900 in1995, and 4,800 in 1996.
Data and Methods UsedTo Calculate the Healthy Eating Index
6

Overall Healthy Eating Index ScoresThe mean HEI score is 63.6 for 1994,63.5 for 1995, and 63.8 for 1996 (table 3,p. 8). An HEI score over 80 implies a ‘‘good’’ diet, an HEI score between 51 and 80 implies a diet that ‘‘needs improvement,’’ and an HEI score lessthan 51 implies a ‘‘poor’’ diet.1 Between1994 and 1996, the diets of most people(70 percent) needed improvement (fig. 2).About 12 percent of the population hada good diet, and 18 percent had a poordiet.
1This scoring system for a ‘‘good’’ diet, a diet that ‘‘needs improvement,’’ and a ‘‘poor’’ diet was developed in the initial HEI work by Kennedyet al. (6) in consultation with nutrition experts.
Healthy Eating Index Component ScoresDuring the 1994-96 period, the highestmean HEI component score for the U.S.population was for cholesterol (table 3).The cholesterol score averaged 7.8 on ascale of 10. With an average score of7.6, variety accounted for the secondhighest component score. The fruits andmilk components of the HEI had thetwo lowest mean scores over 1994-96,with an average of 3.9 and 5.4, respec-tively. Average scores for the other HEIcomponents were between 6 and 7.
Overall, 71 percent of people had amaximum score of 10 for cholesterol----that is, they met the dietary recommen-dation (table 4). Fifty-two percent had a maximum score for variety over the
Study Results
1994 1995 1996
11.4%70.5%
17.2%18.6%
11.2%71.7%
12.2%70.0%
17.3%
Figure 2. Healthy Eating Index Rating, U.S. population, 1994-96
Diet classified as "Good" (Healthy Eating Index score greater than 80)
Diet classified as "Needs improvement" (Healthy Eating Index score between 51 and 80)
Diet classified as "Poor" (Healthy Eating Index score less than 51)
7
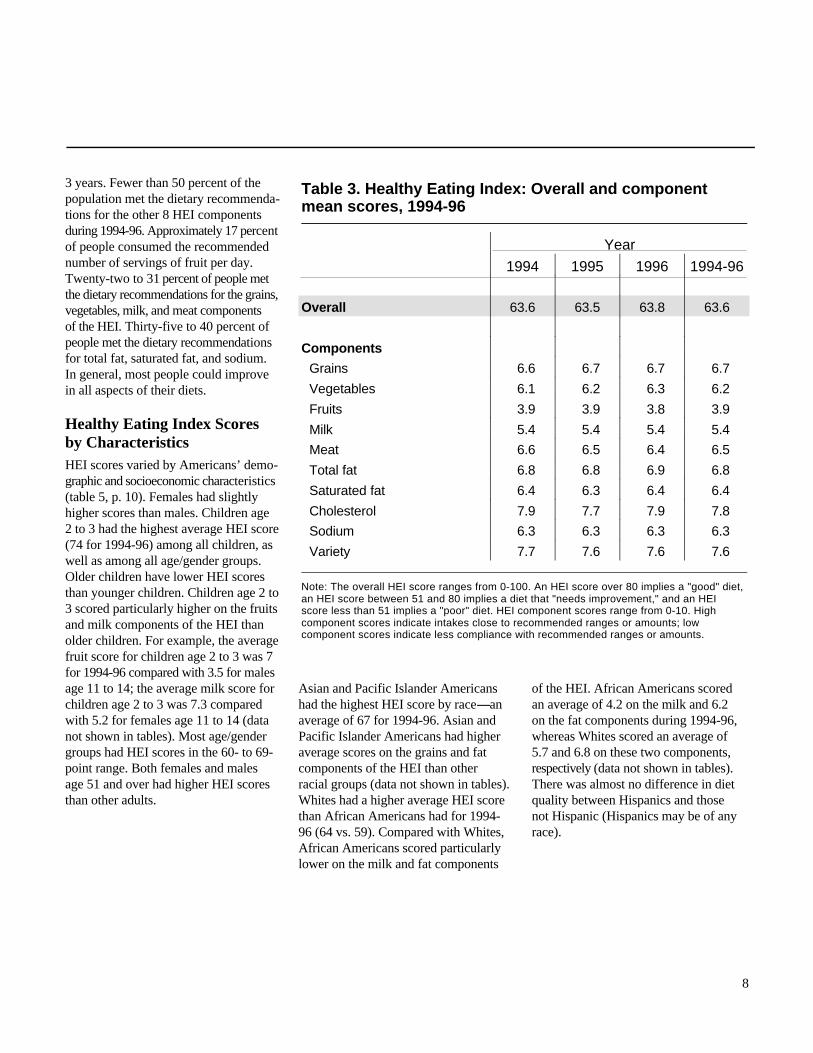
3 years. Fewer than 50 percent of thepopulation met the dietary recommenda-tions for the other 8 HEI componentsduring 1994-96. Approximately 17 percentof people consumed the recommendednumber of servings of fruit per day.Twenty-two to 31 percent of people metthe dietary recommendations for the grains,vegetables, milk, and meat components of the HEI. Thirty-five to 40 percent ofpeople met the dietary recommendationsfor total fat, saturated fat, and sodium.In general, most people could improvein all aspects of their diets.
Healthy Eating Index Scoresby CharacteristicsHEI scores varied by Americans’ demo-graphic and socioeconomic characteristics(table 5, p. 10). Females had slightlyhigher scores than males. Children age2 to 3 had the highest average HEI score(74 for 1994-96) among all children, aswell as among all age/gender groups.Older children have lower HEI scoresthan younger children. Children age 2 to3 scored particularly higher on the fruitsand milk components of the HEI thanolder children. For example, the averagefruit score for children age 2 to 3 was 7for 1994-96 compared with 3.5 for malesage 11 to 14; the average milk score forchildren age 2 to 3 was 7.3 comparedwith 5.2 for females age 11 to 14 (datanot shown in tables). Most age/gender groups had HEI scores in the 60- to 69-point range. Both females and malesage 51 and over had higher HEI scoresthan other adults.
Asian and Pacific Islander Americanshad the highest HEI score by race----anaverage of 67 for 1994-96. Asian andPacific Islander Americans had higheraverage scores on the grains and fat components of the HEI than other racial groups (data not shown in tables).Whites had a higher average HEI scorethan African Americans had for 1994-96 (64 vs. 59). Compared with Whites,African Americans scored particularlylower on the milk and fat components
of the HEI. African Americans scoredan average of 4.2 on the milk and 6.2 on the fat components during 1994-96,whereas Whites scored an average of 5.7 and 6.8 on these two components, respectively (data not shown in tables).There was almost no difference in dietquality between Hispanics and those not Hispanic (Hispanics may be of anyrace).
Table 3. Healthy Eating Index: Overall and componentmean scores, 1994-96
Year
1994 1995 1996 1994-96
Overall 63.6 63.5 63.8 63.6
Components
Grains 6.6 6.7 6.7 6.7
Vegetables 6.1 6.2 6.3 6.2
Fruits 3.9 3.9 3.8 3.9
Milk 5.4 5.4 5.4 5.4
Meat 6.6 6.5 6.4 6.5
Total fat 6.8 6.8 6.9 6.8
Saturated fat 6.4 6.3 6.4 6.4
Cholesterol 7.9 7.7 7.9 7.8
Sodium 6.3 6.3 6.3 6.3
Variety 7.7 7.6 7.6 7.6
Note: The overall HEI score ranges from 0-100. An HEI score over 80 implies a "good" diet,an HEI score between 51 and 80 implies a diet that "needs improvement," and an HEIscore less than 51 implies a "poor" diet. HEI component scores range from 0-10. Highcomponent scores indicate intakes close to recommended ranges or amounts; lowcomponent scores indicate less compliance with recommended ranges or amounts.
8

HEI scores generally increased with levelsof income. People with household income50 percent or below the poverty thresh-old had an average HEI score of 60 for1994-96, and those with household income between 51 and 100 percent of the poverty threshold had an averageHEI score of 61.2 By comparison, peoplewith a household income over three timesthe poverty threshold had an averageHEI score of 65 for 1994-96.
Income is a good predictor of ability topurchase food. Higher income groupshave the ability to buy relatively expen-sive foods, such as fresh fruits and leanmeats, which result in a better diet quality.They also are able to have more varietyin their diets. People in higher incomehouseholds did better on the saturatedfat and sodium components of the HEIthan did people in lower income house-holds. People with household incomeover three times the poverty thresholdhad an average score of 6.6 for saturatedfat and 7.9 for sodium; those with house-hold income 50 percent or below thepoverty threshold had an average scoreof 5.7 for saturated fat and 6.6 for sodium(data not shown in tables).
Education level was positively associ-ated with a better diet. People with a highschool diploma or less had an averageHEI score of 61 for 1994-96, whereasthose with 4 years of college had an average HEI score of 66, and those with more than 4 years of college hadan average HEI score of 68. Educationmay be a predictor of people’s ability totranslate nutrition guidance information
2In 1995, the poverty threshold was $9,935 for a family of two, $12,156 for a family of three,$15,570 for a family of four, and $18,407 for afamily of five.
into better dietary practices (17). Higher education is also associated with higherearnings. The difference in HEI scoresbetween the lowest and highest educa-tion categories was about 7 points.
There were regional differences in dietquality. People in the Northeast had thehighest HEI score, an average of 65 for1994-96, and those in the South had thelowest score, an average of 62. Peoplein the South scored lower on the totalfat component of the HEI than people in other regions (data not shown in tables).People who lived in an urban area (aMetropolitan Statistical Area in or outside a central city) also had a slightlyhigher HEI score than did people who
lived in a nonurban area. This could bebecause average income, which is an indicator of one’s ability to purchasefood, is lower in nonurban than in urban areas.
Based on the demographic and socio-economic characteristics examined, no subgroup of the population had anaverage HEI score greater than 80----ascore that implies a good diet. Certainsegments of the American populationhave a diet of poorer quality than othergroups. This underscores the need to tailor nutrition policies and programs tomeet the needs of different segments ofthe population, particularly those at ahigher risk of having a poor diet.
Table 4. Percent of people meeting the dietary recommendations for Healthy Eating Index components
Year
Components 1994 1995 1996 1994-96
Grains 21.9 23.0 22.2 22.4
Vegetables 29.4 30.8 31.8 30.7
Fruits 17.8 17.4 17.1 17.4
Milk 25.4 25.4 25.5 25.4
Meat 29.8 29.1 26.4 28.4
Total fat 36.8 36.5 37.5 36.9
Saturated fat 40.3 39.1 40.1 39.8
Cholesterol 71.2 68.8 71.9 70.6
Sodium 35.4 34.5 34.7 34.9
Variety 52.2 52.0 53.0 52.4
Note: For each component, a person received a maximum score of 10 for meeting the dietaryrecommendations.
9
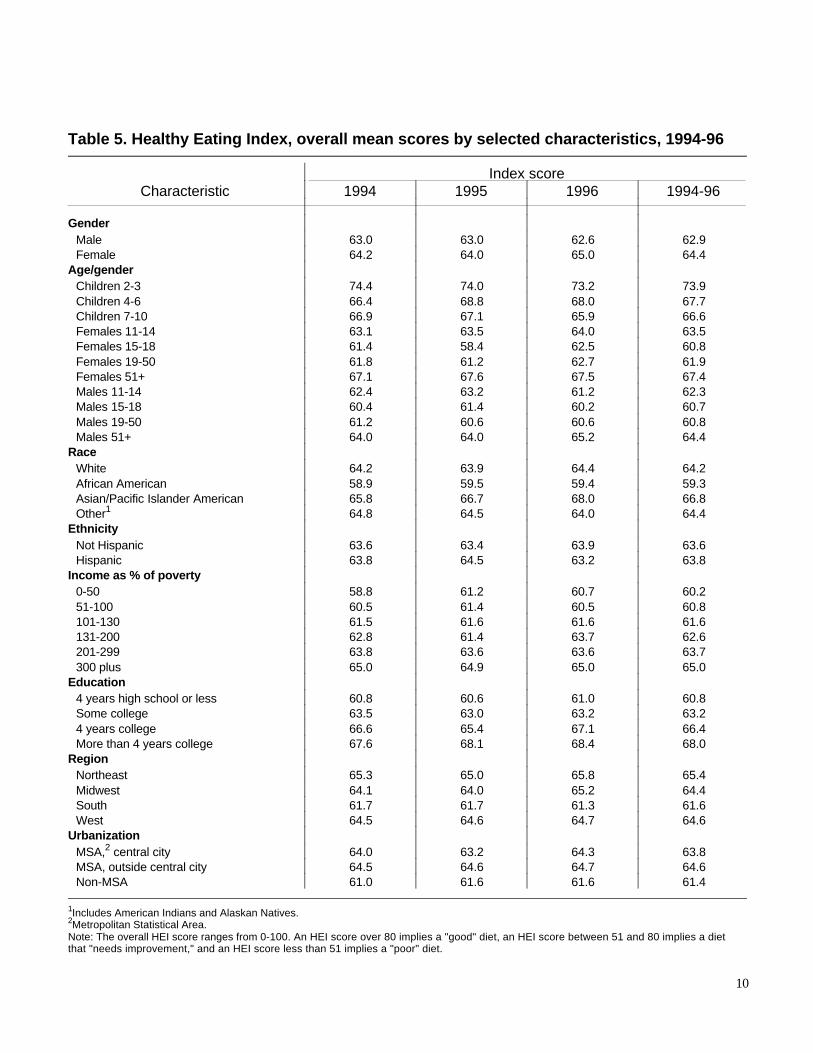
Table 5. Healthy Eating Index, overall mean scores by selected characteristics, 1994-96
Index scoreCharacteristic 1994 1995 1996 1994-96
GenderMale 63.0 63.0 62.6 62.9Female 64.2 64.0 65.0 64.4
Age/genderChildren 2-3 74.4 74.0 73.2 73.9Children 4-6 66.4 68.8 68.0 67.7Children 7-10 66.9 67.1 65.9 66.6Females 11-14 63.1 63.5 64.0 63.5Females 15-18 61.4 58.4 62.5 60.8Females 19-50 61.8 61.2 62.7 61.9Females 51+ 67.1 67.6 67.5 67.4Males 11-14 62.4 63.2 61.2 62.3Males 15-18 60.4 61.4 60.2 60.7Males 19-50 61.2 60.6 60.6 60.8Males 51+ 64.0 64.0 65.2 64.4
RaceWhite 64.2 63.9 64.4 64.2African American 58.9 59.5 59.4 59.3Asian/Pacific Islander American 65.8 66.7 68.0 66.8Other1 64.8 64.5 64.0 64.4
EthnicityNot Hispanic 63.6 63.4 63.9 63.6Hispanic 63.8 64.5 63.2 63.8
Income as % of poverty0-50 58.8 61.2 60.7 60.251-100 60.5 61.4 60.5 60.8101-130 61.5 61.6 61.6 61.6131-200 62.8 61.4 63.7 62.6201-299 63.8 63.6 63.6 63.7300 plus 65.0 64.9 65.0 65.0
Education4 years high school or less 60.8 60.6 61.0 60.8Some college 63.5 63.0 63.2 63.24 years college 66.6 65.4 67.1 66.4More than 4 years college 67.6 68.1 68.4 68.0
RegionNortheast 65.3 65.0 65.8 65.4Midwest 64.1 64.0 65.2 64.4South 61.7 61.7 61.3 61.6West 64.5 64.6 64.7 64.6
UrbanizationMSA,2 central city 64.0 63.2 64.3 63.8MSA, outside central city 64.5 64.6 64.7 64.6Non-MSA 61.0 61.6 61.6 61.4
1Includes American Indians and Alaskan Natives.2Metropolitan Statistical Area.Note: The overall HEI score ranges from 0-100. An HEI score over 80 implies a "good" diet, an HEI score between 51 and 80 implies a dietthat "needs improvement," and an HEI score less than 51 implies a "poor" diet.
10
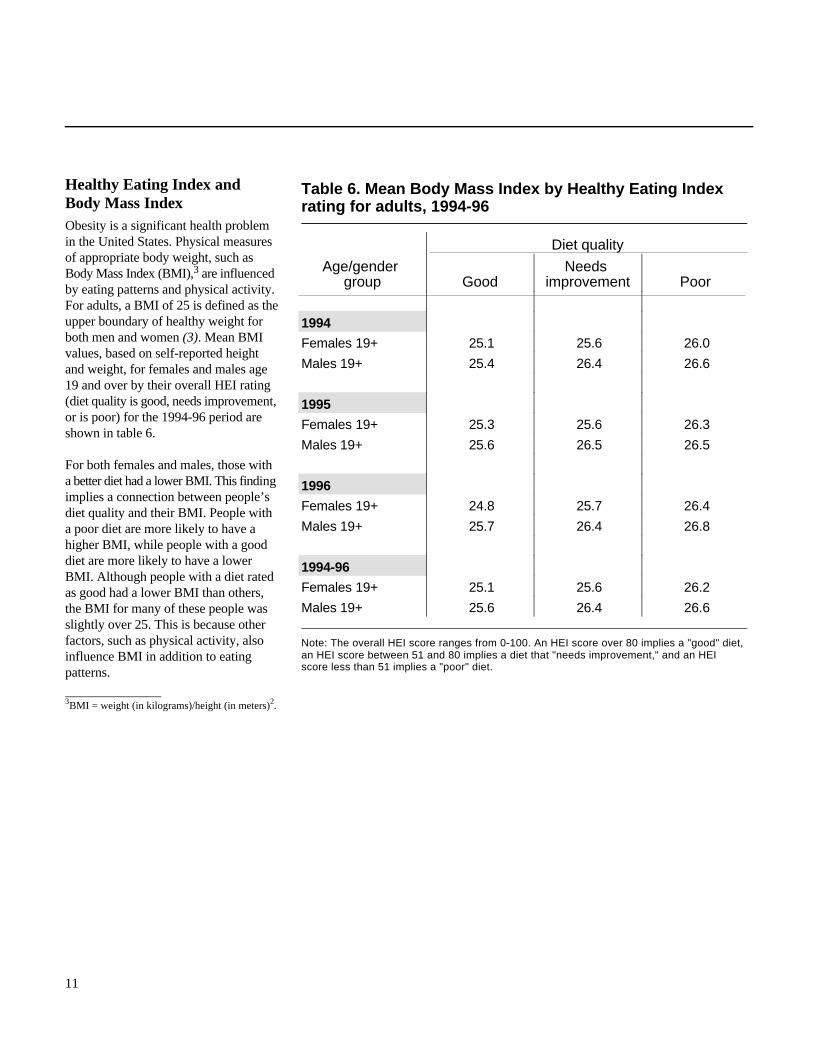
Healthy Eating Index andBody Mass IndexObesity is a significant health problemin the United States. Physical measuresof appropriate body weight, such asBody Mass Index (BMI),3 are influencedby eating patterns and physical activity.For adults, a BMI of 25 is defined as theupper boundary of healthy weight forboth men and women (3). Mean BMIvalues, based on self-reported heightand weight, for females and males age19 and over by their overall HEI rating(diet quality is good, needs improvement,or is poor) for the 1994-96 period areshown in table 6.
For both females and males, those witha better diet had a lower BMI. This findingimplies a connection between people’sdiet quality and their BMI. People witha poor diet are more likely to have ahigher BMI, while people with a gooddiet are more likely to have a lowerBMI. Although people with a diet ratedas good had a lower BMI than others,the BMI for many of these people wasslightly over 25. This is because otherfactors, such as physical activity, also influence BMI in addition to eating patterns.
3BMI = weight (in kilograms)/height (in meters)2.
Table 6. Mean Body Mass Index by Healthy Eating Indexrating for adults, 1994-96
Diet quality
Age/gender group Good
Needs improvement Poor
1994
Females 19+ 25.1 25.6 26.0
Males 19+ 25.4 26.4 26.6
1995
Females 19+ 25.3 25.6 26.3
Males 19+ 25.6 26.5 26.5
1996
Females 19+ 24.8 25.7 26.4
Males 19+ 25.7 26.4 26.8
1994-96
Females 19+ 25.1 25.6 26.2
Males 19+ 25.6 26.4 26.6
Note: The overall HEI score ranges from 0-100. An HEI score over 80 implies a "good" diet,an HEI score between 51 and 80 implies a diet that "needs improvement," and an HEIscore less than 51 implies a "poor" diet.
11
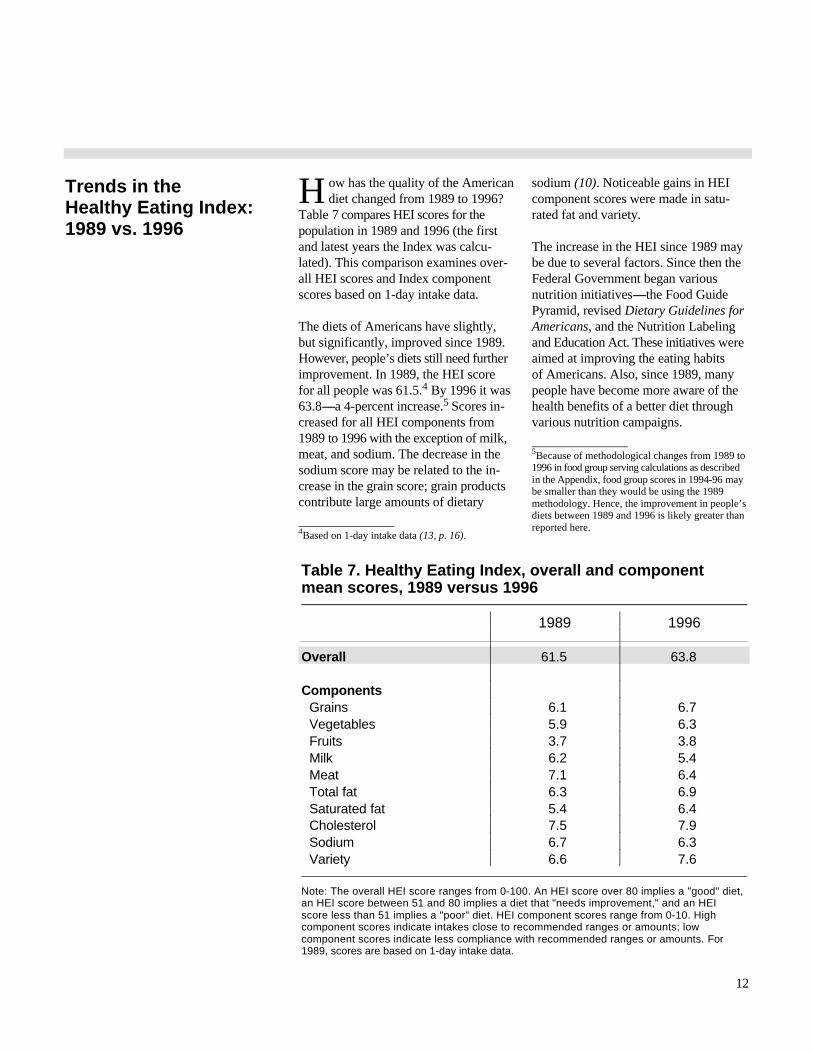
H ow has the quality of the American diet changed from 1989 to 1996?
Table 7 compares HEI scores for thepopulation in 1989 and 1996 (the firstand latest years the Index was calcu-lated). This comparison examines over-all HEI scores and Index componentscores based on 1-day intake data.
The diets of Americans have slightly,but significantly, improved since 1989.However, people’s diets still need furtherimprovement. In 1989, the HEI scorefor all people was 61.5.4 By 1996 it was63.8----a 4-percent increase.5 Scores in-creased for all HEI components from1989 to 1996 with the exception of milk,meat, and sodium. The decrease in thesodium score may be related to the in-crease in the grain score; grain productscontribute large amounts of dietary
4Based on 1-day intake data (13, p. 16).
sodium (10). Noticeable gains in HEIcomponent scores were made in satu-rated fat and variety.
The increase in the HEI since 1989 maybe due to several factors. Since then theFederal Government began various nutrition initiatives----the Food GuidePyramid, revised Dietary Guidelines forAmericans, and the Nutrition Labelingand Education Act. These initiatives wereaimed at improving the eating habits of Americans. Also, since 1989, manypeople have become more aware of thehealth benefits of a better diet throughvarious nutrition campaigns.
5Because of methodological changes from 1989 to1996 in food group serving calculations as describedin the Appendix, food group scores in 1994-96 maybe smaller than they would be using the 1989methodology. Hence, the improvement in people’sdiets between 1989 and 1996 is likely greater thanreported here.
Trends in the Healthy Eating Index:1989 vs. 1996
Table 7. Healthy Eating Index, overall and componentmean scores, 1989 versus 1996
1989 1996
Overall 61.5 63.8
ComponentsGrains 6.1 6.7Vegetables 5.9 6.3Fruits 3.7 3.8Milk 6.2 5.4Meat 7.1 6.4Total fat 6.3 6.9Saturated fat 5.4 6.4Cholesterol 7.5 7.9Sodium 6.7 6.3Variety 6.6 7.6
Note: The overall HEI score ranges from 0-100. An HEI score over 80 implies a "good" diet,an HEI score between 51 and 80 implies a diet that "needs improvement," and an HEIscore less than 51 implies a "poor" diet. HEI component scores range from 0-10. Highcomponent scores indicate intakes close to recommended ranges or amounts; lowcomponent scores indicate less compliance with recommended ranges or amounts. For 1989, scores are based on 1-day intake data.
12

A mericans’ eating patterns, as measured by the HEI, have slightly,
but significantly improved since 1989.Although this trend is in the desired direction, the diets of most Americansstill need improvement. In 1994-96,only 12 percent of Americans had a diet that could be considered good.
Of the 10 components of the HEI, theaverage scores of 7 of these components(grains, vegetables, fruits, total fat, saturated fat, cholesterol, and variety) increased from 1989 to 1996. Grains,vegetables, and fruits are generally highin fiber and low in total fat, saturatedfat, and cholesterol, thereby influencingthese latter three components. Althoughfruit scores increased, in 1996 only 17percent of people ate the recommendednumber of servings of fruit on a givenday.
The average score for the milk, meat,and sodium components declined from1989 to 1996. In 1996, only 26 percentof people ate the recommended numberof servings of milk products on a givenday. In the past several years, there hasbeen a decline in milk consumption andsimultaneous increase in carbonated softdrink consumption (9). The decrease inthe sodium score is likely related to theincrease in the grains score as manygrain products, such as breads, are highin sodium.
One of the factors that influences dietaryquality is income. People with a higherincome are able to afford more variety----more types of fruits and vegetables----intheir diets and HEI scores tend to increase.The impact of income on the ability topurchase a variety of foods is evident inthe variety scores for different incomegroups. People with a household income50 percent of the poverty threshold orbelow had an average variety score of
6.9 for 1994-96, whereas those with ahousehold income of 300 percent of thepoverty threshold or more had an averagevariety score of 7.9 (data not shown intables). Education also influences dietquality. People with 4 years of collegehave a better diet than those with lesseducation. People with more educationmay acquire more nutrition information,which improves the quality of their diets(17).
Age, gender, race, ethnicity, and area ofresidence are other factors that influencediet quality. In general, children lessthan 11 years of age have a better dietthan others. It could be that parents aremore attentive to children’s diets.Adults over 50 years of age have betterdiets than other adults. Females tend tohave a slightly more healthful diet thanmales. African Americans have a poorerquality diet than other racial groups. People living in the South and nonurbanareas are more likely to have a poorerdiet.
These findings provide an awarenessand better understanding of the types of dietary changes needed to improvepeople’s eating patterns. USDA and otherFederal Departments have various nutri-tion education and promotion activitiesdesigned to improve people’s diets. USDAalso has a number of partnerships withthe private sector to achieve this goal.The HEI is an important tool that can beused to assess the effect of these activitiesand provide guidance to better target anddesign nutrition education and publichealth interventions.
Conclusions
13

Determination of Food GuidePyramid Serving DefinitionsFor each of the five major food groups,servings definitions used to compute theIndex scores were intended to be as con-sistent as possible with the concepts anddefinitions described in the Food GuidePyramid (14). Serving definitions reflectconsistency with the underlying rationalein terms of nutrient contributions fromeach of the five major food groups andthe Pyramid concept of defining servingsin common household measures and easily recognizable units. The servingscalculated in this report were based onthe Pyramid Servings database developedby the USDA’s Agricultural ResearchService (12).
Grains Group (Bread, Cereal, Rice,and Pasta)While the basic Pyramid serving defini-tions were used for most foods in thisgroup, when needed, the grain or com-plex carbohydrate content of a food pro-vided the basis for the serving definitionfor some grain-based foods. This wasthe case for snack-type grain products,grain-based desserts, certain quickbreads, and miscellaneous grains, suchas breading. For other grain products,such as some quick breads, pancakes,waffles, and taco shells, a combinationof the two methods was used.
For yeast bread, some quick breads,rice, pasta, and breakfast cereals, the basic Pyramid definition was used. Aserving was defined as 1 slice of bread,with the weight of 1 regular slice ofcommercial white bread (26 grams)used as a standard of comparison for decisions about serving weights foryeast breads. The Pyramid defines 1⁄2a hamburger or submarine roll, Englishmuffin, bagel, or croissant as one breadserving; a muffin or serving of quickbread was defined as 45 grams. For rice,
pasta, or cooked breakfast cereals, oneserving was defined as 1⁄2 cup cooked asspecified by the Pyramid, and for ready-to-eat breakfast cereals, one serving wasdefined as 1 ounce, but only ingredientsconsidered typical of grain products werecounted toward the serving weight.
When standard serving sizes were notdescribed in the Pyramid, a serving wasbased on the grain content of the food.Since 1 slice of commercial white breadcontains 16 grams of flour, one standardgrain serving was defined as the gramsof a grain product containing 16 gramsof flour. For products containing grainingredients other than flour and productscontaining more than one grain ingredi-ent, servings were calculated by summinggrain servings from each grain ingredient.Thus, grain servings for a given foodwere defined on a grain equivalent basis. Vegetables GroupVegetable serving definitions were basedon those in the Food Guide Pyramid,which defines a serving as 1 cup of raw leafy vegetables; 1⁄2 cup of othervegetables, cooked or chopped raw; or3⁄4 cup of vegetable juice. Often, thefood coding database provided severaldifferent weights for the various formsin which a vegetable is available for con-sumption. For vegetables not specifiedin terms of preparation form, the follow-ing general order of priority was used to select a serving weight for a givenvegetable: Mashed, chopped, sliced,cubed, diced, pieces, and whole. In general, this had the effect of counting as a serving the most dense form of thevegetable for which a weight was available.For dehydrated vegetables (other thandried beans and peas), a serving size of1⁄4 cup was assigned, for tomato pureeor paste a serving size of 1⁄4 cup wasused, and for dried beans and peas the
Appendix
14
serving was defined as the weightneeded to yield 1⁄2 cup cooked. For potatoes----baked, boiled, roasted,mashed, and fried----one serving was defined as 1⁄2 cup, while for potato chipsone serving was defined as 1 ounce andfor dehydrated potatoes as the amountof dried potato flakes that yield 1⁄2 cupof prepared mashed potatoes. All vegetables that were ingredients inmulti-ingredient foods were disaggregatedand any fraction of a serving they contributed, no matter how small, was accounted for in servings from the vegetable group on the Pyramid Servingsintake files.
Fruits Group Fruit serving definitions were based onthose in the Food Guide Pyramid, whichdefines a serving as a whole fruit suchas a medium apple, banana, or orange; agrapefruit half; a melon wedge; 3⁄4 cupfruit juice; 1⁄2 cup berries; 1⁄2 cupchopped, cooked, or canned fruit; or 1⁄4 cup dried fruit. For raw fruits, oneserving was defined as a whole fruit ifthe weight of one fruit was equal to orgreater than the weight of 1⁄2 cup rawfruit. For fruits with pits, the servingweight was for 1⁄2 cup of pitted fruit.For large fruits, such as melons andpineapple, one serving was defined as1⁄2 cup raw fruit.
For fruit juices, single-strength juices,and juices containing less than 10 percentsugar by weight, a serving was definedas 3⁄4 cup. For juice concentrates, oneserving was defined as 1.5 ounces,which is the amount needed to prepare3⁄4 cup of reconstituted juice. Othersweetened fruit juices, juice drinks, andfruit ades were handled as mixtures, andservings were determined based on theirfruit ingredients.
Servings from all fruits, whether eatenplain or consumed as an ingredient ofany food, were counted toward fruitgroup servings. Fruit mixtures wereseparated into ingredients before servingweights were assigned only if a servingweight consistent with Pyramid guidancecould not be determined for the food asconsumed.
Milk Group (Milk, Yogurt, andCheese) For milk and yogurt, the serving defini-tion used was taken directly from thePyramid, which defines a serving as 1cup of fluid milk or yogurt. For cheeses(includes cottage cheese and creamcheese), serving definitions were basedon the Pyramid’s underlying criterionfor a milk serving, which is that it shouldprovide about the same amount of calciumas 1 cup of skim milk (i.e., 302 milligrams).
The most frequently used serving defini-tion for natural or processed cheese is 1.5 to 2 ounces, while that for dry cheesesand reduced fat or nonfat cheeses is 1ounce. For cottage and ricotta cheeses,serving sizes were defined in terms of thenumber of cups needed to provide 302milligrams of calcium, and fat-free creamcheese was assigned a serving size basedon its calcium content. Other types ofcream cheese were counted toward thePyramid tip.
Flavored milks, other than those madewith whole, lowfat, or skim milk, werehandled as mixtures, and serving defini-tions were based on their milk ingredients.For dry milk, dry whey, and evaporatedmilk, a serving was defined as the amountneeded to yield 1 cup reconstituted or diluted. Frozen yogurt, ice cream, andother frozen dairy desserts were consid-ered as mixtures, and servings were as-signed based on their milk ingredients.
Most foods containing milk productswere separated into ingredients, and thenumber of servings from the milk groupwas determined based on the amount ofmilk or cheese they contained. Exceptionswere grain products that counted towardgrain group servings and processed meatsand meat analogs that counted towardmeat group servings.
Meat Group (Meat, Poultry, Fish, DryBeans, Eggs, and Nuts) For the meat group, the Pyramid recom-mends eating two to three servings eachday of meat or meat alternates; this isequivalent to 5 to 7 ounces of cookedlean meat, poultry, or fish. In the HEIcomputation, 2.5 ounces of lean meatwas used as the serving definition forthe meat, poultry, or fish group. Cookedlean meat is defined as meat, poultry, orfish that contains 9.35 grams or less fatper 100 grams and at least 90.65 gramsthat is not fat per 100 grams.
For meat alternates, the Pyramid specifiesamounts equivalent to 1 ounce of cookedlean meat as follows: 1⁄2 cup of cookeddry beans or peas, 1 egg, 2 tablespoonsof peanut butter, 1⁄3 cup of nuts, 1⁄4 cupof seeds, and 1⁄2 cup of tofu. The sameserving unit, ounces of cooked leanmeat equivalents, was used for all foodsthat count toward the meat group. Thismeasure standardizes the definition of aserving unit across the different types offoods that count toward the meat groupand presents the data in the unit of measurein which the meat group recommendationis specified. Dry beans and peas werefirst assigned to the meat group if themeat serving recommendations were notmet, after which they were added to thevegetables group.
15
Allocation of Mixtures to Individual Food GroupsIn calculating the HEI, it was necessaryto assign the foods in mixtures, in theappropriate amounts, to their constituentfood groups. Pizza, for example, canmake significant contributions to severalfood groups, including grains, vegetables,milk, and meat. The approach used wasa straightforward extension of the oneused to estimate serving sizes. Commoditycompositions of foods were identified.Commodities were then assigned to appropriate food groups based on thegram/serving size factors that were calculated.
Methodology Change for Serving DefinitionsThe methodology used to determineserving definitions for each of the fivemajor food groups in this report is basedon that developed by USDA’s Agricul-tural Research Service (12). This meth-odology differs somewhat from thatused to calculate the 1989-90 HEI (13).In particular, milk serving definitionspreviously used were based on grams ofnonfat milk solids contained in a fooddivided by the amount of grams of non-fat milk solids contained in 1 cup ofmilk.
For the 1994-96 HEI, milk serving defi-nitions were based on the Pyramid’s underlying criterion for a milk serving,which is that it should provide about the same amount of calcium as 1 cup of skim milk, or 302 milligrams. Thisapproach, while more in line with theadvice of nutrition researchers, has implications for lower milk group component scores. This is due to theomission of some foods, previouslycounted (e.g., butter and cream cheese),based on nonfat milk solids, but no longer
given credit towards a milk serving because they do no meet the calcium criterion of the Pyramid. For a completedescription and documentation of theFood Guide Pyramid servings, see reference 12.
Estimation of Food GroupServing Requirements by Age and GenderIn order to score food group consump-tion, it was necessary to determine therecommended numbers of servings byfood group for each person in the 1994-96 CSFII. The Food Guide Pyramid con-tains recommended numbers of servingsof food groups for many age/gendercategories, and these recommendationswere used. Some age/gender groups hadRecommended Energy Allowances (REAs)that were different from the three levelsof energy intakes presented in the FoodGuide Pyramid. Interpolation techniqueswere used to estimate the required numberof food group servings for each of theseage/gender groups. Food servings speci-fied in the Food Guide Pyramid for threefood energy levels were used as a basisfor interpolating comparable food servingsat other energy levels for each foodgroup.
Children 2 to 3 years old have an REAless than the lowest calorie level in theFood Guide Pyramid. Extrapolation ofthe Food Guide Pyramid’s recommendednumber of servings to a lower calorielevel would result in lower numbers ofservings than the minimums. However,the Food Guide Pyramid suggests thesechildren eat smaller servings except formilk. The number of servings for children2 to 3 years old was, therefore, held constant at the minimum, but the servingsizes were reduced proportionately, except for milk, where the serving sizewas kept at the original level.
Similarly, males 15 to 50 years old haveREAs slightly higher than the highestcalorie level in the Food Guide Pyramid.Simple extrapolation would result ingreater numbers of servings than themaximum numbers. Since the FoodGuide Pyramid does not specify foodgroup servings for diets beyond 2800kilocalories, the food group servingswere truncated at the maximum numbersindicated by the Food Guide Pyramid.
Design Alternatives: What To CountFoods often fall predominately withinone food group, but may contain smallamounts of other food groups. For example,salad dressings may contain smallamounts of milk or cheese as ingredients.To capture their nutrient contributions,even relatively small amounts of suchincidental foods, for the most part, wereincluded in serving calculations of therelevant Pyramid food group. For a fewfoods, milk (but not cheese) that was aningredient was not counted toward milkgroup servings. These foods includedgrain products that counted towardgrain group servings and processedmeats and meat analogs that counted toward meat group servings.
With these exceptions, ingredient contri-butions to various food groups werecounted in computing the HEI with nominimum size cutoff values imposed.The following examples illustrate someof the implications of this approach:
• The nutrition value from condi-ments, such as mayonnaise, wascounted in computing the HEI.
16
• The nutrition value of milk used in some sweets, such as a milkchocolate bar, was counted in themilk group. If allocated to a singlefood group, the chocolate barwould have been assigned to the‘‘sweets’’ group and not counted in the HEI.
• Fruit juice in a soft drink that is at least 10 percent fruit juice wascounted in computing the HEI.Water and sugar in the soft drinkwere not counted.
• The potato content of potato chipswas counted in computing the HEI.Fat content was not counted in com-puting the vegetables and varietycomponents of the Index but wascounted in computing the fat component.
Coding Structure Used To Compute the Variety Component of the HEIThe food coding structure used to com-pute the HEI was based on USDA’s coding structure for the 1994-96 CSFII.Food items that were similar but codedseparately in the CSFII were grouped together to compute the variety score.The following principles were used tomake food variety coding decisions:
• Foods that were nutritionally similar were grouped together.
• Foods made with separate commodities were generallygrouped separately.
• Foods differing only in fat content were generally grouped together.
• Vegetables were each given separate codes, but different forms of the same vegetable were coded together.
• Different forms of the same meatwere generally coded the same; organ meats and ham were two exceptions.
• Each type of fish was given a separate code, but different cookedor processed forms of the same fishreceived the same code.
• Most forms of fluid milk had thesame code.
• Most cheeses had the same code;the exception was cottage cheese.
• All white breads were given thesame code. Sweet rolls and pasta received different codes.
• Whole wheat products were codeddifferently from products madewith refined wheat flour.
• Ready-to-eat cereals were assignedcodes based on the main grain inthe cereal. Those made from differ-ent grains received different codes.
Food mixtures were broken down intotheir constituent components; thishelped with coding. Only componentfoods present in substantial quantitieswere included in the variety calculations.A threshold of one-half a Food Pyramidserving was used. Food componentscontributing less than this amount werenot included in the computation of thevariety score. It is possible that varietyscores for some people were slightly underestimated by this approach. Several servings in a food group con-sumed in less than one-half servingamounts throughout a day, when com-bined, could exceed the one-half servinglimit. The potential effects of this under-estimation on the final results arethought to be small.
A second conversion assumption usedwas that food mixtures containing twoor more components from the samefood group, such as mixed vegetables,could be reasonably and equally allo-cated to the two or more food codes ofthe components that were present in thehighest proportions.
17
1. American Dietetic Association. 1995, July 19. Nutrition experts respond to newgovernment report card on American diet. News Release.
2. Basiotis, P.P., Welsh, S.O., Cronin, F.J., Kelsay, J.L., and Mertz, W. 1987. Numberof days of food intake records required to estimate individual and group nutrient intakes with defined confidence. The Journal of Nutrition 117(9):1638-1641.
3. Dietary Guidelines Advisory Committee. 1995. Report of the Dietary GuidelinesAdvisory Committee on the Dietary Guidelines for Americans, 1995. U.S. Departmentof Agriculture, Agricultural Research Service.
4. Frazao, E. 1996. The American diet: A costly health problem. FoodReview19(1):2-6.
5. Huijbregts, P., Feskens, E., Rasanen, L., Fidanza, F., Nissinen, A., Menotti, A.,and Kromhout, D. 1997. Dietary pattern and 20 year mortality in elderly men inFinland, Italy, and the Netherlands: Longitudinal cohort study. British Medical Journal 314:13-17.
6. Kennedy, E.T., Ohls, J., Carlson, S., and Fleming, K. 1995. The Healthy EatingIndex: Design and applications. Journal of the American Dietetic Association95(10):1103-1108.
7. National Research Council, Committee on Diet and Health, Food and NutritionBoard. 1989. Diet and Health: Implications for Reducing Chronic Disease Risk. National Academy Press, Washington, DC.
8. National Research Council, Subcommittee on the Tenth Edition of the RDAs,Food and Nutrition Board. 1989. Recommended Dietary Allowances. (10th ed.). National Academy Press, Washington, DC.
References
18
9. Putnam, J. and Gerrior, S. 1997. Americans consuming more grains and vegetables,less saturated fat. FoodReview 20(3):2-12.
10. Saltos, E. and Bowman, S. 1997, May. Dietary guidance on sodium: Should wetake it with a grain of salt? Nutrition Insights No. 3. U.S. Department of Agriculture,Center for Nutrition Policy and Promotion.
11. Shaw, A. and Davis, C. 1994. The Dietary Guidelines focus on reducing excessiveintakes. FoodReview 17(1):4-7.
12. U.S. Department of Agriculture, Agricultural Research Service. 1998, February.1994-96 Continuing Survey of Food Intakes by Individuals and 1994-96 Diet andHealth Knowledge Survey and related materials [CD-ROM].
13. U.S. Department of Agriculture, Center for Nutrition Policy and Promotion.1995. The Healthy Eating Index. CNPP-1.
14. U.S. Department of Agriculture, Human Nutrition Information Service. 1992.The Food Guide Pyramid. Home and Garden Bulletin Number 252.
15. U.S. Department of Agriculture and U.S. Department of Health and HumanServices. 1995. Nutrition and Your Health: Dietary Guidelines for Americans. (4th ed.). U.S. Department of Agriculture. Home and Garden Bulletin No. 232.
16. U.S. Department of Health and Human Services. 1988. The Surgeon General’sReport on Nutrition and Health. DHHS (PHS) 88-50210, Washington, DC.
17. Variyam, J.N., Blaylock, J., Smallwood, D., and Basiotis, P.P. 1998. USDA’sHealthy Eating Index and Nutrition Information. U.S. Department of Agriculture,Economic Research Service. Technical Bulletin No. 1866.
19