Embed Size (px)
Citation preview
THE HEMOGLOBIN SYSTEM.
VI. THE OXYGEN DISSOCIATION CURVE OF HEMOGLOBIN.*
BY G. S. ADAIR.
WITH THE COLLABORATION OF A. V. BOCK AND H. FIELD, JR.
(From the Medical Laboratories of the Massachusetts General Hospital, Boston.)
(Received for publication, January 7, 1925.)
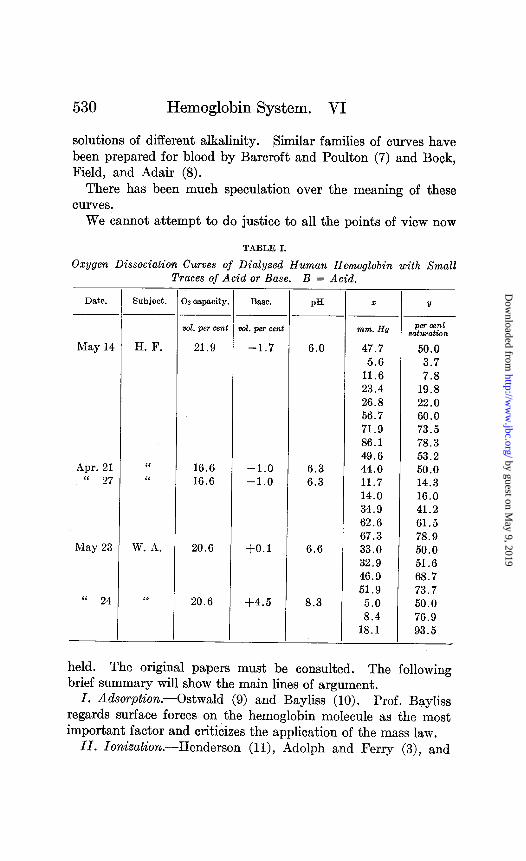
This work gives the oxygen dissociation curves of solutions previously investigated in regard to their acid-binding and base- binding properties. Table I gives oxygen dissociation curves of pure hemoglobin. These are on the lines of the work of Hiifner (l), Barcroft and Roberts (2), Adolph and Ferry (3), and Adair, Barcroft, and Bock (4), but owing to the fact that the previous work gave rough estimates of the amount of impurity in the dialyzed solution, it was possible to give a theoretical explanation of the phenomena. The tensions at half saturation in this table are interpolated.
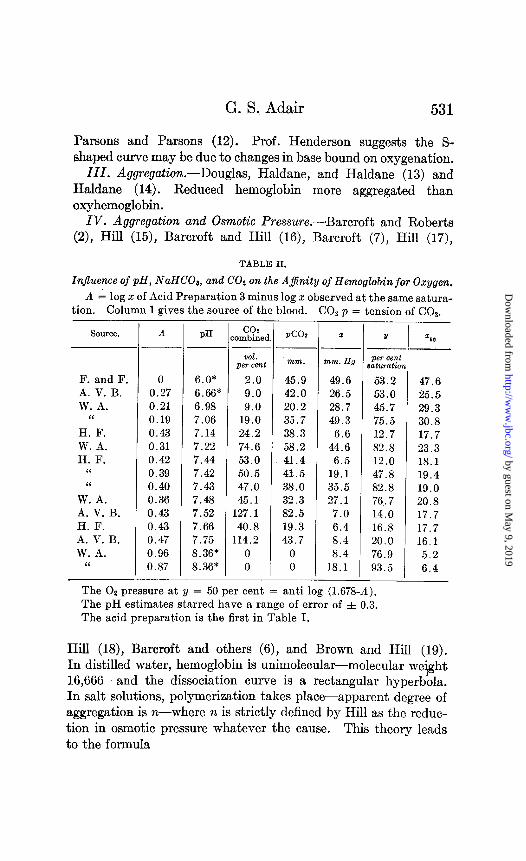
Table II gives the relation of the affinity constant of oxyhemo- globin and the pH in the presence of sodium bicarbonate. This appears to be the first test of this relation in an homogeneous system. Blood was investigated by Barcroft and Peters (included in the report of the Monte Rosa Expedition of 1911 (5)), and Barcroft and others (6).
Table III gives dissociation data in a salt solution,
Theories of the Oxygen Dissociation Curve.
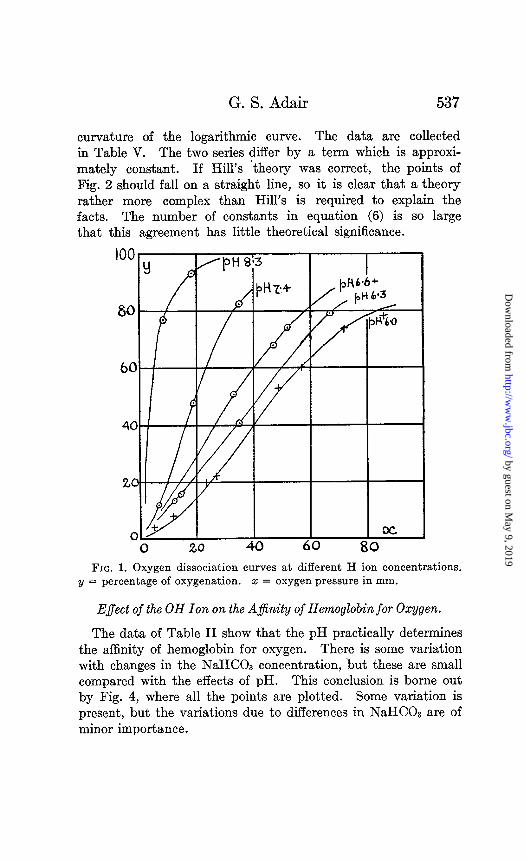
The curves of Fig. 1 show the relation between the oxygen pressure and y, the percentage of hemoglobin oxygenated in
* This paper is No. 47 of a series of articles on the physiology and path- ology of blood from the Harvard Medical School and allied hospitals, a part of the expenses of which has been defrayed from a grant of the Proctor Fund of the Harvard Medical School for the study of chronic diseases.
529
by guest on May 9, 2019
http://ww
w.jbc.org/
Dow
nloaded from
530 Hemoglobin System. VI
solutions of different alkalinity. Similar families of curves have been prepared for blood by Barcroft and Poulton (7) and Bock, Field, and Adair (8).
There has been much speculation over the meaning of these curves.
We cannot attempt to do justice to all the points of view now
TABLE I.
Oxygen Dissociation Curves of Dialyzed Human Hemoglobin with Small Traces of Acid or Base. B = Acid.
Date. Subject.
May 14
Apr. 21 “ 27
May 23
“ 24
H. F.
‘I “
W. A.
“
32 capacity
vol. pe7 ten
21.9
16.6 16.6
20.6
20.6
Ba5.2.
wl. per ten
-1.7
-1.0 -1.0
+0.1
+4.5
PH
6.0
6.3 6.3
6.6
8.3
-
--
-
z
mm. Hg
47.7 5.6
11.6 23.4 26.8 56.7 71.9 86.1 49.6 44.0 11.7 14.0 34.9 62.6 67.3 33.0 32.9 46.9 51.9
5.0 8.4
18.1
II
pe7 cent saturation
50.0 3.7 7.8
19.8 22.0 60.0 73.5 78.3 53.2 50.0 14.3 16.0 41.2 61.5 78.9 50.0 51.6 68.7 73.7 50.0 76.9 93.5
held. The original papers must be consulted. The following brief summary will show the main lines of argument.
I. Adsorption.-Ostwald (9) and Bayliss (10). Prof. Bayliss regards surface forces on the hemoglobin molecule as the most important factor and criticizes the application of the mass law.
II. Ionization.-Henderson (ll), Adolph and Ferry (3), and
by guest on May 9, 2019
http://ww
w.jbc.org/
Dow
nloaded from
G. S, Adair 531
Parsons and Parsons (12). Prof. Henderson suggests the S- shaped curve may be due to changes in base bound on oxygenation.
111. Aggregation.-Douglas, Haldane, and Haldane (13) and Haldane (14). Reduced hemoglobin more aggregated than oxyhemoglobin.
IV. Aggregation and Osmotic Pressure.-Barcroft and Roberts (2), Hill (15), Barcroft and Hill (16), Barcroft (7), Hill (17),
TABLE II.
Influence of pH, NaHCO,, and CO2 on the Ajinity of Hemoglobin for Oxygen. A 2 log x of Acid Preparation 3 minus log zr observed at the same satura-
tion. Column 1 gives the source of the blood. CO2 p = tension of COz.
SOURX.
F. and F. A. V. B. W. A.
“
H. F. W. A. H. F.
I‘ ‘I
W. A. A. V. B. H. F. A. V. B. W. A.
“
A PH -_
0 6.0* 0.27 6.66* 0.21 6.98 0.19 7.06 0.43 7.14 0.31 7.22 0.42 7.44 0.39 7.42 0.40 7.43 0.36 7.48 0.43 7.52 0.43 7.66 0.47 7.75 0.96 8.36* 0.87 8.36*
-
CO2 ombinec
vol. per cent
2.0 9.0 9.0
19.0 24.2 74.6 53.0 50.5 47.0 45.1
127.1 40.8
114.2 0 0
PC02
mm.
45.9 42.0 20.2 35.7 38.3 58.2 41.4 41.5 38.0 32.3 82.5 19.3 43.7
0 0
-
--
-
z
mm. Hg
49.6 26.5 28.7 49.3
6.6 44.6
6.5 19.1 35.5 27.1
7.0 6.4 8.4 8.4
18.1
per cent saturatio
53.2 53.0 45.7 75.5 12.7 82.8 12.0 47.8 82.8 76.7 14.0 16.8 20.0 76.9 93.5
--
‘7%
47.6 25.5 29.3 30.8 17.7 23.3 18.1 19.4 19.0 20.8 17.7 17.7 16.1
5.2 6.4
The Oz pressure at y = 50 per cent = anti log (1.678-A). The pH estimates starred have a range of error of f 0.3. The acid preparation is the first in Table I.
Hill (18), Barcroft and others (6), and Brown and Hill (19). In distilled water, hemoglobin is unimolecular-molecular we$ght 16,666-and the dissociation curve is a rectangular hyperbola. In salt solutions, polymerization takes place-apparent degree of aggregation is n-where n is strictly defined by Hill as the reduc- tion in osmotic pressure whatever the cause. This theory leads to the formula
by guest on May 9, 2019
http://ww
w.jbc.org/
Dow
nloaded from

532 Hemoglobin System. VI
Kx”
’ = I + Kx” y = Oxygen saturation. x = Oxygen pressure.
TABLE III.
Oxygen Dissociation Curve of Hemoglobin in Isotonic Salt Solutions of Composition 0.1 M K, 0.1 iwC1, ~/lb PO&, (~/?‘.6) Na, pH 8.08.
HbOz = oxygen capacity. 2 = 02 tension. 9 = percentage of oxvgena- tion. 1 L -
. -
-
“- B, C, and D = P reparations 1 and 2 on man and 1 and 2 on horse.
HbOa
vol. per cent 22.5
21.9
21.9
7.3
29.3
z Y HbOo z I
mm. Hg
9.2 1.4
11.0 15.3 22.7 34.0
3.6 12.6 20.5 29.4 47.2 14.0 20.5 10.1
per cent raturation
32.0 43.5 48.5 65.5 84.9 90.0 11.2 53.7 79.7 87.5 93.7 63.5 80.0 44.1
12.9 59.8 19.2 69.8 21.1 77.0 15.9 73.1 19.7 79.8 27.1 91.1
-
-
vol. per cent
19.6
9.8
15.0
7.5
mm. Hg
6.6 11.5 12.9 13.2 23.2 37.7 44.5 12.0 17.4 24.3 35.5 51.0
5.8 14.8 18.3 42.5 75.0
4.2 13.9 19.0 42.7
per cd. M.wotion
17.6 39.4 48.8 53.0 79.7 92.0 92.3 49.2 72.6 83.0 96.4 94.1 36.0 79.0 89.0 98.0
100.0 35.5 80.0 90.8 96.0
There are two fundamental postulates in Prof. Hill’s theory:
(1) the osmotic pressure of hemoglobin is k of the equivalent
of oxygen. 10.21
P= TXC
where c = gm. Hb per 100 cc. solvent and n = 2.2 (2).
Hemoglobin and oxyhemoglobin are homogeneous and separable substances.
by guest on May 9, 2019
http://ww
w.jbc.org/
Dow
nloaded from

G. S. Adair 533
Adair tested these assumptions by direct experiment. Quali- tatively, Hill’s theory was confirmed for n was over 1, showing that aggregates with more than 1 iron atom were present. Quanti- tatively, Hill’s theory was not confirmed.
Testing equation (1) it was found that the relation of p and C was a curve.
10 - 21
(
c p=- 4 1 - 0*015c >
The apparent value of n was not constant.
Ad&s Theory.
Adair’s theory (20) is that the molecular weight of hemoglobin is 66,700.
Equation (2) was applied to calculate a dissociation curve, assuming homogeneous equilibrium. The formula was
log x - log x 10 = t log 9 f 0.000638 bHbo2 - PHb) (3)
log x50 = oxygen pressure at half saturation; pnbol and pnb, osmotic pressures of oxy and reduced Hb. The formula has one merit, there are no undetermined constants, but the agree- ment with the’ data is not close. n is too large. The probable cause of this is that Hb and HbOz are not strictly homogeneous and separable substances. A qualitative explanation is that both Hb and HbOz exist on the same molecule, Hb4.
Adair’s hypothesis is that the molecule Hb,(Os), is built up and broken down in stages. Unfortunately this hypothesis does not lead to a formula for the oxygen dissociation curve. An exploration of various possibilities was made and the results reported below, but no quantitative conclusions were arrived at.
The general formula for the building up of the 4 oxygen mole- cules was deduced for the ideal solution where all components obey the mass law.
0.25K1x + 0.5K2x2 + 0.75K@ + Knx4 Y= 1 + KIX + Ksx2 +K& + Kd (4)
If the K terms are deduced in the simplest possible manner from the kinetic theory, the following results are obtained.
by guest on May 9, 2019
http://ww
w.jbc.org/
Dow
nloaded from

534 Hemoglobin System. VI
K = 1, K, = 3/8, KS = l/16, Ka = l/256
Substituted in formula (4) these give formula (5).
It is known that this formula is not correct, so it is necessary to consider the possible disturbing influences. No theory can be developed, but a suggestion may be considered, in the hope that it may be of assistance in visualizing the points at issue.
The 4 iron atoms may be close together and the system with four oxygens may be very much more stable than the inter- mediates. Formula (6) gives the type of relation which might be expected with this distribution of iron atoms.
1/ = 0.25(Kz) + 0.25(K~)~ + 0.25(K~)~ + (FL)* 1 + Kx + 0.5(K~)~ + 0.333(K~)~ + (KS) (‘3
This is written below in the abbreviated form
Y = f(G) (7)
It is hardly necessary to detail the steps in the derivation of equation (6) because so many relations are possible that it would be a matter of chance if the details were correct. The formula proves the proposition that n by the oxygen curve may be smaller than n measured by osmotic pressures. The simplified formula (7) is useful in later stages of the work.
It will be seen that although the oxygen dissociation curve has been attacked by many workers, no solution has been put forward which gives a completely satisfying reason why the curve has a form adapted to the needs of the organism, rather than the form given by the simple laws of physics and chemistry.
Hyperbolic Dissociation Curve in Distilled Water.
The well known rectangular hyperbola in distilled water, executed by Barcroft and Roberts (2), has played a great part in the development of the theory of hemoglobin solutions. It is the foundation stone of the theories of Prof. Hill and Mr. J. B. S. Haldane. It appears to contradict the theory of Adair.
It is quite certain that in the presence of acids hemoglobin
by guest on May 9, 2019
http://ww
w.jbc.org/
Dow
nloaded from
G. S. Adair 535
does change its state of aggregation, and the theory that the low n in distilled water is due to the formation of unimolecular hemo- globin is extremely probable. The many arguments in favor of unimolecular hemoglobin make it very ,necessary to consider the case for the constant molecular weight of Adair’s theory
The data given below show that when corrections are made for the change in acidity on oxygenation, the hyperbolic curve is not obtained. The corrected value of n is about 2, practically the same as in blood. Hence there is no need to assume that unimolecular hemoglobin is formed in the dialysis of human hemoglobin.
The effect found by Barcroft and Roberts is a little larger than can be accounted for by the correction given below, so there
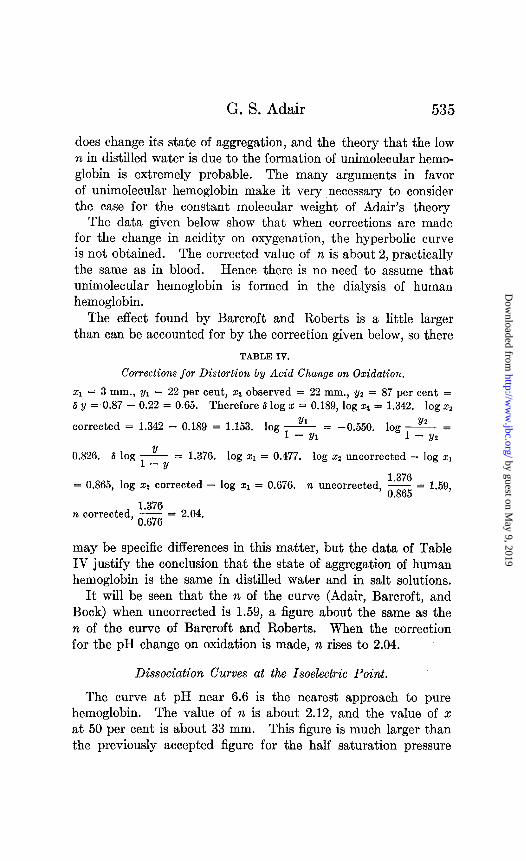
TABLE IV.
Corrections for Distortion by Acid Change on Oxidation.
21 = 3 mm., yl = 22 per cent, x1 observed = 22 mm., yz = 87 per cent = S y = 0.87 - 0.22 = 0.65. Therefore 6 log 5 = 0.189, log zz = 1.342. log x2
Yl corrected = 1.342 - 0.189 = 1.153. log - Y/z 1 - Yl
= -0.550. log - = 1 - y2
0.826. 6 log --!!- 1-Y
= 1.376. log x1 = 0.477. log xz uncorrected - log 2,
1.376 = 0.865, log 22 corrected - log z1 = 0.676. n uncorrected, - = 1.59,
0.865
n corrected, iz = 2.04.
may be specific differences in this matter, but the data of Table IV justify the conclusion that the state of aggregation of human hemoglobin is the same in distilled water and in salt solutions.
It will be seen that the n of the curve (Adair, Barcroft, and Bock) when uncorrected is 1.59, a figure about the same as the n of the curve of Barcroft and Roberts. When the correction for the pH change on oxidation is made, n rises to 2.04.
Dissociation Curves at the Isoelectric Point.
The curve at pH near 6.6 is the nearest approach to pure hemoglobin. The value of n is about 2.12, and the value of x: at 50 per cent is about 33 mm. This figure is much larger than the previously accepted figure for the half saturation pressure
by guest on May 9, 2019
http://ww
w.jbc.org/
Dow
nloaded from

536 Hemoglobin System. VI
of pure hemoglobin, about 8 mm., but the old figure was probably obtained on a preparation of sodium hemoglobinate. Adolph and Ferry’s result is ~50 = 25 & 5 for horse hemoglobin.
Dissociation Curves on the Acid Side of the Isoelectric Point.
The curve marked pH 6.0 on Fig. 1 and the data of “May 14, Table I, ” are of interest for two reasons. First, the solution was unaffected by COZ. Since more acid did not affect it, the curve must be near the position of minimum affinity for oxygen. For this reason it was used as a base line for measuring the extra
TABLE V.
Theoretical and Observed Dissociation Curves.
0.25Klz + 0.5K& + 0.75K323 + Kbx4 1J=
1 + KIT + K,x2 + Ka.9 + Ktx4 (4)
z calculated.
lag 5 calculated.
log J- l--Y
calcuhted. .
0.1 2.5 0.000 -1.591 0.2 5.2 0.301 -1.265 0.5 16.3 0.699 --0.710 0.8 33.6 0.903 -0.297 1.0 45.6 0.000 -0.075 1.2 57.0 0.079 +o. 122 1.5 69.8 0.176 f0.364 2.0 82.3 0.301 +0.667 2.5 88.8 0.398 +0.900 3.0 92.2 0.477 $1.073 4.0 95.6 0.602 +1.336
Where K, = 1, Kz = 0.5, K, = 0.3 1, a md Kq = 1.
log 2 observed.
0.74 -1.42 1.06 -1.07 1.37 -0.61 1.42 -0.55 1.75 +0.1s 1.86 +0.44 1.94 $0.55 1.70 +0.06
log -E l--v
observed.
log x calculated + 1.65 = log z observed.
affinity for oxygen caused by changing the pH. In Table II the affinity is calculated by deducting log x of the solution meas- ured from log x of the acid preparation at the same value of y.
Second, the data were used to test formula (6). This was done by two methods. In Fig. 1 the theoretical values of x and y were calculated and the data marked with crosses. In Fig. 2
log --Y- and log x were calculated and the observed data plotted. 1-Y
This figure shows how the formula produces the curious upward
by guest on May 9, 2019
http://ww
w.jbc.org/
Dow
nloaded from
G. S. Adair 537
curvature of the logarithmic curve. The data are collected in Table V. The two series differ by a term which is approxi- mately constant. If Hill’s ‘theory was correct, the points of Fig. 2 should fall on a straight line, so it is clear that a theory rather more complex than Hill’s is required to explain the facts. The number of constants in equation (6) is so large that this agreement has little theoretical significance.
FIG. 1. Oxygen dissociation curves at different H ion concentrations. y = percentage of oxygenation. 2 = oxygen pressure in mm.
E$ect of the OH Ion on the Afinity of Hemoglobin for Oxygen.
The data of Table II show that the pH practically determines the affinity of hemoglobin for oxygen. There is some variation with changes in the NaHC03 concentration, ‘but these are small compared with the effects of pH. This conclusion is borne out by Fig. 4, where all the points are plotted. Some variation is present, but the variations due to differences in NaHC03 are of minor importance.
by guest on May 9, 2019
http://ww
w.jbc.org/
Dow
nloaded from

538 Hemoglobin System. VI
Formula (6) can be written in the abbreviated form
The affinity of hemoglobin for oxygen is proportional to the log of the equilibrium constant, K.
If the K ratios of formula (6) are constant, a very simple method of calculating afllnity can be devised, for at any given saturation Kx must be constant, therefore the change in log K equals minus the change in log x.
LOG x
FIG. 2. Test of formula (6). Curve drawn from 6 experimental points from Table IV.
Taking the standard acid curve as a base line, the increase in log K with pH can be obtained by subtracting log x of the alkaline solution from log 2 of the acid preparation at the same value of y. This gives A, the change in affinity.
by guest on May 9, 2019
http://ww
w.jbc.org/
Dow
nloaded from
G. S. Adair 539
A = log z acid preparation - log z alkaline solution.
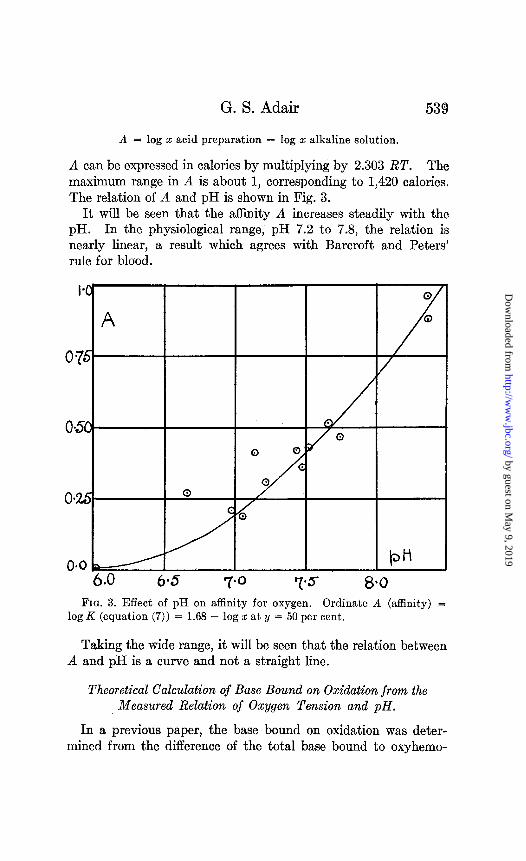
A can be expressed in calories by multiplying by 2.303 RT. The maximum range in A is about 1, corresponding to 1,420 calories. The relation of A and pH is shown in Fig. 3.
It will be seen that the affinity A increases steadily with the pH. In the physiological range, pH 7.2 to 7.8, the relation is nearly linear, a result which agrees with Barcroft and Peters’ rule for blood.
FIG. 3. Effect of pH on affinity for oxygen. Ordinate A (affinity) = log K (equation (7)) = 1.68 - log z at y = 50 per cent.
Taking the wide range, it will be seen that the relation between A and pH is a curve and not a straight line.
Theoretical Calculation of Base Bound on Oxidation from the Measured Relation of Oxygen Tension and pH.
In a previous paper, the base bound on oxidation was deter- mined from the difference of the total base bound to oxyhemo-
by guest on May 9, 2019
http://ww
w.jbc.org/
Dow
nloaded from
540 Hemoglobin System. VI
globin and the total base bound to reduced hemoglobin at the same pH.
Assuming the theory of non-stoichiometric reactions (Adair (20)), it should be possible to calculate this quantity from meas- urements of [OH] ions and 02 pressures, without any direct estimates of base bound. Let 2 = mols of base bound per mol of Hb oxidized. Then applying equation (3)
- dlog [O,l ’ = d log [OH]
Therefore,
TABLE, VI.
PH Z calculated. AB observed.
6.0 6.6 7.0 7.2 7.4 7.6 7.8
-
-
0.10 0.20 0.40 0.43 0.46 0.51 0.57
0.08
0.41
0.51 0.56 0.55
Hence Z can be calculated by drawing tangents to the curve of Fig. 3. These values are tabulated in Table VI with values of AB-the observed values of base bound-from Table VI of Paper V.
This table is a most striking confirmation of the theory of non-stoichiometric reactions. The deviations observed are well within the limits of experimental error.
Heat of Reaction of Oxygen and Hemoglobin.
Brown and Hill’s (19) work on the heat of reaction of oxygen and hemoglobin forms a strong argument in favor of Hill’s theory.
In presenting an alternative theory it is necessary to prove that the heat of reaction data are consistent with it.
Hill shows that if the oxygen concentration is maintained constant, and y is the saturation at temperature T1 and y2 at T2, then
by guest on May 9, 2019
http://ww
w.jbc.org/
Dow
nloaded from
G. S. Adair 541
Y K1 x=1 ~2 - k2 xn l-y- 1 - y2
1% Yl log Y2 log K1 - log Kz = - - __
1 - Yl 1 - $42
This result can be applied to calculate q from the formula of van% Hoff.
d log K -E-g& dT
The caIculated q is equal to nQ, where Q is the observed heat. It is impossible to use a method exactly like Prof. Hill’s with formula (6), but a very simple method can be devised based on formula (7).
Temperature.
“C.
21.5
37.5
48.0
Saturation. Y
14.7 4.6 4.3 0.63 65.1 13.6 12.6 1.10 96.4 35.3 32.7 1.51 16.0 14.0 12.3 1.09 41.2 34.9 30.7 1.49 61.5 62.6 55.0 1.74 78.9 67.3 58.2 1.76 17.6 35.9 30.5 1.48 28.7 51.5 43.8 1.64 31.4 53.6 44.6 1.65
TABLE VII.
Prwsure. z
-
-
If the percentage saturation is maintained constant, Kx must be constant, therefore log 2 + log K must be constant. Therc- foredlogx =--dlogK.
Table VII gives oxygen dissociation curves of dialyzed hemo- globin, prepared from the blood of Dr. H. Field. This experiment was suggested by Prof. Henderson. These data are shown in Fig. 4. On account of the slight uncertainty of the middle curve, the variation of Q with temperature is not estimated, but the average Q value can be determined.
by guest on May 9, 2019
http://ww
w.jbc.org/
Dow
nloaded from

542
1.8
I.6
08
0.6
Hemoglobin System. VI
FIG. 4. Influence of temperature on oxygen dissociation. Ordinate = log of oxygen pressure; abscissa, y, percentage of saturation.
Calculation of Q.
Tz - T1 = (48" - 21.5”) = 26.5 log, x2 - log, x1 = 3.46 - 1.525 = 1.935 at y = 20 per cent.
d log, -& = - d log, 5 = - 0.0731 (mean value).
- & = d log, -& (ET”)
R=2 T = 34.7”C. = 307.7” absolute. T2 = 94,500 & = 2 X 0.0731 X 94,500 = 13,600 calories.
This calculated value of Q may be compared with the measured value of Q of different observers.
by guest on May 9, 2019
http://ww
w.jbc.org/
Dow
nloaded from

G. S. Adair 543
Q
13,00l319,000 11,600 10,000 11,500
15,000
27,000
-
--
-
Observer.
du Bois-Reymond (21). Berthelot (22). Adolph and Henderson (23). Brown and Hill (19).
‘I ‘I “ (19).
Barcroft and Hill (16).
-
-
Remarks.
34°C. Boric acid blood.
34°C. CO*-free blood.
34°C. No salt, pH 8 (?).
It will be seen that increase of pH increases Q as it increases affinity. Removal of salts also increases Q as it increases the affinity A.
Our experiments on a purified hemoglobin would be inter- mediate in pH between the acid blood of Brown and Hill and the COz-free blood, and it will be seen that Q calculated from the K of formula (7) lies between 11,500 and 15,000.
TABLE VIII.
Preparation No. Letter. 02 capacity. HbOz
Manl................ A 22.5 0.010 “2 . . . . . . . . . . . . . . . . B 19.6 0.0088 (( 3 d................ B 9.8 0.0044
Horsel............... C 15.0 0.0067
‘I 1. . . . . . . . . . . . . . C 7.5 0.0033 “ 2............... D 21.9 0.0098
D 7.3 0.0033
z at 50 per cent saturation.
12.3 13.3 12.2
7.0 6.5
11.8 11.5
In order to calculate Q from the effects of temperature on the dissociation curve, it is necessary to determine n if Hill’s method is used. The method based on Adair’s formula gives Q directly; therefore, the advantage of simplicity lies with the latter.
E$ect of Salts on Afinity at Constant pH.
The data of Table III were graphed and the half saturation pressures were estimated. 02 capacity = oxygen capacity. HbOz = mols of 02 per liter of solution. The solvent was X(0.1 M),
Na (~/7.5), Cl(O.1 M), Poh(M,/15), pH 8.08, corrected for the Donnan equilibrium pH = 8.03.
by guest on May 9, 2019
http://ww
w.jbc.org/
Dow
nloaded from
544 Hemoglobin System. VI
SUMMARY AND CONCLUSIONS.
Tables of data on oxygen equilibrium curves of pure human hemoglobin are given, and a brief analysis of various t,heories is made.
Adair’s measurements of osmotic pressure can be reconciled with the oxygen data by the theory that the complex molecule Hb? (02)4, or Hgb (Oz)+ is built up and broken down to Hgb and 402 in stages.
Methods of correction for the acid change on oxidation are worked out, proving that the curve in distilled water is practi- cally the same shape as in blood, rather than the well known hyperbola of the law of mass action.
The linear relation between pH and affinity for oxygen found by Barcroft and Peters for blood was found to apply to homoge- neous hemoglobin solutions only over a narrow range. It was shown that the base bound on oxidation AB could be calculated from this curve, applying the equation given below (Adair (20)).
Data are given on the effects of hemoglobin and salt concentra- tion and also temperature on the affinity for oxygen. The heat of reaction of pure human hemoglobin is about 13,600 calories per mol of oxygen.
BIBLIOGRAPHY.
1. Htifner, G., Arch. Anat. u. Physiol., Physiol. A&., 1901, 187. 2. Barcroft, J., and Roberts, F., J. Physiol., 1909-10, xxxix, 143. 3. Adolph, E. F., and Ferry, R. M., J. Biol. Chem., 1921, xlvii, 547. 4. Adair, G. S., Barcroft, J., and Bock, A. V., J. Physiol., 1921, Iv, 332. 5. Barcroft, J., Camis, M., Mathison, C. G., Roberts, F., andRyffe1, J. H.,
Phil. Trans. London, Series B, 1914-15, ccvi, 69. 6. Barcroft, J., Bock, A. V., Hill, A. V., Parsons, T. R., Parsons, W., and
Shoji, R., J. Physiol., 1922, Ivi, 157. 7. Barcroft, J., and Poulton, E. P., in Barcroft, J., The respiratory func-
tion of the blood, 1914, Cambridge, 59. 8. Bock, A. V., Field, H., Jr., and Adair, G. S., J. BioZ. Chem., 1924, lix,
353. 9. Ostwald, W., Biochem. Centr., 1908, xxviii, 416.
10. Bayliss, W. M., Principles of general physiology, London, New York, Bombay, Calcutta, and Madras, 3rd edition, revised, 1920, 618.
by guest on May 9, 2019
http://ww
w.jbc.org/
Dow
nloaded from
G. S. Adair
11. Henderson, L. J., J. Biol. Chem., 1920, xli, 401. 12. Parsons, T. R., and Parsons, W., J. Physiol., 1922, lvi, 1. 13. Douglas, C. G., Haldane, J. S., and Haldane, J: B. S., J. Physiol., 1912,
xliv, 275. 14. Haldane, .I. S., Respiration, New Haven, 1922,80. 15. Hill, A. V., J. Physiol., 1910, xl, p. iv. 16. Bareroft, J., and Hill, A. V., J. Physiol., 1909-1910, xxxix, 411. 17. Hill, A. V., Biochem. J., 1921, xv, 577. 18. Hill, A. V., J. BioZ. Chem., 1922, li, 359. 19. Brown, W. E. I,., and Hill, A. V., Proc. Roy. Sot. London, Series B,
1923, xciv, 297. 20. Adair, G. S., J. Physiol., 1923, lviii, p. iv. 21. du Bois-Reymond, R., Arch. Anat. u. Physiol., Physiol. AM., 1914, 237. 22. Berthelot, M., Compt. rend. Acad., 1889, cix, 776. 23. Adolph, E. F., and Henderson, L. J., J. BioZ. Chem., 1922,1,463.
by guest on May 9, 2019
http://ww
w.jbc.org/
Dow
nloaded from

V. Bock and H. Field, Jr.G. S. Adair and With the collaboration of A.
HEMOGLOBINOXYGEN DISSOCIATION CURVE OF
THE HEMOGLOBIN SYSTEM: VI. THE
1925, 63:529-545.J. Biol. Chem.
http://www.jbc.org/content/63/2/529.citation
Access the most updated version of this article at
Alerts:
When a correction for this article is posted•
When this article is cited•
alerts to choose from all of JBC's e-mailClick here
ml#ref-list-1
http://www.jbc.org/content/63/2/529.citation.full.htaccessed free atThis article cites 0 references, 0 of which can be by guest on M
ay 9, 2019http://w
ww
.jbc.org/D
ownloaded from


![Names indexed from the Tithe Applotment Books …billmacafee.com/182030stithe/tithenorthantrim.pdf1851 Adair Adair James 1826 Cary Billy Clogher Lower [Low Clogher] 3867 Adair Adair](https://img.pdfslide.net/doc/110x75/5b3339c77f8b9a81728d252d/names-indexed-from-the-tithe-applotment-books-adair-adair-james-1826-cary-billy.jpg)


![[4] Adair Berguiga](https://img.pdfslide.net/doc/110x75/55cf9c5d550346d033a997a4/4-adair-berguiga.jpg)