Embed Size (px)
Citation preview

ATTITUDES AND SOCIAL COGNITION
The Heritability of Attitudes: A Study of Twins
James M. Olson, Philip A. Vernon,and Julie Aitken Harris
University of Western Ontario
Kerry L. JangUniversity of British Columbia
The genetic basis of individual differences in attitudes was examined in a survey of 195 pairs ofmonozygotic twins and 141 pairs of same-sex dizygotic twins. A principal components analysis of the 30attitude items in the survey identified 9 attitude factors, of which 6 yielded significant heritabilitycoefficients. Nonshared environmental factors accounted for the most variance in the attitude factors.Possible mediators of attitude heritability were also assessed, including personality traits, physicalcharacteristics, and academic achievement. Analyses showed that several of these possible mediatorscorrelated at a genetic level with the heritable attitude factors, suggesting that the heritability of themediator variables might account for part of the heritable components of some attitudes. There was alsosome evidence that highly heritable attitudes were psychologically "stronger" than less heritableattitudes.
A truism in the social psychological literature on attitudes is thatattitudes are learned (e.g., see Eagly & Chaiken, 1993; Olson &Zanna, 1993; Oskamp, 1991). That is, evaluations of objectsdevelop through experience. For example, it is generally agreedthat humans are born without predetermined attitudes toward tar-gets, except perhaps a few stimuli closely related to survival (e.g.,aversions to pain and cold, attractions to breast milk and the humanface). Instead, evaluations of the multitude of stimuli in our envi-ronments are formed over the years, on the basis of both personalexperiences and information from others.
A common corollary of the hypothesis that attitudes are learnedis the idea that attitudes are environmentally caused. That is, ifattitudes develop through experience, then it seems to follow thatattitudes are determined by environmental factors (i.e., lifeexperiences).
To be sure, the environment is necessary for the development ofattitudes. But the hypothesis that attitudes are learned is not in-compatible with the notion that biological and genetic factors alsoinfluence attitudes. That is, there is a second necessary componentto the development of attitudes: the biological organism withinwhich events are subjectively experienced and mnemonically re-
James M. Olson, Philip A. Vernon, and Julie Aitken Harris, Departmentof Psychology, University of Western Ontario, London, Ontario, Canada;Kerry L. Jang, Department of Psychiatry, University of British Columbia,Vancouver, British Columbia, Canada.
We thank John DeFries, Charles Judd, and Abraham Tesser for theircomments on versions of this article.
Correspondence concerning this article should be addressed to James M.Olson, Department of Psychology, University of Western Ontario, London,Ontario N6A 5C2, Canada. Electronic mail may be sent to jolson®julian.uwo.ca.
corded. Biological factors presumably mediate and moderate theimpact of personal experiences, in that events are experiencedthrough our sensory structures, and memories and evaluations arestored in our brains.
Yet the role of biological factors, particularly genetic variables,in attitude formation and change has received little attention fromsocial psychologists (although some behavioral geneticists haveinvestigated attitudes; e.g., Eaves, Eysenck, & Martin, 1989; Loeh-lin & Nichols, 1976). Social psychologists have examined a fewbiological factors, such as the physiological concomitants of atti-tudes (e.g., Cacioppo & Petty, 1987), the impact of certain drugson attitudes and persuasion (e.g., Bostrom & White, 1979), and therole of arousal in specific attitudinal phenomena such asdissonance-motivated persuasion (e.g., Zanna & Cooper, 1974).But benign neglect probably best characterizes the state of researchin social psychology on biological factors in attitudes. For exam-ple, in the most comprehensive exisiting review of the attitudesliterature (Eagly & Chaiken, 1993), there was little discussion ofbiological processes.
The Possible Role of Genetic Factors in Attitudes
In this article, we present data investigating the issue of geneticdetermination of the differences between individuals in their ex-pressed attitudes. Given the relative unfamiliarity of a geneticperspective in social psychology, it might be useful, before re-viewing relevant studies, to address why a genetic perspective issensible and how genes could possibly influence evaluations.
Heredity and environment are so intertwined that it is impossi-ble to disentangle them completely. Genetic factors exert theirinfluence on an organism that is in a particular environment, so thefinal product is inevitably a combination of biological and expe-riential factors. Asking how much a particular individual's atti-
Journal of Personality and Social Psychology, 2001, Vol. 80, No. 6, 845-860Copyright 2001 by the American Psychological Association, Inc. 0022-3514/01/S5.00 DOI: 10.1037//0022-3514.80.6.845
845

846 OLSON, VERNON, HARRIS, AND JANG
tudes or traits are due to heredity versus the environment isnonsensical, just like asking whether a leaky basement is causedmore by the crack in the foundation or the water outside. In a veryreal sense, genetic effects are also environmental because theyemerge in an environment, and environmental effects are alsogenetic because they are mediated by biological processes.
Notwithstanding the intertwining of heredity and environment,it is possible to estimate the extent to which differences betweenindividuals on an attitude or trait can be attributed to genetic versusenvironmental factors. That is, within a particular range of envi-ronmental and genetic "values" or "scores" (namely, the range inthe sample), it is possible to estimate whether interindividualdifferences reflect variation in the environmental scores and/or thegenetic scores. Estimates of genetic influence are labeled herita-bility coefficients.
Note that heritability coefficients do not indicate the extent towhich characteristics are genetically caused (which, as mentionedearlier, is impossible to determine). Rather, they indicate the extentto which variation on the characteristic in the sample is attributableto genetic differences. Any genetic or environmental influencesthat apply uniformly to all members of the sample will not bereflected in this statistic. For example, "two-leggedness in humansis highly genetically determined, but differences in leggednessamong humans are mostly due to environmental accident" (Loeh-lin & Nichols, 1976, p. 1); thus, individual differences in legged-ness would generate a low heritability coefficient despite thepredominantly genetic basis of two-leggedness.
Heritability coefficients are dependent on the variability ofenvironmental and genetic scores in the sample. If members of asample were genetically identical, then any variation in phenotypewould necessarily be due to environmental factors. If members ofa sample had experienced identical environments, then any varia-tion in phenotype would necessarily be due to genetic factors. Tothe extent that a sample is representative of a larger population interms of the heterogeneity of genes and environments, heritabilitycoefficients reflect the percentage of the variation in a character-istic among members of the population that is attributable togenetic factors.
Genetic influences also do not imply that the characteristic isunchangeable. To take a simple example, hair color is geneticallydetermined but is completely malleable. Thus, learning that atti-tudes or traits have significant heritabilities does not mean they areinevitable or impossible to alter (although Tesser, 1993, has spec-ulated that heritable attitudes may have a biological substrate thatmakes attitude change more difficult). For instance, if members ofa population have been exposed to very similar environments withregard to a particular characteristic (e.g., they have all been ex-posed to extensive propaganda regarding a particular belief), thecharacteristic (belief) will yield a high heritability coefficient inthat sample even though a different environment would haveproduced very different scores (beliefs).
Turning to a more specific issue, how could genes produceparticular evaluations of objects by individuals? First, it is ex-tremely unlikely that there are direct, one-to-one connections be-tween genes and attitudes (e.g., a gene that causes attitudes towardcapital punishment) or even many-to-one connections (e.g., a set ofgenes that, together, cause attitudes toward capital punishment).Rather, genes probably establish general predispositions or naturalinclinations, which then shape environmental experiences in ways
that increase the likelihood of the individual developing specifictraits and attitudes. For example, children who are naturally smallfor their age might be picked on by other children more than theirlarger peers. As a result, these children might develop anxietiesabout social interaction, with consequences for their personality(e.g., introversion) and their attitudes (e.g., dislike for parties).
What are some specific genetically influenced characteristicsthat might systematically bias environmental experiences so as toinduce particular attitudes? Tesser (1993) identified several possi-bilities, including intelligence, sensory structures, and tempera-ment. Intelligence is widely—though not universally—viewed ashaving a heritable component (e.g., DeFries, Plomin, & LaBuda,1987; Snyderman & Rothman, 1987). Intelligence could plausiblybe linked to many attitudes, ranging from enjoyment of specificintellectual activities like reading and chess to attitudes towardmore global targets like education and the role of computers in ourlives. In addition, if attitudes toward controversial issues are in-fluenced systematically by cognitive reasoning, then intelligencemight also contribute to a genetic component in those attitudes.Sensory structures are inarguably genetically based, at least in part,and could influence preferences for various types of sensory ex-periences. For example, taste differences could affect attitudestoward chocolate, hearing sensitivity could affect attitudes towardloud music, and differences in inner-ear structures that maintainbalance could affect attitudes toward roller coaster rides. Person-ality and temperament characteristics have been a central focus ofbehavioral genetics research. Evidence exists to support geneticand biochemical components of several personality traits, includ-ing sociability, neuroticism, and sensation seeking (e.g., Bouchard& McGue, 1990; Loehlin, 1989; Loehlin & Nichols, 1976; Telle-gen et al, 1988; Zuckerman, 1995). These broad traits couldinfluence a wide range of attitudes, with some obvious examplesbeing sociability affecting attitudes toward meeting new people,neuroticism affecting attitudes toward alcohol, and sensation seek-ing affecting attitudes toward skydiving. In a nonattitudinal do-main, Jockin, McGue, and Lykken (1996) found that geneticfactors affecting personality accounted for a substantial portion ofthe heritability of a different construct, divorce risk. That is, theheritability of divorce risk was shown to be related to geneticallybased differences in personality.
Thus, there are many characteristics, themselves having a ge-netic component, that could affect individuals' attitudes. Thesevariables constitute potential mediators of the genes-attitudes re-lation. In other words, these variables might be mediating mech-anisms that underlie connections between genes and attitudes.
Past Research on Attitude Heritability
As mentioned above, researchers have shown that individualdifferences on a variety of broad personality factors are partlyattributable to genetic differences (e.g., Loehlin & Nichols, 1976;Tellegen et al., 1988). These factors, such as sociability, domi-nance, and self-acceptance, are generally presumed to encompassmany specific attitudes. There have also been demonstrations thatspecific behaviors (which may imply specific attitudes) have sig-nificant heritabilities, including alcohol consumption (Partanen,Bruun, & Markkanen, 1966) and television viewing (Plomin, Cor-ley, DeFries, & Fulker, 1990).

HERITABILITY OF ATTITUDES 847
But what about the heritability of specific attitudes themselves?A small number of researchers have examined directly whetherevaluations of individual targets (objects, behaviors, issues, etc.)contain a heritable component.
For example, Perry (1973) examined a sample of 84 pairs oftwins (approximately half identical and half fraternal), who com-pleted Likert-type items assessing attitudes toward alcohol, ciga-rettes, and coffee. Previous researchers had found that behavioralvariability in each of these domains (e.g., amount consumed) waspartly attributable to genetic influences, so Perry wanted to seewhether the heritability of attitudes paralleled the behavioral find-ings. In fact, attitudes toward alcohol manifested a significantheritability coefficient, with genetic factors accounting for 51% ofthe variance in alcohol attitudes, whereas attitudes toward ciga-rettes and coffee did not yield significant heritability estimates.
Scarr and Weinberg (1981) administered the Authoritarianismscale (California F-Scale; Adorno, Frenkel-Brunswik, Levinson, &Sanford, 1950) to the members of 120 biological and 112 adoptivefamilies, involving approximately 450 children. This scale con-sisted of 20 sociopolitical statements, to which respondents indi-cated their agreement or disagreement. The results showed gener-ally nonsignificant correlations between the total authoritarianismscores of members of adoptive families (except husband-wife) butconsistently significant correlations between the total scores ofmembers of biological families. On the basis of some furtheranalyses involving IQ scores, the authors hypothesized that thegenetic transmission of verbal ability partly accounted for thebiological component of authoritarianism.
Arvey, Bouchard, Segal, and Abraham (1989) studied 34 pairsof identical twins who were reared apart. These participants com-pleted a 20-item job satisfaction questionnaire. Results showedthat total job satisfaction scores yielded a significant heritabilityestimate, with approximately 30% of the variance in job satisfac-tion being attributable to genetic factors.
In a related study from the same laboratory, Keller, Bouchard,Arvey, Segal, and Dawis (1992) administered a work values in-ventory to 43 pairs of twins who were reared apart (23 identicaland 20 fraternal). Six composite scores for work values werecomputed from respondents' expressed preferences for 20 individ-ual job outcomes (e.g., a composite score for the value attached to"achievement outcomes"), and all six yielded significant heritabil-ity coefficients, with the proportions of variance accounted forranging from 18% to 56% (M = 38%).
Waller, Kojetin, Bouchard, Lykken, and Tellegen (1990) sur-veyed 84 pairs of twins who were raised apart (53 identical and 31fraternal) and more than 800 pairs of twins who were rearedtogether (approximately 450 identical and 350 fraternal). Fivequestionnaires measuring religious attitudes and interests werecompleted by at least some participants: interest in choosing areligious occupation, involvement in religious activities duringleisure time, religious fundamentalism, religious interests, andreligious values. All five measures yielded significant heritabilitycoefficients, accounting for between 41% and 52% of the interin-dividual variance.
In the largest studies of genetic variability in specific attitudes,Eaves et al. (1989) reported the results of two surveys, one involv-ing almost 3,000 pairs of same-sex twins in Australia (approxi-mately 2,000 identical and 1,000 fraternal) and the other involvingapproximately 700 same-sex twins in Great Britain (approximately
450 identical and 250 fraternal). Australian respondents completeda 50-item measure of conservatism (Wilson & Patterson, 1968),which consisted of one- or two-word items (e.g., "death penalty,""hippies," "white superiority," "jazz," and "bible truth") to whichpeople answered "yes," "?," or "no." Thirty-three of the 50 itemsyielded significant heritability estimates, which ranged from 21%to 51% (see Martin et al., 1986). British respondents completed a60-item public opinion inventory (Eysenck, 1951), which con-sisted of attitude statements on a variety of issues, including crime,religion, and race (e.g., "Crimes of violence should be punished byflogging," "A person should be free to take his own life, if hewishes to do so, without any interference from society," "Theaverage man can live a good enough life without religion," and"The practical man is of more use to society than the thinker");respondents indicated the extent of their agreement or disagree-ment with each statement on a 5-point scale. Heritability estimatesfor individual items ranged from 1% to 62%, with a medianof 39%.
When the findings across different studies are examined, thereappears to have been some stability in the kinds of attitudes thathave yielded high heritabilities. Though not perfect, there has beena consistent tendency for attitudes toward the treatment of crimi-nals (e.g., death penalty, flogging) to produce high heritabilitycoefficients. Another domain of attitudes that has appeared heri-table is religious attitudes—not specific religious affiliations, butgeneral views about the value of religion (see Eaves et al., 1989).Attitudes toward authority and toward unconventional behaviorhave also yielded high heritability estimates in more than onestudy. In contrast, items that have yielded little evidence of heri-tability have included attitudes toward political ideologies (e.g.,socialism, capitalism) and attitudes toward behaviors by youngpeople (e.g., teenage drivers, pajama parties).
The Present Study
In the present study, we examined the genetic basis of individualdifferences in attitudes by collecting data from a large number ofmonozygotic (identical) and dizygotic (fraternal) twins. We as-sessed a wide range of attitude topics, including specific objects(e.g., sweets, roller coaster rides), social issues (e.g., capitalism,abortion on demand), and behaviors (e.g., playing chess, exercis-ing). Many of these attitudes had never before been measured intwin research. By comparing the correlations within identical andfraternal twins, we could estimate the amounts of variance betweenindividuals in attitudinal responses that were attributable to geneticfactors. We also calculated estimates of environmental influenceson the attitudes.
We had several goals in this research. One goal was to test thereplicability of past findings on the heritability of attitudes. Ifindividual differences in some attitudes really are strongly genet-ically determined, then they should yield high heritability coeffi-cients across studies (although, of course, sampling variability andmeasurement error can produce fluctuating results). As mentionedearlier, it is possible to identify attitude domains that have pro-duced either high or low heritabilities; we wanted to confirm thesefindings in another large-sample study.
A second (and more interesting) goal was to explore possiblemediators of genetic effects on attitudes. We hoped to identifyvariables that might underlie gene-attitude relations. This issue is

848 OLSON, VERNON, HARRIS, AND JANG
complex, so we wanted to begin exploring it by simply obtainingsome preliminary evidence. We measured several possible medi-ators directly through self-report assessments of physical charac-teristics (athleticism, appearance), academic achievement (as aproxy for intellectual abilities), and personality factors. We testedwhether these factors were themselves heritable and, if so, whetherthey shared genetic variance with heritable attitudes. That is, weexamined whether attitudes and potential mediators were corre-lated at the genetic level. Significant genetic correlations areconsistent with (though not definitive about) the hypothesis thatone variable's heritability is attributable to the heritability of theother variable. For example, if attitudes toward reading proved tobe heritable and also correlated at the genetic level with a measureof intelligence that was itself heritable, one interpretation could bethat attitudes toward reading were to some extent heritable becauseintelligence was heritable. For any attitude-mediator pairings thatshared genetic variance, we also examined mediation at the phe-notypic level (i.e., whether the phenotypic covariation between thevariables was consistent with a causal model going from themediator to the attitude). Finally, we also conducted analyses thatexplored whether potential mediators were involved in the herita-bility of all of the attitudes, not just particular attitudes. Specifi-cally, we tested whether the strength of the correlations betweenthe possible mediators and attitude scores predicted the heritabil-ities of the attitudes. If attitudes that correlate highly with amediator variable yield higher heritabilities than do attitudes thatdo not correlate with the mediator variable, then the mediatormight be a mechanism through which genes affect the set ofattitudes. For example, if the heritability coefficients of a set ofattitudes correlated with the correlations between the attitudes andthe personality trait of sociability, and if sociability were itselfheritable, then sociability would be implicated as a possible ex-planation of why or how the attitudes yielded significantheritabilities.
A third goal of our research was to gather data relevant to anidea put forward by Tesser (1993). Tesser hypothesized that atti-tudes that are highly heritable might have a biological basis thatmakes attitude change difficult. Because people find it difficult oruncomfortable to change these attitudes (and therefore do not liketo do so), they may develop psychological defenses to "protect"them. As a result, these attitudes may become "stronger" in apsychological sense. For example, "niche-building" might occur(see Plomin, DeFries, & Loehlin, 1977; Scarr & McCartney,1983), such that individuals seek out environments that are com-patible with their highly heritable attitudes or even construct theirown environments to protect these attitudes.
Tesser (1993; Crelia & Tesser, 1996; Tesser & Crelia, 1994) hastested this idea in several ingenious ways. In all of his studies,attitudes were selected for use that had been shown by Eaves et al.(1989) to have either high or low heritability coefficients. In onestudy, respondents were shown to provide their answers morequickly for high than for low heritability attitudes. In anotherstudy, individuals were found to be less affected by conformitypressure when reporting high than when reporting low heritabilityattitudes. In a third study, interpersonal similarity on high herita-bility attitudes was shown to affect liking more than similarity onlow heritability items. Finally, in two studies, people found agree-ment feedback more reinforcing when it was based on highlyheritable attitudes than when it was based on less heritable atti-
tudes. All of these results suggest that attitude strength is related toattitude heritability.
We examined this issue in a different way: We measured self-reported attitude strength for every item. We expected that atti-tudes that yielded high heritability coefficients would also yieldhigh average strength ratings.
Method
Participants
Pairs of adult twins were recruited through advertisements in localnewspapers asking for twins to participate in psychological research inreturn for monetary payment (the specific amount paid to participantsdepended on the set of questionnaires they were asked to complete). Twosamples of twins were collected, one in London, Ontario, Canada, and onein Vancouver, British Columbia, Canada. Participants were involved ineither the Western Ontario Twin Project or the University of BritishColumbia Twin Project, which are ongoing behavioral genetic studies ofpersonality and mental ability.
The full set of dependent measures reported in this article was completedby a total of 672 participants, consisting of 195 pairs of monozygotic (MZ)twins (128 female pairs and 67 male pairs) and 141 pairs of same-sexdizygotic (DZ) twins (97 female pairs and 44 male pairs). Zygosity wasdetermined through a questionnaire designed by Nichols and Bilbro (1966),which has a reported accuracy of 93%, as compared with the results ofblood typing (Kasriel & Eaves, 1976). The mean age of the participantswas 30.40 years (29.96 for the identical twins, and 31.02 for the fraternaltwins).
Dependent Measures
Along with other questionnaires unrelated to the present article, partic-ipants completed an attitude survey at home and returned it by mail. Thesurvey assessed participants' favorability toward 30 targets (includingcontroversial issues, personal activities, and social settings). The full set ofattitude targets is presented in Table 1. Each item was phrased, "My overallattitude toward [name of issue] is: ", with possible answers rangingfrom —3 (extremely unfavorable) through 0 (neutral) to 3 (extremelyfavorable). Immediately after indicating their favorability toward the tar-get, participants answered two questions that assessed the strength of theirattitude: "How important is this attitude to you?" with possible answersranging from 0 (not at all important) to 6 (extremely important), and "Howstrongly do you hold this attitude?" with possible answers ranging from 0{not at all strongly) to 6 (extremely strongly).
Participants also provided ratings of themselves on 20 personality traits,each of which represented a subscale of the Personality Research Form(Jackson, 1984). Three adjectives described each trait (e.g., "humble,self-blaming, puts self down," "ambitious, competitive, achieving"), andparticipants rated the self-descriptiveness of the trait on a scale from 0 (notat all) to 6 {very much). The full set of traits (as reflected by one of thethree adjectives) is presented in Table 2.
Participants also rated themselves on four additional items, two of whichassessed their physical capabilities: "How athletic (naturally good at phys-ical activities) are you?" with possible answers ranging from 0 (not at allathletic) to 6 (extremely athletic), and "How physically strong are you?"with possible answers ranging from 0 (not at all strong) to 6 (extremelystrong). The next two items assessed participants' physical attractiveness:"How would you rate your own physical attractiveness?" with possibleanswers ranging from 0 (not at all attractive) to 6 (extremely attractive),and "Do other people consider you to be good looking?" with possibleanswers ranging from 0 (not at all good looking) to 6 (extremely goodlooking).

HERITABILITY OF ATTITUDES 849
Table 1Genetic Analyses of Individual Attitude Items
Attitude
Doing crossword puzzlesDeath penalty for murderSweetsOpen-door immigrationDoing athletic activitiesVoluntary euthanasiaSmokingBeing the center of attentionSeparate roles for men and womenEducationMaking racial discrimination illegalLoud musicGetting along well with other peopleCapitalismPlaying organized sportsBig partiesPlaying chessLooking my best at all timesAbortion on demandPublic speakingPlaying bingoWearing clothes that draw attentionEasy access to birth controlExercisingOrganized religionBeing the leader of groupsReading booksCastration as punishment for sex crimesBeing assertiveRoller coaster rides
Correlations
MZ
.46
.45
.36
.47
.41
.45
.49
.31
.27
.30
.37
.53
.20
.41
.52
.44
.38
.42
.53
.34
.37
.38
.24
.35
.43
.40
.55
.39
.28
.50
DZ
.11
.33
.23
.20
.26
.21
.38
.14
.26
.14-.01
.49
.19
.19
.10
.30
.22
.14
.28
.26
.33
.28
.27
.17
.21
.08
.24
.29
.27
.31
Model
ADEAEACEAEAEAEACEAECEAEADEACEAEAEADEACEAEADEAEACECEACECEAEAEADE •ADEACECEAE
Best fitting model
Fit
X2(3) = 1.47, ns\2(4) = 5.61, ns^(3) = 1.41, nsx2(4) = 2.18, ns
X2{4) = 2.18, nsX2(4) = 2.29, nsX2(3) = 2.51, nsx2(4) = 5.52, ns
X2(4) = 2.54, ns^(4) = 11.64, p < .02X2(3) = 4.71, nsx2(3) = 1.15, «i
X2(4) = 19.61, p < .001X2{4) = 4.67, nsX2(3) = 0.46, nsX2Q) = 2.14, nsX2(4) = 2.76, ns^(3) = 3.13, nsX2(4) = 1.00, nsx2(3) = 1.91, ns
X2(4) = 7.07, nsX2(3) = 2.39, nsX2(4) = 5.35, nsx2(4) = 2.77, ns
^(4) = 3.17, MSX2(3) = 2.13, nsx2{3) = 4.31, «s
X2(3) = 0.48, nsx2(4) = 4.00, ns
X2(4) = 2.82, ns
a2
.02
.50
.22
.46
.44
.44
.31
.28
.00
.32
.00
.11
.28
.39
.00
.32
.38
.10
.54
.20
.00
.24
.00
.36
.45
.00
.37
.17
.00
.52
Estimates
c2
.00
.12
.00
.21
.26
.43
.00
.13
.00
.00
.15
.33
.15
.25
.21
.28
.00
e2
.55
.50
.65
.54
.56
.56
.48
.71
.74
.68
.66
.46
.72
.61
.48
.54
.62
.55
.46
.65
.65
.61
.75
.64
.55
.59
.43
.62
.72
.48
d2
.43
.00
.00
.00
.00
.34
.00
.52
.35
.00
.00
.41
.20
Note. Estimates of .00 mean that the component was tested but did not account for a significant amount of variance. MZ = monozygotic twins; DZ =dizygotic twins; A (a2) = additive genetic variance; E (e2) = nonshared environmental variance; D (d2) = nonadditive genetic variance; C (c2) = sharedenvironmental variance.
Finally, participants were asked to report their grade point average(GPA) in their final year of high school (as a percentage) and the highestlevel of education they had completed. These academic achievement mea-sures were taken as gross indicants of intellectual ability.
Heritability Analyses
Analyses were performed to estimate the amounts of variance in attituderesponses (and in other dependent measures) within our sample that wereattributable to genetic and environmental factors. We conducted theseanalyses on each individual item in the questionnaire (attitudes, personal-ity, athleticism, attractiveness, and grades), as well as on composite vari-ables formed on the basis of factor analyses (reported below).
For each dependent measure, covariance matrices were computed be-tween each pair of twins for MZ and DZ pairs separately, with thecomputer program PRELIS (Joreskog & Sorbom, 1989b). A model-fittingapproach, by means of the computer program LISREL VII (Joreskog &Sorbom, 1989a), was applied to these covariance matrices to estimate theproportion of the variance attributable to additive genetic (a), sharedenvironmental (c), and nonshared environmental (e) factors (ACE model).The obtained maximum-likelihood parameter estimates of these compo-nents were squared to form a2 (percentage of variance attributable toadditive genetic factors—i.e., genetic "main effects" from the two parents),c2 (percentage of variance attributable to environmental factors that were
shared by the twins), and e2 (percentage of variance attributable to envi-ronmental factors that were unique to one of the twins). For those depen-dent measures in which the ratio of the MZ correlation to the DZ corre-lation was greater than 2, it was possible to test for nonadditive geneticeffects (d)—that is, genetic influences resulting from an interaction of thetwo parents' contributions. For these measures, a model specifying additivegenetic variance, nonadditive genetic variance, and nonshared environmen-tal variance was tested (ADE model). The obtained maximum-likelihoodparameter estimates of these components were squared to form estimates ofa2, d2 (percentage of variance attributable to nonadditive genetic factors),and e2.
Three reduced models for each measure were also tested that systemat-ically removed one component of variance. The first removed additivegenetic effects, the second removed shared environmental effects (ornonadditive genetic effects), and the third removed both types of effects. Asignificant change in the chi-square analysis from the full model to thechi-square analysis from a reduced model indicated that the remainingparameters could not independently account for the variance. The goodnessof fit of all models was determined by means of Akaike's (1987) infor-mation criterion = x2 ~ 2 (df), which gives a superior indication of fit inmodels with a small number of parameters (Bollen, 1989), and by the chisquare itself. Because a model that has nonadditive genetic variancewithout additive genetic variance is biologically implausible (see Neale &Cardon, 1992), the DE model was never tested.

850 OLSON, VERNON, HARRIS, AND JANG
Table 2Genetic Analyses of Individual Nonattitude Items
Category and item
PersonalityHumbleAmbitiousFriendlyAggressiveIndependentInconsistentPreciseDefensiveDominantPersistentExhibitionisticFearfulImpulsiveSympatheticNeatPlayfulAestheticObligingDependentInquiring
AthleticismAthleticStrong
AttractivenessPhysical attractivenessGood looking to other people
AcademicGPA in final year of high schoolLevel of completed education
Correlations
MZ
.60
.46
.35
.27
.27
.16
.31
.35
.24
.36
.44
.26
.26
.35
.25
.29
.37
.11
.26
.22
.60
.52
.37
.47
.61
.82
DZ
.27
.24
.25
.09
.09
.07
.20
.25
.12
.10
.23
.01
.03
.25
.22
.14
.13
.18
.02
.13
.27
.21
.25
.28
.25
.57
Model
AEAEAEADEADEAEAEAEAEADEAEADEAEAECEAEADECEADEAE
AEAE
AEAE
ADEACE
Best fitting model
Fit
X2(4) = 3.47, nsX2(4) = 0.18, nsX2(4) = 14.72, p < .05^(3) = 0.65, ns*2(3) = 1.38, nsX2(4) = 1.42,™X2(4) = 2.00, nsX2(4) = 4.06, nsXz(4) = 0.68, nsX*Q) = 0.81, nsX2(4) = 4.25, nsX
2(3) = 2.07, nsX2(4) = 1.98, nsX*(4) = 2.57, nsX2(4) = 5.34, nsX2(4) = 1.21, nsX*Q) = 9.30, p < .05X2(4) = 9.29, p < .05^(3) = 5.43, nsX2(4) = 5.05, ns
X2(4) = 3.47, nsX2(4) = 12.87, p < .05
X2(4) = 10.74, p < .05X2(4) = 11.95, p < .05
^(3) = 0.15, nsX20) = 0.23, ns
a2
.58
.46
.42
.06
.11
.16
.33
.38
.23
.00
.43
.00
.23
.39
.00
.30
.04
.00
.00
.25
.58
.51
.42
.53
.41
.49
Estimates
c2
.00
.00
.00
.00
.00
.00
.00
.23
.14
.00
.00
.00
.33
e2
.42
.54
.58
.72
.74
.84
.67
.62
.77
.63
.57
.76
.77
.61
.77
.70
.57
.86
.75
.75
.42
.49
.58
.47
.40
.18
d2
.00
.22
.15
.00
.37
.24
.00
.00
.39
.25
.00
.00
.19
Note. Estimates of .00 mean that the component was tested but did not account for a significant amount of variance. MZ = monozygotic twins; DZ =dizygotic twins; A (a2) = additive genetic variance; E (e2) = nonshared environmental variance; D (d2) = nonadditive genetic variance; C (c2) = sharedenvironmental variance; GPA = grade point average.
Results
Genetic Analyses of Individual Items
Table 1 summarizes the genetic analyses of the individualattitude items: the intra-twin correlations for MZ pairs and for DZpairs, the best fitting model (the full model or one of the threereduced models) with its associated chi square, and the estimatesfor each of the elements in the best fitting model (a2, e2, and c2 ord2). Because only one of the ACE or ADE models could be testedfor each measure, either c2 or d2 could not be estimated;the estimates that were not tested are left blank in the table.Table 2 presents the same statistics for the individual nonattitudeitems (personality, athleticism, attractiveness, and academicachievement).
As can be seen in Table 1, 26 of the 30 attitude items yieldedsignificant genetic effects, because of either additive or nonaddi-tive factors (or both). We summed the additive and nonadditivegenetic effects to form h2, or heritability coefficients. The esti-mates for h2 ranged from 0 to .57, with a median of .35. The fiveitems with the largest genetic components (greater than or equal to.50) were attitudes toward reading books, abortion on demand,playing organized sports, roller coaster rides, and the death penaltyfor murder. The four items with the smallest genetic components
(no genetic effect) were attitudes toward separate roles for menand women, playing bingo, easy access to birth control, and beingassertive.
As can be seen in Table 2, 18 of the 20 personality items yieldedsignificant additive and/or nonadditive genetic effects. The esti-mates for h2 ranged from 0 to .58, with a median of .29. The fiveitems with the largest genetic components (greater than .40) werehumble, ambitious, exhibitionistic, aesthetic, and friendly. Thethree items with the smallest genetic components (less than .20)were neat, obliging, and inconsistent.
Table 2 also shows that both athleticism items yielded largeheritability coefficients (greater than .50), as did both attractive-ness items (greater than .40). Finally, both measures of academicachievement also yielded high heritability coefficients (greaterthan .40).
It is also worth noting that nonshared environmental factors(i.e., unique experiences of each member of a twin pair) werethe most powerful contributors to variability in both sets ofitems. For the attitude items, e2 ranged from .43 to .75, with amedian value of .60. For the personality items, e2 ranged from.42 to .86, with a median value of .71. The other nonattitudeitems (athleticism, attractiveness, academic achievement) alsoyielded high e2, with the exception of level of completed

HERITABILITY OF ATTITUDES 851
education, where e2 fell to .18 (though this was still signifi-cantly greater than 0).
In sharp contrast to nonshared environmental factors, sharedenvironmental factors (i.e., experiences common to both membersof a twin pair) generally contributed little to the variance in theitems. For the attitude items, c2 was significantly greater than 0 inonly 11 of the 17 analyses in which it was tested, with a medianvalue of .15. For the personality items, c2 was significantly greaterthan 0 in only 2 of the 10 analyses in which it was tested, with amedian value of 0. The same was true for the other nonattitudeitems, for which c2 was significant in only one of three analyses.
Factor Analyses of Individual Items
A principal components factor analysis, with varimax rotation,was conducted on the 30 attitude items. This analysis yielded ninefactors with eigenvalues greater than 1. Table 3 presents the factorloadings of each item on each of the factors. The factors generallyseemed interpretable on the basis of high-loading items. Factor 1reflected Attitudes Toward Athleticism, with high loadings forattitudes toward doing athletic activities, playing organized sports,and exercising. Factor 2 reflected Attitudes Toward Leadership,with high loadings for attitudes toward being the leader, being thecenter of attention, public speaking, and being assertive. Factor 3reflected Attitudes Toward the Preservation of Life, with high
loadings for attitudes toward abortion on demand, voluntary eu-thanasia, easy access to birth control, and organized religion (re-versed). Factor 4 reflected Attitudes Toward Sensory Experiences,with high loadings for attitudes toward loud music, smoking, rollercoaster rides, and big parties. Factor 5 reflected Attitudes TowardIntellectual Pursuits, with high loadings for attitudes toward read-ing books, doing crossword puzzles, playing chess, and education;attitudes toward capitalism also loaded highly on this factor. Fac-tor 6 reflected Attitudes Toward Equality, with high loadings forattitudes toward making racial discrimination illegal, separate rolesfor men and women (reversed), open-door immigration policies,and getting along well with others. Factor 7 reflected AttitudesToward Outward Appearance, with high loadings for attitudestoward looking my best at all times, wearing attention-grabbingclothing, and getting along well with other people. Factor 8 re-flected Attitudes Toward the Treatment of Criminals, with highloadings for attitudes toward castration as a punishment for sexcrimes and the death penalty for murder. Finally, Factor 9 wasmore difficult to interpret; we labeled it Attitudes Toward Sweetsand Games, with high loadings for attitudes toward sweets, doingcrossword puzzles, and playing bingo.
A principal components factor analysis was also conducted onthe 20 personality trait items, again with varimax rotation. Thisanalysis revealed five factors with eigenvalues greater than 1.
Table 3Factor Analysis of Individual Attitude Items
Attitude
Doing crossword puzzlesDeath penalty for murderSweetsOpen-door immigrationDoing athletic activitiesVoluntary euthanasiaSmokingBeing the center of attentionSeparate roles for men and womenEducationMaking racial discrimination illegalLoud musicGetting along well with other peopleCapitalismPlaying organized sportsBig partiesPlaying chessLooking my best at all timesAbortion on demandPublic speakingPlaying bingoWearing clothes that draw attentionEasy access to birth controlExercisingOrganized religionBeing the leader of groupsReading booksCastration as punishment for sex crimesBeing assertiveRoller coaster rides
1
-.01.07.11
- .20.85.01
- .35- .01
.03
.17- .02
.12
.22
.03
.68
.21
.08
.06
.02
.14- .12- .08-.01
.79- .02
.12-.01
.00
.09
.22
2
-.11- .06
.01
.15
.08
.08- .03
.72
.05- .10
.07
.02
.05
.08
.06
.32
.22
.02
.05
.58- .10
.38- .06
.13-.01
.81
.05
.08
.52
.04
3
- .06.04.09
- .16.05.71.11.01
-.25- .07
.00
.02
.00-.09- .06
.10
.08- .03
.73- .10
.04
.10
.62
.04- .62
.02
.10
.00
.17
.09
4
.05- .01- .13
.03
.11- .03
.57
.15-.05-.17-.01
.78-.02- .01
.21
.46- .06- .04
.08
.03
.36
.21
.10- .04- .12
.00- .12-.02- .13
.52
Factor
5
.55- .11-.04-.07
.05
.06
.09- .12- .03
.44
.05- .12- .05
.48
.13- .10
.55-.01
.13
.30
.13- .15
.07
.00
.23
.09
.62- .03
.10- .10
6
-.05-.17
.11
.46-.05
.15- .10- .08- .56
.37
.73
.04
.40-.29- .03
.06- .06- .08-.09
.12- .04- .05
.28
.01
.07
.00
.21
.06
.11
.03
7
-.03.06.08
- .13.05
- .06- .01
.15- .01
.30- .02
.04
.44
.29- .02
.34- .15
.79
.05- .10
.06
.50
.26
.12
.19- .04- .09
.05
.19-.09
8
.16
.74- .08- .33- .03
.21
.24- .04
.14
.05
.04- .10
.17
.06
.20- .03- .13
.11- .06- .01
.29- .12- .06- .04
.00
.05- .15
.74
.03- .05
9
.44
.06
.73
.20
.03
.11- .09
.16
.08- .06
.08- .04
.02-.21
.15
.06
.04
.02
.15- .12
.43
.26-.07- .11
.11- .02-.01- .03-.25
.02
Note. Loadings greater than .40 are presented in boldface.

852 OLSON, VERNON, HARRIS, AND JANG
Table 4 presents the factor loadings. Again, the factors seemedinterpretable. Factor 1 reflected Aggressiveness, with high load-ings for the traits dominant, aggressive, exhibitionistic, defensive,and impulsive. Factor 2 reflected Sociability, with high loadingsfor playful, friendly, aesthetic, and caring. Factor 3 reflectedDependence, with high loadings for dependent, humble, fearful,obliging, and defensive. Factor 4 reflected Persistence, with highloadings for independent, persistent, inquiring, precise, and ambi-tious. Finally, Factor 5 reflected Obsessiveness, with high loadingsfor neat, inconsistent (reversed), precise, and impulsive (reversed).
Genetic Analyses of Factors and Composite Measures
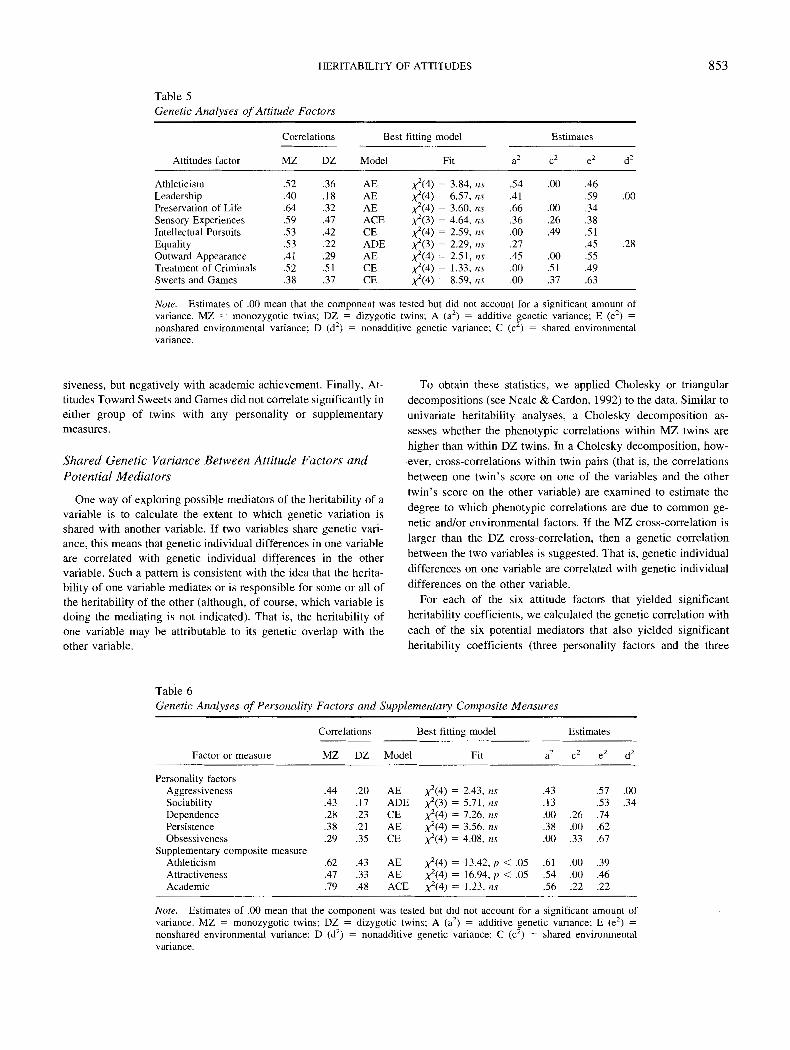
Table 5 summarizes the results of the heritability analyses of thenine attitude factors that emerged from the factor analysis. Indi-viduals' scores for each factor were calculated by weighting all 30items according to the factor loadings presented in Table 3. Table6 summarizes the same statistics for the heritability analyses of thefive personality factors, using the weights of the 20 items pre-sented in Table 4. Table 6 also presents the results of heritabilityanalyses of three supplementary composite measures: the sum ofthe two athleticism items (which correlated significantly, r[670] =.60, p < .001), the sum of the two attractiveness items (whichcorrelated significantly, r[670] = .75, p < .001), and the sum ofthe standardized values of the GPA and completed level of edu-cation variables (which correlated significantly, r[670] = .36,p < .01).
As can be seen in Table 5, six of the nine attitude factors yieldedsignificant additive and/or nonadditive genetic components, withthe estimates for h2 ranging from 0 to .66; the median h2 across thenine factors was .41. The three factors yielding the largest geneticcomponents were Attitudes Toward the Preservation of Life, At-titudes Toward Equality, and Attitudes Toward Athleticism. The
Table 4Factor Analysis of Individual Personality Items
Personalityitem
HumbleAmbitiousFriendlyAggressiveIndependentInconsistentPreciseDefensiveDominantPersistentExhibitionisticFearfulImpulsiveSympatheticNeatPlayfulAestheticObligingDependentInquiring
1
- .06.36
- .09.75
- .03.25.10.54.79.11.57.01.53
- .33- .06
.11
.04
.13
.14
.14
2
- .21.28.76
-.12-.05
.12- .06- .16- .04
.13
.39- .33
.15
.51
.10
.78
.51
.20
.16
.31
Factor
3
.67- .20- .04
.11-.22
.18
.04
.43- .01- .06- .03
.61
.08
.37
.16- .10
.00
.57
.68
.18
4
.11
.43
.01
.09
.71
.10
.44
.12
.12
.65
.01- .09-.07
.18
.04
.04
.36- .08- .32
.56
5
-.27.27.13
- .08- .03- .70
.59- .16
.25
.25- .10
.15- .48
.11
.72- .12- .13
.16- .06- .15
Note. Loadings greater than .40 are presented in boldface.
three factors yielding the smallest genetic components were Atti-tudes Toward Intellectual Pursuits, Attitudes Toward the Treat-ment of Criminals, and Attitudes Toward Sweets and Games.
As can be seen in Table 6, three of the five personality factorsyielded significant heritability coefficients, with the estimates forh2 ranging from 0 to .47. The composite Athleticism, Attractive-ness, and Academic measures also yielded significant geneticeffects, with the estimates for h2 ranging from .54 to .61.
Paralleling the analyses of the individual items, nonshared en-vironmental factors constituted the most powerful variable forpredicting variance in the factors within our sample. For theattitude factors, e2 ranged from .34 to .63, with a median value of.49. For the personality factors, e2 ranged from .53 to .74, with amedian value of .62. Analyses of the supplementary compositemeasures also yielded significant estimates for e2, ranging from.22 to .46.
Shared environmental factors were somewhat more importantfor predicting the attitude factors than they were for the individualattitude items, with four of the seven analyses in which they weretested yielding a significant estimate for c2, with a median valueacross the seven analyses of .26. Two of the three analyses of the.personality factors in which c2 was tested yielded significantestimates, with a median value of .26. Shared experiences contrib-uted reliably to variance in only one of the supplementary com-posite measures: academic achievement.
Phenotypic Intercorrelations Among Factors andComposite Measures
Tables 7 and 8 present the intercorrelations between the attitudefactors, personality factors, and supplementary composite mea-sures for MZ and DZ twins, respectively. Because of the largenumber of correlations, only those correlations that were signifi-cant &tp < .005 (two tailed) are presented in boldface in the tables.Relatively few correlations were significant in both groups oftwins (these correlations are presented in italics in the tables). Wemention here just the correlations that were significant in bothgroups of twins and that involved the attitude factors.
Attitudes Toward Athleticism correlated only with self-reportsof athletic ability, such that more positive attitudes toward athleti-cism were associated with greater athletic ability. Favorable atti-tudes toward leadership were associated positively with Aggres-siveness, Sociability, and physical attractiveness, but negativelywith Dependence. Attitudes Toward the Preservation of Life didnot correlate significantly in both groups of twins with any per-sonality or supplementary measures. Attitudes Toward SensoryExperiences, for which high scores reflected favorable attitudestoward intense experiences, correlated positively with Sociabilityand self-reports of athletic ability but negatively with Obsessive-ness and academic achievement. Favorable attitudes toward intel-lectual pursuits were associated positively with Persistence; sur-prisingly, such attitudes correlated significantly with academicachievement only within the MZ twins. Attitudes Toward Equalitydid not correlate significantly in both groups of twins with anypersonality or supplementary variables. Favorable attitudes towardmaintaining an attractive outward appearance were associated pos-itively with Sociability and physical attractiveness. Attitudes To-ward the Treatment of Criminals (for which high scores reflectedsupport for severe punishment) correlated positively with Obses-
HERITABILITY OF ATTITUDES 853
Table 5Genetic Analyses of Attitude Factors
Attitudes factor
AthleticismLeadershipPreservation of LifeSensory ExperiencesIntellectual PursuitsEqualityOutward AppearanceTreatment of CriminalsSweets and Games
Correlations
MZ
.52
.40
.64
.59
.53
.53
.41
.52
.38
DZ
.36
.18
.32
.47
.42
.22
.29
.51
.37
Best
Model
AEAEAEACECEADEAECECE
fitting model
Fit
X2(4) = 3.84, nsX
2(4) = 6.57, nsX2(4) = 3.60, nsX2(3) = 4.64, ns^(4) = 2.59, ns^(3) = 2.29, nsX>(4) = 2.51, nsX
2(4) = 1.33, nsX2(4) = 8.59, ns
a2
.54
.41
.66
.36
.00
.27
.45
.00
.00
Estimates
c2
.00
.00
.26
.49
.00
.51
.37
e2
.46
.59
.34
.38
.51
.45
.55
.49
.63
d2
.00
.28
Note. Estimates of .00 mean that the component was tested but did not account for a significant amount ofvariance. MZ = monozygotic twins; DZ = dizygotic twins; A (a2) = additive genetic variance; E (e2) =nonshared environmental variance; D (d2) = nonadditive genetic variance; C (c2) = shared environmentalvariance.
siveness, but negatively with academic achievement. Finally, At-titudes Toward Sweets and Games did not correlate significantly ineither group of twins with any personality or supplementarymeasures.
Shared Genetic Variance Between Attitude Factors andPotential Mediators
One way of exploring possible mediators of the heritability of avariable is to calculate the extent to which genetic variation isshared with another variable. If two variables share genetic vari-ance, this means that genetic individual differences in one variableare correlated with genetic individual differences in the othervariable. Such a pattern is consistent with the idea that the herita-bility of one variable mediates or is responsible for some or all ofthe heritability of the other (although, of course, which variable isdoing the mediating is not indicated). That is, the heritability ofone variable may be attributable to its genetic overlap with theother variable.
To obtain these statistics, we applied Cholesky or triangulardecompositions (see Neale & Cardon, 1992) to the data. Similar tounivariate heritability analyses, a Cholesky decomposition as-sesses whether the phenotypic correlations within MZ twins arehigher than within DZ twins. In a Cholesky decomposition, how-ever, cross-correlations within twin pairs (that is, the correlationsbetween one twin's score on one of the variables and the othertwin's score on the other variable) are examined to estimate thedegree to which phenotypic correlations are due to common ge-netic and/or environmental factors. If the MZ cross-correlation islarger than the DZ cross-correlation, then a genetic correlationbetween the two variables is suggested. That is, genetic individualdifferences on one variable are correlated with genetic individualdifferences on the other variable.
For each of the six attitude factors that yielded significantheritability coefficients, we calculated the genetic correlation witheach of the six potential mediators that also yielded significantheritability coefficients (three personality factors and the three
Table 6Genetic Analyses of Personality Factors and Supplementary Composite Measures
Factor or measure
Personality factorsAggressivenessSociabilityDependencePersistenceObsessiveness
Supplementary composite measureAthleticismAttractivenessAcademic
Correlat
MZ
.44
.43
.28
.38
.29
.62
.47
.79
ions
DZ
.20
.17
.23
.21
.35
.43
.33
.48
Model
AEADECEAECE
AEAEACE
Best fitting model
Fit
^ (4) = 2.43, ns^(3) = 5.71,/is^(4) = 7.26, nsX2(4) = 3.56, nsX2(4) = 4.08, ns
/ ( 4 ) = 13.42, p < .05x2(4) = 16.94, p < .05
x2(4) = 1.23, ns
a2
.43
.13
.00
.38
.00
.61
.54
.56
Estimates
c2
.26
.00
.33
.00
.00
.22
e2
.57
.53
.74
.62
.67
.39
.46
.22
d2
.00
.34
Note. Estimates of .00 mean that the component was tested but did not account for a significant amount ofvariance. MZ = monozygotic twins; DZ = dizygotic twins; A (a2) = additive genetic variance; E (e2) =nonshared environmental variance; D (d2) = nonadditive genetic variance; C (c2) = shared environmentalvariance.

854 OLSON, VERNON, HARRIS, AND JANG
Table 7Intercorrelations Between Attitude Factors, Personality Factors, and Supplementary Composite Measures: Monozygotic Twins
Factor or measure
Attitude factorsAthleticismLeadershipPreservation of LifeSensory ExperiencesIntellectual PursuitsEqualityOutward AppearanceTreatment of CriminalsSweets and Games
Supplementary composite measure1. Athleticism2. Attractiveness3. Academic
Aggressiveness
.07.40
- .01.26
- .05- .23
.04
.03-.01
.27
.20- .06
Sociability
.17
.22.02.24
- .11.13.31
- .04.00
.24
.37.01
Personality factor
Dependence
- .15-.17- .18-.11
.03
.15
.06-.06
.04
- .25- .13
.03
Persistence
.19
.13
.03- .02
.29
.19- .07- .11- .08
.23
.19
.23
Obsessiveness
- .03.09
- .10-.27
.10
.08
.18
.25
.06
-.05.02.18
Supplementarycomposite measure
1
.56
.17
.08.29
- .05- .05
.02
.01- .10
.44
.05
2
.18
.28
.09
.12-.05
.01.26.04
- .06
—.14
3
.14
.10
.09-.16
.26
.13-.07-.19
.08
—
Note. Correlations presented in boldface are significant atp < .005 (two tailed). Correlations that are significant in both groups of twins appear in italics.
supplementary composite variables). Cholesky decompositionsalso provide an estimate of the extent to which relations betweenvariables are attributable to common environmental influences(i.e., to the same nonshared environmental experiences of thetwins). Table 9 presents the genetic and environmental correlationsfor all pairings of the six attitude factors and the six potentialmediators; correlations in boldface are significantly greater than 0.
These data provide some interesting ideas about why individualdifferences in certain attitudes were heritable, which we elaboratein the Discussion section. At this point, we simply summarize thesignificant genetic correlations. Attitudes Toward Athleticismshared a significant amount of genetic variance with self-reportedathletic ability and with Persistence. Attitudes Toward Leadershipshowed genetic overlap with five of the six possible mediators:physical attractiveness, Sociability, Aggressiveness, Persistence,
and academic achievement. Attitudes Toward the Preservation ofLife produced significant genetic correlations with physical attrac-tiveness and Sociability. Attitudes Toward Sensory Experiencesshared genetic variance with Sociability, Aggressiveness, Persis-tence, and athleticism. Attitudes Toward Equality yielded signifi-cant genetic correlations with Sociability and academic achieve-ment. Finally, Attitudes Toward Outward Appearance showedgenetic overlap with Sociability and physical attractiveness.
The attitude factors did not, in general, show much overlap withthe potential mediators in terms of being attributable to the samenonshared environmental experiences of the twins. Attitudes To-ward Athleticism appeared to be influenced by the same environ-mental experiences as athletic ability. Attitudes Toward Leader-ship were associated with similar environmental experiences asAggressiveness. Attitudes Toward Sensory Experiences were re-
Table 8Intercorrelations Between Attitude Factors, Personality Factors, and Supplementary Composite Measures: Dizygotic Twins
Factor or measure
Attitude factorsAthleticismLeadershipPreservation of LifeSensory ExperiencesIntellectual PursuitsEqualityOutward AppearanceTreatment of CriminalsSweets and Games
Supplementary composite measure1. Athleticism2. Attractiveness3. Academic
Aggressiveness
- .04.37
- .03.14
-.05- .13
.03
.14
.05
.14
.15-.02
Sociability
.12.17.14.24
- .14.27.55.00.08
.18
.38- .06
Personality factor
Dependence
- .07-.22- .14- .03-.11
.06
.10
.07
.15
- .14- .10- .04
Persistence
.10
.13
.12- .08
.25
.02
.01- .13- .10
.28
.10.29
Obsessiveness
.01
.03-.16-.36- .04
.00
.04
.28- .04
.06
.11
.18
Supplementarycomposite measure
1
.43
.15
.05
.17
.04- .04-.01
.04-.09
.31.05
2
.08.25.11.10
-.04.01.21
- .03.02
.01
3
.15
.13
.08-.24
.12
.15- .13-.20- .02
—
Note. Correlations presented in boldface are significant at p < .005 (two tailed). Correlations that are significant in both groups of twins appear in italics.

HERITABILITY OF ATTITUDES 855
Table 9Genetic and Environmental Correlations Between Attitudesand Potential Mediators
Attitudes factor andmediator
AthleticismAggressivenessSociabilityPersistenceAthleticismAttractivenessAcademic ach.
LeadershipAggressivenessSociabilityPersistenceAthleticismAttractivenessAcademic ach.
Preservation of LifeAggressivenessSociabilityPersistenceAthleticismAttractivenessAcademic ach.
Sensory ExperiencesAggressivenessSociabilityPersistenceAthleticismAttractivenessAcademic ach.
EqualityAggressivenessSociabilityPersistenceAthleticismAttractivenessAcademic ach.
Outward AppearanceAggressivenessSociabilityPersistenceAthleticismAttractivenessAcademic ach.
h2
.54
.43
.47
.38
.61
.54
.56
.41
.43
.47
.38
.61
.54
.56
.66
.43
.47
.38
.61
.54
.56
.36
.43
.47
.38
.61
.54
.56
.55
.43
.47
.38
.61
.54
.56
.45
.43
.47
.38
.61
.54
.56
Geneticcorrelation
- .03.03.25.63.10.17
.41
.43
.26
.10
.55
.22
- .13.21.11.05.22
- .04
.33
.41- .28
.28
.14- .05
- .19.44.17.00.11.24
.01
.36-.11- .09
.27- .04
Environmentalcorrelation
.06
.19
.11
.30
.09
.04
.37
.02
.09
.15
.01- .03
.10- .10
.03
.05- .02
.00
.08
.07
.14
.20
.07- .13
-.17-.01
.04- .06- .08- .24
.04
.34
.03
.08
.21
.06
Note. Correlations presented in boldface are significant at p < .005 (twotailed), h2 = heritability coefficients; ach. = achievement.
lated to the same environmental experiences as athleticism. Atti-tudes Toward Equality showed a negative environmental correla-tion with academic achievement, which means that environmentalexperiences that were associated with positive attitudes towardequality also tended to be negatively associated with academicachievement. Finally, Attitudes Toward Outward Appearancewere related to the same environmental experiences as were So-ciability and physical attractiveness.
Testing Phenotypic Mediation of Attitude Factors
Another means of examining mediation relies on phenotypiccorrelations, testing direction of causality models that go from thephenotype of one variable (e.g., a personality variable) to the
phenotype of another variable (e.g., an attitude). Techniques havebeen developed that allow the testing of simple models of causa-tion using cross-sectional family data (see Carey & DiLalla, 1994;Heath et al., 1993). Like the Cholesky analyses previously de-scribed, these techniques use cross-correlations within MZ and DZtwin pairs. For example, if the personality trait of sociabilitycauses positive attitudes toward parties, then the cross-correlationbetween one twin's Sociability and the other twin's attitude towardparties should be equal to the product of two other correlations: theintraindividual correlation between Sociability and attitudes to-ward parties and the correlation between one twin's Sociabilityand the other twin's Sociability. With sufficient sample sizes, theobtained cross-correlation can be tested against the predicted val-ue; a significant difference suggests that the model is invalid.
Because we were interested specifically in the mediation ofgenetic effects, we conducted these phenotypic analyses only forattitude-mediator pairings that produced a significant genetic cor-relation in Table 9 (i.e., we used these analyses as another way ofexploring whether an attitude might be heritable because it iscaused by another variable that is heritable). Of the 17 suchpairings, 8 did not produce a significant phenotypic correlationwithin both sets of twins in Tables 7 and 8; clearly, it made nosense to test phenotypic mediation when there was no phenotypiccorrelation between the two variables.
Thus, there were nine attitude-mediator pairs that produced botha significant genetic correlation and a significant phenotypic cor-relation. For these pairs, we tested across all twins (both MZ andDZ to increase power) two contrasting, simple models of causa-tion; the mediator caused the attitude versus the attitude caused themediator. Unfortunately, six of the nine tests yielded inconclusiveresults, either because the two models yielded very similar predic-tions within our sample or because the correlation between thepotential mediator and the attitude was small (or both). For thesesix pairs, neither causal model could be rejected on the basis of ourdata.
On the other hand, three pairs of variables yielded results thatsupported one model over the other. First, our data supported theconclusion that athletic abilities cause Attitudes Toward Athletics.The predicted cross-correlation for this model was r = .29, whichdid not differ significantly from the obtained cross-correlation, r =.34 (cross-correlations can be computed in two ways, from Twin 1to Twin 2 or from Twin 2 to Twin 1, so we averaged the twovalues). In contrast, the predicted cross-correlation for the modelassuming that Attitudes Toward Athletics cause athletic abilitieswas r = .23, which differed significantly (p < .05) from theobtained value of .34.
Unexpectedly, our data weakly supported the conclusion thatAttitudes Toward Sensory Experiences cause the personality vari-ables of Aggressiveness and Sociability. With regard to Aggres-siveness, the Aggressiveness causes attitudes model predicted across-con-elation of r = .07, which differed significantly from theobtained cross-correlation of .17; the attitudes cause Aggressive-ness model predicted a cross-correlation of .11, which did notdiffer significantly from .17 (though it was not much larger thanthe preceding correlation of .07). With regard to Sociability, theSociability causes attitudes model predicted a value of r = .07,which differed significantly from the obtained cross-correlation of.16; the attitudes cause Sociability model predicted a cross-correlation of .13, which did not differ from .16. Thus, for these

856 OLSON, VERNON, HARRIS, AND JANG
two pairings, the phenotypic data were more consistent with thehypothesis that the attitudes caused the hypothesized mediator thanwith the reverse causal hypothesis.
Predicting the Heritability Coefficients of Attitude Items
As a final way of exploring possible mediators of the heritabil-ities of attitudes, we examined the correlations between (a) theheritability coefficients of the attitudes and (b) the absolute valuesof the correlations between the attitudes and other variables (po-tential mediators). For example, across the 30 attitude items, wecalculated the correlation between the heritability coefficients ofthe 30 items (h2) and the 30 absolute values of the correlationsbetween the items and the personality factor of Aggressiveness. Apositive correlation would indicate that as attitude items correlatedmore strongly with Aggressiveness (either positively or negatively,because absolute values were computed), they (attitude items) alsotended to be more heritable. In other words, a positive correlationwould be consistent with the view that differences in the strengthof associations with Aggressiveness accounted for some of thevariability in the heritabilities of the attitude items; Aggressivenesswould be implicated as a possible mediator of the heritability ofthe attitudes measured in our study. This analysis assumes that allof the measured attitudes have the same underlying determinant ordeterminants of their heritability; it is quite possible (or evenlikely) that different attitudes are heritable for different reasons(i.e., have different mediators of their heritability), which wouldnot be revealed by this particular statistical approach.
We computed these correlations for the mediators that werethemselves heritable (three personality factors and the three sup-plementary composite measures). Only one variable yielded asignificant result. Specifically, the amount of genetic variance inan attitude item (h2) was positively correlated with the correlationbetween the item and the academic achievement composite mea-sure, r(28) = .33, p < .04. Thus, attitudes that correlated withacademic achievement tended to be more heritable. Given thatacademic achievement was itself highly heritable and correlated atthe genetic level with some attitudes in the earlier Choleskydecomposition analyses, this correlation with the heritability ofattitudes is provocative.
Relation Between Attitude Heritability and AttitudeStrength
Immediately after reporting their attitude toward a target, par-ticipants indicated how important this attitude was to them andhow strongly they held the attitude. These questions assessedattitude strength, which Tesser (1993) has argued might be relatedto attitude heritability. To examine this hypothesis, we calculatedfor each attitude item the mean rating of importance across allparticipants and the mean rating of strength across all participants;each of these two sets of means was then correlated, across the 30items, with the heritability coefficients of the items. Mean ratingsof importance did not correlate with h2 across the 30 items,r(28) = .05, ns. Although the relation was not statistically signif-icant, mean ratings of strength were positively correlated with h2
across the 30 items, r(28) = .17, p < .19, as predicted by Tesser(1993).
We also looked at the relation between heritability and strengthwithin the attitude factors. Thus, we computed a weighted impor-tance score and a weighted strength score for each attitude factorby multiplying the mean importance (or strength) rating for eachitem by the factor loadings in Table 3. In so doing, we generateda single importance (and strength) score for each of the ninefactors. We then correlated these nine scores with the heritabilitycoefficients of the attitude factors. More-heritable factors werestrongly associated with both higher weighted importance scores,r(7) = .52, p < .08, and higher weighted strength scores, r(7) =.51, p < .08, although the correlations were only marginallysignificant because of the few degrees of freedom. Thus, as pre-dicted by Tesser (1993), heritable attitude factors tended also to bepsychologically stronger.
Discussion
This study provided strong evidence that differences betweenrespondents in many of their expressed attitudes were partly de-termined by genetic factors. Twenty-six of the 30 individual atti-tude items yielded significant genetic effects, with a median h2 of.35. Six of the nine attitude factors yielded significant geneticeffects, with a median h2 of .41. These genetic effects emergedacross a wide variety of attitude topics and domains, from attitudesas diverse as support for the death penalty to enjoyment of rollercoaster rides.
Our results are consistent with past studies of the heritability ofsocial attitudes (e.g., Arvey et al., 1989; Eaves et al., 1989; Kelleret al., 1992; Waller et al., 1990), which have also found a geneticcomponent in many evaluations. Our study included many newattitude topics never previously tested in twin research, such asattitudes toward physical activities, intellectual tasks, and leader-ship behaviors. Differences between respondents in some of thesenew attitudes proved to be highly heritable (e.g., Attitudes TowardAthleticism and Attitudes Toward Leadership).
What about the specific attitudes that have yielded high or lowheritabilities in past studies? As stated in the introduction, one ofour goals was to test the replicability of the heritability coefficientsfor particular attitudes in past research. In general, attitudes thathave yielded high heritabilities in past studies also did so in thisresearch. For example, like in Eaves et al. (1989), a substantialgenetic component was found in participants' attitudes toward thedeath penalty for murder and voluntary euthanasia. Like Waller etal. (1990), we found that attitudes toward organized religion werealso heritable. One puzzling exception to this pattern was theattitude factor of the treatment of criminals (a domain that hasyielded high heritabilities in the past), which was not heritabledespite the fact that the two highest loading items, attitudes towardthe death penalty and castration for sex crimes, yielded significantheritability coefficients. Perhaps some items with lower loadingsthat were not heritable (e.g., attitudes toward bingo) or that wereheritable but conceptually distinct from Attitudes Toward theTreatment of Criminals (e.g., attitudes toward smoking) maskedthe heritability of the highest loading items.'
' These data raise an issue concerning our heritability analyses of theattitude factors. Given that the factor analyses were conducted on thephenotypic covariances, items that loaded heavily on the same factor did

HERITABILITY OF ATTITUDES 857
We were less successful at replicating previous findings of lowheritabilities. Attitudes toward separate roles for men and womenwere not heritable, replicating previous findings for similar itemsdealing with gender roles (Eaves et al., 1989). Several otherattitudes that have yielded low heritabilities in past research,however, were more heritable in our sample. For example, herita-bility coefficients of .54, .46, .39, and .31 were obtained forattitudes toward abortion on demand, open-door immigration, cap-italism, and smoking, respectively, which have yielded low ornonsignificant estimates in past studies (Eaves et al., 1989; Perry,1973). When all of the relevant studies, including the present one,are examined, there are few attitude topics that have consistentlyyielded null heritability estimates (although, of course, many pos-sible attitude topics have yet to be examined in behavioral geneticsresearch).
We should remind the reader of some of the assumptions un-derlying the twin methodology adopted in this study. First, weassumed that our zygosity determination was accurate—that is, thequestionnaire designed by Nichols and Bilbro (1966) approachedthe accuracy rate of 93% that has been reported in past studies.Second, we assumed that the degree of environmental similaritywas equal for identical and fraternal twins. This assumption hasgenerally been supported by empirical tests (e.g., see Plomin et al.,1997), although it remains contentious for critics of behavioralgenetics. Violation of this assumption (with identical twins beingexposed to more similar environments) would tend to increaseheritability estimates. Third, we assumed that relatively little as-sortative mating occurred in our sample. Assortative mating is thetendency for genetically similar individuals to mate, which willincrease genetic similarity within families and decrease geneticsimilarity between families. Because such increased intrafamilialgenetic similarity will occur for DZ twins but not MZ twins (whoare genetically identical irrespective of assortative mating), strongassortative mating would tend to decrease heritability estimates.Finally, given that we want to generalize the findings from ourstudy to the general population, we assumed that the sample oftwins was reasonably representative of the larger population. Tothe extent that the heterogeneity of the genes and/or environmentsin our sample differed substantially from those in the larger pop-ulation, our estimates of genetic and environmental influence willnot generalize.
Mediators of Attitude Heritability
If the conclusion is accepted that many attitudes are partlyheritable, then the question arises, why or how are differencesbetween individuals' attitudes genetically determined? Given thatdirect gene-to-attitude connections are extremely unlikely, whatare the mechanisms that might account for the genetic componentof attitudes? This issue has received very little attention fromsocial scientists. We explored it in several ways in the presentresearch.
Most directly, we calculated the extent to which genetic varia-tion was shared between heritable attitude factors and heritable
not necessarily show similar patterns of heritabilities themselves. Analternative strategy might have been to conduct a factor analysis of theattitude covariances that derived simply from shared genetic variance.
potential mediators (namely, personality factors and supplemen-tary composite variables). Genetic correlations indicate the extentto which genetic individual differences in one variable are relatedto genetic individual differences in another variable. Causal direc-tion is not revealed by genetic correlations, of course, a point thatwe illustrate several times by presenting competing possible inter-pretations of our results. Nevertheless, as described in the follow-ing paragraphs, our genetic analyses identified several potentialmediators that overlapped considerably with attitudes (as well assome smaller but significant genetic correlations that we do notdiscuss). All of the mediators yielded significant genetic correla-tions with at least two of the attitude factors; the personality traitof Sociability was particularly impressive, correlating at the ge-netic level with five of the six attitude factors. We followed up thegenetic correlation analyses with phenotypic mediation analysestesting two simple models: the mediator caused the attitude versusthe attitude caused the mediator. These analyses only made sensewhen the variables were correlated at the phenotypic level and,even then, were usually inconclusive because of relatively weakphenotypic correlations. A few mediator-attitude pairings, how-ever, yielded interesting data that are also discussed below.
Attitudes Toward Athleticism, which were heritable (h2 = .54),showed a high genetic correlation (.63) with self-reported athleticability, which was itself highly heritable (h2 = .61). One interpre-tation of this overlap is that inherited physical abilities relevant to
" athletics influenced attitudes toward athletics (playing organizedsports, exercising, etc.). For example, individuals with naturallygood coordination and strength might have been more successfulat sports than less athletically inclined individuals, with the resultthat the former individuals developed more favorable attitudestoward sports than did the latter. This causal model was explicitlysupported by the phenotypic analyses, for which the model goingfrom athletic abilities to athletic attitudes was consistent with thedata, whereas the model going from athletic attitudes to athleticabilities could be rejected. Thus, there were converging pieces ofevidence in our study supporting the conclusion that attitudestoward athletics yielded a significant heritability coefficient, atleast in part, because they were caused by genetically influencedphysical and athletic abilities.
Attitudes Toward Leadership (h2 = .41) showed relatively largegenetic correlations with self-reported physical attractiveness(.55), Sociability (.43), and Aggressiveness (.41), all of whichwere also highly heritable (h2 = .54, .47, and .43, respectively).Thus, it is possible that Attitudes Toward Leadership were herita-ble, in part, because other inherited characteristics led to particularexperiences relevant to leadership. For example, perhaps physi-cally attractive persons were treated deferentially and developedmore confidence in their leadership abilities. Similarly, perhapsindividuals who were naturally outgoing (sociable) gravitated topositions of leadership and developed positive attitudes. Naturalaggressiveness or assertiveness might also have led to greatersuccess in attempts to lead, which induced favorable attitudestoward being a leader. These variables constitute a good exampleof the ambiguity of genetic correlations, however, in that they canplausibly be interpreted in other ways (phenotypic mediation anal-yses involving Attitudes Toward Leaders were inconclusive). Forexample, Attitudes Toward Leadership may have been heritablefor reasons other than those we have proposed, and the heritabil-ities of the hypothesized mediators may themselves have been due

858 OLSON, VERNON, HARRIS, AND JANG
to the heritability of Attitudes Toward Leadership. For example,perhaps individuals who were favorable toward leadership mademore effort to make themselves physically attractive, or becamemore sociable and aggressive because they wanted to be leaders.
Attitudes Toward Sensory experiences (h2 = .36), with higherscores reflecting more positive attitudes toward intense experi-ences like loud music, big parties, and roller coaster rides, shareda substantial amount of genetic variance with Sociability (r = .41).Perhaps the trait of sociability encompasses a general tendency toapproach sources of stimulation (including other people), whichresulted in positive attitudes toward various kinds of sensoryexperiences. This relation might have reflected the opposite causaldirection, however. For example, positive attitudes toward intensesensory experiences may have induced the trait of sociability bymotivating people to approach social gatherings. Indeed, the phe-notypic causal analyses supported this latter interpretation: Thedata were consistent with the causal model going from sensoryattitudes to Sociability, whereas the reverse causal model (whichwas the one we would have predicted) was disconfirmed by thedata.
Attitudes Toward Sensory experiences also yielded a moder-ately high genetic correlation with Aggressiveness (.33). Perhapsinherited aggressiveness induced relatively intense sensory expe-riences, which produced more positive attitudes toward such ex-periences. Once again, though, the phenotypic analyses were moreconsistent with an opposing view: The causal model going fromsensory attitudes to Aggressiveness was supported by the data,whereas the model going from Aggressiveness to attitudes wasdisconfirmed. Thus, for example, positive attitudes to intensesensory experiences (heritable for whatever reason) may havefacilitated the development of an aggressive personality by moti-vating intense experiences like interpersonal confrontations orhighly competitive activities.
Attitudes Toward Equality (h2 = .55) yielded a strong geneticcorrelation (.44) with Sociability. This overlap is intriguing, be-cause the attitude items included in the equality factor reflected, atleast in part, a desire for positive interpersonal relationships (e.g.,making racial discrimination illegal, getting along well with otherpeople). Thus, natural inclinations to be sociable might haveinduced a desire for smooth interactions, which affected attitudestoward issues involving interpersonal relationships. Of course, it isalso possible that positive attitudes toward getting along with otherpeople could have facilitated the development of sociability (phe-notypic mediational analyses were inconclusive).
The final heritable attitude factor, Attitudes Toward OutwardAppearance (e.g., looking my best at all times, wearing attention-grabbing clothes; h2 = .45), yielded a moderately high geneticcorrelation with Sociability (.36). Natural inclinations toward so-ciability could plausibly have induced more interest in lookinggood (to impress or attract others). Alternatively, this relationmight have reflected that positive attitudes toward looking goodincreased Sociability (phenotypic analyses were inconclusive).
We conducted another, very different analysis that explored theextent to which the potential mediators could account for theheritabilities of many attitudes. Specifically, we calculated thecorrelation between the heritability coefficients of the 30 attitudeitems and the items' correlations with the mediators. Rather thantesting genetic overlap between a specific attitude and possiblemediators, this analysis investigated the ability of the mediators to
account for differences between the attitudes in heritability. Onlyone mediator yielded a significant result—the academic achieve-ment measure. The correlations between academic achievementand each of the attitude items were significantly related (r = .33)to the heritability coefficients of the attitudes. Thus, attitude itemsthat correlated highly with academic achievement also tended to behighly heritable. (In a similar vein, there is also a positive corre-lation between the g loadings of IQ subtests and the subtests'heritabilities; see Jensen, 1998.) Our result suggests that academicachievement may have accounted, at least in part, for the herita-bility of individual differences in many attitudes. That is, academicachievement, which was itself heritable, may have contributed tothe heritable component of individual differences in many atti-tudes. This hypothesis is consistent with the conclusions of Scarrand Weinberg (1981), who argued that the genetic transmission ofverbal ability (one probable aspect of academic achievement)partly accounted for the genetic component of individual differ-ences in authoritarian attitudes. We should reemphasize, however,that this analysis rests on the assumption that the same variableunderlies the heritability of many attitudes, which arguably is aquestionable assumption. Also, academic achievement might havereflected respondents' motivation as much as (if not more than)their intellect, in which case motivational variables might havebeen the operative variable influencing attitudes across manydomains.
Environmental Effects on Attitudes
We have focused to this point on the relevance of our data forunderstanding the genetic transmission of individual differences inattitudes, but it is important to emphasize that our findings alsostrongly confirmed the importance of environmental variables inattitude formation. In all of our analyses, the largest percentages ofvariance in attitudes were attributable to nonshared environmentalfactors. That is, the most significant predictor of variability inattitude scores (whether at the item or factor level) was variation inexperiences that were unique to individual members of twin pairs.Of course, these findings should not be surprising to social psy-chologists, who subscribe strongly to a belief in environmentalcausation. Nevertheless, in the context of an article on genes andattitudes, it is worth keeping in mind the fact that environmentalfactors outweighed genetic ones as predictors of the attitudes inour sample (although we should also note that estimates for non-shared environmental factors were calculated as residuals thatinclude variance due to issues such as item unreliability, whichmight be considered error rather than environmental influence).
The observation that nonshared environmental factors are im-portant is not new to our research. Indeed, behavioral geneticistshave increasingly been noting both the predictive strength ofunique experiences and the surprising weakness of shared envi-ronmental factors in the domains of personality, attitudes, andaptitudes (see Dunn & Plomin, 1990; Eaves et al, 1989). Forexample, Plomin and Rende (1991) stated, "One of the mostimportant discoveries in human behavioral genetics involves nur-ture rather than nature: Environmental factors important to devel-opment are experienced differently by children in the same family"(p. 179). An important direction for future research is to exploremore thoroughly the specific experiences of siblings that lead todifferences in attitudes. Such research may require better measures

HERITABILITY OF ATTITUDES 859
of the environment than are currently available (Plomin & Rende,1991), although in a recent study using multiple environmentalmeasures, the authors had some success identifying nonsharedenvironmental mediators of personality differences (Vernon, Jang,Harris, & McCarthy, 1997).
The Cholesky analyses of our data identified a few attitude-mediator pairs that shared environmental origins. That is, in a fewcases, an attitude factor and a potential mediator variable yieldeda significant environmental correlation, indicating that similarnonshared experiences influenced both variables. In all of the casesof a significant, positive environmental correlation, the two vari-ables also correlated positively at the phenotypic level. Specifi-cally, similar experiences were implicated in the development ofboth variables of (a) athletic ability and Attitudes Toward Athleti-cism, (b) Aggressiveness and Attitudes Toward Leadership, (c)athletic abilities and Attitudes Toward Sensory Experiences, (d)Sociability and Attitudes Toward Outward Appearance, and (e)physical attractiveness and Attitudes Toward Outward Appear-ance. For example, exposure to a good coach might both improveathletic abilities and foster positive attitudes toward organizedsports (the first environmental correlation listed above). Or earlyexperiences of peer ridicule might both produce a shy, nonaggres-sive style and precipitate negative attitudes toward being a leader(the second environmental correlation). These environmental find-ings further underscore the importance of studying the specificexperiences of siblings that lead to particular psychologicalcharacteristics.
Attitude Heritability and Attitude Strength
Tesser (1993) hypothesized that heritable attitudes are psycho-logically stronger than are attitudes that are not heritable (see alsoCrelia & Tesser, 1996; Tesser & Crelia, 1994). He showed thatattitudes that had yielded high heritabilities in past research werereported more quickly, were less influenced by conformity pres-sure, affected interpersonal liking more, and yielded strongeragreement-reinforcement effects than did attitudes that hadyielded low heritabilities. Tesser speculated that highly heritableattitudes may have a biological basis that makes change difficult oruncomfortable; thus, individuals build up psychological defensesaround such attitudes and seek out or construct environments thatsupport and protect them.
No researchers have previously tested this hypothesis by obtain-ing direct, self-report measures of attitude strength from partici-pants. In the present study, we obtained such measures and exam-ined their relation to attitude heritability. This approach yieldedevidence that supported Tesser's (1993) reasoning. Specifically,across the 30 attitude items, there was a weak correlation of .17(which was statistically nonsignificant) between the heritability ofthe item and the mean rating across all participants of how stronglythey held the attitude: Items that were more heritable also tendedto yield somewhat higher mean strength ratings across participants.More impressively, when mean importance and mean strengthscores were calculated for each attitude factor (by weighting theimportance or strength means for the 30 items by the factorloadings in Table 3), these scores were strongly related to theheritabilities of the factors (correlations of .52 and .51), althoughthe correlations were only marginally significant because of thefew degrees of freedom. Twenty-five percent of the variation in the
strength or importance scores of the attitude factors could beaccounted for by variation in the heritabilities of the factors.
These data provide support for Tesser's (1993) hypothesis thathighly heritable attitudes are stronger than are less heritable atti-tudes. Moreover, our support comes from an entirely differentresearch strategy than those used by Tesser. There are a variety ofways that attitude strength can be operationalized (see Bassili,1996); our findings, together with those of Tesser (1993; Crelia &Tesser, 1996; Tesser & Crelia, 1994), provide converging evidencefrom very different operationalizations that highly heritable atti-tudes are psychologically stronger than less heritable attitudes.
Conclusions
Attitudes are learned. But attitudes also depend on biologicalfactors. In this research, we obtained evidence that variation acrossindividuals on a wide variety of attitudes is partly attributable togenetic factors. The median h2 across the 30 individual attitudeitems was .35, meaning that, typically, 35% of the attitudinalvariance in our sample was attributable to genetic factors. Non-shared environmental factors were even more important in pre-dicting variation within our sample, producing a median e2 of .60across the 30 individual attitude items. Nevertheless, fully 26 ofthe 30 individual attitudes yielded an estimate of genetic influencethat was significantly greater than zero.
Several personality traits and supplementary variables wereimplicated as possible mediators of attitude heritability. Presum-ably, these characteristics—themselves highly heritable—predis-posed individuals to form particular kinds of attitudes, therebycontributing to the genetic determination of individual differencesin those attitudes. Sociability, in particular, was correlated at agenetic level with several attitudes. Athletic ability and physicalattractiveness also yielded substantial genetic correlations withrelevant attitudes. Finally, academic achievement appeared to becapable of predicting the heritability of the set of attitudes mea-sured in our sample. We think that the primary value of ourmediational analyses is to raise interesting questions about thesources of attitude heritability that can be examined in futureresearch.
We hope that attitude researchers will begin to direct moreattention to the role of biological processes, including geneticfactors, in the formation and change of attitudes. Twin methodol-ogies constitute just one of a variety of approaches that offer thepotential to examine the simultaneous effects of nature and nur-ture. In the long run, we stand to gain the most understanding fromperspectives that integrate biology and experience in accountingfor individual differences.
References
Adorno, T. W., Frenkel-Brunswik, E., Levinson, P. J., & Sanford, R. N.(1950). The authoritarian personality. New York: Harper & Row.
Akaike, H. (1987). Factor analysis and AIC. P.sychometrika, 52, 317-332.Arvey, R. D., Bouchard, T. } . , Segal, N. L., & Abraham, L. M. (1989). Job
satisfaction: Environmental and genetic components. Journal of AppliedPsychology, 74, 187-192.
Bassili, J. N. (1996). Meta-judgmental versus operative indexes of psycho-logical attributes: The case of measures of attitude strength. Journal ofPersonality and Social Psychology, 71, 637-653.

860 OLSON, VERNON, HARRIS, AND JANG
Bollen, K. A. (1989). Structural equations with latent variables. NewYork: Wiley.
Bostrom, R. N., & White, N. D. (1979). Does drinking weaken resistance?Journal of Communication, 29, 73-80.
Bouchard, T. J. Jr., & McGue, M. (1990). Genetic and rearing environ-mental influences on adult personality: An analysis of adopted twinsreared apart. Journal of Personality, 58, 263-292.
Cacioppo, J. T., & Petty, R. E. (1987). Stalking rudimentary processes ofsocial influence: A psychophysiological approach. In M. P. Zanna, J. M.Olson, & C. P. Herman (Eds.), Social influence: The Ontario symposium(Vol. 5, pp. 41-74). Hillsdale, NJ: Erlbaum.
Carey, G., & DiLalla, D. L. (1994). Personality and psychopathology:Genetic perspectives. Journal of Abnormal Psychology, 103, 32-43.
Crelia, R. A., & Tesser, A. (1996). Attitude heritability and attitudereinforcement: A replication. Personality and Individual Differences,21, 803-808.
DeFries, J. C , Plomin, R., & LaBuda, M. C. (1987). Genetic stability ofcognitive development from childhood to adulthood. DevelopmentalPsychology, 23, 4-12.
Dunn, J., & Plomin, R. (1990). Separate lives: Why siblings are sodifferent. New York: Basic Books.
Eagly, A. H., & Chaiken, S. (1993). The psychology of attitudes. SanDiego, CA: Harcourt Brace Jovanovich.
Eaves, L. J., Eysenck, H. J., & Martin, N. G. (1989). Genes, culture, andpersonality: An empirical approach. London: Academic Press.
Eysenck, H. J. (1951). Primary social attitudes as related to social class andpolitical party. British Journal of Sociology, 2, 198-209.
Heath, A. C , Kessler, R. C, Neale, M. C, Hewitt, J. K., Eaves, L. J., &Kendler, K. S. (1993). Testing hypotheses about direction of causationusing cross-sectional family data. Behavior Genetics, 23, 29-50.
Jackson, D. N. (1984). Personality Research Form manual (3rd ed.). PortHuron, MI: Research Psychologists Press.
Jensen, A. R. (1998). The g factor: The science of mental ability. Westport,CT: Praeger.
Jockin, V., McGue, M, & Lykken, D. T. (1996). Personality and divorce:A genetic analysis. Journal of Personality and Social Psychology, 71,288-299.
Joreskog, K. G., & Sorbom, D. (1989a). LISREL: A guide to program andapplications (2nd ed.). Mooreseville, IN: Scientific Software.
Joreskog, K. G., & Sorbom, D. (1989b). PRELIS: A preprocessor forLISREL (2nd ed.). Mooreseville, IN: Scientific Software.
Kasriel, J., & Eaves, L. (1976). The zygosity of twins: Further evidence onthe agreement between diagnosis by blood groups and written question-naires. Journal of Biosocial Science, 8, 263-266.
Keller, L. M., Bouchard, T. J. Jr., Arvey, R. D., Segal, N. L., & Dawis,R. V. (1992). Work values: Genetic and environmental influences.Journal of Applied Psychology, 77, 79-88.
Loehlin, J. C. (1989). Environmental and genetic contributions to behav-ioral development. American Psychologist, 44, 1285-1292.
Loehlin, J. C , & Nichols, R. C. (1976). Heredity, environment, andpersonality: A study of 850 sets of twins. Austin: University of TexasPress.
Martin, N. G., Eaves, L. J., Heath, A. C , Jardine, R., Feingold, L. R, &Eysenck, H. J. (1986). Transmission of social attitudes. Proceedings ofthe National Academy of Sciences, USA, 83, 4364-4368.
Neale, M. C, & Cardon, L. R. (1992). Methodology for genetics studies oftwins and families. Norwell, MA: Kluwer Academic.
Nichols, R. C, & Bilbro, W. C , Jr. (1966). The diagnosis of twin zygosity.Ada Genetica Medicae et Gemellologiae, 16, 265-275.
Olson, J. M., & Zanna, M. P. (1993). Attitudes and attitude change. AnnualReview of Psychology, 44, 117-154.
Oskamp, S. (1991). Attitudes and opinions (2nd ed.). Englewood Cliffs,NJ: Prentice Hall.
Partanen, J., Bruun, K., & Markkanen, T. (1966). Inheritance of drinkingbehavior. Helsinki, Finland: The Finnish Foundation for AlcoholResearch.
Perry, A. (1973). The effect of heredity on attitudes toward alcohol,cigarettes, and coffee. Journal of Applied Psychology, 58, 275-277.
Plomin, R., Corley, R., DeFries, J. C , & Fulker, D. W. (1990). Individualdifferences in television viewing in early childhood: Nature as well asnurture. Psychological Science, 1, 371-377.
Plomin, R., DeFries, J. C, & Loehlin, J. C. (1977). Genotype-environmentinteraction and correlation in the analysis of human behavior. Psycho-logical Bulletin, 84, 309-322.
Plomin, R., & Rende, R. (1991). Human behavioral genetics. AnnualReview of Psychology, 42, 161-190.
Scarr, S., & McCartney, K. (1983). How people make their own environ-ments: A theory of genotype-to-environment effects. Child Develop-ment, 54, 424-435.
Scarr, S., & Weinberg, R. A. (1981). The transmission of authoritarianismin families: Genetic resemblance in social-political attitudes? In S. Scarr(Ed.), Race, social class, and individual differences in I. Q. (pp. 399-427). Hillsdale, NJ: Erlbaum.
Snyderman, M., & Rothman, S. (1987). Survey of expert opinion onintelligence and aptitude testing. American Psychologist, 42, 137-144.
Tellegen, A., Lykken, D. T., Bouchard, T. J. Jr., Wilcox, K. J., Segal, N. L.,& Rich, S. (1988). Personality similarity in twins reared apart andtogether. Journal of Personality and Social Psychology, 54, 1031-1039.
Tesser, A. (1993). The importance of heritability in psychological research:The case of attitudes. Psychological Review, 100, 129-142.
Tesser, A., & Crelia, R. A. (1994). Attitude heritability and attitudereinforcement: A test of the niche building hypothesis. Personality andIndividual Differences, 16, 571-577.
Vernon, P. A., Jang, K. L., Harris, J. A., & McCarthy, J. M. (1997).Environmental predictors of personality differences: A twin and siblingstudy. Journal of Personality and Social Psychology, 72, 177-183.
Waller, N. G., Kojetin, B. A., Bouchard, T. J. Jr., Lykken, D. T., &Tellegen, A. (1990). Genetic and environmental influences on religiousinterests, attitudes, and values: A study of twins reared apart and to-gether. Psychological Science, 1, 138-142.
Wilson, G. D., & Patterson, J. R. (1968). A new conservatism scale. BritishJournal of Social and Clinical Psychology, 7, 264-269.
Zanna, M. P., & Cooper, J. (1974). Dissonance and the pill: An attributionapproach to studying the arousal properties of dissonance. Journal ofPersonality and Social Psychology, 29, 703-709.
Zuckerman, M. (1995). Good and bad humors: Biochemical bases ofpersonality and its disorders. Psychological Science, 6, 325-332.
Received April 2, 1997Revision received March 1, 1998
Accepted December 15, 1998 •