Embed Size (px)
Citation preview

THE HERITAGE INSURANCE COMPANY KENYA LIMITED
Annual Report & Financial Statements
2017A member of
Insurance CompanyHeritage

02
The
Her
itage
Insu
ranc
e Co
mpa
ny K
enya
Lim
ited
Annu
al R
epor
t and
Fin
anci
al S
tate
men
ts 2
017

01CORPORATE INFORMATION 2 Corporate Information 7 Directors’ Report 8 Chairman’s statement21 Corporate Governance Report24 Statement of Directors’ Responsibilities26 Independent Auditors’ Report
02FINANCIAL STATEMENTS31 Statement of Profit or Loss32 Statement of other comprehensive income33 Statement of financial position35 Statement of changes in equity37 Statement of cash flows39 Accounting policies53 Notes to the financial statements

DIRECTORS
P.N. Gethi Kenyan ChairmanG.M. Kioi Kenyan Managing DirectorG.R. May British Non-ExecutiveM.L. du Toit South African Non-ExecutiveS. Sejpal (Ms) British Non-Executive (Resigned 20/11/2017)S.C. Wenman South African Non-ExecutiveC.W. Mwangi (Ms) Kenyan Non-Executive (Resigned 14/06/2017)Rachel Mbai Kenyan Non-Executive (Appointed 30/08/2017)Catherine Mitchem British Non-Executive (Appointed 17/11/2017)
SECRETARY
C. Kioni (Ms)P. O. Box 30390 - 00100Nairobi
SENIOR MANAGEMENT
G. M. Kioi Managing DirectorA. P. Ngunjiri Director (Medical)B. N. Hiuhu (Mrs) Director (Underwriting & Claims)L. Magambo General Manager (Finance)B. Irungu Senior Manager (Claims)I. K Kamau Senior Manager (IT)D. Mathenge Senior Manager (Finance)J. Maluki (Ms) Senior Manager (Medical)B. Maina Senior Manager (Underwriting)S. Chege Head of Retail Business
AUDITORS
KPMG KenyaCertified Public Accountants8th Floor, ABC TowersWaiyaki WayP. O. Box 40612 - 00100Nairobi
REGISTERED HEAD OFFICE
Liberty HouseMamlaka RoadP.O. Box 30390 - 00100Nairobi
PRINCIPAL BANKERS
Stanbic Bank LimitedStanbic CentreChiromo RoadP. O. Box 72833 - 00200Nairobi
Commercial Bank of Africa LimitedCBA Building Mara/ Ragati RoadP.O. Box 30437 - 00100Nairobi
CORPORATE INFORMATION0
4Th
e H
erita
ge In
sura
nce
Com
pany
Ken
ya L
imite
d An
nual
Rep
ort a
nd F
inan
cial
Sta
tem
ents
20
17

MOMBASA Social Security HouseP.O. Box 84886 - 00100MOMBASA
ELDORET Imperial CourtP.O. Box 6120 - 30100ELDORET
NYALI Nyali CentreLinks RoadP.O. Box 84886 - 80100MOMBASA
MACHAKOS Town Plaza2nd FloorP.O. Box 211 - 90100MACHAKOS
KISII Royal Towers2nd Floor,Hospital RoadP. O. Box 3066 - 40200KISII
KISUMU Tuffoam Mall1st FloorJomo Kenyatta HighwayP.O. Box 1062 - 40100KISUMU
NAIVASHA CfC Heritage HouseMoi RoadP.O. Box 1319 - 20117NAIVASHA
NAIROBI Liberty HouseP.O. Box 30390 - 00100NAIROBI
NANYUKI Silver PlazaP.O. Box 1615 - 10400NANYUKI
NAKURU Polo CentreP.O. Box 4362 - 20100NAKURU
MERU NakumattMwitu Centre BuildingP.O. Box 1911 - 60200MERU
THIKA Zuri CentreKenyatta HighwayP.O. 7048 - 001000THIKA
KITENGELA Capital CentreP.O. Box 30390 - 00100NAIROBI
NAIROBI (CITY CENTRE) Lonrho HouseMezzanine 2, Standard StreetP.O. Box 30390 - 00100NAIROBI
EMBUNjue Plaza3rd Floor, Embu - Meru RoadP. O. Box 2607 - 60100EMBU
The Heritage Insurance Company (T) Limited4th Floor Masaki IkonBains Avenue- Msasani Peninsula PO Box 7390, Dar es Salaam, Tanzania.
BRANCHES
SUBSIDIARYTh
e H
erita
ge In
sura
nce
Com
pany
Ken
ya L
imite
d An
nual
Rep
ort a
nd F
inan
cial
Sta
tem
ents
20
170
5

OUR VISIONWe will be the market leading wealth management company in Africa while entering growth markets which allow us to use our points of difference to make a meaningful contribution to the group.
We are a customer-focused organisation with a united, passionate and skilled workforce.
We have the foresight to respond to changing consumer needs through innovative solutions and technologically efficient processes.
OUR VALUES
• Be passionate about our work and utilise our talents to add value
• Take initiative and responsibility
• Respect and appreciate constructive criticism and the opinion of others
• Focus on set goals and deadlines
• Be proud ambassadors of our Company and Group
• Put our customers at the centre of our thinking and serve them with diligence
• Encourage teamwork, respect and trust for one another
• Take ownership of the consequences of our actions
• Perform our duties with care, integrity and honesty
• Deliver beyond expectations
• Constantly improve our skills and knowledge
• Embrace change and seek ways to do things better
06
The
Her
itage
Insu
ranc
e Co
mpa
ny K
enya
Lim
ited
Annu
al R
epor
t and
Fin
anci
al S
tate
men
ts 2
017

MEDICAL INSURANCE
because the greatest gift is a healthy you

MARINE INSURANCE
because your businessmatters to you

The directors submit their report together with the audited financial statements for the year ended 31 December 2017 which disclose the state of affairs of The Heritage Insurance Company Kenya Limited and its subsidiary, Heritage Insurance Company Tanzania Limited (together the ‘Group’).
1. PRINCIPAL ACTIVITIESThe Group underwrites all classes of non life insurance risks as defined by the Insurance Act except Micro Insurance.
2. COMPANY RESULTS AND DIVIDEND
Profit after tax for the year ended 31 December 2017 of Shs 459 million (2016: Shs 524 million) has been added to retained earnings.During the year, the directors paid nil (2016: 60 million) as interim dividend. The directors do not propose payment of a final dividend (2016: nil).
3. DIRECTORS
The directors who held office during the year to the date of this report are as shown on page 2.
4. RELEVANT AUDIT INFORMATION
The Directors in office at the date of this report confirm that:
• There is no relevant information of which the company’s auditor is unaware; and
• Each director has taken all the steps that they ought to have taken as a Director so as to be aware of any relevant audit information and to establish that the Company’s auditor is aware of that information.
5. EMPLOYEES
The number of persons employed by the Company at the end of the year was 179 (2016: 174). Out of the 179 members of staff employed by Heritage Kenya as at 31 December 2017, 105 are male and 74 are female.
6. AUDITORS
The auditors, KPMG Kenya, continue in office in accordance with section 719 of the Kenyan Companies Act, 2015 and subject to the approval by the Commissioner of Insurance under Section 56(4) of the Insurance Act.
7. BUSINESS OVERVIEW
The group delivered solid results in the backdrop of a difficult trading environment. The Group’s heritage is built around a philosophy of quality business rather than top line growth. This has helped the Group weather a particularly difficult year. In Kenya, the Gross Written Premium grew by 11 percent though there was a disproportionate growth in reinsurance costs due to changes in business mix.
There was also an increase in bad debts provisioning reflective of a difficult trading environment where some of our customers were unable to pay premiums on time due to credit glut.
This had a negative effect on Kenya’s core underwriting results though expenses of management remained well under controlin the year. The Heritage Insurance Company Kenya Limited sold a non-strategic company Azali Limited, a special purpose vehicle created to manage Heritage House in Naivasha. The disposal contributed a net loss of KShs 10 million to Heritage Group earnings.
Tanzania business underwent multiple and fundamental regulatory changes in the year. The changes were mainly targeted at distribution and premium payment. This resulted in business slow down and as a result,
DIRECTORS’ REPORT
The
Her
itage
Insu
ranc
e Co
mpa
ny K
enya
Lim
ited
Annu
al R
epor
t and
Fin
anci
al S
tate
men
ts 2
017
09

DIRECTOR’S REPORT (CONT’D)BUSINESS OVERVIEW (CONT’D)
the Gross Written premium was down on the prior year by 14%. On the flipside, the claims cost and management expenses both reduced to compensate for lower premium earnings.
In keeping with the Group’s strong Corporate Governance and risk management practices, all entities within the Group recorded improved solvency in the reporting period.
Key financial indicators of Group and Company are shown below:
THE GROUP THE COMPANY
Gross Written Premiums: up 9% up 11%
Investment Income: up 22% up 17%
Net assets: up 11% up 23%
Benefit payments: up 5% up 11%
Operating expenses up 6% flat
Profit for the year down 12% up 16%
(Loss)/ Gain on disposal of subsidiary (10m) 50m
8. APPROVAL OF FINANCIAL STATEMENTS
The financial statements set out on pages 39 to 103 were approved and authorized for issue at a meeting of Directors on 28 March 2018
By Order of the Board
Company Secretary28 March 2018
10Th
e H
erita
ge In
sura
nce
Com
pany
Ken
ya L
imite
d An
nual
Rep
ort a
nd F
inan
cial
Sta
tem
ents
20
17

PROFESSIONAL INDEMNITY
because your careerbrings value to your life
The
Her
itage
Insu
ranc
e Co
mpa
ny K
enya
Lim
ited
Annu
al R
epor
t and
Fin
anci
al S
tate
men
ts 2
017
11

CHAIRMAN’S STATEMENT DEAR SHAREHOLDERS
I am indeed very pleased to present the Heritage Insurance Company Kenya Limited Annual Report and Financial Statements for the year ended 31 December 2017.
I am particularly grateful to you, shareholders, for the level of support you continue to provide for your company as is evident from your active participation every year.
These occasions offer us a great opportunity to review
our financial performance and at the same time plan strategically ahead together.
On our part as the Board, together with the management and staff, we are always encouraged by the confidence bestowed upon us to steer the affairs of your company and remain committed to the realization of its full potential for growth in order to continue to deliver better returns.
Income Statement HIK HIT Azali Total Cons Adj. Group
2017Profit before taxation 770,982 77,449 2,912 851,343 (172,344) 679,001
Taxation (193,892) (25,493) (874) (220,259) - (220,259)
Total earnings 577,090 51,956 2,038 631,084 (172,344) 458,743
Change in earnings +16% (51%) 0% +4% (111%) (12%)
2016
Profit before taxation 705,079 155,941 2,934 863,954 (81,617) 782,337
Taxation (206,885) (50,306) (897) (258,089) - (258,089)
Total earnings 498,194 105,635 2,037 605,866 (81,617) 524,249
*Azali Limited was sold on 31 August 2017
GLOBAL BUSINESS OUTLOOK
The World Bank forecasts global economic growth to edge up to 3.1 percent in 2018 after a much stronger than expected 2017, as the recovery in investment, manufacturing, and trade continues.
Growth in advanced economies is expected to moderate slightly to 2.2 percent this year, as central banks gradually remove their post-crisis accommodation and the upturn in investment growth stabilizes.
Growth in emerging market and developing economies as a whole is projected to strengthen to 4.5 percent, as activity in commodity exporters continues to recover amid firming prices.
In oil-exporting economies, the 2014 - 16 oil price collapse has already prompted some reforms. Nevertheless, across all emerging market and developing economies (EMDEs), room for policy improvements remains. Policy initiatives to lift physical and human capital, encourage labour force participation, and improve institutions could help raise potential growth and reduce inequality.
12Th
e H
erita
ge In
sura
nce
Com
pany
Ken
ya L
imite
d An
nual
Rep
ort a
nd F
inan
cial
Sta
tem
ents
20
17

“The Company’s overall financial performance in 2017 showed resilience in the midst of events outside our direct control”.
P N Gethi
The
Her
itage
Insu
ranc
e Co
mpa
ny K
enya
Lim
ited
Annu
al R
epor
t and
Fin
anci
al S
tate
men
ts 2
017
13

CHAIRMAN’S STATEMENT (CONT’D)MACRO ECONOMIC ENVIRONMENT
World Bank 2018 report projects Kenya’s economic growth to rebound to 5.8 percent in 2018. The same report indicates the Gross Domestic Product (GDP) growth decelerated to 5.5 percent in 2017 because of drought, weak credit growth, security concerns, and a rise in oil prices.
Medium term GDP growth should rebound to 5.8 percent in 2018 and 6.1 percent in 2019 respectively, depending on the completion of ongoing infrastructure projects, the resolution of slow credit growth, and the strengthening of the global economy and tourism.
In the long term, the adoption of prudent macroeconomic policies will help safeguard Kenya’s robust economic performance, according to the World Bank. This includes the implementation of fiscal and monetary prudence and lowering the deficit down to 4.3 percent by financial year 2019/2020, as per the Medium Term Fiscal Framework. Fiscal consolidation needs to avoid compromising public investment in critical infrastructure key to unlocking the economy’s productive capacity.
On social development, Kenya met some Millennium Development Goals (MDGs) targets, including reduced child mortality, near universal primary school enrolment, and narrowed gender gaps in education. Interventions and increased spending on health and education are paying dividends. And, while the healthcare system has faced challenges, devolved health care and free maternal health care at all public health facilities will improve health care outcomes and develop a more equitable health care system.
Kenya’s youthful and growing population, dynamic private sector, highly skilled workforce, improved infrastructure, new constitution, and pivotal role in East Africa, give it the potential to be one of Africa’s great success stories. Addressing poverty, inequality, governance, and the skills gap (between market requirements and the education curriculum) will be major goals, as well as problems of climate change, low investment, and low productivity.
INSURANCE SECTOR OUTLOOK
Kenya represents one of Africa’s most well developed and best regulated insurance markets, with formidable historic growth and even better near term prospects. There are increasing regulatory capital requirements on the horizon, and there is growing scope for consolidation.
The 2018 Insurance Industry Outlook pinpoints key opportunities for growth. Foreign and local capital is likely to continue to flow into the sector, lured not only by the great domestic potential access to financial services is still modest but also by the chance to expand into the sizeable regional market. Currently, according to the Association of Kenyan
Insurers (AKI), Kenya represents 70 percent of the East African insurance market, which also includes Tanzania, Uganda, Rwanda and Burundi.
In recent years, insurance penetration and accessibility have been improving steadily. A number of major infrastructure plans have created investment opportunities in insurance. Some of the main ventures include the construction of the second runway and new terminal at Jomo KenyattaInternational Airport, the Lamu Transport Corridor project and the Standard Gauge Railway (SGR) project.The insurance penetration is about 2.9 percent of the Gross Domestic Product (GDP).
The worldwide insurance penetration is estimated at 6.5 percent of GDP. (Source IRA 2017 report)
As technology, innovation, higher customer expectations and disruptive newcomers redefine the marketplace, we remain focused on growing top line sales, bottom line profitability, addressing challenges, and competing responsibly in a dynamic industry.
INNOVATION AND TECHNOLOGYIn line with enhancing efficiency in various spheres of business operations, adoption of emerging technology trends has been a key area of focus for the company. The business has been aggressive in automating core areas of business including bank payment through a host to host system that has not only quickened payments but also reduced from a two-stage process to a one stage process.
In addition, we made it easier for customers to pay premiums by offering multiple online payment options. Customers can now pay premiums from the comfort of their homes or offices via m pesa or credit cards (Visa) by simply going to our website and selecting E Pay. Payment reference will be required for instantaneous receipting and allocating to a customer account.
The company also connected to the government’s Integrated Population Registration System (IPRS) which is registration bureau of identity cards.
This has enhanced speed of processing new business with an authenticated and accurate system. Cyber Security has been a key area of focus for the company. In the year, the business subscribed to Mimecast with a view to scan emails, thereby eliminating fraud and spam emails and filtering any viruses. The company also moved its email servers to the cloud thereby ensuring that all staff are able to access and provide timely service from any location with an internet connection.
On new product development, we introduced the Trade Credit policy that seeks to cover businesses that supply goods on credit against loss of revenue from buyers who do not honour their payment obligation.
14Th
e H
erita
ge In
sura
nce
Com
pany
Ken
ya L
imite
d An
nual
Rep
ort a
nd F
inan
cial
Sta
tem
ents
20
17

CHAIRMAN’S STATEMENT (CONT’D)INNOVATION AND TECHNOLOGY (CONT’D)
Going forward, the company plans to introduce a groundbreaking motor insurance policy that will revolutionize motor insurance in Kenya. Through this product, clients will now pay their premiums based on how they drive.
CORPORATE SOCIAL INVESTMENTSIn 2017, the company drove a robust Corporate Social Responsibility (CSI) programme anchored on two main pillars of Education and Health as part of the wider Liberty Group CSI
Policy. On education, the company enrolled 10 new secondary school students in form one from across the country to bring to a total of 52 students under the Heritage Scholarship Programme that sponsors tuition fee for students in secondary and tertiary institutions. Other education programmes undertaken over the period include celebration of the 2017 Nelson Mandela Day with students from Kajiado Township Primary School. In marking this occasion, the company through its staff donated funds towards a school feeding programme that saw all the students get lunch through a Heritage staff initiative dubbed Stairwell Challenge which saw each participating staff raise money towards the programme.Additionally, the company made donations towards education of needy students during the 2017 Starehe Founders Day Celebration in Nairobi. On health, the company ran a vigorous
Healthy Living Campaign that aimed at sensitizing company staff on benefits of living a healthy lifestyle. Indeed, it was through this initiative that staff raised funds towards the Kajiado Township Primary School feeding programme. Other initiatives included support to the Cerebral Palsy Society of Kenya and participation in the Association of Kenya Insurers Medical Camp in Githunguri, Kiambu County.
REGULATORY ENVIRONMENT IN KENYA The Insurance Act has undergone various revisions in the year 2017 to keep abreast with the changing environment.
The changes were majorly on harmonizing the risk-based capital provisions within the Act and creation of perpetual licenses for insurance companies.
The Insurance Regulatory Authority (IRA) also issued the following guidelines to assist in the risk-based supervision: • The Insurance (Valuation of Technical Provisions for General Business) Guidelines 2017.
• The Insurance (Investments Management) Guidelines, 2017 • The Insurance (Capital Adequacy) Guidelines, 2017
REGULATORY ENVIRONMENT
The Insurance (Amendment) Act 2016 took effect on 13 January 2017 and the Act was amended to operationalize risk-based solvency requirements that were introduced in the Finance Act, 2013.
THE STATUTE LAW (MISCELLANEOUS AMENDMENTS)
ACT, 2017
The Insurance Act was amended by changing the date when the insurance companies were expected to fully comply with the Risk-Based Capital Requirement. The date has been moved
from 30 June 2018 to 30 June 2020.
THE INSURANCE (AMENDMENT) ACT 2017 AND THE INSURANCE (AMENDMENT) REGULATIONS 2017
The Insurance Act was amended to create perpetual licenses for Insurance companies and did away with the annual application for insurance licenses.
“The company has a long-term education financial aid program where students from poor backgrounds across the counties are considered for sponsorship. The company walks with the student the entire journey from Form 1 admission until they graduate from the university and eventual job placement.”P. N. Gethi
The
Her
itage
Insu
ranc
e Co
mpa
ny K
enya
Lim
ited
Annu
al R
epor
t and
Fin
anci
al S
tate
men
ts 2
017
15

CHAIRMAN’S STATEMENT (CONT’D)
REGIONAL MARKET There were Regulatory Changes in Tanzania as outlined below:
A) THE MISCELLANEOUS AMENDMENTS ACT (NO. 2) OF 2017
In June 2017, the Tanzanian Parliament passed the Written Laws (Miscellaneous Amendments Act (No. 2) of 2017, which amended the Insurance Act, with respect to foreign ownership of insurance brokers, the mechanics of payment (and minimums) for insurance premiums and the requirement to obtain insurance only through Tanzanian insurers.
OWNERSHIP AND PAYMENT OF BROKERS
The changes require insurance brokers to be at least two thirds (over 66 percent) owned and controlled by Tanzanian citizens. This is a 100 percent increase from the previous local participation requirement (of one third (above 33 percent).
Further, customers will have to pay insurers all premiums directly, even when they are using brokers. Brokers will only be entitled to receive their commissions directly from the insurers (instead of taking them out of premiums from customers) and there are heavy penalties for contravening this.
MINIMUM INSURANCE PREMIUMS
The amendments enable the Commissioner of Insurance to set minimum rates of premiums payable for different classes of insurance by, publishing orders in the Government Gazette.
REQUIREMENT TO OBTAIN INSURANCE ONLY THROUGH TANZANIAN INSURERS
Insurance cover for a Tanzanian resident person or company may only be placed with a Tanzanian registered insurer. The exception to this, where classes of insurance are not available from a Tanzanian registered insurer, is now even further curtailed. The changes make it clear that all ground transport insurance, marine insurance and air cargo insurance covers for Tanzanian imports must be effected by a Tanzanian insurer.
B) CIRCULAR LETTER NO.055/2017 (CONDITIONS FOR DEALING WITH FOREIGN REINSURERS AND REINSURANCE BROKERS)
The circular issued by Commissioner of Insurance specifically seeks to address market challenges resulting
from externalisation (fronting) of insurance business outside the country through reinsurance. It particularly prohibits the externalization of risks at 100 percent, externalisation of long term insurance business in the country and also prohibits co-insurance with sister or parent companies based in other jurisdictions.
The circular also requires insurers to diversify the reinsurers used and ensure the reinsurers have a rating of B+ or better from independent reputable rating agency. Further, the insurance companies are required to retain competent reinsurance staff.
The circular came into effect on 1 January 2018.
All the above regulatory changes have a direct impact in the company and the Group conducts business.
BUSINESS PERFORMANCE IN TANZANIA
Tanzania has sustained relatively high economic growth over the last decade, averaging 6 percent to 7 percent a year.
The growth in the insurance market has been aligned to the reported growth in Gross Domestic Product. In 2018, the general insurance market is expected to grow in double digits based on the historical trend.
During the year under review, the following legislations came into effect:
• Cash before cover – This requires clients to pay their premiums directly to the insurers
• Accreditation of foreign Reinsurance. – This call for foreign reinsurers seeking to transact business in Tanzania to have an accreditation letter from Tanzania Insurance Regulatory Authority.
These changes aim to ensure that a sound business environment is realized.
In terms of financial performance, Heritage Insurance Company Tanzania Limited gross written premium decreased by 26 percent over the previous year primarily due to regulatory changes, loss of large corporate clients and other market conditions. The net earned premium decreased by 19 percent over 2016. During the year, the Company had a reasonable claims experience and recorded an overall net claims ratio of 47 percent (net claims over net earned premium) in line with the
16Th
e H
erita
ge In
sura
nce
Com
pany
Ken
ya L
imite
d An
nual
Rep
ort a
nd F
inan
cial
Sta
tem
ents
20
17

budget and previous year loss. Operating expenses remained marginally higher at 17 percent compared to the international benchmark of 10 percent of gross written premium.
The Company continues to focus on prudently reducing the cost base and on improving the operational cost ratios. Interest & dividend incomes at Tshs 2,089 million were 6 percent higher than the previous year due mainly to an increase in bank deposits from Tshs 19,680 million to Tshs 24,234 million.
Fair value gain on investment was Tshs 293 million compared to a loss of Tshs 587 million in 2016.
Unrealized exchange loss of TZS 22 Million and realized exchange gains of TZS 417 million has also been recorded as at the end of December 2017.
The underwriting profit decreased by 51 percent to TShs 696.8 million in 2017 from TShs 1,409 million in 2016. The profit before tax at TShs 1,677 million is 23 percent lower compared with profit before tax of TShs 4,331 million in 2016.
Besides the drop in business at the top line, the bottom line results were significantly affected by a one-off bad debt provision of a disputed claim recovery worth Tshs 1,189 million. During the year the company paid an interim dividend of Tshs 4 billion. With total Assets of Tshs 56.6 billion and a strong relationship with reputable Reinsurers, the Company remains both strong and dynamic.
The Heritage Insurance Company Tanzania strives to ensure success for the benefits of all our stakeholders by providing efficient service to its loyal clients and enhancing shareholders value.
The Company will continue to focus on its core market segment of large corporate clients alongside while making concerted efforts to develop and strengthen business relationships with Tier II, Tier III brokers and retail channel partners to broaden its client base.
The positive impact of various Government projects and the focus on industrialization will have a positive impact for the Company.
The Company is expecting to derive substantive growth from Aviation, Engineering, Marine business segments and other retail business especially motor segment.
The success of our business derives from our stakeholders: Employees, Clients, Brokers, Agents, Reinsures, Business partners, Regulators and Shareholders.
COMPANY OF CHOICE
Heritage Insurance Company Kenya Limited is an equal opportunity employer. The company provides equal employment opportunities to all employees or job applicants and does not discriminate in any way because of gender, race, colour, religion, national origin, sex, physical or mental disability, or age.
The company encourages staff development by offering both Professional and Internal training opportunities.Our objectives in appointment are to recruit the person who is most suited to the particular job based on his relevant abilities, qualifications, experience and skills for the post. Recruitment and selection decisions will always be made on the basis of merit making our company the most attractive place to work.
Heritage Insurance Company Limited is committed to ensuring the best possible environment for the employees. Safeguarding and promoting their welfare is our highest priority.
We aim to recruit staff that share and understand our commitment, and to ensure that no job applicant is treated unfairly by reason of a protected characteristic as defined under the Employment Act.
DEALING WITH FRAUD
Fraud is one of the biggest challenges facing the insurance industry. The industry estimates generally put fraud at about 10 percent of the property or casualty insurance industry’s incurred losses and loss adjustment expenses each year, although the figure can fluctuate based on the line of business, economic conditions and other factors.
Fraudulent claims are particularly prevalent in motor and medical claims. It is difficult to tell the exact magnitude of the menace.
The industry lobby body, the Association of Kenya Insurers (AKI) is developing a data sharing platform that should help industry players share information freely to assist stakeholders to understand customer trends.
CHAIRMAN’S STATEMENT (CONT’D)BUSINESS PERFORMANCE IN TANZANIA (CONT’D)
The
Her
itage
Insu
ranc
e Co
mpa
ny K
enya
Lim
ited
Annu
al R
epor
t and
Fin
anci
al S
tate
men
ts 2
017
17

PRODUCTS AND CHANNELS Heritage Insurance Company Kenya Limited provides short term insurance products and prides on its superb history of prompt claims payment.
This has earned us major awards for Outstanding Insurance Underwriter in Claims Settlement as nominated by members of the Association of Insurance Brokers of Kenya.
We are also rated AA by Global Rating Company (GRC), for amongst other reasons, our high claims paying ability. This is one of the highest international ratings ever given to recognize a Kenyan insurer!
As Heritage Insurance Company, we are developing systems and processes to meet the modern demands of the ever enlightened customers.
This, therefore, means investing in the expansion of our distribution channels and networks making it easier for our customers to have access to services at their own convenience.
As a result, we have gained cumulative experience in understanding our customers’ needs and preferences and have been largely successful in providing innovative solutions that meet their needs.
APPRECIATION
I would like to take this opportunity to sincerely thank the Board of Directors for their unrelenting support and guidance throughout the year.
Similarly, to our valued business partners, brokers, agents and clients who have remained with us even in the most turbulent of times, we thank you and reiterate our unbreakable promise to service. As I conclude, I wish to thank the management and staff for your dedication and commitment to serve our clients. Together, we will maintain our Brand as the trusted leader in insurance in the East African region.
Peter Gethi,ChairmanDate: 28 March 2018
CHAIRMAN’S STATEMENT (CONT’D)
18Th
e H
erita
ge In
sura
nce
Com
pany
Ken
ya L
imite
d An
nual
Rep
ort a
nd F
inan
cial
Sta
tem
ents
20
17

TRADE CREDIT INSURANCE
because some risksare worth taking

GROSS WRITTEN PREMIUMS
GROSSPREMIUMS
(Kshs.)
TOTAL ASSETS UNDERWRITING RESULTS
GROUP
COMPANY
Kenya
5.9 B
Tanzania
1.7 B
8.0
7.0
6.0
5.0
4.0
3.0
2.0
1.0
0.02013 2014 2015 2016 2017
6.0 6.
24.
0
5.2 5.
3
5.9
3.5
7.5 7.
6
7.6
1 0
2 0
30
40
50
60
70
80 5 .
00
10
8.0
6.0
4.0
2.0
1.0
0.02013 2014 2015 2016 2017
9.9
9.1
6.1 6.
6 7.2
8.9
4.7
9.8 10
.2
11.3
1 0
2 0
40
60 7
80 2
10 .
.
00
0.6
0.5
0.4
0.3
0.2
0.1
0.02013 2014 2015 2016 2017
0.33
0.25
0.20 0.
22
0.40
0.26
0.31
0.28
0.48
0.30
0
01
0 2
0
0 3 5 2
04
4
0 5 0
06
00
Heritage Insurance Company Kenya Limited is among the top 10 short term insurance underwriters in the industry by premium volumes. The Company has put in place some rigorous underwriting guidelines to ensure that we have continuously returned underwriting results from the operations of the Company over the years. In addition, the Company continuously evaluates its processes and procedures to ensure the operations are done in the most efficient manner, to serve the clients in the most satisfactory manner. Today we are among the best in service delivery.
FIN
AN
CIA
LH
IGH
TLIG
HTS
20Th
e H
erita
ge In
sura
nce
Com
pany
Ken
ya L
imite
d An
nual
Rep
ort a
nd F
inan
cial
Sta
tem
ents
20
17

GROSS WRITTEN PREMIUMS
GROSSPREMIUMS
(Kshs.)
TOTAL ASSETS UNDERWRITING RESULTS
GROUP
COMPANY
Kenya
5.9 B
Tanzania
1.7 B
8.0
7.0
6.0
5.0
4.0
3.0
2.0
1.0
0.02013 2014 2015 2016 2017
6.0 6.
24.
0
5.2 5.
3
5.9
3.5
7.5 7.
6
7.6
1 0
2 0
30
40
50
60
70
80 5 .
00
10
8.0
6.0
4.0
2.0
1.0
0.02013 2014 2015 2016 2017
9.9
9.1
6.1 6.
6 7.2
8.9
4.7
9.8 10
.2
11.3
1 0
2 0
40
60 7
80 2
10 .
.
00
0.6
0.5
0.4
0.3
0.2
0.1
0.02013 2014 2015 2016 2017
0.33
0.25
0.20 0.
22
0.40
0.26
0.31
0.28
0.48
0.30
0
01
0 2
0
0 3 5 2
04
4
0 5 0
06
00
Heritage Insurance is an equal opportunity employer. The Company strives to attract and retain a highly skilled and competent staff who in turn serves our clients in the most professional way. Out of the 179 members of staff employed by Heritage Kenya as at 31 December 2017, 105 are male and 74 are female.

1
3
2
BOARD OF DIRECTORS
4
22Th
e H
erita
ge In
sura
nce
Com
pany
Ken
ya L
imite
d An
nual
Rep
ort a
nd F
inan
cial
Sta
tem
ents
20
17

7
26
1 Peter GethiChairman 4 Gayling May
Director
7 Stuart WenmanDirector
2 Godfrey KioiManaging Director 5 Mike Du Toit
Director
3 Rachel Mbai Director (Appointed 30 Aug. 2017) 6 Catherine Mitchem
Director (Appointed 17 Nov. 2017)
4
5
The
Her
itage
Insu
ranc
e Co
mpa
ny K
enya
Lim
ited
Annu
al R
epor
t and
Fin
anci
al S
tate
men
ts 2
017
23

MANAGEMENTTEAM
1 2 3
6
1 G. Kioi
Managing Director
4 S. Chege
Head of Retail Business
2 B. N. Hiuhu (Mrs.)
Director (Underwriting & Claims)
3 A. P. Ngunjiri
Director (Medical)
4 5

7
9
8
10
7 L. Magambo
General Manager (Finance)
10 I.Kamau
Senior Manager (ICT)
8 B. Irungu
Senior Manager (Claims)
5 J. Maluki (Ms.)
Senior Manager (Medical) 9 B. Maina
Senior Manager (Underwriting)
6 D. Mathenge
Senior Manager (Finance)
The
Her
itage
Insu
ranc
e Co
mpa
ny K
enya
Lim
ited
Annu
al R
epor
t and
Fin
anci
al S
tate
men
ts 2
017
25

AGRICULTURAL INSURANCE
because growth and progress drive everything

1. INTRODUCTION
The Heritage Insurance Company Kenya Limited Corporate Governance Framework comprises the Board of Directors, Committees of the Board, Management and Operations Committees, as well as policies, procedures and systems which together govern the management of the business. The company continuously embraces the principles of good corporate governance to ensure that its business remains sustainable, relevant and profitable. The Board of Directors and Management have embraced the principles of integrity, accountability and transparency in directing and running the affairs of the company.
The Corporate Governance Framework also guides the relationship between Heritage Insurance Company Kenya Limited its parent shareholder, Liberty Kenya Holdings Ltd, as well as its relations with other member companies of the Liberty Africa Group.
2. BOARD OF DIRECTORS
The Mandate of the Heritage Insurance Company Board of Directors is to implement principles of good corporate governance, determine the strategic direction of the company and ensure sustainability of the business. The Board of Directors is therefore responsible for implementing the Strategic Plan through oversight, enhanced shareholder value, company growth, profitability, financial reporting, accountability and safeguarding of company assets.In order to achieve this efficiently, the Board has delegated various responsibilities to various committees of the Board and Management Committees, while the mandate to oversee the running of the business has been conferred to the Managing Director. There are three committees of the board, namely: The Directors Affairs Committee, Audit and Risk Committee and the Investment Committee.
The Board of Directors is constituted of six non-executive directors and the Managing Director and holds meetings at least once every quarter.
In 2017, the Board of Directors held meetings as follows:
Member 02.03.2017 25.05.2017 30.08.2017 17.11.2017 11.12.2017
Peter N Gethi P P P P P
Godfrey Kioi P P P P P
Gayling R May P P P P P
Stuart Wenman P P P P P
Mike du Toit P P P P P
Claire W Mwangi * 1 P P P N/A N/A
Sonal Sejpal * 2 P A P P N/A
Rachel Mbai * 3
Catherine Mitchem * 4
-
-
--
P-
P
-
P
P
*1 Resigned on 14 June 2017 *2 Resigned on 20 November 2017
*3 Joined the Board on 30 August 2017 *4 Joined the Board on 17 November 2017P - Present A - Absent with apologies N/A - Resigned
CORPORATEGOVERNANCE REPORT
The
Her
itage
Insu
ranc
e Co
mpa
ny K
enya
Lim
ited
Annu
al R
epor
t and
Fin
anci
al S
tate
men
ts 2
017
27

CORPORATE GOVERNANCE REPORT (CONT’D)
3. THE DIRECTORS’ AFFAIRS COMMITTEE
This Committee is established by the directors of Liberty Kenya Holdings Limited. The mandate of this committee is to supervise the management of key human resources of all its subsidiaries. This includes the appointment and management of executives and review of remuneration policies.
4. THE AUDIT AND RISK COMMITTEE (ARC)
The mandate of this committee is to oversee the implementation of effective policies, procedures and internal controls.
The ARC also sets and reviews the company’s risk management strategy, while enforcing compliance with internal and regulatory provisions.
This committee also reviews the scope of work, skills of the Internal Audit function and provides guidance in the resolution of audit findings. The ARC reinforces best practice in Corporate Governance through the implementation of its mandate.
The Audit and Risk committee is charged with approving the company’s financial statements, and acts as the liaison with the External Auditors. In this regard, the ARC provides oversight and assurance for financial reporting.
The Audit and Risk Committee is constituted of four non-executive directors, and holds meetings every quarter:
In the year 2017, the Audit and Risk Committee held meetings as follows:
Director 28.02.2017
23.05.2017
28.08.2017
14.11.2017
G R May P P P P
M L du Toit P P P P
S Sejpal A P P N/A
S C Wenman P P P P
P - Present A - Absent with apologies N/A - Resigned
5. THE INVESTMENT COMMITTEE
The objective of the Investment Committee is to oversee the design of the company’s investment strategy and to monitor its implementation. The committee monitors performance of the company’s investment portfolio, as administered by professional asset managers in accordance with the Board Investment Strategy, and reviews compliance of the investment
managers with benchmarks and performance standards.The committee is constituted of three non-executive directors, the Managing Director and representatives from the Finance Department and holds quarterly meetings.
In year 2017, the Investment Committee held meetings as follows:
Director 01.02.2017
24.05.2017
29.08.2017
15.11.2017
M.L . du Toit P P P P
S.C. Wenman P P P P
C.W. Mwangi * A A N/A N/A
G.M. Kioi P P P P
P - Present A - Absent with apologies N/A - Resigned
6. MANAGEMENT AND OPERATIONS COMMITTEES
Three Management and Operations Committees have been constituted to facilitate effective implementation of the Strategic Plan and efficient Company operations. They include:
6.1 THE EXECUTIVE COMMITTEE (EXCO)
The mandate of ExCo is to oversee strategic and operational matters of the company, as well as all its relations with the Liberty Group. The objective of this committee is to enhance coordination and communication across the business units, and carry out review of company performance and implementation of the Strategic Plan. This committee meets weekly, and also holds monthly Mission Status Review (MSR) forums to monitor implementation of the Strategic Plan.
The members of ExCo are;
• Managing Director• Director – Medical• Director – Operations• General Manager – Finance and Administration• General Manager – Risk and Compliance• Senior Manager – ICT• Senior Manager – Human Resources• Head of Retail Business• Head of Corporate Business
28Th
e H
erita
ge In
sura
nce
Com
pany
Ken
ya L
imite
d An
nual
Rep
ort a
nd F
inan
cial
Sta
tem
ents
20
17
CORPORATE GOVERNANCE REPORT (CONT’D)6. MANAGEMENT AND OPERATIONS COMMITTEES(CONT’D)
6.2 THE CREDIT MANAGEMENT COMMITTEE
The mandate of the Credit Management committee is to ensure full implementation of the Credit Policy, as well as providing policy guidance and oversight in credit management.
It is chaired by the General Manager-Finance and Administration, and is constituted by members whose functions have the greatest impact in debt management and credit control. Its core responsibilities are:
• To ensure compliance with the credit management policy;• To ensure that all money owed to the company is
promptly collected in accordance with credit terms;• To take appropriate measures in dealing with defaulters;
and• To recommend to the Board, through the Managing
Director and Audit and Risk Committee, provision for doubtful debts and write off of uncollectible debts.
L. Magambo ChairmanL. Wachira SecretaryG.M. Kioi Member B.N.G. Hiuhu Member F. Muikamba Member A.P. Ngunjiri Member A. Njiru Member S. Chege Member S. Githinji Member
6.3 THE HUMAN RESOURCES COMMITTEE
The objectives of this committee are as follows:
• To develop policies on terms and conditions of service, performance management and staff remuneration in line with best market practice
• To ensure compliance with legislation regarding human capital management
• To develop and review the code of ethics and evaluate cases of unethical behavior
The members of this committee are the Managing Director, General Manager – Finance and Administration, Director – Medical, and the Senior Manager – Human Resources.
The committee meets bi-monthly or as deemed necessary.
7. THE OPERATIONS COMMITTEE
The company has implemented an enterprise risk management framework and upholds internal controls designed to enhance compliance, integrity and reliability of financial data.This framework is also supported by policies, procedures and segregation of duty, which ensure accountability and safeguarding of company assets.
The effectiveness of the risk management and internal control environment is monitored regularly through the internal audit function and annual review by external auditors.
As part of risk governance, internal control and compliance oversight, the company has established an Operating Company (OpCo) Committee.
The objective of this committee is to monitor key risk indicators and to set the tone in management of operational, market, insurance and compliance risks. This committee holds monthly meetings.
The members of the OpCo are:
G.M Kioi ChairmanM. Kivuitu MemberB.N.G. Hiuhu MemberA. Ngunjiri MemberL. Magambo MemberJ. Kinoti MemberI. Kaviti Member
The
Her
itage
Insu
ranc
e Co
mpa
ny K
enya
Lim
ited
Annu
al R
epor
t and
Fin
anci
al S
tate
men
ts 2
017
29

CORPORATESOCIALINVESTMENT
1.
2.
3.
4.
STUDENT SPONSORSHIP PROGRAMME - 7
Members of the Heritage Corporate Social Investment committee with one of the student under the sponsorship programme when they paid her a visit at Kyeni Girls High School in Embu County. Currently, the programme has enrolled over 50 students from across the country in secondary and university institutions.
DIABETES AWARENESS - 3
Members of staff take part in a diabetes awareness campaign walk organised by the Kenya Diabetes Management Information Centre. The company donated Ksh.100,000
HEALTHY DIET - 1
Heritage Managing Director Mr. Godfrey Kioi (centre) leads members of staff in launching an internal staff campaign on healthy living during “HAPPY DAY”
MARKING NELSON MANDELA DAY - 6
Heritage Insurance and Liberty Life Kenya CSI patrons Albert Ngunjiri and Kivuitu Musili present a sponsorship cheque to teachers and students of Kajiado Township Primary School in marking the 2017 Nelson Mandela Day. The funds will go towards the school feeding programme for all the students in the school.
30Th
e H
erita
ge In
sura
nce
Com
pany
Ken
ya L
imite
d An
nual
Rep
ort a
nd F
inan
cial
Sta
tem
ents
20
17

5.
6.
7.
MEDICAL CAMP - 4
The company in partnership with the Association of Kenya Insurers (AKI) organised a public medical camp in Gatanga Kiambu County targeting members of the public as part of Heritage CSI initiative.
STAIRWELL CHALLENGE - 5
Members of staff from Heritage Insurance, Liberty Life and Stanlib sign commemorative t-shirts after successfully taking part in a stairwell challenge at Liberty House. The initiative involved staff taking stairs from ground floor to the rooftop with each trip raising funds towards school feeding programme while promoting healthy living.
WALKING FOR A CAUSE -2
A group of staff from Heritage express their delight after successfully finishing a 20 km walk in support of the Celebral Palsy Society of Kenya.Heritage actively supports the society’s campaigns to create awareness and advocacy for the rights of persons afflicted by celebral palsy in Kenya.
The
Her
itage
Insu
ranc
e Co
mpa
ny K
enya
Lim
ited
Annu
al R
epor
t and
Fin
anci
al S
tate
men
ts 2
017
31

STATEMENT OF DIRECTORS’ RESPONSIBILITIESThe Directors are responsible for the preparation and presentation of the consolidated and separate financial statements of The Heritage Insurance Company Kenya Limited set out on pages 39 to 103 which comprise the Group and Company statements of financial position as at 31 December 2017, the statements of profit or loss, statements of other comprehensive income, statements of changes in equity and statements of cash flows for the Group and Company for the year then ended, and the notes to the financial statements which include a summary of significant accounting policies and other explanatory information.
The Directors responsibilities include: determining that the basis of accounting described in Accounting policy 1.2 is an acceptable basis for preparing and presenting the financial statements in the circumstances, preparation and presentation of financial statements in accordance with International Financial Reporting Standards and in the manner required by the Kenyan Companies Act, 2015 and for such internal control as the directors determine is necessary to enable the preparation of financial statements that are free from material misstatements, whether due to fraud or error.
Under the Kenyan Companies Act, 2015, the Directors are required to prepare financial statements for each financial year that give a true and fair view of the financial position of the Group and Company as at the end of the financial year and of the profit or loss of the Group and company for that year. It also requires the Directors to ensure the company keeps proper accounting records that disclose with reasonable accuracy the financial position of the Group and the company.
The Directors accept responsibility for the annual financial statements, which have been prepared using appropriate accounting policies supported by reasonable and prudent judgements and estimates, in conformity with International Financial Reporting Standards and in the manner required by the Kenyan Companies Act, 2015. The Directors are of the opinion that the financial statements give a true and fair view of the financial position of the Group’s and Company’s profit or loss.
The Directors further accept responsibility for the maintenance of accounting records that may be relied upon in the preparation of financial statements, as well as adequate systems of internal financial control.The Directors have made an assessment of the Group and the Company’s ability to continue as a going concern and have no reason to believe the Group and the Company will not be a going concern for at least the next twelve months from the date of this statement.
APPROVAL OF THE FINANCIAL STATEMENTSThe financial statements, as indicated above, were approved and authorized for issue by the Board of Directors on 28 March 2018.
P.N. Gethi G.M. KioiDate: 28 March 2018
32Th
e H
erita
ge In
sura
nce
Com
pany
Ken
ya L
imite
d An
nual
Rep
ort a
nd F
inan
cial
Sta
tem
ents
20
17

MOTOR INSURANCE
because we believeyou deserve peace of mind

INDEPENDENT AUDITORS’ REPORT TO THE SHAREHOLDERSREPORT ON THE AUDIT OF THE CONSOLIDATED AND SEPARATE FINANCIAL STATEMENTS
OPINION
We have audited the consolidated and separate financial statements of The Heritage Insurance Company Kenya Limited (the Group and Company ) set out on pages 39 to 103 which comprise the Group and Company statements of financial position as at 31 December 2017, Group and Company statements of profit or loss, Group and Company statements of other comprehensive income, Group and Company statements of changes in equity and Group and Company statements of cash flows for the year then ended, and notes to the consolidated and separate financial statements, including a summary of significant accounting policies and other explanatory information.
In our opinion, the accompanying consolidated and separate financial statements give a true and fair view of the consolidated and separate financial position of The Heritage Insurance Company Kenya Limited as at 31 December 2017, and of the consolidated and separate financial performance and cash flows for the year then ended in accordance with International Financial Reporting Standards and in the manner required by Kenyan Companies Act, 2015.
BASIS FOR OPINION
We conducted our audit in accordance with International Standards on Auditing (ISAs). Our responsibilities under those standards are further described in the Auditors’ Responsibilities for the Audit of the consolidated and separate Financial Statements section of our report. We are independent of the Group and Company in accordance with the International Ethics Standards Board for Accountants’ Code of Ethics for Professional Accountants (IESBA Code) together with the ethical requirements that are relevant to our audit of the financial statements in Kenya and we have fulfilled our other ethical responsibilities in accordance with these requirements and the IESBA Code. We believe that the audit evidence we have obtained is sufficient and appropriate to provide a basis for our opinion.
KEY AUDIT MATTERS
Key audit matters are those matters that, in our professional judgment, were of most significance in our audit of the consolidated and separate financial statements of the current period. These matters were addressed in the context of our audit of the consolidated and separate financial statements as a whole, and in forming our opinion, and we do not provide a separate opinion on these matters.34
The
Her
itage
Insu
ranc
e Co
mpa
ny K
enya
Lim
ited
Annu
al R
epor
t and
Fin
anci
al S
tate
men
ts 2
017
INDEPENDENT AUDITOR’S REPORT TO THE SHAREHOLDERS (CONT’D)REPORT ON THE AUDIT OF THE CONSOLIDATED AND SEPARATE FINANCIAL STATEMENTS (CONT’D)KEY AUDIT MATTERS (CONT’D)
INSURANCE CONTRACT LIABILITIES
See accounting policy note 1.2e) and disclosure note 25 - Insurance contract liabilities
The key audit matter How the matter was addressed
Insurance contract liabilities constitute about 37% of the Group’s total liabilities. Valuation of these liabilities is highly judgemental and requires a number of assumptions to be made that have high estimation uncertainty.
This is particularly the case for those liabilities that are recognized in respect of claims that have occurred but have not yet been reported to the Group. Small changes in the assumptions used to value the liabilities, particularly those relating to the amount and timing of future claims, can lead to material impacts on the valuation of insurance liabilities..
The key assumptions that drive the reserving calculations include graduated development factors, loss ratios, inflation assumptions and claims expense assumptions.
The valuation of insurance contract liabilities depends on the accuracy of data about the volume, amount and pattern of cur-rent and historical claims since they are often used to form expectations about future claims.
If the data used in calculating insurance liabilities, or for forming judgements over key assumptions, is not complete and accurate then material impacts on the valuation of insurance liabilities may arise. Consequently, we have determined the valuation of insur-ance contract liabilities to be a key audit matter.
Our audit procedures in this area included among others:
• Evaluating and testing of key controls around the claims handling and reserve setting processes of the Group;
• Checking for any unrecorded liabilities at the end of the period;
• Checking samples of claims reserves by comparing the estimated amount of the reserve to appropriate docu-mentation, such as reports from loss adjusters;
• Re-performing reconciliations between the data record-ed in the financial systems and the data used in the actu-arial reserving calculations;
• Using our actuarial specialists to review the reserving methodology applied and analytically reviewing the valu-ation results presented and movements since the pre-vious year-end. We focused on understanding the meth-odologies applied and examining areas of judgement such as changes in valuation assumptions; and
• We also considered the validity of management’s liability adequacy testing by assessing the reasonableness of the projected cash flows and challenging the assumptions adopted in the context of company and industry experi-ence data and specific product features.
The
Her
itage
Insu
ranc
e Co
mpa
ny K
enya
Lim
ited
Annu
al R
epor
t and
Fin
anci
al S
tate
men
ts 2
017
35

The key audit matter How the matter was addressed
The recognition of premium revenue, determination of un-earned premiums and estimation of provisions for uncollected premiums receivables involves significant judgment.
There are inherent risks in the valuation of reinsurance assets and insurance receivables (Note 35 (c)).
These balances require judgement to be applied by the Compa-ny for their valuation and their processing requires manual ad-justments to be made.
Due to the above factors, we considered premium income and receivables to be a key audit matter.
Our audit procedures in this area included, among others:
• Understanding the terms of the reinsurance programmes in place and conducting relevant substantive procedures and substantive analytical procedures to assess the rea-sonableness of the reinsurance assets relative to gross provisions;
• Inspection of management’s aged analysis for recoveries as at 31 December 2017;
• Evaluation and testing of key controls over the processes designed to record and monitor premium income and insurance and reinsurance receivables;
• Testing of the manual adjustments on a sample basis by tracing back to supporting documentation; and
• Considering credit ratings for reinsurers, facultative and brokerage entities.
See accounting policy notes:
• 1.2 (f) (i)) recognition and measurement of premium income• 1.2 (f) (vi) receivables and payables related to insurance contracts and investment contracts• 1.2 (k) impairment of financial assets
See notes to the financial statements:
• 35 (c) Management of insurance and financial risk (Credit risk)• 2 Gross earned premiums
INDEPENDENT AUDITOR’S REPORT TO THE SHAREHOLDERS (CONT’D)REPORT ON THE AUDIT OF THE CONSOLIDATED AND SEPARATE FINANCIAL STATEMENTS (CONT’D)KEY AUDIT MATTERS (CONT’D)
PREMIUM INCOME AND RECEIVABLES
36Th
e H
erita
ge In
sura
nce
Com
pany
Ken
ya L
imite
d An
nual
Rep
ort a
nd F
inan
cial
Sta
tem
ents
20
17

The key audit matter How the matter was addressed
Many financial reporting controls depend on the correct functioning of operational and fi-nancial Information Technology (IT) systems, for example interfaces between the operat-ing systems and financial reporting systems, or automated controls that prevent or detect inaccurate or incomplete transfers of financial information.
If these systems or controls fail, a significant risk of error in reported financial information can arise from the failure to transfer data ap-propriately between systems or inappropriate changes being made to financial data or sys-tems.
This is an area requiring particular audit atten-tion in our audit due to the complexity of the IT infrastructure and legacy systems which re-quire manual inputs, relative to more automat-ed processes.
In this area our audit procedures included,among others:
• Testing general IT controls around system access and change management and testing controls over computer operations within specific applications which are required to be operating correctly to mitigate the risk of misstatement in the fi-nancial statements;
• With the support of our own IT specialists, we tested these controls through ex-amining the process for approving changes to the systems, and assessing the restrictions placed on access to core systems through testing the permissions and responsibilities of those given that access.; and
• Where we identify the need to perform additional procedures, place reliance on manual compensating controls, such as reconciliation between systems and other information sources or performing additional testing, such as extending the size of our sample sizes, to obtain sufficient appropriate audit evidence over the financial statement balances that were impacted.
INDEPENDENT AUDITOR’S REPORT TO THE SHAREHOLDERS (CONT’D)REPORT ON THE AUDIT OF THE CONSOLIDATED AND SEPARATE FINANCIAL STATEMENTS (CONT’D)KEY AUDIT MATTERS (CONT’D)
INFORMATION TECHNOLOGY SYSTEMS AND CONTROLS
INDEPENDENT AUDITOR’S REPORT TO THE SHAREHOLDERS (CONT’D)REPORT ON THE AUDIT OF THE CONSOLIDATED AND SEPARATE FINANCIAL STATEMENTS (CONT’D)
OTHER INFORMATION
The Directors are responsible for the other information. The other information obtained at the date of this aduitor’s report is information included in the Annual Report and Financial Statements, but does not include consolidated and separate financial statements and our auditors report thereon.
Our opinion on the consolidated and separate financial statements does not cover the other information and we do not express any form of assurance conclusion thereon.
The
Her
itage
Insu
ranc
e Co
mpa
ny K
enya
Lim
ited
Annu
al R
epor
t and
Fin
anci
al S
tate
men
ts 2
017
37

INDEPENDENT AUDITOR’S REPORT TO THE SHAREHOLDERS (CONT’D)REPORT ON THE AUDIT OF THE CONSOLIDATED AND SEPARATE FINANCIAL STATEMENTS (CONT’D)
OTHER INFORMATION
In connection with our audit of the financial statements, our responsibility is to read the other information and, in doing so, consider whether the other information is materially inconsistent with the financial statements or our knowledge obtained in the audit or otherwise appears to be materially misstated. If, based on the work we have performed on the other information obtained prior to the date of this auditors’ report, we conclude that there is a material misstatement of this other information, we are required to report that fact. We have nothing to report in this regard.
RESPONSIBILITIES OF DIRECTORS FOR THE FINANCIAL STATEMENTS
As stated on page 30, the Directors are responsible for the preparation of the financial statements that give a true and fair view in accordance with International Financial Reporting Standards and in the manner required by the Kenyan Companies Act, 2015 and for such internal control, as the Directors determine is necessary to enable the preparation of consolidated and separate financial statements that are free from material misstatement, whether due to fraud or error.
In preparing the consolidated and separate financial statements, the Directors are responsible for assessing the group’s and company’s ability to continue as a going concern, disclosing, as applicable, matters related to going concern and using the going concern basis of accounting unless the Directors either intend to liquidate the Company or to cease operations, or have no realistic alternative but to do so.
The Directors are responsible for overseeing the Company’s financial reporting process.
AUDITORS’ RESPONSIBILITIES FOR THE AUDIT OF THE CONSOLIDATED AND SEPARATE FINANCIAL STATEMENTS
Our objectives are to obtain reasonable assurance about whether the financial statements of the consolidated and separate as a whole are free from material misstatement, whether due to fraud or error and to issue an auditors’ report that includes our opinion. Reasonable assurance is a high level of assurance but is not a guarantee that an audit conducted in accordance with ISAs will always detect a material misstatement when it exists. Misstatements can arise from fraud or error and are considered material if, individually or in the aggregate, they could reasonably be expected to influence the economic decisions of users taken on the basis of these financial statements.As part of an audit in accordance with ISAs, we exercise professional judgment and maintain professional skepticism throughout the audit. We also:
• Identify and assess the risks of material misstatement of the financial statements, whether due to fraud or error, design and perform audit procedures responsive to those risks, and obtain audit evidence that is sufficient and appropriate to provide a basis for our opinion. The risk of not detecting a material misstatement resulting from fraud is higher than for one resulting from error, as fraud may involve collusion, forgery, intentional omissions, misrepresentations, or the override of internal control.
• Obtain an understanding of internal control relevant to the audit in order to design audit procedures that are appropriate in the circumstances, but not for the purpose of expressing an opinion on the effectiveness of the Group’s and Company’s internal control.
• Evaluate the appropriateness of accounting policies used and the reasonableness of accounting estimates and related disclosures made by the Directors.
38Th
e H
erita
ge In
sura
nce
Com
pany
Ken
ya L
imite
d An
nual
Rep
ort a
nd F
inan
cial
Sta
tem
ents
20
17

INDEPENDENT AUDITOR’S REPORT TO THE SHAREHOLDERS (CONT’D)REPORT ON THE AUDIT OF THE CONSOLIDATED AND SEPARATE FINANCIAL STATEMENTS (CONT’D)
• Conclude on the appropriateness of the Director’s use of the going concern basis of accounting and, based on the audit evidence obtained, whether a material uncertainty exists related to events or conditions that may cast significant doubt
on the Group’s and Company’s ability to continue as a going concern. If we conclude that a material uncertainty exists, we are required to draw attention in our auditor’s report to the related disclosures in the consolidated and separate financial statements or, if such disclosures are inadequate, to modify our opinion. Our conclusions are based on the audit evidence obtained up to the date of our auditors’ report. However, future events or conditions may cause the Group and/or Company to cease to continue as a going concern.
• Evaluate the overall presentation, structure, and content of the consolidated and separate financial statements, including the disclosures, and whether the consolidated and separate financial statements represent the underlying transactions and events in a manner that achieves a fair presentation.
• Obtain sufficient appropriate audit evidence regarding the financial information of the entities within the group to express an opinion on the consolidated and separate financial statements. We are responsible for the direction, suspension, and performance of the group audit. We remain solely responsible for our audit opinion.
We communicate with Directors regarding, among other matters, the planned scope and timing of the audit and significant audit findings, including any significant deficiencies in internal control that we identify during our audit.
From the matters communicated with the Director’s, we determine those matters that were of most significance in the audit of the consolidated and separate financial statements of the current period and are therefore the key audit matters. We describe these matters in our auditors’ report unless law or regulation precludes public disclosure about the matter or when, in extremely rare circumstances, we determine that a matter should not be communicated in our report because the adverse consequences of doing so would reasonably be expected to outweigh the public interest benefits of such communication.
REPORT ON OTHER LEGAL AND REGULATORY REQUIREMENTS
As required by the Kenyan Companies Act, 2015 we report to you, based on our audit, that:• In our opinion, the information given in the report of the directors on page 7 is consistent with financial statements.• Our opinion is unqualified.
The Engagement Partner responsible for the audit resulting in this independent auditors’ report is CPA Alexander Mbai P/2172
KPMG Kenya8th Floor, ABC TowersWaiyaki WayP O Box 4061200100 Nairobi GPODate: 28 March 2018
The
Her
itage
Insu
ranc
e Co
mpa
ny K
enya
Lim
ited
Annu
al R
epor
t and
Fin
anci
al S
tate
men
ts 2
017
39

LADIES FIRST CAR INSURANCE
because your prizedpossessions matter

FINANCIAL STATEMENTS 2017
STATEMENT OF PROFIT OR LOSS FOR THE YEAR ENDED 31 DECEMBER 2017
THE GROUP THE COMPANY
2017 2016 2017 2016
Note(s) Shs '000 Shs '000 Shs '000 Shs '000
Gross earned premiums 2 7,584,902 7,519,324 5,606,220 5,206,092
Less: reinsurance premium ceded (3,933,831) (3,762,092) (2,508,219) (2,143,667)
Net earned premiums 3,651,071 3,757,232 3,098,001 3,062,425
Commissions earned 834,634 776,942 648,476 570,333
Investment income 3 567,561 462,848 561,042 478,085
Gain/(loss) on sale of subsidiary 4 (10,549) - 49,615 -
Other income/(loss) 5 32,173 17,268 15,056 5,765
1,423,819 1,257,058 1,274,189 1,054,183
Net income 5,074,890 5,014,290 4,372,190 4,116,608
Claims and policyholder benefits 6 3,466,013 3,329,367 2,710,775 2,586,027
Less: amounts recoverable from re insurers (1,705,130) (1,657,550) (1,209,415) (1,230,725)
Net insurance benefits and claims 1,760,883 1,671,817 1,501,360 1,355,302
Operating and other expenses 7 1,790,058 1,696,549 1,425,477 1,422,194
Commissions payable 844,948 863,589 674,371 634,035
Total expenses and commissions 2,635,006 2,560,138 2,099,848 2,056,229
Result of operating activities 679,001 782,335 770,982 705,077
Profit before income tax 679,001 782,335 770,982 705,077
Income tax expenses 9 (220,258) (258,088) (193,892) (206,885)
Profit for the year 458,743 524,247 577,090 498,192
Profit attributable to:
Owners of the Company 437,961 481,993 577,090 498,192
Non controlling interests 20,782 42,254 - -
458,743 524,247 577,090 498,192
The accounting policies on pages 47 to 61 and the notes on pages 61 to 103 form an integral part of the financial statements 2017.
The
Her
itage
Insu
ranc
e Co
mpa
ny K
enya
Lim
ited
Annu
al R
epor
t and
Fin
anci
al S
tate
men
ts 2
017
41

FINANCIAL STATEMENTS 2017
STATEMENT OF OTHER COMPREHENSIVE INCOME
THE GROUP THE COMPANY
2017 2016 2017 2016
Note(s) Shs '000 Shs '000 Shs '000 Shs '000
Profit for the year 458,743 524,247 577,090 498,192
Other comprehensive income:
Items that may be reclassified to profit or loss:
Foreign currency translation differences 13 (b) (17,013) (20,517) - -
Total other comprehensive income (17,013) (20,517) - -
Total comprehensive income for the year 441,730 503,730 577,090 498,192
Total comprehensive income attributable to:
Owners of the parent 426,154 464,589 577,090 498,192
Non controlling interest 15 15,576 39,141 - -
441,730 503,730 577,090 498,192
The accounting policies on pages 47 to 61 and the notes on pages 61 to 103 form an integral part of the financial statements 2017.
42Th
e H
erita
ge In
sura
nce
Com
pany
Ken
ya L
imite
d An
nual
Rep
ort a
nd F
inan
cial
Sta
tem
ents
20
17
FINANCIAL STATEMENTS 2017
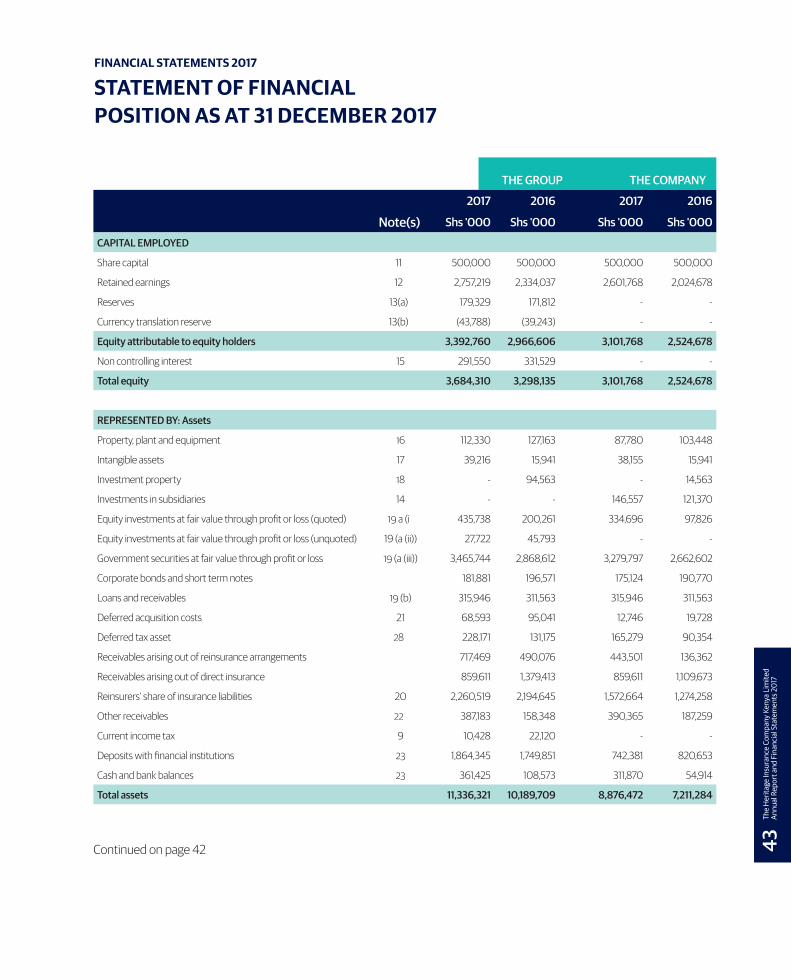
STATEMENT OF FINANCIALPOSITION AS AT 31 DECEMBER 2017
THE GROUP THE COMPANY
2017 2016 2017 2016
Note(s) Shs '000 Shs '000 Shs '000 Shs '000
CAPITAL EMPLOYED
Share capital 11 500,000 500,000 500,000 500,000
Retained earnings 12 2,757,219 2,334,037 2,601,768 2,024,678
Reserves 13(a) 179,329 171,812 - -
Currency translation reserve 13(b) (43,788) (39,243) - -
Equity attributable to equity holders 3,392,760 2,966,606 3,101,768 2,524,678
Non controlling interest 15 291,550 331,529 - -
Total equity 3,684,310 3,298,135 3,101,768 2,524,678
REPRESENTED BY: Assets
Property, plant and equipment 16 112,330 127,163 87,780 103,448
Intangible assets 17 39,216 15,941 38,155 15,941
Investment property 18 - 94,563 - 14,563
Investments in subsidiaries 14 - - 146,557 121,370
Equity investments at fair value through profit or loss (quoted) 19 a (i 435,738 200,261 334,696 97,826
Equity investments at fair value through profit or loss (unquoted) 19 (a (ii)) 27,722 45,793 - -
Government securities at fair value through profit or loss 19 (a (iii)) 3,465,744 2,868,612 3,279,797 2,662,602
Corporate bonds and short term notes 181,881 196,571 175,124 190,770
Loans and receivables 19 (b) 315,946 311,563 315,946 311,563
Deferred acquisition costs 21 68,593 95,041 12,746 19,728
Deferred tax asset 28 228,171 131,175 165,279 90,354
Receivables arising out of reinsurance arrangements 717,469 490,076 443,501 136,362
Receivables arising out of direct insurance 859,611 1,379,413 859,611 1,109,673
Reinsurers’ share of insurance liabilities 20 2,260,519 2,194,645 1,572,664 1,274,258
Other receivables 22 387,183 158,348 390,365 187,259
Current income tax 9 10,428 22,120 - -
Deposits with financial institutions 23 1,864,345 1,749,851 742,381 820,653
Cash and bank balances 23 361,425 108,573 311,870 54,914
Total assets 11,336,321 10,189,709 8,876,472 7,211,284
Continued on page 42
The
Her
itage
Insu
ranc
e Co
mpa
ny K
enya
Lim
ited
Annu
al R
epor
t and
Fin
anci
al S
tate
men
ts 2
017
43

FINANCIAL STATEMENTS 2017
STATEMENT OF FINANCIALPOSITION AS AT 31 DECEMBER 2017 CONTINUED
THE GROUP THE COMPANY
2017 2016 2017 2016
Note(s) Shs '000 Shs '000 Shs '000 Shs '000
Liabilities
Insurance contract liabilities 25 2,823,722 2,652,724 2,182,858 2,048,629
Unearned premium 27 2,918,386 2,926,838 2,355,765 2,018,889
Deferred commission income 21 59,594 87,318 - -
Deferred income tax 28 - 1,719 - -
Current income tax 36,511 19,604 36,511 19,225
Creditors arising from direct insurance 585,119 449,402 546,310 449,408
Creditors arising from reinsurance arrangements 755,146 540,791 484,578 -
Amounts due to related companies 29 10,429 9,042 10,429 13,741
Other payables 29 463,104 204,136 158,253 136,714
Total liabilities 7,652,011 6,891,574 5,774,704 4,686,606
Total net assets 3,684,310 3,298,135 3,101,768 2,524,678
The annual report and financial statements 2017 and the notes on pages 39 to 103, were approved and authorised for issue by the board on the 28 March 2017 and were signed on its behalf by:
P.N. Gethi G.R. May G.M. Kioi
The accounting policies on pages 47 to 61 and the notes on pages 61 to 103 form an integral part of the financial statements 2017.
44Th
e H
erita
ge In
sura
nce
Com
pany
Ken
ya L
imite
d An
nual
Rep
ort a
nd F
inan
cial
Sta
tem
ents
20
17

FINANCIAL STATEMENTS 2017
STATEMENT OF CHANGES IN EQUITY FOR THE YEAR ENDED 31 DECEMBER 2017
Share capital
Currency translation
Statutoryreserve
Retainedearnings
SubtotalOwners of
the Company
Noncontrolling
interestTotal
equityShs ‘000 Shs '000 Shs '000 Shs '000 Shs ‘000 Shs ‘000 Shs '000
THE GROUP 2017Balance at 1 January 2017 500,000 (39,243) 171,812 2,334,037 2,966,606 331,529 3,298,135
Profit for the year - - - 437,961 437,961 20,782 458,743
Other comprehensive income
Foreign currency translation differences - (4,545) (1,825) (5,437) (11,807) (5,206) (17,013)
Transfer to statutory reserve - - 9,342 (9,342) - - -
Total comprehensive income for the year - (4,545) 7,517 423,182 426,154 15,576 441,730
Issue of shares - - - - - 18,519 18,519
Interim dividends for 2017 - - - - - (74,074) (74,074)
Balance at31 December 2017 500,000 (43,788) 179,329 2,757,219 3,392,760 291,550 3,684,310
THE GROUP 2016Balance at 1 January 2016 500,000 (34,135) 161,922 1,934,230 2,562,017 333,936 2,895,953
Profit for the year - - - 481,993 481,993 42,254 524,247
Other comprehensive income
Foreign currency translation differences - (5,108) (1,446) (10,850) (17,404) (3,113) (20,517)
Transfer to statutory reserve - - 11,336 (11,336) - - -
Total comprehensive income for the year - (5,108) 9,890 459,807 464,589 39,141 503,730
Issue of shares - - - - - 18,886 18,886
Interim dividends for 2016 - - - (60,000) (60,000) (60,434) (120,434)
Total contributions with owners of the company - - - (60,000) (60,000) (41,548) (101,548)
Balance at 31 December 2016 500,000 (39,243) 171,812 2,334,037 2,966,606 331,529 3,298,135
The accounting policies on pages 47 to 61 and the notes on pages 61 to 103 form an integral part of the financial statements 2017.
The
Her
itage
Insu
ranc
e Co
mpa
ny K
enya
Lim
ited
Annu
al R
epor
t and
Fin
anci
al S
tate
men
ts 2
017
45

FINANCIAL STATEMENTS 2017
STATEMENT OF CHANGES IN EQUITYFOR THE YEAR ENDED 31 DECEMBER 2017
Share capital
Retained earnings
Total equity
Shs ‘000 Shs '000 Shs '000
THE COMPANY 2017Balance at 1 January 2017 500,000 2,024,678 2,524,678
Profit for the year - 577,090 577,090
Total comprehensiveincome for the year - 577,090 577,090
Balance at 31 December 2017 500,000 2,601,768 3,101,768
THE COMPANY 2016Balance at 1 January 2016 500,000 1,586,486 2,086,486
Profit for the year - 498,192 498,192
Total comprehensiveincome for the year - 498,192 498,192
Interim Dividends for 2016 - (60,000) (60,000)
Total contributions withowners of the company - (60,000) (60,000)
Balance at 31 December 2016 500,000 2,024,678 2,524,678
The accounting policies on pages 47 to 61 and the notes on pages 61 to 103 form an integral part of the financial statements 2017.
46Th
e H
erita
ge In
sura
nce
Com
pany
Ken
ya L
imite
d An
nual
Rep
ort a
nd F
inan
cial
Sta
tem
ents
20
17
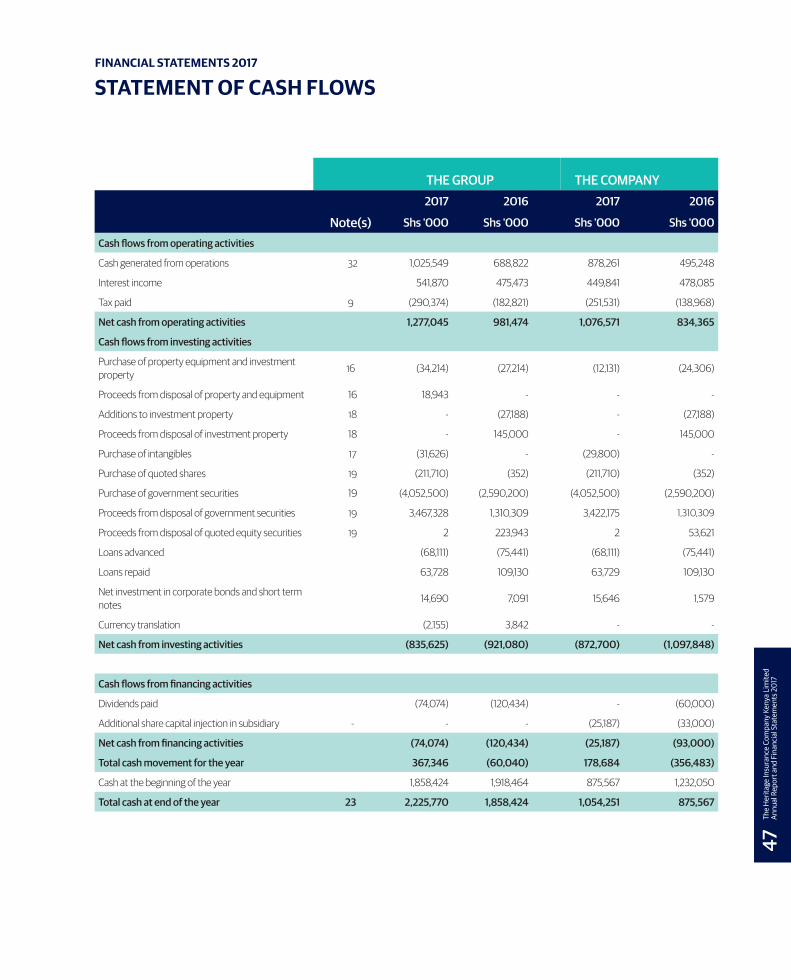
FINANCIAL STATEMENTS 2017
STATEMENT OF CASH FLOWS
THE GROUP THE COMPANY
2017 2016 2017 2016
Note(s) Shs '000 Shs '000 Shs '000 Shs '000
Cash flows from operating activities
Cash generated from operations 32 1,025,549 688,822 878,261 495,248
Interest income 541,870 475,473 449,841 478,085
Tax paid 9 (290,374) (182,821) (251,531) (138,968)
Net cash from operating activities 1,277,045 981,474 1,076,571 834,365
Cash flows from investing activities
Purchase of property equipment and investment property 16 (34,214) (27,214) (12,131) (24,306)
Proceeds from disposal of property and equipment 16 18,943 - - -
Additions to investment property 18 - (27,188) - (27,188)
Proceeds from disposal of investment property 18 - 145,000 - 145,000
Purchase of intangibles 17 (31,626) - (29,800) -
Purchase of quoted shares 19 (211,710) (352) (211,710) (352)
Purchase of government securities 19 (4,052,500) (2,590,200) (4,052,500) (2,590,200)
Proceeds from disposal of government securities 19 3,467,328 1,310,309 3,422,175 1,310,309
Proceeds from disposal of quoted equity securities 19 2 223,943 2 53,621
Loans advanced (68,111) (75,441) (68,111) (75,441)
Loans repaid 63,728 109,130 63,729 109,130
Net investment in corporate bonds and short term notes 14,690 7,091 15,646 1,579
Currency translation (2,155) 3,842 - -
Net cash from investing activities (835,625) (921,080) (872,700) (1,097,848)
Cash flows from financing activities
Dividends paid (74,074) (120,434) - (60,000)
Additional share capital injection in subsidiary - - - (25,187) (33,000)
Net cash from financing activities (74,074) (120,434) (25,187) (93,000)
Total cash movement for the year 367,346 (60,040) 178,684 (356,483)
Cash at the beginning of the year 1,858,424 1,918,464 875,567 1,232,050
Total cash at end of the year 23 2,225,770 1,858,424 1,054,251 875,567
The
Her
itage
Insu
ranc
e Co
mpa
ny K
enya
Lim
ited
Annu
al R
epor
t and
Fin
anci
al S
tate
men
ts 2
017
47

DIRECTORS AND OFFICERS LIABILITY
beacause we believe in protecting you from legalliabilities

ACCOUNTINGPOLICIES1. PRESENTATION OF ANNUAL REPORT AND FINANCIAL STATEMENTS 2017
1.1 GENERAL INFORMATION
The Company is incorporated in Kenya under the Kenyan Companies Act, 2015 and is domiciled in Kenya. The address of its registered office is:Liberty HouseMamlaka RoadP.O. Box 30390 0010000100 Nairobi.
The Group and Company underwrites all classes of short term (General) insurance risks as defined by the Insurance Act except Micro Insurance.
For Kenyan Companies Act, 2015 reporting purposes, the balance sheet is represented by the statement of financial position and the profit and loss account is represented by the statement of profit or loss in these financial statements.
1.2 SUMMARY OF SIGNIFICANT ACCOUNTING POLICIES
The principal accounting policies adopted in the preparation of these financial statements are set out below. These policies have been consistently applied to all the periods presented unless otherwise stated.
A) BASIS OF PREPARATION
The financial statements are prepared in accordance with and comply with International Financial Reporting Standards (IFRS). The financial statements are presented in the functional currency, Kenya Shillings (Shs), rounded to the nearest thousand, and prepared under the historical cost convention, as modified by the carrying of investment property and available for sale investments at fair value and actuarially determined liabilities at their present value. For Kenyan Companies Act, 2015 reporting purposes in these financial statements, the balance sheet is represented by the statement of financial position and the profit and loss account is represented by the statement of profit or loss.The preparation of financial statements in conformity with IFRS requires the use of certain critical accounting estimates. It also requires management to exercise its judgement in the process of applying the Group’s accounting policies. The areas involving a higher degree
of judgement or complexity or where assumptions and estimates are significant to the financial statements are discussed in Note 34.
B) NEW STANDARDS, AMENDMENTS AND INTERPRETATIONS
(i) New standards, amendments and interpretations effective and adopted during the year
The Company has adopted the following new standards and amendments during the year ended 31 December 2017, including consequential amendments to other standards with the date of initial application by the Company/Branch/Group being 1 January 2017.The nature and effects of the changes are as explained herein.
The nature and effects of the changes are explained below:
New standards or amendments Effective for annual periods
beginning on or after
Disclosure Initiative (Amendments to IAS 7)
1 January 2017
Recognition of Deferred Tax Assets for Unrealised Losses (Amendments to IAS 12)
1 January 2017
DISCLOSURE INITIATIVE (AMENDMENTS TO IAS 7)
The amendments in Disclosure Initiative (Amendments to IAS 7) come with the objective that entities shall provide disclosures that enable users of financial statements to evaluate changes in liabilities arising from financing activities.The International Accounting Standards Board (IASB) requires that the following changes in liabilities arising from financing activities are disclosed (to the extent necessary):
(i) changes from financing cash flows; (ii) changes arising from obtaining or losing control of subsidiaries or other businesses;(iii) the effect of changes in foreign exchange rates; (iv) changes in fair values; and (v) other changes.
The
Her
itage
Insu
ranc
e Co
mpa
ny K
enya
Lim
ited
Annu
al R
epor
t and
Fin
anci
al S
tate
men
ts 2
017
49

ACCOUNTING POLICIES (CONTINUED)
1.2 SUMMARY OF SIGNIFICANT ACCOUNTING POLICIES (CONTINUED)
B) NEW STANDARDS, AMENDMENTS AND INTERPRETATIONS (CONTINUED)
DISCLOSURE INITIATIVE (AMENDMENTS TO IAS 7)
The IASB defines liabilities arising from financing activities as liabilities “for which cash flows were, or future cash flows will be, classified in the statement of cash flows as cash flows from financing activities”. It also stresses that the new disclosure requirements also relate to changes in financial assets if they meet the same definition.
The amendments state that one way to fulfill the new disclosure requirement is to provide a reconciliation between the opening and closing balances in the statement of financial position for liabilities arising from financing activities.
Finally, the amendments state that changes in liabilities arising from financing activities must be disclosed separately from changes in other assets and liabilities.
The amendments apply for annual periods beginning on or after 1 January 2017 and early application is permitted.
The adoption of these changes did not have a significant impact on the financial statements of the Group and Company.
Recognition of Deferred Tax Assets for Unrealised Losses (Amendments to IAS 12)
The amendments in Recognition of Deferred Tax Assets for Unrealised Losses clarify the following aspects:
• Unrealised losses on debt instruments measured at fair value and measured at cost for tax purposes give rise to a deductible temporary difference regardless of whether the debt instrument’s holder expects to recover the carrying amount of the debt instrument by sale or by use.
• The carrying amount of an asset does not limit the estimation of probable future taxable profits.
• Estimates for future taxable profits exclude tax deductions resulting from the reversal of deductible temporary differences.
• An entity assesses a deferred tax asset in combination with other deferred tax assets. Where tax law restricts the utilisation of tax losses, an entity would assess a deferred tax asset in combination with other deferred tax assets of the same type.
The standard was effective for annual periods beginning on or after 1 January 2017 with early application permitted.
As transition relief, an entity may recognize the change in the opening equity of the earliest comparative period in opening retained earnings on an initial application without allocating the change between opening retained earnings and other components of equity. The Board has not added additional transition relief for first time adopters.
The adoption of these changes did not have a significant impact on the financial statements of the Group and Company.
Annual improvements cycle (2012 - 2016)various standards
Standard Amendments
IFRS 12 Disclosure of Interests in other Entities
Disclosure of interest in other entities. Clarifies that disclosure requirements for interest in other entities also ap-plies to interests that are classified as held for sale or distribution.
The adoption of these changes did not affect the amount and disclosures of the Group and Company’s financial statements.
A number of new standards, amendments to standards and interpretations are not yet effective for the year ended 31 December 2017, and have not been applied in preparing these financial statements.
The Group does not plan to adopt these standards early.These are summarised below;
New standard or amendments Effective for annual periods beginning on or after
IFRS 15 Revenue from Contracts with Customers
1 January 2018
IFRS 9 Financial Instruments (2014) 1 January 2018
Classification and Measurement of Share based Payment. Transactions (Amendments to IFRS 2)
1 January 2018
Applying IFRS 9 Financial Instruments with IFRS 4. Insurance Contracts (Amendments to IFRS 4)
1 January 2018
IFRS 16 Leases 1 January 2018
IFRIC 22 Foreign Currency Transac-tions and Advance Consideration
1 January 2018
IAS 40 Transfers of Investment property
1 January 2018
50Th
e H
erita
ge In
sura
nce
Com
pany
Ken
ya L
imite
d An
nual
Rep
ort a
nd F
inan
cial
Sta
tem
ents
20
17

ACCOUNTING POLICIES (CONTINUED)
1.2 SUMMARY OF SIGNIFICANT ACCOUNTING POLICIES (CONTINUED)
B) NEW STANDARDS, AMENDMENTS AND INTERPRETATIONS (CONTINUED)
ii) New and amended standards and interpretations in issue but not yet effective for the year ended 31 December 2017. (Continued)
New standard or amendments Effective for annual periods
beginning on or after
IFRIC 23 Income tax exposure 1 January 2019
IFRS 9 Prepayment Features with Negative Compensation
1 January 2019
IAS 28 Long term Interests in Associ-ates and Joint Ventures
1 January 2019
IFRS 17 Insurance contracts 1 January 2019
Sale or Contribution of Assets be-tween an Investor and its Associate or Company (Amendments to IFRS 10 and IAS 28).
To bedetermined
IFRS 15: Revenue from contracts with customers
This standard replaces IAS 11 Construction Contracts, IAS 18 Revenue, IFRIC 13 Customer Loyalty Programmes, IFRIC 15 Agreements for the Construction of Real Estate, IFRIC 18 Transfer of Assets from Customers and SIC 31 Revenue ñ Barter of Transactions Involving Advertising Services
The standard contains a single model that applies to contracts with customers and two approaches to recognizing revenue: at a point in time or over time. The standard specifies how and when an IFRS reporter will recognize revenue as well as requiring such entities to provide users of financial statements with more informative, relevant disclosures.
The standard provides a single, principles-based five-step model to be applied to all contracts with customers in recognising revenue being: Identify the contract(s) with a customer; identify the performance obligations in the contract; determine the transaction price; Allocate the transaction price to the performance obligations in the contract; and recognise revenue when (or as) the entity satisfies a performance obligation.
IFRS 15 is effective for annual reporting periods beginning on or after 1 January 2018, with early adoption permitted.
The Group and Company are assessing the potential impact on their financial statements of applying this amendment.
IFRS 9: Financial Instruments (2014)
On 24 July 2014 the IASB issued the final IFRS 9 Financial Instruments Standard, which replaces earlier versions of IFRS 9 and completes the IASB’s project to replace IAS 39 Financial Instruments: Recognition and Measurement.
This standard introduces changes in the measurement bases of the financial assets to amortized cost, fair value through other comprehensive income or fair value through profitor loss.
Even though these measurement categories are similar to IAS 39, the criteria for classification into these categories are significantly different. In addition, the IFRS 9 impairment model has been changed from an incurred loss model from IAS 39 to an expected credit loss model.
The standard is effective for annual period beginning on or after 1 January 2018 with retrospective application, early adoption permitted.
The Group and Company are assessing the potential impact on their financial statements of applying this amendment.
Classification and Measurement of Share-based Payment Transactions (Amendments to IFRS 2)
Accounting for cash settled share-based payment transactions that include a performance condition
Up until this point, IFRS 2 contained no guidance on how vesting conditions affect the fair value of liabilities for cash-settled share-based payments. IASB has now added guidance that introduces accounting requirements for cash settled share-based payments that follows the same approach as used for equity-settled share-based payments.
Classification of share based payment transactions with net settlement features
IASB has introduced an exception into IFRS 2 so that a share-based payment where the entity settles the share- based payment arrangement net is classified as equity settled in its entirety provided the share-based payment would have been classified as equity-settled had it not included the net settlement feature.
The
Her
itage
Insu
ranc
e Co
mpa
ny K
enya
Lim
ited
Annu
al R
epor
t and
Fin
anci
al S
tate
men
ts 2
017
51

ACCOUNTING POLICIES (CONTINUED)
1.2 SUMMARY OF SIGNIFICANT ACCOUNTING POLICIES (CONTINUED)
B) NEW STANDARDS, AMENDMENTS AND INTERPRETATIONS (CONTINUED)
ii) New and amended standards and interpretations in issue but not yet effective for the year ended 31 December 2017. (Continued)
Accounting for modifications of share based payment transactions from cash settled to equity settled
Up until this point, IFRS 2 did not specifically address situations where a cash-settled share-based payment changes to an equity-settled share-based payment because of modifications of the terms and conditions.
The IASB has introduced the following clarifications:On such modifications, the original liability recognized in respect of the cash-settled share-based payment is derecognized and the equity-settled share-based payment is recognized at the modification date fair value to the extent services have been rendered up to the modification date.
Any difference between the carrying amount of the liability as at the modification date and the amount recognised in equity at the same date would be recognized in profit and loss immediately.
The amendments are effective for annual periods beginning on or after 1 January 2018. Earlier application is permitted. The amendments are to be applied prospectively. However, retrospective application if allowed if this is possible without the use of hindsight. If an entity applies the amendments retrospectively, it must do so for all of the amendments described above.
The Group and Company are assessing the potential impact on their financial statements of applying this amendment.
Applying IFRS 9 Financial Instruments with IFRS 4 Insurance Contracts (Amendments to IFRS 4)
The amendments in Applying IFRS 9 ‘Financial Instruments’ with IFRS 4 ‘Insurance Contracts’ (Amendments to IFRS 4) provide two options for entities that issue insurance contracts within the scope of IFRS 4:
• an option that permits entities to reclassify, from profit or loss to other comprehensive income, some of the income or expenses arising from designated financial assets; this is the so called overlay approach;
• an optional temporary exemption from applying IFRS 9 for entities whose predominant activity is issuing contracts within the scope of IFRS 4; this is the so called deferral approach.
The application of both approaches is optional and an entity is permitted to stop applying them before the new insurance contracts standard is applied.An entity applies the overlay approach retrospectively to qualifying financial assets when it first applies IFRS 9. Application of the overlay approach requires disclosure of sufficient information to enable users of financial statements to understand how the amount reclassified in the reporting period is calculated and the effect of that reclassification on the financial statements.
An entity applies the deferral approach for annual periods beginning on or after 1 January 2018. Predominance is assessed at the reporting entity level at the annual reporting date that immediately precedes 1 April 2016. Application of the deferral approach needs to be disclosed together with information that enables users of financial statements to understand how the insurer qualified for the temporary exemption and to compare insurers applying the temporary exemption with entities applying IFRS 9. The deferral can only be made use of for the three years following 1 January 2018. Predominance is only reassessed if there is a change in the entity’s activities.
The Group and Company are assessing the potential impact on their financial statements of applying this amendment
IFRS 16: Leases
On 13 January 2016 the IASB issued IFRS 16 Leases, completing the IASB’s project to improve the financial reporting of leases. IFRS 16 replaces the previous leases standard, IAS 17 Leases, and related interpretations.IFRS 16 sets out the principles for the recognition, measurement, presentation and disclosure of leases for both parties to a contract, i.e. the customer (lessee) and the supplier (lessor). The standard defines a lease as a contract that conveys to the customer (lessee) the right to use an asset for a period of time in exchange for consideration. A company assesses whether a contract contains a lease on the basis of whether the customer has the right to control the use of an identified asset for a period of time.
The standard eliminates the classification of leases as either operating leases or finance leases for a lessee and introduces a single lessee accounting model. All leases are treated in a similar way to finance leases. Applying that model significantly affects the accounting and presentation of leases and consequently, the lessee is required to recognize:
52Th
e H
erita
ge In
sura
nce
Com
pany
Ken
ya L
imite
d An
nual
Rep
ort a
nd F
inan
cial
Sta
tem
ents
20
17

ACCOUNTING POLICIES (CONTINUED)
1.2 SUMMARY OF SIGNIFICANT ACCOUNTING POLICIES(CONTINUED)
B) NEW STANDARDS, AMENDMENTS AND INTERPRETATIONS (CONTINUED)
ii) New and amended standards and interpretations in issue but not yet effective for the year ended 31 December 2017. (Continued)
a) assets and liabilities for all leases with a term of more than 12 months, unless the underlying asset is of low value. A company recognizes the present value of the unavoidable lease payments and b) depreciation of lease assets and interest on lease liabilities in profit or loss over the lease term; and shows them either as lease assets (right of use assets) or together with property, plant and equipment. If lease payments are made over time, a company also recognizes a financial liability representing its obligation to make future lease payments.
c) separate the total amount of cash paid into aprincipal portion (presented within financing activities) and interest (typically presented within either operating or financing activities) in the statement of cash flows.
IFRS 16 substantially carries forward the lessor accounting requirements in IAS 17. Accordingly, a lessor continues to classify its leases as operating leases or finance leases, and to account for those two types of leases differently. However, compared to IAS 17, IFRS 16 requires a lessor to disclose additional information about how it manages the risks related to its residual interest in assets subject to leases.
The standard does not require a company to recognize assets and liabilities for:
a) short term leases (i.e. leases of 12 months or less) b) leases of low value assets
The new Standard is effective for annual periods beginning on or after 1 January 2019. Early application is permitted insofar as the recently issued revenue Standard, IFRS 15 Revenue from Contracts with Customers is also applied.
The Group and Company are assessing the potential impact on their financial statements of applying this amendment.
IFRIC Interpretation 22 Foregn Currency Transactions and Advance Consideration
This Interpretation applies to a foreign currency transaction (or part of it) when an entity recognizes a non-monetary asset or non-monetary liability arising from the payment or receipt of advance consideration before the entity recognizes the related asset, expense or income (or part of it).
This Interpretation stipulates that the date of the transaction for the purpose of determining the exchange rate to use on initial recognition of the related asset, expense or income (or part of it) is the date on which an entity initially recognizes the non-monetary asset or non-monetary liability arising from the payment or receipt of advance consideration.
(a) at fair value; or
(b) at the fair value of the consideration paid or received at a date other than the date of initial recognition of the non-monetary asset or non-monetary liability arising from advance consideration (for example, the measurement of goodwill applying IFRS 3 Business Combinations).
The amendments apply retrospectively for annual periods beginning on or after 1 January 2018, with early application permitted.
The Group and Company are assesing the potential impact on their financial statements of applying this amendment.
Transfers of investment property (amendments to IAS 40)
The IASB has amended the requirements in IAS 40 Investment property on when a company should transfer a property asset to, or from, investment property.
The adoption of this standard will not have a significant impact on the financial statements of the Group and Company.
IFRIC 23 Clarification on Accounting for Income Tax Exposures
IFRIC 23 clarifies the accounting for income tax treatments that have yet to be accepted by tax authorities, whilst also aiming to enhance transparency. IFRIC 23 explains how to recognize and measure deferred and current income tax assets and liabilities where there is uncertainty over a tax treatment.
An uncertain tax treatment is any tax treatment applied by an
The
Her
itage
Insu
ranc
e Co
mpa
ny K
enya
Lim
ited
Annu
al R
epor
t and
Fin
anci
al S
tate
men
ts 2
017
53

ACCOUNTING POLICIES (CONTINUED) 1.2 SUMMARY OF SIGNIFICANT ACCOUNTING POLICIES (CONTINUED)
B) NEW STANDARDS, AMENDMENTS AND INTERPRETATIONS (CONTINUED)
ii) New and amended standards and interpretations in issue but not yet effective for the year ended 31 December 2017. (Continued)
entity where there is uncertainty over whether that treatment will be accepted by the tax authority.
If an entity concludes that it is probable that the tax authority will accept an uncertain tax treatment that has been taken or is expected to be taken on a tax return, it should determine
its accounting for income taxes consistently with that tax treatment.If an entity concludes that it is not probable that the treatment will be accepted, it should reflect the effect of the uncertainty in its income tax accounting in the period in which that determination is made. Uncertainty is reflected in the overall measurement of tax and separate provision is not allowed.
The entity is required to measure the impact of the uncertainty using the method that best predicts the resolution of the uncertainty (that is, the entity should use either the most likely amount method or the expected value method when measuring an uncertainty).
The entity will also need to provide disclosures, under existing disclosure requirements, about
(a) judgments made;(b) assumptions and other estimates used; and(c) potential impact of uncertainties not reflected.
The Group and Company are assessing the potential impact on their financial statements of applying this amendment.
Prepayment Features with Negative Compensation (Amendments to IFRS 9)
The amendments clarify that financial assets containing prepayment features with negative compensation can now be measured at amortized cost or at fair value through other comprehensive income (FVOCI) if they meet the other relevant requirements of IFRS 9.
The amendments apply for annual periods beginning on or after 1 January 2019 with retrospective application, early adoption is permitted.
Management is currently evaluating the impact of the new standard on the Group’s and Company’s financial statements.
Long Term Interests in Associates and Joint Ventures (Amendments to IAS 28)
The amendments clarify that an entity applies IFRS 9 to long term interests in an associate and joint venture that form part of the net investment in the associate or joint venture but to which the equity method is not applied.
The Group and Company are assessing the potential impact on their financial statements of applying this amendment.
The amendments apply for annual periods beginning on or after 1 January 2019 with retrospective application, early adoption is permitted. IFRS 17 Insurance Contracts
IFRS 17 Insurance Contracts sets out the requirements that an entity should apply in reporting information about insurance contracts it issues and reinsurance contracts it holds. An entity shall apply IFRS 17 Insurance Contracts to:
(a) insurance contracts, including reinsurance contracts, it issues;
(b) reinsurance contracts it holds; and
(c) investment contracts with discretionary participation features it issues, provided the entity also issues insurance contracts
IFRS 17 requires an entity that issues insurance contracts to report them on the statement of financial position as the total of:
(a) the fulfilment cash flows—the current estimates of amounts that the entity expects to collect from premiums and pay out for claims, benefits and expenses, including an adjustment for the timing and risk of those amounts;
(b) the contractual service margin—the expected profit for providing insurance coverage. The expected profit for providing insurance coverage is recognized in profit or loss over time as the insurance coverage is provided.
IFRS 17 requires an entity to recognise profits as it delivers insurance services, rather than when it receives premiums, as well as to provide information about insurance contract profits that the Company expects to recognize in the future. IFRS 17
54Th
e H
erita
ge In
sura
nce
Com
pany
Ken
ya L
imite
d An
nual
Rep
ort a
nd F
inan
cial
Sta
tem
ents
20
17

ACCOUNTING POLICIES (CONTINUED)
1.2 SUMMARY OF SIGNIFICANT ACCOUNTING POLICIES (CONTINUED)
B) NEW STANDARDS, AMENDMENTS AND INTERPRETATIONS (CONTINUED)
ii) New and amended standards and interpretations in issue but not yet effective for the year ended 31 December 2017. (Continued)
requires an entity to distinguish between groups of contracts expected to be profit making and groups of contracts expected to be loss making.
Any expected losses arising from loss making, or onerous, contracts are accounted for in profit or loss as soon as the Company determines that losses are expected.
IFRS 17 requires the entity to update the fulfilment cash flows at each reporting date, using current estimates of the amount, timing and uncertainty of cash flows and of discount rates. The entity:
(a) accounts for changes to estimates of future cash flows from one reporting date to another either as an amount in profit or loss or as an adjustment to the expected profit for providing insurance coverage, depending on the type of change and the reason for it; and
(b) chooses where to present the effects of some changes in discount rates—either in profit or loss or in other comprehensive income.
IFRS 17 also requires disclosures to enable users of financial statements to understand the amounts recognized in the entity’s statement of financial position and statement of profit or loss and other comprehensive income, and to assess the risks the Company faces from issuing insurance contracts.
IFRS 17 replaces IFRS 4 Insurance Contracts. IFRS 17 is effective for financial periods commencing on or after 1 January 2021. An entity shall apply the standard retrospectively unless impracticable. A Company can choose to apply IFRS 17 before that date, but only if it also applies IFRS 9 Financial Instruments and IFRS 15 Revenue from Contracts with Customers.
The Group and Company are assessing the potential impact on their financial statements of applying this amendment. Sale or contribution of assets between an investor and its associate or company (amendments to IFRS 10 and IAS 28)
The amendments require the full gain to be recognized when assets transferred between an investor and its associate or
Company meet the definition of a ‘business’ under IFRS 3.
Business Combinations. Where the assets transferred do not meet the definition of a business, a partial gain to the extent of unrelated investors’ interests in the associate or Company is recognized.
The definition of a business is key to determining the extent of the gain to be recognized.The effective date for these changes has now been postponed until the completion of a broader review.The adoption of these changes will not have a significant impact on the financial statements of the Group.
C) CONSOLIDATION
i) Business Combinations
The Group applies the acquisition method of accounting to account for business combinations, when control is transferred to the group. The consideration transferred for the acquisition of a subsidiary is generally measured at fair values, as are the fair value of assets transferred, the liabilities incurred to the former owners of the acquiree and the equity interests issued by the Group. The consideration transferred includes the fair value of any asset or liability resulting from a contingent consideration arrangement. Identifiable assets acquired and liabilities and contingent liabilities assumed in a business combination are measured initially at their fair values at the acquisition date.
The Group recognizes any non-controlling interest in the acquiree on an acquisition by acquisition basis, either at fair value or at the non-controlling interest’s proportionate share of the recognized amounts of acquiree’s identifiable net assets. Any gain on a bargain purchase is recognized in profit or loss immediately. Acquisition related costs are expensed as incurred, except if related to the issue of debt or equity securities.
Investments in subsidiaries are accounted for at cost less impairment. Cost is adjusted to reflect changes in consideration arising from contingent consideration amendment. Cost also includes directly attributable cost of investment. Intercompany transactions, balances and unrealized gains on transactions between group companies are eliminated. Unrealized losses are also eliminated unless the transaction provides evidence of an impairment of the asset transferred. Accounting policies of subsidiaries have been changed where necessary to ensure consistency with the policies adopted by the Group.
The
Her
itage
Insu
ranc
e Co
mpa
ny K
enya
Lim
ited
Annu
al R
epor
t and
Fin
anci
al S
tate
men
ts 2
017
55

ACCOUNTING POLICIES (CONTINUED)
1.2 SUMMARY OF SIGNIFICANT ACCOUNTING POLICIES (CONTINUED)
C) CONSOLIDATION (CONTINUED)
ii) Subsidiaries
Subsidiaries are all entities (including structured entities) over which the group has control. The group controls an entity when the group is exposed to, or has rights to, variable returns from its involvement with the entity and has the ability to affect those returns through its power over the entity. Subsidiaries are fully consolidated from the date on which control is transferred to the group. They are deconsolidated from the date that control ceases.
iii) Associates
Associates are all entities over which the Group has significant influence but not control, generally accompanying a shareholding of between 20% and 50% of the voting rights. Investments in associates are accounted for by the equity method of accounting and are initially recognized at cost.
The Group’s share of its associates’ post acquisition profits or losses is recognised in the income statement, and its share of post acquisition movements in reserves is recognized in reserves. The cumulative post acquisition movements are adjusted against the carrying amount of the investment. When the Group’s share of losses in an associate equals or exceeds its interest in the associate, including any other unsecured receivables, the Group does not recognize further losses, unless it has incurred obligations or made payments on behalf of the associate.
Unrealised gains on transactions between the Group and its associates are eliminated to the extent of the Group’s interest in the associates. Unrealised losses are also eliminated unless the transaction provides evidence of an impairment of the asset transferred. Accounting policies of associates have been changed where necessary to ensure consistency with the policies adopted by the Group.
iv) Non controlling interest (NCI)
NCI are measured at their proportionate share of the acquiree’s identifiable net assets at the date of acquisition. Changes in the Group’s interest in a subsidiary that do not result in a loss in control are accountable for as equity transactions.
v) Loss of Control
When the Group loses control of a subsidiary, it de recognizes the assets and liabilities of the subsidiary and any related NCI and other components of equity. Any resulting gain or loss is recognized in profit or loss. Any interest retained in the former subsidiary is measured at fair value when control is lost.
D) FUNCTIONAL CURRENCY AND TRANSLATION OF FOREIGN CURRENCIES
i) Functional and presentation currency
Items included in the financial statements of each of the Group’s entities are measured using the currency of the primary economic environment in which the entity operates (‘the functional currency’). The consolidated financial statements are presented in Kenya Shillings thousands (Shs), except where indicated.
ii) Translations of foreign currencies and balances in group entities
Foreign currency transactions are translated into the functional currency of the respective entity using the exchange rates prevailing at the dates of the transactions. Foreign exchange gains and losses resulting from the settlement of such transactions and from the translation at year end exchange rates of monetary assets and liabilities denominated in foreign currencies are recognized in the income statement. Non-monetary assets and liabilities denominated in foreign currencies are translated to the functional currency at the exchange rate when the fair value was determined.
iii) Consolidation of group entities
The results and financial position of all the group entities (none of which has the currency of a hyperinflationary economy) that have a functional currency different from the presentation currency are translated into the presentation currency as follows:
(i) assets and liabilities for each statement of financial position presented are translated at the closing rate at the date of that statement of financial position;
(ii) income and expenses for each income statement are translated at average exchange rates (unless this average is not a reasonable approximation of the cumulative effect of the rates prevailing on the transaction dates, in which case income expenses are translated at the dates of the transactions);
56Th
e H
erita
ge In
sura
nce
Com
pany
Ken
ya L
imite
d An
nual
Rep
ort a
nd F
inan
cial
Sta
tem
ents
20
17

ACCOUNTING POLICIES (CONTINUED)
1.2 SUMMARY OF SIGNIFICANT ACCOUNTING POLICIES (CONTINUED)
D) FUNCTIONAL CURRENCY AND TRANSLATION OF FOREIGN CURRENCIES (CONTINUED)
(iii) all resulting exchange differences are recognized as a separate component of equity. On consolidation, exchange differences arising from the translation of the net investment in foreign entities are recognized in other comprehensive income and accumulated in the currency translation reserve except to the extent that the translation is allocated to the non-controlling interests. When a foreign operation is sold, such exchange differences are recognized in the profit and loss account as part of the gain or loss on sale. Goodwill and fair value adjustments arising on the acquisition of a foreign entity are treated as assets and liabilities of the foreign entity and translated at the closing rate.
E) INSURANCE CONTRACTS
Classification
The Group issues contracts that transfer insurance risk or financial risk or both. Insurance contracts are those contracts that transfer significant insurance risk. Such contracts may also transfer financial risk. As a general guideline, the group defines as significant insurance risk, the possibility of having to pay benefits on the occurrence of an insured event that is at least 10% more than the benefits payable if the insured event did not occur. Investment contracts are those contracts that transfer financial risk with no significant insurance risk. See accounting policy for these contracts under.A number of insurance and investment contracts contain a discretionary participation feature (DPF). This feature entitles the holder to receive, as a supplement to guaranteed benefits, additional benefits or bonuses:
a) that are likely to be a significant portion of the total contractual benefits;
b) whose amount or timing is contractually at the discretion of the Group
c) that are contractually based on:
i) The performance of a specified pool of contracts or a specified type of contract;
ii) Realized and/or unrealized investment returns on a specified pool of assets held by the Group;
iii) The profit or loss of the Company, fund or other entity that issues the contract.
Short term insurance business. Means insurance business of any class or classes not being long term insurance business.Classes of Short term Insurance include Aviation insurance, Engineering insurance, Fire insurance Domestic risks Fire insurance Industrial and Commercial risks, Liability insurance, Marine Insurance, Motor insurance private vehicles, Motor insurance commercial vehicles, Personal Accident insurance,Theft insurance , Workmen’s Compensation and Employer’s Liability insurance and Miscellaneous insurance (i.e. class of business not included under those listed above)
Motor insurance business means the business of affecting and carrying out contracts of insurance against loss of, or damage to, or arising out of or in connection with the use of, motor vehicles, inclusive of third party risks but exclusive of transit risks.
Personal Accident insurance business means the business of affecting and carrying out contracts of insurance against risks of the persons insured sustaining injury as the result of an accident or of an accident of a specified class or dying as the result of an accident or of an accident of a specified class or becoming incapacitated in consequence of disease or of disease of a specified class.
Fire insurance business means the business of affecting and carrying out contracts of insurance, otherwise than incidental to some other class of insurance business against loss or damage to property due to fire, explosion, storm and other occurrences customarily included among the risks insured against in the fire insurance business.
F) RECOGNITION AND MEASUREMENT
i. Premium income
For short term insurance business, premium income is recognized on assumption of risks, and includes estimates of premiums due but not yet received, less an allowance for cancellations, and less unearned premium.
Unearned premiums represent the proportion of the premiums written in periods up to the accounting date that relates to the unexpired terms of policies in force at the financial reporting date, and is computed using the 1/365th method. Premiums are shown before deduction of commission and are gross of any taxes or duties levied on premiums.
The
Her
itage
Insu
ranc
e Co
mpa
ny K
enya
Lim
ited
Annu
al R
epor
t and
Fin
anci
al S
tate
men
ts 2
017
57

ACCOUNTING POLICIES (CONTINUED)
1.2 SUMMARY OF SIGNIFICANT ACCOUNTING POLICIES (CONTINUED)
F) RECOGNITION AND MEASUREMENT (CONTINUED)
ii. Claims
A liability for contractual benefits that are expected to be incurred in the future is recorded when the premiums are recognized. The liability is determined as the sum of the expected discounted value of the benefit payments and the future administration expenses that are directly related to the contract, less the expected discounted value of the theoretical premiums that would be required to meet the benefits and administration expenses based on the valuation assumptions used (the valuation premiums).
The liability is based on assumptions as to mortality, persistency, maintenance expenses and investment income that are established at the time the contract is issued. A margin for adverse deviations is included in the assumptions.
Where insurance contracts have a single premium or a limited number of premium payments due over a significantly shorter period than the period during which benefits are provided, the excess of the premiums payable over the valuation premiums is deferred and recognized as income in line with the decrease of unexpired insurance risk of the contracts in force or, for annuities in force, in line with the decrease of the amount of future benefits expected to be paid.
The liabilities are recalculated at each financial reporting date using the assumptions established at inception of the contracts.
For short term insurance business, claims incurred comprise claims paid in the year and changes in the provision for outstanding claims. Claims paid represent all payments made during the year, whether arising from events during that or earlier years.
Outstanding claims represent the estimated ultimate cost of settling all claims arising from incidents occurring prior to the financial reporting date, but not settled at that date. Outstanding claims are computed on the basis of the best information available at the time the records for the year are closed and include provisions for claims incurred but not reported (“IBNR”). The method used in computing IBNR is described in note 25Outstanding claims are not discounted.
iii. Commissions payable and deferred acquisition costs (“DAC”)
A proportion of commission’s payable is deferred and
amortized over the period in which the related premium is earned. Deferred acquisition costs represent a proportion of acquisition costs that relate to policies that are in force at the year end.
iv. Liability adequacy test
At each financial reporting date, liability adequacy tests are performed to ensure the adequacy of the contract liabilities net of related DAC. In performing these tests, current best estimates of future contractual cash flows and claims handling and administration expenses, as well as investment income from the assets backing such liabilities, are used.
Any deficiency is immediately charged to profit or loss initially by writing off DAC and by subsequently establishing a provision for losses arising from liability adequacy tests (the unexpired risk provision).
v. Reinsurance contracts held
Contracts entered into by the Group with reinsurers under which the Group is compensated for losses on one or more contracts issued by the Group and that meet the classification requirements for insurance contracts are classified as reinsurance contracts held. Contracts that do not meet these classification requirements are classified as financial assets. Insurance contracts entered into by the Group under which the contract holder is another insurer (inwards reinsurance) are included with insurance contracts.
The benefits to which the Group is entitled under its reinsurance contracts held are recognized as reinsurance assets. These assets consist of short term balances due from reinsurers, as well as longer term receivables that are dependent on the expected claims and benefits arising under the related reinsured insurance contracts.
Amounts recoverable from or due to reinsurers are measured consistently with the amounts associated with the reinsured insurance contracts and in accordance with the terms of each reinsurance contract. Reinsurance liabilities are primarily premiums payable for reinsurance contracts and are recognized as an expense when due.
The Group assesses its reinsurance assets for impairment on a quarterly basis. If there is objective evidence that the reinsurance asset is impaired, the Group reduces the
58Th
e H
erita
ge In
sura
nce
Com
pany
Ken
ya L
imite
d An
nual
Rep
ort a
nd F
inan
cial
Sta
tem
ents
20
17

ACCOUNTING POLICIES (CONTINUED) 1.2 SUMMARY OF SIGNIFICANT ACCOUNTING POLICIES (CONTINUED)
F) RECOGNITION AND MEASUREMENT (CONTINUED)
carrying amount of the reinsurance asset to its recoverable amount and recognizes that impairment loss in the income statement.
The Group gathers the objective evidence that a reinsurance asset is impaired using the same process adopted for financial assets held at amortised cost. The impairment loss is also calculated following the same method used for these financial assets. These processes are described in accounting policy 1.2 (k).
vi. Receivables and payables related to insurance contracts and investment contracts
Receivables and payables are recognised when due. These include amounts due to and from agents, brokers and insurance contract holders.If there is objective evidence that the insurance receivable is impaired, the Group reduces the carrying amount of the insurance receivable accordingly and recognizes that impairment loss in profit or loss. The processes followed by the Group in assessing impairment of these receivables are described in accounting policy 1.2 (k).
vii. Salvage and subrogation reimbursements
Some insurance contracts permit the Group to sell (usually damaged) property acquired in settling a claim (for example, salvage). The Group may also have the right to pursue third parties for payment of some or all costs (for example, subrogation).
Estimates of salvage recoveries are included as an allowance in the measurement of the insurance liability for claims, and salvage property is recognized in other assets when the liability is settled. The allowance is the amount that can reasonably be recovered from the disposal of the property.
Subrogation reimbursements are also considered as an allowance in the measurement of the insurance liability for claims and are recognized in other assets when the liability is settled. The allowance is the assessment of the amount that can be recovered from the action against the liable third party.
G) OTHER INCOME RECOGNITION
Commissions receivable are recognized as income in the period in which they are earned.Investment income is stated net of investment expenses.
Interest income is recognized on a time proportion basis that takes into account the effective yield on the asset. Dividends are recognized as income in the period in which the right to receive payment is established. Rental income is recognized as income in the period in which it is earned.
H) PROPERTY AND EQUIPMENT
All property and equipment are initially recorded at cost. All property and equipment is stated at historical cost less accumulated depreciation. Historical cost includes expenditure that is directly attributable to the acquisition of the items.
Subsequent costs are included in the asset’s carrying amount or recognized as a separate asset, as appropriate, only when it is probable that future economic benefits associated with the item will flow to the Group and the cost of the item can be measured reliably. All other repairs and maintenance are charged to the income statement during the financial period in which they are incurred.
Freehold land is not depreciated. Depreciation is calculated on other property and equipment on the straight line basis to write down the cost of each asset, to its residual value over its estimated useful life applicable to the current and prior year Buildings 25 - 30 years Equipment and motor vehicles 3 - 10 yearsFurniture and fittings 10 years Asset residual values and their estimated useful lives are reviewed at each financial reporting date and adjusted if appropriate. Where the carrying amount of an asset is greater than its estimated recoverable amount, it is written down immediately to its recoverable amount.Gains and losses on disposal of property and equipment are determined by reference to their carrying amounts and are included in the income statement.
I) INTANGIBLE ASSETS
Intangible assets relate to computer software.Acquired computer software licenses are capitalized on the basis of the costs incurred to acquire and bring to use the specific software. These costs are amortized over their estimated useful lives (3 - 5 years). Costs associated with developing or maintaining computer software programmes are recognized as an expense as incurred. Costs that are directly associated with the production of identifiable and unique software products controlled by the
The
Her
itage
Insu
ranc
e Co
mpa
ny K
enya
Lim
ited
Annu
al R
epor
t and
Fin
anci
al S
tate
men
ts 2
017
59
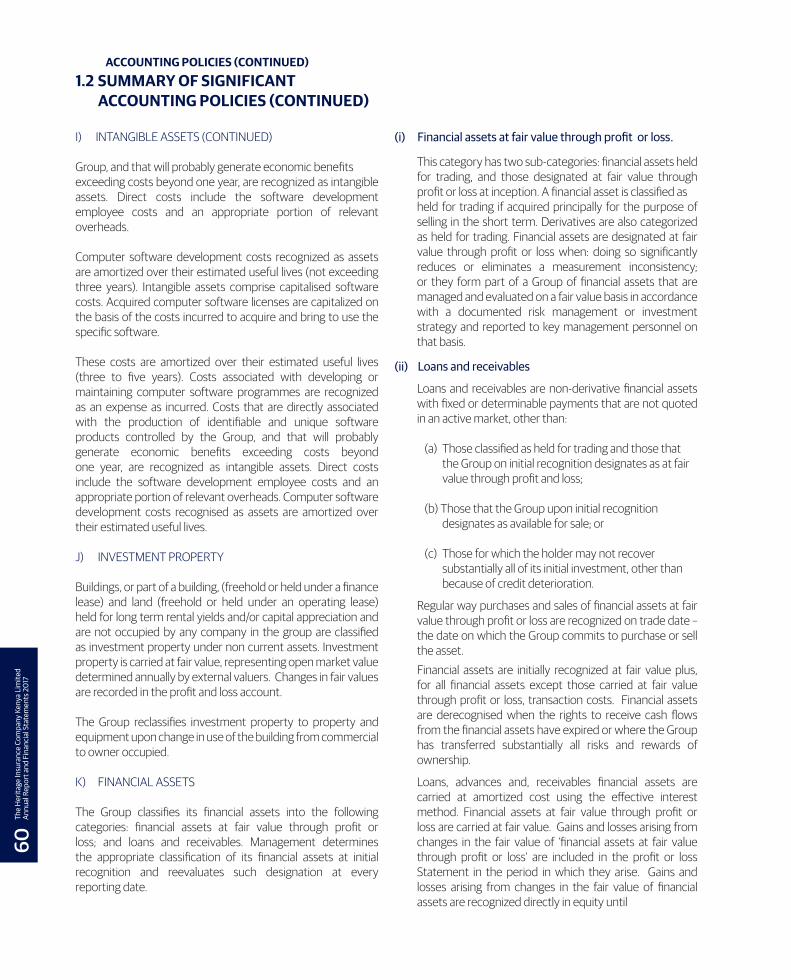
ACCOUNTING POLICIES (CONTINUED) 1.2 SUMMARY OF SIGNIFICANT ACCOUNTING POLICIES (CONTINUED)
I) INTANGIBLE ASSETS (CONTINUED)
Group, and that will probably generate economic benefits exceeding costs beyond one year, are recognized as intangible assets. Direct costs include the software development employee costs and an appropriate portion of relevant overheads.
Computer software development costs recognized as assets are amortized over their estimated useful lives (not exceeding three years). Intangible assets comprise capitalised software costs. Acquired computer software licenses are capitalized on the basis of the costs incurred to acquire and bring to use the specific software.
These costs are amortized over their estimated useful lives (three to five years). Costs associated with developing or maintaining computer software programmes are recognized as an expense as incurred. Costs that are directly associated with the production of identifiable and unique software products controlled by the Group, and that will probably generate economic benefits exceeding costs beyond one year, are recognized as intangible assets. Direct costs include the software development employee costs and an appropriate portion of relevant overheads. Computer software development costs recognised as assets are amortized over their estimated useful lives.
J) INVESTMENT PROPERTY
Buildings, or part of a building, (freehold or held under a finance lease) and land (freehold or held under an operating lease) held for long term rental yields and/or capital appreciation and are not occupied by any company in the group are classified as investment property under non current assets. Investment property is carried at fair value, representing open market value determined annually by external valuers. Changes in fair values are recorded in the profit and loss account.
The Group reclassifies investment property to property and equipment upon change in use of the building from commercial to owner occupied.
K) FINANCIAL ASSETS
The Group classifies its financial assets into the following categories: financial assets at fair value through profit or loss; and loans and receivables. Management determines the appropriate classification of its financial assets at initial recognition and reevaluates such designation at every reporting date.
(i) Financial assets at fair value through profit or loss.
This category has two sub-categories: financial assets held for trading, and those designated at fair value through profit or loss at inception. A financial asset is classified as held for trading if acquired principally for the purpose of selling in the short term. Derivatives are also categorized as held for trading. Financial assets are designated at fair value through profit or loss when: doing so significantly reduces or eliminates a measurement inconsistency; or they form part of a Group of financial assets that are managed and evaluated on a fair value basis in accordance with a documented risk management or investment strategy and reported to key management personnel on that basis.
(ii) Loans and receivables
Loans and receivables are non-derivative financial assets with fixed or determinable payments that are not quoted in an active market, other than:
(a) Those classified as held for trading and those that the Group on initial recognition designates as at fair value through profit and loss;
(b) Those that the Group upon initial recognition designates as available for sale; or
(c) Those for which the holder may not recover substantially all of its initial investment, other than because of credit deterioration.
Regular way purchases and sales of financial assets at fair value through profit or loss are recognized on trade date – the date on which the Group commits to purchase or sell the asset.Financial assets are initially recognized at fair value plus, for all financial assets except those carried at fair value through profit or loss, transaction costs. Financial assets are derecognised when the rights to receive cash flows from the financial assets have expired or where the Group has transferred substantially all risks and rewards of ownership.
Loans, advances and, receivables financial assets are carried at amortized cost using the effective interest method. Financial assets at fair value through profit or loss are carried at fair value. Gains and losses arising from changes in the fair value of ‘financial assets at fair value through profit or loss’ are included in the profit or loss Statement in the period in which they arise. Gains and losses arising from changes in the fair value of financial assets are recognized directly in equity until
60Th
e H
erita
ge In
sura
nce
Com
pany
Ken
ya L
imite
d An
nual
Rep
ort a
nd F
inan
cial
Sta
tem
ents
20
17

ACCOUNTING POLICIES (CONTINUED)
1.2 SUMMARY OF SIGNIFICANT ACCOUNTING POLICIES (CONTINUED)
K) FINANCIAL ASSETS (CONTINUED)
the financial asset is derecognized or impaired, at which time the cumulative gain or loss previously recognized in equity is recognized in the income statement. However, interest calculated using the effective interest method is recognized in the income statement.
Dividends on equity instruments are recognized in the Profit or Loss Statement when the Group’s right to receive payment is established.Fair values of quoted investments in active markets are based on current bid prices. Fair values for unlisted equity securities are estimated using valuation techniques.
These include the use of recent arm’s length transactions, discounted cash flow analysis and other valuation techniques commonly used by market participants. Equity securities for which fair values cannot be measured reliably are recognized at cost less impairment.
Impairment of financial assets
The Group assesses at each financial reporting date whether there is objective evidence that a financial asset or a group of financial assets is impaired. A financial asset or a group of financial assets is impaired and impairment losses are incurred only if there is objective evidence of impairment as a result of one or more events that occurred after initial recognition of the asset (a ‘loss event’) and that loss event (or events) has an impact on the estimated future cash flows of the financial asset or group of financial assets that can be reliably estimated.
Objective evidence that a financial asset or group of assets is impaired includes observable data that comes to the attention of the Group about the following loss events:
a) Significant financial difficulty of the borrower;
b) A breach of contract, such as default or delinquency in interest or principal repayments;c) The Group granting to the borrower, for economic or legal reasons relating to the borrower’s financial difficulty, a concession that the Company would not otherwise consider;
d) The becoming probable that the borrower will enter bankruptcy or other financial reorganisation;
e) The disappearance of an active market for that financial asset because of financial difficulties; or
f) Observable data indicating that there is a measurable decrease in the estimated future cash flows from a group of financial assets since the initial recognition of those assets, although the decrease cannot yet be identified with the individual financial assets in the group, including: adverse changes in the payment status of borrowers in the Group; or national or local economic conditions that correlate with defaults on the assets in the Group.
The estimated period between a loss occurring and its identification is determined by management for each identified portfolio.
(i) Assets carried at amortized cost
The Group assesses whether objective evidence of impairment exists individually for financial assets. If there is objective evidence that an impairment loss on financial assets carried at amortized cost has been incurred.
The amount of the loss is measured as the difference between the asset’s carrying amount and the present value of estimated future cash flows (excluding future credit losses that have not been incurred) discounted at the financial instrument’s original effective interest rate.
The carrying amount of the asset is reduced through the use of an allowance account and the amount of the loss is recognized in the income statement. If a loan or held to maturity asset has a variable interest rate, the discount rate for measuring any impairment loss is the current effective interest rate determined under the contract.
As a practical expedient, the Group may measure impairment on the basis of an instrument’s fair value using an observable market price. The calculation of the present value of the estimated future cash flows of a collateralized financial asset reflects the cash flows that may result from foreclosure less costs for obtaining and selling the collateral, whether or not foreclosure is probable.When a loan is uncollectible, it is written off against the related provision for loan impairment. Such loans are written off after all the necessary procedures have been completed and the amount of the loss has been determined. Subsequent recoveries of amounts previously written off decrease the amount of the provision for loan impairment in the income statement.
The
Her
itage
Insu
ranc
e Co
mpa
ny K
enya
Lim
ited
Annu
al R
epor
t and
Fin
anci
al S
tate
men
ts 2
017
61

ACCOUNTING POLICIES (CONTINUED) 1.2 SUMMARY OF SIGNIFICANT ACCOUNTING POLICIES (CONTINUED)
K) FINANCIAL ASSETS (CONTINUED)
If, in a subsequent period, the amount of the impairment loss decreases and the decrease can be related objectively to an event occurring after the impairment was recognized (such as an improvement in the debtor’s credit rating), the previously recognized impairment loss is reversed by adjusting the allowance account. The amount of the reversal is recognized in the income statement.
(ii) Renegotiated loans
Loans that are either subject to collective impairment assessment or individually significant and whose terms have been renegotiated are no longer considered to be past due but are treated as new loans. In subsequent years, the renegotiated terms apply in determining whether the asset is considered to be past due
L) CASH AND CASH EQUIVALENTS
Cash and cash equivalents are carried in the date of financial reporting at amortized cost. For the purposes of the cash flow statement, cash and cash equivalents comprise cash on hand, deposits held at call with banks, other short term highly liquid investments with original maturities of three months or less, and bank overdrafts.
M) LEASES
Leases of assets where a significant proportion of the risks and rewards of ownership are retained by the lessor are classified as operating leases. Payments made under operating leases are charged to income on a straight line basis over the period of the lease. Lease incentives received are recognized as an integral part of the total term of the lease.
N) EMPLOYEE BENEFITS
(i) Retirement benefit obligations
The Group operates a defined contribution retirement benefit scheme for its employees.A defined contribution plan is a pension plan under which the Group companies pay fixed contributions into a separate entity.
The Group has no legal or constructive obligations to pay further contributions if the fund does not hold sufficient assets to pay all employees the benefits relating to employee service in the current and prior periods.
The assets of all schemes are held in separate trustee administered funds, which are funded by contributions from both the Group and employees. The Group and all its employees also contribute to the appropriate national Social Security Fund, which are defined contribution schemes.
The Group’s contributions to the defined contribution schemes are charged to profit or loss in the year to which they relate.
(ii) Other entitlements
Employee entitlements to long service awards are recognised when they accrue to employees. A provision is made for the estimated liability for such entitlements as a result of services rendered by employees up to the date of financial reporting.
The estimated monetary liability for employees’ accrued annual leave entitlement at the financial reporting date is recognized as an expense accrual is only reassessed if there is a change in the entity’s activities.
O) TAXATION
Income tax expense is the aggregate of the charge to the income statement in respect of current income tax and deferred income tax. Current income tax is the amount of income tax payable on the taxable profit for the period determined in accordance with the relevant tax legislation.
Deferred income tax is provided in full, using the liability method, on all temporary differences arising between the tax bases of financial assets and financial liabilities and their carrying values for financial reporting purposes. However, if the deferred income tax arises from the initial recognition of an asset or liability in a transaction other than a business combination that at the time of the transaction affects neither accounting nor taxable profit nor loss, it is not accounted for.
Deferred income tax is determined using tax rates and laws that have been enacted or substantively enacted at the financial reporting date and are expected to apply when the related deferred income tax liability is settled.
Deferred income tax assets are recognized only to the extent that it is probable that future taxable profits will be available against which the temporary differences can be utilized.
62Th
e H
erita
ge In
sura
nce
Com
pany
Ken
ya L
imite
d An
nual
Rep
ort a
nd F
inan
cial
Sta
tem
ents
20
17

FINANCIAL STATEMENTS 2017
NOTES TO THE FINANCIAL STATEMENTS
THE GROUP THE COMPANY
2017 2016 2017 2016
Shs '000 Shs '000 Shs '000 Shs '000
2. Gross earned premiums
The premium income of the Group and Company can be analysed between the main classes of business as shown below:
Class of business:
Accident 2,163,690 2,219,692 1,458,659 1,403,303
Fire 1,564,863 1,721,272 687,617 691,290
Marine 172,513 134,224 102,813 67,947
Medical 1,906,988 1,613,952 1,906,988 1,613,952
Motor 1,776,848 1,830,184 1,450,143 1,429,600
7,584,902 7,519,324 5,606,220 5,206,092
3. Investment income
Interest on government securities 337,859 260,128 316,110 260,078
Interest on bank deposits 158,080 118,557 88,451 61,959
Interest from corporate bonds and commercial paper 23,595 25,558 22,688 24,571
Interest on loans and receivables 22,591 32,089 22,591 32,089
Rental income from investment property 9,384 34,545 - 24,989
Fair value gain on investment property - (12,625) - (12,625)
Dividend income (12,569) 13,631 96,158 68,881
Fair value gain/(loss) on sale of financial investments 28,621 (9,035) 15,044 18,143
567,561 462,848 561,042 478,085
ACCOUNTING POLICIES (CONTINUED)
1.2 SUMMARY OF SIGNIFICANT ACCOUNTING POLICIES (CONTINUED)
O) TAXATION (CONTINUED)
Deferred income tax is provided on temporary differences arising on investments in subsidiaries and associates, except where the timing of the reversal of the temporary difference is controlled by the Group and it is probable that the temporary difference will not reverse in the foreseeable future.
P) DIVIDENDS
Dividends payable to the Group’s shareholders are charged to equity in the period in which they are declared. Proposed dividends are shown as a separate component of equity until declared.
Q) COMPARATIVES
Where necessary, comparative figures have been adjusted to conform to changes to presentation in the current year.
The financial assets were revalued through the statement of profit or loss as disclosed on page 39
The
Her
itage
Insu
ranc
e Co
mpa
ny K
enya
Lim
ited
Annu
al R
epor
t and
Fin
anci
al S
tate
men
ts 2
017
63

THE GROUP THE COMPANY
2017 2016 2017 2016
Shs '000 Shs '000 Shs '000 Shs '000
4. Gain/(Loss) on sale of subsidiary
During the year the group disposed off the entire investment in Azali Limited. The gain/(Loss) on disposal is shown below
Profit/(Loss) on disposal of subsidiary
Receivable from disposal of Azali 95,000 - 95,000 -
Intercompany account (39,736) - (39,736) -
Investment in Azali (5,649) - (5,649) -
Cumulative retained earnings (60,164) - - -
(10,549) - 49,615 -
5. Other income
(Loss)/Profit on sale of property, plant and equipment (52) 345 - -
Profit from Kenya Motor Insurance Pool - 1,200 - 1,200
Other income 25,981 8,789 8,812 -
Miscellaneous income 6,244 6,934 6,244 4,565
32,173 17,268 15,056 5,765
6. Claims and policyholder benefits payable
Accident 616,244 908,763 390,963 535,187
Fire 518,993 433,286 123,288 241,287
Marine 56,370 66,954 50,683 59,171
Medical 1,272,618 903,571 1,272,617 903,467
Motor 1,001,788 1,016,793 873,224 846,915
Total claims and policyholder benefits 3,466,013 3,329,367 2,710,775 2,586,027
FINANCIAL STATEMENTS 2017
NOTES TO THE FINANCIAL STATEMENTS (CONTINUED)
64Th
e H
erita
ge In
sura
nce
Com
pany
Ken
ya L
imite
d An
nual
Rep
ort a
nd F
inan
cial
Sta
tem
ents
20
17

THE GROUP THE COMPANY
2017 2016 2017 2016
Shs '000 Shs '000 Shs '000 Shs '000
7. Operating and other expenses
Employee benefits expenses (Note 8) 867,294 845,447 675,375 648,015
Severance pay (Note 8) (94,560) 108,715 (94,560) 108,715
Directors’ fees 17,254 15,198 8,955 7,723
Audit fees 9,760 10,708 5,258 6,731
Depreciation (Note 16) 31,145 32,197 27,799 29,271
Amortisation of intangible assets (Note 17) 7,586 7,084 7,586 7,084
Impairment for doubtful receivables 282,341 84,354 206,568 68,631
Operating lease rentals land and buildings 98,599 93,810 72,859 81,254
Repairs and maintenance expenditure 58,349 42,431 57,013 40,524
Other 512,290 456,605 458,625 424,246
1,790,058 1,696,549 1,425,477 1,422,194
8. Employee benefit expenses
Employee benefit expenses includes the following:
Salaries and wages 609,133 601,425 442,431 413,322
Social security benefit costs 52,199 47,556 40,785 38,227
Other 205,962 196,466 192,157 196,466
Employee benefit expenses 867,294 845,447 675,373 648,015
Severance pay (94,560) 108,715 (94,560) 108,715
772,734 954,162 580,813 756,730
FINANCIAL STATEMENTS 2017
NOTES TO THE FINANCIAL STATEMENTS (CONTINUED)
Severance pay-staff severance package costs comprise of employee benefits awarded in a court case in year 2016 and set aside on appeal in 2017.
During the year, the average number of persons employed by the Group was 228 (2016: 223). This comprised an average of 97 female and 131 male employees (2016: Female 95, Male 128)The Group also had an average of 25 employees in management and 203 in non-management (2016: management 26, non-management 197)
During the year, the average number of persons employed by the Company was 177 (2016: 174). This comprised an average of 73 female and 104 male employees (2016: Female 78, Male 96)The Group also had an average of 22 employees in management and 155 in non-management (2016: management 24, non-man-agement 150)
The
Her
itage
Insu
ranc
e Co
mpa
ny K
enya
Lim
ited
Annu
al R
epor
t and
Fin
anci
al S
tate
men
ts 2
017
65

THE GROUP THE COMPANY
2017 2016 2017 2016
Shs '000 Shs '000 Shs '000 Shs '000
9. Income tax expenses
Reconciliation of the tax expenses.
The Group’s and Company’s current tax charge is computed in accordance with income tax rules applicable to short term insurance companies. A reconciliation of the tax charge is shown below:
Profit before income tax 679,001 782,335 770,982 705,077
Tax calculated at a rate of 30% (2016: 30%) 203,633 234,701 231,227 211,523
Tax effect of:
Income not subject to tax (40,586) (49,899) (86,169) (49,899)
Tax effect of interest income 33,312 28,838 33,312 28,838
Expenses not deductable for tax purposes 50,374 51,675 22,781 24,054
Over provision of deferred tax in prior years (25,747) (5,977) (6,531) (6,381)
Capital gains tax @ 5% (728) (1,250) (728) (1,250)
Income tax charge 220,258 258,088 193,892 206,885
There was no tax charge relating to components of other comprehensive income.
Income tax expense
Current tax 318,973 265,315 268,817 211,259
Deferred tax (98,715) (7,227) (74,925) (4,374)
Total 220,258 258,088 193,892 206,885
Tax recoverable /(payable) movement
As at 1 January 2017 2,516 85,010 (19,225) 56,322
Current tax charge for the year (318,973) (265,315) (268,817) (214,515)
Paid in the year 290,374 182,821 251,531 138,968
As at 31 December 2017 (26,083) 2,516 (36,511) (19,225)
Comprising
Tax recoverable 10,428 22,120 - -
Tax payable (36,511) (19,604) (36,511) (19,225)
Total (26,083) 2,516 (36,511) (19,225)
10. Dividend payable
Proposed dividends are accounted for as a separate component of equity until they have been ratified at an annual general meeting. The Directors did not propose an interim dividend (2016 : Shs 2.4 per share, Shs 60 Million) and do not recommend payment of a final dividend (2016 :Nil).
11. Share capital
The total authorized number of ordinary shares is Shs 25 Million with a par value of Shs 20 per share. At 31 December 2017, 25 Million ordinary shares were in issue (2016 : 25 Million ordinary shares). All issued shares are fully paid.
FINANCIAL STATEMENTS 2017
NOTES TO THE FINANCIAL STATEMENTS (CONTINUED)
66Th
e H
erita
ge In
sura
nce
Com
pany
Ken
ya L
imite
d An
nual
Rep
ort a
nd F
inan
cial
Sta
tem
ents
20
17

THE GROUP THE COMPANY
2017 2016 2017 2016
Shs '000 Shs '000 Shs '000 Shs '000
Authorised, issued and paid up
25 Million ordinary shares with a par value ofShs 20 per share 500,000 500,000 500,000 500,000
All ordinary shares rank equally with regard to the Company’s residual assets, are entitled to dividends as declared from time to time and are entitled to one vote per share at general meetings of the Company.
12. Retained earnings
The retained earnings balance represents the amount available for dividend distribution to the shareholders of the Company, except for cumulative fair value gains of the Company’s investment properties of Shs nil (2016: Shs 12.6 Million) whose distribution is subject to restrictions by the Kenyan Insurance Act.
THE GROUP THE COMPANY
2017 2016 2017 2016
Shs '000 Shs '000 Shs '000 Shs '000
13. Other reserves a) Statutory reserves
Statutory reserves comprise:
Contingency reserve Tanzania 179,329 171,812 - -
Movements in the statutory reserve are shown in the statement of changes in equity on pages 43 to 44The contingency reserve is maintained by the Tanzania subsidiary as required by the Tanzania Insurance Act. The reserve is calculated annually as the greater of 3% of net written premium or 20% of the net profit. This reserve shall accumulate until it reaches the minimum paid up share capital or 50% of the net premiums, whichever is greater.
b) Currency translation reserve
The currency translation reserve comprises all foreign currency differences arising from the translation of the financial statements of foreign operations.
14. Investment in subsidiary
Country of incorporation and place of
business
Nature ofbusiness
Proportion ofordinary shares directly held by the parent (%)
Proportion ofordinary shares
held by the group (%)
Proportion ofordinary share
held by non controlling
interest (%)
The Heritage Insurance Company Tanzania Limited Tanzania Insurance 60% 60% 40%
Azali Limited (Disposed of on 31 August 2017) Kenya Property 100% 100% - %
FINANCIAL STATEMENTS 2017
NOTES TO THE FINANCIAL STATEMENTS (CONTINUED)
All subsidiary undertakings are included in the consolidation. The proportion of the voting rights in the subsidiary undertakings held directly by the parent company do not differ from the proportion of ordinary shares held. The parent company further does not have any shareholdings in the preference shares of subsidiary undertakings included in the group.
The
Her
itage
Insu
ranc
e Co
mpa
ny K
enya
Lim
ited
Annu
al R
epor
t and
Fin
anci
al S
tate
men
ts 2
017
67

FINANCIAL STATEMENTS 2017
NOTES TO THE FINANCIAL STATEMENTS (CONTINUED) 14. Investment in subsidiary (Continued) THE GROUP THE COMPANY
2017 2016 2017 2016
Shs '000 Shs '000 Shs '000 Shs '000
Investment in The Heritage Insurance Company Tanzania Limited (60%) 146,557 115,721
Investment in Azali Limited (100%) - 5,649
146,557 121,370
Movements during the year
The following was the movements during the year:
Opening balance 121,370 88,368
Additional capital in Heritage Tanzania 30,836 33,002
Disposal of Azali (5,649) -
146,557 121,370
15. Non -controlling Interests (NCI)
NCI percentage 40% 40%
Non-current assets 122,982 97,501
Current assests 2,498,503 2,941,026
Non-current liabilities - -
Current liabilities (1,892,611) (2,209,704)
Net Assets 728,874 828,832
Net assets attributable to NCI 291,550 331,529
Revenue 1,978,682 2,313,233
Profit 51,956 105,635
OCI - -
Total comprehensive income 51,956 105,635
Profit allocated to NCI 20,782 4,2254
OCI allocated to NCI (5,206) (3,113)
Cash flows from operating activities 112,207 110,690
Cash flow from investing activities (37,728) (68,606)
Cash flow from financing activities (55,556) (41,549)
Net increase (decrease) in cash and cash equivalents 18,923 535
16. Property, plant and equipment THE GROUP
2017 2016
Cost orrevaluation
Accumulateddepreciation
Carryingvalue
Cost or revaluation
Accumulated depreciation
Carryingvalue
Buildings on leasehold land 18,523 (18,523) - 18,523 - 18,523
Furniture and equipment 515,356 (407,948) 107,408 524,482 (423,989) 100,493
Motor vehicles 28,605 (23,683) 4,922 29,648 (21,501) 8,147
Total 562,484 (450,154) 112,330 572,653 (445,490) 127,163
68Th
e H
erita
ge In
sura
nce
Com
pany
Ken
ya L
imite
d An
nual
Rep
ort a
nd F
inan
cial
Sta
tem
ents
20
17

FINANCIAL STATEMENTS 2017
NOTES TO THE FINANCIAL STATEMENTS (CONTINUED)
16. Property, plant and equipment (Continued) THE COMPANY
2017 2016
Cost orrevaluation
Accumulateddepreciation
Carrying value
Cost or revaluation
Accumulated depreciation
Carryingvalue
Furniture and equipment 433,074 (349,134) 83,940 420,943 (323,521) 97,422
Motor vehicles 11,638 (7,798) 3,840 11,638 (5,612) 6,026
Total 444,712 (356,932) 87,780 432,581 (329,133) 103,448
THE GROUP
Reconciliation of property, plant and equipment 2017
Opening balance Additions Disposals Currency
translation Depreciation Total
Buildings 18,523 - (18,523) - - -
Fittings and equipment 100,493 34,163 (322) 1,000 (27,926) 107,408
Motor vehicles 8,147 51 (98) 41 (3,219) 4,922
Total 127,163 34,214 (18,943) 1,041 (31,145) 112,330
Reconciliation of property, plant and equipment 2016
Opening balance Additions Disposals Transfers Currency
translationCumulated on disposal Depreciation Total
Furniture and equipment 18,523 - - - - - - 18,523
Fittings and equipment 103,765 27,114 (302) (1,341) (39) 269 (28,973) 100,493
Motor vehicles 9,958 100 (1,128) 1,341 (28) 1,128 (3,224) 8,147
Total 132,246 27,214 (1,430) - (67) 1,397 (32,197) 127,163
THE COMPANY
Reconciliation of property, plant and equipment 2017
Opening balance Additions Depreciation Total
Fittings and equipment 97,422 12,131 (25,613) 83,940
Motor vehicles 6,026 - (2,186) 3,840
Total 103,448 12,131 (27,799) 87,780
Reconciliation of property, plant and equipment 2016
Opening balance Additions Depreciation Total
Fittings and equipment 100,203 24,306 (27,087) 97,422
Motor vehicles 8,210 - (2,184) 6,026
Total 108,413 24,306 (29,271) 103,448
Equipment with a cost of Shs 222,228,089 (2016 Shs 221,912,000) was fully depreciated as at 31 December 2017. The notional depreciation charge in respect of this equipment amounts to Shs 42,026,076 (2016 Shs 40,268,000).
The
Her
itage
Insu
ranc
e Co
mpa
ny K
enya
Lim
ited
Annu
al R
epor
t and
Fin
anci
al S
tate
men
ts 2
017
69

17. Intangible assets THE GROUP
2017 2016
Cost orrevaluation
Accumulateddepreciation
Carryingvalue
Cost / Valuation
Accumulated depreciation
Carryingvalue
Intangible assets 62,491 (23,275) 39,216 64,429 (48,488) 15,941
THE COMPANY
Cost orrevaluation
Accumulateddepreciation
Carryingvalue
Cost or revaluation
Accumulated depreciation
Carryingvalue
Intangible assets 60,369 (22,214) 38,155 64,429 (48,488) 15,941
THE GROUP
Reconciliation of intangible assets 2017 Opening balance Additions Amortisation Total
Intangible assets 15,941 31,626 (8,351) 39,216
Reconciliation of intangible assets 2016 Opening balance Additions Amortisation Total
Intangible assets 23,025 - (7,084) 15,941
THE COMPANY
Reconciliation of intangible assets 2017 Opening balance Additions Amortisation Total
Intangible assets 15,941 29,800 (7,586) 38,155
Reconciliation of intangible assets 2016 Opening balance Additions Amortisation Total
Intangible assets 23,025 - (7,084) 15,941
FINANCIAL STATEMENTS 2017
NOTES TO THE FINANCIAL STATEMENTS (CONTINUED)
Intangible assets with a cost of Shs 60,839,000 (2016 Shs 26,914,000) were fully amortised as at 31 December 2017.The notional amortisation charge in respect of these assets amounts to Shs 5,935,000 (2016 Shs 5,383,000).
70Th
e H
erita
ge In
sura
nce
Com
pany
Ken
ya L
imite
d An
nual
Rep
ort a
nd F
inan
cial
Sta
tem
ents
20
17

18. Investment property THE GROUP
2017 2016
Cost / Valuation
Accumulateddepreciation
Carryingvalue
Cost / Valuation
Accumulated depreciation
Carryingvalue
Investment property - - - 94,563 - 94,563
THE COMPANY
Cost orrevaluation
Accumulateddepreciation
Carryingvalue
Cost or revaluation
Accumulated depreciation
Carryingvalue
Investment property - - - 14,563 - 14,563
THE GROUP
Reconciliation of investment property 2017 Opening balance Disposal Total
Investment property 94,563 (94,563) -
Reconciliation of investment property 2016
Opening balance Additions Disposals Revaluation Total
Investment property 225,000 27,188 (145,000) (12,625) 94,563
THE COMPANY
Reconciliation of investment property 2017
Opening balance Additions Transfers Total
Investment property 14,563 - (14,563) -
Reconciliation of investment property 2016
Opening balance Additions Disposals Amortisation Total
Investment property 145,000 27,188 (145,000) (12,625) 14,563
FINANCIAL STATEMENTS 2017
NOTES TO THE FINANCIAL STATEMENTS (CONTINUED)
During the year, investments in I REIT previously classified under property was reclassified to equity.Th
e H
erita
ge In
sura
nce
Com
pany
Ken
ya L
imite
d An
nual
Rep
ort a
nd F
inan
cial
Sta
tem
ents
20
1771

19. Financial instruments THE GROUP THE COMPANY
2017 2016 2017 2016
Shs '000 Shs '000 Shs '000 Shs '000
At fair value through profit or loss designated
Quoted shares 100,482 102,435 - -
At fair value through profit or loss held for trading
Treasury bills 186,462 206,010 - -
Available for sale
Listed shares 335,256 97,826 334,696 97,826
Unlisted shares 27,722 45,793 - -
Government securities 3,279,282 2,662,602 3,279,797 2,662,602
3,642,260 2,806,221 3,614,493 2,760,428
Held to maturity
Corporate bonds 181,881 196,571 175,124 190,770
Loans and receivables
Mortgage loans 264,746 262,860 264,746 262,860
Other loans and deposits maturing after 90 days - 4,286 - 4,286
Staff loans 51,200 44,417 51,200 44,417
315,946 311,563 315,946 311,563
Quoted shares 435,738 200,261 334,696 97,826
Unquoted shares 27,722 45,793 - -
Government securities 3,465,744 2,868,612 3,279,797 2,662,602
Corporate bonds and short term notes 181,881 196,571 175,124 190,770
Loans and receivables 315,946 311,563 315,946 311,563
4,427,031 3,622,800 4,105,563 3,262,761
FINANCIAL STATEMENTS 2017
NOTES TO THE FINANCIAL STATEMENTS (CONTINUED)
72Th
e H
erita
ge In
sura
nce
Com
pany
Ken
ya L
imite
d An
nual
Rep
ort a
nd F
inan
cial
Sta
tem
ents
20
17

19. Financial instruments (Continued)a) Equity investments at fair value through profit or loss
THE GROUP THE COMPANY
i) Quoted shares 2017 2016 2017 2016
Shs '000 Shs '000 Shs '000 Shs '000
At start of year 200,261 471,924 97,826 161,577
Additions 211,710 352 211,710 352
Disposals (2) (223,943) (2) (53,621)
Fair value gain/ (loss) 25,760 (45,289) 25,162 (10,482)
Currency translation (1,991) (2,783) - -
At end of the year 435,738 200,261 334,696 97,826
ii) Unquoted sharesAt start of year 45,793 42,660 - -
Currency translation (890) (825) - -
Fair value (loss)/gains (17,181) 3,958 - -
At end of the year 27,722 45,793
iii) Government securitiesAt start of the year 2,868,612 1,590,981 2,662,602 1,432,563
Additions 4,052,500 2,590,200 4,052,500 2,590,200
Maturities (3,467,328) (1,310,309) (3,422,175) (1,310,309)
Fair value gain/(loss) 15,965 (839) (13,130) (49,852)
Currency translation (4,005) (1,421) - -
At end of the year 3,465,744 2,868,612 3,279,797 2,662,602
Instruments held under lien with Insurance Regulatory Authority as at 31 December 2017 werevalued at Shs 450 Million (2016 : Shs 300 Million).
b.) Loans and receivables
Mortgage loansAt start of the year 267,145 294,890 267,145 294,890
Loans advanced 37,217 32,230 37,217 32,230
Loan repayments (39,616) (59,975) (39,616) (59,975)
At end of the year 264,746 267,145 264,746 267,145
FINANCIAL STATEMENTS 2017
NOTES TO THE FINANCIAL STATEMENTS (CONTINUED)
The
Her
itage
Insu
ranc
e Co
mpa
ny K
enya
Lim
ited
Annu
al R
epor
t and
Fin
anci
al S
tate
men
ts 2
017
73

19. Financial instruments (Continued)b) Loans and receivables (Continued)
THE GROUP THE COMPANY
Maturity profile of mortgage loans 2017 2016 2017 2016
Shs '000 Shs '000 Shs '000 Shs '000
Loans maturing:
Within 1 year - 4,286 - 4,286
In 1 - 5 years 23,008 9,108 23,008 9,108
In over 5 years 241,738 253,751 241,738 253,751
At end of the year 264,746 267,145 264,746 267,145
Other loansAt start of the year 44,418 50,361 44,418 50,361
Loans advanced 30,894 43,211 30,894 43,211
Loan repayments (24,112) (49,154) (24,112) (49,154)
At end of the year 51,200 44,418 51,200 44,418
Maturity profile of other loans Loans maturing:
Within 1 year 1,678 940 - -
In 1-5 years 49,522 43,478 - -
At end of the year 51,200 44,418 - -
Book amount ofMortgage loans 264,746 267,145 264,746 267,145
Other loans 51,200 44,418 51,200 44,418
Total loans and receivables at year end 315,946 311,563 315,946 311,563
FINANCIAL STATEMENTS 2017
NOTES TO THE FINANCIAL STATEMENTS (CONTINUED)
There is no concentration of credit risk with respect to mortgage and other loans.
74Th
e H
erita
ge In
sura
nce
Com
pany
Ken
ya L
imite
d An
nual
Rep
ort a
nd F
inan
cial
Sta
tem
ents
20
17

20. Reinsurers’ share of insurance liabilities
THE GROUP THE COMPANY
Reinsurers’ share of: 2017 2016 2017 2016
Shs '000 Shs '000 Shs '000 Shs '000
Unearned premium (Note 27) 1,455,851 1,516,632 1,091,388 810,769
Notified claims outstanding (Note 26) 652,487 570,485 377,618 391,715
Claims incurred but not reported (Note 26) 152,181 107,528 103,658 71,774
At end of the year 2,260,519 2,194,645 1,572,664 1,274,258
Amounts due from reinsurers in respect of claims already paid by the Company on contracts that are reinsured are included in receivables arising out of reinsurance arrangements in the statement of financial position. Reinsurers’ share of insurance liabilities is classified as current assets. Movements in the above reinsurance assets are shown in Note 26.
21. Deferred acquisition costs
AssetsAt start of the year 95,041 120,344 19,728 34,097
Additions 191,301 270,232 21,114 49,333
Amortisation charge (216,284) (294,761) (28,096) (63,702)
Currency translation (1,465) (774) - -
At end of the year 68,593 95,041 12,746 19,728
LiabilitiesAt start of the year (87,318) (88,414) - -
Additions (180,497) (223,471) - -
Amortisation charge 206,522 223,721 - -
Currency translation 1,699 846 - -
At end of the year (59,594) (87,318) - -
Net 8,999 7,723 12,746 19,728
FINANCIAL STATEMENTS 2017
NOTES TO THE FINANCIAL STATEMENTS (CONTINUED)
The
Her
itage
Insu
ranc
e Co
mpa
ny K
enya
Lim
ited
Annu
al R
epor
t and
Fin
anci
al S
tate
men
ts 2
017
75

22. Other receivables
THE GROUP THE COMPANY
2017 2016 2017 2016
Shs '000 Shs '000 Shs '000 Shs '000
Due from related parties (Note 33 (v) 67,093 11,085 82,361 50,965
Prepayments 288,740 128,629 300,720 127,052
Operating lease receivables 17,046 1,477 - -
Other receivables 14,304 17,157 7,284 9,242
387,183 158,348 390,365 187,259
23. Cash and cash equivalents
Cash and cash equivalents consist ofDeposits with financial institutions 1,864,345 1,749,851 742,381 820,653
Cash at bank and in hand 361,425 108,573 311,870 54,914
2,225,770 1,858,424 1,054,251 875,567
The following table summarises the maturity of deposits with Financial Institutions.
Maturing within 90 days 1,368,928 1,043,426 742,381 820,653
Maturing within 90-360 days 495,417 706,425 - -
Total 1,864,345 1,749,851 742,381 820,653
FINANCIAL STATEMENTS 2017
NOTES TO THE FINANCIAL STATEMENTS (CONTINUED)
76Th
e H
erita
ge In
sura
nce
Com
pany
Ken
ya L
imite
d An
nual
Rep
ort a
nd F
inan
cial
Sta
tem
ents
20
17

24. Weighted average effective interest rates
The following table summarizes the weighted average effective interest rates at the period end on the principal interest bearing investments:
THE GROUP THE COMPANY
2017 2016 2017 2016
Shs '000 Shs '000 Shs '000 Shs '000
% % % %
Loans Receivable 8 8 8 8
Government securities 10 13 10 13
Deposits with financial institutions 12 8 12 8
Corporate bonds 13 11 13 11
Deposits with financial institutions have an average maturity of 3 to 4 months (2016: 3 to 4 months), while corporate bonds have an average maturityof 1 to 6 years (2016: 1 to 6 years).
25. Insurance contract liabilities
THE GROUP THE COMPANY
2017 2016 2017 2016
Shs '000 Shs '000 Shs '000 Shs '000
Short term non-life insurance contracts
Claims reported and claims handling expenses 2,238,853 2,116,912 1,695,142 1,600,628
Claims incurred but not reported 584,869 535,812 487,716 448,001
At end of the year 2,823,722 2,652,724 2,182,858 2,048,629
Movements in insurance liabilities and reinsurance assets are shown in note 26.
The Company uses Bornehuetter Fergusson (BF) technique to estimate the ultimate cost of claims for the Incurred But Not Reported (IBNR) provision. The BF method recognizes the occasional limitation of the chain ladder in using the actual claims paid or reported only but also takes into account the loss ratios of the business classes to provide an additional indication of the expected ultimate claims. During the year the company fully adopted the actuarial reserving basis of IBNR.
As the data is still sparse and not fully matured for the various classes of business, basic chain ladder will be rather volatile.BF was therefore recommended to provide a more stable statistical estimate of the liabilities for the IBNR provisions.
FINANCIAL STATEMENTS 2017
NOTES TO THE FINANCIAL STATEMENTS (CONTINUED)
The
Her
itage
Insu
ranc
e Co
mpa
ny K
enya
Lim
ited
Annu
al R
epor
t and
Fin
anci
al S
tate
men
ts 2
017
77

25. Insurance contract liabilities
THE GROUP
Estimate of ultimate claims costs:
2011Shs ‘000
2012Shs ‘000
2013Shs ‘000
2014Shs‘000
2015Shs ‘000
2016Shs ‘000
2017Shs ‘000 Total
At end of accident year 2,199,467 1,531,634 5,817,104 2,012,270 2,379,655 2,136,277 2,208,048 18,284,455
One year later 1,692,157 1,554,580 5,324,233 1,996,098 1,761,723 2,357,402 - 14,686,193
Two years later 1,539,068 1,377,902 5,286,549 1,427,188 1,477,496 - - 11,108,203
Three years later 1,614,349 1,427,973 1,680,596 1,542,359 - - - 6,265,277
Four years later 1,616,287 1,169,959 1,689,967 - - - - 4,476,213
Five years later 1,027,172 1,139,175 - - - - - 2,166,347
Six years later 1,024,367 - - - - - - 1,024,367
Current estimate of cumulative claims 1,024,367 1,139,175 1,689,967 1,542,359 1,477,496 2,357,402 2,208,04 12,253,857
Less: cumulative payments to date (968,102) (1,092,174) (1,617,071) (1,292,680) (1,228,751) (1,916,569) (1,236,989) (9,352,336)
Liability in the statement of financial position
56,265 47,001 72,896 249,679 248,745 440,833 971,059 2,086,478
Liability in respect of prior years 152,375
Incurred but not reported 584,869
Total gross claims liability included in the statement of financial position
56,265 47,001 72,896 249,679 248,745 440,833 971,059 2,823,722
FINANCIAL STATEMENTS 2017
NOTES TO THE FINANCIAL STATEMENTS (CONTINUED)
78Th
e H
erita
ge In
sura
nce
Com
pany
Ken
ya L
imite
d An
nual
Rep
ort a
nd F
inan
cial
Sta
tem
ents
20
17

FINANCIAL STATEMENTS 2017
NOTES TO THE FINANCIAL STATEMENTS (CONTINUED)
25. Insurance contract liabilities (Continued)
THE COMPANY
Accident year Estimate of ultimateclaims costs:
2011Shs ‘000
2012Shs ‘000
2013Shs ‘000
2014Shs
‘0002015
Shs ‘0002016
Shs ‘0002017
Shs ‘000 Total
At end of accident year 1,283,515 850,064 954,808 1,281,658 1,317,688 1,381,701 1,449,064 8,518,498
One year later 967,010 1,142,028 1,568,825 1,439,584 1,405,054 1,654,247 - 8,176,748
Two years later 921,726 1,078,406 1,509,430 1,345,393 1,107,198 - - 5,962,153
Three years later 1,014,168 1,127,469 1,635,486 1,450,935 - - - 5,228,058
Four years later 1,018,832 1,154,658 1,638,374 - - - - 3,811,864
Five years later 1,021,656 1,128,497 - - - - - 2,150,153
Six years later 1,008,268 - - - - - - 1,008,268
Current estimate of cumulative claims 1,008,268 1,128,497 1,638,374 1,450,935 1,107,198 1,654,247 1,449,064 9,436,583
Less: cumulative payments to date (954,710) (1,084,614) (1,572,899) (1,253,290) (957,621) (1,323,861) (766,338) (7,913,333)
Liability in the statement of financial position
53,558 43,883 65,475 197,645 149,577 330,386 682,726 1,523,250
Liability in respect of prior years 171,892
Incurred but not reported 487,716
Total gross claims liability included in the statement of financial position
53,558 43,883 65,475 197,645 149,577 330,386 682,726 2,182,858
The
Her
itage
Insu
ranc
e Co
mpa
ny K
enya
Lim
ited
Annu
al R
epor
t and
Fin
anci
al S
tate
men
ts 2
017
79

26. Movements in insurance liabilities and reinsurance assets
THE GROUP
2017 2016
Gross Shs ‘000
ReinsuranceShs ‘000
NetShs ‘000
GrossShs ‘000
ReinsuranceShs ‘000
NetShs ‘000
Notified claims 2,116,912 570,485 1,546,427 1,936,381 553,050 1,383,331
Incurred but not reported 535,812 107,528 428,284 685,327 246,906 438,421
Total at the beginningof the year 2,652,724 678,013 1,974,711 2,621,708 799,956 1,821,752
Cash paid for claims settled in year (3,285,225) (1,579,712) (1,705,513) (3,297,446) (1,779,850) (1,517,596)
Increase in liabilities:
Arising from current year claims 2,989,044 1,621,749 1,367,295 2,053,409 1,299,908 753,501
Arising from prior year claims 467,179 84,619 382,560 1,275,053 357,999 917,054
Total at end of the year 2,823,722 804,669 2,019,053 2,652,724 678,013 1,974,711
Notified claims 2,238,853 652,478 1,586,366 2,116,912 570,485 1,546,427
Incurred but not reported 584,869 152,182 432,687 535,812 107,528 428,284
Total at end of the year 2,823,722 804,669 2,019,053 2,652,724 678,013 1,974,711
THE COMPANY
2017 2016
Gross Shs ‘000
ReinsuranceShs ‘000
NetShs ‘000
GrossShs ‘000
ReinsuranceShs ‘000
NetShs ‘000
Notified claims 1,600,628 391,715 1,208,913 1,364,340 301,513 1,062,827
Incurred but not reported 448,001 71,774 376,227 581,397 196,598 384,799
Total at the beginning of the year 2,048,629 463,489 1,585,140 1,945,737 498,111 1,447,626
Cash paid for claims settled in year (2,576,405) (1,191,488) (1,384,917) (2,483,380) (1,265,592) (1,217,788)
Increase in liabilities:
Arising from current year claims 2,200,692 1,146,283 1,054,409 1,619,081 1,091,403 527,678
Arising from prior year claims 509,942 62,993 446,949 967,191 139,567 827,624
Total at end of the year 2,182,858 481,277 1,701,581 2,048,629 463,489 1,585,140
Notified claims 1,695,142 377,619 1,317,523 1,600,628 391,715 1,208,913
Incurred but not reported 487,716 103,658 384,058 448,001 71,774 376,227
Total at end of the year 2,182,858 481,277 1,701,581 2,048,629 463,489 1,585,140
FINANCIAL STATEMENTS 2017
NOTES TO THE FINANCIAL STATEMENTS (CONTINUED)
80Th
e H
erita
ge In
sura
nce
Com
pany
Ken
ya L
imite
d An
nual
Rep
ort a
nd F
inan
cial
Sta
tem
ents
20
17

FINANCIAL STATEMENTS 2017
NOTES TO THE FINANCIAL STATEMENTS (CONTINUED)
27. Unearned premiumUnearned premium represents the liability for short term business contracts where the Group and Company’sobligations are not expired at the year end. Movement of the reserve is shown below:
THE GROUP
2017 2016
Gross Shs ‘000
ReinsuranceShs ‘000
NetShs ‘000
GrossShs ‘000
ReinsuranceShs ‘000
NetShs ‘000
At beginning of the year 2,926,838 1,516,632 1,410,206 2,832,885 1,416,928 1,415,957
Increase in the period (net) 9,203 (79,305) 88,508 102,901 106,552 (3,651)
Currency translation (17,655) 18,524 (36,179) (8,948) (6,848) (2,100)
At end of the year 2,918,386 1,455,851 1,462,535 2,926,838 1,516,632 1,410,206
THE COMPANY
At beginning of the year 2,018,889 810,769 1,208,120 1,884,802 691,382 1,193,420
Increase in the year (net) 336,876 280,618 56,258 134,087 119,387 14,700
At end of the year 2,355,765 1,091,387 1,264,378 2,018,889 810,769 1,208,120
28. Deferred income tax
THE GROUP THE COMPANY
2017Shs ‘000
2016Shs ‘000
2017Shs ‘000
2016Shs ‘000
Deferred tax liability - (1,719) - -
Deferred tax asset 205,202 131,175 165,279 90,354
Net deferred tax asset 205,202 129,456 165,279 90,354
Deferred tax is calculated, in full, on all temporary differences under the liability method using a principal tax rate of 30% (2016 : 30%). The movement on the deferred income tax account is as follows:
At start of the year 129,456 122,229 90,354 82,723
Profit or loss credit (Note 9) 75,746 7,227 74,925 4,374
Underprovision in previous year - - - 3,257
At end of the year 205,202 129,456 165,279 90,354
Deferred tax assets and liabilities, deferred tax charge/(credit) in the statement of profit or loss account are attributable to the following items:
The
Her
itage
Insu
ranc
e Co
mpa
ny K
enya
Lim
ited
Annu
al R
epor
t and
Fin
anci
al S
tate
men
ts 2
017
81

28. Deferred income tax (Continued)
THE GROUP
Charged/(credited)
Charged/(credited)
1.1.2017Shs ‘000
to p/lShs ‘000
31.12.2017Shs ‘000
1.1.2016Shs ‘000
to p/lShs ‘000
31.12.2016Shs ‘000
Property and equipment:On historical cost basis (18,959) 868 (18,091) (15,140) (3,819) (18,959)
Investment property fair value gains 9,260 - 9,260 16,448 (7,188) 9,260
Provisions (118,227) (98,763) (216,990) (118,604) 377 (118,227)
Deferred tax effect on fair value gains on government securities 3,658 - 3,658 - 3,658 3,658
Currency translation (5,188) (820) (6,008) (4,933) (255) (5,188)
Total (129,456) (98,715) (228,171) (122,229) (7,227) (129,456)
THE COMPANY
Charged/(credited)
Charged/(credited)
1.1.2017Shs ‘000
to p/lShs ‘000
31.12.2017Shs ‘000
1.1.2016Shs ‘000
to p/lShs ‘000
31.12.2016Shs ‘000
Property and equipment:On historical cost basis (5,357) (218) (5,575) (1,846) (3,511) (5,357)
Investment property fair value gains - - - 7,188 (7,188) -
Provisions (84,997) (74,707) (159,704) (88,065) (3,068) (84,997)
Total (90,354) (74,925) (165,279) (82,723) (7,631) (90,354)
29. Other liabilities
THE GROUP THE COMPANY
2017Shs ‘000
2016Shs ‘000
2017Shs ‘000
2016Shs ‘000
Other liabilities 332,789 85,066 76,632 63,948
Accrued expenses 130,319 119,070 81,625 72,766
Other payables 463,108 204,136 158,257 136,714
Amounts due to related companies 10,429 9,042 10,429 13,741
473,537 213,178 168,686 150,455
Other payables are classified as current liabilities
FINANCIAL STATEMENTS 2017
NOTES TO THE FINANCIAL STATEMENTS (CONTINUED)
82Th
e H
erita
ge In
sura
nce
Com
pany
Ken
ya L
imite
d An
nual
Rep
ort a
nd F
inan
cial
Sta
tem
ents
20
17

31. Capital commitments THE GROUP THE COMPANY
2017Shs ‘000
2016Shs ‘000
2017Shs ‘000
2016Shs ‘000
The Company’s commitment for capital expenditure was as follows:
Computers, Furniture and Fittings 111,829 91,828 111,829 91,828
Operating leases as lessee (expense) Minimum lease payments due
Within one year 13,605 11,055 - 11,055
In second to fifth year inclusive 148,063 99,310 99,310 99,310
161,668 110,365 99,310 110,365
Operating lease payments represent rentals payable by the group for some of its office properties. Leases are negotiated for an average term of six years and rentals are fixed for an average of two years. No contingent rent is payable.
32. Cash generated from operations
THE GROUP THE COMPANY
2017Shs ‘000
2016Shs ‘000
2017Shs ‘000
2016Shs ‘000
Profit before taxation 679,001 782,335 770,982 705,077
Adjustments for: Interest received (Note 3) (541,922) (475,473) (449,840) (478,085)
Depreciation (Note 16) 31,145 32,197 27,799 29,271
Amortisation of intangibles (Note 17) 8,351 7,084 7,586 7,084
Profit on sale of property and equipment (Note 5) 52 (345) - -
Fair value gain on investment property (Note 3) - 12,625 - 12,625
Revaluation reserve of bonds & shares (Note 19) (24,544) 42,170 2,531 60,334
Loss on disposal of subsidiary (Note 4) 10,549 - - -
Changes in working capital:
Receivables arising out of reinsurance arrangements (227,393) (35,218) (307,139) (2,610)
Insurance contract liabilities 170,998 31,015 134,229 102,891
Provision for unearned premium reserve (8,452) 93,953 336,876 134,087
Deferred acquisition costs (1,276) 24,207 6,982 14,369
Reinsurers’ share of insurance liabilities (65,874) 22,239 (298,406) (84,764)
Other payables 610,424 (121,166) 806,323 (337,853)
Other receivables 384,490 273,199 (159,662) 332,822
1,025,549 688,822 878,261 495,248
FINANCIAL STATEMENTS 2017
NOTES TO THE FINANCIAL STATEMENTS (CONTINUED)
30. Contingent Liabilities
In common with the insurance industry in general, the Group companies are subject to litigation arising in the normal course of insurance business. The directors are of the opinion that this litigation will not have a material effect on the financial position or profits of the Group and Company with the exception of our Tanzania subsidiary which has tax disputes with Tanzania Revenue Authority with respect to Value Added Tax (VAT), corporation tax, withholding tax and Pay As You Earn (PAYE) tax from year 2003 to 2005 totalizing Tshs 270 million. The Company has paid one third of amount in dispute as per provisions of Tanzania Income Tax Act. In the opinion of the Directors, no additional material liability is expected to arise from the disputed assessments.
The
Her
itage
Insu
ranc
e Co
mpa
ny K
enya
Lim
ited
Annu
al R
epor
t and
Fin
anci
al S
tate
men
ts 2
017
83
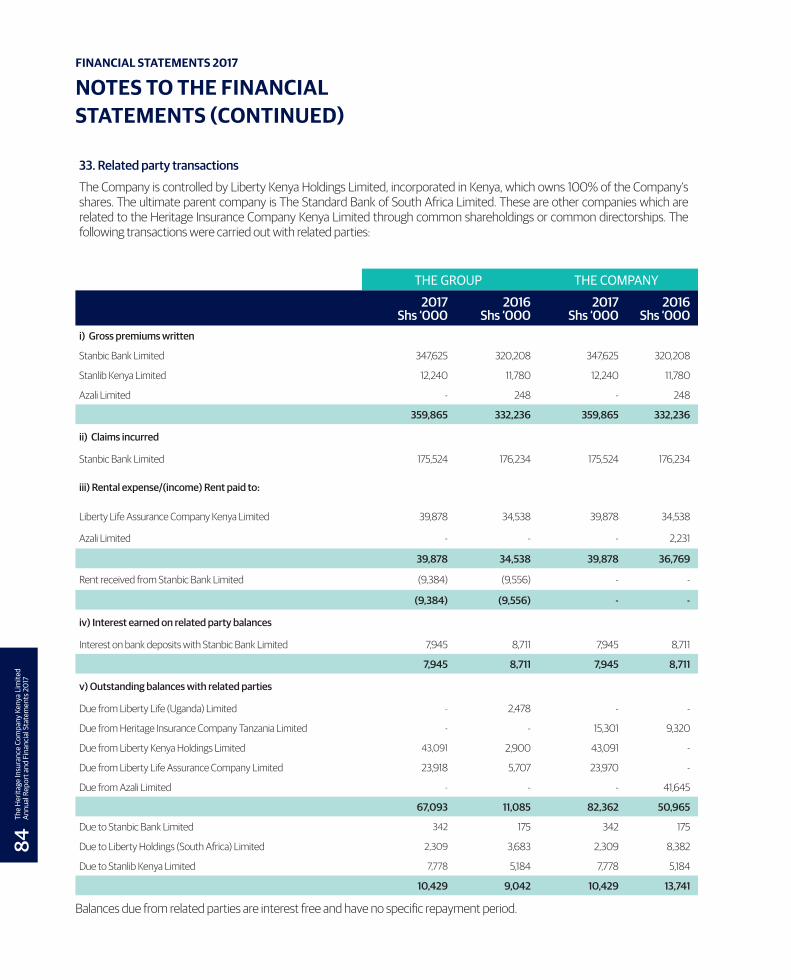
THE GROUP THE COMPANY
2017Shs ‘000
2016Shs ‘000
2017Shs ‘000
2016Shs ‘000
i) Gross premiums written
Stanbic Bank Limited 347,625 320,208 347,625 320,208
Stanlib Kenya Limited 12,240 11,780 12,240 11,780
Azali Limited - 248 - 248
359,865 332,236 359,865 332,236
ii) Claims incurred
Stanbic Bank Limited 175,524 176,234 175,524 176,234
iii) Rental expense/(income) Rent paid to:
Liberty Life Assurance Company Kenya Limited 39,878 34,538 39,878 34,538
Azali Limited - - - 2,231
39,878 34,538 39,878 36,769
Rent received from Stanbic Bank Limited (9,384) (9,556) - -
(9,384) (9,556) - -
iv) Interest earned on related party balances
Interest on bank deposits with Stanbic Bank Limited 7,945 8,711 7,945 8,711
7,945 8,711 7,945 8,711
v) Outstanding balances with related parties
Due from Liberty Life (Uganda) Limited - 2,478 - -
Due from Heritage Insurance Company Tanzania Limited - - 15,301 9,320
Due from Liberty Kenya Holdings Limited 43,091 2,900 43,091 -
Due from Liberty Life Assurance Company Limited 23,918 5,707 23,970 -
Due from Azali Limited - - - 41,645
67,093 11,085 82,362 50,965
Due to Stanbic Bank Limited 342 175 342 175
Due to Liberty Holdings (South Africa) Limited 2,309 3,683 2,309 8,382
Due to Stanlib Kenya Limited 7,778 5,184 7,778 5,184
10,429 9,042 10,429 13,741
FINANCIAL STATEMENTS 2017
NOTES TO THE FINANCIAL STATEMENTS (CONTINUED)
33. Related party transactions
The Company is controlled by Liberty Kenya Holdings Limited, incorporated in Kenya, which owns 100% of the Company’s shares. The ultimate parent company is The Standard Bank of South Africa Limited. These are other companies which are related to the Heritage Insurance Company Kenya Limited through common shareholdings or common directorships. The following transactions were carried out with related parties:
Balances due from related parties are interest free and have no specific repayment period.
84Th
e H
erita
ge In
sura
nce
Com
pany
Ken
ya L
imite
d An
nual
Rep
ort a
nd F
inan
cial
Sta
tem
ents
20
17
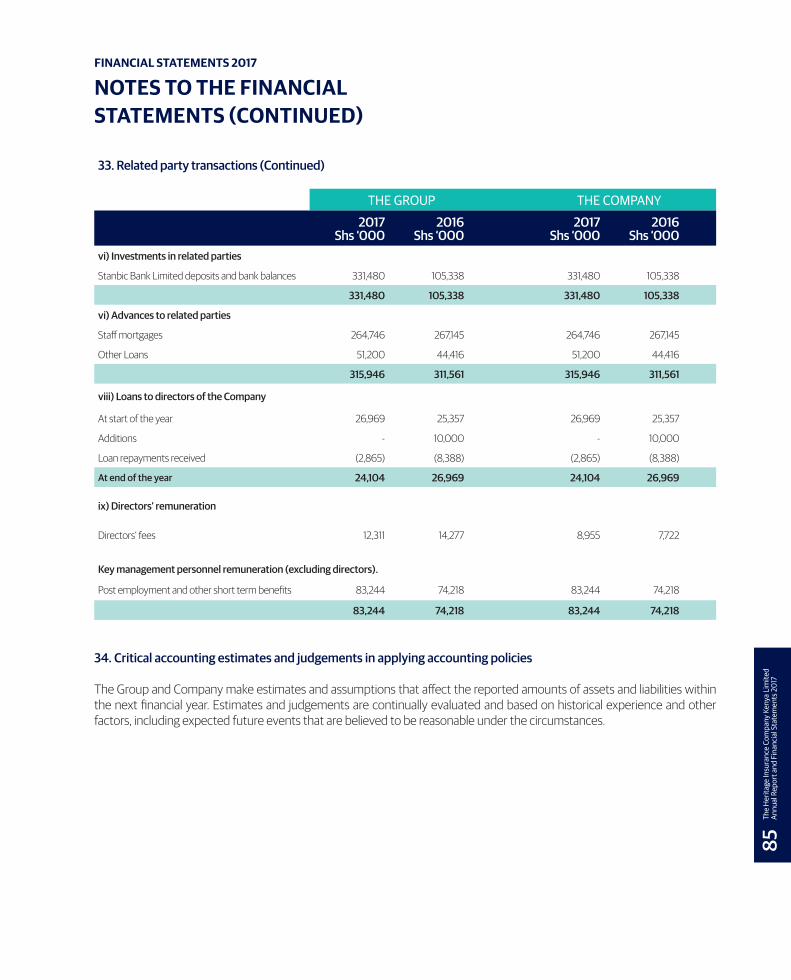
33. Related party transactions (Continued)
THE GROUP THE COMPANY
2017Shs ‘000
2016Shs ‘000
2017Shs ‘000
2016Shs ‘000
vi) Investments in related parties
Stanbic Bank Limited deposits and bank balances 331,480 105,338 331,480 105,338
331,480 105,338 331,480 105,338
vi) Advances to related parties
Staff mortgages 264,746 267,145 264,746 267,145
Other Loans 51,200 44,416 51,200 44,416
315,946 311,561 315,946 311,561
viii) Loans to directors of the Company
At start of the year 26,969 25,357 26,969 25,357
Additions - 10,000 - 10,000
Loan repayments received (2,865) (8,388) (2,865) (8,388)
At end of the year 24,104 26,969 24,104 26,969
ix) Directors’ remuneration
Directors’ fees 12,311 14,277 8,955 7,722
Key management personnel remuneration (excluding directors).
Post employment and other short term benefits 83,244 74,218 83,244 74,218
83,244 74,218 83,244 74,218
FINANCIAL STATEMENTS 2017
NOTES TO THE FINANCIAL STATEMENTS (CONTINUED)
34. Critical accounting estimates and judgements in applying accounting policies
The Group and Company make estimates and assumptions that affect the reported amounts of assets and liabilities within the next financial year. Estimates and judgements are continually evaluated and based on historical experience and other factors, including expected future events that are believed to be reasonable under the circumstances.
The
Her
itage
Insu
ranc
e Co
mpa
ny K
enya
Lim
ited
Annu
al R
epor
t and
Fin
anci
al S
tate
men
ts 2
017
85
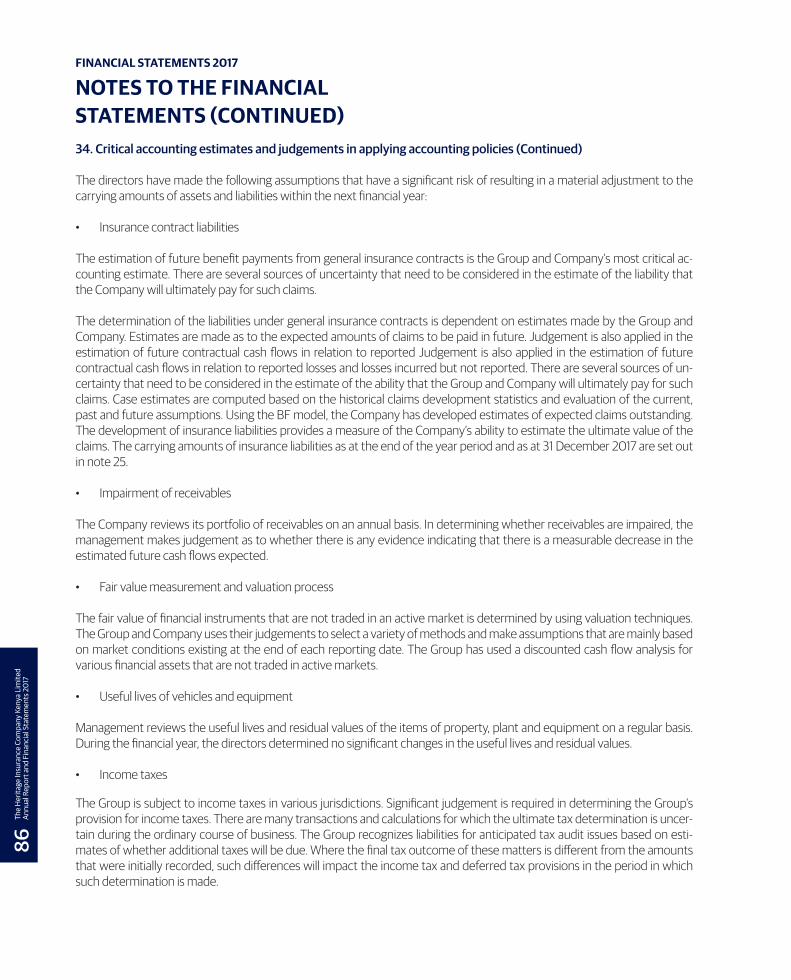
FINANCIAL STATEMENTS 2017
NOTES TO THE FINANCIAL STATEMENTS (CONTINUED)34. Critical accounting estimates and judgements in applying accounting policies (Continued) The directors have made the following assumptions that have a significant risk of resulting in a material adjustment to the carrying amounts of assets and liabilities within the next financial year:
• Insurance contract liabilities
The estimation of future benefit payments from general insurance contracts is the Group and Company’s most critical ac-counting estimate. There are several sources of uncertainty that need to be considered in the estimate of the liability that the Company will ultimately pay for such claims.
The determination of the liabilities under general insurance contracts is dependent on estimates made by the Group and Company. Estimates are made as to the expected amounts of claims to be paid in future. Judgement is also applied in the estimation of future contractual cash flows in relation to reported Judgement is also applied in the estimation of future contractual cash flows in relation to reported losses and losses incurred but not reported. There are several sources of un-certainty that need to be considered in the estimate of the ability that the Group and Company will ultimately pay for such claims. Case estimates are computed based on the historical claims development statistics and evaluation of the current, past and future assumptions. Using the BF model, the Company has developed estimates of expected claims outstanding. The development of insurance liabilities provides a measure of the Company’s ability to estimate the ultimate value of the claims. The carrying amounts of insurance liabilities as at the end of the year period and as at 31 December 2017 are set out in note 25.
• Impairment of receivables
The Company reviews its portfolio of receivables on an annual basis. In determining whether receivables are impaired, the management makes judgement as to whether there is any evidence indicating that there is a measurable decrease in the estimated future cash flows expected.
• Fair value measurement and valuation process
The fair value of financial instruments that are not traded in an active market is determined by using valuation techniques. The Group and Company uses their judgements to select a variety of methods and make assumptions that are mainly based on market conditions existing at the end of each reporting date. The Group has used a discounted cash flow analysis for various financial assets that are not traded in active markets.
• Useful lives of vehicles and equipment
Management reviews the useful lives and residual values of the items of property, plant and equipment on a regular basis. During the financial year, the directors determined no significant changes in the useful lives and residual values.
• Income taxes
The Group is subject to income taxes in various jurisdictions. Significant judgement is required in determining the Group’s provision for income taxes. There are many transactions and calculations for which the ultimate tax determination is uncer-tain during the ordinary course of business. The Group recognizes liabilities for anticipated tax audit issues based on esti-mates of whether additional taxes will be due. Where the final tax outcome of these matters is different from the amounts that were initially recorded, such differences will impact the income tax and deferred tax provisions in the period in which such determination is made.
86Th
e H
erita
ge In
sura
nce
Com
pany
Ken
ya L
imite
d An
nual
Rep
ort a
nd F
inan
cial
Sta
tem
ents
20
17

THE GROUP
Class of business Maximum insured loss (Shs’ 000)
Short term insurance business Shs 0 Shs 15M Shs 15M Shs 250M Over Shs 250M Total
Motor Gross 26,757,422 16,541,822 488,841 43,788.085
Net 26,194,420 14,822,850 216,857 41,234,127
Fire Gross 13,471,065 95,546,520 769,960,473 878,978,058
Net 12,471,065 72,153,176 31,235,323 115,599,321
Personal accident Gross 532,707 13,431,303 7,565382 21,529,392
Net 478,026 10,811,403 6,685,382 17,974,811
Other Gross 26,311,168 146,042,438 328,385,285 500,738,891
Net 30,395,694 136,049,000 150,724,108 317,168,802
Total Gross 67,072,362 271,562,083 1,106,399,981 1,445,034,426
Net 69,278,962 233,836,429 188,861,670 491,977,061
FINANCIAL STATEMENTS 2017
NOTES TO THE FINANCIAL STATEMENTS (CONTINUED)35. Management of insurance and financial risk The Company’s activities expose it to a variety of risks, including insurance risk, financial risk, credit risk, and the effects of changes in property values, debt and equity market prices, foreign currency exchange rates and interest rates and liquidity risks. The Company’s overall risk management programme focuses on the identification and management of risks and seeks to minimise potential adverse effects on its financial performance by use of underwriting guidelines and capacity limits, re-insurance planning, credit policy governing the acceptance of clients, and defined criteria for the approval of intermediaries and reinsurers. Investment policies are in place which help manage liquidity and seek to maximise return within an accept-able level of interest rate risk.
This section summarises the way the company manages key risks:
A) INSURANCE RISK
The risk under any one insurance contract is the possibility that the insured event occurs and the uncertainty of the amount of the resulting claim. By the very nature of an insurance contract, this risk is random and therefore unpredictable.For a portfolio of insurance contracts where the theory of probability is applied to pricing and provisioning, the principal risk that the company faces under its insurance contracts is that the actual claims and benefit payments exceed the carrying amount of the insurance liabilities. This could occur because the frequency or severity of claims and benefits are greater than estimated. Insurance events are random and the actual number and amount of claims and benefits will vary from year to year from the level established using statistical techniques. Experience shows that the larger the portfolio of similar insurance contracts, the smaller the relative variability about the expected outcome will be. In addition, a more diversified portfolio is less likely to be affected across the board by a change in any subset of the portfolio. The company has developed its insurance underwriting strategy to diversify the type of insurance risks accepted and within each of these categories to achieve a sufficiently large population of risks to reduce the variability of the expected outcome.
Factors that aggravate insurance risk include lack of risk diversification in terms of type and amount of risk, geographical location and type of industry covered. The following tables disclose the concentration of insurance liabilities by the class of business in which the contract holder operates and by the maximum insured loss limit included in the terms of the policy:
Year ended 31 December 2017.
The concentration by sector or maximum insured loss at the end of the year is broadly consistent with the prior year.
The
Her
itage
Insu
ranc
e Co
mpa
ny K
enya
Lim
ited
Annu
al R
epor
t and
Fin
anci
al S
tate
men
ts 2
017
87

35. Management of insurance and financial risk (Continued)
FINANCIAL STATEMENTS 2017
NOTES TO THE FINANCIAL STATEMENTS (CONTINUED)
Year ended 31 December 2017.
Year ended 31 December 2016.
THE COMPANY
Class of business Maximum insured loss (Shs’ 000)
Short term insurance business Shs 0 Shs 15M Shs 15M Shs 250M Over Shs 250M Total
Motor Gross 26,478,456 15,876,107 - 42,354,563
Net 25,927,171 14,616,989 - 40,544,160
Fire Gross 13,095,246 89,989,079 395,988,267 499,072,592
Net 10,973,540 66,759,558 26,618,906 104,351,004
Personal accident Gross 533,707 13,431,303 7,565,382 21,529,392
Net 478,026 10,811,403 6,685,382 17,974,811
Other Gross 25,058,245 133,820,662 165,654,182 324,533,089
Net 20,293,292 100,663,623 27,979,854 148,936,769
Gross 65,164,654 253,117,151 569,207,831 887,489,636
Net 57,671,029 192,851,573 61,284,142 311,806,744
The concentration by sector or maximum insured loss at the end of the year is broadly consistent with the prior year.
THE GROUP
Class of business Maximum insured loss (Shs’ 000)
Short term insurance business Shs 0 Shs 15M Shs 15M Shs 250M Over Shs 250M Total
Motor Gross 31,194,004 13,683,889 623,168 45,501,061
Net 31,993,829 12,594,453 269,704 44,857,986
Fire Gross 28,157,345 91,782,264 580,696,108 700,635,717
Net 28,735,317 82,993,424 38,997,564 150,726,305
Personal accident Gross 2,323,014 29,250,340 167,499,112 199,072,466
Net 8,518,130 43,341,657 99,489,099 151,348,886
Other Gross 24,288,447 148,646,923 135,511,448 308,446,818
Net 20,743,132 112,275,120 28,471,373 161,489,625
Gross 85,962,810 283,363,416 884,329,836 1,253,656,062
Net 89,990,40 251,204,654 167,227,740 508,422,802
The concentration by sector or maximum insured loss at the end of the year is broadly consistent with the prior year.88Th
e H
erita
ge In
sura
nce
Com
pany
Ken
ya L
imite
d An
nual
Rep
ort a
nd F
inan
cial
Sta
tem
ents
20
17

35. Management of insurance and financial risk (Continued)
THE COMPANY
Class of business Maximum insured loss (Shs’ 000)
Short term insurance business Shs 0 Shs 15M Shs 15M Shs 250M Over Shs 250M Total
Motor Gross 30,838,382 12,835,244 - 43,673,626
Net 31,661,452 12,338,425 - 43,999,877
Fire Gross 27,770,202 86,057,370 195,455,617 309,283,189
Net 27,682,953 78,409,612 35,074,264 141,166,829
Personal accident Gross 1,106,092 17,379,736 9,443,811 27,929,639
Net 1,106,092 17,379,736 9,432,785 27,918,613
Other Gross 24,288,447 148,646,923 135,511,448 308,446,818
Net 20,743,132 112,275,120 28,471,373 161,489,625
Gross 84,003,123 264,919,273 340,410,876 689,333,272
Net 81,193,629 220,402,893 72,978,422 374,574,944
FINANCIAL STATEMENTS 2017
NOTES TO THE FINANCIAL STATEMENTS (CONTINUED)
Year ended 31 December 2017.
The concentration by sector or maximum insured loss at the end of the year is broadly consistent with the prior year.
B) FINANCIAL RISK
The Group is exposed to financial risk through its financial assets, financial liabilities (investment contracts and borrowings), reinsurance assets and insurance liabilities. In particular the key financial risk is that the proceeds from its financial assets are not sufficient to fund the obligations arising from its insurance and investment contracts. The most important types of risk are credit risk, liquidity risk and market risk. Market risk includes currency risk, interest rate risk, equity price risk and other price risks.These risks arise from open positions in interest rate, currency and equity products, all of which are exposed to general and specific market movements. The risks that the Group primarily faces due to the nature of its investments and liabilities are interest rate risk and equity price risk. The Group manages these positions through an Investment Committee and investment policy that has been developed to achieve long term investment return in excess of its obligations under insurance and investment contracts. The principal technique of the company is to match assets to the liabilities arising from insurance and investment contracts by reference to the type of benefits payable to contract holders. For each distinct category of liabilities, a separate portfolio of assets is maintained. Funds are applied to investments that fit the criteria developed as being acceptable and optimize the return on investment.
Asset Liability Matching (ALM) Balance sheet of the Company as at 31 December 2017Th
e H
erita
ge In
sura
nce
Com
pany
Ken
ya L
imite
d An
nual
Rep
ort a
nd F
inan
cial
Sta
tem
ents
20
1789

35. Management of insurance and financial risk (Continued)
THE COMPANY
Class of business Maximum insured loss (Shs’ 000)
Asset classPolicy Holders
2017Shs ‘000
%Share Holder
2017Shs ‘000
%
Investible assets 2,061,116 37% 2,470,882 75%
Non-investible 2,328,035 42% 496,322 15%
Inadmissible assets 1,180,360 21% 336,011 10%
Total 5,569,511 - 3,303,215 -
Liabilities 5,569,511 100% 205,193 100%
Excess - - 3,098,022 -
Asset classPolicy Holders
2016Shs ‘000
%Share Holder
2016Shs ‘000
%
Investible assets 1,855,690 43% 1,930,722 71%
Non-investible 1,465,534 34% 466,733 15%
Inadmissible assets 980,696 23% 305,514 11%
Total 4,301,920 - 2,702,969 -
Liabilities 4,301,920 100% 178,066 100%
Excess - - 2,524,903 -
FINANCIAL STATEMENTS 2017
NOTES TO THE FINANCIAL STATEMENTS (CONTINUED)
Year ended 31 December 2017.
90Th
e H
erita
ge In
sura
nce
Com
pany
Ken
ya L
imite
d An
nual
Rep
ort a
nd F
inan
cial
Sta
tem
ents
20
17

FINANCIAL STATEMENTS 2017
NOTES TO THE FINANCIAL STATEMENTS (CONTINUED)
35. Management of insurance and financial risk (Continued) C) CREDIT RISK
The Company has exposure to credit risk, which is the risk that a counterparty will be unable to pay amounts in full when due. Key areas where the Company is exposed to credit risk are:
• receivables arising out of direct insurance arrangements;
• receivables arising out of reinsurance arrangements; and
• reinsurers share of insurance liabilities.
Other areas where credit risk arises include cash and cash equivalents, corporate bonds, commercial papers, loans receivable, government securities and deposits with banks and other receivables.
The Group has no significant concentrations of credit risk. The Group structures the levels of credit risk it accepts by placing limits on its exposure to a single counterparty, or groups of counterparty, and to geographical and industry segments. Such risks are subject to an annual or more frequent review. Limits on the level of credit risk by category and territory are approved quarterly by the Board of Directors.
Reinsurance is used to manage insurance risk. This does not, however, discharge the company’s liability as primary insurer. If a reinsurer fails to pay a claim for any reason, the company remains liable for the payment to the policyholder. The creditworthiness of reinsurers is considered on an annual basis by reviewing their financial strength prior to finalisation of any contract. The exposure to individual counterparties is also managed by other mechanisms, such as the right of offset where counterparties are both debtors and creditors of the company. Management information reported to the company includes details of provisions for impairment on loans and receivables and subsequent write offs. Internal audit makes regular reviews to assess the degree of compliance with the company procedures on credit.
Exposures to individual policyholders and groups of policyholders are collected within the ongoing monitoring of the controls associated with regulatory solvency. Where there exists significant exposure to individual policyholders, or homogenous groups of policyholders, a financial analysis equivalent to that conducted for reinsurers is carried out by the company risk department.
The credit quality of financial assets that are neither past due nor impaired can be assessed by reference to the external credit ratings if available or historical information about counterparty default rate. None of the Company’s credit counterparties has an external credit rating other than the government of Kenya which has a Standard and Poor’s rating of B+. For credit risk counterparties without an external credit rating, the group classifies them as follows.
• Group 1 New customers/related parties
• Group 2 Existing customers/related parties with no defaults in the past
• Group 3 Existing customer/related parties with some defaults in the past.
All defaults were fully recovered maximum exposure to credit risk before collateral held
The
Her
itage
Insu
ranc
e Co
mpa
ny K
enya
Lim
ited
Annu
al R
epor
t and
Fin
anci
al S
tate
men
ts 2
017
91

35. Management of insurance and financial risk (Continued)
THE GROUP THE COMPANY
Credit quality
2017Shs ‘000
2016Shs ‘000
2017Shs ‘000
2016Shs ‘000
Receivables arising out of reinsurance arrangements Group 2 717,469 490,076 443,501 136,362
Receivables arising out of direct insurance arrangements
See analysis below 859,611 1,379,413 859,611 1,109,673
Other receivables (excluding prepayment) Group 2 387,183 158,348 390,365 187,259
Reinsurers’ share of insurance liabilities Group 2 2,260,519 2,194,645 1,572,664 1,274,258
Government securities B+ 3,465,744 2,868,612 3,279,797 2,662,602
Corporate bond and short term notes Group 2 181,881 196,571 175,124 190,770
Loans receivable Group 2 315,946 311,563 315,946 311,563
Deposits with financial institutions Group 2 1,864,345 1,749,851 742,381 820,653
Cash and bank balances Group 2 361,425 108,573 311,870 54,914
10,414,123 9,457,652 8,091,259 6,748,054
FINANCIAL STATEMENTS 2017
NOTES TO THE FINANCIAL STATEMENTS (CONTINUED)
Year ended 31 December 2017.
Collateral is held for mortgage, car and development loans above Shs 100,000; all other assets are collateral free. Some receivables that are past due but not impaired are not within their approved credit limits, and have had their terms renegotiated.
None of the above assets are past due or impaired except for the receivables arising out of direct insurance arrangements (which are due within 60 days of the end of the month in which they are invoiced except those related to Motor and Fire Insurance policies which are due on inception of insurance cover):
Financial assets that are past due or impaired
92Th
e H
erita
ge In
sura
nce
Com
pany
Ken
ya L
imite
d An
nual
Rep
ort a
nd F
inan
cial
Sta
tem
ents
20
17

35. Management of insurance and financial risk (Continued)
Receivables arising out of direct insurance arrangements are summarized as follows:
THE GROUP THE COMPANY
Credit quality
2017Shs ‘000
2016Shs ‘000
2017Shs ‘000
2016Shs ‘000
Past due but not impaired Group 2 859,611 1,379,413 859,611 1,109,673
Impaired Group 2 446,400 330,954 446,400 239,833
Gross 1,306,011 1,710,367 1,306,011 1,349,506
Less: allowance for impairment (446,400) (330,954) (446,400) (239,833)
Net 859,611 1,379,413 859,611 1,109,673
Receivables arising out of direct insurance arrangements past due but not impaired;
THE GROUP THE COMPANY
2017Shs ‘000
2016Shs ‘000
2017Shs ‘000
2016Shs ‘000
Past due but not impaired 296,177 262,170 296,177 262,170
by up to 30 days 90,949 91,670 742,381 91,670
Over 61 days 472,485 1,025,573 472,485 755,833
Total past due but not impaired 859,611 1,379,413 859,611 1,109,673
All receivables past due by more than 360 days are carried at their estimated recoverable value. No collateral is held on impaired debts.
Allowance for impairment
Receivables arising out of direct insurance arrangements
THE GROUP THE COMPANY
2017Shs ‘000
2016Shs ‘000
2017Shs ‘000
2016Shs ‘000
Past due impaired
Brokers 178,540 166,622 178,540 86,982
Agents 158,983 124,556 158,983 113,075
Insurance companies - 836 - 836
Direct clients 108,877 38,940 108,877 38,940
446,400 330,954 446,400 239,833
FINANCIAL STATEMENTS 2017
NOTES TO THE FINANCIAL STATEMENTS (CONTINUED)
No collateral was held in relation to the receivables that are past due or impaired.The movement in allowance for impairment account is as below:
The
Her
itage
Insu
ranc
e Co
mpa
ny K
enya
Lim
ited
Annu
al R
epor
t and
Fin
anci
al S
tate
men
ts 2
017
93

35. Management of insurance and financial risk (Continued)
THE GROUP THE COMPANY
2017Shs ‘000
2016Shs ‘000
2017Shs ‘000
2016Shs ‘000
At start of year 330,954 319,716 239,833 209,744
Charge to profit or loss 115,446 12,225 206,567 30,089
Currency translation - (987) - -
At end of the year 446,400 330,954 446,400 239,833
FINANCIAL STATEMENTS 2017
NOTES TO THE FINANCIAL STATEMENTS (CONTINUED)
D) MARKET RISK
i) Foreign exchange risk
The Group operates internationally and is exposed to foreign exchange risk arising from various foreign currency transactions, primarily with respect to the US dollar. Foreign exchange risk arises from our reinsurance dealings with foreign reinsurance brokers. This risk is significant, particularly in respect of the subsidiary in Tanzania, and has in the past been mitigated through the use ofa dollar denominated account.
In the year ending 31 December 2017, we had an equivalent of Shs 11.1M (2016: Shs 13.4M) in reinsurance balances denominated in foreign currency and foreign currency deposit accounts. The impact of normal exchange fluctuations in the Kenya and Tanzania shilling against the US dollar would not have a material effect on Group’s results. The average rate was Shs 102.50 (2016 Shs 101.5) to the dollar, whereas the closing rate was Shs 103.00 (2016 Shs 102.50) to the dollar. ii) Price risk
The Group is exposed to equity securities price risk because of investments in quoted and unquoted shares classified at fair value through the income statement. The Group is not exposed to commodity price risk. To manage its price risk arising from investments in equity and debt securities, the Group diversifies its portfolio. Diversification of the portfolio is done in accordance with limits set by the Group in the Investment Policy. All quoted shares held by the Group are traded on the Stock Exchange.
At 31 December 2017, if the market prices of equity had increased/decreased by 5% all other variables held constant, the fair value of equities held by the Company would have changed by Shs 16,735,000 (31 December 2016: Shs 14,674,000). This would result in a change in profit for the year.
At 31 December 2017, if the market prices of equity had increased/decreased by 5% all other variables held constant, the fair value of equities held by the Group would have changed by Shs 21,781,000 (31 December 2016: Shs 30,042,000). This would result in a change in profit for the year.
94Th
e H
erita
ge In
sura
nce
Com
pany
Ken
ya L
imite
d An
nual
Rep
ort a
nd F
inan
cial
Sta
tem
ents
20
17

THE GROUP
As at 31 December 2017 Liabilities
Up to 1 month
Shs ‘0001 3 months
Shs ‘0003 12
monthsShs ‘000
1 5 yearsShs ‘000
Over 5 years
Shs ‘000Total
Insurance contract liabilities 666,970 496,161 350,940 1,018,010 291,641 2,823,722
Other payables 74,106 - 388,998 - - 463,104
Creditors arising from reinsurance arrangements - - 585,119 - - 585,119
Due to related parties - - 10,429 - - 10,429
Creditors arising from direct insurance arrangements - 755,146 - - - 755,146
Total financial liabilities (expected maturity dates) 741,076 1,251,307 1,335,486 1,018,010 291,641 4,637,520
FINANCIAL STATEMENTS 2017
NOTES TO THE FINANCIAL STATEMENTS (CONTINUED)
35. Management of insurance and financial risk (Continued) D) MARKET RISK
iii.) Cash flow and fair value interest rate risk
Fixed interest rate financial instruments expose the Group to fair value interest rate risk. Variable interest rate financial instruments expose the Group to cash flow interest rate risk.The Group’s fixed interest rate financial instruments are government securities, deposits with financial institutions and corporate bonds.
No limits are placed on the ratio of variable rate financial instruments to fixed rate financial instruments.
At 31 December 2017, if the interest rate of the fixed interest bearing instruments increased/decreased by 1%, all other variables held constant, the profit of the Company would have changed by Shs 45,516,000 (31 December 2016: Shs. 16,355,000).
At 31 December 2017, if the interest rate of the fixed interest bearing instruments increased/decreased by 1%. all other variables held constant, the profit of the Group would have changed by Shs 45,849,000 (31 December 2016: Shs. 38,041,160).
e) Liquidity risk
Liquidity risk is the risk that the Company is unable to meet its payment obligations associated with its financial liabilities as they fall due and to replace funds when they are withdrawn.
The Group is exposed to daily calls on its available cash for claims settlement and other administration expenses. The Group does not maintain cash resources to meet all of these needs but maintains a balanced portfolio of short term and long term investments to suit the Company’s settlement cycle. Experience shows that reinvestment of maturing funds can be predicted with a high level of certainty and therefore can be matched to maturing liabilities.
Large unexpected payments are met out of call deposits conveniently placed with various financial institutions at competitive interest rates. Prompt premium collection ensures that the day to day liquidity requirements of the Group are adequately met.The table below presents the cash flows payable and receivable by the Group under liabilities and assets respectively by remaining contractual maturities at the balance sheet date. All figures are in thousands of Kenya Shillings.
The
Her
itage
Insu
ranc
e Co
mpa
ny K
enya
Lim
ited
Annu
al R
epor
t and
Fin
anci
al S
tate
men
ts 2
017
95

35. Management of insurance and financial risk (Continued)THE COMPANY
As at 31 December 2017Liabilities
Up to 1 month
Shs ‘0001 3 months
Shs ‘0003 12
monthsShs ‘000
1 5 yearsShs ‘000
Over 5 years
Shs ‘000Total
Insurance contract liabilities 515,596 383,554 271,292 786,965 225,451 2,182,858
Creditors arising from reinsurance arrangements
- 484,578 - - - 484,578
Other payables 74,106 - 84,147 - - 158,253
Creditors arising from direct insurance arrangements - - 546,310 - - 546,310
Due to related parties - - 10,429 - - 10,429
Total financial liabilities (expected maturity dates) 589,702 868,132 912,178 786,965 225,451 3,382,428
THE GROUP
As at 31 December 2016 Liabilities
Up to 1 month
Shs ‘0001 3 months
Shs ‘0003 12
monthsShs ‘000
1 5 yearsShs ‘000
Over 5 years
Shs ‘000Total
Insurance contract liabilities 856,502 637,156 424,769 355,252 379,045 2,652,724
Insurance contract liabilities Creditors arising from reinsurance arrangements
63,805 125,305 15,021 - - 204,131
Other payables - - 540,791 - - 540,791
Creditors arising from direct insurance arrangements - - 9,042 - - 9,042
Due to related parties - - 449,402 - - 449,402
Total financial liabilities (expected maturity dates) 920,307 762,461 1,439,025 355,252 379,045 3,856,090
THE COMPANY
As at 31 December 2016 Liabilities
Up to 1 month
Shs ‘0001 3 months
Shs ‘0003 12
monthsShs ‘000
1 5 yearsShs ‘000
Over 5 years
Shs ‘000Total
Insurance contract liabilities 661,454 492,058 348,038 274,352 272,727 2,048,629
Other payables 42,733 83,921 10,060 - - 136,714
Creditors arising from direct insurance arrangements - - 449,408 - - 449,408
Due to related parties - - 13,741 - - 13,741
Total financial liabilities (expected maturity dates) 704,187 575,979 821,247 274,352 272,727 2,648,492
FINANCIAL STATEMENTS 2017
NOTES TO THE FINANCIAL STATEMENTS (CONTINUED)
96Th
e H
erita
ge In
sura
nce
Com
pany
Ken
ya L
imite
d An
nual
Rep
ort a
nd F
inan
cial
Sta
tem
ents
20
17

FINANCIAL STATEMENTS 2017
NOTES TO THE FINANCIAL STATEMENTS (CONTINUED)
Kenya Short term divisionShs ‘000
Tanzania Short term divisionTShs ‘000
Regulatory requirement 500,000 300,000
Amount of capital held by the company 500,000 500,000
35. Management of insurance and financial risk (Continued)
F) CAPITAL MANAGEMENT
The Group’s capital comprises the paid up share capital and the solvency margin required to meet the requirements of the insurance regulator. The Group’s objectives when managing capital, which is a broader concept than the ‘equity’ on the balance sheets, are:
• To comply with the capital requirements as set out in the Kenyan Insurance Act, 2015.
• To comply with regulatory solvency requirements as set out in the Insurance Act, 2015. This is consistently carried out to ensure the Company’s ability to meet all its obligations as they fall due is not compromised;
• To safeguard the company’s ability to continue as a going concern, so that it can continue to provide returns to shareholders and benefits for other stakeholders; and
• To provide an adequate return to shareholders by pricing insurance and investment contracts commensurately with the level of risk.
The Kenyan Insurance Act, 2015 requires general insurance companies to hold the minimum level of paid up capital of Shs 500 million by 30 June 2017 and Shs 600 million by 30 June 2018.
The Company had a share capital of 25 Million fully paid up ordinary shares (Shs 20 par value each) totalling Shs 500 Million.This is in line with the above guidelines.
The Group’s paid up capital at the end of 2017 and 2016 is presented in Note 11. The table below summarises the capital requirements of the company and its subsidiary in the various jurisdiction that the Company operates.
SOLVENCYShort term insurance businesses are required to maintain a minimum capital requirement of Shs 600 million by June 2018, 20% of the previous years net earned premium and risk based capital as determined from time to time.
The Kenyan Insurance Regulatory Authority (IRA) has set the minimum required capital adequacy ratio of 180% from 30 June 2017 and 200% and above by 30 June 2018.
During the period the Group and Company held the minimum paid up capital required. The Company has met the required solvency margin as at 31 December 2017. The following table sets out an analysis of the capital adequacy ratio as at 31 December 2017 for the Company:
The
Her
itage
Insu
ranc
e Co
mpa
ny K
enya
Lim
ited
Annu
al R
epor
t and
Fin
anci
al S
tate
men
ts 2
017
97

G) FAIR VALUE ESTIMATION
IFRS 7 requires disclosure of fair value measurements by level of the following fair value measurement hierarchy for financial instruments that are measured at fair value:
• Quoted prices (unadjusted) in active markets for identical assets or liabilities (level 1).
• Inputs other than quoted prices included within level 1 that are observable for the asset or liability, either directly (that is, as prices) or indirectly (that is, derived from prices) (level 2).
• Inputs for the asset or liability that are not based on observable market data (that is, unobservable inputs) (level 3).
The following table presents the Group’s assets that are measured at fair value at 31 December 2017.
35. Management of insurance and financial risks (Continued)
Solvency (Cont’d)
Capital adequacy ratio computationKenya Short term division
2017Shs ‘000
Kenya Short term division2016
Shs ‘000Credit Risk Capital 859,429 865,831
Market Risk Capital 116,783 33,717
Insurance Risk Capital 314,233 261,459
Operational Risk capital 276,749 271,666
Risk-Based Capital 1,199,245 1,176,741
Total Capital available 2,797,808 2,295,431
Absolute amount minimum 600,000 600,000
Volume of Business Minimum 612,485 581,871
Risk-Based Capital Minimum 1,199,245 1,176,741
Minimum Required Capital 1,199,245 1,176,741
Capital Adequacy Ratio 233% 195%
FINANCIAL STATEMENTS 2017
NOTES TO THE FINANCIAL STATEMENTS (CONTINUED)
98Th
e H
erita
ge In
sura
nce
Com
pany
Ken
ya L
imite
d An
nual
Rep
ort a
nd F
inan
cial
Sta
tem
ents
20
17

THE GROUP
As at 31 December 2017Assets
Level 1Shs ‘000
Level 2Shs ‘000
Level 3Shs ‘000
TotalShs ‘000
Financial assets
Quoted shares 435,738 - - 435,738
Unquoted shares - - 27,722 27,722
Bonds - 3,465,744 - 3,465,744
Total assets 435,7382 3,465,744 27,722 3,929,204
THE COMPANY
As at 31 December 2017 Assets
Level 1Shs ‘000
Level 2Shs ‘000
Level 3Shs ‘000
TotalShs ‘000
Financial assets
Quoted shares 334,696 - - 334,696
Bonds - 3,279,797 - 3,279,797
Total assets 334,696 3,279,797 - 3,614,493
THE GROUP
As at 31 December 2016Assets
Level 1Shs ‘000
Level 2Shs ‘000
Level 3Shs ‘000
TotalShs ‘000
Financial assets
Quoted shares 200,261 - - 200,261
Unquoted shares - - 45,793 45,793
Bonds - 2,868,612 - 2,868,612
Investment property - 94,563 - 94,563
Total assets 200,261 2,963,175 45,793 3,209,229
THE COMPANY
As at 31 December 2016 Assets
Level 1Shs ‘000
Level 2Shs ‘000
Level 3Shs ‘000
TotalShs ‘000
Financial assets
Quoted shares 97,826 - - 97,826
Bonds - 2,662,602 - 2,662,602
Investment property - 14,563 - 14,563
Total assets 97,826 2,677,165 - 2,774,991
35. Management of insurance and financial risks (Continued) g) Fair value estimation (Continued)
FINANCIAL STATEMENTS 2017
NOTES TO THE FINANCIAL STATEMENTS (CONTINUED)
The
Her
itage
Insu
ranc
e Co
mpa
ny K
enya
Lim
ited
Annu
al R
epor
t and
Fin
anci
al S
tate
men
ts 2
017
99

FINANCIAL STATEMENTS 2017
NOTES TO THE FINANCIAL STATEMENTS (CONTINUED)
35. Management of insurance and financial risks (Continued) g) Fair value estimation (Continued)
36. Subsequent events
The fair value of other classes of financial assets and liabilities that are not traded in an active market (for example, unquoted equity investments) is determined by using valuation techniques.
These valuation techniques maximise the use of observable market data where it is available and rely as little as possible on entity specific estimates.
If all significant inputs required to fair value an instrument are observable, the instrument is included in level 2.
If one or more of the significant inputs is not based on observable market data, the instrument is included in level 3.Specific valuation techniques used to value financial instruments include:
• Quoted market prices or dealer quotes for similar instruments
• The fair value government security is calculated as the present value of the estimated future cash flows based on observable yield curves.
• Other techniques, such as discounted cash flow analysis, are used to determine fair value for the remaining financial instruments.
Note that all of the resulting fair value estimates are included in level 2 or 3. There were no transfers into or out of level 3 during the period.
There were no events after 31 December 2017 that would have a material effect, adjusting or non-adjusting, on the financial statements.
100
The
Her
itage
Insu
ranc
e Co
mpa
ny K
enya
Lim
ited
Annu
al R
epor
t and
Fin
anci
al S
tate
men
ts 2
017

FIN
AN
CIA
L ST
ATEM
ENTS
20
17
SUPP
LEM
ENTA
RY IN
FORM
ATIO
NCO
NSO
LID
ATED
SH
ORT
TER
M IN
SURA
NCE
BU
SIN
ESS
REV
ENU
E AC
COU
NT
– 20
17
Clas
s of
insu
ranc
e Bu
sines
sEn
gine
erin
gFi
reD
omes
ticFi
reIn
dust
rial
Liab
ility
Mar
ine
Avia
tion
Mot
or
Priv
ate
Mot
or
Com
mer
-ci
alPe
rson
al
Acci
dent
Med
ical
Thef
tW
.C.A
Misc
ella
-ne
ous
2017
Shs ‘
00
0Sh
s '0
00
Shs '
00
0Sh
s '0
00
Shs ‘
00
0Sh
s ‘0
00
Shs ‘
00
0Sh
s ‘0
00
Shs ‘
00
0Sh
s ‘0
00
Shs ‘
00
0Sh
s ‘0
00
Shs '
00
0To
tal
Gros
s pre
miu
ms w
ritte
n58
5,035
16
1,957
1,1
39,13
4 43
6,88
5 18
0,12
0 72
,414
1,0
36,0
54
710,
014
282,0
18
1,992
,457
15
6,07
5 33
1,222
51
1,626
7,5
95,0
11
Chan
ge in
gro
ss U
PR (2
19,3
61)
(1,9
80)
265,7
52
4,42
4 (7
,607
)(13
,517
) (8
,865
)39
,644
9,
489
(85,4
68)
1,081
9,
812
(3,5
14)
(10,
110)
Less
: rei
nsur
ance
pay
able
311,7
77
25,8
36
1,250
,131
284,
560
94,5
23
57,6
51
59,8
57
38,8
21
54,3
07
1,451
,088
10
,862
24
,019
27
0,39
8 3,9
33,8
30
Net
ear
ned
prem
ium
s53
,897
13
4,14
1 15
4,75
5 15
6,74
9 77
,990
1,2
46
967,
332
710,
837
237,
200
45
5,90
1 14
6,29
4 31
7,015
23
7,712
3,
651,0
71
Gros
s clai
ms p
aid70
,845
42
,490
50
9,72
6 14
,717
56
,036
-
609,
207
318,
775
102,0
29
1,250
,053
61
,238
77
,944
17
0,20
3 3,
283,
263
Chan
ge in
gro
ss o
/s cl
aims
567
(15,7
14)
(17,5
08)
23,2
54
334
2,50
6 55
,165
18,6
41
(20,
941)
22,5
64
4,61
6 30
,478
78
,787
182,
749
Less
: Rei
nsur
ance
reco
vera
ble
18,6
95
(47)
440,
642
20,6
65
45,12
3 2,
561
11,03
9 25
,547
24
,933
96
6,77
8 17
,048
2,
285
129,
860
1,705
,129
Net
clai
ms i
ncur
red
52,7
17
26,8
23
51,5
76
17,3
06
11,2
47
(55)
653,
333
311,8
69
56,15
5 30
5,83
9 48
,80
6 10
6,13
7 11
9,13
0
1,760
,883
Com
miss
ions
rece
ivabl
e (1
02,5
10)
(8,5
07)
(234
,045
) (3
9,153
) (1
8,85
5) (1
1,118
) (7
,164)
904
(11,3
93)
(370
,799)
16
(4,5
10)
(27,5
00)
(834
,634
)
Com
miss
ions
pay
able
81,5
89
27,3
96
179,1
89
45,5
28
23,2
91
8,85
3 96
,140
71,6
91
50,5
62
157,6
06
18,8
89
62,9
92
21,2
22
844,
948
Expe
nses
of m
anag
emen
t 49
,041
53
,170
134,
200
101,9
41
26,6
64
5,681
32
5,931
22
8,90
9 16
1,253
27
6,18
0 46
,828
83
,506
90
,405
1,5
83,70
9
Tota
l exp
ense
san
d co
mm
issio
ns28
,120
72
,059
79
,344
10
8,31
6 31
,100
3,
416
414,
907
301,5
04
200,
422
62,9
87
65,7
33
141,9
88
84,12
7 1,5
94,0
23
Und
erw
ritin
g p
rofit
/(lo
ss)
tran
sfer
red
to P
& L
acc
ount
- 20
17 (2
6,94
0)
35,2
59
23,8
35
31,12
7 35
,643
(2
,115)
(10
0,90
8)97
,464
(1
9,37
7)87
,075
31
,755
68
,890
34
,457
29
6,16
5
Key
ratio
s:
Loss
ratio
(net
claim
s inc
urre
d / n
et
earn
ed p
rem
ium
)98
20
33
11
14
(4)
68
44
24
67
33
33
50
41
Com
miss
ions
ratio
(com
miss
ions
pa
yabl
e / g
ross
pre
miu
m w
ritte
n)14
17
16
10
13
12
9
10
18
8 12
19
8
11
Expe
nses
ratio
(man
agem
ent
expe
nses
/ gr
oss w
ritte
n pr
emiu
m)
8
33
12
23
15
8
31
32
57
14
30
25
18
21
The
Her
itage
Insu
ranc
e Co
mpa
ny K
enya
Lim
ited
Annu
al R
epor
t and
Fin
anci
al S
tate
men
ts 2
017
101

Clas
s of
insu
ranc
e Bu
sines
sEn
gine
erin
gFi
reD
omes
ticFi
reIn
dust
rial
Liab
ility
Mar
ine
Avia
tion
Mot
or
Priv
ate
Mot
or
Com
mer
-ci
alPe
rson
al
Acci
dent
Med
ical
Thef
tW
.C.A
Misc
ella
-ne
ous
2017
Shs ‘
00
0Sh
s '0
00
Shs '
00
0Sh
s '0
00
Shs ‘
00
0Sh
s ‘0
00
Shs ‘
00
0Sh
s ‘0
00
Shs ‘
00
0Sh
s ‘0
00
Shs ‘
00
0Sh
s ‘0
00
Shs '
00
0To
tal
Gros
s pre
miu
ms w
ritte
n31
2,160
16
3,433
1,5
47,4
80
446
,257
14
0,01
9 15
,287
1,0
07,12
1 8
12,2
83
386
,770
1,7
61,10
3 12
6,42
2 3
91,6
74
511,
981
7,621
,990
Chan
ge in
gro
ss U
PR (2
1,915
)(5
,451
) 15
,810
(5
,767)
(5,79
6)(11
,450
)(2
7,105
) 3
7,885
18
,313
(14
7,150
)(3
,249
) 16
,218
3
6,99
1 (10
2,666
)
Less
: rei
nsur
ance
pay
able
233,0
56
27,5
24
1,396
,686
2
75,78
6 6
6,42
6 3
,726
57,8
55
65,
278
64,
698
1,266
,101
8,4
12
29,
787
266
,757
3,762
,092
Net
ear
ned
prem
ium
s57
,189
130,
458
166,
604
164,
704
67,7
97
111
922
,161
784,
890
3
40,3
85
347
,852
11
4,76
1 3
78,10
5 2
82,2
15
3,75
7,232
Gros
s clai
ms p
aid24
0,29
8 3
4,69
6 4
79,5
08
23,4
59
60,
177
- 5
60,4
36
354
,644
13
5,024
1,0
04,2
34
24,
628
75,1
71
299
,718
3,
291,9
93
Chan
ge in
gro
ss o
/s cl
aims
48,5
46
13,8
87
(94,
805)
6,5
27
6,7
77
4,2
75
79,
769
22,0
48
3,4
97
(100,
767)
(17,6
61)
40,
608
24,
673
37,3
74
Less
: Rei
nsur
ance
reco
vera
ble
258,
607
(513
) 3
37,3
15
29,
600
40,
148
4,0
55
27,8
80
21,8
23
63,
342
706,
731
(2,0
36)
(1,88
1) 17
2,58
2 1,6
57,6
53
Net
clai
ms i
ncur
red
30,2
37
49,0
96
47,3
88
386
26
,80
6 2
20
612
,325
3
54,8
69
75,17
9 19
6,73
6 9,
003
11
7,660
15
1,912
1,6
71,8
17
Com
miss
ions
rece
ivabl
e (4
0,73
3)(3
,623
)(2
40,19
2)(3
6,53
0)(11
,674
)(3
,680
)(9
,039
)(5
,196)
(15,9
97)
(370
,827
) (5
44)
(5,2
84)
(33,6
23)
(776
,942
)
Com
miss
ions
pay
able
36,7
25
25,
564
208
,004
4
2,85
7 19
,318
1,4
88
91,8
80
83,9
54
73,
553
128,
034
18,79
2 8
0,44
3 5
2,977
8
63,5
89
Expe
nses
of m
anag
emen
t 25
,027
9
1,509
10
8,66
8 8
6,10
8 17
,602
7,
987
336
,566
2
06,3
90
175,6
14
266
,990
4
1,477
7
2,467
7
9,46
8 1,5
15,8
73
Tota
l exp
ense
s and
co
mm
issio
ns21
,019
11
3,45
0
76,4
80
92,4
35
25,2
46
5,79
5 4
19,4
07
285
,148
233
,170
24
,197
59,7
25
147,6
26
98,8
22
1,60
2,52
0
Und
erw
ritin
g pr
ofit/
(loss
)
tran
sfer
red
to P
& L
acc
ount
- 20
165,
933
(32,
088
)42
,736
71
,883
15
,745
(5
,90
4)(1
09,
571)
144,
873
32,0
36
126,
919
46,0
33
112,
819
31,4
81
482,
895
Key
ratio
s:
Loss
ratio
(net
claim
s inc
urre
d / n
et
earn
ed p
rem
ium
)53
38
28
0
40
198
66
45
22
57
8 31
54
41
Com
miss
ions
ratio
(com
miss
ions
pa
yabl
e / g
ross
pre
miu
m w
ritte
n)12
16
13
10
14
10
9
10
19
7 15
21
10
11
Expe
nses
ratio
(man
agem
ent
expe
nses
/ gr
oss w
ritte
n pr
emiu
m)
8 56
7
19
13
52
33
25
45
15
33
19
16
20
FIN
AN
CIA
L ST
ATEM
ENTS
20
17
SUPP
LEM
ENTA
RY IN
FORM
ATIO
NCO
NSO
LID
ATED
SH
ORT
TER
M IN
SURA
NCE
BU
SIN
ESS
REV
ENU
E AC
COU
NT
– 20
16
102
The
Her
itage
Insu
ranc
e Co
mpa
ny K
enya
Lim
ited
Annu
al R
epor
t and
Fin
anci
al S
tate
men
ts 2
017

Clas
s of
insu
ranc
e Bu
sines
sEn
gine
erin
gFi
reD
omes
ticFi
reIn
dust
rial
Liab
ility
Mar
ine
Avia
tion
Mot
or
Priv
ate
Mot
or
Com
mer
-ci
alPe
rson
al
Acci
dent
Med
ical
Thef
tW
.C.A
Misc
ella
-ne
ous
2017
Shs ‘
00
0Sh
s '0
00
Shs '
00
0Sh
s '0
00
Shs ‘
00
0Sh
s ‘0
00
Shs ‘
00
0Sh
s ‘0
00
Shs ‘
00
0Sh
s ‘0
00
Shs ‘
00
0Sh
s ‘0
00
Shs '
00
0To
tal
Gros
s pre
miu
ms w
ritte
n42
7,536
16
1,957
48
4,88
9 20
6,65
8 117
,208
72
,414
86
0,13
0 60
2,697
22
0,68
4 1,9
92,4
57
141,6
91
326,
458
328,
318
5,943
,097
Chan
ge in
gro
ss U
PR (2
27,9
77)
(1,9
80)
42,75
0 (7
,532
)(14
,395
)(13
,517
) (3
1,421
)18
,737
9,88
1 (8
5,468
)19
7 4,
579
(30,
728)
(336
,874
)
Less
: rei
nsur
ance
pay
able
156,
945
25,8
36
405,7
63
80,11
3 32
,577
57
,651
28
,697
19
,756
46,2
04
1,451
,088
2,
718
22,9
43
177,9
31
2,50
8,22
2
Net
ear
ned
prem
ium
s42
,614
13
4,14
1 12
1,876
11
9,01
3 70
,236
1,2
46
800,
012
60
1,678
18
4,36
1 45
5,90
1 13
9,17
0
308,
094
11
9,66
1 3,
098
,00
1
Gros
s clai
ms p
aid56
,197
42,4
90
112,0
61
6,22
2 49
,200
-
495,1
94
280,
344
77,0
70
1,250
,053
52
,646
75
,762
79,16
5 2,
576,
404
Chan
ge in
gro
ss o
/s cl
aims
340
(15,7
14)
(15,
549)
23,2
75
1,483
2,
506
77,9
44
19,74
2 (2
2,914
)22
,564
9,
814
23,6
44
7,235
13
4,37
0
Less
: Rei
nsur
ance
reco
vera
ble
6,26
3 (4
7)71
,801
13
,646
42
,875
2,
561
1,987
21
,303
9,
213
966,
778
12,2
69
241
60,5
24
1,209
,414
Net
clai
ms i
ncur
red
50,2
74
26,8
23
24,7
11
15,8
51
7,80
8 (5
5)57
1,151
27
8,78
3 44
,943
30
5,83
9 50
,191
99,16
5 25
,876
1,5
01,3
60
Com
miss
ions
rece
ivabl
e (7
8,12
4) (8
,507
) (1
01,3
40)
(16,
887)
(5,4
67)
(11,1
18)
(3,3
44)
(1,70
8) (1
3,460
) (3
70,79
9)57
6 (4
,341
) (3
3,957
) (6
48,4
76)
Com
miss
ions
pay
able
64,2
67
27,3
96
87,8
17
31,12
9 16
,455
8,
853
77,0
46
60,2
84
40,5
62
157,6
06
17,12
4 61
,410
24
,422
67
4,37
1
Expe
nses
of m
anag
emen
t 40
,955
53
,170
112,8
16
58,5
56
22,9
82
5,681
23
3,637
72
,573
14
8,92
2 27
6,18
0 44
,045
82
,559
54
,675
1,3
06,75
1
Tota
l exp
ense
s and
co
mm
issio
ns27
,098
72
,059
99
,293
72
,798
33
,970
3,
416
307,
339
231,1
49
176,
024
62
,987
61
,745
13
9,62
8 45
,140
1,3
32,6
46
Und
erw
ritin
g pr
ofit/
(loss
)
tran
sfer
red
to P
& L
acc
ount
- 20
17 (3
4,75
8)35
,259
(2
,128)
30,3
64
28,4
58
(2,11
5) (7
8,47
8)91
,746
(3
6,60
6)87
,075
27
,234
69
,30
1 48
,643
26
3,99
5
Key
ratio
s:
Loss
ratio
(net
claim
s inc
urre
d / n
et
earn
ed p
rem
ium
)118
20
20
13
11
(4)
71
46
24
67
36
32
22
48
Com
miss
ions
ratio
(com
miss
ions
pa
yabl
e / g
ross
pre
miu
m w
ritte
n)15
17
18
15
14
12
9
10
18
8 12
19
7
11
Expe
nses
ratio
(man
agem
ent
expe
nses
/ gr
oss w
ritte
n pr
emiu
m)
10
33
23
28
20
8 27
29
67
14
31
25
17
22
FIN
AN
CIA
L ST
ATEM
ENTS
20
17
SUPP
LEM
ENTA
RY IN
FORM
ATIO
NCO
MPA
NY
SHO
RT T
ERM
INSU
RAN
CE B
USI
NES
S RE
VEN
UE
ACCO
UN
T – 2
017
The
Her
itage
Insu
ranc
e Co
mpa
ny K
enya
Lim
ited
Annu
al R
epor
t and
Fin
anci
al S
tate
men
ts 2
017
103

Clas
s of
insu
ranc
e Bu
sines
sEn
gine
erin
gFi
reD
omes
ticFi
reIn
dust
rial
Liab
ility
Mar
ine
Avia
tion
Mot
or
Priv
ate
Mot
or
Com
mer
-ci
alPe
rson
al
Acci
dent
Med
ical
Thef
tW
.C.A
Misc
ella
-ne
ous
2017
Shs ‘
00
0Sh
s '0
00
Shs '
00
0Sh
s '0
00
Shs ‘
00
0Sh
s ‘0
00
Shs ‘
00
0Sh
s ‘0
00
Shs ‘
00
0Sh
s ‘0
00
Shs ‘
00
0Sh
s ‘0
00
Shs '
00
0To
tal
Gros
s pre
miu
ms w
ritte
n13
6,68
5 16
3,433
54
3,698
21
0,32
6 64
,541
15
,287
76
7,789
65
5,34
4 31
5,028
1,7
61,10
3 10
9,40
5 36
1,214
23
6,32
9 5,
340,
182
Chan
ge in
gro
ss U
PR (2
5,101
) (5
,451
) (1
0,38
9) (1
1,182
)3,4
06
(11,4
50)
(33,7
00)
40,16
7 14
,177
(147
,150)
183
10,9
45
41,4
55
(134
,090
)
Less
: rei
nsur
ance
pay
able
67,5
73
27,5
24
403,8
60
72,3
08
9,35
8 3,7
26
15,2
64
37,11
9 47
,711
1,266
,101
2,433
25
,930
16
4,76
0 2,1
43,6
67
Net
ear
ned
prem
ium
s44
,011
13
0,45
8 12
9,44
9 12
6,83
6 58
,589
11
1 71
8,82
5 65
8,39
2 28
1,494
34
7,852
10
7,155
34
6,22
9 11
3,02
4 3,
062
,425
Gros
s clai
ms p
aid10
9,21
2 34
,696
18
1,492
7,2
60
52,6
98
- 44
1,428
32
3,128
111
,387
1,0
04,2
34
13,8
19
74,6
27
129,
396
2,483
,377
Chan
ge in
gro
ss o
/s cl
aims
25,4
34
13,8
87
11,21
2 1,0
25
6,47
3 4,
275
69,2
08
13,2
55
1,745
(1
00,76
7) (1
9,73
3)41
,555
35
,183
102,
752
Less
: Rei
nsur
ance
reco
vera
ble
122,
315
(513
)15
2,169
11,
046
35,79
8 4,
055
12,5
69
16,9
04
53,9
80
706,
731
(7,0
67)
245
122,
595
1,230
,827
Net
clai
ms i
ncur
red
12,3
31
49,0
96
40,5
35
(2,7
61)
23,3
73
220
49
8,0
67
319,
479
59,15
2 19
6,73
6 1,1
53
115,
937
41,9
84
1,355
,302
Com
miss
ions
rece
ivabl
e (1
6,15
7) (3
,623
) (1
15,6
67)
(16,
291)
(967
) (3
,680
) (3
,529
) (1
,667
) (1
3,478
) (3
70,8
27)
- (4
,660
) (1
9,78
7) (5
70,3
33)
Com
miss
ions
pay
able
17,4
99
25,5
64
109,
024
30,9
77
11,88
5 1,4
88
67,0
63
68,8
15
62,11
6 12
8,03
4 16
,918
74
,593
20
,059
63
4,03
5
Expe
nses
of m
anag
emen
t19
,408
91
,509
92
,414
53
,839
13
,032
7,9
87
233,
263
148,
616
164,
983
266,
990
39,0
64
67,8
33
40,3
29
1,239
,267
Tota
l exp
ense
san
d co
mm
issio
ns20
,750
11
3,45
0
85,7
71
68,5
25
23,9
50
5,79
5 29
6,79
7 21
5,76
4 21
3,62
1 24
,197
55,9
82
137,7
66
40,6
01
1,30
2,96
9
Und
erw
ritin
g pr
ofit/
(loss
)
tran
sfer
red
to P
& L
acc
ount
- 20
1610
,930
(3
2,0
88)
3,14
3 61
,072
11
,266
(5
,90
4) (7
6,03
9)12
3,14
9 8,
721
126,
919
50,0
20
92,5
26
30,4
39
404,
154
Key
ratio
s:
Loss
ratio
(net
claim
s inc
urre
d / n
et
earn
ed p
rem
ium
)28
3831
(2)
4019
869
4921
571
3337
44
Com
miss
ions
ratio
(com
miss
ions
pa
yabl
e / g
ross
pre
miu
m w
ritte
n)13
1620
1518
109
1120
715
218
12
Expe
nses
ratio
(man
agem
ent
expe
nses
/ gr
oss w
ritte
n pr
emiu
m)
1456
1726
2052
3023
5215
3619
1723
FIN
AN
CIA
L ST
ATEM
ENTS
20
17
SUPP
LEM
ENTA
RY IN
FORM
ATIO
NCO
MPA
NY
SHO
RT T
ERM
INSU
RAN
CE B
USI
NES
S RE
VEN
UE
ACCO
UN
T – 2
016
104
The
Her
itage
Insu
ranc
e Co
mpa
ny K
enya
Lim
ited
Annu
al R
epor
t and
Fin
anci
al S
tate
men
ts 2
017

2017
2016
2015
2014
2013
2012
2011
2010
200
920
08
Shs ‘
00
0Sh
s '0
00
Shs '
00
0Sh
s '0
00
Shs ‘
00
0Sh
s ‘0
00
Shs ‘
00
0Sh
s ‘0
00
Shs ‘
00
0Sh
s ‘0
00
Gros
s Writ
ten
Prem
ium
5,94
3,0
97
5,34
0,18
2 5,
224,
669
4,02
6,55
1 3,
549,
062
3,
406,
711
3,38
2,89
5 2,
649,
262
2,0
62,0
94
1,876
,660
Net
Writ
ten
Prem
ium
3,43
4,87
73,
196,
515
3,0
58,11
5 2,
315,
231
1,962
,880
1,9
27,9
50
2,37
1,460
2,
257,
204
1,731
,328
1,5
75,4
10
Prem
ium
ear
ned
3,098
,001
3,0
62,4
25
2,909
,357
2,0
87,0
14
1,936
,410
2,1
03,17
2 2,4
63,8
19
1,936
,874
1,6
47,5
16
1,429
,598
Claim
s inc
urre
d1,5
01,3
60
1,355
,302
1,3
37,6
83
831,5
00
710,
430
839,
663
1,193
,557
1,0
53,6
24
946,
524
862,
598
Net
com
miss
ion
25,8
95
63,70
2 65
,916
(2
5,022
) (2
,504
)10
0,87
8 18
8,79
2 22
5,457
20
0,05
1 13
9,90
8
Expe
nses
1,306
,751
1,2
39,2
67
1,289
,767
1,079
,262
91
8,07
6 98
2,83
8 88
2,75
1 63
1,643
49
9,92
3 42
8,67
1
PRO
FIT
AND
LOSS
Und
erw
rittin
g pr
ofit/
(loss
) 26
3,99
5 40
4,15
4 21
5,99
1 20
1,274
31
0,40
8 17
9,79
3 19
8,71
9 26
,150
1,0
18
(1,5
79)
Polic
yhol
der b
onus
es &
Inte
rest
– DA
sche
mes
(Lon
g-te
rm
Busin
ess)
- -
- -
- (1
78,7
15)
(94,
416)
(140
,977
) (7
3,010
) (8
0,66
4)
Inve
stm
ent a
nd o
ther
inco
me
625,
713
483,8
50
381,2
77
515,1
82
419,
257
726,
343
565,
205
402,4
37
212,1
32
300,
817
Expe
nses
not
char
ged
to re
venu
e ac
coun
t (1
18,7
26)
(182
,927
) (7
6,20
4) (1
4,46
6) (1
8,53
9) (6
3,32
4) (2
2,58
9) (9
,074
) (1
1,029
) (4
7,317
)
Tax
(193
,892
) (2
06,8
85)
(134
,166)
(187
,852
) (1
74,2
15)
(118
,388
) (1
03,0
21)
(81,3
76)
(85,9
36)
(93,
574)
Ope
ratin
g pr
ofit a
ttrib
uted
to sh
areh
olde
r57
7,090
49
8,19
2 38
6,89
8 51
4,138
53
6,91
1 54
5,709
54
3,898
19
7,160
43
,175
77,6
83
Divi
dend
s-
60,
000
370
,000
23
0,00
0 2
00,0
00
400,
000
280
,000
4
35,0
00
-21
8,00
0
SHAR
E H
OLD
ER’S
FUN
DS
Shar
e ca
pita
l50
0,00
0 50
0,00
0 50
0,00
0 50
0,00
0 50
0,00
0 50
0,00
0 50
0,00
0 50
0,00
0 50
0,00
0 50
0,00
0
Reta
ined
pro
fit an
d re
serv
es2,
601,7
68
2,024
,678
1,5
86,4
86
1,569
,588
1,2
85,4
50
1,384
,078
1,0
71,2
01
1,235
,860
1,0
32,9
15
803,6
27
3,10
1,768
3,
024
,678
2,
086
,486
2,
069
,588
1,7
85,4
50
1,884
,078
1,5
71,2
01
1,735
,860
1,5
32,9
15
1,303
,627
Insu
ranc
e fu
nds i
nclu
ding
claim
s and
pro
visio
ns2,
965,9
59
2,79
3,26
0 2,6
41,0
46
2,115
,386
1,7
52,5
21
1,815
,417
3,
562,9
56
3,645
,473
2,9
79,4
47
2,641
,698
6,0
67,7
27
5,81
7,938
4,
727,
532
4,18
4,97
4 3,
537,9
71
3,69
9,49
5 5,
134,
157
5,38
1,333
4,
512,
362
3,94
5,32
5
SHAR
E IN
FORM
ATIO
NEa
rnin
g pe
r sha
re S
hs
2320
1520
.621
2222
82
3
Divi
dend
per
shar
e Sh
s -
214
.89.
28
1611
170
9
FIN
AN
CIA
L ST
ATEM
ENTS
20
17
SUPP
LEM
ENTA
RY IN
FORM
ATIO
NTH
E H
ERIT
AGE
INSU
RAN
CE C
OM
PAN
Y K
ENYA
LIM
ITED
- FI
NA
NCI
AL
RECO
RD –
THE
COM
PAN
Y FO
R TH
E TE
N Y
EARS
EN
DED
31 D
ECEM
BER
2017
Not
e: E
ffect
ive
1 Jan
uary
201
3, lo
ng te
rm B
usin
ess w
as tr
ansf
erre
d to
Lib
erty
Life
Ass
uran
ce K
enya
Ltd
thro
ugh
a bu
sines
s re-
orga
niza
tion
proc
ess,
the
figur
es fo
r 201
3, 2
014,
201
5 20
16 &
201
7 sh
ow o
nly
shor
t te
rm B
usin
ess.
The
figur
es w
ere
rest
ated
to sh
ow th
e co
mbi
ned
posit
ion
for s
hort-
term
and
long
-term
bus
ines
s fro
m 2
008
to 2
012.
The
ear
ning
s per
shar
e ar
e ba
sed
on a
n iss
ued
capi
tal o
f 25,0
00,0
00 o
rdin
ary
shar
es.
The
Her
itage
Insu
ranc
e Co
mpa
ny K
enya
Lim
ited
Annu
al R
epor
t and
Fin
anci
al S
tate
men
ts 2
017
105

DOMESTIC PACKAGE
because we believe in protecting you against burglary

THE HERITAGE INSURANCE COMPANY TANZANIA LIMITEDAbridged Annual Report And Financial StatementsFor The Year Ended 31 December 2017

The directors of the Company at the date of this report, all of whom have served since 1 January 2017, are shown on page 109.
COMPANY SECRETARY
Gemma MoshyP.O.Box 78196Dar es Salaam
SENIOR MANAGEMENT
N. Shanmugarajan - Chief Executive OfficerPuneet Jain (ACA, ACS) - - Chief Financial Officer (Resigned on 30th June 2017)Thecla Magashi ( CPA (T),MBA - Chief Financial Officer (Joined on 1st May 2017)Gilliard Mardai ( ADI) - Joined 1st October 2017
INDEPENDENT AUDITORS
KPMG11th Floor, PPF Tower, Ohio StreetGarden AvenueP.O. Box 1160,Dar es Salaam
REGISTERED OFFICE
4th Floor Masaki IkonBains Avenue- Msasani Peninsula P.O. Box 7390, Dar es SalaamTanzania
PRINCIPAL BANKERS
Citibank Tanzania Limited36 Upanga RoadP.O. Box 71625, Dar es Salaam,Tanzania
CORPORATE INFORMATION
TANZANIA
The Exim Bank Tanzania LimitedExim Tower 1404/45 Ghana AvenueP.O. Box 1431, Dar es SalaamTanzania
STANBIC BANK
Plot no. 99A,Cnr Kinondoni Road & Ali Hassan Mwinyi RoadP.O. Box 72647, Dar es SalaamTanzania
108
The
Her
itage
Insu
ranc
e Co
mpa
ny K
enya
Lim
ited
Annu
al R
epor
t and
Fin
anci
al S
tate
men
ts 2
017

I am delighted to present the results of The Heritage Insurance Company Tanzania Limited for the 12 months ended 31 December 2017. We continue to differentiate ourselves in capital strength and the resulting financial flexibility; this gives our clients and other business partners peace of mind whilst we endeavor to build our culture of sustainable progress & reliability at the same time, maintaining our position as the insurer of choice.
OVERVIEW
Tanzania has sustained a relatively high economic growth over the last decade, averaging 6%–7% a year. Tanzania’s economy has been expanding rapidly, putting it close to the top of the fastest growing economies in Sub-Saharan Africa. World Bank had predicted a growth rate of 7% in 2017. The trend is expected to be maintained in 2018.
The government continues to cut its spending and putting aggressive measures to ensure that a tax payment culture is cultivated amongst all eligible Tanzanians. These measures aim to ensure that the government has adequate financial resources which will have a positive effect on the economy in the medium to long term.
In 2016, the insurance market grew by 7% compared to the target of 18%. The growth aligned to the reported growth in GDP. In 2017, the general insurance market is expected to have grown in line with the economic growth as well. In 2018, the general insurance market is expected to grow in double digit based on the historical trend.
2018 is promising to be a year of economic opportunities due to various large investments/project being undertaken by the Government, namely; construction of flyovers, standard – gauge railway project, completion of Terminal III at the JNIA, Uganda – Tanzania crude oil pipeline etc. The insurance industry is positioning itself to offer various insurance products to the market.
PERFORMANCE REVIEW
The gross written premium decreased by 26% over the previous year primarily due to regulatory changes, loss of large corporate clients and other market conditions. The net earned premium decreased by 19% over 2016.
During the year, the Company had a reasonable claims experience and recorded an overall net claims ratio of 47% (net claims over net earned premium) in line with the budget and previous year loss. Operating expenses remained marginally higher at 17% compared to the international benchmark of 10% of gross written premium. The Company continues to focus on prudently reducing the cost base and on improving the operational cost ratios.
Interest & dividend incomes at Tshs 2,089 million were 6% higher than the previous year due mainly to increase in bank deposits from Tshs 19,680 million to Tshs 24,234 million. Fair value gain on investment was Tshs 293 million compared to a loss of Tshs 587 million in 2016. Unrealized exchange loss of TZS 22 million and realized exchange gains of TZS 417 million have also been recorded as at the end of December 2017.
The underwriting profit decreased by 51% to TShs 696.8 million in 2017 from TShs 1,409 million in 2016. The profit before tax at TShs 1,677 million is 23% lower compared with profit before tax of TShs 4,331 million in 2016. Besides the drop in business at the top line, the bottom line results were significantly affected by a one off bad debt provision of a disputed claim recovery worth Tshs 1,189 million. During the year, the company paid an interim dividend of Tshs 4 billion.
With total assets of Tshs 56.6 billion and a strong relationship with reputable reinsurers the Company remains both strong and dynamic.
CHAIRMAN’S STATEMENT
The
Her
itage
Insu
ranc
e Co
mpa
ny K
enya
Lim
ited
Annu
al R
epor
t and
Fin
anci
al S
tate
men
ts 2
017
109

CHAIRMAN’S STATEMENT (CONT’D)
FUTURE OUTLOOK The Company strives to ensure success for the benefits of all of our stakeholders by providing efficient service to its loyal clients and enhancing shareholders’ value. Early this year we opened a Customer Service Point (CSP) conveniently located at Haidery Plaza in the city centre. In November 2017, the Company’s registered office was relocated to a new office in Msasani Peninsular and this has improved the work environment and clients service delivery.
The Company will continue to focus on its core market segment of large corporate clients alongside making concerted efforts to develop and strengthen business relationships with Tier II, Tier III brokers and retail channel partners to broaden its client base. The positive impact of various government projects and the focus on industrialization will have a positive impact to the Company. The Company is expecting to derive substantial growth from Aviation, Engineering, Marine business segments and other retail business especially motor segment.
The success of our business derives from our stakeholders – Employees, Clients, Brokers, Agents, Reinsurers, Business partners, Regulators and Shareholders. I would like to sincerely extend my appreciation to all our stakeholders for their continued support. Particularly to staff I record the Board recognition for the valuable contribution and for commitments to the values and ideals that Heritage represents. To our esteemed clients, we remain grateful for your support.
ACKNOWLEDGEMENTS
The Board acknowledges the support and guidance provided by the Commissioner of Insurance and his team to the Company. The Company will continue to live and promote a culture of prudent business underwriting.
Lastly, I take this opportunity to thanking my fellow directors for their valuable support, guidance, vision and the intellect they bring to the Board.
YOGESH M. MANEK DATECHAIRMAN
110
The
Her
itage
Insu
ranc
e Co
mpa
ny K
enya
Lim
ited
Annu
al R
epor
t and
Fin
anci
al S
tate
men
ts 2
017

1. The directors submit their report together with the audited financial statements for the year ended 31 December 2017, which disclose the state of affairs of The Heritage Insurance Company Tanzania Limited (“the Company”).
2 INCORPORATION The Company is incorporated in Tanzania under the Companies Act as a limited liability company.
3 VISION
Our vision is to be the obvious and preferred choice of risk partner for buyers, intermediaries and reinsurers, and the point of reference for the Tanzania insurance industry.
4 MISSION
Our mission is to maintain a viable and sustainable risk transfer enterprise that maximizes returns for key stakeholder groups – our shareholders, business partners and staff.
5 PRINCIPAL ACTIVITIES
The Company is registered for general insurance business, which is its principal activity.
6 COMPOSITION OF THE BOARD OF DIRECTORS
The directors of the Company at the date of this report and who have served since 1 January 2017, except where otherwise stated, are:
Name Position Nationality Age Yogesh M. Manek Chairman Tanzanian 63 Nanalal L. Chohan Director Tanzanian 70 Michael L. du Toit Director South African 56 Juma V. Mwapachu Director Tanzanian 75 Peter N. Gethi Director Kenyan 52 Godfrey Kioi Director Kenyan 53 Ravi Singh Director South African 41
7 COMPANY SECRETARY
The Company’s Secretary as at the date of the report was Mrs. Gemma Moshy.
8 CORPORATE GOVERNANCE
The Board of Directors consists of 7 directors and 1 alternate director. None of the directors hold executive positions. The Board of Directors consists of 7 directors. None of the directors hold executive positions in the Company. The Board takes overall responsibility for the Company, including responsibility for identifying key risk areas, considering and monitoring investment decisions, considering significant financial matters, and reviewing the performance of management business plans and budgets. The Board is also responsible for ensuring that a comprehensive system of internal control policies and procedures is operative, and for compliance with sound corporate governance principles.
DIRECTOR’S REPORT
The
Her
itage
Insu
ranc
e Co
mpa
ny K
enya
Lim
ited
Annu
al R
epor
t and
Fin
anci
al S
tate
men
ts 2
017
111

The Board is required to meet at least four times a year. The Board delegates the day to day management of the business to the Chief Executive Officer assisted by the Management Team. The Management Team is invited to attend board meetings and facilitate the effective control of the Company’s operational activities, acting as a medium of communication and coordination between the various departments.
The Company is committed to the principles of effective corporate governance. The Directors also recognize the importance of integrity, transparency and accountability. During the year, the Board had the following sub-committees to ensure a high standard of corporate governance throughout the Company.
BOARD AUDIT AND RISK COMMITTEE
No. Name Position 1 Ravi Singh Chairman 2 Geetha Sivakumar Member 3 Michael L. du Toit Member 4 Peter N. Gethi Member
BOARD INVESTMENT COMMITTEE
No. Name Position 1 Yogesh M. Manek Chairman 2 Michael L. du Toit Member 3 Geetha Sivakumar Member
BOARD HUMAN RESOURCES AND REMUNERATION COMMITTEE
No. Name Position 1 Juma V. Mwapachu Chairman 2 Yogesh M. Manek Member 3 Godfrey Kioi Member
9 RISK MANAGEMENT AND INTERNAL CONTROL
The Board accepts final responsibility for the risk management and internal control systems of the Company. It is the task of management to ensure that adequate internal financial and operational control systems are developed and maintained on an ongoing basis in order to provide reasonable assurance regarding:
• The effectiveness and efficiency of operations; • The safeguarding of the Company’s assets; • Compliance with applicable laws and regulations; • The reliability of accounting records; • Business sustainability under normal as well as adverse conditions, and • Responsible behaviours towards all stakeholders.
The efficiency of any internal control system is dependent on the strict observance of prescribed measures. There is always a risk of non-compliance with such measures by staff. Whilst no system of internal control can provide absolute assurance against misstatement or losses, the Company’s system is designed to provide the Board with reasonable assurance that the procedures in place are operating effectively.
The Board assessed the internal control systems throughout the financial year ended 31 December 2017 and is of the opinion that they met accepted criteria.
DIRECTOR’S REPORT (CONT’D)CORPORATE GOVERNANCE (CONT’D)
112
The
Her
itage
Insu
ranc
e Co
mpa
ny K
enya
Lim
ited
Annu
al R
epor
t and
Fin
anci
al S
tate
men
ts 2
017

The Board performs risk and internal control assessment through the Board Audit and Risk Committee. The efficiency of any internal control system is dependent on the strict observance of prescribed measures. There is always a risk of non-compliance with such measures by staff. Whilst no system of internal control can provide absolute assurance against misstatement or losses, the Company’s system is designed to provide the Board with reasonable assurance that the procedures in place are operating effectively.
The Board assessed the internal control systems throughout the financial year ended 31 December 2017 and is of the opinion that they met accepted criteria.
The Board performs risk and internal control assessment through the Board Audit and Risk Committee.
10 CAPITAL STRUCTURE
The Company’s capital structure for the year is shown in Note 12 to the financial statements.
11 MANAGEMENT TEAM
The management of the Company is under the Chief Executive Officer, assisted by the following:
• Chief Financial Officer; • General Manager, • Human Resources Officer and • System Administration Manager.
12 SHAREHOLDERS OF THE COMPANY
The total number of shareholders during the year 2017 is 2 (2016: 2 shareholders). One director, Mr. Yogesh M. Manek has an indirect interest of 37.44% in the shares of the Company through his shareholding in MAC Group Tanzania Limited. No other director holds shares of the Company. The shares of the Company are held as follows:
13 FUTURE DEVELOPMENT PLANS
The Company will continue to improve its profitability through the introduction of innovative products and focusing on value-added customer services while carefully managing both costs and risks. The Company will continue to focus on improving productivity and introducing new products to the market.
Based on gross premium written in the current year, the Company is one of the leading private insurance Companies in Tanzania. After deducting reinsurance premium, the Company registered net earned premium of TShs 11,979 million
(2016: TShs 14,813 million). The directors believe that the Company is well placed to consolidate its position as a leading Company in the market during the next two to three years.
DIRECTOR’S REPORT (CONT’D)RISK MANAGEMENT AND INTERNAL CONTROL (CONT’D)
Name of the Shareholder Number of Shares held in 2017
Number of Shares held in 2016
Heritage Insurance Company Kenya Limited 48,000 42,000
MAC Group Tanzania Limited 32,000 28,000
80,000 70,000
The
Her
itage
Insu
ranc
e Co
mpa
ny K
enya
Lim
ited
Annu
al R
epor
t and
Fin
anci
al S
tate
men
ts 2
017
113
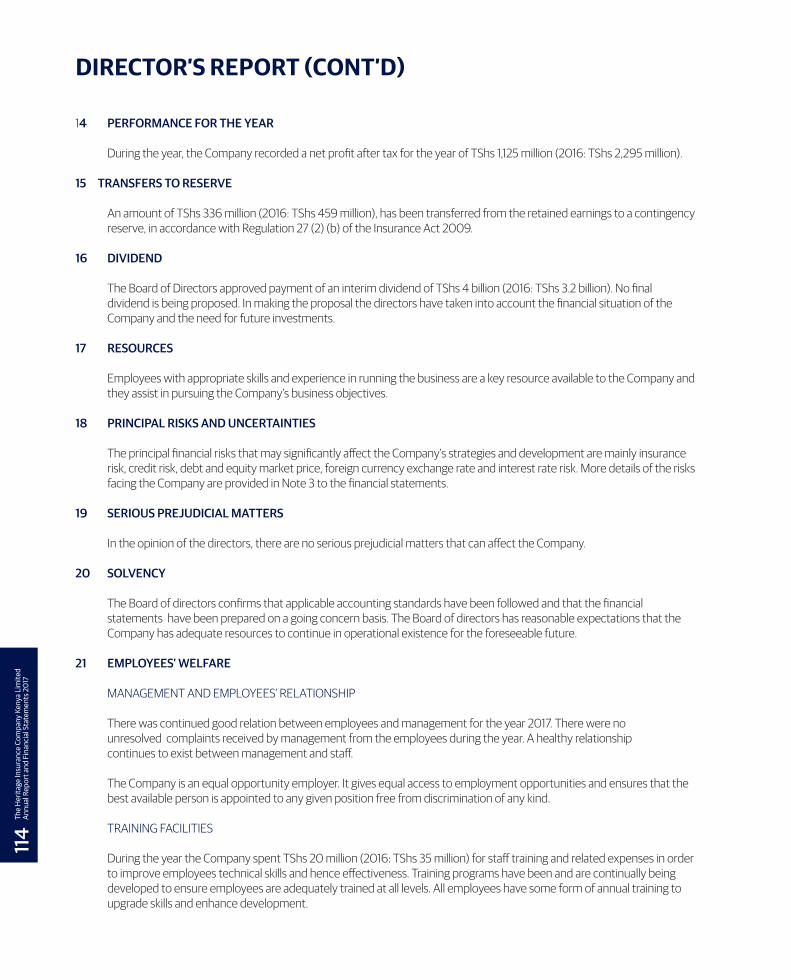
14 PERFORMANCE FOR THE YEAR
During the year, the Company recorded a net profit after tax for the year of TShs 1,125 million (2016: TShs 2,295 million).
15 TRANSFERS TO RESERVE
An amount of TShs 336 million (2016: TShs 459 million), has been transferred from the retained earnings to a contingency reserve, in accordance with Regulation 27 (2) (b) of the Insurance Act 2009.
16 DIVIDEND
The Board of Directors approved payment of an interim dividend of TShs 4 billion (2016: TShs 3.2 billion). No final dividend is being proposed. In making the proposal the directors have taken into account the financial situation of the Company and the need for future investments.
17 RESOURCES Employees with appropriate skills and experience in running the business are a key resource available to the Company and they assist in pursuing the Company’s business objectives.
18 PRINCIPAL RISKS AND UNCERTAINTIES
The principal financial risks that may significantly affect the Company’s strategies and development are mainly insurance risk, credit risk, debt and equity market price, foreign currency exchange rate and interest rate risk. More details of the risks facing the Company are provided in Note 3 to the financial statements.
19 SERIOUS PREJUDICIAL MATTERS
In the opinion of the directors, there are no serious prejudicial matters that can affect the Company.
20 SOLVENCY
The Board of directors confirms that applicable accounting standards have been followed and that the financial statements have been prepared on a going concern basis. The Board of directors has reasonable expectations that the Company has adequate resources to continue in operational existence for the foreseeable future.
21 EMPLOYEES’ WELFARE
MANAGEMENT AND EMPLOYEES’ RELATIONSHIP
There was continued good relation between employees and management for the year 2017. There were no unresolved complaints received by management from the employees during the year. A healthy relationship continues to exist between management and staff.
The Company is an equal opportunity employer. It gives equal access to employment opportunities and ensures that the best available person is appointed to any given position free from discrimination of any kind.
TRAINING FACILITIES
During the year the Company spent TShs 20 million (2016: TShs 35 million) for staff training and related expenses in order to improve employees technical skills and hence effectiveness. Training programs have been and are continually being developed to ensure employees are adequately trained at all levels. All employees have some form of annual training to upgrade skills and enhance development.
DIRECTOR’S REPORT (CONT’D)
114
The
Her
itage
Insu
ranc
e Co
mpa
ny K
enya
Lim
ited
Annu
al R
epor
t and
Fin
anci
al S
tate
men
ts 2
017

MEDICAL ASSISTANCE
All members of staff and their spouses up to a maximum of four beneficiaries (dependants) for each employee were availed medical services by the Company through medical insurance.
PERSONS WITH DISABILITIES
Applications for employment by disabled persons are always considered, bearing in mind the aptitude of the applicant concerned. In the event of members of staff becoming disabled, every effort is made to ensure that their employment with the Company continues and appropriate training is arranged. It is the policy of the Company that training, career development and promotion of persons with disabilities should, as far as possible, be identical to that of other employees.
EMPLOYEES BENEFIT PLAN
The Company pays contributions to publicly administered pension plan on mandatory basis which qualifies to be a defined contribution plan. The number of employees during the year was 51 (2016: 49).
22 GENDER PARITY
The Company had 51 employees, out of which 23 were female and 27 were male (2016: female 17, male 32).
23 RELATED PARTY TRANSACTIONS
All related party transactions and balances are disclosed in note 33 to these financial statements.
24 POLITICAL AND CHARITABLE DONATIONS
The Company did not make any political donations during the year. Donations made to charitable and other organizations during the year amounted to TShs 5.4 million (2016: TShs 5.4 million).
25 RELATIONSHIP WITH STAKEHOLDERS
The Company continued to maintain a good relationship with all stakeholders including the regulators.
26 CORPORATE SOCIAL RESPONSIBILITY (CSR)
The Company encourages its employees’ initiatives on participating in the CSR activities. Various activities were carried out during the year including visiting orphanage centers.
27 AUDITORS
The auditors, KPMG, have expressed their willingness to continue in office and are eligible for re-appointment. A resolution proposing reappointment of KPMG for the year ending 31 December 2018 will be put to the Annual General Meeting.
BY ORDER OF THE BOARD
Yogesh M. Manek Godfrey Kioi DATECHAIRMAN DIRECTOR
DIRECTOR’S REPORT (CONT’D)EMPLOYEES’ WELFARE (CONT’D)
The
Her
itage
Insu
ranc
e Co
mpa
ny K
enya
Lim
ited
Annu
al R
epor
t and
Fin
anci
al S
tate
men
ts 2
017
115

The Company’s directors are responsible for the preparation of financial statements that give a true and fair view of The Heritage Insurance Company Tanzania Limited comprising the statement of financial position as at 31 December 2017, and the statements of profit or loss and other comprehensive income, changes in equity and cash flows for the year then ended, and the notes to the financial statements, which include a summary of significant accounting policies and other explanatory notes, in accordance with International Financial Reporting Standards and in the manner required by the Companies Act, 2002.
The directors are also responsible for such internal control as they determine is necessary to enable the preparation of financial statements that are free from material misstatement, whether due to fraud or error, and for maintaining adequate accounting records and an effective system of risk management.
The directors have made an assessment of the ability of the Company to continue as going concern and have no reason to believe that the business will not be a going concern in the year ahead.
The auditors are responsible for reporting on whether the financial statements give a true and fair view in accordance with the applicable financial reporting framework.
Approval of financial statements:
The financial statements of The Heritage Insurance Company Tanzania Limited, as identified in the first paragraph, were approved by the board of directors and signed by
Yogesh M. Manek Godfrey Kioi DATECHAIRMAN DIRECTOR
STATEMENT OF DIRECTORS’ RESPONSIBILITIES

FINANCIAL STATEMENTS 2017
STATEMENT OF PROFIT OR LOSS FOR THE YEAR ENDED 31 DECEMBER 2017
2017 2016
TShs’000 TShs’000
Insurance premium revenue 42,858,245 49,318,132
Insurance premium ceded to reinsurers (30,878,756) (34,504,827)
Net insurance premium revenue 11,979,489 14,813,305
Investment income 2,089,714 2,006,280
Commission earned 4,032,174 4,404,896
Fair value gain/ (loss) 293,270 (587,969)
Other income 393,901 210,816
Net income 18,788,548 20,847,328
Insurance claims (16,358,446) (15,848,031)
Insurance claims recovered from reinsurers 10,737,194 9,099,908
Net insurance claims (5,621,252) (6,748,123)
Operating expenses (7,795,058) (5,861,716)
Commission expenses (3,694,687) (4,894,097)
Profit from operations 1,677,551 3,343,392
Share of profit of equity- accounted investee, net of tax - -
Profit before income tax 1,677,551 3,343,392
Taxation (552,177) (1,048,377)
Profit for the year 1,125,374 2,295,015
Other comprehensive income - -
Total comprehensive income for the year 1,125,374 2,295,015
The
Her
itage
Insu
ranc
e Co
mpa
ny K
enya
Lim
ited
Annu
al R
epor
t and
Fin
anci
al S
tate
men
ts 2
017
117

FINANCIAL STATEMENTS 2017
STATEMENT OF FINANCIALPOSITION AS AT 31 DECEMBER 2017
2017 2016
Note(s) TShs’000 TShs’000
REPRESENTED BY: Assets
Motor vehicle and equipment 13 553,161 109,974
Equity investment at fair value through profit or loss (quoted) 14 2,182,498 2,169,574
Equity investment at fair value through profit or loss (unquoted) 15 598,805 969,574
Receivables arising out of direct insurance arrangements 3 - 5,713,085
Receivables arising out of reinsurance arrangements 3 5,917,722 7,491,671
Reinsurers’ share of insurance liabilities 16 14,857,680 19,493,800
Deferred acquisition cost 17 1,206,301 1,595,126
Deferred tax asset 18 1,358,490 862,335
Income tax recoverable 225,234 513,635
Other receivables 19 256,932 197,986
Government securities at fair value through profit or loss 20 4,016,447 3,386,764
Government securities at amortized costs - 976,526
Corporate bonds at fair value through profit or loss 21 145,956 122,863
Deposits with financial institutions 22 24,234,414 19,680,419
Cash and bank balances 23 1,070,394 1,136,190
Total Assets 56,624,034 64,419,853
LIABILITIES
Insurance contract liabilities 24 13,842,659 12,794,734
Unearned premiums 25 12,152,613 19,230,359
Payables arising from reinsurance arrangements 26 5,844,269 11,449,133
Deferred acquisition income 17 1,287,236 1849,389
Creditors arising from direct insurance arrangements 838,282 -
Other payables 27 6,915,280 1,477,917
Total liabilities 40,880,339 46,801,532
EQUITY
Share capital 12 8,000,000 7,000,000
Contingency reserve 6,170,952 5,834,656
Retained earnings 1,572,743 4,783,655
Total equity and liabilities 15,743,695 17,618,321
The financial statements were approved for issue by the board of directors and signed on its behalf by:
Yogesh M. Manek Godfrey Kioi Shanmugarajan NatarajanCHAIRMAN DIRECTOR CHIEF EXECUTIVE OFFICER
118
The
Her
itage
Insu
ranc
e Co
mpa
ny K
enya
Lim
ited
Annu
al R
epor
t and
Fin
anci
al S
tate
men
ts 2
017

Clas
s of
insu
ranc
e Bu
sines
sEn
gine
er-
ing
Fire
Indu
s-tr
ial
Liab
ility
Mar
ine
Mot
or
Com
mer
cial
Priv
ate
Pers
onal
Ac
cide
ntTh
eft
Wor
kmen
’sCo
mpe
nsat
ion
Misc
ella
neou
s 20
17
Tota
l20
16 To
tal
TShs
’00
0TS
hs’0
00
TShs
’00
0TS
hs’0
00
TShs
’00
0TS
hs’0
00
TShs
’00
0TS
hs’0
00
TShs
’00
0TS
hs’0
00
TShs
’00
0TS
hs’0
00
Gros
s pre
miu
ms w
ritte
n3,4
11,42
7 14
,170,
938
4,98
6,70
8 1,3
62,6
72
2,32
4,48
4 3,8
10,5
14
1,328
,512
31
1,558
10
3,192
3,9
70,4
93
35,78
0,49
9 48
,648
,228
Chan
ge in
gro
ss U
PR18
6,61
9 4,
830,
212
258,
973
147,0
40
452,
861
488,
565
(8,4
99)
19,15
7 113
,360
58
9,45
8
7,0
77,74
6 66
9,90
5
Gros
s ear
ned
prem
ium
s 3,
598,
046
19
,001
,150
5,
245,
680
1,5
09,
713
2,77
7,34
6 4,
299,
080
1,3
20,0
13
330,
715
216,
552
4,55
9,95
1 42
,858
,245
49
,318
,133
Less
: rei
nsur
ance
pay
able
3,
353,6
57
18,2
89,0
24
4,42
8,30
4 1,3
41,74
3 41
2,945
67
4,91
5 17
5,52
5 17
6,39
6 23
,317
2,0
02,9
30
30,8
78,75
6 34
,504
,826
Net
ear
ned
prem
ium
s24
4,38
9 71
2,12
7 81
7,377
16
7,969
2,
364,
400
3,
624,
165
1,144
,488
15
4,31
9 19
3,23
6 2,
557,0
20
11,9
79,4
89
14,8
13,3
07
Net
Writ
ten
286,
103
756,
658
906,
751
130,
277
2,023
,122
3,23
5,997
1,2
57,4
82
160,
935
90,2
14
2,435
,362
11,
282,
898
14,4
22,4
36
Gros
s clai
ms p
aid
317,2
72
8,61
3,408
18
4,00
3 14
8,07
3 83
2,421
2,4
69,5
11 54
0,61
2 18
6,10
1 47
,273
1,9
71,8
48
15,3
10,5
21
17,2
41,9
22
Chan
ge in
gro
ss o
/s cl
aims
4,92
9 (4
2,428
) (4
49)
(24,
883)
(23,8
46)
(493
,384
)42
,728
(112
,585
)14
8,02
5 1,5
49,8
19
1,047
,926
(1
,393
,891
)
Less
: Rei
nsur
ance
reco
vera
ble
269,
275
7,989
,094
15
2,035
48
,681
91
,927
19
6,06
1 34
0,49
1 10
3,51
2 44
,279
1,5
01,8
37
10,73
7,194
9,
099,
908
Net
clai
ms i
ncur
red
52,9
26
581,8
85
31,5
19
74,5
09
716,
647
1,780
,065
24
2,84
9 (2
9,99
6)15
1,019
2,
019
,830
5,
621,2
52
6,74
8,12
3
Com
miss
ion
rece
ivabl
e (5
28,19
4) (2
,874
,402
) (4
82,2
79)
(289
,980
)56
,589
(8
2,74
2)44
,765
(12,1
22)
(3,6
76)
(231
,580
) (4
,403
,621
) (4
,404
,896
)
Com
miss
ion
paya
ble
375,1
79
1,979
,119
311,8
86
148,
077
247,0
61
413,
576
216,
603
38,2
19
34,2
64
302,1
51
4,06
6,13
5 4,
894,
098
Expe
nses
of m
anag
emen
t 17
5,134
46
3,180
93
9,72
3 79
,747
1,220
,219
1,9
99,0
91
267,1
02
60,2
76
20,5
18
773,9
23
5,998
,914
5,8
97,2
89
Tota
l exp
ense
s and
co
mm
issio
ns22
,120
(4
32,10
3)76
9,33
0
(62,
155)
1,523
,869
2,
329,
925
528,
470
86
,373
51
,106
844,
494
5,66
1,428
6,
386,
491
Und
erw
ritin
g pr
ofit/
(loss
) 16
9,34
4 56
2,34
5 16
,528
15
5,61
5 12
3,88
5 (4
85,8
26)
373,
169
97,9
42
(8,8
89)
(307
,30
4)69
6,80
9 1,6
78,6
93
Key
ratio
s
Loss
ratio
22
%82
%4%
44%
30%
49%
21%
-19%
78%
79%
47%
47%
Com
miss
ion
ratio
11%
14%
6%11%
11%11%
16%
12%
33%
8%11%
11%
Expe
nses
ratio
5%
3%19
%6
%52
%52
%20
%19
%20
%19
%17
%12
%
FIN
AN
CIA
L ST
ATEM
ENTS
20
17
SUPP
LEM
ENTA
RY IN
FORM
ATIO
N (T
AN
ZAN
IA)
GEN
ERA
L IN
SURA
NCE
BU
SIN
ESS
REV
ENU
E AC
COU
NT
2017
The
Her
itage
Insu
ranc
e Co
mpa
ny K
enya
Lim
ited
Annu
al R
epor
t and
Fin
anci
al S
tate
men
ts 2
017
119
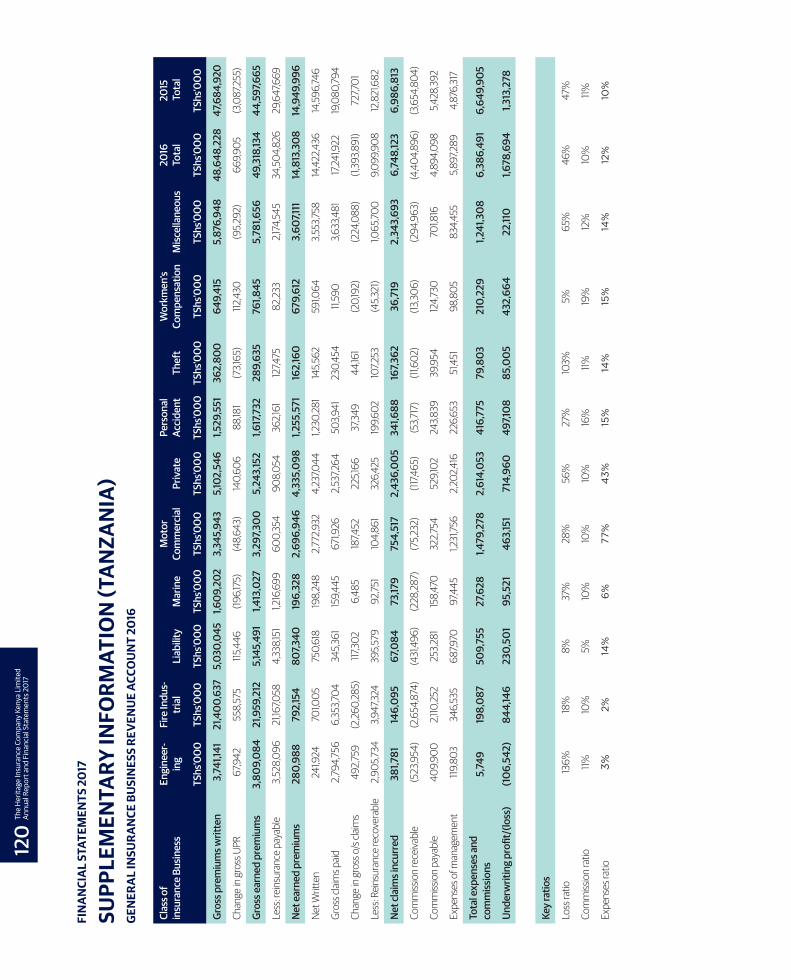
Clas
s of
insu
ranc
e Bu
sines
sEn
gine
er-
ing
Fire
Indu
s-tr
ial
Liab
ility
Mar
ine
Mot
or
Com
mer
cial
Priv
ate
Pers
onal
Ac
cide
ntTh
eft
Wor
kmen
’sCo
mpe
nsat
ion
Misc
ella
neou
s 20
16
Tota
l20
15 To
tal
TShs
’00
0TS
hs’0
00
TShs
’00
0TS
hs’0
00
TShs
’00
0TS
hs’0
00
TShs
’00
0TS
hs’0
00
TShs
’00
0TS
hs’0
00
TShs
’00
0TS
hs’0
00
Gros
s pre
miu
ms w
ritte
n3,
741,1
4121
,40
0,63
75,
030,
045
1,60
9,20
23,
345,
943
5,10
2,54
61,5
29,5
5136
2,80
064
9,41
55,
876,
948
48,6
48,2
2847
,684
,920
Chan
ge in
gro
ss U
PR67
,942
558,
575
115,4
46(19
6,17
5)(4
8,64
3)14
0,60
688
,181
(73,1
65)
112,4
30(9
5,29
2)66
9,90
5(3
,087
,255
)
Gros
s ear
ned
prem
ium
s 3,
809,
084
21,9
59,2
125,
145,
491
1,413
,027
3,29
7,30
05,
243,
152
1,617
,732
289,
635
761,8
455,
781,6
5649
,318
,134
44,5
97,6
65
Less
: rei
nsur
ance
pay
able
3,
528,
096
21,16
7,058
4,33
8,15
11,2
16,6
9960
0,35
490
8,05
436
2,161
127,4
7582
,233
2,174
,545
34,5
04,8
2629
,647
,669
Net
ear
ned
prem
ium
s28
0,98
879
2,15
480
7,340
196,
328
2,69
6,94
64,
335,
098
1,255
,571
162,
160
679,
612
3,60
7,111
14,8
13,3
08
14,9
49,9
96
Net
Writ
ten
241,9
2470
1,005
750,
618
198,
248
2,77
2,932
4,23
7,044
1,230
,281
145,
562
591,0
643,
553,7
5814
,422
,436
14,5
96,74
6
Gros
s clai
ms p
aid
2,79
4,75
66,
353,7
0434
5,36
115
9,44
567
1,926
2,53
7,264
503,9
4123
0,45
411,
590
3,633
,481
17,2
41,9
2219
,080
,794
Chan
ge in
gro
ss o
/s cl
aims
492,
759
(2,2
60,2
85)
117,3
026,
485
187,4
5222
5,166
37,3
4944
,161
(20,
192)
(224
,088
)(1,
393,8
91)
727,7
01
Less
: Rei
nsur
ance
reco
vera
ble
2,90
5,73
43,9
47,3
2439
5,57
992
,751
104,
861
326,
425
199,
602
107,2
53(4
5,32
1)1,0
65,70
09,
099,
908
12,8
21,6
82
Net
clai
ms i
ncur
red
381,7
8114
6,0
9567
,084
73,17
975
4,51
72,
436,
00
534
1,688
167,
362
36,7
192,
343,
693
6,74
8,12
36,
986,
813
Com
miss
ion
rece
ivabl
e (5
23,9
54)
(2,6
54,8
74)
(431
,496
)(2
28,2
87)
(75,
232)
(117,4
65)
(53,7
17)
(11,6
02)
(13,3
06)
(294
,963
)(4
,404
,896
)(3
,654
,804
)
Com
miss
ion
paya
ble
409,
900
2,110
,252
253,
281
158,
470
322,
754
529,1
0224
3,839
39,9
5412
4,73
070
1,816
4,89
4,09
85,4
28,3
92
Expe
nses
of m
anag
emen
t 119
,803
346,
535
687,9
7097
,445
1,231
,756
2,20
2,416
226,
653
51,4
5198
,805
834,
455
5,897
,289
4,87
6,31
7
Tota
l exp
ense
s and
co
mm
issio
ns5,
749
198,
087
509,
755
27,6
281,4
79,2
782,
614,
053
416,
775
79,8
0321
0,22
91,2
41,3
08
6,38
6,49
16,
649,
905
Und
erw
ritin
g pr
ofit/
(loss
) (1
06,
542)
844,
146
230,
501
95,5
2146
3,15
171
4,96
049
7,10
885
,00
543
2,66
422
,110
1,678
,694
1,313
,278
Key
ratio
s
Loss
ratio
13
6%18
%8%
37%
28%
56%
27%
103%
5%65
%46
%47
%
Com
miss
ion
ratio
11%
10%
5%10
%10
%10
%16
%11%
19%
12%
10%
11%
Expe
nses
ratio
3%2%
14%
6%
77%
43%
15%
14%
15%
14%
12%
10%
FIN
AN
CIA
L ST
ATEM
ENTS
20
17
SUPP
LEM
ENTA
RY IN
FORM
ATIO
N (T
AN
ZAN
IA)
GEN
ERA
L IN
SURA
NCE
BU
SIN
ESS
REV
ENU
E AC
COU
NT
2016
120
The
Her
itage
Insu
ranc
e Co
mpa
ny K
enya
Lim
ited
Annu
al R
epor
t and
Fin
anci
al S
tate
men
ts 2
017

PERSONAL ACCIDENT
because we believe in24-hour worldwide cover

NOTES

TRAVEL INSURANCE
because we believe in covering you home and away

A member of
Insurance CompanyHeritage
heritageinsurance.co.ke


![NATIONAL HOSPITAL INSURANCE FUND ACT - Kenya Law · PDF fileLAWS OF KENYA NATIONAL HOSPITAL INSURANCE FUND ACT No. 9 of 1998 Revised Edition 2012 [1998] Published by the National Council](https://img.pdfslide.net/doc/110x75/5a7a5ca47f8b9a0d098c7b5b/national-hospital-insurance-fund-act-kenya-law-laws-of-kenya-national-hospital.jpg)