Embed Size (px)
Citation preview
2014: Volume 4, Number 3
A publication of the Centers for Medicare & Medicaid Services,Office of Information Products & Data Analytics
The HHS-HCC Risk Adjustment Model for Individual and Small Group Markets
under the Affordable Care ActJohn Kautter,1 Gregory C. Pope,1 Melvin Ingber,1 Sara Freeman,1
Lindsey Patterson,1 Michael Cohen,2 and Patricia Keenan2
1RTI International 2Centers for Medicare & Medicaid Services
Abstract: Beginning in 2014, individuals and small businesses are able to purchase private health insurance through competitive Marketplaces. The Affordable Care Act (ACA) provides for a program of risk adjustment in the individual and small group markets in 2014 as Marketplaces are implemented and new market reforms take effect. The purpose of risk adjustment is to lessen or eliminate the influence of risk selection on the premiums that plans charge. The risk adjustment methodology includes the risk adjustment model and the risk transfer formula.
This article is the second of three in this issue of the Review that describe the Department of Health and Human Services (HHS) risk adjustment methodology and focuses on the risk adjustment model. In our first companion article, we discuss the key issues and choices in developing the methodology. In this article, we present the risk adjustment model, which is named the HHS-Hierarchical Condition Categories (HHS-HCC) risk adjustment model. We first summarize the
HHS-HCC diagnostic classification, which is the key element of the risk adjustment model. Then the data and methods, results, and evaluation of the risk adjustment model are presented. Fifteen separate models are developed. For each age group (adult, child, and infant), a model is developed for each cost sharing level (platinum, gold, silver, and bronze metal levels, as well as catastrophic plans). Evaluation of the risk adjustment models shows good predictive accuracy, both for individuals and for groups. Lastly, this article provides examples of how the model output is used to calculate risk scores, which are an input into the risk transfer formula. Our third companion paper describes the risk transfer formula.
Keywords: risk adjustment, affordable care act, ACA, risk score, hierarchical condition categories, HHS-HCC model, plan liability, predict healthcare expenditures, health insurance marketplaces
ISSN: 2159-0354
doi: http://dx.doi.org/10.5600/mmrr.004.03.a03
Kautter, J., Pope, G. C., Ingber, M., et al. E1
MMRR 2014: Volume 4 (3)
Medicare & Medicaid Research Review2014: Volume 4, Number 3
Mission Statement
Medicare & Medicaid Research Review is a peer- reviewed, online journal reporting data and research that informs current and future directions of the Medicare, Medicaid, and Children’s Health Insurance programs. The journal seeks to examine and evaluate health care coverage, quality and access to care for beneficiaries, and payment for health services.
http://www.cms.gov/MMRR/
Centers for Medicare & Medicaid ServicesMarilyn Tavenner
Administrator
Editor-in-ChiefDavid M. Bott, Ph.D.
The complete list of Editorial Staff and
Editorial Board members may be found on the MMRR Web site (click link):
MMRR Editorial Staff Page
Contact: [email protected]
Published by the Centers for Medicare & Medicaid Services.
All material in the Medicare & Medicaid Research
Review is in the public domain and may be duplicated
without permission. Citation to source is requested.
Introduction
Beginning in 2014, individuals and small businesses are able to purchase private health insurance through competitive Marketplaces. Issuers must follow certain rules to participate in the markets, for example, in regard to the premiums they can charge enrollees and also not being allowed to refuse insurance to anyone or vary enrollee premiums based on their health. Enrollees in individual market health plans through the Marketplaces may be eligible to receive premium tax credits to make health insurance more affordable and financial assistance to cover cost sharing for health care services.
This article is the second in a series of three related articles in this issue of Medicare & Medicaid Research Review that describe the Department of Health and Human Services (HHS)-developed risk adjustment methodology for the individual and small group markets established by the Affordable Care Act (ACA) of 2010. The risk adjustment methodology consists of a risk adjustment model and a risk transfer formula. The risk adjustment model uses an individual’s demographics and diagnoses to determine a risk score, which is a relative measure of how costly that individual is anticipated to be. The risk transfer formula averages all individual risk scores in a risk adjustment covered plan, makes certain adjustments, and calculates the funds transferred between plans. Risk transfers are intended to offset the effects of risk selection on plan costs while preserving premium differences due to factors such as actuarial value differences. This article describes the risk adjustment model. See our companion article (Pope et al., 2014) for a description of the risk transfer formula. Another companion article (Kautter, Pope, and Keenan, 2014) discusses the
Kautter, J., Pope, G. C., Ingber, M., et al. E2
MMRR 2014: Volume 4 (3)
key issues and choices in developing the ACA risk adjustment methodology.1
HHS will use this risk adjustment methodology when operating risk adjustment on behalf of a state. In 2014, the HHS methodology will be used in all states except one (Massachusetts), and it will apply to all non-grandfathered plans2 both inside and outside of the Marketplaces in the individual and small-group markets in each state.
The organization of this article is as follows. We first summarize the Hierarchical Condition Categories (HCC) diagnostic classification used for the risk adjustment model, which we designate the HHS-HCC diagnostic classification to distinguish it from the Centers for Medicare & Medicaid Services (CMS) HCC, or CMS-HCC, classification used in Medicare risk adjustment (Pope et al., 2004). Then the data and methods, results, and evaluation for the risk adjustment model are presented. Finally, we provide examples of how the model output is used to calculate risk scores, which are an input into the risk transfer formula.
HHS-HCC Diagnostic Classification
The basis of the HHS-HCC risk adjustment model is using health plan enrollee diagnoses (and demographics) to predict medical expenditure risk. To obtain a clinically meaningful and statistically stable system, the tens of thousands of ICD-9-CM codes used to capture diagnoses must be grouped into a smaller number of organized categories that produce a diagnostic profile of each person. The diagnostic classification is key in determining the ability of a risk adjustment model
1 For general background on risk adjustment, risk transfers (“risk equalization”), and risk selection, see van de Ven and Ellis (2000), van de Ven and Schut (2011), Van de Ven (2011), and Breyer, Bundorf, and Pauly (2012).
2 Grandfathered plans are those that were in existence on March 23, 2010, and have not been changed in ways that substantially cut benefits or increase costs for enrollees. Grandfathered plans are exempted from many of the changes required under the Affordable Care Act.
to distinguish high from low cost individuals. The classification also determines the sensitivity of the model to intentional or unintentional variations in diagnostic coding, an important consideration in real-world risk adjustment.
The starting point for the HHS-HCCs was the Medicare CMS-HCCs. The CMS-HCCs had to be adapted into the HHS-HCCs for ACA risk adjustment for three main reasons:
1. Prediction Year—The CMS-HCC risk adjustment model uses base year diagnoses and demographic information to predict the next year’s spending. The HHS-HCC risk adjustment model uses current year diagnoses and demographics to predict the current year’s spending. Medical conditions may have different implications in terms of current year costs and future costs; selection of HCCs for the risk adjustment model should reflect those differences.
2. Population—The CMS-HCCs were developed using data from the aged (age ≥ 65) and disabled (age < 65) Medicare populations. For some conditions, such as pregnancy and neonatal complications, the sample size in the Medicare population is quite low, whereas sample sizes in the commercially insured population are larger. HCCs were re-examined to better reflect salient medical conditions and cost patterns for adult, child, and infant subpopulations in the commercial population.
3. Type of Spending—The CMS-HCCs are configured to predict non-drug medical spending. The HHS-HCCs predict the sum of medical and drug spending. Also, the CMS-HCCs predict Medicare provider payments while the HHS-HCCs predict commercial insurance payments.
E3Kautter, J., Pope, G. C., Ingber, M., et al.
MMRR 2014: Volume 4 (3)
Risk Adjustment Model HHS-HCCs
There are 264 HHS-HCCs in the full diagnostic classification, of which a subset is included in the HHS risk adjustment model. The criteria for including HCCs in the model are now described. These criteria were sometimes in conflict and tradeoffs had to be made among them in assessing whether to include specific HCCs in the HHS risk adjustment model.
Criterion 1—Represent clinically-significant, well-defined, and costly medical conditions that are likely to be diagnosed, coded, and treated if they are present.
Criterion 2—Are not especially subject to discretionary diagnostic coding or “diagnostic discovery” (enhanced rates of diagnosis through population screening not motivated by improved quality of care).
Criterion 3—Do not primarily represent poor quality or avoidable complications of medical care.
Criterion 4—Identify chronic, predictable, or other conditions that are subject to insurer risk selection, risk segmentation, or provider network selection, rather than random acute events that represent insurance risk.
Following an extensive review process, we selected 127 HHS-HCCs to be included in the HHS risk adjustment model (see Appendix Exhibit A1 for a listing of the 127 HHS-HCCs). Finally, to balance the competing goals of improving predictive power and limiting the influence of discretionary coding, a subset of HHS-HCCs in the risk adjustment model were grouped into larger aggregates, in other words “grouping” clusters of HCCs together as a single condition with a single coefficient that can only be counted once. After grouping, the number of HCC factors included in the model was effectively reduced from 127 to 100.
Data and Methods
In this section we describe the data and methods used for development of the HHS-HCC risk adjustment model. We first discuss the choice of prospective versus concurrent risk adjustment. We then discuss the definition and data source for the concurrent modeling sample. Model variables, including expenditures, demographics, and diagnoses are defined. Finally, the model estimation and evaluation strategies are discussed.
Model Type
The HHS-HCC risk adjustment model is a concurrent model. A concurrent model uses diagnoses from a time period to predict cost in that same period. This is in contrast to a prospective model, which uses diagnoses from a base period to predict costs in a future period. While a prospective model is used for the Medicare Advantage program, we developed a concurrent model for the HHS risk adjustment methodology because, for implementation in 2014, prior year (2013) diagnoses data will not be available. In addition, unlike Medicare, people may move in and out of enrollment in the individual and small group markets, so prior year diagnostic data will not be available for all enrollees even after 2014.
Data
The calibration sample for the HHS-risk adjustment model consists of 2010 Truven MarketScan® Commercial Claims and Encounter data. The MarketScan® data is a large, well-respected, widely-used, nationally-dispersed proprietary database sourced from large employers and health plans. Employees, spouses, and dependents covered by employer-sponsored private health insurance are included. The MarketScan® sample includes enrollees from all 50 states and the District of Columbia. Although MarketScan®
Kautter, J., Pope, G. C., Ingber, M., et al. E4
MMRR 2014: Volume 4 (3)
represents the large employer rather than the small group/individual market, we know of no evidence that the relationship between diagnoses and relative expenditures differs significantly in the two markets, holding constant the generosity of plan benefits (essential health benefits and metal level). We compared the age, sex, and regional distribution of the MarketScan® sample to the expected ACA risk adjustment population (Trish, Damico, Claxton, Levitt, & Garfield, 2011; Buettgens, Garrett, & Holahan, 2010). We found that overall they are similar, although the MarketScan® data has more children and fewer young adults, and more sample members in the South and fewer in the Northeast and West than the expected risk adjustment population.3
Sample
An enrollee is included in the concurrent modeling sample if the enrollee has at least one month of 2010 enrollment, is enrolled in a preferred provider organization (PPO) or other fee-for-service (FFS) health plan,4 has no payments made on a capitated basis, has prescription drug coverage, and has integrated mental health/substance abuse coverage.5 The primary goals of the sample selection criteria were to ensure that 1) enrollees had complete expenditure and diagnosis data, 2) enrollees included those entering (e.g., newborns) and exiting (e.g., decedents) enrollment during the year, and 3) enrollees had health care coverage
3 As discussed below, we develop separate models for adults, children, and infants, which avoids any influence of the larger proportion of children in the MarketScan® data on model parameter values for adults. Weighting the calibration data to improve correspondence with the risk adjustment population will be revisited in future recalibrations of the model as actual data on the age-gender and other characteristics of the ACA risk adjustment population become available.
4 Other fee-for-service health plans include, for example, indemnity, consumer-directed, and high-deductible health plans.
5 Additionally, mothers with bundled newborn claims, and newborns with no birth records, were excluded.
comparable to the essential health benefits under the ACA.
Expenditures
The HHS-HCC risk adjustment model predicts health care expenditures for which plans are liable, which exclude enrollee cost sharing. This is termed a plan liability risk adjustment model, which has been used in other payment systems, such as Medicare Part C and Part D (Pope et al., 2004; Kautter, Ingber, Pope, & Freeman, 2012). We considered predicting total expenditures and then adjusting to plan liability with a multiplicative plan actuarial value factor. However, this approach may not accurately capture plan liability levels due to the non-linear relationship of plan liability to total expenditures. Although alternative plan cost sharing designs exist, we define a standard benefit (plan liability cost sharing) design for each cost sharing level (platinum, gold, silver, and bronze metal levels, as well as catastrophic plans6) using the following elements. Plan liability is zero percent of total expenditures below the deductible, one minus the coinsurance percentage of total expenditures between the deductible and the out-of-pocket limit, and one hundred percent of total expenditures above the out-of-pocket limit. Thus, the standard benefit for each metal level is completely specified by a deductible, coinsurance rate, and out-of-pocket maximum.
Using the 2010 MarketScan® inpatient, outpatient, and drug services files, we summed total payments (submitted charges minus non-covered charges minus pricing discounts), which include enrollee cost sharing. We then trended the 2010 expenditures to 2014 by applying a constant annual growth rate. Once expenditures were trended, the standard benefit design parameters
6 While technically metal levels (platinum, gold, silver, bronze), and catastrophic plans differ, for purposes of this article, references to metal levels will include catastrophic plans.
Kautter, J., Pope, G. C., Ingber, M., et al. E5
MMRR 2014: Volume 4 (3)
(deductibles, coinsurance rates, out-of-pocket limits) were applied to simulate plan liability expenditures for each metal level. Plan liability expenditures were then annualized by dividing them by the fraction of months in 2010 that each beneficiary is enrolled in the plan (i.e., by the eligibility fraction). Annualized expenditures are the “per member per month” amount multiplied by 12. Annualized expenditures were not truncated.
Finally, plan liability expenditures were converted to relative plan liability expenditures, which are defined as plan liability expenditures divided by a denominator. A relative plan liability expenditure of 1.0 corresponds to the average plan liability expenditure for the calibration sample. The denominator was calculated as follows. For the entire calibration sample, we calculated the mean plan liability for each metal level and then took a weighted average of these means, where the weights were based on a forecasted distribution of enrollment in 2014 across the five metal levels. Going forward, we use the term “plan liability” to mean “relative plan liability.”
In short, we simulated plan liability expenditures for each metal tier from total expenditures for each sample member (that is, we applied different benefit structures to the same sample). An alternative approach would have been to model actual plan liability (payments) for enrollees in MarketScan® plans grouped into ACA metal tiers by the plans’ actual actuarial values. However, MarketScan® provides sufficient plan benefit information to calculate plan actuarial value for only a small fraction of its sample. Also, grouping plans by actuarial value would have led to different samples of individuals for each metal level model estimation, which would have reduced sample sizes for each model and led to differences in unmeasured factors across
metal level samples. Simulating plan liability on the full sample for each metal also means that (as intended) the model estimates do not reflect differential induced demand (moral hazard) across metals. For this reason, induced demand is accounted for in the risk transfer formula, as discussed in our companion article.
Demographics and Diagnoses
The HHS-HCC risk adjustment model uses 2010 beneficiary demographics and diagnoses to predict 2010 (trended to 2014) plan liability expenditures for each beneficiary. The demographic factors employed are age and sex. Age is measured as of the last month of enrollment, which in general results in infants aged 0 having been born in 2010.7 Age ranges were determined by the age distribution of the commercial population, as well as consideration of post 2014 market reform rules for the individual and small group markets. There are 18 age/sex categories for adults and 8 age/sex categories for children. How age and sex are incorporated into the infant model is described below. Adults are defined as ages 21+, children are ages 2–20, and infants are ages 0–1. The age categories for adult male and female are ages 21–24, 25–29, 30–34, 35–39, 40–44, 45–49, 50–54, 55–59, and 60+. The age categories for children male and female are ages 2–4, 5–9, 10–14, and 15–20.
ICD-9-CM person-level diagnoses from 2010 were used to create diagnosis groups (HCCs) for each beneficiary in the sample. Only diagnosis codes from sources allowable for risk adjustment when HHS is operating on behalf of a state are included in the diagnosis-level file. The goal
7 More specifically, MarketScan® includes age on the first day of enrollment for that month, and this is how age is measured. Note that if age for an infant is measured as zero and the infant has no birth records (in the 2010 MarketScan® database), we excluded the infant from the sample.
Kautter, J., Pope, G. C., Ingber, M., et al. E6
MMRR 2014: Volume 4 (3)
of the restrictions on source of diagnoses is to improve the quality, accuracy, and auditability of diagnoses used for risk adjustment. For example, clinical laboratory diagnoses, which include “rule outs” and diagnoses not verified by a clinician, were excluded. Allowable diagnoses include those from inpatient hospital claims, outpatient facility claims (hospital outpatient, rural health clinic, federally qualified health center, and community mental health clinic), and professional claims (diagnoses are generally not available on prescription drug claims, including for the MarketScan® data). In addition, diagnoses from outpatient facility claims and professional claims are restricted to those with at least one CPT/HCPCS procedure code8 corresponding generally to face-to-face encounters with a clinician.
Subpopulations
Due to the inherent clinical and cost differences in the adult, child, and infant populations, we developed separate risk adjustment models for each group. The adult and child models have similar specifications, with age/sex demographic categories and HCCs (individual HCCs and aggregate HCC groupings) predicting annualized plan liability expenditures.
However, infants have low frequencies for most HCCs leading to unstable parameter estimates in an additive model. Because of this, the infant model utilizes a categorical approach in which infants are assigned a birth maturity (by length of gestation and birth weight) or Age 1 category, and a disease severity category (based on HCCs other than birth maturity). There are four Age 0 birth maturity categories—Extremely
8 CPT® is the Current Procedural Terminology maintained by the American Medical Association, and HCPCS is the Healthcare Common Procedure Coding System maintained by the Centers for Medicare and Medicaid Services.
Immature; Immature; Premature/Multiples; Term—and a single Age 1 Maturity category. Age zero infants are assigned to one of the four birth maturity categories and age one infants are assigned to the Age 1 Maturity category.
There are 5 disease severity categories based on the clinical severity and associated costs of the non-maturity HCCs: Severity Level 5 (Highest Severity) to Severity Level 1 (Lowest Severity).9 Examples of severity level assignments are:
• Level5—HCC137(HypoplasticLeftHeartSyndrome and Other Severe Congenital Heart Disorders);
• Level4—HCC127(Cardio-RespiratoryFailure and Shock, Including Respiratory Distress Syndromes);
• Level3—HCC45(IntestinalObstruction);• Level2—HCC69(AcquiredHemolytic
Anemia, Including Hemolytic Disease of Newborn); and,
• Level1—HCC37(ChronicHepatitis).
All infants (age 0 or 1) are assigned to a disease severity category based on the single highest severity level of any of their non-maturity HCCs. HCCs not appropriately diagnosed for infants—such as pregnancy and psychiatric HCCs—were excluded from the infant disease severity categories. Infants with no severity HCCs are assigned to Level 1.
When cross-classified, the 5 maturity categories and 5 severity categories define 25 mutually-exclusive categories. Each infant is assigned to 1 of the 25 categories. Finally, there are two additive terms for sex, for age zero males and age one males.10
9 In assigning HCCs to infant severity levels, the HCC hierarchies are maintained. If two HCCs are in a hierarchical relationship, the higher-ranking HCC is assigned to the same or a higher severity level than the lower-ranking HCC.
10 Male infants have higher costs than female infants due to increased morbidity and neonatal mortality.
Kautter, J., Pope, G. C., Ingber, M., et al. E7
MMRR 2014: Volume 4 (3)
Model Estimation
All risk adjustment models are estimated by weighted least squares regression.11 The dependent variable is annualized, simulated, plan liability expenditures, and the weight is the person-specific, sample eligibility fraction. Annualization and weighting—which are equivalent on an annual basis to predicting per member per month expenditures weighting by the number of months each individual is eligible for the sample—appropriately adjusts for months of enrollee eligibility in the sample. Independent variables for the adult model include 18 age/sex demographic categories, 114 HCC diagnosis groups, and 16 disease interactions (discussed below), and for the child model, 8 age/sex demographic categories and 119 HCC diagnosis groups. For the infant model, independent variables include 25 categories defined by birth maturity for age 0, age 1, and diagnostic severity, and 2 age/sex demographic additive terms.
In each adult and child regression model, we include a binary indicator variable for each individual HCC that is not included in an aggregate HCC grouping. In addition, we include a binary indicator for each aggregate HCC grouping. In the latter case, it indicates whether or not the enrollee had at least one HCC in the aggregate HCC grouping.
In addition, we impose coefficient constraints to ensure that the principle that higher-clinically-ranked HCCs in an HCC hierarchy have at least as large incremental predicted expenditures as lower-ranked HCCs is met. Constraints generally have the effect of averaging two or more groups together when, unconstrained, there is a violation of clinical logic.
11 We investigated various non-linear approaches to model estimation that might have been better able to account for the non-linearities in plan liability. However, these models suffer from several important shortcomings, including complexity, lack of transparency, and not predicting mean expenditures accurately for all diagnostic and demographic subgroups, or even for the overall sample. We concluded that, evaluated against a broad range of criteria for real-world risk adjustment, weighted least squares is the preferable estimation method.
Disease Interactions
For the adult models, the inclusion of disease interaction terms better reflected plan liability across metal levels and improved model performance.12 Based on empirical findings, as well as clinical review, we developed a set of eight diagnostic markers of severe illness: HCC 2 (Septicemia, Sepsis, Systemic Inflammatory Response Syndrome/Shock); HCC 42 (Peritonitis/Gastrointestinal Perforation/Necrotizing Entercolitis); HCC 120 (Seizure Disorders and Convulsions); HCC 122 (Non-Traumatic Coma, Brain Compression/Anoxic Damage); HCC 125 (Respirator Dependence/Tracheostomy Status); HCC 126 (Respiratory Arrest); HCC 127 (Cardio-Respiratory Failure and Shock, Including Respiratory Distress Syndromes); and HCC 156 (Pulmonary Embolism and Deep Vein Thrombosis). A severe illness indicator variable was defined as having at least one of the eight diagnostic markers of severe illness.13
The severe illness indicator was interacted with individual HCCs and aggregate HCC groupings.14 The disease interactions that met minimum sample size and incremental predicted expenditure thresholds were included in the model. The incremental predicted expenditures for the disease interactions were categorized into medium and high cost categories. For each category, we included a binary indicator variable in the regression model for whether or not the enrollee had at least one disease interaction in the category. Finally, a hierarchy was imposed such that if an enrollee was in the high cost disease interaction category, he/she was excluded from the medium cost category.
12 Disease interactions were empirically unimportant in the child model and were not included. The infant model is a categorical model.
13 The diagnostic markers of severe illness are also included in the model not interacted with other diagnoses (HCCs).
14 When we examined a comprehensive set of interactions, high frequency, high incremental expenditure disease interactions tended to include severe illnesses.
Kautter, J., Pope, G. C., Ingber, M., et al. E8
MMRR 2014: Volume 4 (3)
In sum, a person can have, at most, one disease interaction coefficient/incremental predicted expenditure. This constraint was imposed because clinical reasoning and empirical evidence indicated that a single one of the diagnostic markers sufficed to distinguish the most severely ill patients among those with the underlying interacted diagnoses.
Predicted Plan Liability Expenditures
For an enrollee in a given metal level plan, the total predicted plan liability expenditures is the sum of the incremental predicted plan liability expenditures (coefficients) from the relevant metal level model. For adults and children, this is the sum of the age/sex, HCC, and disease interaction coefficients.15 For infants, this is the sum of the maturity/disease-severity category and additive sex coefficients.
Recall that plan liability expenditures were converted to relative plan liability expenditures, resulting in a relative plan liability expenditure of 1.0 for the average plan liability expenditure in the calibration sample. Converting “actual” plan liability expenditures to relatives automatically converts “predicted” plan liability expenditures to relatives. Going forward, we use the term “predicted plan liability” to mean “predicted relative plan liability.”
Model Evaluation
The predictive accuracy of a risk adjustment model for individuals is typically judged by the percentage of variation in individual expenditures explained by the model (as measured by the R-squared statistic). To test the performance of the HHS-HCC risk adjustment models for subgroups, we calculate the expenditure ratio of predicted to actual weighted mean plan liability expenditures, which is commonly termed the “predictive ratio.”
15 The child risk adjustment models do not have disease interactions.
If prediction is perfect, mean predicted will equal mean actual expenditures, and the predictive ratio is 1.00. As a rule of thumb, predictive ratios with a margin of error of 10 percent in either direction (0.90 ≤ predictive ratio ≤ 1.10) indicate reasonably accurate prediction (Kautter et al., 2012).
Results
Sample Exclusions
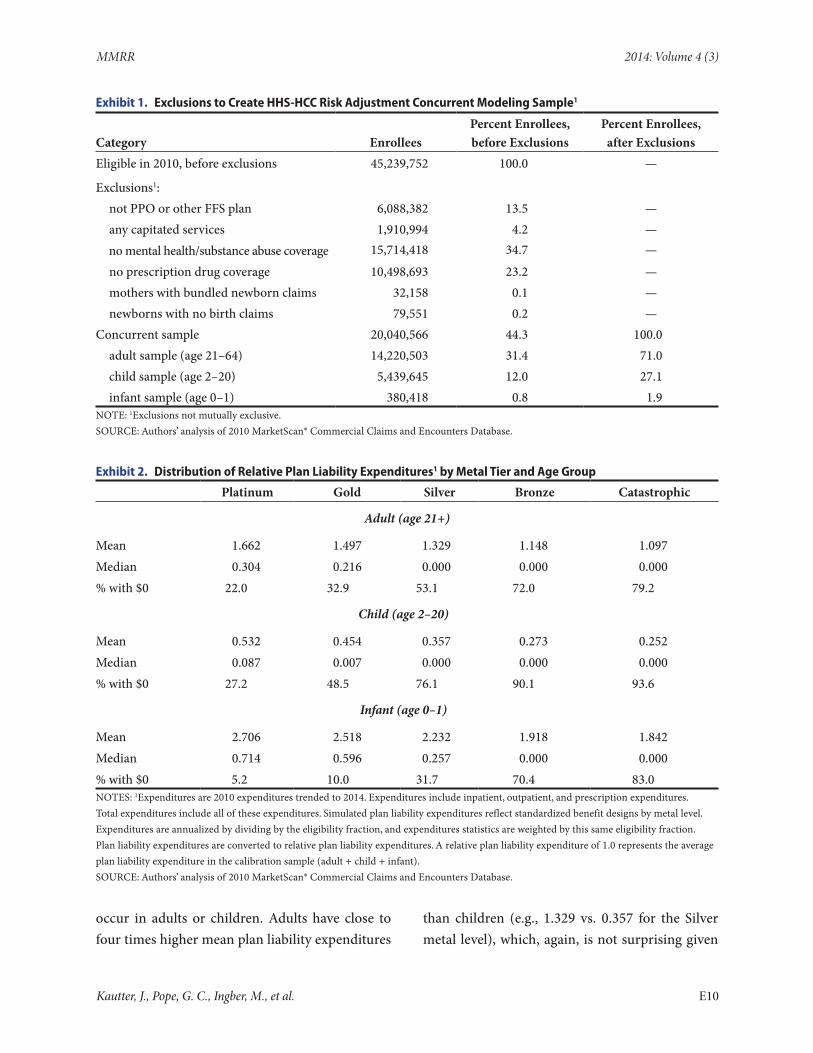
As shown in Exhibit 1, the 2010 data included 45,239,752 enrollees. After all exclusionary criteria were imposed, the concurrent sample comprised 20,040,566 enrollees, which is 44.3 percent of the original sample. Adults, children, and infants comprise, respectively, 71.0 percent, 27.1 percent, and 1.9 percent of the concurrent sample.
Plan Liability Expenditures
Mean simulated plan liability expenditures (annualized, weighted) per enrolled beneficiary ranges from 1.369 (36.9% higher than average) for the platinum cost sharing level to 0.877 (12.3% lower than average) for the catastrophic cost sharing level (shown in Exhibit 2, decomposed by adult/child/infant as well as by metal level). The median ranges from 0.216 for platinum to 0.000 for silver, bronze, and catastrophic.16 The percentage of individuals with $0 plan liability increases from 16.9 percent for platinum to 83.2 percent for catastrophic. Mean plan liability expenditures are highest for infants (e.g., 2.232 for silver mean plan liability), which is not surprising given infants have costs related to hospitalization at birth and can have severe and expensive conditions that do not
16 Every enrollee will have a positive plan liability risk score, regardless of whether he/she has a positive plan liability expenditure (the one exception is for children ages 2–9 without a risk adjustment model HHS-HCC and enrolled in a catastrophic plan—these enrollees will have a plan liability risk score of 0—see section below “Child Risk Adjustment Models” and Exhibit 5 and Appendix Exhibit A2).
Kautter, J., Pope, G. C., Ingber, M., et al. E9
MMRR 2014: Volume 4 (3)
Exhibit 1. Exclusions to Create HHS-HCC Risk Adjustment Concurrent Modeling Sample1
Category EnrolleesPercent Enrollees, before Exclusions
Percent Enrollees, after Exclusions
Eligible in 2010, before exclusions 45,239,752 100.0 —
Exclusions1: not PPO or other FFS plan 6,088,382 13.5 — any capitated services 1,910,994 4.2 — no mental health/substance abuse coverage 15,714,418 34.7 —
no prescription drug coverage 10,498,693 23.2 — mothers with bundled newborn claims 32,158 0.1 — newborns with no birth claims 79,551 0.2 —Concurrent sample 20,040,566 44.3 100.0 adult sample (age 21–64) 14,220,503 31.4 71.0 child sample (age 2–20) 5,439,645 12.0 27.1 infant sample (age 0–1) 380,418 0.8 1.9NOTE: 1Exclusions not mutually exclusive.SOURCE: Authors’ analysis of 2010 MarketScan® Commercial Claims and Encounters Database.
Exhibit 2. Distribution of Relative Plan Liability Expenditures1 by Metal Tier and Age Group
Platinum Gold Silver Bronze Catastrophic
Adult (age 21+)
Mean 1.662 1.497 1.329 1.148 1.097Median 0.304 0.216 0.000 0.000 0.000% with $0 22.0 32.9 53.1 72.0 79.2
Child (age 2–20)
Mean 0.532 0.454 0.357 0.273 0.252Median 0.087 0.007 0.000 0.000 0.000% with $0 27.2 48.5 76.1 90.1 93.6
Infant (age 0–1)
Mean 2.706 2.518 2.232 1.918 1.842Median 0.714 0.596 0.257 0.000 0.000% with $0 5.2 10.0 31.7 70.4 83.0NOTES: 1Expenditures are 2010 expenditures trended to 2014. Expenditures include inpatient, outpatient, and prescription expenditures.Total expenditures include all of these expenditures. Simulated plan liability expenditures reflect standardized benefit designs by metal level.Expenditures are annualized by dividing by the eligibility fraction, and expenditures statistics are weighted by this same eligibility fraction.Plan liability expenditures are converted to relative plan liability expenditures. A relative plan liability expenditure of 1.0 represents the average plan liability expenditure in the calibration sample (adult + child + infant).SOURCE: Authors’ analysis of 2010 MarketScan® Commercial Claims and Encounters Database.
occur in adults or children. Adults have close to four times higher mean plan liability expenditures
than children (e.g., 1.329 vs. 0.357 for the Silver metal level), which, again, is not surprising given
Kautter, J., Pope, G. C., Ingber, M., et al. E10
MMRR 2014: Volume 4 (3)
that the onset of most chronic conditions are highly correlated with age.
HHS-HCCs
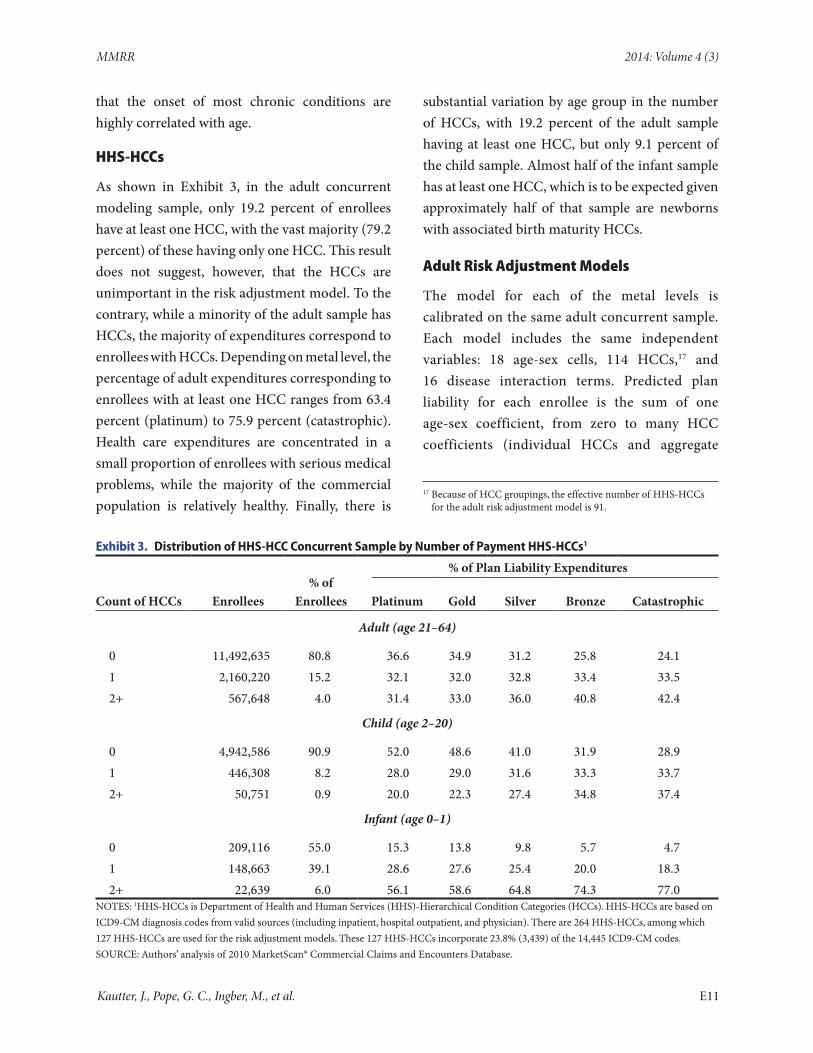
As shown in Exhibit 3, in the adult concurrent modeling sample, only 19.2 percent of enrollees have at least one HCC, with the vast majority (79.2 percent) of these having only one HCC. This result does not suggest, however, that the HCCs are unimportant in the risk adjustment model. To the contrary, while a minority of the adult sample has HCCs, the majority of expenditures correspond to enrollees with HCCs. Depending on metal level, the percentage of adult expenditures corresponding to enrollees with at least one HCC ranges from 63.4 percent (platinum) to 75.9 percent (catastrophic). Health care expenditures are concentrated in a small proportion of enrollees with serious medical problems, while the majority of the commercial population is relatively healthy. Finally, there is
substantial variation by age group in the number of HCCs, with 19.2 percent of the adult sample having at least one HCC, but only 9.1 percent of the child sample. Almost half of the infant sample has at least one HCC, which is to be expected given approximately half of that sample are newborns with associated birth maturity HCCs.
Adult Risk Adjustment Models
The model for each of the metal levels is calibrated on the same adult concurrent sample. Each model includes the same independent variables: 18 age-sex cells, 114 HCCs,17 and 16 disease interaction terms. Predicted plan liability for each enrollee is the sum of one age-sex coefficient, from zero to many HCC coefficients (individual HCCs and aggregate
17 Because of HCC groupings, the effective number of HHS-HCCs for the adult risk adjustment model is 91.
Exhibit 3. Distribution of HHS-HCC Concurrent Sample by Number of Payment HHS-HCCs1
% of Plan Liability Expenditures
Count of HCCs Enrollees% of
Enrollees Platinum Gold Silver Bronze Catastrophic
Adult (age 21–64)
0 11,492,635 80.8 36.6 34.9 31.2 25.8 24.11 2,160,220 15.2 32.1 32.0 32.8 33.4 33.52+ 567,648 4.0 31.4 33.0 36.0 40.8 42.4
Child (age 2–20)
0 4,942,586 90.9 52.0 48.6 41.0 31.9 28.91 446,308 8.2 28.0 29.0 31.6 33.3 33.72+ 50,751 0.9 20.0 22.3 27.4 34.8 37.4
Infant (age 0–1)
0 209,116 55.0 15.3 13.8 9.8 5.7 4.71 148,663 39.1 28.6 27.6 25.4 20.0 18.32+ 22,639 6.0 56.1 58.6 64.8 74.3 77.0
NOTES: 1HHS-HCCs is Department of Health and Human Services (HHS)-Hierarchical Condition Categories (HCCs). HHS-HCCs are based on ICD9-CM diagnosis codes from valid sources (including inpatient, hospital outpatient, and physician). There are 264 HHS-HCCs, among which 127 HHS-HCCs are used for the risk adjustment models. These 127 HHS-HCCs incorporate 23.8% (3,439) of the 14,445 ICD9-CM codes.SOURCE: Authors’ analysis of 2010 MarketScan® Commercial Claims and Encounters Database.
Kautter, J., Pope, G. C., Ingber, M., et al. E11
MMRR 2014: Volume 4 (3)
HCC groupings) subject to HCC hierarchies and constraints/groups, and zero or one severe illness disease interaction term. The model coefficients represent the incremental, not total, predicted plan liability expenditures of each risk marker in the model, given the other risk markers characterizing an individual. The dependent variable for each model is the annualized plan liability expenditures simulated according to a standard cost sharing design for that metal level.
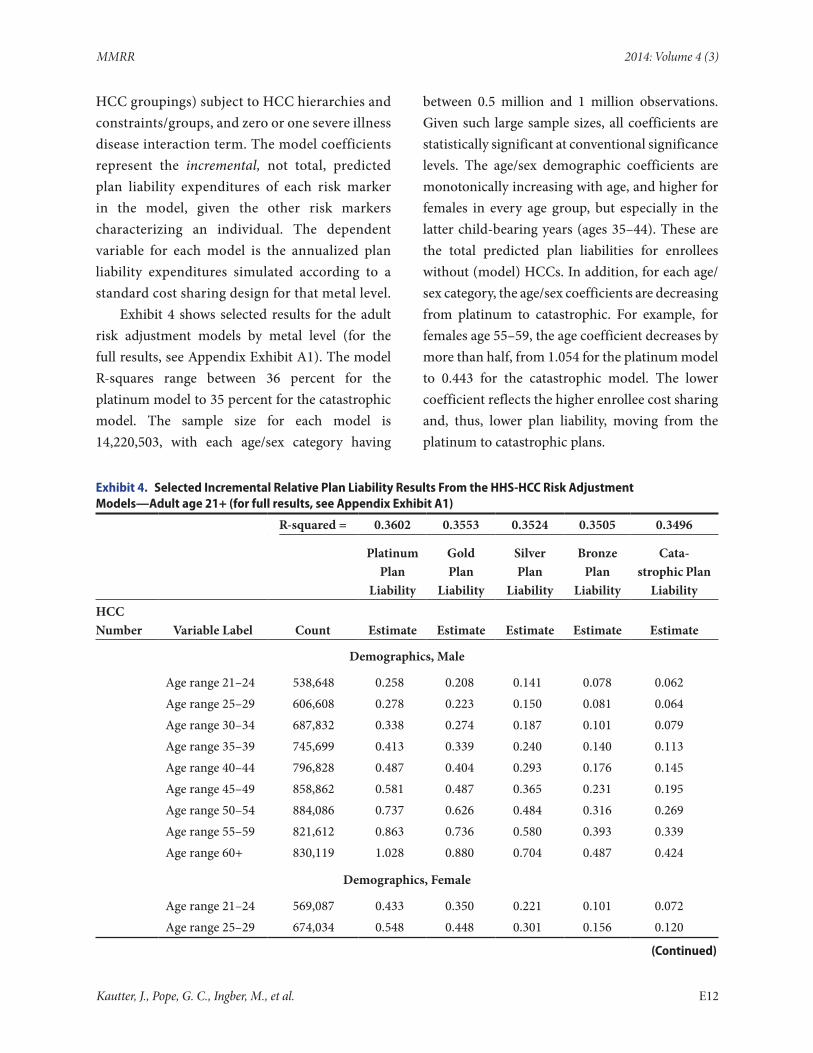
Exhibit 4 shows selected results for the adult risk adjustment models by metal level (for the full results, see Appendix Exhibit A1). The model R-squares range between 36 percent for the platinum model to 35 percent for the catastrophic model. The sample size for each model is 14,220,503, with each age/sex category having
between 0.5 million and 1 million observations. Given such large sample sizes, all coefficients are statistically significant at conventional significance levels. The age/sex demographic coefficients are monotonically increasing with age, and higher for females in every age group, but especially in the latter child-bearing years (ages 35–44). These are the total predicted plan liabilities for enrollees without (model) HCCs. In addition, for each age/sex category, the age/sex coefficients are decreasing from platinum to catastrophic. For example, for females age 55–59, the age coefficient decreases by more than half, from 1.054 for the platinum model to 0.443 for the catastrophic model. The lower coefficient reflects the higher enrollee cost sharing and, thus, lower plan liability, moving from the platinum to catastrophic plans.
Exhibit 4. Selected Incremental Relative Plan Liability Results From the HHS-HCC Risk Adjustment Models—Adult age 21+ (for full results, see Appendix Exhibit A1)
R-squared = 0.3602 0.3553 0.3524 0.3505 0.3496
Platinum Plan
Liability
Gold Plan
Liability
Silver Plan
Liability
Bronze Plan
Liability
Cata-strophic Plan
LiabilityHCC Number Variable Label Count Estimate Estimate Estimate Estimate Estimate
Demographics, Male
Age range 21–24 538,648 0.258 0.208 0.141 0.078 0.062Age range 25–29 606,608 0.278 0.223 0.150 0.081 0.064Age range 30–34 687,832 0.338 0.274 0.187 0.101 0.079Age range 35–39 745,699 0.413 0.339 0.240 0.140 0.113Age range 40–44 796,828 0.487 0.404 0.293 0.176 0.145Age range 45–49 858,862 0.581 0.487 0.365 0.231 0.195Age range 50–54 884,086 0.737 0.626 0.484 0.316 0.269Age range 55–59 821,612 0.863 0.736 0.580 0.393 0.339Age range 60+ 830,119 1.028 0.880 0.704 0.487 0.424
Demographics, Female
Age range 21–24 569,087 0.433 0.350 0.221 0.101 0.072Age range 25–29 674,034 0.548 0.448 0.301 0.156 0.120
(Continued)
Kautter, J., Pope, G. C., Ingber, M., et al. E12
MMRR 2014: Volume 4 (3)
Exhibit 4 Continued. Selected Incremental Relative Plan Liability Results From the HHS-HCC Risk Adjustment Models—Adult age 21+ (for full results, see Appendix Exhibit A1)
Platinum Plan
Liability
Gold Plan
Liability
Silver Plan
Liability
Bronze Plan
Liability
Cata-strophic Plan
Liability
HCC Number Variable Label Count Estimate Estimate Estimate Estimate Estimate
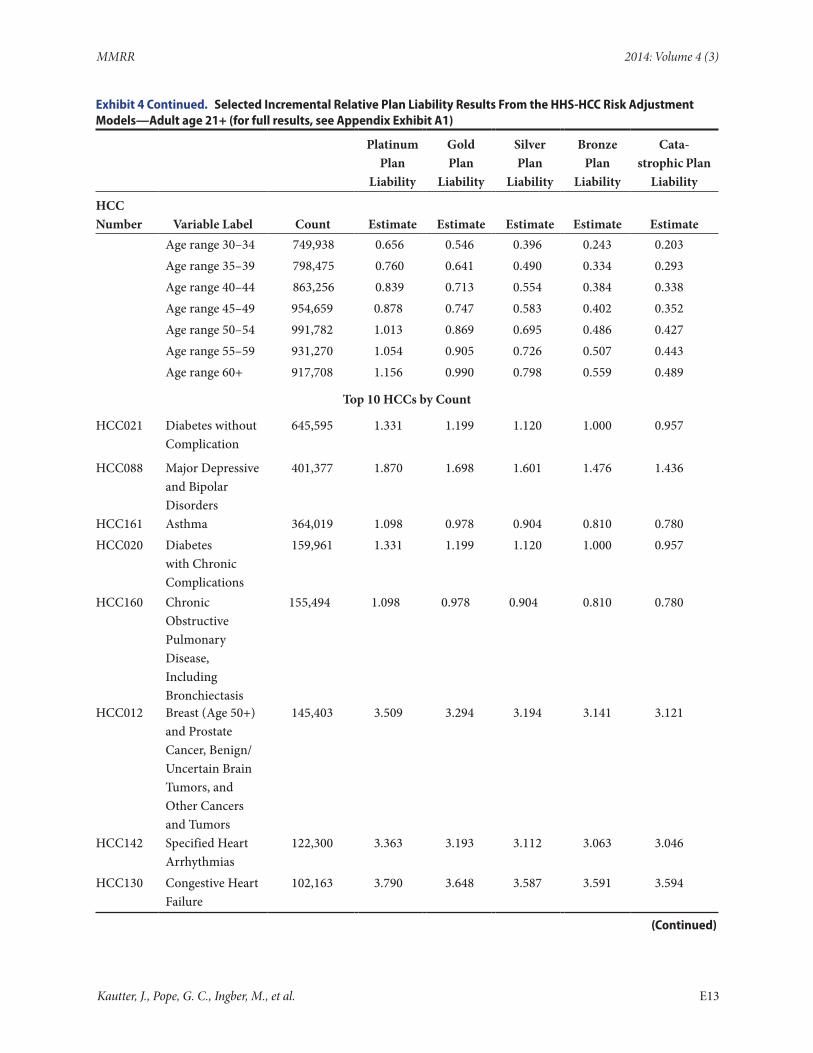
Age range 30–34 749,938 0.656 0.546 0.396 0.243 0.203Age range 35–39 798,475 0.760 0.641 0.490 0.334 0.293Age range 40–44 863,256 0.839 0.713 0.554 0.384 0.338Age range 45–49 954,659 0.878 0.747 0.583 0.402 0.352Age range 50–54 991,782 1.013 0.869 0.695 0.486 0.427Age range 55–59 931,270 1.054 0.905 0.726 0.507 0.443Age range 60+ 917,708 1.156 0.990 0.798 0.559 0.489
Top 10 HCCs by Count
HCC021 Diabetes without Complication
645,595 1.331 1.199 1.120 1.000 0.957
HCC088 Major Depressive and Bipolar Disorders
401,377 1.870 1.698 1.601 1.476 1.436
HCC161 Asthma 364,019 1.098 0.978 0.904 0.810 0.780HCC020 Diabetes
with Chronic Complications
159,961 1.331 1.199 1.120 1.000 0.957
HCC160 Chronic Obstructive Pulmonary Disease, Including Bronchiectasis
155,494 1.098 0.978 0.904 0.810 0.780
HCC012 Breast (Age 50+) and Prostate Cancer, Benign/Uncertain Brain Tumors, and Other Cancers and Tumors
145,403 3.509 3.294 3.194 3.141 3.121
HCC142 Specified Heart Arrhythmias
122,300 3.363 3.193 3.112 3.063 3.046
HCC130 Congestive Heart Failure
102,163 3.790 3.648 3.587 3.591 3.594
(Continued)
Kautter, J., Pope, G. C., Ingber, M., et al. E13
MMRR 2014: Volume 4 (3)
Exhibit 4 Continued. Selected Incremental Relative Plan Liability Results From the HHS-HCC Risk Adjustment Models—Adult age 21+ (for full results, see Appendix Exhibit A1)
Platinum Plan
Liability
Gold Plan
Liability
Silver Plan
Liability
Bronze Plan
Liability
Cata-strophic Plan
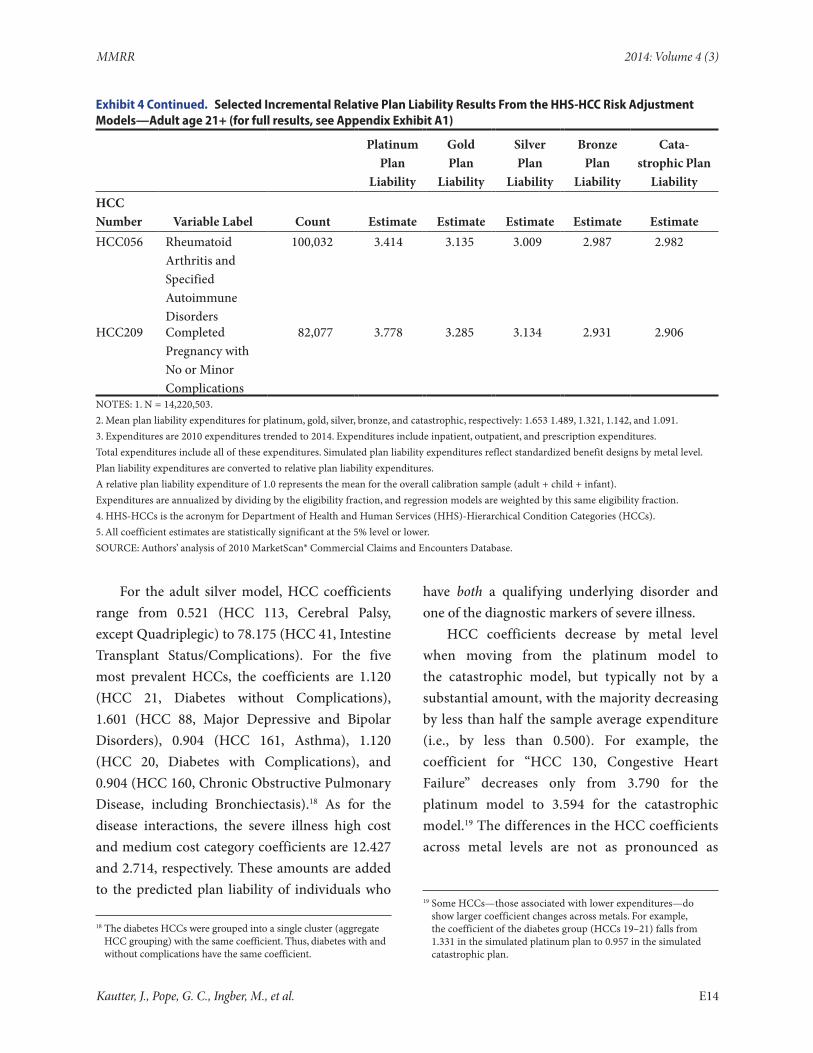
LiabilityHCC Number Variable Label Count Estimate Estimate Estimate Estimate EstimateHCC056 Rheumatoid
Arthritis and Specified Autoimmune Disorders
100,032 3.414 3.135 3.009 2.987 2.982
HCC209 Completed Pregnancy with No or Minor Complications
82,077 3.778 3.285 3.134 2.931 2.906
NOTES: 1. N = 14,220,503.2. Mean plan liability expenditures for platinum, gold, silver, bronze, and catastrophic, respectively: 1.653 1.489, 1.321, 1.142, and 1.091.3. Expenditures are 2010 expenditures trended to 2014. Expenditures include inpatient, outpatient, and prescription expenditures.Total expenditures include all of these expenditures. Simulated plan liability expenditures reflect standardized benefit designs by metal level.Plan liability expenditures are converted to relative plan liability expenditures.A relative plan liability expenditure of 1.0 represents the mean for the overall calibration sample (adult + child + infant).Expenditures are annualized by dividing by the eligibility fraction, and regression models are weighted by this same eligibility fraction.4. HHS-HCCs is the acronym for Department of Health and Human Services (HHS)-Hierarchical Condition Categories (HCCs).5. All coefficient estimates are statistically significant at the 5% level or lower.SOURCE: Authors’ analysis of 2010 MarketScan® Commercial Claims and Encounters Database.
For the adult silver model, HCC coefficients range from 0.521 (HCC 113, Cerebral Palsy, except Quadriplegic) to 78.175 (HCC 41, Intestine Transplant Status/Complications). For the five most prevalent HCCs, the coefficients are 1.120 (HCC 21, Diabetes without Complications), 1.601 (HCC 88, Major Depressive and Bipolar Disorders), 0.904 (HCC 161, Asthma), 1.120 (HCC 20, Diabetes with Complications), and 0.904 (HCC 160, Chronic Obstructive Pulmonary Disease, including Bronchiectasis).18 As for the disease interactions, the severe illness high cost and medium cost category coefficients are 12.427 and 2.714, respectively. These amounts are added to the predicted plan liability of individuals who
18 The diabetes HCCs were grouped into a single cluster (aggregate HCC grouping) with the same coefficient. Thus, diabetes with and without complications have the same coefficient.
have both a qualifying underlying disorder and one of the diagnostic markers of severe illness.
HCC coefficients decrease by metal level when moving from the platinum model to the catastrophic model, but typically not by a substantial amount, with the majority decreasing by less than half the sample average expenditure (i.e., by less than 0.500). For example, the coefficient for “HCC 130, Congestive Heart Failure” decreases only from 3.790 for the platinum model to 3.594 for the catastrophic model.19 The differences in the HCC coefficients across metal levels are not as pronounced as
19 Some HCCs—those associated with lower expenditures—do show larger coefficient changes across metals. For example, the coefficient of the diabetes group (HCCs 19–21) falls from 1.331 in the simulated platinum plan to 0.957 in the simulated catastrophic plan.
Kautter, J., Pope, G. C., Ingber, M., et al. E14
MMRR 2014: Volume 4 (3)
the differences in the age/sex coefficients. This occurs because the age-sex coefficients represent the entire predicted liability for persons without HCCs, who are relatively healthy. The plan’s liability for their lower expenditures is greatly reduced by the increase in the deductible across the simulated metal level plans. In contrast, much of the spending for persons with HCCs, especially the more expensive ones, occurs above the plan deductible and even above the plan out-of-pocket maximum, and thus is less affected by the change in cost sharing when moving across metal levels. The upshot is that predicted plan liability, and hence the risk score, are more stable (proportionately) across metal levels for very sick individuals, while predicted plan liability/risk score for healthy individuals is much lower in the bronze or catastrophic plans than in the platinum or gold plans.20,21 In other words, plans will incur a significant liability for very sick people even if they have higher lower-end cost sharing; but their proportionate liability for relatively healthy people will be much lower.
Child Risk Adjustment Models
Each of the five metal level models is calibrated on the same child concurrent sample. Each model includes the same independent variables: eight age-sex cells and 119 HCCs.22 Disease interactions were empirically unimportant for the child model and
20 All individuals, including very sick ones, receive an age-sex coefficient as part of their predicted plan liability. Thus, their predictions are subject to the same absolute changes in plan liability when moving across metal levels. However, because HCC coefficients comprise the largest portion of the predicted liability of very sick individuals, proportionately (percentage-wise) their total prediction is less affected by metal level.
21 The severe illness disease interaction coefficients are fairly stable across metals, but rise slightly with greater cost sharing. This may occur because the individual disease (HCC) and aggregate disease (HCC) grouping coefficients decline across metals, and the severe illness interactions are picking up more of the costs of the very expensive people in the metals with higher cost sharing.
22 Because of aggregate HCC groupings, the effective number of HHS-HCCs for the child risk adjustment model is 100.
were not included. The dependent variable for each model is the annualized plan liability expenditures simulated according to a standard cost sharing design for that metal level. Predicted plan liability for each child is the sum of one age-sex coefficient and zero to many HCC coefficients, each of which represents an incremental expenditure.23
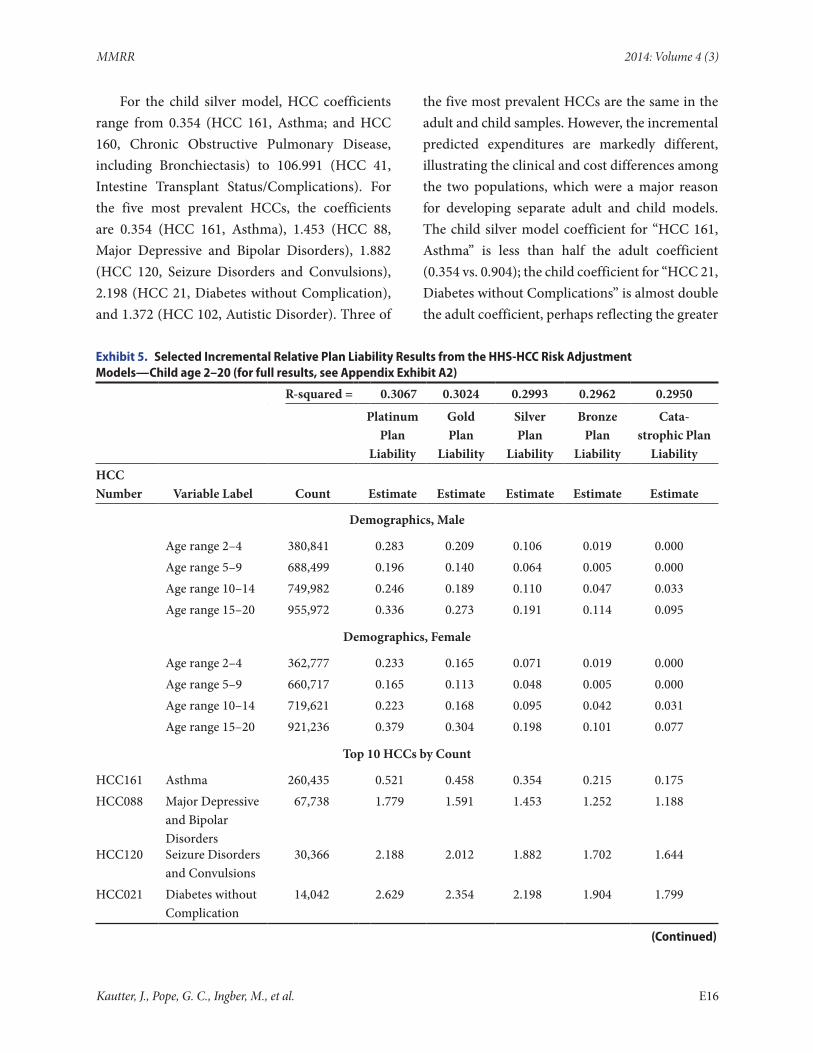
Exhibit 5 shows selected results for the child risk adjustment models by metal level (for the full results, see Appendix Exhibit A2). The model R-squares for each of the 5 metal levels range between 31 percent for the platinum model to 30 percent for the catastrophic model. These R-squares are approximately 5 percentage points lower than the R-squares for the adult models. This can be explained partially by noting that less than 10 percent of the child sample has any HCCs, which are the main predictors of individual variation in plan liability expenditures. The sample size for each model is 5,439,645, with each age/sex category having between 362,777 and 921,236 observations. Given such large sample sizes, except for the youngest age/sex categories (age 2–4, age 5–9) for the lowest metal levels (bronze, catastrophic), all coefficients are statistically significant at conventional significance levels.
The age/sex demographic coefficients have a U-shaped pattern, unlike the monotonically increasing coefficients of adults. For example, for males in the silver model, the age/sex coefficients are 0.106 for age 2–4, 0.064 for age 5–9, 0.110 for age 10–14, and 0.191 for age 15–20. Female children are less expensive than male children until ages 15–20, which is perhaps when reproductive health expenses begin to become more pronounced. Similar to the adult model, the age/sex coefficients decrease from platinum to catastrophic.24
23 The risk score for each child is the sum of his/her relative coefficients. See above for details.
24 The zero coefficients for ages 2–9 in the catastrophic model indicate that the model predicts negligible expenditures above the deductible for children of these ages without any of the risk adjustment model HCCs.
Kautter, J., Pope, G. C., Ingber, M., et al. E15
MMRR 2014: Volume 4 (3)
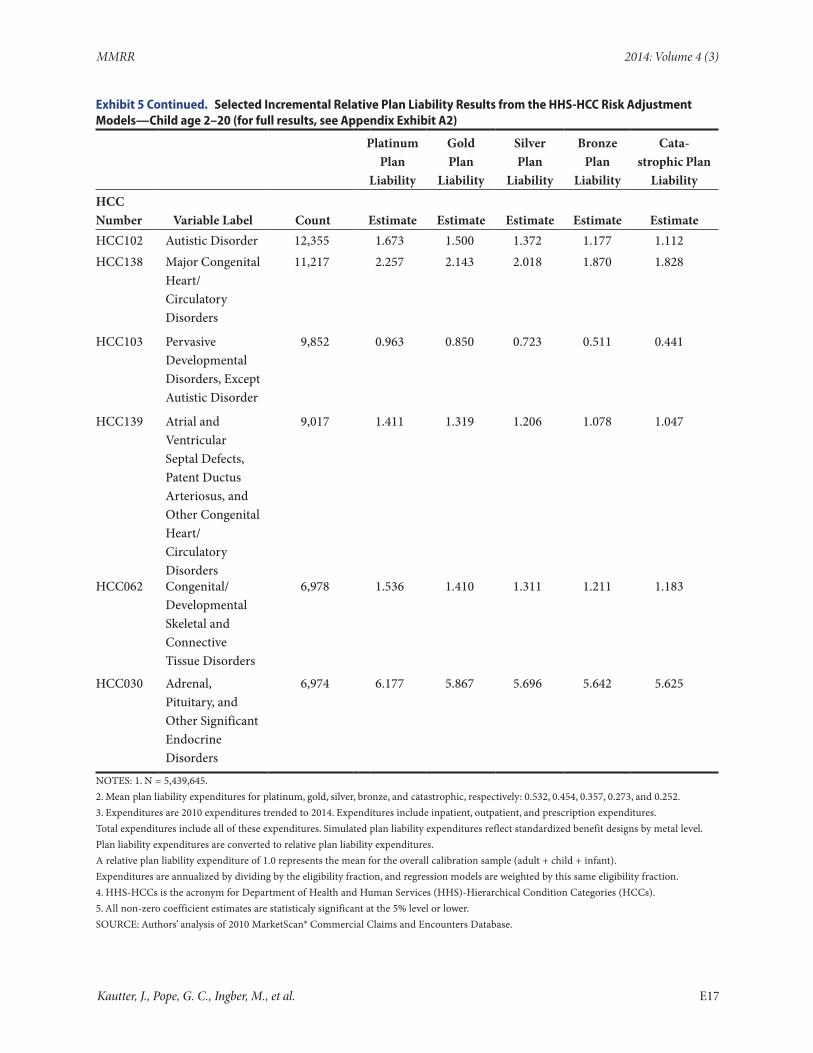
For the child silver model, HCC coefficients range from 0.354 (HCC 161, Asthma; and HCC 160, Chronic Obstructive Pulmonary Disease, including Bronchiectasis) to 106.991 (HCC 41, Intestine Transplant Status/Complications). For the five most prevalent HCCs, the coefficients are 0.354 (HCC 161, Asthma), 1.453 (HCC 88, Major Depressive and Bipolar Disorders), 1.882 (HCC 120, Seizure Disorders and Convulsions), 2.198 (HCC 21, Diabetes without Complication), and 1.372 (HCC 102, Autistic Disorder). Three of
the five most prevalent HCCs are the same in the adult and child samples. However, the incremental predicted expenditures are markedly different, illustrating the clinical and cost differences among the two populations, which were a major reason for developing separate adult and child models. The child silver model coefficient for “HCC 161, Asthma” is less than half the adult coefficient (0.354 vs. 0.904); the child coefficient for “HCC 21, Diabetes without Complications” is almost double the adult coefficient, perhaps reflecting the greater
Exhibit 5. Selected Incremental Relative Plan Liability Results from the HHS-HCC Risk Adjustment Models—Child age 2–20 (for full results, see Appendix Exhibit A2)
R-squared = 0.3067 0.3024 0.2993 0.2962 0.2950
Platinum Plan
Liability
Gold Plan
Liability
Silver Plan
Liability
Bronze Plan
Liability
Cata-strophic Plan
LiabilityHCC Number Variable Label Count Estimate Estimate Estimate Estimate Estimate
Demographics, Male
Age range 2–4 380,841 0.283 0.209 0.106 0.019 0.000Age range 5–9 688,499 0.196 0.140 0.064 0.005 0.000Age range 10–14 749,982 0.246 0.189 0.110 0.047 0.033Age range 15–20 955,972 0.336 0.273 0.191 0.114 0.095
Demographics, Female
Age range 2–4 362,777 0.233 0.165 0.071 0.019 0.000Age range 5–9 660,717 0.165 0.113 0.048 0.005 0.000Age range 10–14 719,621 0.223 0.168 0.095 0.042 0.031Age range 15–20 921,236 0.379 0.304 0.198 0.101 0.077
Top 10 HCCs by Count
HCC161 Asthma 260,435 0.521 0.458 0.354 0.215 0.175HCC088 Major Depressive
and Bipolar Disorders
67,738 1.779 1.591 1.453 1.252 1.188
HCC120 Seizure Disorders and Convulsions
30,366 2.188 2.012 1.882 1.702 1.644
HCC021 Diabetes without Complication
14,042 2.629 2.354 2.198 1.904 1.799
(Continued)
Kautter, J., Pope, G. C., Ingber, M., et al. E16
MMRR 2014: Volume 4 (3)
Exhibit 5 Continued. Selected Incremental Relative Plan Liability Results from the HHS-HCC Risk Adjustment Models—Child age 2–20 (for full results, see Appendix Exhibit A2)
Platinum Plan
Liability
Gold Plan
Liability
Silver Plan
Liability
Bronze Plan
Liability
Cata-strophic Plan
LiabilityHCC Number Variable Label Count Estimate Estimate Estimate Estimate EstimateHCC102 Autistic Disorder 12,355 1.673 1.500 1.372 1.177 1.112HCC138 Major Congenital
Heart/Circulatory Disorders
11,217 2.257 2.143 2.018 1.870 1.828
HCC103 Pervasive Developmental Disorders, Except Autistic Disorder
9,852 0.963 0.850 0.723 0.511 0.441
HCC139 Atrial and Ventricular Septal Defects, Patent Ductus Arteriosus, and Other Congenital Heart/Circulatory Disorders
9,017 1.411 1.319 1.206 1.078 1.047
HCC062 Congenital/Developmental Skeletal and Connective Tissue Disorders
6,978 1.536 1.410 1.311 1.211 1.183
HCC030 Adrenal, Pituitary, and Other Significant Endocrine Disorders
6,974 6.177 5.867 5.696 5.642 5.625
NOTES: 1. N = 5,439,645.2. Mean plan liability expenditures for platinum, gold, silver, bronze, and catastrophic, respectively: 0.532, 0.454, 0.357, 0.273, and 0.252.3. Expenditures are 2010 expenditures trended to 2014. Expenditures include inpatient, outpatient, and prescription expenditures.Total expenditures include all of these expenditures. Simulated plan liability expenditures reflect standardized benefit designs by metal level.Plan liability expenditures are converted to relative plan liability expenditures.A relative plan liability expenditure of 1.0 represents the mean for the overall calibration sample (adult + child + infant).Expenditures are annualized by dividing by the eligibility fraction, and regression models are weighted by this same eligibility fraction.4. HHS-HCCs is the acronym for Department of Health and Human Services (HHS)-Hierarchical Condition Categories (HCCs).5. All non-zero coefficient estimates are statisticaly significant at the 5% level or lower.SOURCE: Authors’ analysis of 2010 MarketScan® Commercial Claims and Encounters Database.
Kautter, J., Pope, G. C., Ingber, M., et al. E17
MMRR 2014: Volume 4 (3)
severity of Type I versus Type II diabetes (2.198 vs. 1.120); and the child coefficient for “HCC 88, Major Depressive and Bipolar Disorders” is relatively similar in magnitude to the adult coefficient (1.453 vs. 1.601). Some other notably higher child versus adult silver coefficients are: “HCC 112 Quadriplegic Cerebral Palsy” (5.223 child vs. 1.681 adult); “HCC 159 Cystic Fibrosis” (12.743 child vs. 9.957 adult); and “HCC 102 Autistic Disorder” (1.372 child vs. 0.974 adult). Finally, like the adult model, the HCC coefficients in the child model decrease when moving from the platinum model to the catastrophic model, but often not by a substantial amount.
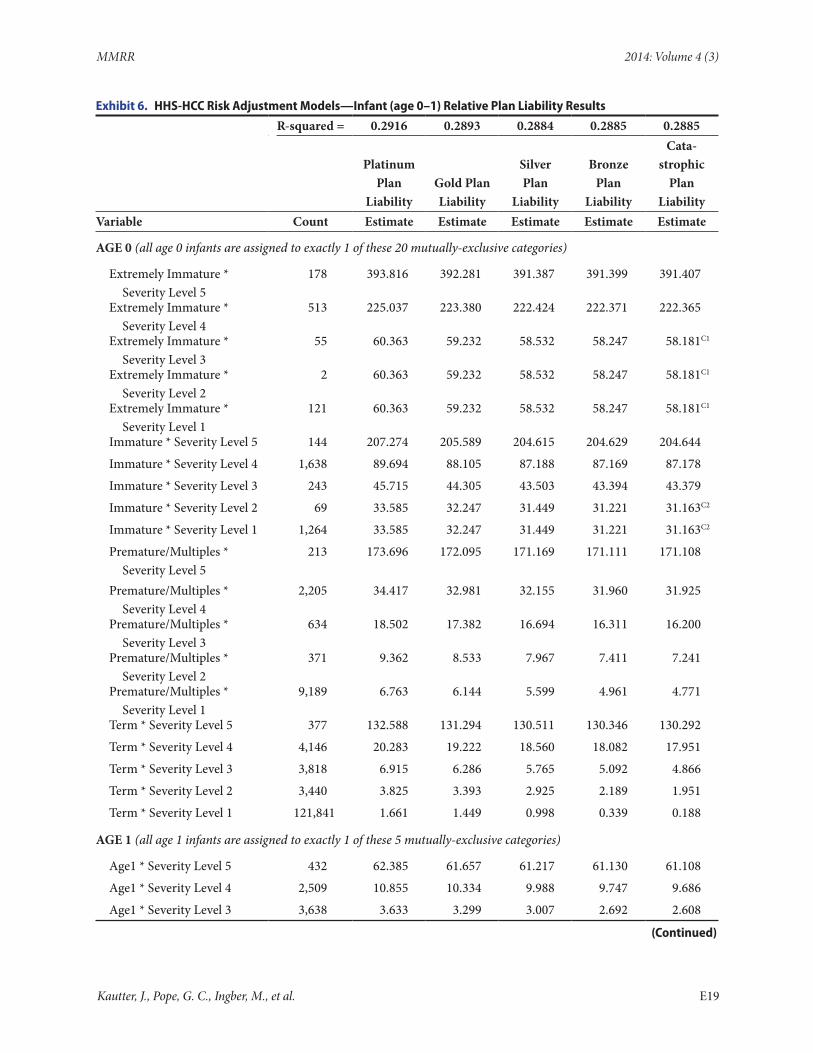
Infant Risk Adjustment Models
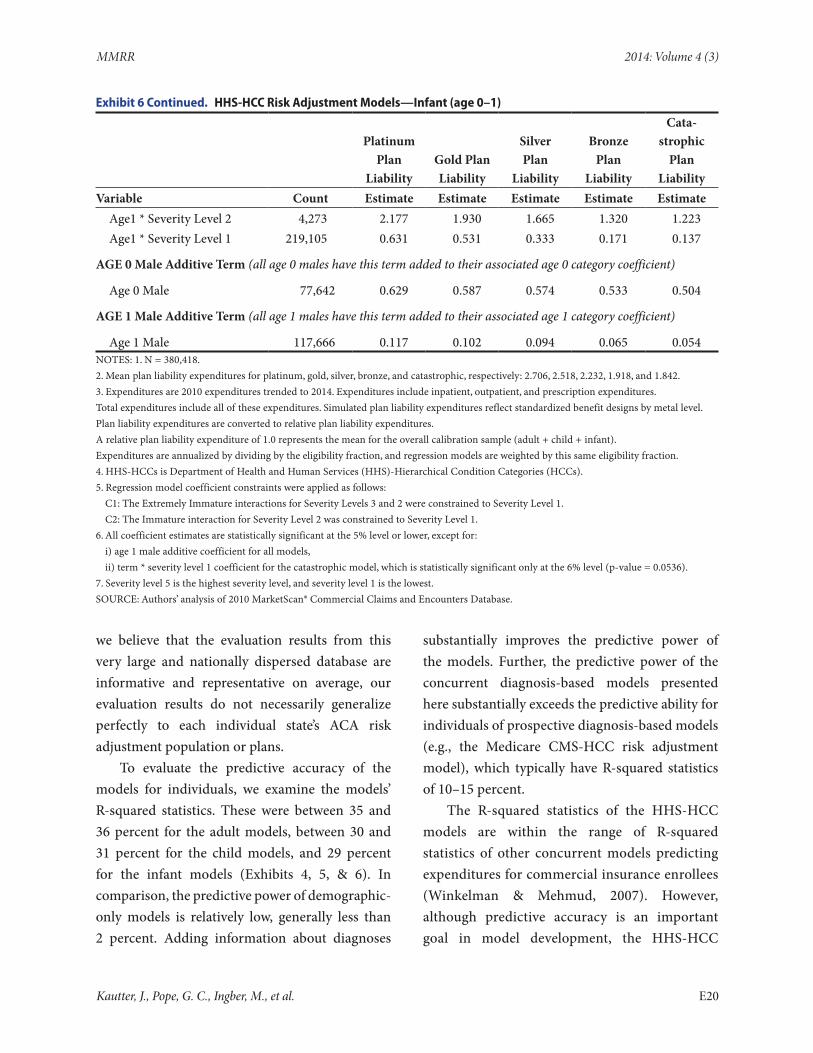
As described previously, the infant model utilizes a categorical approach in which infants are assigned a birth maturity (by length of gestation and birth weight) or Age 1 category, and a disease severity category (based on HCCs other than birth maturity). Exhibit 6 shows the estimated infant risk adjustment models by metal level. The model R-squares are 29 percent across the five metal levels in the infant model, which are slightly lower than the child model R-squares. The sample size for each model is 380,418, with 90 percent of observations in the “Term x Severity Level 1” category (n=121,841) or the “Age 1 x Severity Level 1” category (n=219,105). The remaining categories (except for the Male Additive terms) each have fewer than 10,000 observations. In fact, sample sizes for a handful of categories are less than 100, which required coefficient constraints to improve statistical precision. Predicted plan liability for each infant is the coefficient of his or her single category [(maturity) x (disease severity)] plus, if male, the coefficient of the Age 0 or Age 1 Male Additive Term.25
25 The risk score for each infant is the sum of his/her relative coefficients. See above for details.
For the infant silver model, predicted plan liability for age 0 female infants ranges from 391.387 for the “Extremely Immature x Severity Level 5” category, to 0.998 for the “Term x Severity Level 1” category. Thus, the predicted plan liability for an extremely immature infant with the highest disease severity level is almost 400 times the predicted plan liability for a term infant with the lowest disease severity level. For age 1 female infants, predicted plan liability ranges from 61.217 for the “Age 1 x Severity Level 5” category to 0.333 for the “Age 1 x Severity Level 1” category. The “Age 0, Male” and “Age 1, Male” Additive Terms are 0.574 and 0.094, respectively. Within each maturity level, predicted plan liability is increasing in severity (or is equal when small sample sizes require severity levels to be combined in estimation). Also, for age 0 infants, within each severity level, predicted plan liability increases with greater immaturity.
The infant model predicted plan liability, the (maturity) x (disease severity) coefficients, decrease with greater plan enrollee cost sharing (moving from platinum to catastrophic plans). But, proportionately, the reduction is much larger for the less expensive categories. For example, the (Term) x (Severity Level 5) predicted plan liability falls only from 132.588 (platinum) to 130.292 (catastrophic). But the (Term) x (Severity Level 1) predicted plan liability falls from 1.661 (platinum) to 0.188 (catastrophic). This can be explained by the large difference in deductibles in the standard benefit designs used to simulate plan liability expenditures, which have a much larger proportionate effect on the lower-expenditure categories.
Evaluation
In evaluating the models’ performance we look at both explanatory power at the individual level and under- and over-prediction for subgroups of the population. We evaluate model predictive accuracy using our MarketScan® calibration sample. While
Kautter, J., Pope, G. C., Ingber, M., et al. E18
MMRR 2014: Volume 4 (3)
Exhibit 6. HHS-HCC Risk Adjustment Models—Infant (age 0–1) Relative Plan Liability Results
R-squared = 0.2916 0.2893 0.2884 0.2885 0.2885
Platinum Plan
LiabilityGold Plan Liability
Silver Plan
Liability
Bronze Plan
Liability
Cata-strophic
Plan Liability
Variable Count Estimate Estimate Estimate Estimate Estimate
AGE 0 (all age 0 infants are assigned to exactly 1 of these 20 mutually-exclusive categories)
Extremely Immature * Severity Level 5
178 393.816 392.281 391.387 391.399 391.407
Extremely Immature * Severity Level 4
513 225.037 223.380 222.424 222.371 222.365
Extremely Immature * Severity Level 3
55 60.363 59.232 58.532 58.247 58.181C1
Extremely Immature * Severity Level 2
2 60.363 59.232 58.532 58.247 58.181C1
Extremely Immature * Severity Level 1
121 60.363 59.232 58.532 58.247 58.181C1
Immature * Severity Level 5 144 207.274 205.589 204.615 204.629 204.644
Immature * Severity Level 4 1,638 89.694 88.105 87.188 87.169 87.178
Immature * Severity Level 3 243 45.715 44.305 43.503 43.394 43.379
Immature * Severity Level 2 69 33.585 32.247 31.449 31.221 31.163C2
Immature * Severity Level 1 1,264 33.585 32.247 31.449 31.221 31.163C2
Premature/Multiples * Severity Level 5
213 173.696 172.095 171.169 171.111 171.108
Premature/Multiples * Severity Level 4
2,205 34.417 32.981 32.155 31.960 31.925
Premature/Multiples * Severity Level 3
634 18.502 17.382 16.694 16.311 16.200
Premature/Multiples * Severity Level 2
371 9.362 8.533 7.967 7.411 7.241
Premature/Multiples * Severity Level 1
9,189 6.763 6.144 5.599 4.961 4.771
Term * Severity Level 5 377 132.588 131.294 130.511 130.346 130.292
Term * Severity Level 4 4,146 20.283 19.222 18.560 18.082 17.951
Term * Severity Level 3 3,818 6.915 6.286 5.765 5.092 4.866
Term * Severity Level 2 3,440 3.825 3.393 2.925 2.189 1.951
Term * Severity Level 1 121,841 1.661 1.449 0.998 0.339 0.188
AGE 1 (all age 1 infants are assigned to exactly 1 of these 5 mutually-exclusive categories)
Age1 * Severity Level 5 432 62.385 61.657 61.217 61.130 61.108
Age1 * Severity Level 4 2,509 10.855 10.334 9.988 9.747 9.686
Age1 * Severity Level 3 3,638 3.633 3.299 3.007 2.692 2.608
(Continued)
Kautter, J., Pope, G. C., Ingber, M., et al. E19
MMRR 2014: Volume 4 (3)
Exhibit 6 Continued. HHS-HCC Risk Adjustment Models—Infant (age 0–1)
Platinum Plan
LiabilityGold Plan Liability
Silver Plan
Liability
Bronze Plan
Liability
Cata-strophic
Plan Liability
Variable Count Estimate Estimate Estimate Estimate EstimateAge1 * Severity Level 2 4,273 2.177 1.930 1.665 1.320 1.223Age1 * Severity Level 1 219,105 0.631 0.531 0.333 0.171 0.137
AGE 0 Male Additive Term (all age 0 males have this term added to their associated age 0 category coefficient)
Age 0 Male 77,642 0.629 0.587 0.574 0.533 0.504
AGE 1 Male Additive Term (all age 1 males have this term added to their associated age 1 category coefficient)
Age 1 Male 117,666 0.117 0.102 0.094 0.065 0.054NOTES: 1. N = 380,418.2. Mean plan liability expenditures for platinum, gold, silver, bronze, and catastrophic, respectively: 2.706, 2.518, 2.232, 1.918, and 1.842.3. Expenditures are 2010 expenditures trended to 2014. Expenditures include inpatient, outpatient, and prescription expenditures.Total expenditures include all of these expenditures. Simulated plan liability expenditures reflect standardized benefit designs by metal level.Plan liability expenditures are converted to relative plan liability expenditures.A relative plan liability expenditure of 1.0 represents the mean for the overall calibration sample (adult + child + infant).Expenditures are annualized by dividing by the eligibility fraction, and regression models are weighted by this same eligibility fraction.4. HHS-HCCs is Department of Health and Human Services (HHS)-Hierarchical Condition Categories (HCCs).5. Regression model coefficient constraints were applied as follows:
C1: The Extremely Immature interactions for Severity Levels 3 and 2 were constrained to Severity Level 1.C2: The Immature interaction for Severity Level 2 was constrained to Severity Level 1.
6. All coefficient estimates are statistically significant at the 5% level or lower, except for:i) age 1 male additive coefficient for all models,ii) term * severity level 1 coefficient for the catastrophic model, which is statistically significant only at the 6% level (p-value = 0.0536).
7. Severity level 5 is the highest severity level, and severity level 1 is the lowest.SOURCE: Authors’ analysis of 2010 MarketScan® Commercial Claims and Encounters Database.
we believe that the evaluation results from this very large and nationally dispersed database are informative and representative on average, our evaluation results do not necessarily generalize perfectly to each individual state’s ACA risk adjustment population or plans.
To evaluate the predictive accuracy of the models for individuals, we examine the models’ R-squared statistics. These were between 35 and 36 percent for the adult models, between 30 and 31 percent for the child models, and 29 percent for the infant models (Exhibits 4, 5, & 6). In comparison, the predictive power of demographic-only models is relatively low, generally less than 2 percent. Adding information about diagnoses
substantially improves the predictive power of the models. Further, the predictive power of the concurrent diagnosis-based models presented here substantially exceeds the predictive ability for individuals of prospective diagnosis-based models (e.g., the Medicare CMS-HCC risk adjustment model), which typically have R-squared statistics of 10–15 percent.
The R-squared statistics of the HHS-HCC models are within the range of R-squared statistics of other concurrent models predicting expenditures for commercial insurance enrollees (Winkelman & Mehmud, 2007). However, although predictive accuracy is an important goal in model development, the HHS-HCC
Kautter, J., Pope, G. C., Ingber, M., et al. E20
MMRR 2014: Volume 4 (3)
models are not developed purely to maximize the value of the R-squared statistic. Instead, the HHS-HCC models are intended to balance high predictive ability with lower sensitivity to discretionary diagnostic coding. The latter is primarily achieved by including only a subset of less discretionary HCCs that identify chronic or systematic conditions subject to insurance risk selection rather than being random acute events. In addition, HCCs that primarily represent complications of or poor quality of care (e.g., pressure ulcers) are excluded.
It is also important to assess aggregate predictive accuracy for defined subgroups of health plan enrollees. This analysis evaluates whether the model predicts liability accurately for plans enrolling different types of people, and whether once the model is implemented, plans have any incentives to avoid or enroll certain types of individuals, for example, those with high health care costs or certain medical conditions. In the calibration sample, the models predict mean plan liability expenditures perfectly (predictive ratio = 1.00) for each of the age group subpopulations (adult, child, infant) for each level of plan cost sharing (platinum, gold, silver, bronze, catastrophic). Not only that, prediction is perfect for each of the included demographic (age/sex categories) and diagnostic factors (HCC diagnosis groups) for each subpopulation. This is expected, given the specification and statistical techniques used to estimate the model. However, given their clinical and cost differences, predicting accurately on average for these subpopulations is important. For example, the model accounts for the very high incremental health care costs of children with hemophilia (45.551—relative incremental plan liability estimate in child silver model). Basing risk transfer payments and charges on accurate estimates of the differential costs by
subpopulation will help ensure that plans in the individual and small group markets receive adequate payments to treat enrollees with high expected costs.
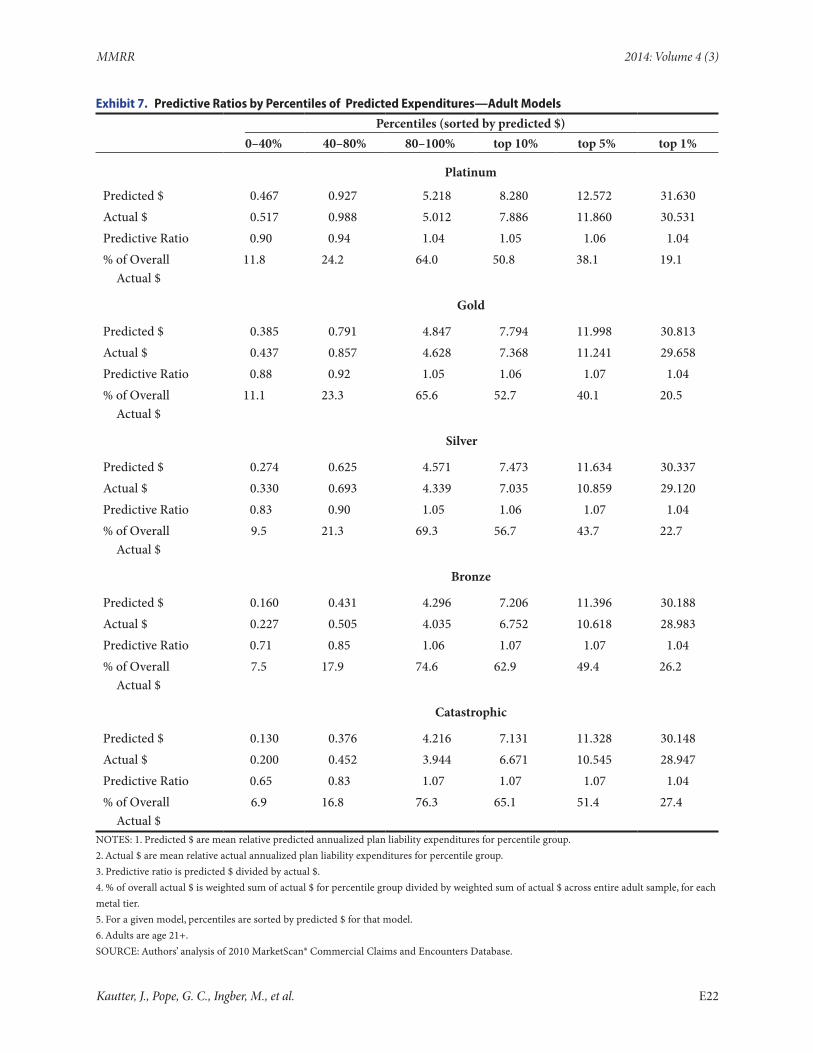
We also tested the predictive accuracy of the models using enrollee groups sorted into predicted expenditure percentile ranges (0–40%, 40–80%, 80–100%, top 10%, top 5%, top 1%). This set of ratios determines whether the model predictions are accurate at various levels of predicted expenditures; that is, it determines whether expenditures the model predicts to be low are in fact low on average, and whether expenditures the model predicts to be high are in fact high on average. We chose this set of percentile ranges (which we refer to simply as “percentiles”) not only to cover the entire range of predicted expenditures, but to emphasize the higher percentiles that capture the small proportion of high-cost individuals in which most medical expenditures are concentrated. Accurate model prediction is especially critical for these high-cost cases.
For the adult sample, Exhibit 7 presents predictive ratios for percentiles of enrollees created by sorting predicted plan liability expenditures. The adult platinum model predicts well for these predicted expenditure groups. There is less than a 10 percent prediction error in either direction for each of these groups, ranging from lower-cost to very-high-cost individuals. The lower percentiles, 0–40% and 40–80%, are somewhat under-predicted, whereas the highest percentiles (80–100%, top 10%, top 5%, top 1%) are somewhat over-predicted.
The adult models perform adequately across all metal levels, doing especially well for the critical highest percentiles. For example, for the 80–100% percentile, the predictive ratios range from 1.04 (platinum) to 1.07 (catastrophic). The mean actual plan liability expenditures for enrollees in the 80–100% percentile range from 5.012 to 3.944 across metal tiers, which represents, respectively,
Kautter, J., Pope, G. C., Ingber, M., et al. E21
MMRR 2014: Volume 4 (3)
Exhibit 7. Predictive Ratios by Percentiles of Predicted Expenditures—Adult Models
Percentiles (sorted by predicted $)0–40% 40–80% 80–100% top 10% top 5% top 1%
Platinum
Predicted $ 0.467 0.927 5.218 8.280 12.572 31.630Actual $ 0.517 0.988 5.012 7.886 11.860 30.531Predictive Ratio 0.90 0.94 1.04 1.05 1.06 1.04% of Overall Actual $
11.8 24.2 64.0 50.8 38.1 19.1
Gold
Predicted $ 0.385 0.791 4.847 7.794 11.998 30.813Actual $ 0.437 0.857 4.628 7.368 11.241 29.658Predictive Ratio 0.88 0.92 1.05 1.06 1.07 1.04% of Overall Actual $
11.1 23.3 65.6 52.7 40.1 20.5
Silver
Predicted $ 0.274 0.625 4.571 7.473 11.634 30.337Actual $ 0.330 0.693 4.339 7.035 10.859 29.120Predictive Ratio 0.83 0.90 1.05 1.06 1.07 1.04% of Overall Actual $
9.5 21.3 69.3 56.7 43.7 22.7
Bronze
Predicted $ 0.160 0.431 4.296 7.206 11.396 30.188Actual $ 0.227 0.505 4.035 6.752 10.618 28.983Predictive Ratio 0.71 0.85 1.06 1.07 1.07 1.04% of Overall Actual $
7.5 17.9 74.6 62.9 49.4 26.2
Catastrophic
Predicted $ 0.130 0.376 4.216 7.131 11.328 30.148Actual $ 0.200 0.452 3.944 6.671 10.545 28.947Predictive Ratio 0.65 0.83 1.07 1.07 1.07 1.04% of Overall Actual $
6.9 16.8 76.3 65.1 51.4 27.4
NOTES: 1. Predicted $ are mean relative predicted annualized plan liability expenditures for percentile group.2. Actual $ are mean relative actual annualized plan liability expenditures for percentile group.3. Predictive ratio is predicted $ divided by actual $.4. % of overall actual $ is weighted sum of actual $ for percentile group divided by weighted sum of actual $ across entire adult sample, for each metal tier.5. For a given model, percentiles are sorted by predicted $ for that model.6. Adults are age 21+.SOURCE: Authors’ analysis of 2010 MarketScan® Commercial Claims and Encounters Database.
Kautter, J., Pope, G. C., Ingber, M., et al. E22
MMRR 2014: Volume 4 (3)
64.0 percent to 76.3 percent of overall mean actual plan liability expenditures. Since most of the dollars are in the highest percentiles, it is most important for the model to perform well for these high cost subgroups.
The adult models perform less well for the lowest percentiles, especially for the lower metal levels. For example, for the 0–40% percentile, the predictive ratio for the catastrophic model is only 0.65. However, the enrollees comprising the 0–40% percentile represent only 6.9 percent of overall actual expenditures for the catastrophic metal level. Moreover, the absolute amount of the under-prediction, 0.130 for predicted expenditures versus 0.200 for actual expenditures for a difference of 0.070, is small. The predictive ratio is low, in part, because the denominator of the ratio, 0.200 (1/5 of the average predicted expenditures for the calibration sample), is small for these low-cost beneficiaries, magnifying the absolute prediction error when expressed as a ratio. For the catastrophic metal, as for the other metals, the HHS-HCC model predicts a wide range of plan liabilities across groups, from 0.130 to 30.148 (0–40% percentile vs. top 1% percentile), corresponding to a similar range of actual plan liabilities ranging from 0.200 to 28.948.
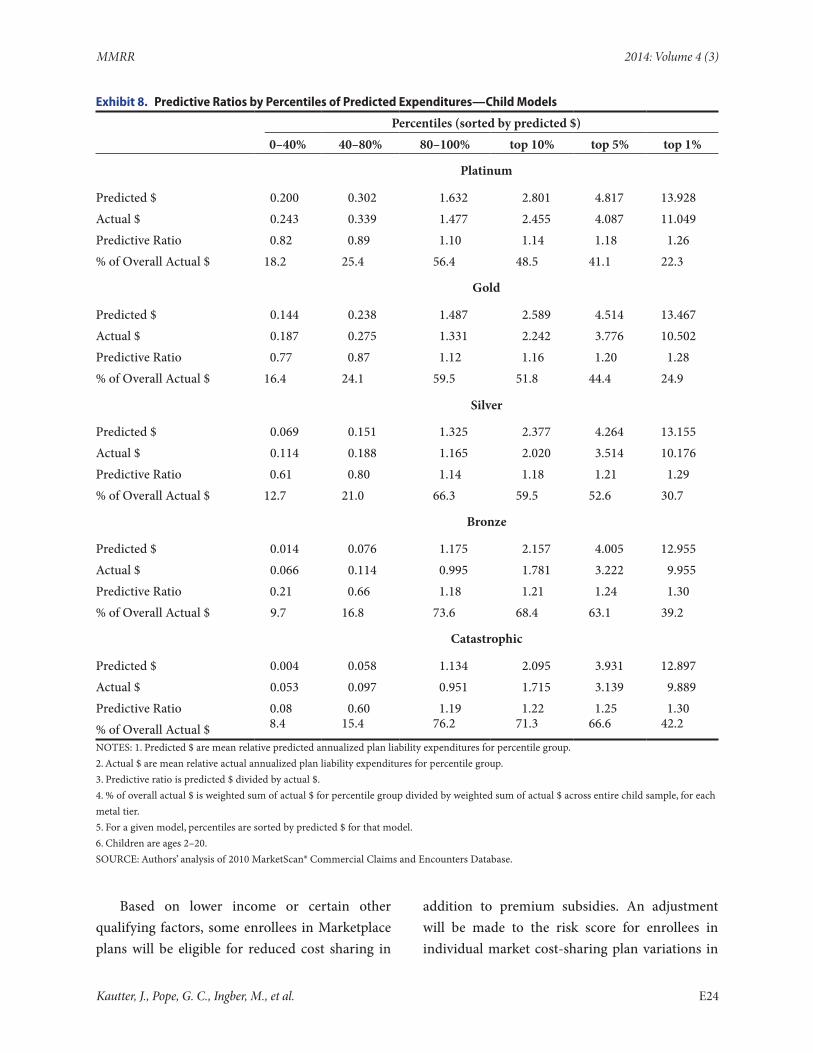
The predictive ratios for the child models (Exhibit 8) exhibit the same qualitative patterns as for the adult models, except that the predictive ratios denote less predictive accuracy. For the child platinum model, there is less than a 20 percent error for each percentile (except for the top 1% percentile). Like the adult models, the child model performs less well for the lowest percentiles, especially for the lower metal levels. However, it is important to consider the amount of actual (relative) dollars these percentiles represent. For example, for the catastrophic model, while the 0–40% percentile has a predictive ratio of 0.08,
the absolute difference of predicted and actual (relative) expenditures is only 0.049 (predicted expenditures 0.004; actual expenditures 0.053), and only 8.4 percent of overall expenditures of the catastrophic metal level is incurred by the lowest percentile group.
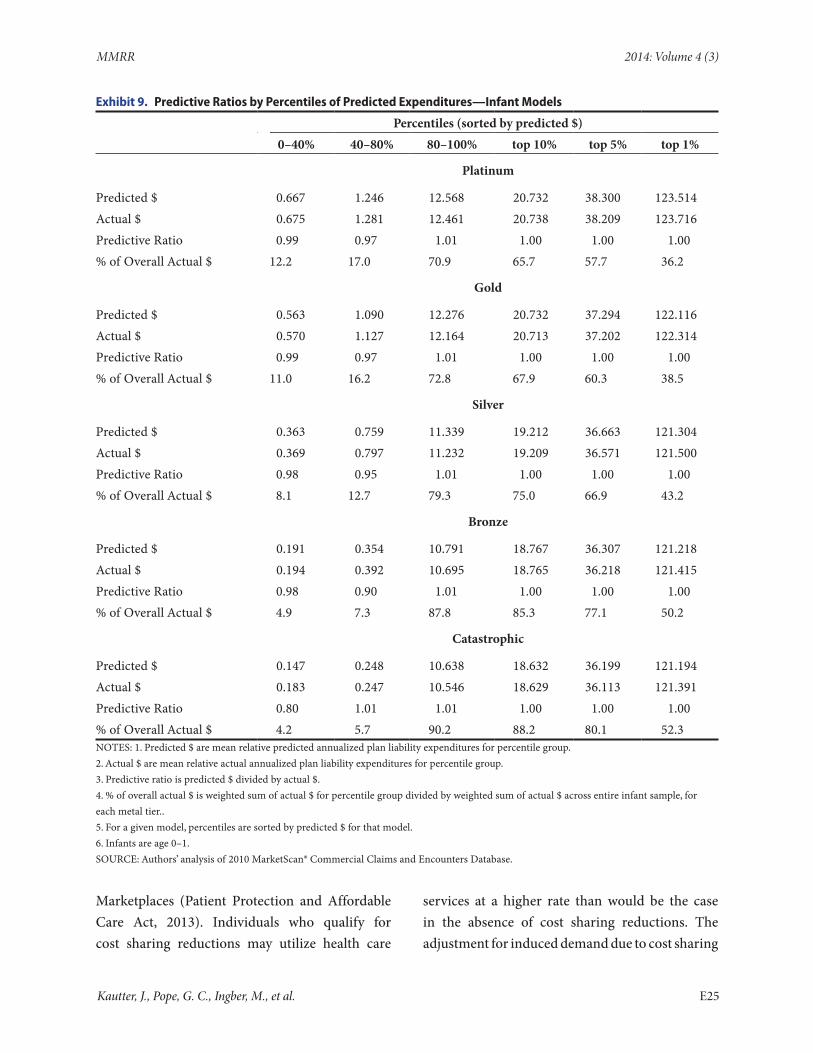
Finally, the infant models perform quite accurately on the predictive ratios for predicted expenditure percentiles (Exhibit 9). In general, there is a 5 percent prediction error or smaller across all percentiles and all metal levels. The two exceptions are the 40–80% percentile for the bronze model (predictive ratio = 0.90) and the 0–40% percentile for the catastrophic model (predictive ratio = 0.80). But again, the dollar amounts of the under-predictions are modest and these percentiles comprise a small share of total actual expenditures, 7.3 percent for the 40–80% percentile for bronze, and 4.2 percent for the 0–40% percentile for catastrophic.
Risk Score Calculation
Below we provide several examples of how empirical risk adjustment model output is applied to calculate an individual’s “plan liability risk score (PLRS)”. We then define the plan average PLRS, which is used in the calculation of transfer payments and charges. In the HHS methodology, the risk score for an enrollee is defined as the predicted relative plan liability expenditure for the enrollee based on the HHS-HCC risk adjustment model for the enrollee’s plan metal level. The predicted relative plan liability expenditures are calculated as follows. For an adult (age 21+), it is the sum of the age/sex, HCC, and disease interaction risk factors in Appendix Exhibit A1; for a child, it is the sum of the age/sex and HCC risk factors in Appendix Exhibit A2; and for infants, it is the sum of the appropriate maturity/disease-severity category and age/sex Additive Term in Exhibit 6.
Kautter, J., Pope, G. C., Ingber, M., et al. E23
MMRR 2014: Volume 4 (3)
Exhibit 8. Predictive Ratios by Percentiles of Predicted Expenditures—Child Models
Percentiles (sorted by predicted $)0–40% 40–80% 80–100% top 10% top 5% top 1%
Platinum
Predicted $ 0.200 0.302 1.632 2.801 4.817 13.928Actual $ 0.243 0.339 1.477 2.455 4.087 11.049Predictive Ratio 0.82 0.89 1.10 1.14 1.18 1.26% of Overall Actual $ 18.2 25.4 56.4 48.5 41.1 22.3
Gold
Predicted $ 0.144 0.238 1.487 2.589 4.514 13.467Actual $ 0.187 0.275 1.331 2.242 3.776 10.502Predictive Ratio 0.77 0.87 1.12 1.16 1.20 1.28% of Overall Actual $ 16.4 24.1 59.5 51.8 44.4 24.9
Silver
Predicted $ 0.069 0.151 1.325 2.377 4.264 13.155Actual $ 0.114 0.188 1.165 2.020 3.514 10.176Predictive Ratio 0.61 0.80 1.14 1.18 1.21 1.29% of Overall Actual $ 12.7 21.0 66.3 59.5 52.6 30.7
Bronze
Predicted $ 0.014 0.076 1.175 2.157 4.005 12.955Actual $ 0.066 0.114 0.995 1.781 3.222 9.955Predictive Ratio 0.21 0.66 1.18 1.21 1.24 1.30% of Overall Actual $ 9.7 16.8 73.6 68.4 63.1 39.2
Catastrophic
Predicted $ 0.004 0.058 1.134 2.095 3.931 12.897Actual $ 0.053 0.097 0.951 1.715 3.139 9.889Predictive Ratio 0.08 0.60 1.19 1.22 1.25 1.30% of Overall Actual $ 8.4 15.4 76.2 71.3 66.6 42.2
NOTES: 1. Predicted $ are mean relative predicted annualized plan liability expenditures for percentile group.2. Actual $ are mean relative actual annualized plan liability expenditures for percentile group.3. Predictive ratio is predicted $ divided by actual $.4. % of overall actual $ is weighted sum of actual $ for percentile group divided by weighted sum of actual $ across entire child sample, for each metal tier.5. For a given model, percentiles are sorted by predicted $ for that model.6. Children are ages 2–20.SOURCE: Authors’ analysis of 2010 MarketScan® Commercial Claims and Encounters Database.
Based on lower income or certain other qualifying factors, some enrollees in Marketplace plans will be eligible for reduced cost sharing in
addition to premium subsidies. An adjustment will be made to the risk score for enrollees in individual market cost-sharing plan variations in
Kautter, J., Pope, G. C., Ingber, M., et al. E24
MMRR 2014: Volume 4 (3)
Exhibit 9. Predictive Ratios by Percentiles of Predicted Expenditures—Infant Models
Percentiles (sorted by predicted $)0–40% 40–80% 80–100% top 10% top 5% top 1%
Platinum
Predicted $ 0.667 1.246 12.568 20.732 38.300 123.514Actual $ 0.675 1.281 12.461 20.738 38.209 123.716Predictive Ratio 0.99 0.97 1.01 1.00 1.00 1.00% of Overall Actual $ 12.2 17.0 70.9 65.7 57.7 36.2
Gold
Predicted $ 0.563 1.090 12.276 20.732 37.294 122.116Actual $ 0.570 1.127 12.164 20.713 37.202 122.314Predictive Ratio 0.99 0.97 1.01 1.00 1.00 1.00% of Overall Actual $ 11.0 16.2 72.8 67.9 60.3 38.5
Silver
Predicted $ 0.363 0.759 11.339 19.212 36.663 121.304Actual $ 0.369 0.797 11.232 19.209 36.571 121.500Predictive Ratio 0.98 0.95 1.01 1.00 1.00 1.00% of Overall Actual $ 8.1 12.7 79.3 75.0 66.9 43.2
Bronze
Predicted $ 0.191 0.354 10.791 18.767 36.307 121.218Actual $ 0.194 0.392 10.695 18.765 36.218 121.415Predictive Ratio 0.98 0.90 1.01 1.00 1.00 1.00% of Overall Actual $ 4.9 7.3 87.8 85.3 77.1 50.2
Catastrophic
Predicted $ 0.147 0.248 10.638 18.632 36.199 121.194Actual $ 0.183 0.247 10.546 18.629 36.113 121.391Predictive Ratio 0.80 1.01 1.01 1.00 1.00 1.00% of Overall Actual $ 4.2 5.7 90.2 88.2 80.1 52.3NOTES: 1. Predicted $ are mean relative predicted annualized plan liability expenditures for percentile group.2. Actual $ are mean relative actual annualized plan liability expenditures for percentile group.3. Predictive ratio is predicted $ divided by actual $.4. % of overall actual $ is weighted sum of actual $ for percentile group divided by weighted sum of actual $ across entire infant sample, for each metal tier..5. For a given model, percentiles are sorted by predicted $ for that model.6. Infants are age 0–1.SOURCE: Authors’ analysis of 2010 MarketScan® Commercial Claims and Encounters Database.
Marketplaces (Patient Protection and Affordable Care Act, 2013). Individuals who qualify for cost sharing reductions may utilize health care
services at a higher rate than would be the case in the absence of cost sharing reductions. The adjustment for induced demand due to cost sharing
Kautter, J., Pope, G. C., Ingber, M., et al. E25
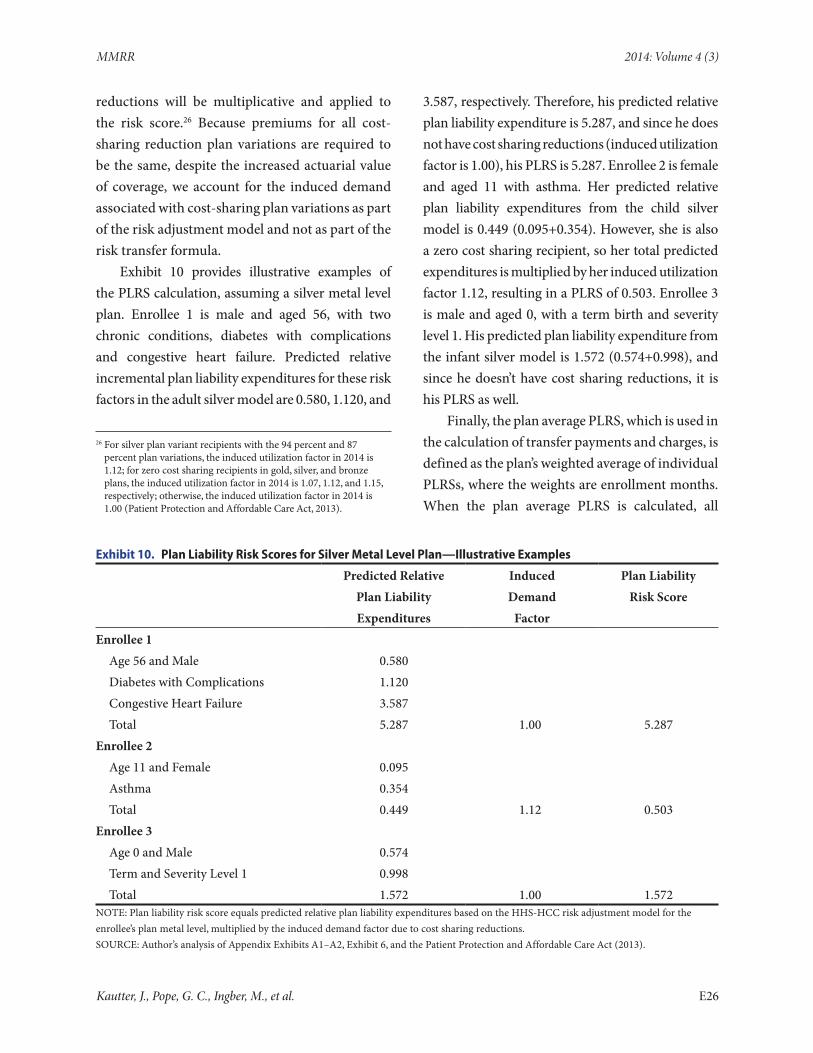
MMRR 2014: Volume 4 (3)
reductions will be multiplicative and applied to the risk score.26 Because premiums for all cost-sharing reduction plan variations are required to be the same, despite the increased actuarial value of coverage, we account for the induced demand associated with cost-sharing plan variations as part of the risk adjustment model and not as part of the risk transfer formula.
Exhibit 10 provides illustrative examples of the PLRS calculation, assuming a silver metal level plan. Enrollee 1 is male and aged 56, with two chronic conditions, diabetes with complications and congestive heart failure. Predicted relative incremental plan liability expenditures for these risk factors in the adult silver model are 0.580, 1.120, and
26 For silver plan variant recipients with the 94 percent and 87 percent plan variations, the induced utilization factor in 2014 is 1.12; for zero cost sharing recipients in gold, silver, and bronze plans, the induced utilization factor in 2014 is 1.07, 1.12, and 1.15, respectively; otherwise, the induced utilization factor in 2014 is 1.00 (Patient Protection and Affordable Care Act, 2013).
3.587, respectively. Therefore, his predicted relative plan liability expenditure is 5.287, and since he does not have cost sharing reductions (induced utilization factor is 1.00), his PLRS is 5.287. Enrollee 2 is female and aged 11 with asthma. Her predicted relative plan liability expenditures from the child silver model is 0.449 (0.095+0.354). However, she is also a zero cost sharing recipient, so her total predicted expenditures is multiplied by her induced utilization factor 1.12, resulting in a PLRS of 0.503. Enrollee 3 is male and aged 0, with a term birth and severity level 1. His predicted plan liability expenditure from the infant silver model is 1.572 (0.574+0.998), and since he doesn’t have cost sharing reductions, it is his PLRS as well.
Finally, the plan average PLRS, which is used in the calculation of transfer payments and charges, is defined as the plan’s weighted average of individual PLRSs, where the weights are enrollment months. When the plan average PLRS is calculated, all
Exhibit 10. Plan Liability Risk Scores for Silver Metal Level Plan—Illustrative Examples
Predicted Relative Induced Plan LiabilityPlan Liability Demand Risk ScoreExpenditures Factor
Enrollee 1Age 56 and Male 0.580Diabetes with Complications 1.120Congestive Heart Failure 3.587Total 5.287 1.00 5.287
Enrollee 2Age 11 and Female 0.095Asthma 0.354Total 0.449 1.12 0.503
Enrollee 3Age 0 and Male 0.574Term and Severity Level 1 0.998Total 1.572 1.00 1.572
NOTE: Plan liability risk score equals predicted relative plan liability expenditures based on the HHS-HCC risk adjustment model for the enrollee’s plan metal level, multiplied by the induced demand factor due to cost sharing reductions.SOURCE: Author’s analysis of Appendix Exhibits A1–A2, Exhibit 6, and the Patient Protection and Affordable Care Act (2013).
Kautter, J., Pope, G. C., Ingber, M., et al. E26
MMRR 2014: Volume 4 (3)
plan enrollees are counted in the numerator, but only billable plan enrollees (parents and the three oldest children) are counted in the denominator (for details, see our companion article on the risk transfer formula).
Conclusion
As discussed in our companion overview article, the key program goal of the ACA risk adjustment methodology developed by HHS is to compensate health insurance plans for differences in enrollee health mix so that plan premiums reflect differences in scope of coverage and other plan factors, but not differences in health status. This article discusses how we developed an empirical risk adjustment model using demographic and diagnostic information from plan enrollees and plan actuarial value (metal tier) to determine a risk score that reflects expected plan liability for enrollee medical expenditures.
This article shows that the HHS risk adjustment model takes into account the new population and generosity of coverage (actuarial value level) in a number of ways. We used private claims data to develop the HHS-HCC diagnostic classification, which is the key component of the risk adjustment model. We developed fifteen separate concurrent plan liability risk adjustment models reflecting three age groups (adult, child, and infant), and five actuarial value tiers (platinum, gold, silver, bronze, and catastrophic). Evaluation of the models showed good predictive accuracy, both for individuals and for groups.
This article also provides several examples of how to calculate risk scores. An enrollee’s “plan liability risk score” is a relative measure of the actuarial risk to the plan for the enrollee. It reflects the health status risk to the plan of the enrollee, the actuarial value of the plan, and the induced demand of the enrollee due to plan variation cost sharing reductions. Plan average risk scores are
then calculated from the enrollee risk scores and used as an input in the risk transfer formula.
In a companion article in this issue of the Medicare & Medicaid Research Review, we discuss the risk transfer formula. We describe how the risk score at the plan level is combined with factors for a plan’s allowable premium rating, actuarial value, induced demand, geographic cost, market share, and the statewide average premium in a formula that calculates balanced transfers among plans. Then we discuss how each plan factor is determined, as well as how the factors relate to each other in the transfer formula.
DisclaimerThe authors have been requested to report any funding sources and other affiliations that may represent a conflict of interest. The authors reported that there are no conflict of interest sources. This study was funded by the Centers for Medicare & Medicaid Services. The views expressed are those of the authors and are not necessarily those of the Centers for Medicare & Medicaid Services.
CorrespondenceJohn Kautter, Ph.D., RTI International, 1440 Main Street, Suite 310, Waltham Massachusetts 02451, [email protected], Tel. (781) 434-1723 Fax. (781) 434-1701.
AcknowledgmentWe would like to thank several people for their contributions to this article. These include John Bertko, Richard Kronick, and others from the HHS “3Rs” advisory group; RTI’s clinician panel, which included John Ayanian, Bruce Landon, Mark Schuster, Thomas Storch, and other clinicians; and RTI computer programmers Arnold Bragg, Helen Margulis, and Aleksandra Petrovic.
References
Breyer, F., Bundorf, K., & Pauly, M. V. (2012). Health Care Spending Risk, Health Insurance, and Payment to Health Plans in M.V. Pauly, T.G. McGuire, and P.P. Barros, eds. Handbook
Kautter, J., Pope, G. C., Ingber, M., et al. E27
MMRR 2014: Volume 4 (3)
of Health Economics, Volume 2. Amsterdam: North Holland, Elsevier.
Buettgens, M., Garrett, B., & Holahan, J. (2010, December). America Under the Affordable Care Act. Urban Institute and Robert Wood Johnson Foundation, 1–16.
Kautter, J., Ingber, M., Pope, G. C., & Freeman, S. (2012). Improvements in Medicare Part D Risk Adjustment: Beneficiary Access and Payment Accuracy. Medical Care, 50, 1102–1108. PubMed http://dx.doi.org/10.1097/MLR.0b013e318269eb20
Kautter, J., Pope, G., & Keenan, P. (2014). Affordable Care Act Risk Adjustment: Overview, Context, and Challenges. Medicare & Medicaid Research Review 4(3).
Patient Protection and Affordable Care Act; HHS Notice of Benefit and Payment Parameters for 2014, 78 Fed.Reg. 47 (March 11, 2013).
Pope, G. C, Bachofer, H., Pearlman, A., Kautter, J., Hunter, E., Miller, D., & Keenan, P. (2014). Risk Transfer Formula for Individual and Small Group Markets Under the Affordable Care Act. Medicare & Medicaid Research Review 4(3).
Pope, G. C., Kautter, J., Ellis, R. P., Ash, A. S., Ayanian, J. Z., Iezzoni, L. I., . . . Robst, J. (2004).
Risk Adjustment for Medicare Capitation Payments Using the CMS-HCC Model. Health Care Financing Review, 25(4), 119–141. PubMed
Trish, E., Damico, A., Claxton, G., Levitt, L., & Garfield, R. (2011, March). A Profile of Health Insurance Exchange Enrollees (Publication No. 8147). The Kaiser Family Foundation.
Van de Ven, W. P. M. M. (2011). Risk Adjustment and Risk Equalization: What Needs to Be Done? Health Economics, Policy, and Law, 6, 147–156. PubMed http://dx.doi.org/10.1017/S1744133110000319
van de Ven, W. P. M. M., & Schut, F. (2011). Guaranteed Access to Affordable Coverage in Individual Health Insurance Markets. in S. Glied and P.C. Smith eds. The Oxford Handbook of Health Economics. Oxford, United Kingdom: Oxford University Press.
van de Ven, W. P. M. M., & Ellis, R. P. (2000). Risk Adjustment in Competitive Health Plan Markets in Anthony J. Culyer and J.P. Newhouse eds. Handbook of Health Economics, Volume 1A. Amsterdam: North-Holland, Elsevier.
Winkelman, R., & Mehmud, S. (2007). A Comparative Analysis of Claims-Based Tools for Health Risk Assessment. Schaumberg, IL: Society of Actuaries.
Kautter, J., Pope, G. C., Ingber, M., et al. E28
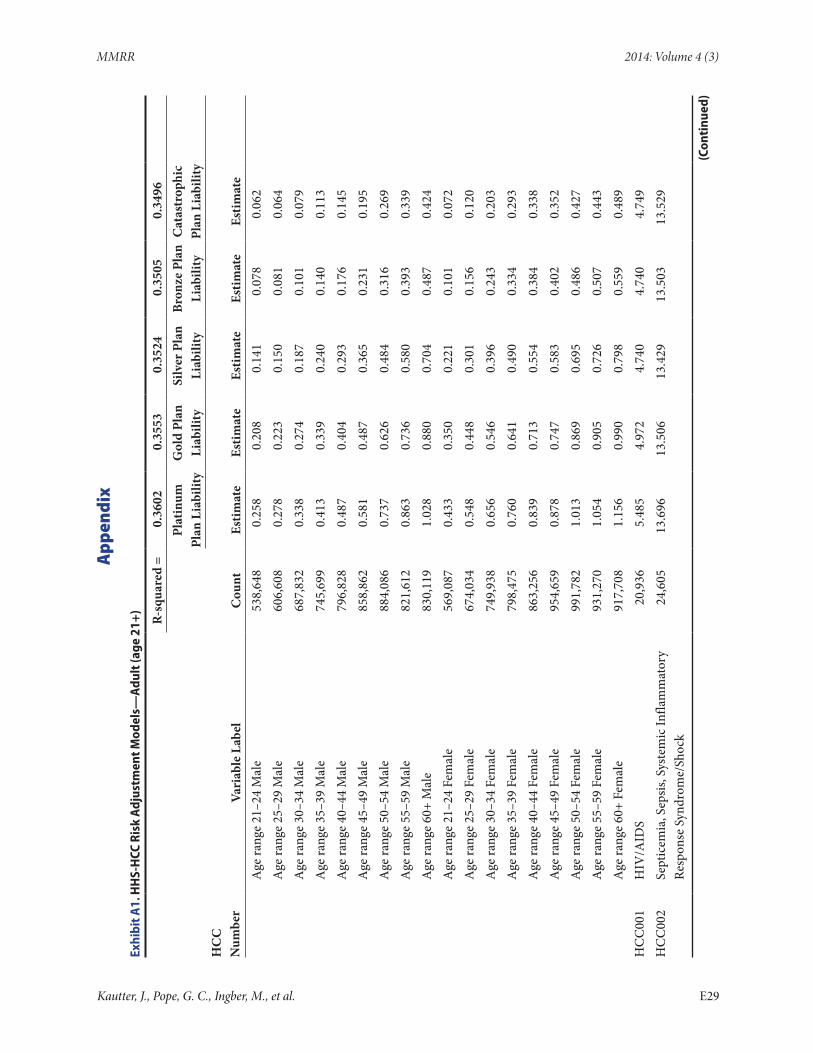
MMRR 2014: Volume 4 (3)
App
endi
x
Exhi
bit A
1. H
HS-
HCC
Ris
k A
djus
tmen
t Mod
els—
Adu
lt (a
ge 2
1+)
R-sq
uare
d =
0.36
020.
3553
0.35
240.
3505
0.34
96
Plat
inum
Pl
an L
iabi
lity
Gol
d Pl
an
Liab
ility
Silv
er P
lan
Liab
ility
Bron
ze P
lan
Liab
ility
Cat
astr
ophi
c Pl
an L
iabi
lity
HC
C
Num
ber
Vari
able
Lab
elC
ount
Estim
ate
Estim
ate
Estim
ate
Estim
ate
Estim
ate
A
ge ra
nge
21–2
4 M
ale
538,
648
0.25
80.
208
0.14
10.
078
0.06
2
Age
rang
e 25
–29
Mal
e60
6,60
80.
278
0.22
30.
150
0.08
10.
064
A
ge ra
nge
30–3
4 M
ale
687,
832
0.33
80.
274
0.18
70.
101
0.07
9
Age
rang
e 35
–39
Mal
e74
5,69
90.
413
0.33
90.
240
0.14
00.
113
A
ge ra
nge
40–4
4 M
ale
796,
828
0.48
70.
404
0.29
30.
176
0.14
5
Age
rang
e 45
–49
Mal
e85
8,86
20.
581
0.48
70.
365
0.23
10.
195
A
ge ra
nge
50–5
4 M
ale
884,
086
0.73
70.
626
0.48
40.
316
0.26
9
Age
rang
e 55
–59
Mal
e82
1,61
20.
863
0.73
60.
580
0.39
30.
339
A
ge ra
nge
60+
Mal
e83
0,11
91.
028
0.88
00.
704
0.48
70.
424
A
ge ra
nge
21–2
4 Fe
mal
e56
9,08
70.
433
0.35
00.
221
0.10
10.
072
A
ge ra
nge
25–2
9 Fe
mal
e67
4,03
40.
548
0.44
80.
301
0.15
60.
120
A
ge ra
nge
30–3
4 Fe
mal
e74
9,93
80.
656
0.54
60.
396
0.24
30.
203
A
ge ra
nge
35–3
9 Fe
mal
e79
8,47
50.
760
0.64
10.
490
0.33
40.
293
A
ge ra
nge
40–4
4 Fe
mal
e86
3,25
60.
839
0.71
30.
554
0.38
40.
338
A
ge ra
nge
45–4
9 Fe
mal
e95
4,65
90.
878
0.74
70.
583
0.40
20.
352
A
ge ra
nge
50–5
4 Fe
mal
e99
1,78
21.
013
0.86
90.
695
0.48
60.
427
A
ge ra
nge
55–5
9 Fe
mal
e93
1,27
01.
054
0.90
50.
726
0.50
70.
443
A
ge ra
nge
60+
Fem
ale
917,
708
1.15
60.
990
0.79
80.
559
0.48
9H
CC
001
HIV
/AID
S20
,936
5.48
54.
972
4.74
04.
740
4.74
9H
CC
002
Sept
icem
ia, S
epsis
, Sys
tem
ic In
flam
mat
ory
Re
spon
se S
yndr
ome/
Shoc
k24
,605
13.6
9613
.506
13.4
2913
.503
13.5
29
(Con
tinu
ed)
Kautter, J., Pope, G. C., Ingber, M., et al. E29
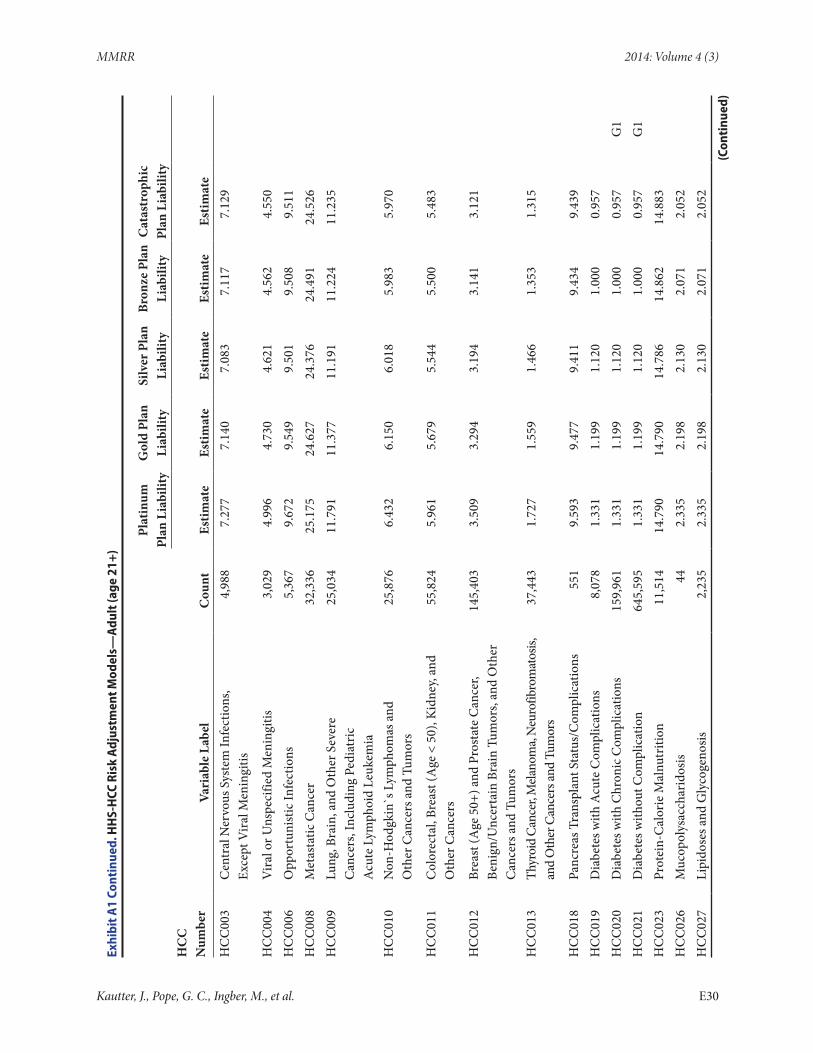
MMRR 2014: Volume 4 (3)
Exhi
bit A
1 Co
ntin
ued.
HH
S-H
CC R
isk
Adj
ustm
ent M
odel
s—A
dult
(age
21+
)
Plat
inum
Pl
an L
iabi
lity
Gol
d Pl
an
Liab
ility
Silv
er P
lan
Liab
ility
Bron
ze P
lan
Liab
ility
Cat
astr
ophi
c Pl
an L
iabi
lity
HC
C
Num
ber
Vari
able
Lab
elC
ount
Estim
ate
Estim
ate
Estim
ate
Estim
ate
Estim
ate
HC
C00
3C
entr
al N
ervo
us S
yste
m In
fect
ions
, Ex
cept
Vira
l Men
ingi
tis4,
988
7.27
77.
140
7.08
37.
117
7.12
9
HC
C00
4V
iral o
r Uns
peci
fied
Men
ingi
tis3,
029
4.99
64.
730
4.62
14.
562
4.55
0H
CC
006
Opp
ortu
nist
ic In
fect
ions
5,36
79.
672
9.54
99.
501
9.50
89.
511
HC
C00
8M
etas
tatic
Can
cer
32,3
3625
.175
24.6
2724
.376
24.4
9124
.526
HC
C00
9Lu
ng, B
rain
, and
Oth
er S
ever
e
Can
cers
, Inc
ludi
ng P
edia
tric
A
cute
Lym
phoi
d Le
ukem
ia
25,0
3411
.791
11.3
7711
.191
11.2
2411
.235
HC
C01
0N
on-H
odgk
in`s
Lym
phom
as a
nd
Oth
er C
ance
rs a
nd T
umor
s25
,876
6.43
26.
150
6.01
85.
983
5.97
0
HC
C01
1C
olor
ecta
l, Br
east
(Age
< 5
0), K
idne
y, an
d O
ther
Can
cers
55,8
245.
961
5.67
95.
544
5.50
05.
483
HC
C01
2Br
east
(Age
50+
) and
Pro
stat
e C
ance
r, Be
nign
/Unc
erta
in B
rain
Tum
ors,
and
Oth
er
Can
cers
and
Tum
ors
145,
403
3.50
93.
294
3.19
43.
141
3.12
1
HC
C01
3Th
yroi
d C
ance
r, M
elano
ma,
Neu
rofib
rom
atos
is,
and
Oth
er C
ance
rs an
d Tu
mor
s37
,443
1.72
71.
559
1.46
61.
353
1.31
5
HC
C01
8Pa
ncre
as T
rans
plan
t Sta
tus/
Com
plic
atio
ns55
19.
593
9.47
79.
411
9.43
49.
439
HC
C01
9D
iabe
tes w
ith A
cute
Com
plic
atio
ns8,
078
1.33
11.
199
1.12
01.
000
0.95
7H
CC
020
Dia
bete
s with
Chr
onic
Com
plic
atio
ns15
9,96
11.
331
1.19
91.
120
1.00
00.
957
G1
HC
C02
1D
iabe
tes w
ithou
t Com
plic
atio
n64
5,59
51.
331
1.19
91.
120
1.00
00.
957
G1
HC
C02
3Pr
otei
n-C
alor
ie M
alnu
triti
on11
,514
14.7
9014
.790
14.7
8614
.862
14.8
83H
CC
026
Muc
opol
ysac
char
idos
is44
2.33
52.
198
2.13
02.
071
2.05
2H
CC
027
Lipi
dose
s and
Gly
coge
nosis
2,23
52.
335
2.19
82.
130
2.07
12.
052
(Con
tinu
ed)
Kautter, J., Pope, G. C., Ingber, M., et al. E30
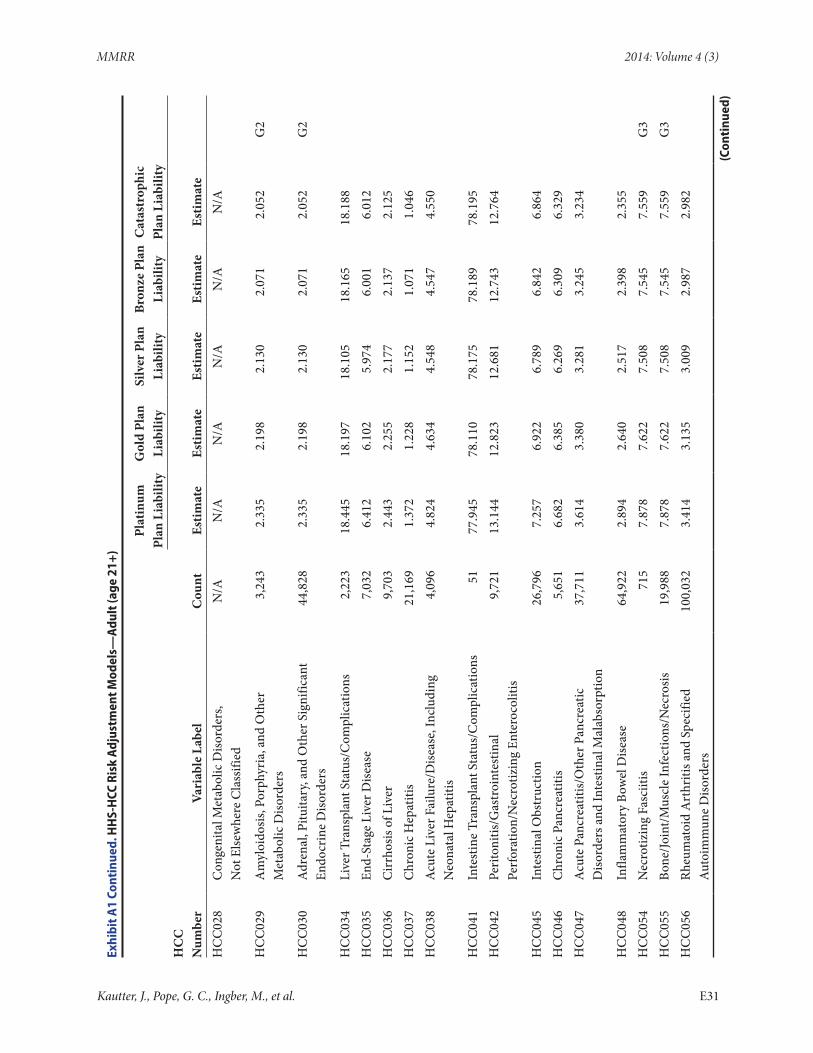
MMRR 2014: Volume 4 (3)
Exhi
bit A
1 Co
ntin
ued.
HH
S-H
CC R
isk
Adj
ustm
ent M
odel
s—A
dult
(age
21+
)
Pl
atin
um
Plan
Lia
bilit
yG
old
Plan
Li
abili
tySi
lver
Pla
n Li
abili
tyBr
onze
Pla
n Li
abili
tyC
atas
trop
hic
Plan
Lia
bilit
yH
CC
N
umbe
rVa
riab
le L
abel
Cou
ntEs
timat
eEs
timat
eEs
timat
eEs
timat
eEs
timat
eH
CC
028
Con
geni
tal M
etab
olic
Diso
rder
s,
Not
Else
whe
re C
lass
ified
N/A
N/A
N/A
N/A
N/A
N/A
HC
C02
9A
myl
oido
sis, P
orph
yria
, and
Oth
er
Met
abol
ic D
isord
ers
3,24
32.
335
2.19
82.
130
2.07
12.
052
G2
HC
C03
0A
dren
al, P
ituita
ry, a
nd O
ther
Sig
nific
ant
Endo
crin
e D
isord
ers
44,8
282.
335
2.19
82.
130
2.07
12.
052
G2
HC
C03
4Li
ver T
rans
plan
t Sta
tus/
Com
plic
atio
ns2,
223
18.4
4518
.197
18.1
0518
.165
18.1
88H
CC
035
End-
Stag
e Li
ver D
iseas
e7,
032
6.41
26.
102
5.97
46.
001
6.01
2H
CC
036
Cir
rhos
is of
Liv
er9,
703
2.44
32.
255
2.17
72.
137
2.12
5H
CC
037
Chr
onic
Hep
atiti
s21
,169
1.37
21.
228
1.15
21.
071
1.04
6H
CC
038
Acu
te L
iver
Fai
lure
/Dise
ase,
Incl
udin
g
Neo
nata
l Hep
atiti
s4,
096
4.82
44.
634
4.54
84.
547
4.55
0
HC
C04
1In
test
ine
Tran
spla
nt S
tatu
s/C
ompl
icat
ions
5177
.945
78.1
1078
.175
78.1
8978
.195
HC
C04
2Pe
riton
itis/
Gas
troi
ntes
tinal
Pe
rfor
atio
n/N
ecro
tizin
g En
tero
colit
is9,
721
13.1
4412
.823
12.6
8112
.743
12.7
64
HC
C04
5In
test
inal
Obs
truc
tion
26,7
967.
257
6.92
26.
789
6.84
26.
864
HC
C04
6C
hron
ic P
ancr
eatit
is5,
651
6.68
26.
385
6.26
96.
309
6.32
9H
CC
047
Acu
te P
ancr
eatit
is/O
ther
Pan
crea
tic
Diso
rder
s and
Inte
stin
al M
alab
sorp
tion
37,7
113.
614
3.38
03.
281
3.24
53.
234
HC
C04
8In
flam
mat
ory
Bow
el D
iseas
e64
,922
2.89
42.
640
2.51
72.
398
2.35
5H
CC
054
Nec
rotiz
ing
Fasc
iitis
715
7.87
87.
622
7.50
87.
545
7.55
9G
3H
CC
055
Bone
/Join
t/Mus
cle
Infe
ctio
ns/N
ecro
sis19
,988
7.87
87.
622
7.50
87.
545
7.55
9G
3H
CC
056
Rheu
mat
oid
Art
hriti
s and
Spe
cifie
d A
utoi
mm
une
Diso
rder
s10
0,03
23.
414
3.13
53.
009
2.98
72.
982
(Con
tinu
ed)
Kautter, J., Pope, G. C., Ingber, M., et al. E31
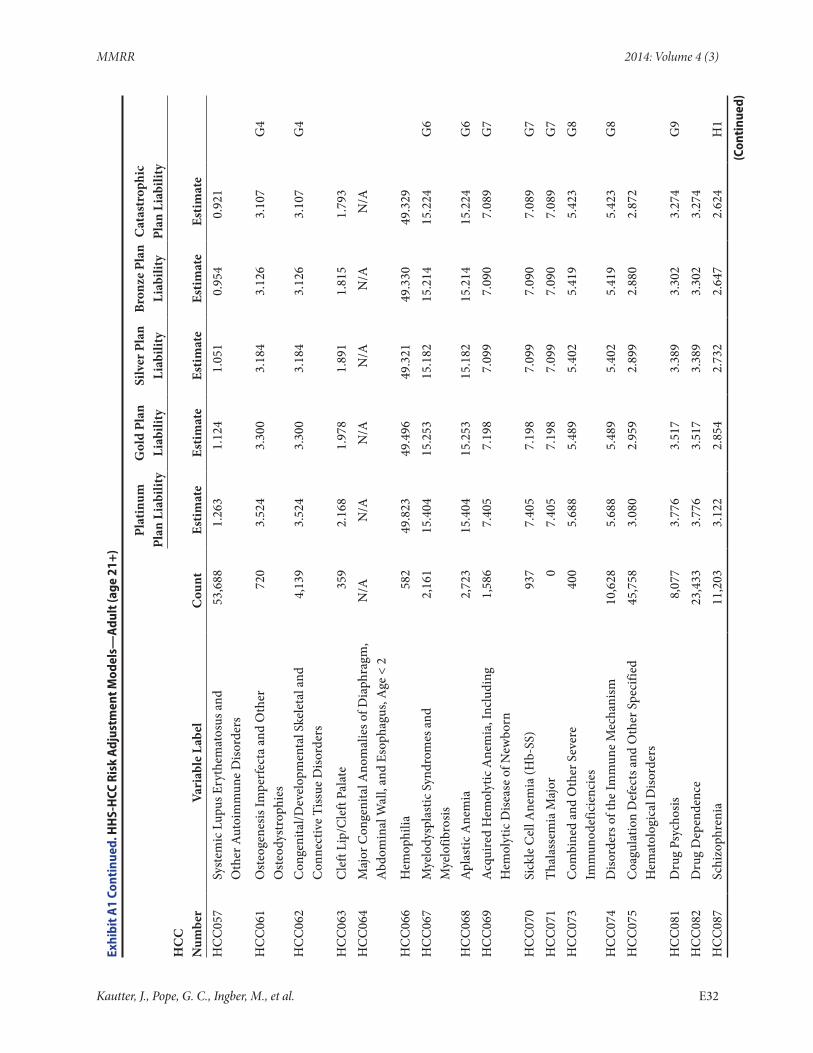
MMRR 2014: Volume 4 (3)
Exhi
bit A
1 Co
ntin
ued.
HH
S-H
CC R
isk
Adj
ustm
ent M
odel
s—A
dult
(age
21+
)
Pl
atin
um
Plan
Lia
bilit
yG
old
Plan
Li
abili
tySi
lver
Pla
n Li
abili
tyBr
onze
Pla
n Li
abili
tyC
atas
trop
hic
Plan
Lia
bilit
yH
CC
N
umbe
rVa
riab
le L
abel
Cou
ntEs
timat
eEs
timat
eEs
timat
eEs
timat
eEs
timat
eH
CC
057
Syst
emic
Lup
us E
ryth
emat
osus
and
O
ther
Aut
oim
mun
e D
isord
ers
53,6
881.
263
1.12
41.
051
0.95
40.
921
HC
C06
1O
steo
gene
sis Im
perf
ecta
and
Oth
er
Ost
eody
stro
phie
s72
03.
524
3.30
03.
184
3.12
63.
107
G4
HC
C06
2C
onge
nita
l/Dev
elop
men
tal S
kele
tal a
nd
Con
nect
ive
Tiss
ue D
isord
ers
4,13
93.
524
3.30
03.
184
3.12
63.
107
G4
HC
C06
3C
left
Lip/
Cle
ft Pa
late
359
2.16
81.
978
1.89
11.
815
1.79
3H
CC
064
Maj
or C
onge
nita
l Ano
mal
ies o
f Dia
phra
gm,
Abd
omin
al W
all,
and
Esop
hagu
s, A
ge <
2N
/AN
/AN
/AN
/AN
/AN
/A
HC
C06
6H
emop
hilia
582
49.8
2349
.496
49.3
2149
.330
49.3
29H
CC
067
Mye
lody
spla
stic
Syn
drom
es a
nd
Mye
lofib
rosis
2,16
115
.404
15.2
5315
.182
15.2
1415
.224
G6
HC
C06
8A
plas
tic A
nem
ia2,
723
15.4
0415
.253
15.1
8215
.214
15.2
24G
6H
CC
069
Acq
uire
d H
emol
ytic
Ane
mia
, Inc
ludi
ng
Hem
olyt
ic D
iseas
e of
New
born
1,58
67.
405
7.19
87.
099
7.09
07.
089
G7
HC
C07
0Si
ckle
Cel
l Ane
mia
(Hb-
SS)
937
7.40
57.
198
7.09
97.
090
7.08
9G
7H
CC
071
Thal
asse
mia
Maj
or0
7.40
57.
198
7.09
97.
090
7.08
9G
7H
CC
073
Com
bine
d an
d O
ther
Sev
ere
Imm
unod
efic
ienc
ies
400
5.68
85.
489
5.40
25.
419
5.42
3G
8
HC
C07
4D
isord
ers o
f the
Imm
une
Mec
hani
sm10
,628
5.68
85.
489
5.40
25.
419
5.42
3G
8H
CC
075
Coa
gula
tion
Def
ects
and
Oth
er S
peci
fied
Hem
atol
ogic
al D
isord
ers
45,7
583.
080
2.95
92.
899
2.88
02.
872
HC
C08
1D
rug
Psyc
hosis
8,07
73.
776
3.51
73.
389
3.30
23.
274
G9
HC
C08
2D
rug
Dep
ende
nce
23,4
333.
776
3.51
73.
389
3.30
23.
274
HC
C08
7Sc
hizo
phre
nia
11,2
033.
122
2.85
42.
732
2.64
72.
624
H1
(Con
tinu
ed)
Kautter, J., Pope, G. C., Ingber, M., et al. E32
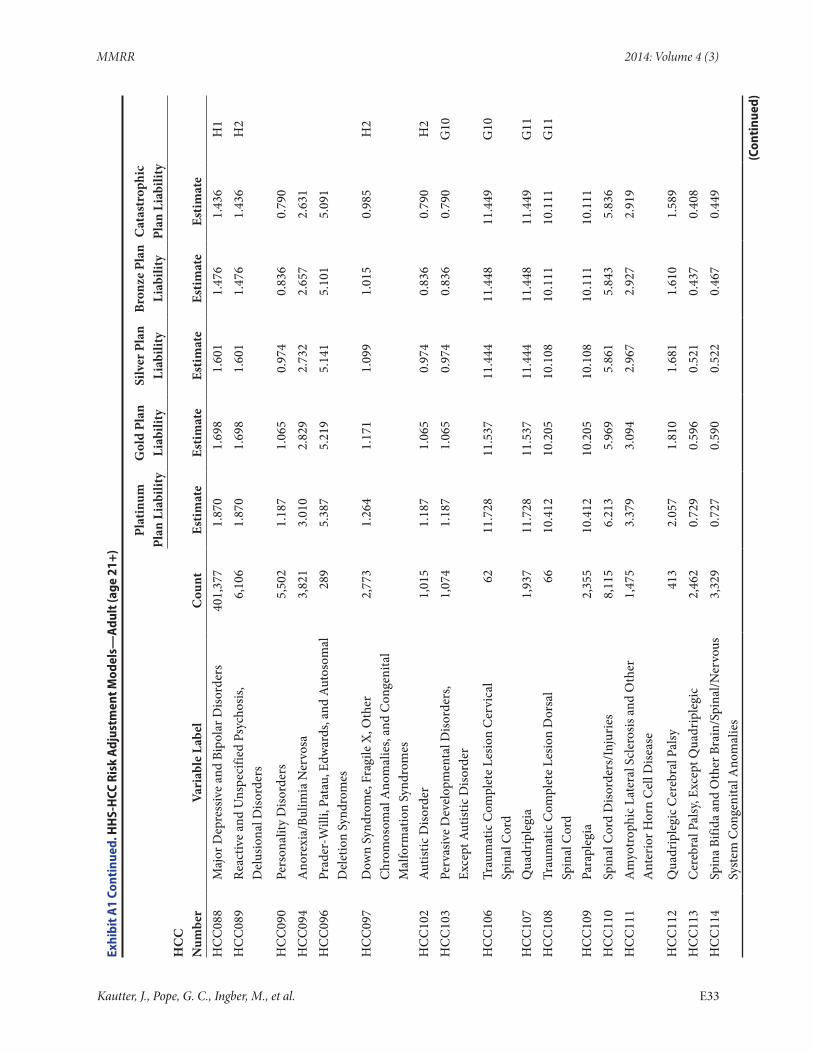
MMRR 2014: Volume 4 (3)
Exhi
bit A
1 Co
ntin
ued.
HH
S-H
CC R
isk
Adj
ustm
ent M
odel
s—A
dult
(age
21+
)
Pl
atin
um
Plan
Lia
bilit
yG
old
Plan
Li
abili
tySi
lver
Pla
n Li
abili
tyBr
onze
Pla
n Li
abili
tyC
atas
trop
hic
Plan
Lia
bilit
yH
CC
N
umbe
rVa
riab
le L
abel
Cou
ntEs
timat
eEs
timat
eEs
timat
eEs
timat
eEs
timat
eH
CC
088
Maj
or D
epre
ssiv
e an
d Bi
pola
r Diso
rder
s40
1,37
71.
870
1.69
81.
601
1.47
61.
436
H1
HC
C08
9Re
activ
e an
d U
nspe
cifie
d Ps
ycho
sis,
Del
usio
nal D
isord
ers
6,10
61.
870
1.69
81.
601
1.47
61.
436
H2
HC
C09
0Pe
rson
ality
Diso
rder
s5,
502
1.18
71.
065
0.97
40.
836
0.79
0H
CC
094
Ano
rexi
a/Bu
limia
Ner
vosa
3,82
13.
010
2.82
92.
732
2.65
72.
631
HC
C09
6Pr
ader
-Will
i, Pa
tau,
Edw
ards
, and
Aut
osom
al
Del
etio
n Sy
ndro
mes
289
5.38
75.
219
5.14
15.
101
5.09
1
HC
C09
7D
own
Synd
rom
e, F
ragi
le X
, Oth
er
Chr
omos
omal
Ano
mal
ies,
and
Con
geni
tal
Mal
form
atio
n Sy
ndro
mes
2,77
31.
264
1.17
11.
099
1.01
50.
985
H2
HC
C10
2A
utist
ic D
isord
er1,
015
1.18
71.
065
0.97
40.
836
0.79
0H
2H
CC
103
Perv
asiv
e D
evel
opm
enta
l Diso
rder
s,
Exce
pt A
utist
ic D
isord
er1,
074
1.18
71.
065
0.97
40.
836
0.79
0G
10
HC
C10
6Tr
aum
atic
Com
plet
e Le
sion
Cer
vica
l Sp
inal
Cor
d62
11.7
2811
.537
11.4
4411
.448
11.4
49G
10
HC
C10
7Q
uadr
iple
gia
1,93
711
.728
11.5
3711
.444
11.4
4811
.449
G11
HC
C10
8Tr
aum
atic
Com
plet
e Le
sion
Dor
sal
Spin
al C
ord
6610
.412
10.2
0510
.108
10.1
1110
.111
G11
HC
C10
9Pa
rapl
egia
2,35
510
.412
10.2
0510
.108
10.1
1110
.111
HC
C11
0Sp
inal
Cor
d D
isord
ers/
Inju
ries
8,11
56.
213
5.96
95.
861
5.84
35.
836
HC
C11
1A
myo
trop
hic L
ater
al S
cler
osis
and
Oth
er
Ant
erio
r Hor
n C
ell D
iseas
e1,
475
3.37
93.
094
2.96
72.
927
2.91
9
HC
C11
2Q
uadr
iple
gic C
ereb
ral P
alsy
413
2.05
71.
810
1.68
11.
610
1.58
9H
CC
113
Cer
ebra
l Pal
sy, E
xcep
t Qua
drip
legi
c2,
462
0.72
90.
596
0.52
10.
437
0.40
8H
CC
114
Spin
a Bi
fida
and
Oth
er B
rain
/Spi
nal/N
ervo
us
Syst
em C
onge
nita
l Ano
mal
ies
3,32
90.
727
0.59
00.
522
0.46
70.
449
(Con
tinu
ed)
Kautter, J., Pope, G. C., Ingber, M., et al. E33
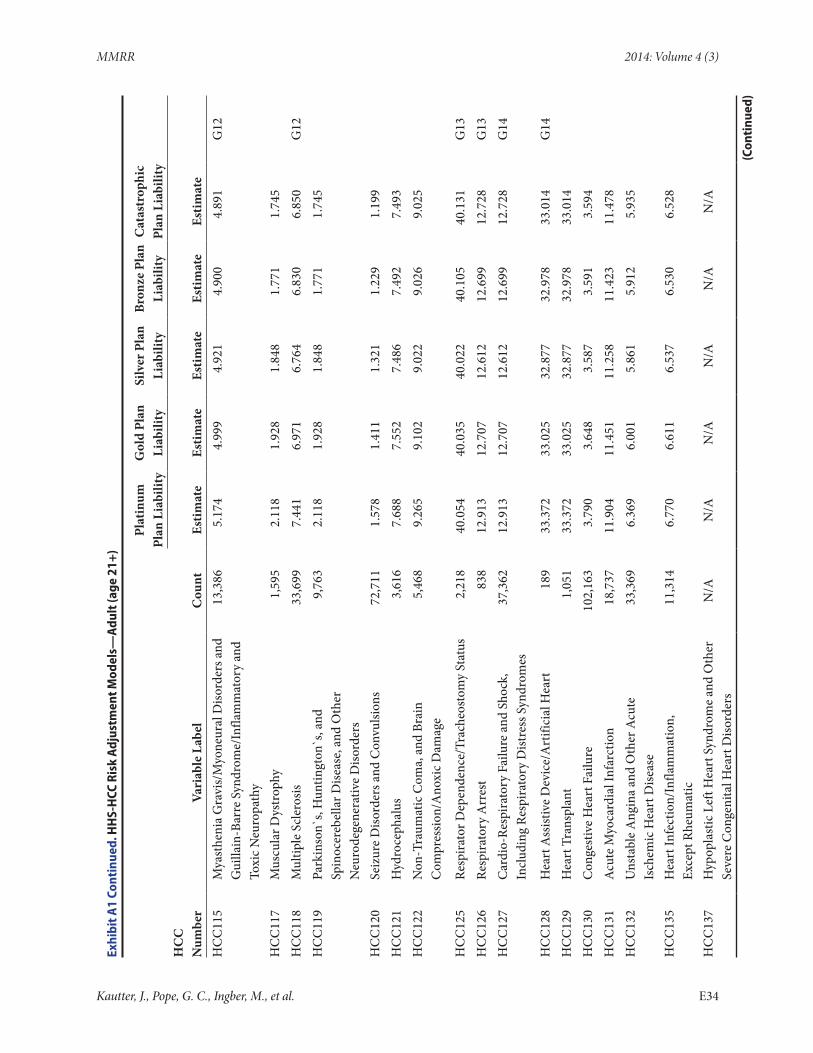
MMRR 2014: Volume 4 (3)
Exhi
bit A
1 Co
ntin
ued.
HH
S-H
CC R
isk
Adj
ustm
ent M
odel
s—A
dult
(age
21+
)
Pl
atin
um
Plan
Lia
bilit
yG
old
Plan
Li
abili
tySi
lver
Pla
n Li
abili
tyBr
onze
Pla
n Li
abili
tyC
atas
trop
hic
Plan
Lia
bilit
yH
CC
N
umbe
rVa
riab
le L
abel
Cou
ntEs
timat
eEs
timat
eEs
timat
eEs
timat
eEs
timat
eH
CC
115
Mya
sthe
nia
Gra
vis/
Myo
neur
al D
isord
ers a
nd
Gui
llain
-Bar
re S
yndr
ome/
Infla
mm
ator
y an
d To
xic N
euro
path
y
13,3
865.
174
4.99
94.
921
4.90
04.
891
G12
HC
C11
7M
uscu
lar D
ystr
ophy
1,59
52.
118
1.92
81.
848
1.77
11.
745
HC
C11
8M
ultip
le S
cler
osis
33,6
997.
441
6.97
16.
764
6.83
06.
850
G12
HC
C11
9Pa
rkin
son`
s, H
untin
gton
`s, a
nd
Spin
ocer
ebel
lar D
iseas
e, a
nd O
ther
N
euro
dege
nera
tive
Diso
rder
s
9,76
32.
118
1.92
81.
848
1.77
11.
745
HC
C12
0Se
izur
e D
isord
ers a
nd C
onvu
lsion
s72
,711
1.57
81.
411
1.32
11.
229
1.19
9H
CC
121
Hyd
roce
phal
us3,
616
7.68
87.
552
7.48
67.
492
7.49
3H
CC
122
Non
-Tra
umat
ic C
oma,
and
Bra
in
Com
pres
sion/
Ano
xic D
amag
e5,
468
9.26
59.
102
9.02
29.
026
9.02
5
HC
C12
5Re
spira
tor D
epen
denc
e/Tr
ache
osto
my
Stat
us2,
218
40.0
5440
.035
40.0
2240
.105
40.1
31G
13H
CC
126
Resp
irato
ry A
rres
t83
812
.913
12.7
0712
.612
12.6
9912
.728
G13
HC
C12
7C
ardi
o-Re
spira
tory
Fai
lure
and
Sho
ck,
Incl
udin
g Re
spira
tory
Dist
ress
Syn
drom
es37
,362
12.9
1312
.707
12.6
1212
.699
12.7
28G
14
HC
C12
8H
eart
Ass
istiv
e D
evic
e/A
rtifi
cial
Hea
rt18
933
.372
33.0
2532
.877
32.9
7833
.014
G14
HC
C12
9H
eart
Tra
nspl
ant
1,05
133
.372
33.0
2532
.877
32.9
7833
.014
HC
C13
0C
onge
stiv
e H
eart
Fai
lure
102,
163
3.79
03.
648
3.58
73.
591
3.59
4H
CC
131
Acu
te M
yoca
rdia
l Inf
arct
ion
18,7
3711
.904
11.4
5111
.258
11.4
2311
.478
HC
C13
2U
nsta
ble
Ang
ina
and
Oth
er A
cute
Is
chem
ic H
eart
Dise
ase
33,3
696.
369
6.00
15.
861
5.91
25.
935
HC
C13
5H
eart
Infe
ctio
n/In
flam
mat
ion,
Ex
cept
Rhe
umat
ic11
,314
6.77
06.
611
6.53
76.
530
6.52
8
HC
C13
7H
ypop
last
ic L
eft H
eart
Syn
drom
e an
d O
ther
Se
vere
Con
geni
tal H
eart
Diso
rder
sN
/AN
/AN
/AN
/AN
/AN
/A
(Con
tinu
ed)
Kautter, J., Pope, G. C., Ingber, M., et al. E34
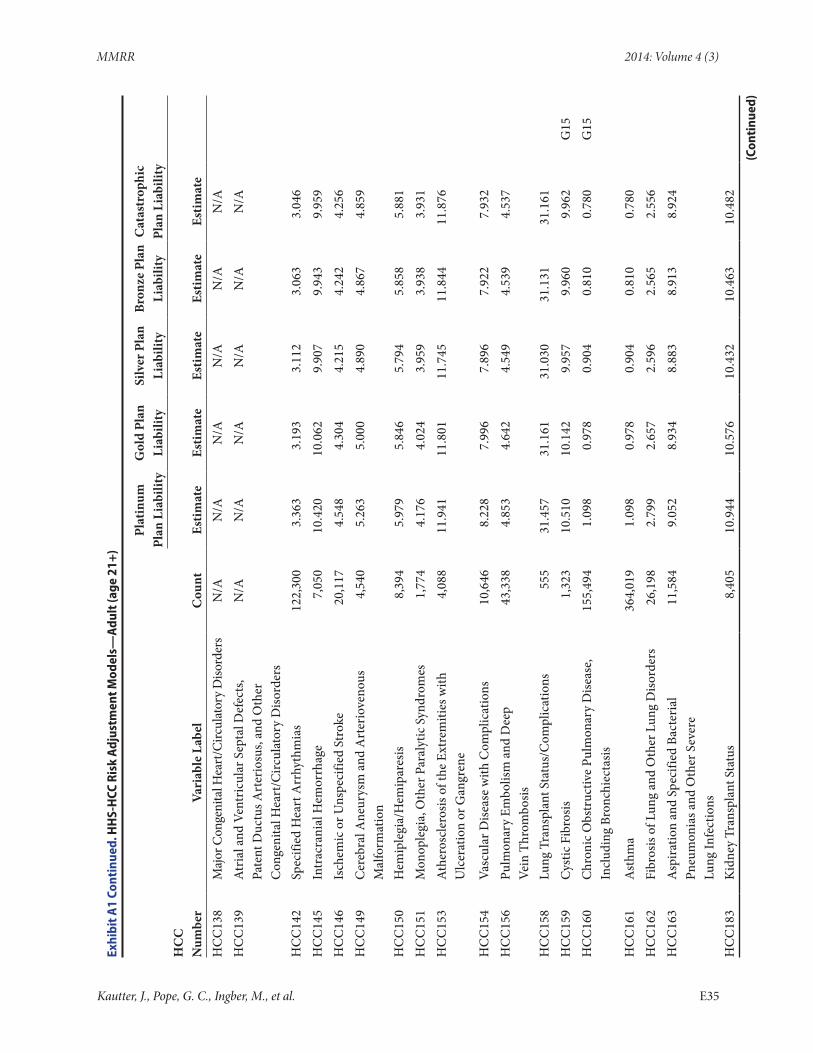
MMRR 2014: Volume 4 (3)
Exhi
bit A
1 Co
ntin
ued.
HH
S-H
CC R
isk
Adj
ustm
ent M
odel
s—A
dult
(age
21+
)
Pl
atin
um
Plan
Lia
bilit
yG
old
Plan
Li
abili
tySi
lver
Pla
n Li
abili
tyBr
onze
Pla
n Li
abili
tyC
atas
trop
hic
Plan
Lia
bilit
yH
CC
N
umbe
rVa
riab
le L
abel
Cou
ntEs
timat
eEs
timat
eEs
timat
eEs
timat
eEs
timat
eH
CC
138
Maj
or C
onge
nita
l Hea
rt/C
ircul
ator
y D
isord
ers
N/A
N/A
N/A
N/A
N/A
N/A
HC
C13
9A
tria
l and
Ven
tric
ular
Sep
tal D
efec
ts,
Pate
nt D
uctu
s Art
erio
sus,
and
Oth
er
Con
geni
tal H
eart
/Circ
ulat
ory
Diso
rder
s
N/A
N/A
N/A
N/A
N/A
N/A
HC
C14
2Sp
ecifi
ed H
eart
Arr
hyth
mia
s12
2,30
03.
363
3.19
33.
112
3.06
33.
046
HC
C14
5In
trac
rani
al H
emor
rhag
e7,
050
10.4
2010
.062
9.90
79.
943
9.95
9H
CC
146
Isch
emic
or U
nspe
cifie
d St
roke
20,1
174.
548
4.30
44.
215
4.24
24.
256
HC
C14
9C
ereb
ral A
neur
ysm
and
Art
erio
veno
us
Mal
form
atio
n4,
540
5.26
35.
000
4.89
04.
867
4.85
9
HC
C15
0H
emip
legi
a/H
emip
ares
is8,
394
5.97
95.
846
5.79
45.
858
5.88
1H
CC
151
Mon
ople
gia,
Oth
er P
aral
ytic
Syn
drom
es1,
774
4.17
64.
024
3.95
93.
938
3.93
1H
CC
153
Ath
eros
cler
osis
of th
e Ex
trem
ities
with
U
lcer
atio
n or
Gan
gren
e4,
088
11.9
4111
.801
11.7
4511
.844
11.8
76
HC
C15
4Va
scul
ar D
iseas
e w
ith C
ompl
icat
ions
10,6
468.
228
7.99
67.
896
7.92
27.
932
HC
C15
6Pu
lmon
ary
Embo
lism
and
Dee
p
Vein
Thr
ombo
sis43
,338
4.85
34.
642
4.54
94.
539
4.53
7
HC
C15
8Lu
ng T
rans
plan
t Sta
tus/
Com
plic
atio
ns55
531
.457
31.1
6131
.030
31.1
3131
.161
HC
C15
9C
ystic
Fib
rosis
1,32
310
.510
10.1
429.
957
9.96
09.
962
G15
HC
C16
0C
hron
ic O
bstr
uctiv
e Pu
lmon
ary
Dise
ase,
In
clud
ing
Bron
chie
ctas
is15
5,49
41.
098
0.97
80.
904
0.81
00.
780
G15
HC
C16
1A
sthm
a36
4,01
91.
098
0.97
80.
904
0.81
00.
780
HC
C16
2Fi
bros
is of
Lun
g an
d O
ther
Lun
g D
isord
ers
26,1
982.
799
2.65
72.
596
2.56
52.
556
HC
C16
3A
spira
tion
and
Spec
ified
Bac
teri
al
Pneu
mon
ias a
nd O
ther
Sev
ere
Lu
ng In
fect
ions
11,5
849.
052
8.93
48.
883
8.91
38.
924
HC
C18
3K
idne
y Tr
ansp
lant
Sta
tus
8,40
510
.944
10.5
7610
.432
10.4
6310
.482
(Con
tinu
ed)
Kautter, J., Pope, G. C., Ingber, M., et al. E35
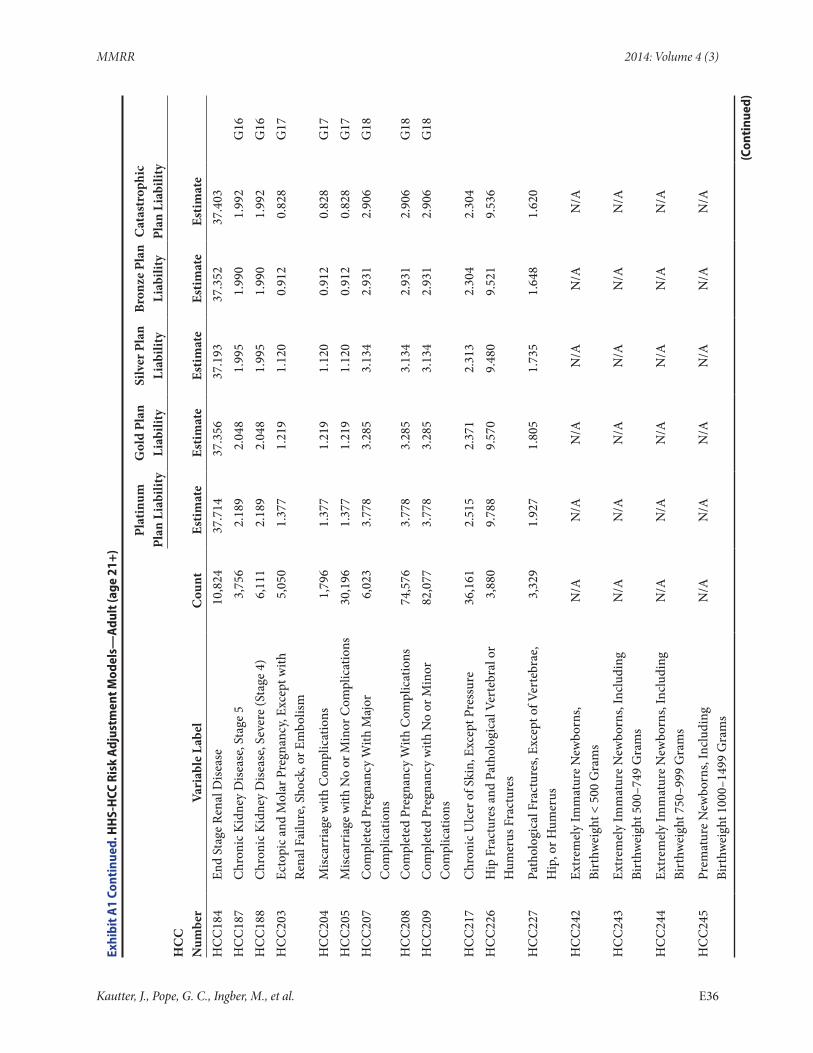
MMRR 2014: Volume 4 (3)
Exhi
bit A
1 Co
ntin
ued.
HH
S-H
CC R
isk
Adj
ustm
ent M
odel
s—A
dult
(age
21+
)
Pl
atin
um
Plan
Lia
bilit
yG
old
Plan
Li
abili
tySi
lver
Pla
n Li
abili
tyBr
onze
Pla
n Li
abili
tyC
atas
trop
hic
Plan
Lia
bilit
yH
CC
N
umbe
rVa
riab
le L
abel
Cou
ntEs
timat
eEs
timat
eEs
timat
eEs
timat
eEs
timat
eH
CC
184
End
Stag
e Re
nal D
iseas
e10
,824
37.7
1437
.356
37.1
9337
.352
37.4
03H
CC
187
Chr
onic
Kid
ney
Dise
ase,
Sta
ge 5
3,75
62.
189
2.04
81.
995
1.99
01.
992
G16
HC
C18
8C
hron
ic K
idne
y D
iseas
e, S
ever
e (S
tage
4)
6,11
12.
189
2.04
81.
995
1.99
01.
992
G16
HC
C20
3Ec
topi
c and
Mol
ar P
regn
ancy
, Exc
ept w
ith
Rena
l Fai
lure
, Sho
ck, o
r Em
bolis
m5,
050
1.37
71.
219
1.12
00.
912
0.82
8G
17
HC
C20
4M
iscar
riag
e w
ith C
ompl
icat
ions
1,79
61.
377
1.21
91.
120
0.91
20.
828
G17
HC
C20
5M
iscar
riag
e with
No
or M
inor
Com
plic
atio
ns30
,196
1.37
71.
219
1.12
00.
912
0.82
8G
17H
CC
207
Com
plet
ed P
regn
ancy
With
Maj
or
Com
plic
atio
ns6,
023
3.77
83.
285
3.13
42.
931
2.90
6G
18
HC
C20
8C
ompl
eted
Pre
gnan
cy W
ith C
ompl
icat
ions
74,5
763.
778
3.28
53.
134
2.93
12.
906
G18
HC
C20
9C
ompl
eted
Pre
gnan
cy w
ith N
o or
Min
or
Com
plic
atio
ns82
,077
3.77
83.
285
3.13
42.
931
2.90
6G
18
HC
C21
7C
hron
ic U
lcer
of S
kin,
Exc
ept P
ress
ure
36,1
612.
515
2.37
12.
313
2.30
42.
304
HC
C22
6H
ip F
ract
ures
and
Pat
holo
gica
l Ver
tebr
al o
r H
umer
us F
ract
ures
3,88
09.
788
9.57
09.
480
9.52
19.
536
HC
C22
7Pa
thol
ogic
al F
ract
ures
, Exc
ept o
f Ver
tebr
ae,
Hip
, or H
umer
us3,
329
1.92
71.
805
1.73
51.
648
1.62
0
HC
C24
2Ex
trem
ely
Imm
atur
e N
ewbo
rns,
Bi
rthw
eigh
t < 5
00 G
ram
sN
/AN
/AN
/AN
/AN
/AN
/A
HC
C24
3Ex
trem
ely
Imm
atur
e N
ewbo
rns,
Incl
udin
g Bi
rthw
eigh
t 500
–749
Gra
ms
N/A
N/A
N/A
N/A
N/A
N/A
HC
C24
4Ex
trem
ely
Imm
atur
e N
ewbo
rns,
Incl
udin
g Bi
rthw
eigh
t 750
–999
Gra
ms
N/A
N/A
N/A
N/A
N/A
N/A
HC
C24
5Pr
emat
ure
New
born
s, In
clud
ing
Bi
rthw
eigh
t 100
0–14
99 G
ram
sN
/AN
/AN
/AN
/AN
/AN
/A
(Con
tinu
ed)
Kautter, J., Pope, G. C., Ingber, M., et al. E36
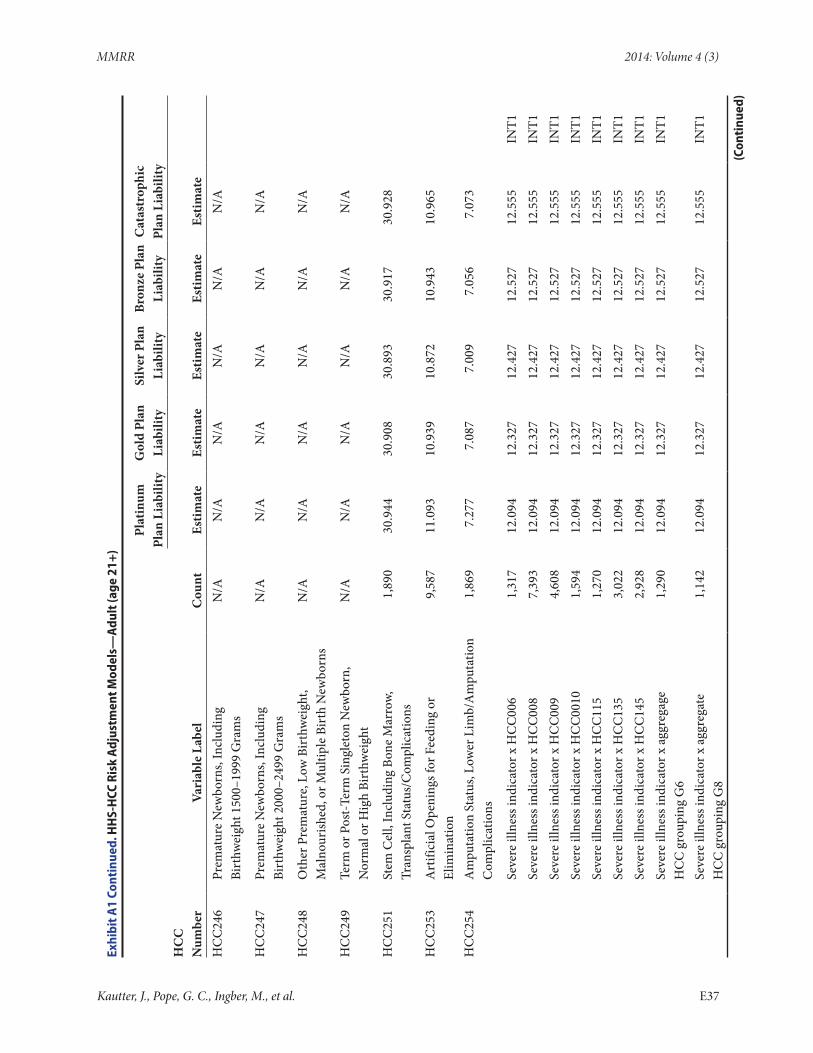
MMRR 2014: Volume 4 (3)
Exhi
bit A
1 Co
ntin
ued.
HH
S-H
CC R
isk
Adj
ustm
ent M
odel
s—A
dult
(age
21+
)
Pl
atin
um
Plan
Lia
bilit
yG
old
Plan
Li
abili
tySi
lver
Pla
n Li
abili
tyBr
onze
Pla
n Li
abili
tyC
atas
trop
hic
Plan
Lia
bilit
yH
CC
N
umbe
rVa
riab
le L
abel
Cou
ntEs
timat
eEs
timat
eEs
timat
eEs
timat
eEs
timat
eH
CC
246
Prem
atur
e N
ewbo
rns,
Incl
udin
g
Birt
hwei
ght 1
500–
1999
Gra
ms
N/A
N/A
N/A
N/A
N/A
N/A
HC
C24
7Pr
emat
ure
New
born
s, In
clud
ing
Bi
rthw
eigh
t 200
0–24
99 G
ram
sN
/AN
/AN
/AN
/AN
/AN
/A
HC
C24
8O
ther
Pre
mat
ure,
Low
Bir
thw
eigh
t, M
alno
urish
ed, o
r Mul
tiple
Bir
th N
ewbo
rns
N/A
N/A
N/A
N/A
N/A
N/A
HC
C24
9Te
rm o
r Pos
t-Te
rm S
ingl
eton
New
born
, N
orm
al o
r Hig
h Bi
rthw
eigh
tN
/AN
/AN
/AN
/AN
/AN
/A
HC
C25
1St
em C
ell,
Incl
udin
g Bo
ne M
arro
w,
Tran
spla
nt S
tatu
s/C
ompl
icat
ions
1,89
030
.944
30.9
0830
.893
30.9
1730
.928
HC
C25
3A
rtifi
cial
Ope
ning
s for
Fee
ding
or
Elim
inat
ion
9,58
711
.093
10.9
3910
.872
10.9
4310
.965
HC
C25
4A
mpu
tatio
n St
atus
, Low
er L
imb/
Am
puta
tion
Com
plic
atio
ns1,
869
7.27
77.
087
7.00
97.
056
7.07
3
Se
vere
illn
ess i
ndic
ator
x H
CC
006
1,31
712
.094
12.3
2712
.427
12.5
2712
.555
INT1
Se
vere
illn
ess i
ndic
ator
x H
CC
008
7,39
312
.094
12.3
2712
.427
12.5
2712
.555
INT1
Se
vere
illn
ess i
ndic
ator
x H
CC
009
4,60
812
.094
12.3
2712
.427
12.5
2712
.555
INT1
Se
vere
illn
ess i
ndic
ator
x H
CC
0010
1,59
412
.094
12.3
2712
.427
12.5
2712
.555
INT1
Se
vere
illn
ess i
ndic
ator
x H
CC
115
1,27
012
.094
12.3
2712
.427
12.5
2712
.555
INT1
Se
vere
illn
ess i
ndic
ator
x H
CC
135
3,02
212
.094
12.3
2712
.427
12.5
2712
.555
INT1
Se
vere
illn
ess i
ndic
ator
x H
CC
145
2,92
812
.094
12.3
2712
.427
12.5
2712
.555
INT1
Se
vere
illn
ess i
ndic
ator
x a
ggre
gage
H
CC
gro
upin
g G
61,
290
12.0
9412
.327
12.4
2712
.527
12.5
55IN
T1
Se
vere
illn
ess i
ndic
ator
x a
ggre
gate
H
CC
gro
upin
g G
81,
142
12.0
9412
.327
12.4
2712
.527
12.5
55IN
T1
(Con
tinu
ed)
Kautter, J., Pope, G. C., Ingber, M., et al. E37
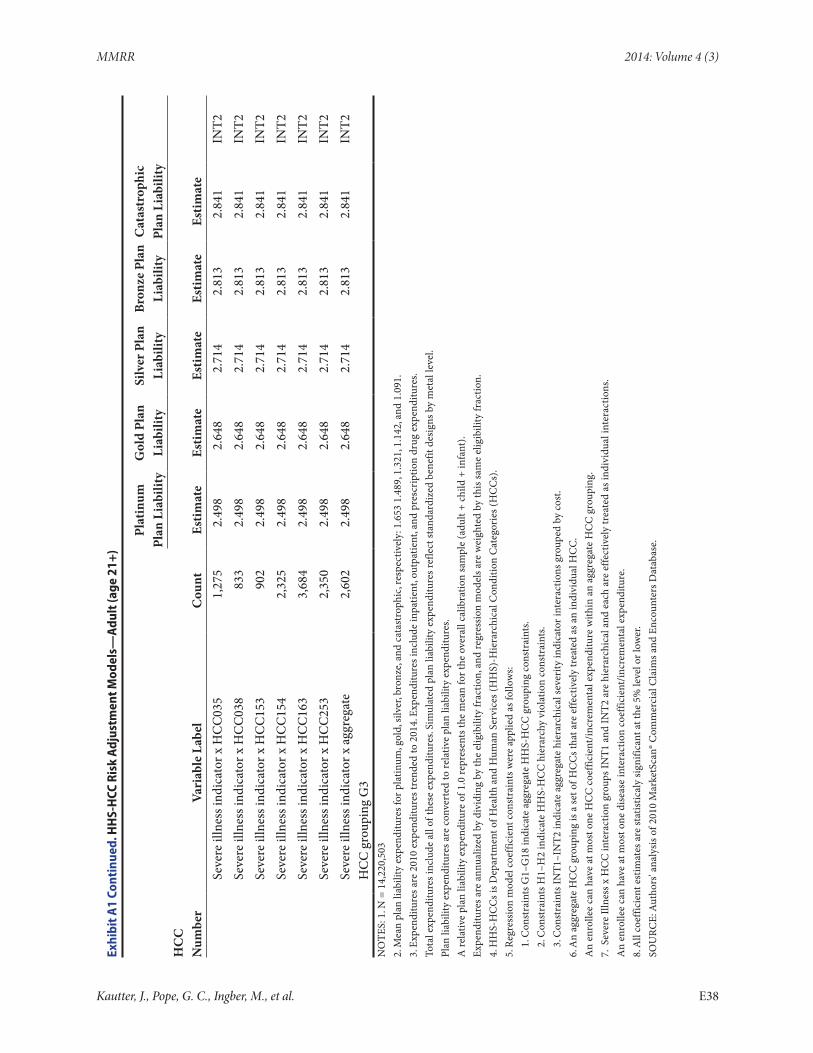
MMRR 2014: Volume 4 (3)
Exhi
bit A
1 Co
ntin
ued.
HH
S-H
CC R
isk
Adj
ustm
ent M
odel
s—A
dult
(age
21+
)
Pl
atin
um
Plan
Lia
bilit
yG
old
Plan
Li
abili
tySi
lver
Pla
n Li
abili
tyBr
onze
Pla
n Li
abili
tyC
atas
trop
hic
Plan
Lia
bilit
yH
CC
N
umbe
rVa
riab
le L
abel
Cou
ntEs
timat
eEs
timat
eEs
timat
eEs
timat
eEs
timat
e
Seve
re il
lnes
s ind
icat
or x
HC
C03
51,
275
2.49
82.
648
2.71
42.
813
2.84
1IN
T2
Seve
re il
lnes
s ind
icat
or x
HC
C03
883
32.
498
2.64
82.
714
2.81
32.
841
INT2
Se
vere
illn
ess i
ndic
ator
x H
CC
153
902
2.49
82.
648
2.71
42.
813
2.84
1IN
T2
Seve
re il
lnes
s ind
icat
or x
HC
C15
42,
325
2.49
82.
648
2.71
42.
813
2.84
1IN
T2
Seve
re il
lnes
s ind
icat
or x
HC
C16
33,
684
2.49
82.
648
2.71
42.
813
2.84
1IN
T2
Seve
re il
lnes
s ind
icat
or x
HC
C25
32,
350
2.49
82.
648
2.71
42.
813
2.84
1IN
T2
Seve
re il
lnes
s ind
icat
or x
agg
rega
te
HC
C g
roup
ing
G3
2,60
22.
498
2.64
82.
714
2.81
32.
841
INT2
NO
TES:
1. N
= 1
4,22
0,50
32.
Mea
n pl
an li
abili
ty e
xpen
ditu
res f
or p
latin
um, g
old,
silv
er, b
ronz
e, an
d ca
tast
roph
ic, r
espe
ctiv
ely:
1.6
53 1
.489
, 1.3
21, 1
.142
, and
1.0
91.
3. E
xpen
ditu
res a
re 2
010
expe
nditu
res t
rend
ed to
201
4. E
xpen
ditu
res i
nclu
de in
patie
nt, o
utpa
tient
, and
pre
scri
ptio
n dr
ug e
xpen
ditu
res.
Tota
l exp
endi
ture
s inc
lude
all
of th
ese
expe
nditu
res.
Sim
ulat
ed p
lan
liabi
lity
expe
nditu
res r
efle
ct st
anda
rdiz
ed b
enef
it de
sign
s by
met
al le
vel.
Plan
liab
ility
exp
endi
ture
s are
con
vert
ed to
rela
tive
plan
liab
ility
exp
endi
ture
s.A
rela
tive
plan
liab
ility
exp
endi
ture
of 1
.0 re
pres
ents
the
mea
n fo
r the
ove
rall
calib
ratio
n sa
mpl
e (a
dult
+ ch
ild +
infa
nt).
Expe
nditu
res a
re a
nnua
lized
by
divi
ding
by
the
elig
ibili
ty fr
actio
n, a
nd re
gres
sion
mod
els a
re w
eigh
ted
by th
is sa
me
elig
ibili
ty fr
actio
n.4.
HH
S-H
CC
s is D
epar
tmen
t of H
ealth
and
Hum
an S
ervi
ces (
HH
S)-H
iera
rchi
cal C
ondi
tion
Cat
egor
ies (
HC
Cs)
.5.
Reg
ress
ion
mod
el c
oeffi
cien
t con
stra
ints
wer
e ap
plie
d as
follo
ws:
1. C
onst
rain
ts G
1–G
18 in
dica
te a
ggre
gate
HH
S-H
CC
gro
upin
g co
nstr
aint
s.2.
Con
stra
ints
H1–
H2
indi
cate
HH
S-H
CC
hie
rarc
hy v
iola
tion
cons
trai
nts.
3. C
onst
rain
ts IN
T1–I
NT2
indi
cate
agg
rega
te h
iera
rchi
cal s
ever
ity in
dica
tor i
nter
actio
ns g
roup
ed b
y co
st.
6. A
n ag
greg
ate
HC
C g
roup
ing
is a
set o
f HC
Cs t
hat a
re e
ffect
ivel
y tr
eate
d as
an
indi
vidu
al H
CC
.A
n en
rolle
e ca
n ha
ve a
t mos
t one
HC
C c
oeffi
cien
t/in
crem
enta
l exp
endi
ture
with
in a
n ag
greg
ate
HC
C g
roup
ing.
7. S
ever
e Ill
ness
x H
CC
inte
ract
ion
grou
ps IN
T1 a
nd IN
T2 a
re h
iera
rchi
cal a
nd e
ach
are
effe
ctiv
ely
trea
ted
as in
divi
dual
inte
ract
ions
.A
n en
rolle
e ca
n ha
ve a
t mos
t one
dis
ease
inte
ract
ion
coef
ficie
nt/in
crem
enta
l exp
endi
ture
.8.
All
coef
ficie
nt e
stim
ates
are
stat
istic
aly
sign
ifica
nt a
t the
5%
leve
l or l
ower
.SO
URC
E: A
utho
rs' a
naly
sis o
f 201
0 M
arke
tSca
n® C
omm
erci
al C
laim
s and
Enc
ount
ers D
atab
ase.
Kautter, J., Pope, G. C., Ingber, M., et al. E38
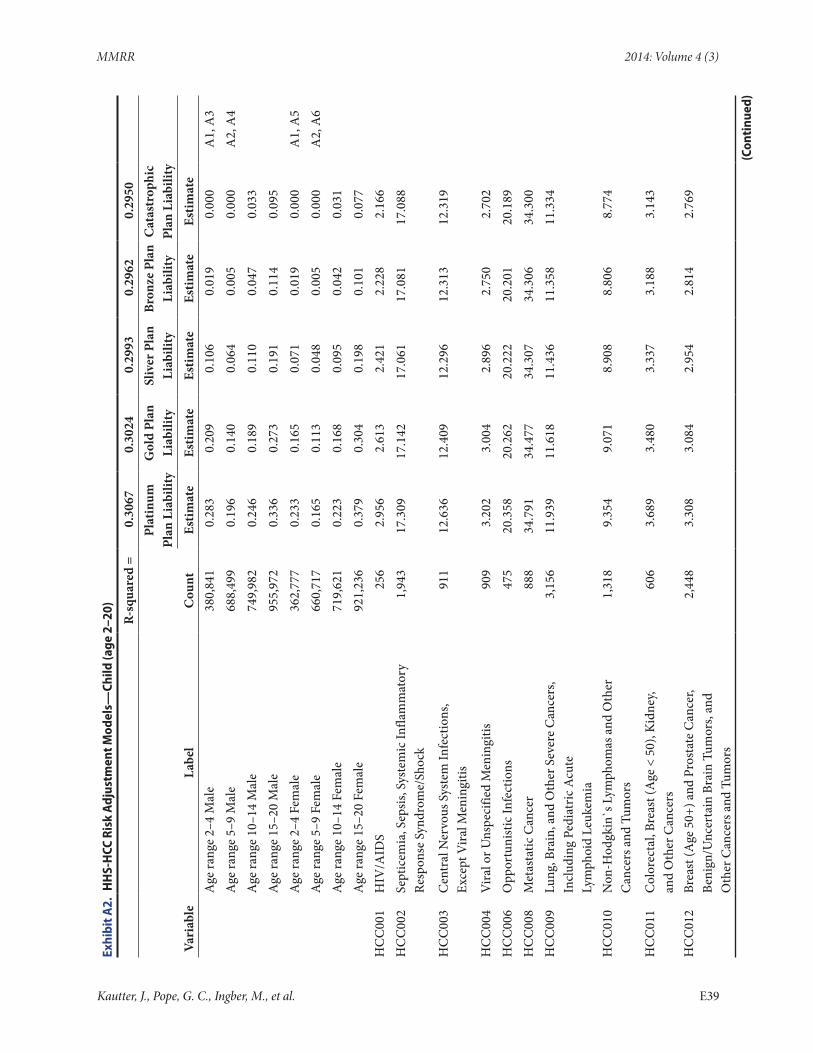
MMRR 2014: Volume 4 (3)
Exhi
bit A
2. H
HS-
HCC
Ris
k A
djus
tmen
t Mod
els—
Child
(age
2–2
0)
R-sq
uare
d =
0.30
670.
3024
0.29
930.
2962
0.29
50
Pl
atin
um
Plan
Lia
bilit
yG
old
Plan
Li
abili
tySl
iver
Pla
n Li
abili
tyBr
onze
Pla
n Li
abili
tyC
atas
trop
hic
Plan
Lia
bilit
y
Vari
able
Labe
lC
ount
Estim
ate
Estim
ate
Estim
ate
Estim
ate
Estim
ate
Age
rang
e 2–
4 M
ale
380,
841
0.28
30.
209
0.10
60.
019
0.00
0A
1, A
3
Age
rang
e 5–
9 M
ale
688,
499
0.19
60.
140
0.06
40.
005
0.00
0A
2, A
4
Age
rang
e 10
–14
Mal
e74
9,98
20.
246
0.18
90.
110
0.04
70.
033
Age
rang
e 15
–20
Mal
e95
5,97
20.
336
0.27
30.
191
0.11
40.
095
Age
rang
e 2–
4 Fe
mal
e36
2,77
70.
233
0.16
50.
071
0.01
90.
000
A1,
A5
A
ge ra
nge
5–9
Fem
ale
660,
717
0.16
50.
113
0.04
80.
005
0.00
0A
2, A
6
Age
rang
e 10
–14
Fem
ale
719,
621
0.22
30.
168
0.09
50.
042
0.03
1
A
ge ra
nge
15–2
0 Fe
mal
e92
1,23
60.
379
0.30
40.
198
0.10
10.
077
H
CC
001
HIV
/AID
S25
62.
956
2.61
32.
421
2.22
82.
166
H
CC
002
Sept
icem
ia, S
epsis
, Sys
tem
ic In
flam
mat
ory
Resp
onse
Syn
drom
e/Sh
ock
1,94
317
.309
17.1
4217
.061
17.0
8117
.088
HC
C00
3C
entr
al N
ervo
us S
yste
m In
fect
ions
, Ex
cept
Vira
l Men
ingi
tis91
112
.636
12.4
0912
.296
12.3
1312
.319
HC
C00
4V
iral o
r Uns
peci
fied
Men
ingi
tis90
93.
202
3.00
42.
896
2.75
02.
702
H
CC
006
Opp
ortu
nist
ic In
fect
ions
475
20.3
5820
.262
20.2
2220
.201
20.1
89
HC
C00
8M
etas
tatic
Can
cer
888
34.7
9134
.477
34.3
0734
.306
34.3
00
HC
C00
9Lu
ng, B
rain
, and
Oth
er S
ever
e C
ance
rs,
Incl
udin
g Pe
diat
ric A
cute
Ly
mph
oid
Leuk
emia
3,15
611
.939
11.6
1811
.436
11.3
5811
.334
HC
C01
0N
on-H
odgk
in`s
Lym
phom
as a
nd O
ther
C
ance
rs a
nd T
umor
s1,
318
9.35
49.
071
8.90
88.
806
8.77
4
HC
C01
1C
olor
ecta
l, Br
east
(Age
< 5
0), K
idne
y,
and
Oth
er C
ance
rs60
63.
689
3.48
03.
337
3.18
83.
143
HC
C01
2Br
east
(Age
50+
) and
Pro
stat
e C
ance
r,
Beni
gn/U
ncer
tain
Bra
in T
umor
s, an
d
Oth
er C
ance
rs a
nd T
umor
s
2,44
83.
308
3.08
42.
954
2.81
42.
769
(Con
tinu
ed)
Kautter, J., Pope, G. C., Ingber, M., et al. E39
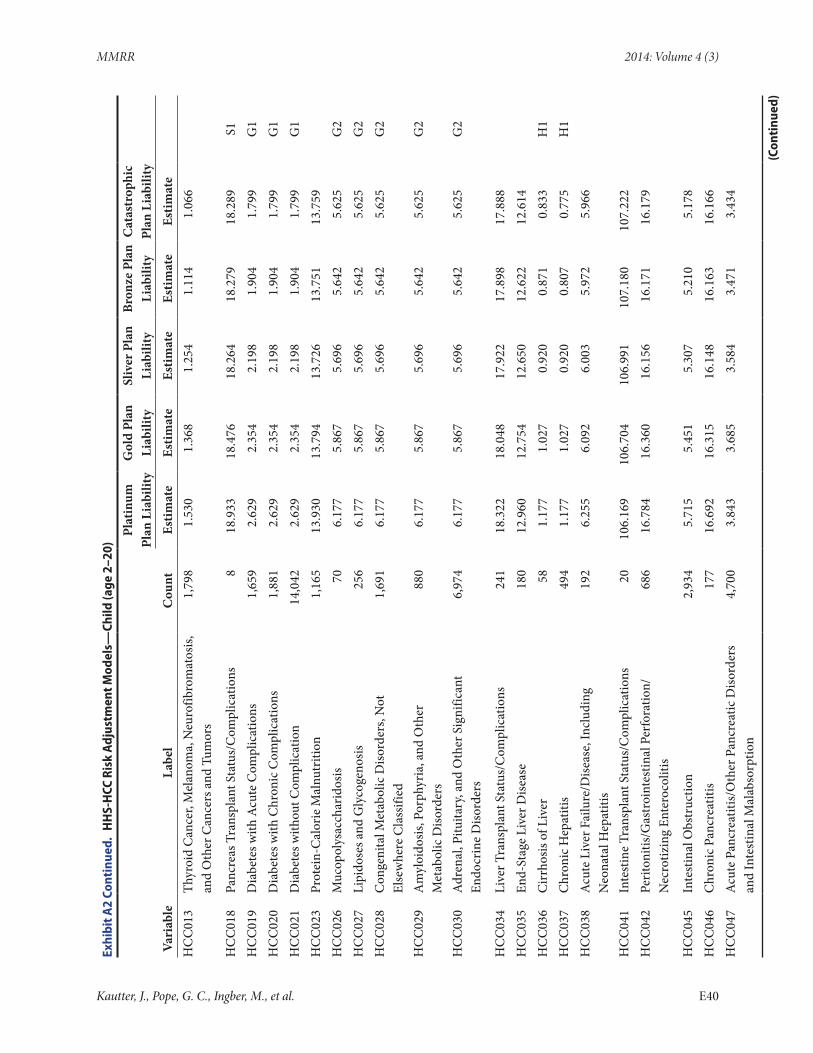
MMRR 2014: Volume 4 (3)
Exhi
bit A
2 Co
ntin
ued.
HH
S-H
CC R
isk
Adj
ustm
ent M
odel
s—Ch
ild (a
ge 2
–20)
Pl
atin
um
Plan
Lia
bilit
yG
old
Plan
Li
abili
tySl
iver
Pla
n Li
abili
tyBr
onze
Pla
n Li
abili
tyC
atas
trop
hic
Plan
Lia
bilit
y
Vari
able
Labe
lC
ount
Estim
ate
Estim
ate
Estim
ate
Estim
ate
Estim
ate
H
CC
013
Thyr
oid
Can
cer,
Mel
anom
a, N
euro
fibro
mat
osis,
an
d O
ther
Can
cers
and
Tum
ors
1,79
81.
530
1.36
81.
254
1.11
41.
066
HC
C01
8Pa
ncre
as T
rans
plan
t Sta
tus/
Com
plic
atio
ns8
18.9
3318
.476
18.2
6418
.279
18.2
89S1
HC
C01
9D
iabe
tes w
ith A
cute
Com
plic
atio
ns1,
659
2.62
92.
354
2.19
81.
904
1.79
9G
1H
CC
020
Dia
bete
s with
Chr
onic
Com
plic
atio
ns1,
881
2.62
92.
354
2.19
81.
904
1.79
9G
1H
CC
021
Dia
bete
s with
out C
ompl
icat
ion
14,0
422.
629
2.35
42.
198
1.90
41.
799
G1
HC
C02
3Pr
otei
n-C
alor
ie M
alnu
triti
on1,
165
13.9
3013
.794
13.7
2613
.751
13.7
59
HC
C02
6M
ucop
olys
acch
arid
osis
706.
177
5.86
75.
696
5.64
25.
625
G2
HC
C02
7Li
pido
ses a
nd G
lyco
geno
sis25
66.
177
5.86
75.
696
5.64
25.
625
G2
HC
C02
8C
onge
nita
l Met
abol
ic D
isord
ers,
Not
El
sew
here
Cla
ssifi
ed1,
691
6.17
75.
867
5.69
65.
642
5.62
5G
2
HC
C02
9A
myl
oido
sis, P
orph
yria
, and
Oth
er
Met
abol
ic D
isord
ers
880
6.17
75.
867
5.69
65.
642
5.62
5G
2
HC
C03
0A
dren
al, P
ituita
ry, a
nd O
ther
Sig
nific
ant
Endo
crin
e D
isord
ers
6,97
46.
177
5.86
75.
696
5.64
25.
625
G2
HC
C03
4Li
ver T
rans
plan
t Sta
tus/
Com
plic
atio
ns24
118
.322
18.0
4817
.922
17.8
9817
.888
H
CC
035
End-
Stag
e Li
ver D
iseas
e18
012
.960
12.7
5412
.650
12.6
2212
.614
H
CC
036
Cir
rhos
is of
Liv
er58
1.17
71.
027
0.92
00.
871
0.83
3H
1H
CC
037
Chr
onic
Hep
atiti
s49
41.
177
1.02
70.
920
0.80
70.
775
H1
HC
C03
8A
cute
Liv
er F
ailu
re/D
iseas
e, In
clud
ing
N
eona
tal H
epat
itis
192
6.25
56.
092
6.00
35.
972
5.96
6
HC
C04
1In
test
ine
Tran
spla
nt S
tatu
s/C
ompl
icat
ions
2010
6.16
910
6.70
410
6.99
110
7.18
010
7.22
2
HC
C04
2Pe
riton
itis/
Gas
troi
ntes
tinal
Per
fora
tion/
Nec
rotiz
ing
Ente
roco
litis
686
16.7
8416
.360
16.1
5616
.171
16.1
79
HC
C04
5In
test
inal
Obs
truc
tion
2,93
45.
715
5.45
15.
307
5.21
05.
178
H
CC
046
Chr
onic
Pan
crea
titis
177
16.6
9216
.315
16.1
4816
.163
16.1
66
HC
C04
7A
cute
Pan
crea
titis/
Oth
er P
ancr
eatic
Diso
rder
s an
d In
test
inal
Mal
abso
rptio
n4,
700
3.84
33.
685
3.58
43.
471
3.43
4
(Con
tinu
ed)
Kautter, J., Pope, G. C., Ingber, M., et al. E40
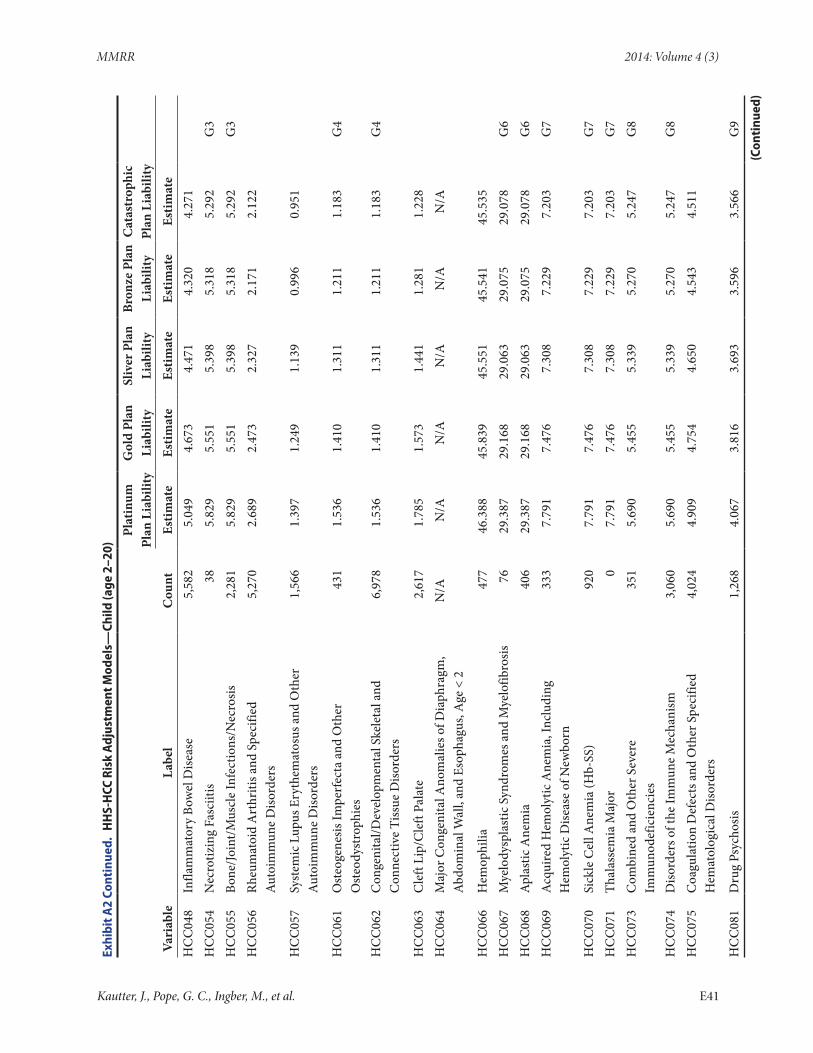
MMRR 2014: Volume 4 (3)
Exhi
bit A
2 Co
ntin
ued.
HH
S-H
CC R
isk
Adj
ustm
ent M
odel
s—Ch
ild (a
ge 2
–20)
Pl
atin
um
Plan
Lia
bilit
yG
old
Plan
Li
abili
tySl
iver
Pla
n Li
abili
tyBr
onze
Pla
n Li
abili
tyC
atas
trop
hic
Plan
Lia
bilit
y
Vari
able
Labe
lC
ount
Estim
ate
Estim
ate
Estim
ate
Estim
ate
Estim
ate
H
CC
048
Infla
mm
ator
y Bo
wel
Dise
ase
5,58
25.
049
4.67
34.
471
4.32
04.
271
H
CC
054
Nec
rotiz
ing
Fasc
iitis
385.
829
5.55
15.
398
5.31
85.
292
G3
HC
C05
5Bo
ne/Jo
int/M
uscl
e In
fect
ions
/Nec
rosis
2,28
15.
829
5.55
15.
398
5.31
85.
292
G3
HC
C05
6Rh
eum
atoi
d A
rthr
itis a
nd S
peci
fied
Aut
oim
mun
e D
isord
ers
5,27
02.
689
2.47
32.
327
2.17
12.
122
HC
C05
7Sy
stem
ic L
upus
Ery
them
atos
us a
nd O
ther
A
utoi
mm
une
Diso
rder
s1,
566
1.39
71.
249
1.13
90.
996
0.95
1
HC
C06
1O
steo
gene
sis Im
perf
ecta
and
Oth
er
Ost
eody
stro
phie
s43
11.
536
1.41
01.
311
1.21
11.
183
G4
HC
C06
2C
onge
nita
l/Dev
elop
men
tal S
kele
tal a
nd
Con
nect
ive
Tiss
ue D
isord
ers
6,97
81.
536
1.41
01.
311
1.21
11.
183
G4
HC
C06
3C
left
Lip/
Cle
ft Pa
late
2,61
71.
785
1.57
31.
441
1.28
11.
228
H
CC
064
Maj
or C
onge
nita
l Ano
mal
ies o
f Dia
phra
gm,
Abd
omin
al W
all,
and
Esop
hagu
s, A
ge <
2N
/AN
/AN
/AN
/AN
/AN
/A
HC
C06
6H
emop
hilia
477
46.3
8845
.839
45.5
5145
.541
45.5
35
HC
C06
7M
yelo
dysp
last
ic S
yndr
omes
and
Mye
lofib
rosis
7629
.387
29.1
6829
.063
29.0
7529
.078
G6
HC
C06
8A
plas
tic A
nem
ia40
629
.387
29.1
6829
.063
29.0
7529
.078
G6
HC
C06
9A
cqui
red
Hem
olyt
ic A
nem
ia, I
nclu
ding
H
emol
ytic
Dise
ase
of N
ewbo
rn33
37.
791
7.47
67.
308
7.22
97.
203
G7
HC
C07
0Si
ckle
Cel
l Ane
mia
(Hb-
SS)
920
7.79
17.
476
7.30
87.
229
7.20
3G
7H
CC
071
Thal
asse
mia
Maj
or0
7.79
17.
476
7.30
87.
229
7.20
3G
7H
CC
073
Com
bine
d an
d O
ther
Sev
ere
Imm
unod
efic
ienc
ies
351
5.69
05.
455
5.33
95.
270
5.24
7G
8
HC
C07
4D
isord
ers o
f the
Imm
une
Mec
hani
sm3,
060
5.69
05.
455
5.33
95.
270
5.24
7G
8H
CC
075
Coa
gula
tion
Def
ects
and
Oth
er S
peci
fied
Hem
atol
ogic
al D
isord
ers
4,02
44.
909
4.75
44.
650
4.54
34.
511
HC
C08
1D
rug
Psyc
hosis
1,26
84.
067
3.81
63.
693
3.59
63.
566
G9
(Con
tinu
ed)
Kautter, J., Pope, G. C., Ingber, M., et al. E41
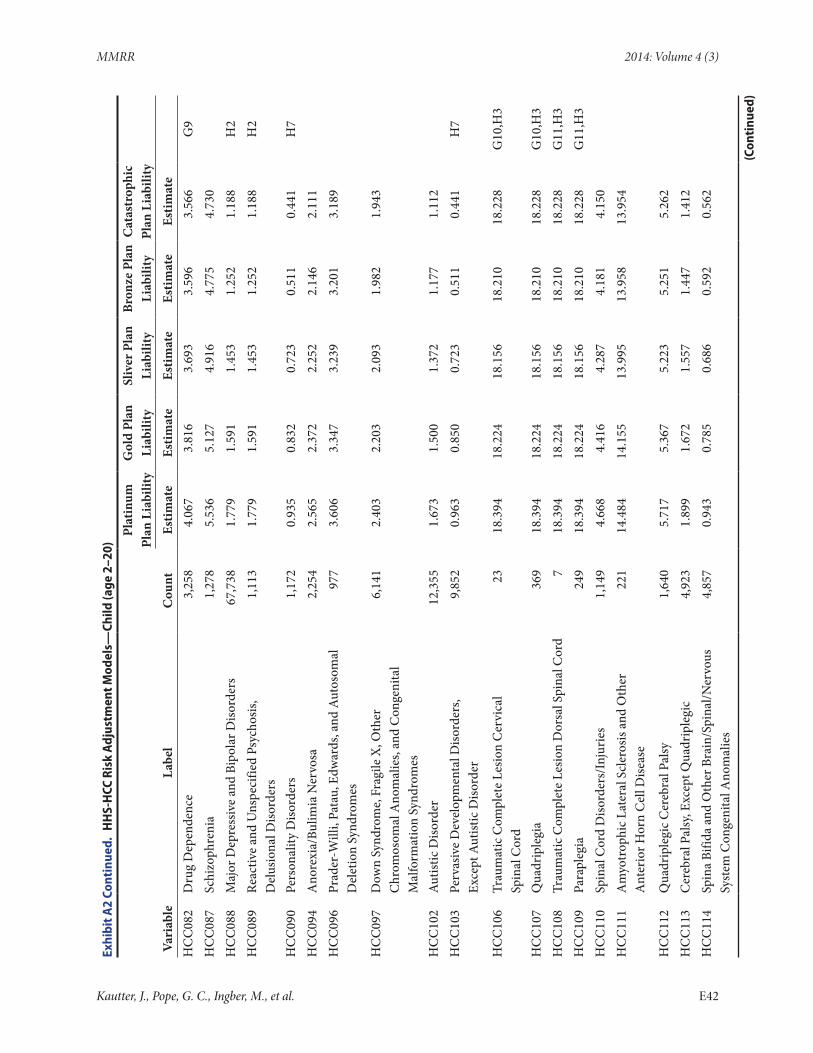
MMRR 2014: Volume 4 (3)
Exhi
bit A
2 Co
ntin
ued.
HH
S-H
CC R
isk
Adj
ustm
ent M
odel
s—Ch
ild (a
ge 2
–20)
Pl
atin
um
Plan
Lia
bilit
yG
old
Plan
Li
abili
tySl
iver
Pla
n Li
abili
tyBr
onze
Pla
n Li
abili
tyC
atas
trop
hic
Plan
Lia
bilit
y
Vari
able
Labe
lC
ount
Estim
ate
Estim
ate
Estim
ate
Estim
ate
Estim
ate
H
CC
082
Dru
g D
epen
denc
e3,
258
4.06
73.
816
3.69
33.
596
3.56
6G
9H
CC
087
Schi
zoph
reni
a1,
278
5.53
65.
127
4.91
64.
775
4.73
0
HC
C08
8M
ajor
Dep
ress
ive
and
Bipo
lar D
isord
ers
67,7
381.
779
1.59
11.
453
1.25
21.
188
H2
HC
C08
9Re
activ
e an
d U
nspe
cifie
d Ps
ycho
sis,
Del
usio
nal D
isord
ers
1,11
31.
779
1.59
11.
453
1.25
21.
188
H2
HC
C09
0Pe
rson
ality
Diso
rder
s1,
172
0.93
50.
832
0.72
30.
511
0.44
1H
7H
CC
094
Ano
rexi
a/Bu
limia
Ner
vosa
2,25
42.
565
2.37
22.
252
2.14
62.
111
H
CC
096
Prad
er-W
illi,
Pata
u, E
dwar
ds, a
nd A
utos
omal
D
elet
ion
Synd
rom
es97
73.
606
3.34
73.
239
3.20
13.
189
HC
C09
7D
own
Synd
rom
e, F
ragi
le X
, Oth
er
Chr
omos
omal
Ano
mal
ies,
and
Con
geni
tal
Mal
form
atio
n Sy
ndro
mes
6,14
12.
403
2.20
32.
093
1.98
21.
943
HC
C10
2A
utist
ic D
isord
er12
,355
1.67
31.
500
1.37
21.
177
1.11
2
HC
C10
3Pe
rvas
ive
Dev
elop
men
tal D
isord
ers,
Ex
cept
Aut
istic
Diso
rder
9,85
20.
963
0.85
00.
723
0.51
10.
441
H7
HC
C10
6Tr
aum
atic
Com
plet
e Le
sion
Cer
vica
l Sp
inal
Cor
d23
18.3
9418
.224
18.1
5618
.210
18.2
28G
10,H
3
HC
C10
7Q
uadr
iple
gia
369
18.3
9418
.224
18.1
5618
.210
18.2
28G
10,H
3H
CC
108
Trau
mat
ic C
ompl
ete
Lesio
n D
orsa
l Spi
nal C
ord
718
.394
18.2
2418
.156
18.2
1018
.228
G11
,H3
HC
C10
9Pa
rapl
egia
249
18.3
9418
.224
18.1
5618
.210
18.2
28G
11,H
3H
CC
110
Spin
al C
ord
Diso
rder
s/In
juri
es1,
149
4.66
84.
416
4.28
74.
181
4.15
0
HC
C11
1A
myo
trop
hic L
ater
al S
cler
osis
and
Oth
er
Ant
erio
r Hor
n C
ell D
iseas
e22
114
.484
14.1
5513
.995
13.9
5813
.954
HC
C11
2Q
uadr
iple
gic C
ereb
ral P
alsy
1,64
05.
717
5.36
75.
223
5.25
15.
262
H
CC
113
Cer
ebra
l Pal
sy, E
xcep
t Qua
drip
legi
c4,
923
1.89
91.
672
1.55
71.
447
1.41
2
HC
C11
4Sp
ina
Bifid
a an
d O
ther
Bra
in/S
pina
l/Ner
vous
Sy
stem
Con
geni
tal A
nom
alie
s4,
857
0.94
30.
785
0.68
60.
592
0.56
2
(Con
tinu
ed)
Kautter, J., Pope, G. C., Ingber, M., et al. E42
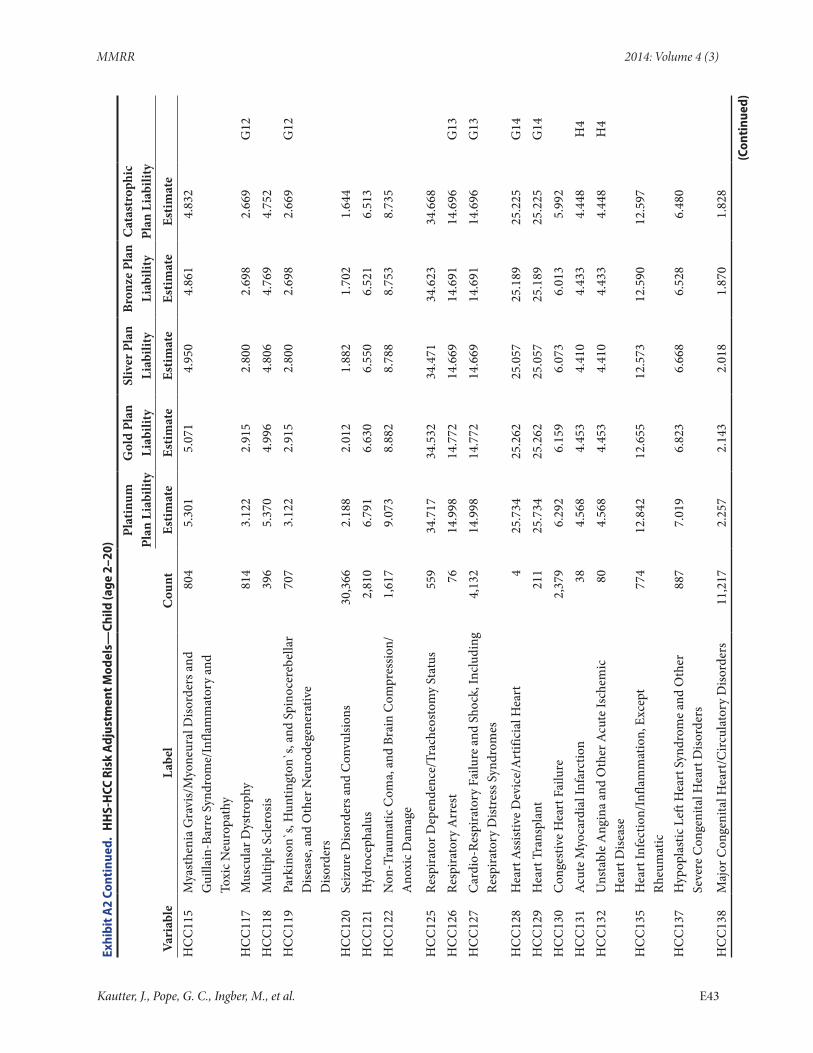
MMRR 2014: Volume 4 (3)
Exhi
bit A
2 Co
ntin
ued.
HH
S-H
CC R
isk
Adj
ustm
ent M
odel
s—Ch
ild (a
ge 2
–20)
Pl
atin
um
Plan
Lia
bilit
yG
old
Plan
Li
abili
tySl
iver
Pla
n Li
abili
tyBr
onze
Pla
n Li
abili
tyC
atas
trop
hic
Plan
Lia
bilit
y
Vari
able
Labe
lC
ount
Estim
ate
Estim
ate
Estim
ate
Estim
ate
Estim
ate
H
CC
115
Mya
sthe
nia
Gra
vis/
Myo
neur
al D
isord
ers a
nd
Gui
llain
-Bar
re S
yndr
ome/
Infla
mm
ator
y an
d To
xic N
euro
path
y
804
5.30
15.
071
4.95
04.
861
4.83
2
HC
C11
7M
uscu
lar D
ystr
ophy
814
3.12
22.
915
2.80
02.
698
2.66
9G
12H
CC
118
Mul
tiple
Scl
eros
is39
65.
370
4.99
64.
806
4.76
94.
752
H
CC
119
Park
inso
n`s,
Hun
tingt
on`s
, and
Spi
noce
rebe
llar
Dise
ase,
and
Oth
er N
euro
dege
nera
tive
Diso
rder
s
707
3.12
22.
915
2.80
02.
698
2.66
9G
12
HC
C12
0Se
izur
e D
isord
ers a
nd C
onvu
lsion
s30
,366
2.18
82.
012
1.88
21.
702
1.64
4
HC
C12
1H
ydro
ceph
alus
2,81
06.
791
6.63
06.
550
6.52
16.
513
H
CC
122
Non
-Tra
umat
ic C
oma,
and
Bra
in C
ompr
essio
n/A
noxi
c Dam
age
1,61
79.
073
8.88
28.
788
8.75
38.
735
HC
C12
5Re
spira
tor D
epen
denc
e/Tr
ache
osto
my
Stat
us55
934
.717
34.5
3234
.471
34.6
2334
.668
H
CC
126
Resp
irato
ry A
rres
t76
14.9
9814
.772
14.6
6914
.691
14.6
96G
13H
CC
127
Car
dio-
Resp
irato
ry F
ailu
re a
nd S
hock
, Inc
ludi
ng
Resp
irato
ry D
istre
ss S
yndr
omes
4,13
214
.998
14.7
7214
.669
14.6
9114
.696
G13
HC
C12
8H
eart
Ass
istiv
e D
evic
e/A
rtifi
cial
Hea
rt4
25.7
3425
.262
25.0
5725
.189
25.2
25G
14H
CC
129
Hea
rt T
rans
plan
t21
125
.734
25.2
6225
.057
25.1
8925
.225
G14
HC
C13
0C
onge
stiv
e H
eart
Fai
lure
2,37
96.
292
6.15
96.
073
6.01
35.
992
H
CC
131
Acu
te M
yoca
rdia
l Inf
arct
ion
384.
568
4.45
34.
410
4.43
34.
448
H4
HC
C13
2U
nsta
ble
Ang
ina
and
Oth
er A
cute
Isch
emic
H
eart
Dise
ase
804.
568
4.45
34.
410
4.43
34.
448
H4
HC
C13
5H
eart
Infe
ctio
n/In
flam
mat
ion,
Exc
ept
Rheu
mat
ic77
412
.842
12.6
5512
.573
12.5
9012
.597
HC
C13
7H
ypop
last
ic L
eft H
eart
Syn
drom
e an
d O
ther
Se
vere
Con
geni
tal H
eart
Diso
rder
s88
77.
019
6.82
36.
668
6.52
86.
480
HC
C13
8M
ajor
Con
geni
tal H
eart
/Circ
ulat
ory
Diso
rder
s11
,217
2.25
72.
143
2.01
81.
870
1.82
8
(Con
tinu
ed)
Kautter, J., Pope, G. C., Ingber, M., et al. E43
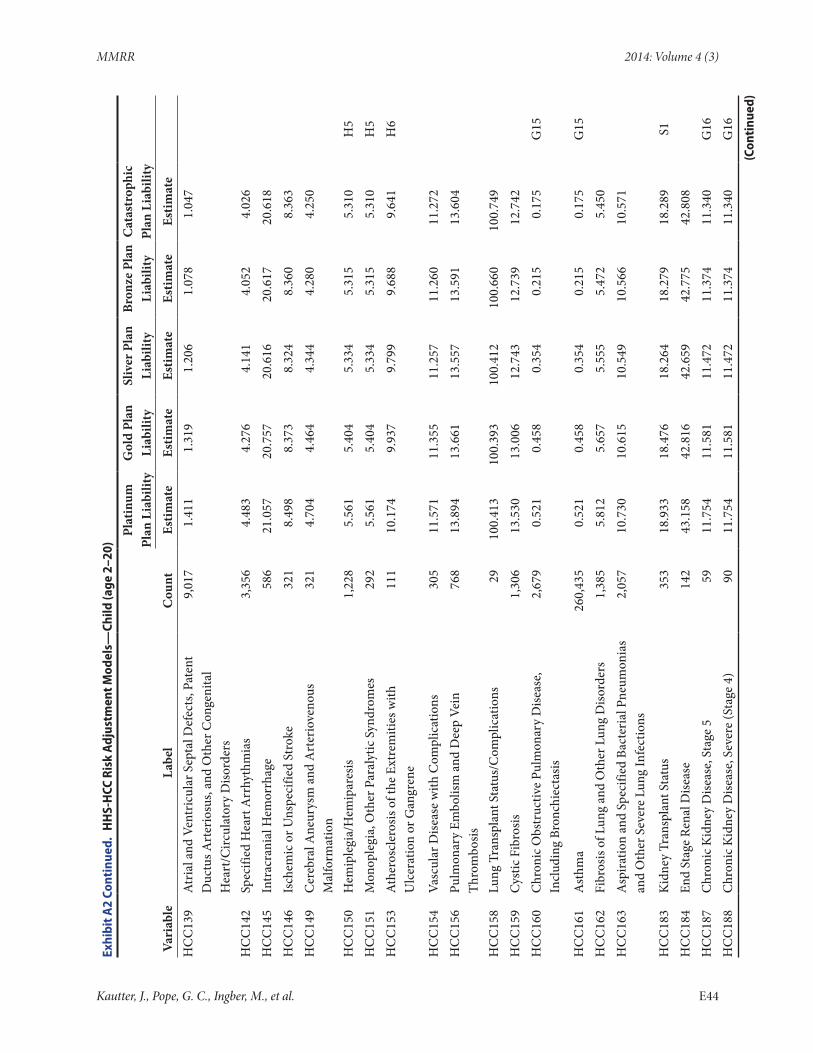
MMRR 2014: Volume 4 (3)
Exhi
bit A
2 Co
ntin
ued.
HH
S-H
CC R
isk
Adj
ustm
ent M
odel
s—Ch
ild (a
ge 2
–20)
Pl
atin
um
Plan
Lia
bilit
yG
old
Plan
Li
abili
tySl
iver
Pla
n Li
abili
tyBr
onze
Pla
n Li
abili
tyC
atas
trop
hic
Plan
Lia
bilit
y
Vari
able
Labe
lC
ount
Estim
ate
Estim
ate
Estim
ate
Estim
ate
Estim
ate
H
CC
139
Atr
ial a
nd V
entr
icul
ar S
epta
l Def
ects
, Pat
ent
Duc
tus A
rter
iosu
s, an
d O
ther
Con
geni
tal
Hea
rt/C
ircul
ator
y D
isord
ers
9,01
71.
411
1.31
91.
206
1.07
81.
047
HC
C14
2Sp
ecifi
ed H
eart
Arr
hyth
mia
s3,
356
4.48
34.
276
4.14
14.
052
4.02
6
HC
C14
5In
trac
rani
al H
emor
rhag
e58
621
.057
20.7
5720
.616
20.6
1720
.618
H
CC
146
Isch
emic
or U
nspe
cifie
d St
roke
321
8.49
88.
373
8.32
48.
360
8.36
3
HC
C14
9C
ereb
ral A
neur
ysm
and
Art
erio
veno
us
Mal
form
atio
n32
14.
704
4.46
44.
344
4.28
04.
250
HC
C15
0H
emip
legi
a/H
emip
ares
is1,
228
5.56
15.
404
5.33
45.
315
5.31
0H
5H
CC
151
Mon
ople
gia,
Oth
er P
aral
ytic
Syn
drom
es29
25.
561
5.40
45.
334
5.31
55.
310
H5
HC
C15
3A
ther
oscl
eros
is of
the
Extr
emiti
es w
ith
Ulc
erat
ion
or G
angr
ene
111
10.1
749.
937
9.79
99.
688
9.64
1H
6
HC
C15
4Va
scul
ar D
iseas
e w
ith C
ompl
icat
ions
305
11.5
7111
.355
11.2
5711
.260
11.2
72
HC
C15
6Pu
lmon
ary
Embo
lism
and
Dee
p Ve
in
Thro
mbo
sis76
813
.894
13.6
6113
.557
13.5
9113
.604
HC
C15
8Lu
ng T
rans
plan
t Sta
tus/
Com
plic
atio
ns29
100.
413
100.
393
100.
412
100.
660
100.
749
H
CC
159
Cys
tic F
ibro
sis1,
306
13.5
3013
.006
12.7
4312
.739
12.7
42
HC
C16
0C
hron
ic O
bstr
uctiv
e Pu
lmon
ary
Dise
ase,
In
clud
ing
Bron
chie
ctas
is2,
679
0.52
10.
458
0.35
40.
215
0.17
5G
15
HC
C16
1A
sthm
a26
0,43
50.
521
0.45
80.
354
0.21
50.
175
G15
HC
C16
2Fi
bros
is of
Lun
g an
d O
ther
Lun
g D
isord
ers
1,38
55.
812
5.65
75.
555
5.47
25.
450
H
CC
163
Asp
iratio
n an
d Sp
ecifi
ed B
acte
rial
Pne
umon
ias
and
Oth
er S
ever
e Lu
ng In
fect
ions
2,05
710
.730
10.6
1510
.549
10.5
6610
.571
HC
C18
3K
idne
y Tr
ansp
lant
Sta
tus
353
18.9
3318
.476
18.2
6418
.279
18.2
89S1
HC
C18
4En
d St
age
Rena
l Dise
ase
142
43.1
5842
.816
42.6
5942
.775
42.8
08
HC
C18
7C
hron
ic K
idne
y D
iseas
e, S
tage
559
11.7
5411
.581
11.4
7211
.374
11.3
40G
16H
CC
188
Chr
onic
Kid
ney
Dise
ase,
Sev
ere
(Sta
ge 4
)90
11.7
5411
.581
11.4
7211
.374
11.3
40G
16(C
onti
nued
)
Kautter, J., Pope, G. C., Ingber, M., et al. E44
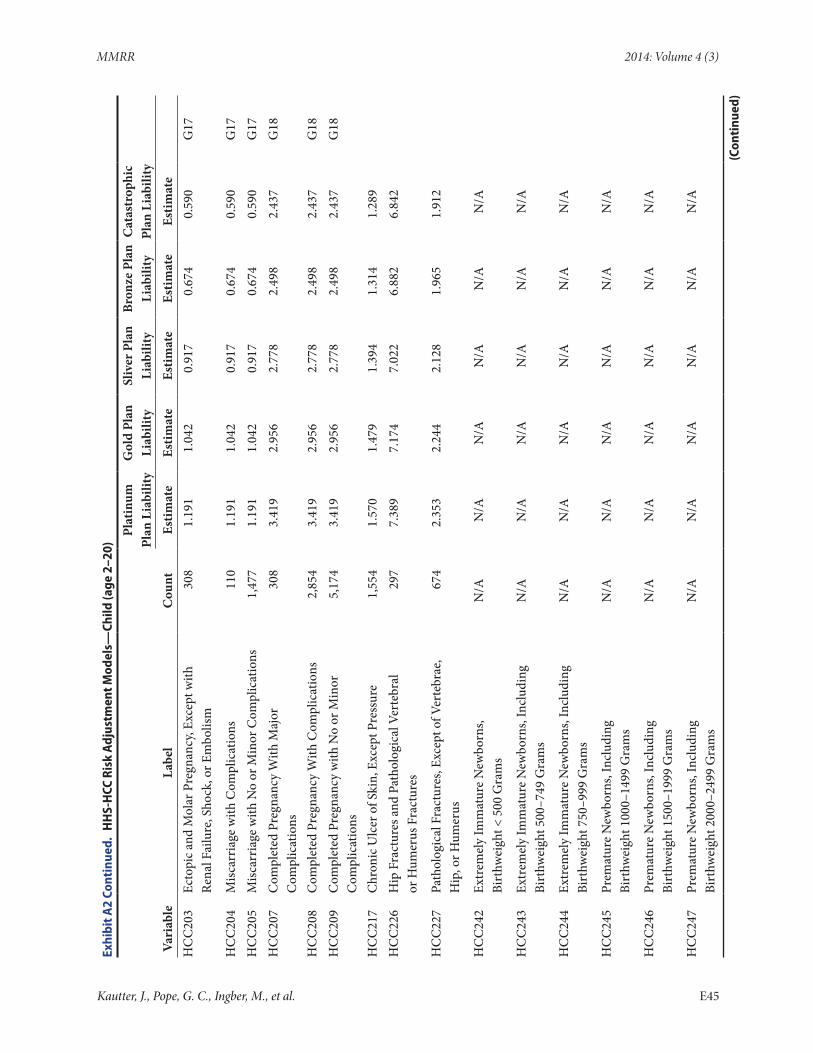
MMRR 2014: Volume 4 (3)
Exhi
bit A
2 Co
ntin
ued.
HH
S-H
CC R
isk
Adj
ustm
ent M
odel
s—Ch
ild (a
ge 2
–20)
Pl
atin
um
Plan
Lia
bilit
yG
old
Plan
Li
abili
tySl
iver
Pla
n Li
abili
tyBr
onze
Pla
n Li
abili
tyC
atas
trop
hic
Plan
Lia
bilit
y
Vari
able
Labe
lC
ount
Estim
ate
Estim
ate
Estim
ate
Estim
ate
Estim
ate
H
CC
203
Ecto
pic a
nd M
olar
Pre
gnan
cy, E
xcep
t with
Re
nal F
ailu
re, S
hock
, or E
mbo
lism
308
1.19
11.
042
0.91
70.
674
0.59
0G
17
HC
C20
4M
iscar
riag
e w
ith C
ompl
icat
ions
110
1.19
11.
042
0.91
70.
674
0.59
0G
17H
CC
205
Misc
arri
age
with
No
or M
inor
Com
plic
atio
ns1,
477
1.19
11.
042
0.91
70.
674
0.59
0G
17H
CC
207
Com
plet
ed P
regn
ancy
With
Maj
or
Com
plic
atio
ns30
83.
419
2.95
62.
778
2.49
82.
437
G18
HC
C20
8C
ompl
eted
Pre
gnan
cy W
ith C
ompl
icat
ions
2,85
43.
419
2.95
62.
778
2.49
82.
437
G18
HC
C20
9C
ompl
eted
Pre
gnan
cy w
ith N
o or
Min
or
Com
plic
atio
ns5,
174
3.41
92.
956
2.77
82.
498
2.43
7G
18
HC
C21
7C
hron
ic U
lcer
of S
kin,
Exc
ept P
ress
ure
1,55
41.
570
1.47
91.
394
1.31
41.
289
H
CC
226
Hip
Fra
ctur
es a
nd P
atho
logi
cal V
erte
bral
or
Hum
erus
Fra
ctur
es29
77.
389
7.17
47.
022
6.88
26.
842
HC
C22
7Pa
thol
ogic
al F
ract
ures
, Exc
ept o
f Ver
tebr
ae,
Hip
, or H
umer
us67
42.
353
2.24
42.
128
1.96
51.
912
HC
C24
2Ex
trem
ely
Imm
atur
e N
ewbo
rns,
Bi
rthw
eigh
t < 5
00 G
ram
sN
/AN
/AN
/AN
/AN
/AN
/A
HC
C24
3Ex
trem
ely
Imm
atur
e N
ewbo
rns,
Incl
udin
g Bi
rthw
eigh
t 500
–749
Gra
ms
N/A
N/A
N/A
N/A
N/A
N/A
HC
C24
4Ex
trem
ely
Imm
atur
e N
ewbo
rns,
Incl
udin
g Bi
rthw
eigh
t 750
–999
Gra
ms
N/A
N/A
N/A
N/A
N/A
N/A
HC
C24
5Pr
emat
ure
New
born
s, In
clud
ing
Bi
rthw
eigh
t 100
0–14
99 G
ram
sN
/AN
/AN
/AN
/AN
/AN
/A
HC
C24
6Pr
emat
ure
New
born
s, In
clud
ing
Bi
rthw
eigh
t 150
0–19
99 G
ram
sN
/AN
/AN
/AN
/AN
/AN
/A
HC
C24
7Pr
emat
ure
New
born
s, In
clud
ing
Bi
rthw
eigh
t 200
0–24
99 G
ram
sN
/AN
/AN
/AN
/AN
/AN
/A
(Con
tinu
ed)
Kautter, J., Pope, G. C., Ingber, M., et al. E45
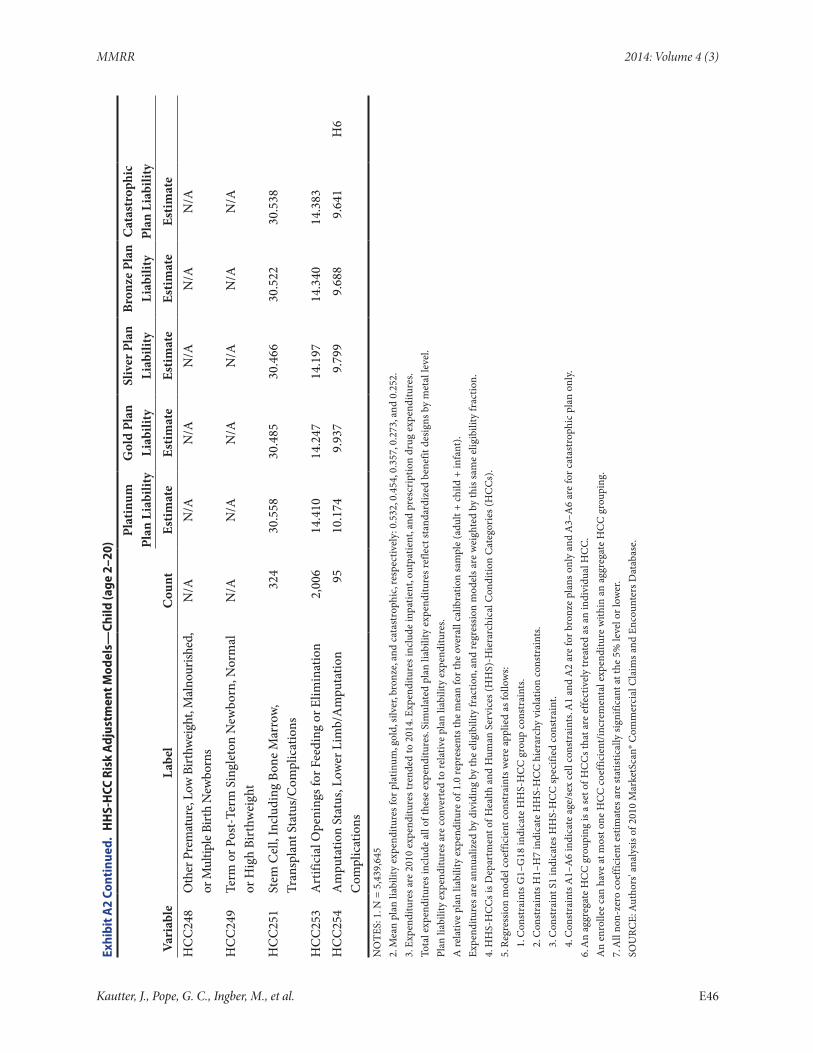
MMRR 2014: Volume 4 (3)
Exhi
bit A
2 Co
ntin
ued.
HH
S-H
CC R
isk
Adj
ustm
ent M
odel
s—Ch
ild (a
ge 2
–20)
Pl
atin
um
Plan
Lia
bilit
yG
old
Plan
Li
abili
tySl
iver
Pla
n Li
abili
tyBr
onze
Pla
n Li
abili
tyC
atas
trop
hic
Plan
Lia
bilit
y
Vari
able
Labe
lC
ount
Estim
ate
Estim
ate
Estim
ate
Estim
ate
Estim
ate
H
CC
248
Oth
er P
rem
atur
e, Lo
w B
irthw
eigh
t, M
alno
urish
ed,
or M
ultip
le Bi
rth
New
born
sN
/AN
/AN
/AN
/AN
/AN
/A
HC
C24
9Te
rm o
r Pos
t-Te
rm S
ingl
eton
New
born
, Nor
mal
or
Hig
h Bi
rthw
eigh
tN
/AN
/AN
/AN
/AN
/AN
/A
HC
C25
1St
em C
ell,
Incl
udin
g Bo
ne M
arro
w,
Tran
spla
nt S
tatu
s/C
ompl
icat
ions
324
30.5
5830
.485
30.4
6630
.522
30.5
38
HC
C25
3A
rtifi
cial
Ope
ning
s for
Fee
ding
or E
limin
atio
n2,
006
14.4
1014
.247
14.1
9714
.340
14.3
83
HC
C25
4A
mpu
tatio
n St
atus
, Low
er L
imb/
Am
puta
tion
Com
plic
atio
ns95
10.1
749.
937
9.79
99.
688
9.64
1H
6
NO
TES:
1. N
= 5
,439
,645
2. M
ean
plan
liab
ility
exp
endi
ture
s for
pla
tinum
, gol
d, si
lver
, bro
nze,
and
cata
stro
phic
, res
pect
ivel
y: 0
.532
, 0.4
54, 0
.357
, 0.2
73, a
nd 0
.252
.3.
Exp
endi
ture
s are
201
0 ex
pend
iture
s tre
nded
to 2
014.
Exp
endi
ture
s inc
lude
inpa
tient
, out
patie
nt, a
nd p
resc
ript
ion
drug
exp
endi
ture
s.To
tal e
xpen
ditu
res i
nclu
de a
ll of
thes
e ex
pend
iture
s. Si
mul
ated
pla
n lia
bilit
y ex
pend
iture
s ref
lect
stan
dard
ized
ben
efit
desi
gns b
y m
etal
leve
l.Pl
an li
abili
ty e
xpen
ditu
res a
re c
onve
rted
to re
lativ
e pl
an li
abili
ty e
xpen
ditu
res.
A re
lativ
e pl
an li
abili
ty e
xpen
ditu
re o
f 1.0
repr
esen
ts th
e m
ean
for t
he o
vera
ll ca
libra
tion
sam
ple
(adu
lt +
child
+ in
fant
).Ex
pend
iture
s are
ann
ualiz
ed b
y di
vidi
ng b
y th
e el
igib
ility
frac
tion,
and
regr
essi
on m
odel
s are
wei
ghte
d by
this
sam
e el
igib
ility
frac
tion.
4. H
HS-
HC
Cs i
s Dep
artm
ent o
f Hea
lth a
nd H
uman
Ser
vice
s (H
HS)
-Hie
rarc
hica
l Con
ditio
n C
ateg
orie
s (H
CC
s).
5. R
egre
ssio
n m
odel
coe
ffici
ent c
onst
rain
ts w
ere
appl
ied
as fo
llow
s:1.
Con
stra
ints
G1–
G18
indi
cate
HH
S-H
CC
gro
up c
onst
rain
ts.
2. C
onst
rain
ts H
1–H
7 in
dica
te H
HS-
HC
C h
iera
rchy
vio
latio
n co
nstr
aint
s.3.
Con
stra
int S
1 in
dica
tes H
HS-
HC
C sp
ecifi
ed c
onst
rain
t.4.
Con
stra
ints
A1–
A6
indi
cate
age
/sex
cel
l con
stra
ints
. A1
and
A2
are
for b
ronz
e pl
ans o
nly
and
A3–
A6
are
for c
atas
trop
hic
plan
onl
y.6.
An
aggr
egat
e H
CC
gro
upin
g is
a se
t of H
CC
s tha
t are
effe
ctiv
ely
trea
ted
as a
n in
divi
dual
HC
C.
An
enro
llee
can
have
at m
ost o
ne H
CC
coe
ffici
ent/
incr
emen
tal e
xpen
ditu
re w
ithin
an
aggr
egat
e H
CC
gro
upin
g.7.
All
non-
zero
coe
ffici
ent e
stim
ates
are
stat
istic
ally
sign
ifica
nt a
t the
5%
leve
l or l
ower
.SO
URC
E: A
utho
rs' a
naly
sis o
f 201
0 M
arke
tSca
n® C
omm
erci
al C
laim
s and
Enc
ount
ers D
atab
ase.
Kautter, J., Pope, G. C., Ingber, M., et al. E46


![HHS-Developed Risk Adjustment Model Algorithm “Do It ......adjustment model algorithm “Do It Yourself [DIY]” software) and software instructions for issuers to use with their](https://img.pdfslide.net/doc/110x75/5e652c06f18fff77053556ac/hhs-developed-risk-adjustment-model-algorithm-aoedo-it-adjustment-model.jpg)