Embed Size (px)
Citation preview

Prepared for submission to JCAP
The Highest Energy HAWC Sourcesare Likely Leptonic and Powered byPulsars
Takahiro Sudoh,a,1 Tim Linden,b Dan Hooperc,d
aDepartment of Astronomy, University of Tokyo, Hongo, Tokyo 113-0033, JapanbStockholm University and The Oskar Klein Centre for Cosmoparticle Physics, Alba Nova,10691 Stockholm, SwedencTheoretical Astrophysics Group, Fermi National Accelerator Laboratory, Batavia, Illinois,60510, USAdDepartment of Astronomy and Astrophysics and the Kavli Institute for Cosmological Physics(KICP), University of Chicago, Chicago, Illinois, 60637, USA
E-mail: [email protected], [email protected], [email protected]
Abstract. The HAWC Collaboration has observed gamma rays at energies above 56 TeVfrom a collection of nine sources. It has been suggested that this emission could be hadronicin nature, requiring that these systems accelerate cosmic-ray protons or nuclei up to PeV-scaleenergies. In this paper, we instead show that the spectra of these objects favor a leptonic(inverse Compton) origin for their emission. More specifically, the gamma-ray emission fromthese objects can be straightforwardly accommodated within a model in which ∼ O(10%) ofthe host pulsar’s spindown power is transferred into the acceleration of electrons and positronswith a power-law spectrum that extends to several hundred TeV or higher. The spectral breakthat is observed among these sources is naturally explained within the context of this simplemodel, and occurs at the energy where the timescale for energy losses matches the age ofthe pulsar. In contrast, this spectral feature cannot be straightforwardly accommodated inhadronic scenarios. Furthermore, hadronic models predict that these sources should producemore emission at GeV-scale energies than is observed. In light of these considerations, weconclude that HAWC’s highest energy sources should be interpreted as TeV halos or pulsarwind nebulae, which produce their emission through inverse Compton scattering, and arepowered by the rotational kinetic energy of their host pulsar.
1Corresponding author.
arX
iv:2
101.
1102
6v2
[ast
ro-p
h.H
E] 5
Aug
202
1FERMILAB-PUB-21-019-T (accepted) DOI:10.1088/1475-7516/2021/08/010
Contents
1 Introduction 1
2 TeV Halos and Pulsar Wind Nebulae 2
3 Associating Very High-Energy HAWC Sources With Known Pulsars 3
4 Pulsars and Inverse Compton Emission 7
5 Results 9
6 Comparison of Hadronic and Leptonic Models 14
7 Discussion and Summary 16
1 Introduction
The cosmic-ray spectrum is thought to be dominated by Galactic sources up to energiesof ∼ 1 PeV, corresponding to the spectral feature known as the “knee”. The nature of theMilky Way’s so-called “PeVatrons” remains an open and widely debated question. Among theproposed candidates, supernova remnants have long been the most popular, and gamma-raymeasurements support the conclusion that these objects produce high-energy protons [1, 2].That being said, it has also been argued that such sources may be unable to accelerateprotons beyond a few hundred TeV [3, 4]. Other PeVatron candidates include the MilkyWay’s supermassive black hole [5–7], and clusters of young and massive stars [8]. The sourcesof the highest energy Galactic protons are expected to generate gamma rays through theproduction and decay of neutral pions, resulting in a power-law gamma-ray spectrum thatextends to ∼100 TeV.
Pulsars can also accelerate electrons and positrons up to energies of at least ∼100 TeV.Due to the Klein-Nishina suppression associated with inverse-Compton scattering, electronsand positrons in this energy range lose much of their energy to synchrotron emission, sup-pressing the leptonic production of ∼100 TeV-scale gamma rays. Through this distinction,very high-energy gamma-ray telescopes provide us with one of the most powerful ways todiscriminate between accelerators of hadronic and leptonic cosmic rays.
The High Altitude Water Cherenkov (HAWC) observatory has recently produced a cata-log of nine gamma-ray sources detected at energies above 56 TeV. Three of these sources havebeen observed above 100 TeV, making this the highest energy gamma-ray catalog reportedto date [9].1 Given that all nine of these sources are located within 0.5◦ of a known pulsar,it appears likely that they are associated with this class of objects. Furthermore, eight ofthese nine pulsars are quite young (tc ≡ P/2P ∼ 1 − 50 kyr), and have exceptionally highspindown power (E > 1036 erg/s). This information suggests two possible interpretations.On the one hand, the gamma-ray emission from these sources could be leptonic in nature,powered by the host pulsars’ rotational kinetic energy. Alternatively, the observed emission
1The Tibet air shower array has also reported the detection of emission above 100 TeV from the CrabNebula [10].
– 1 –
could be hadronic, revealing these systems’ supernova remnants to be among the Milky Way’slong-sought-after PeVatrons.
In this paper, we examine the luminosity, spectrum, and morphology of the very high-energy sources observed by HAWC in order to evaluate whether they are more likely to beleptonic sources powered by the rotational kinetic energy of the young pulsar, or hadronicPeVatrons powered by the supernova remnant. We find that the former interpretation isfavored by three factors. First, the spectra of these sources can be easily accommodated bysimple models in which very high-energy electrons and positrons are accelerated with a power-law spectrum. In contrast, hadronic models cannot straightforwardly account for the spectraobserved from several of HAWC’s highest energy sources. Second, the gamma-ray luminositiesobserved from these sources are well-matched to the past integrated spindown power of theirhost pulsars. And third, the spectral break observed among these systems at Eγ ∼ O(10 TeV)is naturally explained by the guaranteed suppression of the inverse Compton scattering crosssection by Klein-Nishina effects, and the energy dependence of the electron/positron energy-loss time-scale, which is smaller than the pulsar age for the highest-energy leptons.
In light of these considerations, we conclude that HAWC’s highest energy sources arelikely to be TeV halos and/or pulsar wind nebulae, with gamma-ray emission that is 1)powered by the rotational kinetic energy of the host pulsar, and 2) produced through inverseCompton scattering.
2 TeV Halos and Pulsar Wind Nebulae
Observations by HAWC and Milagro have detected diffuse multi-TeV emission from the re-gions surrounding the nearby Geminga and Monogem pulsars [11–14]. The spectrum andintensity of this emission indicate that these sources convert a significant fraction (∼ 10%) oftheir total spindown power into very high-energy electron-positron pairs. Furthermore, eachof these TeV halos exhibits an angular extension of ∼ 2◦ (corresponding to ∼ 25 pc), indicat-ing that cosmic-ray propagation in the vicinity of these pulsars is much less efficient than istypically experienced elsewhere in the interstellar medium [15–22].
Looking beyond the specific examples of Geminga and Monogem, observations by HAWC(and HESS [23, 24]) have led to the identification of a new class of spatially extended, multi-TeV gamma-ray sources, powered by the rotational kinetic energy of pulsars, and whichproduce their observed emission through the inverse Compton scattering of very high-energyelectrons and positrons on the surrounding radiation field [25, 26]. A large fraction of thesources detected by HAWC [11, 12, 27] have been shown to be spatially coincident with apulsar, and all indications suggest that TeV halos are a generic feature of middle-aged pulsars(whether or not TeV halos also accompany millisecond pulsars is an open question [28]). Theseobservations suggest that nearby TeV-halos are likely responsible for the observed cosmic-raypositron excess [15, 29, 29–32] (for earlier work, see Refs. [33–35]), as well as the diffuse TeVexcess observed by Milagro [36], and could plausibly dominate the TeV-scale emission observedfrom the Galactic Center by HESS [37] (as opposed to the hypothesis that this emission isproduced by a Galactic Center PeVatron [7]). Extrapolating to the Milky Way’s larger pulsarpopulation, we expect HAWC and the Cherenkov Telescope Array (CTA) [38] to ultimatelydetect ∼ 50−240 TeV halos [26], including many whose pulsed radio and gamma-ray emissionis not beamed in the direction of Earth [25].
When referring to TeV halos, we adopt a definition for this source class which requiresthat the high-energy electrons and positrons responsible for the observed gamma-ray emission
– 2 –
propagate via diffusion, rather than convection or advection. This distinguishes TeV halosfrom pulsar wind nebulae, for which advection plays an important and often dominant role(for a review, see Ref. [39]). TeV halos are also more spatially extended than typical pulsarwind nebulae. Pulsar wind nebulae are created when the energetic outflow from a pulsarcollides with the ambient medium (supernova ejecta or interstellar medium), resulting ina shockwave surrounding a diffuse plasma of electrons and positrons. Like TeV halos, theemission from a pulsar wind nebula is powered by its pulsar’s rotational kinetic energy, andis leptonic in nature. We consider it to be plausible that HAWC’s highest energy sourcescould be a combination of TeV halos, pulsar wind nebulae, and objects that are currently ina transitional state between these two classifications.2
3 Associating Very High-Energy HAWC Sources With Known Pulsars
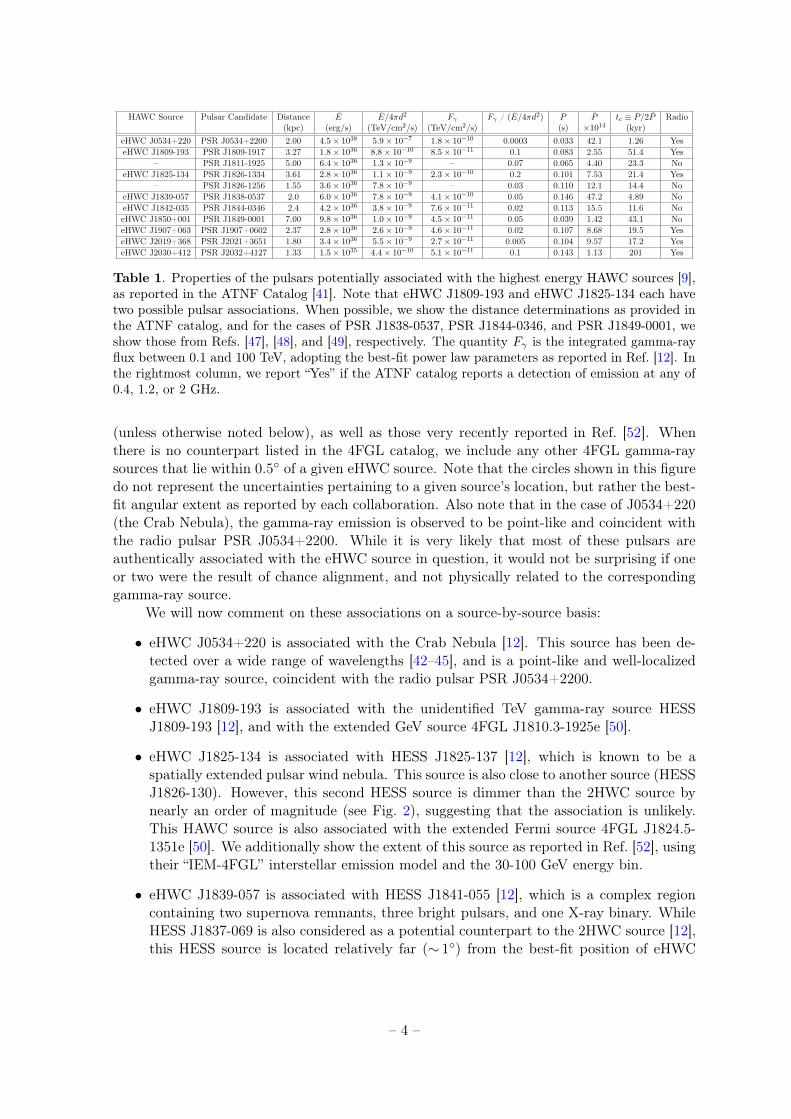
We begin by describing the known pulsars that could potentially be responsible for poweringthe nine sources found in the eHWC (> 56 TeV) catalog [9]. In Table 1, we list some ofthe selected characteristics of these pulsars, as reported in the Australia Telescope NationalFacility (ATNF) pulsar catalog [41]. This list of pulsars was identified in Ref. [9] based on theirlocations (within 0.5◦ of the corresponding HAWC sources), and their high spindown power.In some cases, other nearby pulsars are not listed, primarily when observations indicate thatthey have substantially lower values of E.
Comparing the values of the spindown luminosity of these pulsars, E/4πd2, to theirintegrated gamma-ray flux, Fγ , it is clear that their rotational kinetic energy is more thansufficient to produce the very high-energy gamma-ray emission reported by HAWC.3 Morequantitatively, this comparison suggests that between 0.5% and 20% of these pulsars’ spin-down power goes into the production of gamma rays above 0.1 TeV (consistent with the rangeof values required to explain the TeV halos of Geminga and Monogem [15, 25, 26]). The onlyexception to this is eHWC J0534+220, which would be far brighter if the spindown powerof its pulsar was transferred into gamma rays with similar efficiency. Given that this sourceis associated with the Crab Nebula, we do not find this result particularly surprising. Inparticular, the magnetic field of the Crab pulsar wind nebula is significantly stronger thanthat found among typical pulsar wind nebulae (or TeV halos), causing a large fraction of itsspindown power to be transferred into the production of synchrotron emission [42–46].
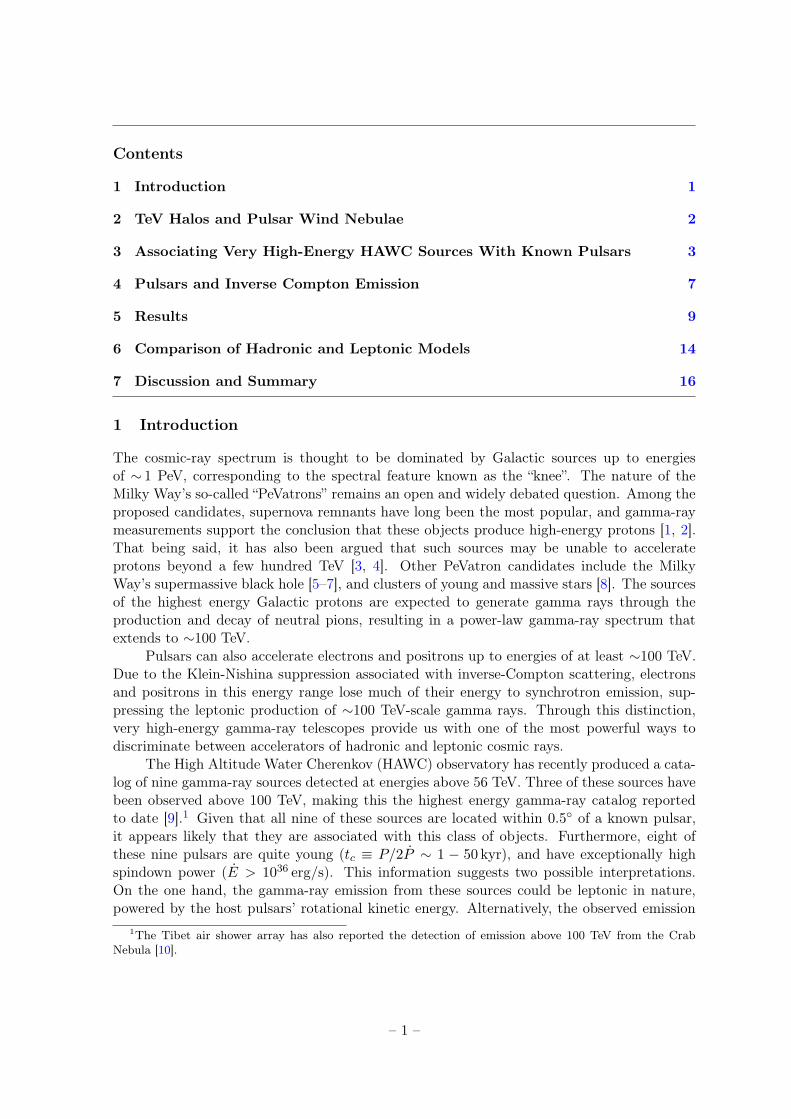
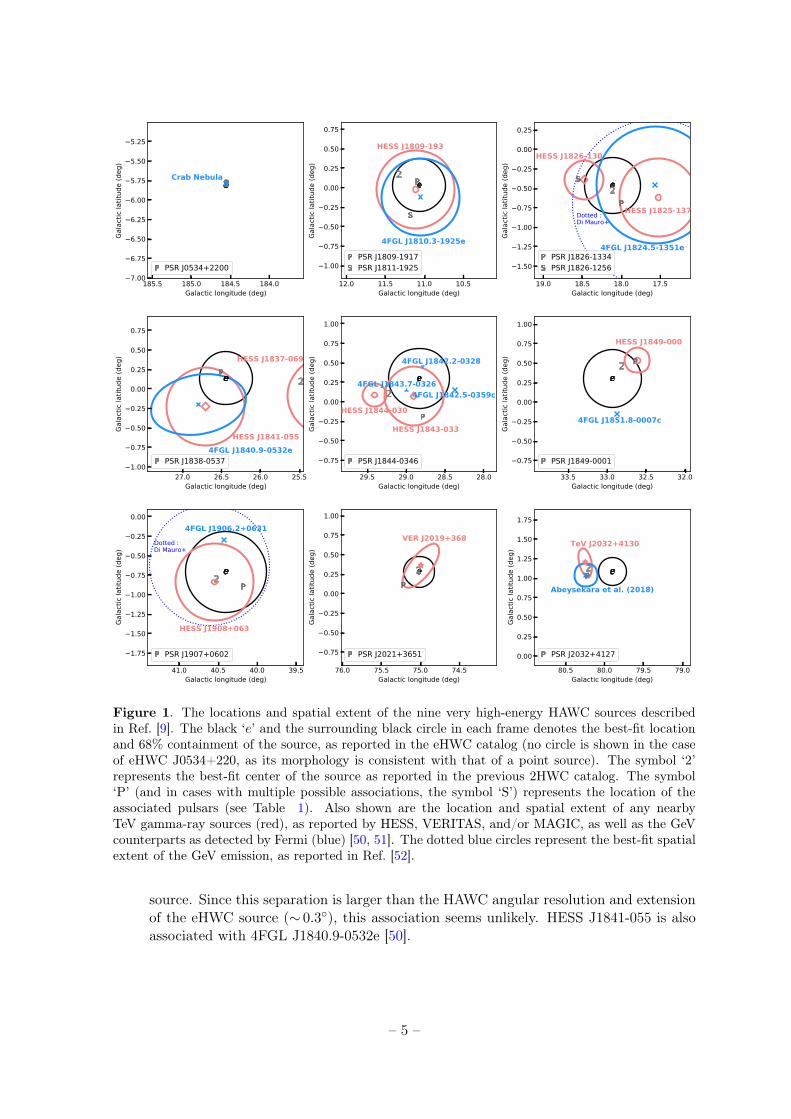
In Fig. 1, we show the locations of the nine very-high-energy HAWC sources, along withthe positions of any pulsars and gamma-ray sources that are potentially associated with them.In each frame, we show the location of the HAWC source as reported in Ref. [9], as well as inthe earlier 2HWC catalog [12]. Following Ref. [12], we also show any nearby TeV gamma-raysources, as reported by HESS, VERITAS, and/or MAGIC. In addition, we show any GeVcounterparts4 that are associated with a TeV source according to Fermi’s 4FGL catalog [50]
2An alternative definition has been put forth by Giacinti et al. [40] which classifies a region as a TeV haloif it contains an overdensity of relativistic electrons and positrons around a pulsar, and if the pulsar andassociated supernova remnant does not dominate the dynamics or composition of the interstellar medium inthat region. Compared to our definition, this choice leads Giacinti et al. to classify many objects that wewould call TeV halos as pulsar wind nebulae, despite the fact that the dynamics assumed by both groups aresimilar.
3Note that the values of Fγ given in Table 1 are based on an extrapolation to energies lower than thosemeasured by HAWC, and thus may somewhat overestimate the total gamma-ray flux above 0.1 TeV.
4We disregard Fermi-LAT sources that are identified as GeV pulsars, as the pulsed spectrum from thesesources falls off rapidly above 10 GeV, and does not appreciably contribute to the TeV emission.
– 3 –
HAWC Source Pulsar Candidate Distance E E/4πd2 Fγ Fγ / (E/4πd2) P P tc ≡ P/2P Radio(kpc) (erg/s) (TeV/cm2/s) (TeV/cm2/s) (s) ×1014 (kyr)
eHWC J0534+220 PSR J0534+2200 2.00 4.5× 1038 5.9× 10⁻⁷ 1.8× 10⁻¹⁰ 0.0003 0.033 42.1 1.26 Yes
eHWC J1809-193 PSR J1809-1917 3.27 1.8× 1036 8.8× 10⁻¹⁰ 8.5× 10⁻¹¹ 0.1 0.083 2.55 51.4 Yes
– PSR J1811-1925 5.00 6.4× 1036 1.3× 10⁻⁹ – 0.07 0.065 4.40 23.3 No
eHWC J1825-134 PSR J1826-1334 3.61 2.8× 1036 1.1× 10⁻⁹ 2.3× 10⁻¹⁰ 0.2 0.101 7.53 21.4 Yes
– PSR J1826-1256 1.55 3.6× 1036 7.8× 10⁻⁹ – 0.03 0.110 12.1 14.4 No
eHWC J1839-057 PSR J1838-0537 2.0 6.0× 1036 7.8× 10⁻⁹ 4.1× 10⁻¹⁰ 0.05 0.146 47.2 4.89 No
eHWC J1842-035 PSR J1844-0346 2.4 4.2× 1036 3.8× 10⁻⁹ 7.6× 10⁻¹¹ 0.02 0.113 15.5 11.6 No
eHWC J1850+001 PSR J1849-0001 7.00 9.8× 1036 1.0× 10⁻⁹ 4.5× 10⁻¹¹ 0.05 0.039 1.42 43.1 No
eHWC J1907+063 PSR J1907+0602 2.37 2.8× 1036 2.6× 10⁻⁹ 4.6× 10⁻¹¹ 0.02 0.107 8.68 19.5 Yes
eHWC J2019+368 PSR J2021+3651 1.80 3.4× 1036 5.5× 10⁻⁹ 2.7× 10⁻¹¹ 0.005 0.104 9.57 17.2 Yes
eHWC J2030+412 PSR J2032+4127 1.33 1.5× 1035 4.4× 10⁻¹⁰ 5.1× 10⁻¹¹ 0.1 0.143 1.13 201 Yes
Table 1. Properties of the pulsars potentially associated with the highest energy HAWC sources [9],as reported in the ATNF Catalog [41]. Note that eHWC J1809-193 and eHWC J1825-134 each havetwo possible pulsar associations. When possible, we show the distance determinations as provided inthe ATNF catalog, and for the cases of PSR J1838-0537, PSR J1844-0346, and PSR J1849-0001, weshow those from Refs. [47], [48], and [49], respectively. The quantity Fγ is the integrated gamma-rayflux between 0.1 and 100 TeV, adopting the best-fit power law parameters as reported in Ref. [12]. Inthe rightmost column, we report “Yes” if the ATNF catalog reports a detection of emission at any of0.4, 1.2, or 2 GHz.
(unless otherwise noted below), as well as those very recently reported in Ref. [52]. Whenthere is no counterpart listed in the 4FGL catalog, we include any other 4FGL gamma-raysources that lie within 0.5◦ of a given eHWC source. Note that the circles shown in this figuredo not represent the uncertainties pertaining to a given source’s location, but rather the best-fit angular extent as reported by each collaboration. Also note that in the case of J0534+220(the Crab Nebula), the gamma-ray emission is observed to be point-like and coincident withthe radio pulsar PSR J0534+2200. While it is very likely that most of these pulsars areauthentically associated with the eHWC source in question, it would not be surprising if oneor two were the result of chance alignment, and not physically related to the correspondinggamma-ray source.
We will now comment on these associations on a source-by-source basis:
• eHWC J0534+220 is associated with the Crab Nebula [12]. This source has been de-tected over a wide range of wavelengths [42–45], and is a point-like and well-localizedgamma-ray source, coincident with the radio pulsar PSR J0534+2200.
• eHWC J1809-193 is associated with the unidentified TeV gamma-ray source HESSJ1809-193 [12], and with the extended GeV source 4FGL J1810.3-1925e [50].
• eHWC J1825-134 is associated with HESS J1825-137 [12], which is known to be aspatially extended pulsar wind nebula. This source is also close to another source (HESSJ1826-130). However, this second HESS source is dimmer than the 2HWC source bynearly an order of magnitude (see Fig. 2), suggesting that the association is unlikely.This HAWC source is also associated with the extended Fermi source 4FGL J1824.5-1351e [50]. We additionally show the extent of this source as reported in Ref. [52], usingtheir “IEM-4FGL” interstellar emission model and the 30-100 GeV energy bin.
• eHWC J1839-057 is associated with HESS J1841-055 [12], which is a complex regioncontaining two supernova remnants, three bright pulsars, and one X-ray binary. WhileHESS J1837-069 is also considered as a potential counterpart to the 2HWC source [12],this HESS source is located relatively far (∼ 1◦) from the best-fit position of eHWC
– 4 –
184.0184.5185.0185.5Galactic longitude (deg)
7.00
6.75
6.50
6.25
6.00
5.75
5.50
5.25
Gala
ctic
latit
ude
(deg
)
Crab Nebula
Crab Nebula
PSR J0534+220010.511.011.512.0
Galactic longitude (deg)
1.00
0.75
0.50
0.25
0.00
0.25
0.50
0.75
Gala
ctic
latit
ude
(deg
)
HESS J1809-193
4FGL J1810.3-1925e
PSR J1809-1917 PSR J1811-1925
17.518.018.519.0Galactic longitude (deg)
1.50
1.25
1.00
0.75
0.50
0.25
0.00
0.25
Gala
ctic
latit
ude
(deg
)
HESS J1825-137
HESS J1826-130
4FGL J1824.5-1351e
Dotted :Di Mauro+
PSR J1826-1334 PSR J1826-1256
25.526.026.527.0Galactic longitude (deg)
1.00
0.75
0.50
0.25
0.00
0.25
0.50
0.75
Gala
ctic
latit
ude
(deg
) HESS J1837-069
HESS J1841-0554FGL J1840.9-0532e
PSR J1838-053728.028.529.029.5
Galactic longitude (deg)
0.75
0.50
0.25
0.00
0.25
0.50
0.75
1.00Ga
lact
ic la
titud
e (d
eg)
HESS J1844-030
HESS J1843-033
4FGL J1842.5-0359c
4FGL J1842.2-0328
4FGL J1843.7-0326
PSR J1844-034632.032.533.033.5
Galactic longitude (deg)
0.75
0.50
0.25
0.00
0.25
0.50
0.75
1.00
Gala
ctic
latit
ude
(deg
)
HESS J1849-000
4FGL J1851.8-0007c
PSR J1849-0001
39.540.040.541.0Galactic longitude (deg)
1.75
1.50
1.25
1.00
0.75
0.50
0.25
0.00
Gala
ctic
latit
ude
(deg
)
HESS J1908+063
4FGL J1906.2+0631Dotted :Di Mauro+
PSR J1907+060274.575.075.576.0
Galactic longitude (deg)
0.75
0.50
0.25
0.00
0.25
0.50
0.75
1.00
Gala
ctic
latit
ude
(deg
)
VER J2019+368
PSR J2021+365179.079.580.080.5
Galactic longitude (deg)
0.00
0.25
0.50
0.75
1.00
1.25
1.50
1.75Ga
lact
ic la
titud
e (d
eg)
TeV J2032+4130
Abeysekara et al. (2018)
PSR J2032+4127
Figure 1. The locations and spatial extent of the nine very high-energy HAWC sources describedin Ref. [9]. The black ‘e’ and the surrounding black circle in each frame denotes the best-fit locationand 68% containment of the source, as reported in the eHWC catalog (no circle is shown in the caseof eHWC J0534+220, as its morphology is consistent with that of a point source). The symbol ‘2’represents the best-fit center of the source as reported in the previous 2HWC catalog. The symbol‘P’ (and in cases with multiple possible associations, the symbol ‘S’) represents the location of theassociated pulsars (see Table 1). Also shown are the location and spatial extent of any nearbyTeV gamma-ray sources (red), as reported by HESS, VERITAS, and/or MAGIC, as well as the GeVcounterparts as detected by Fermi (blue) [50, 51]. The dotted blue circles represent the best-fit spatialextent of the GeV emission, as reported in Ref. [52].
source. Since this separation is larger than the HAWC angular resolution and extensionof the eHWC source (∼ 0.3◦), this association seems unlikely. HESS J1841-055 is alsoassociated with 4FGL J1840.9-0532e [50].
– 5 –
10 3 10 2 10 1 100 101 102
E [TeV]
10 13
10 12
10 11
10 10
E2 F [T
eV c
m2 s
1 ]
eHWC J0534+220 (Crab)
2HWC J0534+220Fermi (Buehler et al. 2012)Crab Nebula
10 3 10 2 10 1 100 101 102
E [TeV]
10 14
10 13
10 12
10 11
E2 F [T
eV c
m2 s
1 ]
eHWC J1809-193
2HWC J1809-190HESS J1809-1934FGL J1810.3-1925e
10 3 10 2 10 1 100 101 102
E [TeV]
10 13
10 12
10 11
10 10
E2 F [T
eV c
m2 s
1 ]
eHWC J1825-134
Di Mauro et al. 20202HWC J1825-134HESS J1825-137HESS J1826-1304FGL J1824.5-1351e
10 3 10 2 10 1 100 101 102
E [TeV]
10 13
10 12
10 11
10 10
E2 F [T
eV c
m2 s
1 ]
eHWC J1839-057
2HWC J1837-065HESS J1837-069HESS J1841-0554FGL J1840.9-0532e
10 3 10 2 10 1 100 101 102
E [TeV]
10 14
10 13
10 12
10 11
E2 F [T
eV c
m2 s
1 ]
eHWC J1842-035
2HWC J1844-032HESS J1844-030HESS J1843-0334FGL J1842.5-0359c4FGL J1842.2-03284FGL J1843.7-0326
10 3 10 2 10 1 100 101 102
E [TeV]
10 14
10 13
10 12
10 11
E2 F [T
eV c
m2 s
1 ]
eHWC J1850+001
2HWC J1849+001HESS J1849-0004FGL J1851.8-0007c
10 3 10 2 10 1 100 101 102
E [TeV]
10 13
10 12
10 11
E2 F [T
eV c
m2 s
1 ]
eHWC J1907+063
Di Mauro et al. 20202HWC J1908+063HESS J1908+0634FGL J1906.2+0631
10 3 10 2 10 1 100 101 102
E [TeV]
10 14
10 13
10 12
10 11
E2 F [T
eV c
m2 s
1 ]
eHWC J2019+368
Di Mauro et al. 20202HWC J2019+367VER J2019+368
10 3 10 2 10 1 100 101 102
E [TeV]
10 14
10 13
10 12
10 11
E2 F [T
eV c
m2 s
1 ]
eHWC J2030+412
2HWC J2031+415Abeysekara et al. (2018)TeV J2032+4130
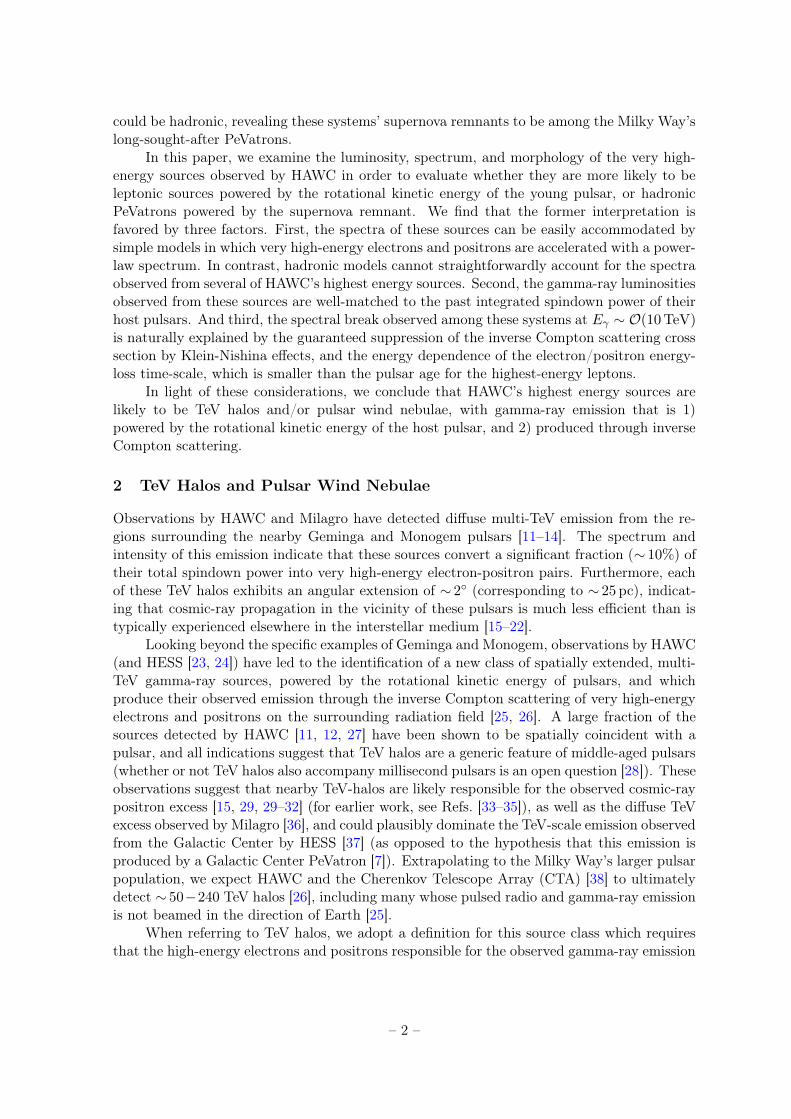
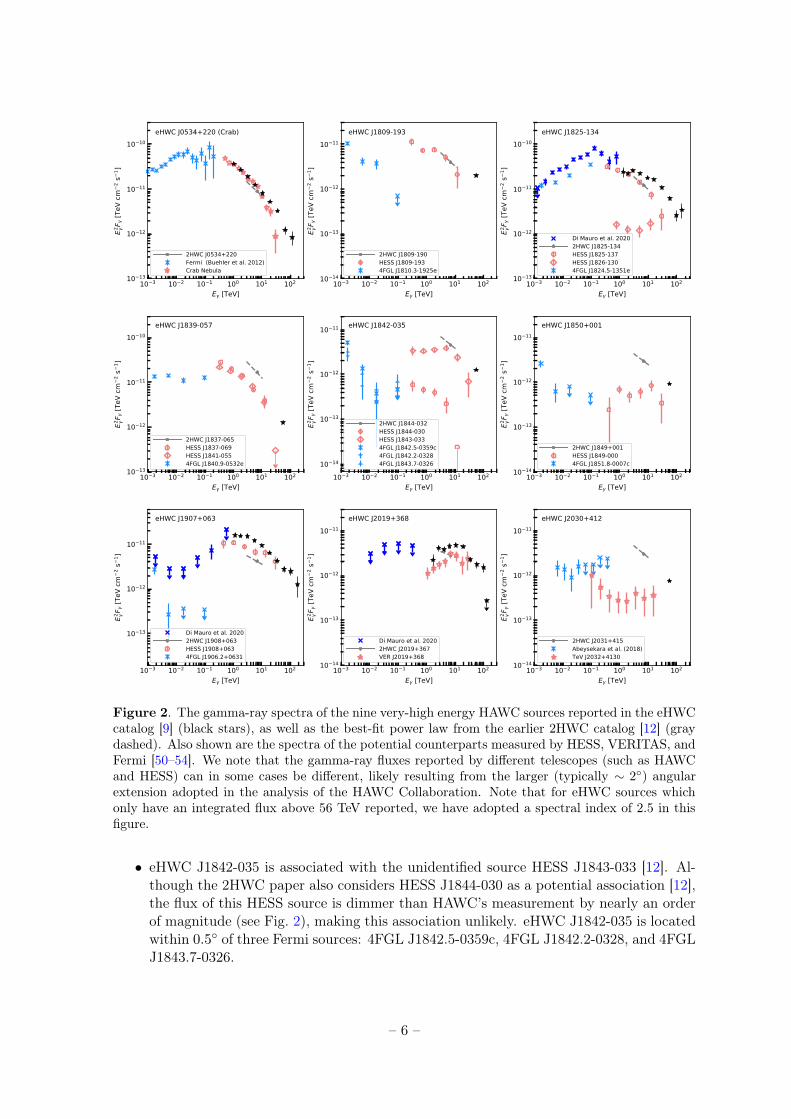
Figure 2. The gamma-ray spectra of the nine very-high energy HAWC sources reported in the eHWCcatalog [9] (black stars), as well as the best-fit power law from the earlier 2HWC catalog [12] (graydashed). Also shown are the spectra of the potential counterparts measured by HESS, VERITAS, andFermi [50–54]. We note that the gamma-ray fluxes reported by different telescopes (such as HAWCand HESS) can in some cases be different, likely resulting from the larger (typically ∼ 2◦) angularextension adopted in the analysis of the HAWC Collaboration. Note that for eHWC sources whichonly have an integrated flux above 56 TeV reported, we have adopted a spectral index of 2.5 in thisfigure.
• eHWC J1842-035 is associated with the unidentified source HESS J1843-033 [12]. Al-though the 2HWC paper also considers HESS J1844-030 as a potential association [12],the flux of this HESS source is dimmer than HAWC’s measurement by nearly an orderof magnitude (see Fig. 2), making this association unlikely. eHWC J1842-035 is locatedwithin 0.5◦ of three Fermi sources: 4FGL J1842.5-0359c, 4FGL J1842.2-0328, and 4FGLJ1843.7-0326.
– 6 –
• eHWC J1850+001 is associated with the pulsar wind nebula HESS J1849-000 [12] andis located within 0.5◦ of the Fermi source 4FGL J1851.8-0007c.
• eHWC J1907+063 is associated with the pulsar wind nebula MGRO J1908+06 [12],which is also known as HESS J1908+063, and is also associated with 4FGL J1906.2+0631 [50].We additionally show the extent of this source as reported in Ref. [52], using their “IEM-4FGL” interstellar emission model. The flux reported in Ref. [52] for this source is verydifferent from that listed in the 4FGL catalog, due to this source’s significant spatialextension. In presenting our results, we will use the spectrum for this source as reportedin Ref. [52].
• eHWC J2019+368 is associated with the source VER J2019+368 [12], an extendedsource that covers two pulsars and one star-forming region. We present the spectraof this source as reported in Ref. [54]. There are no sources in the 4FGL catalog locatednear eHWC 2019+368, nor is there any extended emission reported in Ref. [52].
• eHWC J2030+412 is associated with the pulsar wind nebula TeV J2031+4130 [12].We present the spectra reported by the MAGIC Collaboration in Ref. [53]. The fluxmeasured by HAWC comes from a larger angular region and is much brighter thanthat measured by VERITAS and MAGIC, suggesting a contribution from additionalcomponents. Although there are no sources near eHWC 2030+412 in the 4FGL catalog,a potential GeV counterpart (identified using Fermi data) has been reported in Ref. [51].
In Fig. 2, we show the spectra of these nine very-high-energy HAWC sources as reportedin the eHWC catalog [9], as well as the best-fit power law from the earlier 2HWC catalog [12].Also shown in these frames are the spectra of the potential counterparts measured by HESS,VERITAS, and Fermi. In most cases, these measurements lead to a consistent picture acrossa wide range of energies. We note that measurements by different telescopes (such as HAWCand HESS) can in some cases be different, due to the treatment of these sources’ spatialextension.
4 Pulsars and Inverse Compton Emission
In this section, we describe our calculation of the gamma-ray spectrum produced throughthe inverse Compton scattering of a population of very high-energy electrons and positrons,injected with a given spectrum and over a given time profile.
Very high-energy electrons and positrons lose energy through a combination of inverseCompton scattering and synchrotron processes, leading to the following energy loss rate [55]:
−dEedt
=∑i
4
3σTuiSi(Ee)
(Eeme
)2
+4
3σTumag
(Eeme
)2
≡ b(Ee)
(Ee
TeV
)2
, (4.1)
where σT is the Thomson cross section and
b ≈ 1.02× 10⁻¹³ TeV/s
×[∑
i
uieV/cm3
Si(Ee) +umag
eV/cm3
]. (4.2)
– 7 –
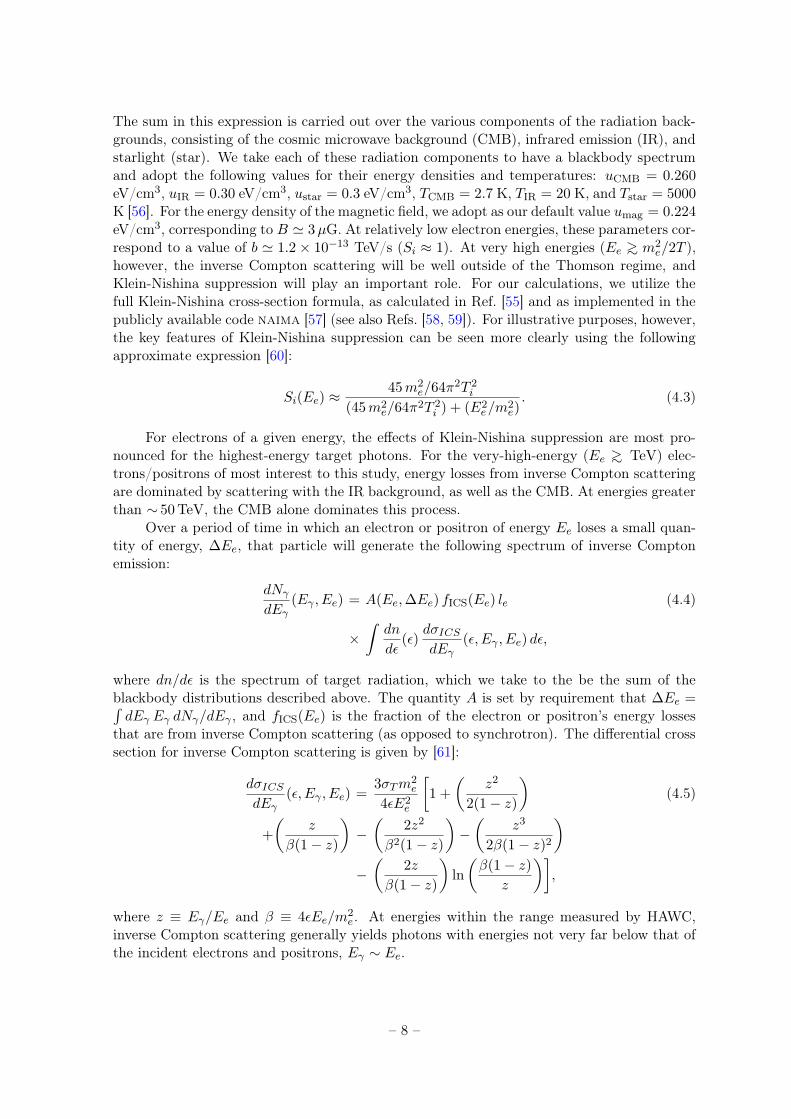
The sum in this expression is carried out over the various components of the radiation back-grounds, consisting of the cosmic microwave background (CMB), infrared emission (IR), andstarlight (star). We take each of these radiation components to have a blackbody spectrumand adopt the following values for their energy densities and temperatures: uCMB = 0.260eV/cm3, uIR = 0.30 eV/cm3, ustar = 0.3 eV/cm3, TCMB = 2.7 K, TIR = 20 K, and Tstar = 5000K [56]. For the energy density of the magnetic field, we adopt as our default value umag = 0.224eV/cm3, corresponding to B ' 3µG. At relatively low electron energies, these parameters cor-respond to a value of b ' 1.2× 10⁻¹³ TeV/s (Si ≈ 1). At very high energies (Ee >∼ m2
e/2T ),however, the inverse Compton scattering will be well outside of the Thomson regime, andKlein-Nishina suppression will play an important role. For our calculations, we utilize thefull Klein-Nishina cross-section formula, as calculated in Ref. [55] and as implemented in thepublicly available code naima [57] (see also Refs. [58, 59]). For illustrative purposes, however,the key features of Klein-Nishina suppression can be seen more clearly using the followingapproximate expression [60]:
Si(Ee) ≈45m2
e/64π2T 2i
(45m2e/64π2T 2
i ) + (E2e/m
2e). (4.3)
For electrons of a given energy, the effects of Klein-Nishina suppression are most pro-nounced for the highest-energy target photons. For the very-high-energy (Ee >∼ TeV) elec-trons/positrons of most interest to this study, energy losses from inverse Compton scatteringare dominated by scattering with the IR background, as well as the CMB. At energies greaterthan ∼ 50 TeV, the CMB alone dominates this process.
Over a period of time in which an electron or positron of energy Ee loses a small quan-tity of energy, ∆Ee, that particle will generate the following spectrum of inverse Comptonemission:
dNγ
dEγ(Eγ , Ee) = A(Ee,∆Ee) fICS(Ee) le (4.4)
×∫dn
dε(ε)
dσICSdEγ
(ε, Eγ , Ee) dε,
where dn/dε is the spectrum of target radiation, which we take to the be the sum of theblackbody distributions described above. The quantity A is set by requirement that ∆Ee =∫dEγ Eγ dNγ/dEγ , and fICS(Ee) is the fraction of the electron or positron’s energy losses
that are from inverse Compton scattering (as opposed to synchrotron). The differential crosssection for inverse Compton scattering is given by [61]:
dσICSdEγ
(ε, Eγ , Ee) =3σTm
2e
4εE2e
[1 +
(z2
2(1− z)
)(4.5)
+
(z
β(1− z)
)−(
2z2
β2(1− z)
)−(
z3
2β(1− z)2
)−(
2z
β(1− z)
)ln
(β(1− z)
z
)],
where z ≡ Eγ/Ee and β ≡ 4εEe/m2e. At energies within the range measured by HAWC,
inverse Compton scattering generally yields photons with energies not very far below that ofthe incident electrons and positrons, Eγ ∼ Ee.
– 8 –
As time passes, pulsars slow down and lose rotational kinetic energy, transferring muchof this energy into the acceleration of particles which produce the radio, gamma-ray, and othernon-thermal emission that is observed from these objects. From the measured quantities Pand P , we can define the pulsar’s characteristic age, tc:
tc ≡P
2P=n− 1
2(tage + τ), (4.6)
where n is the braking index, tage is the age of the pulsar, and τ is its spindown timescale.From the spindown equations, we can write the spindown timescale as
τ =2tcn− 1
(P0
P
)n−1
, (4.7)
where P0 is the initial period of the pulsar. For a given set of P0 and n, these equationsdetermine τ and tage. The spindown power of a pulsar evolves as follows:
E(t) = 4π2IP
P 3= E0
(1 +
t
τ
)−n+1n−1
, (4.8)
where E0 is the initial spindown power, given by
E0 = 4π2IP
P 3
(1 +
tage
τ
)n+1n−1
. (4.9)
These equations leave us with P0, n, and I as free parameters. Unless otherwise stated,we will adopt I = 1045 g cm2 and n = 3 throughout this study.
5 Results
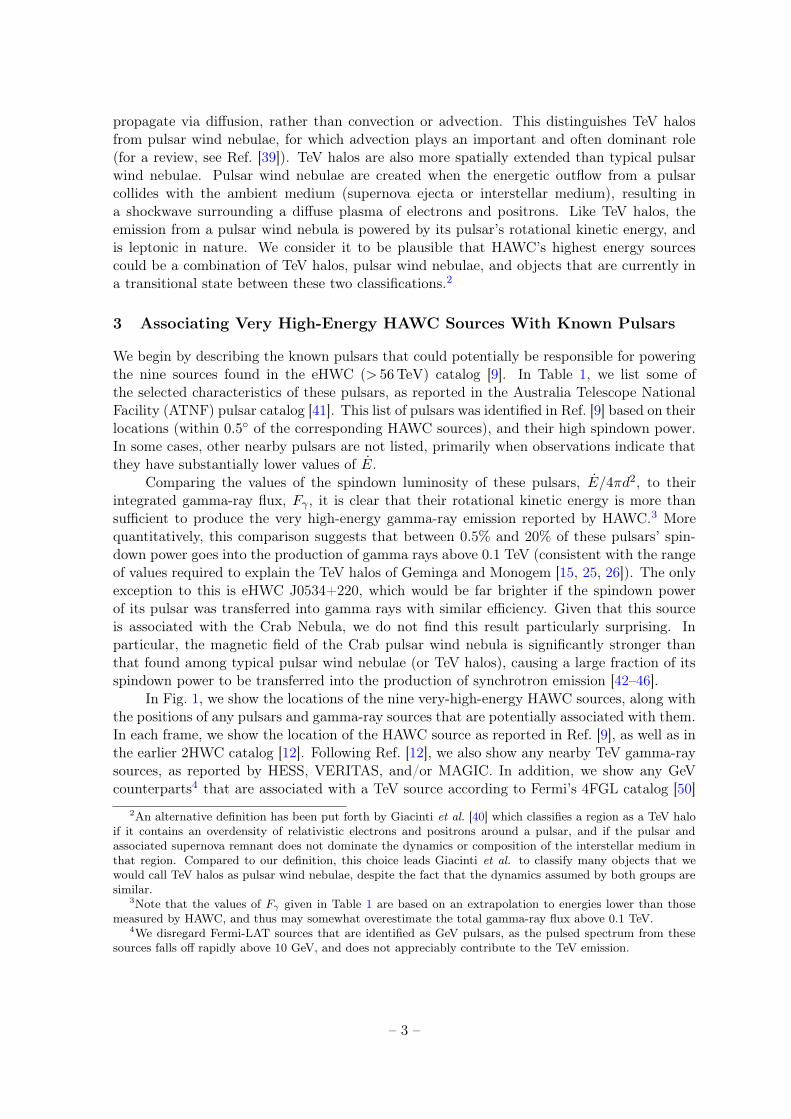
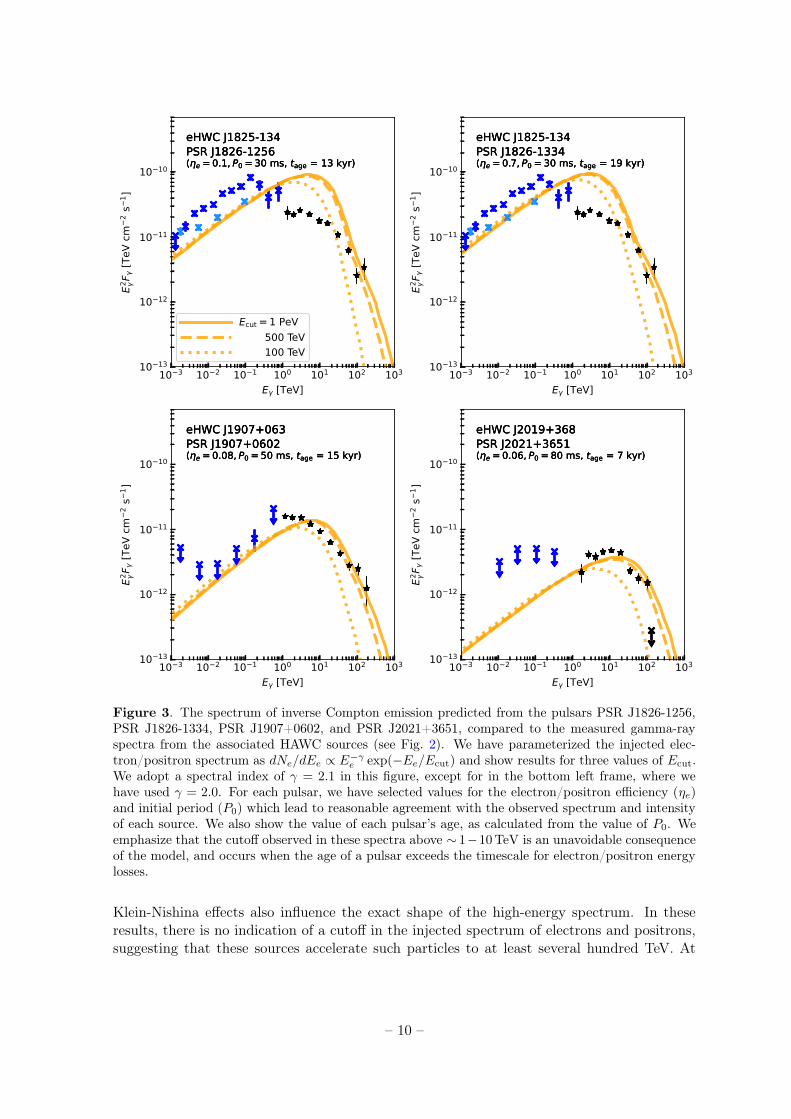
In Fig. 3, we show the spectra of inverse Compton emission predicted from the pulsars PSRJ1826-1256, PSR J1826-1334, PSR J1907+0602, and PSR J2021+3651, comparing our resultswith the gamma-ray observations of each associated HAWC source. In each case, we haveparameterized the injected electron/positron spectrum as a power-law with an exponentialcutoff, dNe/dEe ∝ E−γ
e exp(−Ee/Ecut). Along with γ and Ecut, we treat as free parame-ters each pulsar’s initial period, and the fraction of its spindown power that goes into theproduction of electrons and positrons integrated above 10 GeV, ηe. For each pulsar’s dis-tance, period, and rate of change of its period, we adopt the values reported in the AustraliaTelescope National Facility (ATNF) pulsar catalog [41] (as shown in Table 1). We adoptγ = 2.0 in the bottom left frame of Fig. 3, and 2.1 in the other three frames. In each frame,we show results for three choices of Ecut, and have selected values of ηe and P0 (obtainingthe corresponding value of tage) which, when possible, lead to reasonable agreement with theobserved spectral shape and intensity of each source.
As seen in Fig. 3, the gamma-ray spectrum that is produced through inverse Comptonscattering is automatically suppressed at energies above ∼ 10 TeV, for which the age of thesepulsars exceeds the timescale for electron/positron energy losses, tage >∼ (bEe)
−1. Aroundthis energy, the spectrum of the ambient electrons and positrons transitions from the injectedindex (γ) to a significantly softened index (γ − 1). Note that this suppression occurs even ifthe injected spectrum does not have a cutoff in the relevant energy range (Ecut � 100 TeV).
– 9 –
10 3 10 2 10 1 100 101 102 103
E [TeV]
10 13
10 12
10 11
10 10
E2 F [T
eV c
m2 s
1 ]eHWC J1825-134PSR J1826-1256( e = 0.1, P0 = 30 ms, tage = 13 kyr)
eHWC J1825-134PSR J1826-1256( e = 0.1, P0 = 30 ms, tage = 13 kyr)
eHWC J1825-134PSR J1826-1256( e = 0.1, P0 = 30 ms, tage = 13 kyr)
Ecut = 1 PeV 500 TeV 100 TeV
10 3 10 2 10 1 100 101 102 103
E [TeV]
10 13
10 12
10 11
10 10
E2 F [T
eV c
m2 s
1 ]
eHWC J1825-134PSR J1826-1334( e = 0.7, P0 = 30 ms, tage = 19 kyr)
eHWC J1825-134PSR J1826-1334( e = 0.7, P0 = 30 ms, tage = 19 kyr)
eHWC J1825-134PSR J1826-1334( e = 0.7, P0 = 30 ms, tage = 19 kyr)
10 3 10 2 10 1 100 101 102 103
E [TeV]
10 13
10 12
10 11
10 10
E2 F [T
eV c
m2 s
1 ]
eHWC J1907+063PSR J1907+0602( e = 0.08, P0 = 50 ms, tage = 15 kyr)
eHWC J1907+063PSR J1907+0602( e = 0.08, P0 = 50 ms, tage = 15 kyr)
eHWC J1907+063PSR J1907+0602( e = 0.08, P0 = 50 ms, tage = 15 kyr)
10 3 10 2 10 1 100 101 102 103
E [TeV]
10 13
10 12
10 11
10 10
E2 F [T
eV c
m2 s
1 ]eHWC J2019+368PSR J2021+3651( e = 0.06, P0 = 80 ms, tage = 7 kyr)
eHWC J2019+368PSR J2021+3651( e = 0.06, P0 = 80 ms, tage = 7 kyr)
eHWC J2019+368PSR J2021+3651( e = 0.06, P0 = 80 ms, tage = 7 kyr)
Figure 3. The spectrum of inverse Compton emission predicted from the pulsars PSR J1826-1256,PSR J1826-1334, PSR J1907+0602, and PSR J2021+3651, compared to the measured gamma-rayspectra from the associated HAWC sources (see Fig. 2). We have parameterized the injected elec-tron/positron spectrum as dNe/dEe ∝ E−γ
e exp(−Ee/Ecut) and show results for three values of Ecut.We adopt a spectral index of γ = 2.1 in this figure, except for in the bottom left frame, where wehave used γ = 2.0. For each pulsar, we have selected values for the electron/positron efficiency (ηe)and initial period (P0) which lead to reasonable agreement with the observed spectrum and intensityof each source. We also show the value of each pulsar’s age, as calculated from the value of P0. Weemphasize that the cutoff observed in these spectra above ∼ 1−10 TeV is an unavoidable consequenceof the model, and occurs when the age of a pulsar exceeds the timescale for electron/positron energylosses.
Klein-Nishina effects also influence the exact shape of the high-energy spectrum. In theseresults, there is no indication of a cutoff in the injected spectrum of electrons and positrons,suggesting that these sources accelerate such particles to at least several hundred TeV. At
– 10 –
10 3 10 2 10 1 100 101 102 103
E [TeV]
10 13
10 12
10 11
10 10
E2 F [T
eV c
m2 s
1 ]eHWC J1825-134(PSR J1826-1334)
P0 = 30 ms (tage = 19 kyr) 50 ms (16 kyr) 70 ms (11 kyr)
10 3 10 2 10 1 100 101 102 103
E [TeV]
10 13
10 12
10 11
10 10
E2 F [T
eV c
m2 s
1 ]
eHWC J1825-134(PSR J1826-1334)
tdiff, K = 300 kyr 30 kyr 3 kyr
10 3 10 2 10 1 100 101 102 103
E [TeV]
10 13
10 12
10 11
10 10
E2 F [T
eV c
m2 s
1 ]
eHWC J1825-134(PSR J1826-1334)
umag = 0.224 eV/cm3
0.5 eV/cm3
5.0 eV/cm3
20.0 eV/cm3
10 3 10 2 10 1 100 101 102 103
E [TeV]
10 13
10 12
10 11
10 10
E2 F [T
eV c
m2 s
1 ]eHWC J1825-134(PSR J1826-1334)
n = 3 2.5 2 1.5
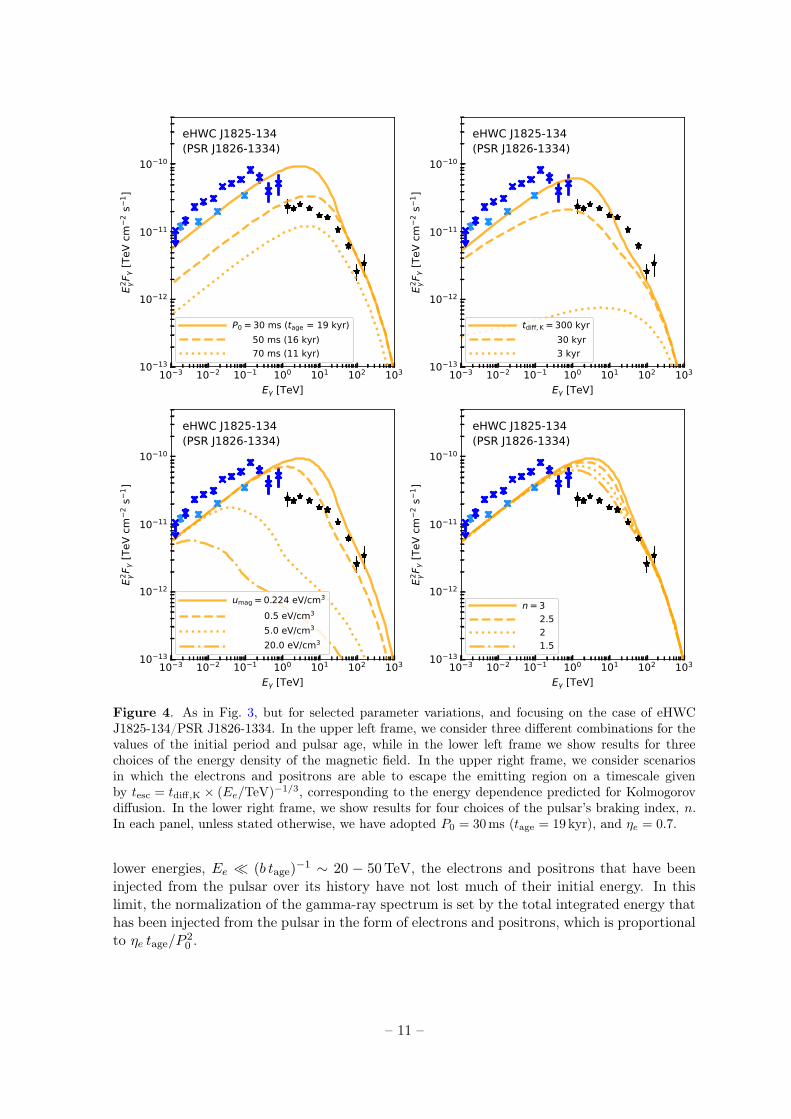
Figure 4. As in Fig. 3, but for selected parameter variations, and focusing on the case of eHWCJ1825-134/PSR J1826-1334. In the upper left frame, we consider three different combinations for thevalues of the initial period and pulsar age, while in the lower left frame we show results for threechoices of the energy density of the magnetic field. In the upper right frame, we consider scenariosin which the electrons and positrons are able to escape the emitting region on a timescale givenby tesc = tdiff,K × (Ee/TeV)−1/3, corresponding to the energy dependence predicted for Kolmogorovdiffusion. In the lower right frame, we show results for four choices of the pulsar’s braking index, n.In each panel, unless stated otherwise, we have adopted P0 = 30 ms (tage = 19 kyr), and ηe = 0.7.
lower energies, Ee � (b tage)−1 ∼ 20 − 50 TeV, the electrons and positrons that have been
injected from the pulsar over its history have not lost much of their initial energy. In thislimit, the normalization of the gamma-ray spectrum is set by the total integrated energy thathas been injected from the pulsar in the form of electrons and positrons, which is proportionalto ηe tage/P
20 .
– 11 –
From the lower frames of Fig. 3, we see that the pulsars PSR J1907+0602 and PSRJ2021+3651 can produce the emission observed by HAWC and Fermi, in each case requiringan efficiency similar to that of Geminga or Monogem, ηe ∼ 0.1. In the upper frames, wesee that either PSR J1826-1256 or PSR J1826-1334 (or some combination thereof) could beresponsible for the gamma-ray emission attributed to eHWC J1825-134, although the latterwould require a high value of ηe ∼ 0.7, and neither of these pulsars provides a particularlygood fit in the ∼ 1− 10 TeV range.
In Fig. 4, we consider some variations regarding our parameter choices, focusing on thecase of eHWC J1825-134 and its corresponding PSR J1826-1334. In the upper left frame, weconsider three different combinations for the values of the initial period and pulsar age. Asdescribed above, this does not impact the spectrum at high energies, where only the currentpower of the injected electrons/positrons determines the normalization. At lower energies,however, the normalization scales as ηetage/P
20 , corresponding to the total energy injected
into high-energy electrons and positrons over the life of the pulsar. In the lower-left frame,we consider variations to the energy density of the magnetic field, showing results for umag =0.224 eV/cm3 (our default value), 0.5 eV/cm3, 5.0 eV/cm3 and 20 eV/cm3, corresponding toB = 3.0 µG, 4.5 µG, 14.2 µG and 28.3 µG, respectively. By increasing the energy densityof the magnetic field, a larger fraction of the energy in electrons and positrons is lost tosynchrotron, suppressing the gamma-ray emission that is produced through inverse Comptonscattering.
Thus far in our calculations, we have assumed that the electrons and positrons remainwithin the TeV halo or pulsar wind nebula, and do not escape via diffusion. This correspondsto one or both of the following conditions being satisfied: tesc � tage or tesc � (bEe)
−1, wheretdiff is the timescale for particles to escape the TeV halo via diffusion. In the upper right frameof Fig. 4, we consider a class of scenarios in which the electrons/positrons instead escape ona timescale given by tesc = tdiff,K × (Ee/TeV)−1/3, corresponding to the energy dependencepredicted for Kolmogorov diffusion. More quantitatively, we reduce the number of electronsand positrons within the emission region by a factor of e−δt/tesc in each timestep of lengthδt. The impact of diffusion is significant only when tesc is smaller than both the age of thepulsar (which, in this case, is 19 kyr), and the timescale for energy losses (which is ∼ 103 yrat the highest energies shown, and ∼ 105 yr at TeV-scale energies). This could, in principle,significantly suppress the predicted gamma-ray emission, but only in scenarios with very rapiddiffusion (much faster than favored by the spectra of Geminga and Monogem [15]). We donot expect diffusion to play an important role in most of the sources under consideration inthis study.
Lastly, in the lower right frame of Fig. 4, we show results for four choices of the pulsar’sbraking index, n. The spectrum of this particular source is somewhat better fit for lowervalues of the braking index.
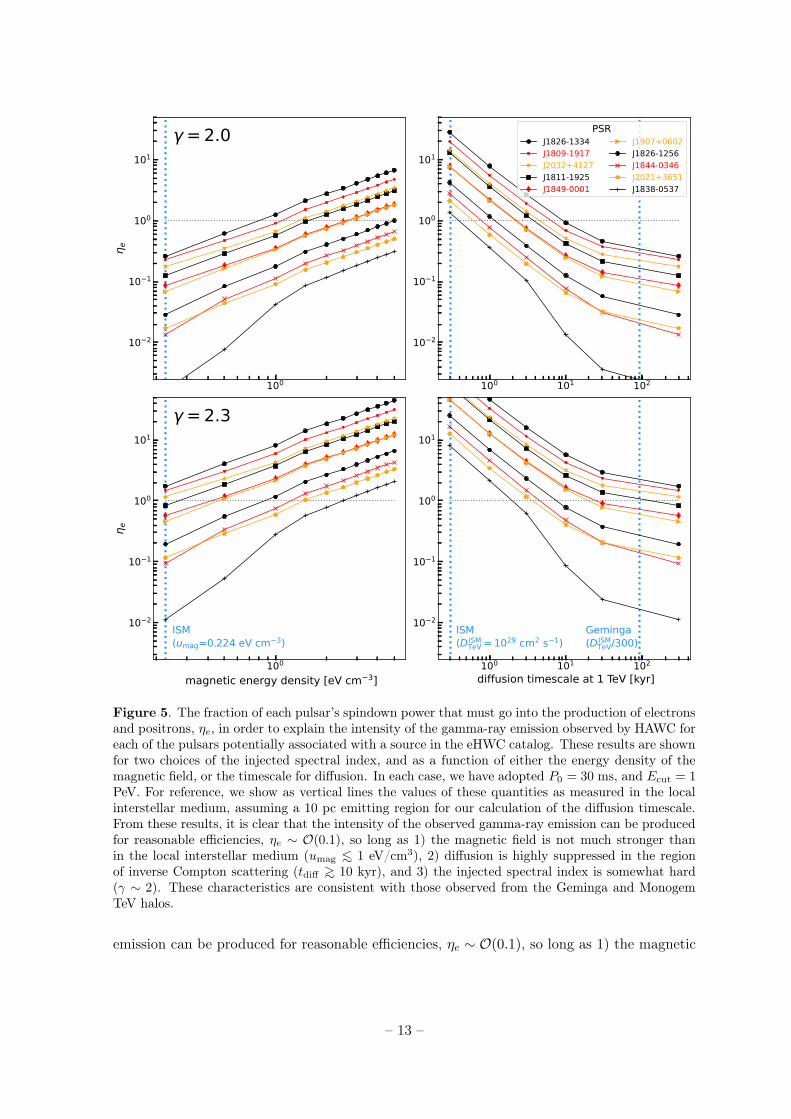
In Fig. 5, we show the values of ηe that are required to explain the intensity of thegamma-ray emission observed by HAWC from each of the sources in the eHWC catalog, foreach of the potentially associated pulsars listed in Table 1 (with the exception of the CrabPulsar, which requires a significantly smaller value of ηe for a given value of umag). We showresults for two choices of the injected spectral index (γ = 2.0, 2.3), and present these resultsas a function of either the energy density of the magnetic field, or the timescale for diffusion.In each case, we have adopted P0 = 30 ms, and Ecut = 1 PeV. For reference, we show asvertical lines the values of these quantities as measured in the local interstellar medium.
From Fig. 5, it is clear that in the case of γ = 2, the intensity of the observed gamma-ray
– 12 –
100
10 2
10 1
100
101
e
= 2.0
100 101 102
10 2
10 1
100
101
PSRJ1826-1334J1809-1917J2032+4127J1811-1925J1849-0001
J1907+0602J1826-1256J1844-0346J2021+3651J1838-0537
100
magnetic energy density [eV cm 3]
10 2
10 1
100
101
e
ISM(umag=0.224 eV cm 3)
= 2.3
100 101 102
diffusion timescale at 1 TeV [kyr]
10 2
10 1
100
101
ISM(D ISM
TeV = 1029 cm2 s 1)Geminga(D ISM
TeV/300)
Figure 5. The fraction of each pulsar’s spindown power that must go into the production of electronsand positrons, ηe, in order to explain the intensity of the gamma-ray emission observed by HAWC foreach of the pulsars potentially associated with a source in the eHWC catalog. These results are shownfor two choices of the injected spectral index, and as a function of either the energy density of themagnetic field, or the timescale for diffusion. In each case, we have adopted P0 = 30 ms, and Ecut = 1PeV. For reference, we show as vertical lines the values of these quantities as measured in the localinterstellar medium, assuming a 10 pc emitting region for our calculation of the diffusion timescale.From these results, it is clear that the intensity of the observed gamma-ray emission can be producedfor reasonable efficiencies, ηe ∼ O(0.1), so long as 1) the magnetic field is not much stronger thanin the local interstellar medium (umag <∼ 1 eV/cm3), 2) diffusion is highly suppressed in the regionof inverse Compton scattering (tdiff >∼ 10 kyr), and 3) the injected spectral index is somewhat hard(γ ∼ 2). These characteristics are consistent with those observed from the Geminga and MonogemTeV halos.
emission can be produced for reasonable efficiencies, ηe ∼ O(0.1), so long as 1) the magnetic
– 13 –
field is not much stronger than in the local interstellar medium (umag <∼ 1 eV/cm3), and 2)diffusion is highly suppressed in the region of inverse Compton scattering (tdiff >∼ 10 kyr),as is known to be the case for both the Geminga and Monogem TeV halos. Comparing thisto the results found in the γ = 2.3 case, it is clear that somewhat hard spectral indices arealso required to produce the observed emission, again consistent with that observed fromGeminga and Monogem. Note that in calculating the values of ηe, we have adopted a power-law injected spectrum of electrons and positrons, integrated to a minimum energy of 10 GeV.Multiwavelength studies of pulsar wind nebulae often require the electrons/positrons to beinjected with a broken power-law spectrum, with Ebr ∼ 0.1 TeV (see, for example, Ref. [62]).Adopting such a function can reduce the required efficiency by a factor of approximately∼ (Ebr/10 GeV)γ−2.
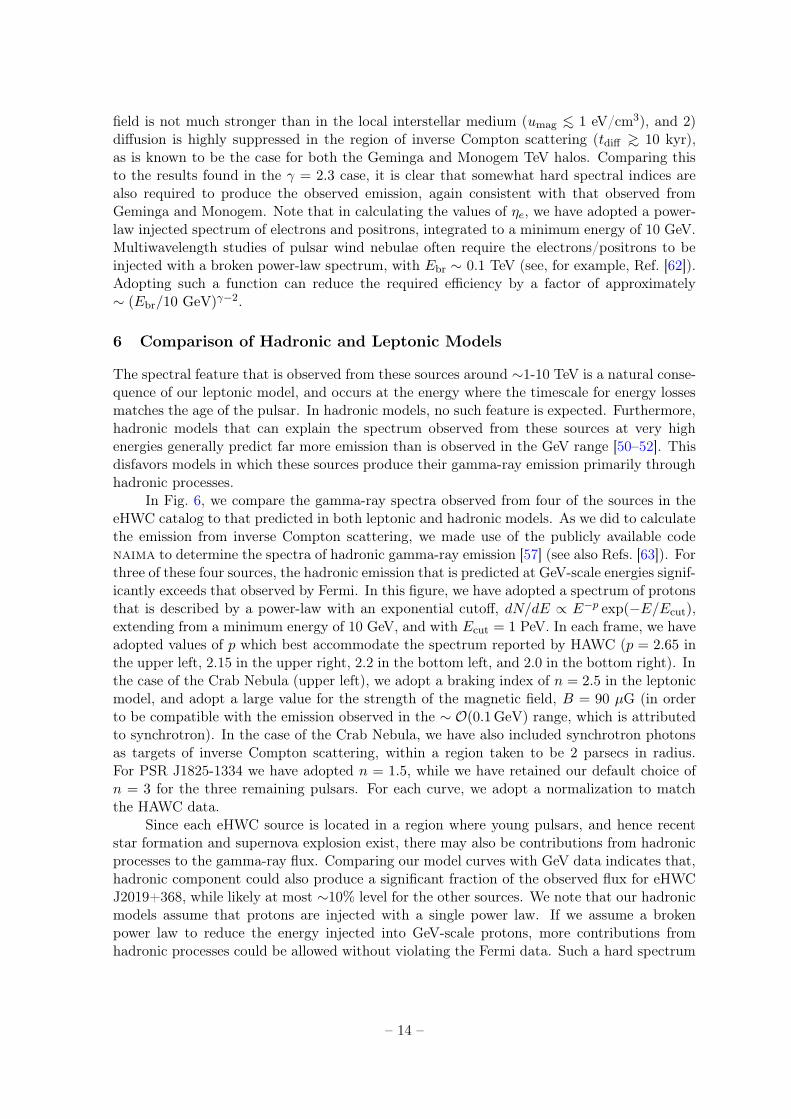
6 Comparison of Hadronic and Leptonic Models
The spectral feature that is observed from these sources around ∼1-10 TeV is a natural conse-quence of our leptonic model, and occurs at the energy where the timescale for energy lossesmatches the age of the pulsar. In hadronic models, no such feature is expected. Furthermore,hadronic models that can explain the spectrum observed from these sources at very highenergies generally predict far more emission than is observed in the GeV range [50–52]. Thisdisfavors models in which these sources produce their gamma-ray emission primarily throughhadronic processes.
In Fig. 6, we compare the gamma-ray spectra observed from four of the sources in theeHWC catalog to that predicted in both leptonic and hadronic models. As we did to calculatethe emission from inverse Compton scattering, we made use of the publicly available codenaima to determine the spectra of hadronic gamma-ray emission [57] (see also Refs. [63]). Forthree of these four sources, the hadronic emission that is predicted at GeV-scale energies signif-icantly exceeds that observed by Fermi. In this figure, we have adopted a spectrum of protonsthat is described by a power-law with an exponential cutoff, dN/dE ∝ E−p exp(−E/Ecut),extending from a minimum energy of 10 GeV, and with Ecut = 1 PeV. In each frame, we haveadopted values of p which best accommodate the spectrum reported by HAWC (p = 2.65 inthe upper left, 2.15 in the upper right, 2.2 in the bottom left, and 2.0 in the bottom right). Inthe case of the Crab Nebula (upper left), we adopt a braking index of n = 2.5 in the leptonicmodel, and adopt a large value for the strength of the magnetic field, B = 90 µG (in orderto be compatible with the emission observed in the ∼ O(0.1 GeV) range, which is attributedto synchrotron). In the case of the Crab Nebula, we have also included synchrotron photonsas targets of inverse Compton scattering, within a region taken to be 2 parsecs in radius.For PSR J1825-1334 we have adopted n = 1.5, while we have retained our default choice ofn = 3 for the three remaining pulsars. For each curve, we adopt a normalization to matchthe HAWC data.
Since each eHWC source is located in a region where young pulsars, and hence recentstar formation and supernova explosion exist, there may also be contributions from hadronicprocesses to the gamma-ray flux. Comparing our model curves with GeV data indicates that,hadronic component could also produce a significant fraction of the observed flux for eHWCJ2019+368, while likely at most ∼10% level for the other sources. We note that our hadronicmodels assume that protons are injected with a single power law. If we assume a brokenpower law to reduce the energy injected into GeV-scale protons, more contributions fromhadronic processes could be allowed without violating the Fermi data. Such a hard spectrum
– 14 –
10 3 10 2 10 1 100 101 102 103
E [TeV]
10 13
10 12
10 11
10 10
E2 F [T
eV c
m2 s
1 ]eHWC J0534+220 (Crab)
hadronicPSR J0534+2200(P0 =25 ms, = 2.4, e = 0.5)Fermi (Buehler et al. 2012)
10 3 10 2 10 1 100 101 102 103
E [TeV]
10 13
10 12
10 11
10 10
E2 F [T
eV c
m2 s
1 ]
eHWC J1825-134
hadronicPSR J1826-1256(P0 =30 ms, = 2.1, e = 0.1)PSR J1825-1334(P0 =30 ms, = 2.1, e = 0.7)4FGL J1824.5-1351e
10 3 10 2 10 1 100 101 102 103
E [TeV]
10 14
10 13
10 12
10 11
E2 F [T
eV c
m2 s
1 ]
eHWC J1907+063
hadronicPSR J1907+0602(P0 =50 ms, = 2.0, e = 0.08)
10 3 10 2 10 1 100 101 102 103
E [TeV]
10 14
10 13
10 12
10 11
E2 F [T
eV c
m2 s
1 ]eHWC J2019+368
hadronicPSR J2021+3651(P0 =80 ms, = 2.1, e = 0.06)
Figure 6. A comparison of the gamma-ray spectra observed from four of the sources in the eHWCcatalog to that predicted from both leptonic and hadronic models. For three of these four sources,the hadronic emission that is predicted at GeV-scale energies significantly exceeds that observed byFermi. We have adopted a spectrum of protons that is described by a power-law with an exponentialcutoff, dN/dE ∝ E−p exp(−E/Ecut), with Ecut = 1 PeV and extending to a minimum energy of 10GeV. In each frame, we have adopted a value of p which best accommodates the spectra reported byHAWC.
could be realized in a scenario where very-high-energy protons that escape early from theSNR travel into massive gas clouds, producing gamma rays there, while lower-energy protonsremain confined in the accelerator (e.g., [64]). However, the eHWC sources shown in Figure 6,except for eHWC 1825-134, have not been reported to have a clear spatial correlation withgases, which challenges this scenario. Regarding eHWC 1825-134, mixed hadronic/leptoniccontributions is a plausible scenario. ([65], see also Sec. 7)
– 15 –
7 Discussion and Summary
The nature of the highest energy HAWC sources is a subject of considerable interest, which hasrecently been discussed by a number of authors and collaborations. In particular, the HAWCCollaboration has used multiwavelength data to argue that the gamma-ray emission fromeHWC J2019+368 is leptonic in origin [66], in agreement with our assessment of this source.More recently, HAWC has performed a stacking analysis of ten pulsars that are not associatedwith any eHWC sources, identifying evidence of gamma-ray emission at energies above 56TeV [67]. More broadly speaking, they conclude from this information that high-spindownpower pulsars universally produce extremely high energy photons. In Ref. [65], members of theHAWC Collaboration argued that eHWC J1825-134 can be separated into four components:diffuse Galactic emission, HAWC J1826-128 (the counterpart to HESS J1826-130), HAWCJ1825-138 (the counterpart to HESS J1825-137), and the newly discovered source HAWCJ1825-134. The spectrum of the emission associated with HAWC J1825-134, and its spatialcorrelation with dense gas, favors a hadronic interpretation for this emission. In contrast, theother two HAWC sources that contribute to eHWC J1825-134 are likely leptonic in origin.
Beyond the HAWC Collaboration, Di Mauro et al. [52] have shown that the spectraof three eHWC sources (eHWC J1825-134, J1907+063, and J2019+368) can be well fit byleptonic models, in concordance with our conclusions (see also, Ref [68]). On similar grounds,Fang et al. [69] have argued that eHWC J2019+368 is likely leptonic in nature. In contrast,the authors of Ref. [70] have claimed that HESS J1809-193 (associated with eHWC J1809-193)is likely to be a hadronic source.
In this paper, we have studied each of the nine gamma-ray sources contained in theeHWC catalog, expanding on the previous work described above, and identifying significantevidence that their emission is likely leptonic in origin. In particular, the gamma-ray emissionfrom these sources can be straightforwardly accommodated within a model in which ∼ O(10%)of the host pulsar’s spindown power is transferred into the acceleration of electrons andpositrons with a simple power-law spectrum. The spectral break that is observed amongthese sources is an unavoidable consequence of this model.
In contrast, the spectral feature that is observed from these sources is not expectedin hadronic scenarios, which also predict far more emission at GeV-scale energies than isobserved. For the three eHWC sources with detailed spectral information, we can rule outscenarios in which a significant fraction of their observed emission is hadronic in origin. Whileit remains possible that one or more of the other six eHWC sources could produce hadronicemission (see, for example, Ref. [70]), we stress that nothing in our analysis differentiates anyof these sources from those that are clearly leptonic in nature. This disfavors an interpretationof these sources as the long-sought-after Galactic PeVatrons.
Furthermore, all nine sources in the eHWC catalog can be powered by the rotationalkinetic energy of their host pulsar, requiring efficiencies that are similar to those of theGeminga and Monogem TeV halos. Also like Geminga and Monogem, diffusion appears tobe suppressed within the emission regions of these sources, and electrons and positrons areinjected into these regions with a relatively hard spectral index, γ ∼ 2.
In light of the considerations described in the paragraphs above, we conclude thatHAWC’s highest energy sources are likely to be TeV halos or pulsar wind nebulae, whichproduce their gamma-ray emission through inverse Compton scattering, and which are pow-ered by the rotational kinetic energy of their host pulsar. We find no evidence that this classof sources produces significant gamma-ray emission through hadronic processes, or accelerates
– 16 –
protons to PeV-scale energies.
Acknowledgments. We would like to thank Mattia Di Mauro for providing us withthe data from Ref. [52]. TS is supported by a Research Fellowship of Japan Society for thePromotion of Science (JSPS) and by JSPS KAKENHI Grant No. JP 18J20943. TL is par-tially supported by the Swedish Research Council under contract 2019-05135, the SwedishNational Space Agency under contract 117/19 and the European Research Council undergrant 742104. DH is supported by the Fermi Research Alliance, LLC under Contract No.DE-AC02-07CH11359 with the U.S. Department of Energy, Office of High Energy Physics.In this work, we have made use of naima [57], gammapy5[71, 72], astropy6 [73, 74], mat-plotlib [75], numpy [76], and scipy [77].
References
[1] M. Tavani et al., Direct Evidence for Hadronic Cosmic-Ray Acceleration in the SupernovaRemnant IC 443, The Astrophysical Journal Letters 710 (2010) L151 [1001.5150].
[2] Fermi-LAT collaboration, Detection of the Characteristic Pion-Decay Signature in SupernovaRemnants, Science 339 (2013) 807 [1302.3307].
[3] A. Bell, K. Schure, B. Reville and G. Giacinti, Cosmic ray acceleration and escape fromsupernova remnants, Mon. Not. Roy. Astron. Soc. 431 (2013) 415 [1301.7264].
[4] S. Gabici, Gamma-Ray Emission from Supernova Remnants and Surrounding MolecularClouds, AIP Conf. Proc. 1792 (2017) 020002 [1610.06234].
[5] Y. Fujita, K. Murase and S.S. Kimura, Sagittarius A* as an Origin of the Galactic PeVCosmic Rays?, JCAP 04 (2017) 037 [1604.00003].
[6] Y.-Q. Guo, Z. Tian, Z. Wang, H.-J. Li and T.-L. Chen, The Galactic Center: APetaelectronvolt Cosmic-ray Acceleration Factory, Astrophys. J. 836 (2017) 233 [1604.08301].
[7] H.E.S.S. collaboration, Acceleration of petaelectronvolt protons in the Galactic Centre, Nature531 (2016) 476 [1603.07730].
[8] F. Aharonian, R. Yang and E. de Oña Wilhelmi, Massive Stars as Major Factories of GalacticCosmic Rays, Nature Astron. 3 (2019) 561 [1804.02331].
[9] HAWC collaboration, Multiple Galactic Sources with Emission Above 56 TeV Detected byHAWC, Phys. Rev. Lett. 124 (2020) 021102 [1909.08609].
[10] M. Amenomori et al., First Detection of Photons with Energy beyond 100 TeV from anAstrophysical Source, Phys. Rev. Lett. 123 (2019) 051101 [1906.05521].
[11] A. Albert et al., 3HWC: The Third HAWC Catalog of Very-High-Energy Gamma-ray Sources,2007.08582.
[12] A. Abeysekara et al., The 2HWC HAWC Observatory Gamma Ray Catalog, Astrophys. J. 843(2017) 40 [1702.02992].
[13] HAWC collaboration, Extended gamma-ray sources around pulsars constrain the origin of thepositron flux at Earth, Science 358 (2017) 911 [1711.06223].
[14] A.A. Abdo et al., Milagro Observations of Multi-TeV Emission from Galactic Sources in theFermi Bright Source List, The Astrophysical Journal Letters 700 (2009) L127 [0904.1018].
5https://www.gammapy.org6http://www.astropy.org
– 17 –
[15] D. Hooper, I. Cholis, T. Linden and K. Fang, HAWC Observations Strongly Favor PulsarInterpretations of the Cosmic-Ray Positron Excess, Phys. Rev. D 96 (2017) 103013[1702.08436].
[16] D. Hooper and T. Linden, Measuring the Local Diffusion Coefficient with H.E.S.S.Observations of Very High-Energy Electrons, Phys. Rev. D 98 (2018) 083009 [1711.07482].
[17] R. López-Coto and G. Giacinti, Constraining the properties of the magnetic turbulence in theGeminga region using HAWC γ-ray data, Mon. Not. Roy. Astron. Soc. 479 (2018) 4526[1712.04373].
[18] G. Johannesson, T.A. Porter and I.V. Moskalenko, Cosmic-Ray Propagation in Light of theRecent Observation of Geminga, Astrophys. J. 879 (2019) 91 [1903.05509].
[19] M. Di Mauro, S. Manconi and F. Donato, Evidences of low-diffusion bubbles around Galacticpulsars, Phys. Rev. D 101 (2020) 103035 [1908.03216].
[20] R.-Y. Liu, H. Yan and H. Zhang, Understanding the Multiwavelength Observation of Geminga’sTev Halo: The Role of Anisotropic Diffusion of Particles, Phys. Rev. Lett. 123 (2019) 221103[1904.11536].
[21] C. Evoli, T. Linden and G. Morlino, Self-generated cosmic-ray confinement in TeV halos:Implications for TeV γ-ray emission and the positron excess, Phys. Rev. D 98 (2018) 063017[1807.09263].
[22] K. Fang, X.-J. Bi and P.-F. Yin, Possible origin of the slow-diffusion region around Geminga,Mon. Not. Roy. Astron. Soc. 488 (2019) 4074 [1903.06421].
[23] HESS collaboration, The H.E.S.S. Galactic plane survey, Astron. Astrophys. 612 (2018) A1[1804.02432].
[24] HESS collaboration, The population of TeV pulsar wind nebulae in the H.E.S.S. GalacticPlane Survey, Astron. Astrophys. 612 (2018) A2 [1702.08280].
[25] T. Linden, K. Auchettl, J. Bramante, I. Cholis, K. Fang, D. Hooper et al., Using HAWC todiscover invisible pulsars, Phys. Rev. D 96 (2017) 103016 [1703.09704].
[26] T. Sudoh, T. Linden and J.F. Beacom, TeV Halos are Everywhere: Prospects for NewDiscoveries, Phys. Rev. D 100 (2019) 043016 [1902.08203].
[27] HAWC collaboration, A Systematic Search for TeV Halos associated with known pulsars, PoSICRC2019 (2020) 797.
[28] D. Hooper and T. Linden, Millisecond Pulsars, TeV Halos, and Implications For The GalacticCenter Gamma-Ray Excess, Phys. Rev. D 98 (2018) 043005 [1803.08046].
[29] K. Fang, X.-J. Bi, P.-F. Yin and Q. Yuan, Two-zone diffusion of electrons and positrons fromGeminga explains the positron anomaly, Astrophys. J. 863 (2018) 30 [1803.02640].
[30] S. Profumo, J. Reynoso-Cordova, N. Kaaz and M. Silverman, Lessons from HAWC pulsar windnebulae observations: The diffusion constant is not a constant; pulsars remain the likeliestsources of the anomalous positron fraction; cosmic rays are trapped for long periods of time inpockets of inefficient diffusion, Phys. Rev. D 97 (2018) 123008 [1803.09731].
[31] X. Tang and T. Piran, Positron flux and γ-ray emission from Geminga pulsar and pulsar windnebula, Mon. Not. Roy. Astron. Soc. 484 (2019) 3491 [1808.02445].
[32] S. Manconi, M. Di Mauro and F. Donato, Contribution of pulsars to cosmic-ray positrons inlight of recent observation of inverse-Compton halos, Phys. Rev. D 102 (2020) 023015[2001.09985].
[33] H. Yüksel, M.D. Kistler and T. Stanev, TeV Gamma Rays from Geminga and the Origin of theGeV Positron Excess, Phys. Rev. Lett. 103 (2009) 051101 [0810.2784].
– 18 –
[34] F.A. Aharonian, A.M. Atoyan and H.J. Voelk, High energy electrons and positrons in cosmicrays as an indicator of the existence of a nearby cosmic tevatron, Astronomy and Astrophysics294 (1995) L41.
[35] F.A. Aharonian, Very high energy gamma-ray astronomy and the origin of cosmic rays.,Nuclear Physics B Proceedings Supplements 39 (1995) 193.
[36] T. Linden and B.J. Buckman, Pulsar TeV Halos Explain the Diffuse TeV Excess Observed byMilagro, Phys. Rev. Lett. 120 (2018) 121101 [1707.01905].
[37] D. Hooper, I. Cholis and T. Linden, TeV Gamma Rays From Galactic Center Pulsars, Phys.Dark Univ. 21 (2018) 40 [1705.09293].
[38] CTA Consortium collaboration, B. Acharya et al., Science with the Cherenkov TelescopeArray, WSP (11, 2018), 10.1142/10986, [1709.07997].
[39] B.M. Gaensler and P.O. Slane, The evolution and structure of pulsar wind nebulae, Ann. Rev.Astron. Astrophys. 44 (2006) 17 [astro-ph/0601081].
[40] G. Giacinti, A. Mitchell, R. López-Coto, V. Joshi, R. Parsons and J. Hinton, Halo fraction inTeV-bright pulsar wind nebulae, Astron. Astrophys. 636 (2020) A113 [1907.12121].
[41] R.N. Manchester, G.B. Hobbs, A. Teoh and M. Hobbs, The Australia Telescope NationalFacility pulsar catalogue, Astron. J. 129 (2005) 1993 [astro-ph/0412641].
[42] M. Lyutikov, T. Temim, S. Komissarov, P. Slane, L. Sironi and L. Comisso, Interpreting CrabNebula’s synchrotron spectrum: two acceleration mechanisms, Mon. Not. Roy. Astron. Soc. 489(2019) 2403 [1811.01767].
[43] E. Amato, D. Guetta and P. Blasi, Signatures of high energy protons in pulsar winds, Astron.Astrophys. 402 (2003) 827 [astro-ph/0302121].
[44] M. Meyer, D. Horns and H.-S. Zechlin, The Crab Nebula as a standard candle in veryhigh-energy astrophysics, Astron. Astrophys. 523 (2010) A2 [1008.4524].
[45] H.E.S.S. collaboration, Resolving the Crab pulsar wind nebula at teraelectronvolt energies,Nature Astron. 4 (2019) 167 [1909.09494].
[46] D. Khangulyan, M. Arakawa and F. Aharonian, Detection of ultra-high-energy gamma raysfrom the Crab Nebula: physical implications, Mon. Not. Roy. Astron. Soc. 491 (2020) 3217[1911.07438].
[47] H. Pletsch et al., PSR J1838-0537: Discovery of a young, energetic gamma-ray pulsar,Astrophys. J. Lett. 755 (2012) L20 [1207.5333].
[48] J. Wu et al., The Einstein@Home Gamma-ray Pulsar Survey. II. Source Selection, SpectralAnalysis, and Multiwavelength Follow-up, Astrophys. J. 854 (2018) 99 [1712.05395].
[49] E. Gotthelf, J. Halpern, R. Terrier and F. Mattana, Discovery of an Energetic 38.5 ms PulsarPowering the Gamma-ray Source IGR J18490-0000/HESS J1849-000, Astrophys. J. Lett. 729(2011) L16 [1012.2121].
[50] Fermi-LAT collaboration, Fermi Large Area Telescope Fourth Source Catalog, Astrophys. J.Suppl. 247 (2020) 33 [1902.10045].
[51] A.U. Abeysekara et al., A Very High Energy γ-Ray Survey toward the Cygnus Region of theGalaxy, ApJ 861 (2018) 134 [1805.05989].
[52] M. Di Mauro, S. Manconi, M. Negro and F. Donato, Investigating γ-ray halos around threeHAWC bright sources in Fermi-LAT data, arXiv e-prints (2020) arXiv:2012.05932[2012.05932].
[53] VERITAS, MAGIC collaboration, Periastron Observations of TeV Gamma-Ray Emissionfrom a Binary System with a 50-year Period, Astrophys. J. Lett. 867 (2018) L19 [1810.05271].
– 19 –
[54] E. Aliu et al., Investigating the TeV Morphology of MGRO J1908+06 with VERITAS,Astrophys. J. 787 (2014) 166 [1404.7185].
[55] G.R. Blumenthal and R.J. Gould, Bremsstrahlung, synchrotron radiation, and comptonscattering of high-energy electrons traversing dilute gases, Rev. Mod. Phys. 42 (1970) 237.
[56] T.A. Porter, G. Johannesson and I.V. Moskalenko, High-Energy Gamma Rays from the MilkyWay: Three-Dimensional Spatial Models for the Cosmic-Ray and Radiation Field Densities inthe Interstellar Medium, Astrophys. J. 846 (2017) 67 [1708.00816].
[57] V. Zabalza, naima: a python package for inference of relativistic particle energy distributionsfrom observed nonthermal spectra, Proc. of International Cosmic Ray Conference 2015 (2015)922 [1509.03319].
[58] F.A. Aharonian, S.R. Kelner and A.Y. Prosekin, Angular, spectral, and time distributions ofhighest energy protons and associated secondary gamma rays and neutrinos propagating throughextragalactic magnetic and radiation fields, Phys. Rev. D 82 (2010) 043002 [1006.1045].
[59] D. Khangulyan, F.A. Aharonian and S.R. Kelner, Simple Analytical Approximations forTreatment of Inverse Compton Scattering of Relativistic Electrons in the Blackbody RadiationField, ApJ 783 (2014) 100 [1310.7971].
[60] R. Schlickeiser and J. Ruppel, Klein–nishina steps in the energy spectrum of galacticcosmic-ray electrons, New Journal of Physics 12 (2010) 033044.
[61] F. Aharonian and A. Atoyan, Compton scattering of relativistic electrons in compact x-raysources, Astrophysics and Space Science 79 (1981) 321.
[62] D.F. Torres, A. Cillis, J. Martín and E. de Oña Wilhelmi, Time-dependent modeling ofTeV-detected, young pulsar wind nebulae, JHEAp 1-2 (2014) 31 [1402.5485].
[63] E. Kafexhiu, F. Aharonian, A.M. Taylor and G.S. Vila, Parametrization of gamma-rayproduction cross sections for p p interactions in a broad proton energy range from thekinematic threshold to PeV energies, Phys. Rev. D 90 (2014) 123014 [1406.7369].
[64] S. Gabici and F.A. Aharonian, Searching for Galactic Cosmic-Ray Pevatrons with Multi-TeVGamma Rays and Neutrinos, ApJ 665 (2007) L131 [0705.3011].
[65] A. Albert et al., Evidence of 200 TeV photons from HAWC J1825-134, 2012.15275.
[66] HAWC collaboration, Spectrum and Morphology of the Very-High-Energy Source HAWCJ2019+368, 2101.01649.
[67] HAWC collaboration, Evidence that Ultra-High-Energy Gamma Rays are a Universal FeatureNear Powerful Pulsars, 2101.07895.
[68] M. Breuhaus, J. Hahn, C. Romoli, B. Reville, G. Giacinti, R. Tuffs et al., Ultra-high energyInverse Compton emission from Galactic electron accelerators, 2010.13960.
[69] J. Fang, L. Wen, H. Yu and S. Chen, Investigating the multiband non-thermal emission of the100 TeV source eHWC J2019+368 with a pulsar wind nebula scenario, Mon. Not. Roy. Astron.Soc. 498 (2020) 4901 [2007.13943].
[70] M. Araya, GeV Emission in the Region of HESS J1809−193 and HESS J1813−178: Is HESSJ1809−193 a Proton Pevatron?, Astrophys. J. 859 (2018) 69 [1804.03325].
[71] C. Deil et al., Gammapy - A prototype for the CTA science tools, in 35th International CosmicRay Conference (ICRC2017), vol. 301 of International Cosmic Ray Conference, p. 766, Jan.,2017 [1709.01751].
[72] C. Nigro et al., Towards open and reproducible multi-instrument analysis in gamma-rayastronomy, Astronomy & Astrophysics 625 (2019) A10 [1903.06621].
[73] Astropy Collaboration, Astropy: A community Python package for astronomy, Astronomy &Astrophysics 558 (2013) A33 [1307.6212].
– 20 –
[74] Astropy Collaboration, The Astropy Project: Building an Open-science Project and Status ofthe v2.0 Core Package, The Astronomical Journal 156 (2018) 123 [1801.02634].
[75] J.D. Hunter, Matplotlib: A 2d graphics environment, Computing in Science & Engineering 9(2007) 90.
[76] S. van der Walt, S.C. Colbert and G. Varoquaux, The numpy array: A structure for efficientnumerical computation, Computing in Science Engineering 13 (2011) 22.
[77] E. Jones, T. Oliphant, P. Peterson et al., SciPy: Open source scientific tools for Python"(2001–).
– 21 –