Embed Size (px)
Citation preview
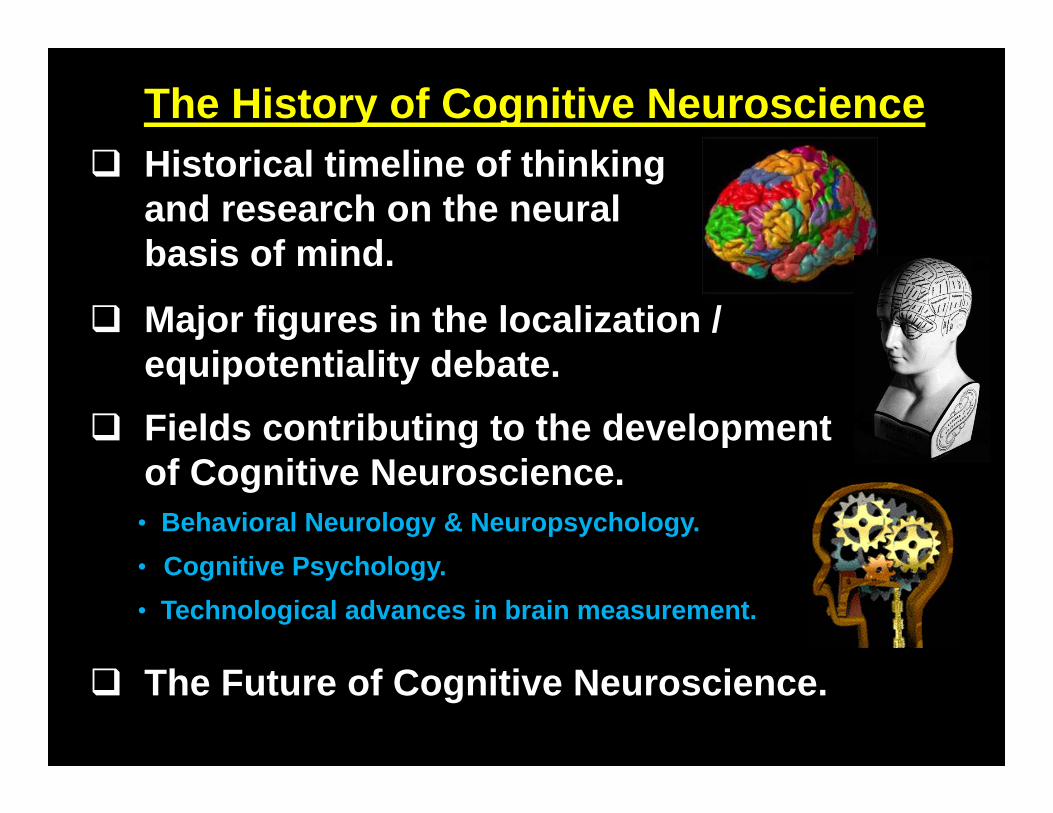
Historical timeline of thinking and research on the neural basis of mind.
The History of Cognitive Neuroscience
• Behavioral Neurology & Neuropsychology.• Cognitive Psychology.• Technological advances in brain measurement.
Major figures in the localization / equipotentiality debate.
Fields contributing to the development of Cognitive Neuroscience.
The Future of Cognitive Neuroscience.
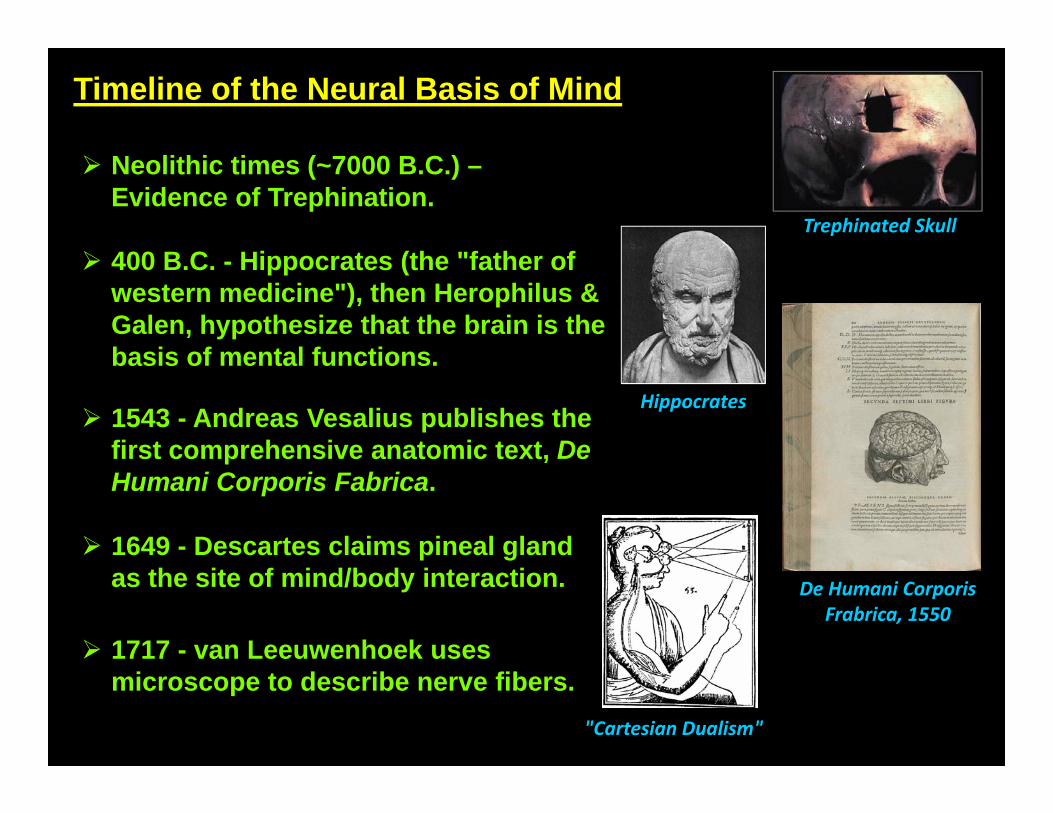
Timeline of the Neural Basis of Mind
Neolithic times (~7000 B.C.) –Evidence of Trephination.
1543 - Andreas Vesalius publishes the first comprehensive anatomic text, De Humani Corporis Fabrica.
De Humani CorporisFrabrica, 1550
1649 - Descartes claims pineal gland as the site of mind/body interaction.
"Cartesian Dualism"
Trephinated Skull
1717 - van Leeuwenhoek uses microscope to describe nerve fibers.
400 B.C. - Hippocrates (the "father of western medicine"), then Herophilus & Galen, hypothesize that the brain is the basis of mental functions.
Hippocrates
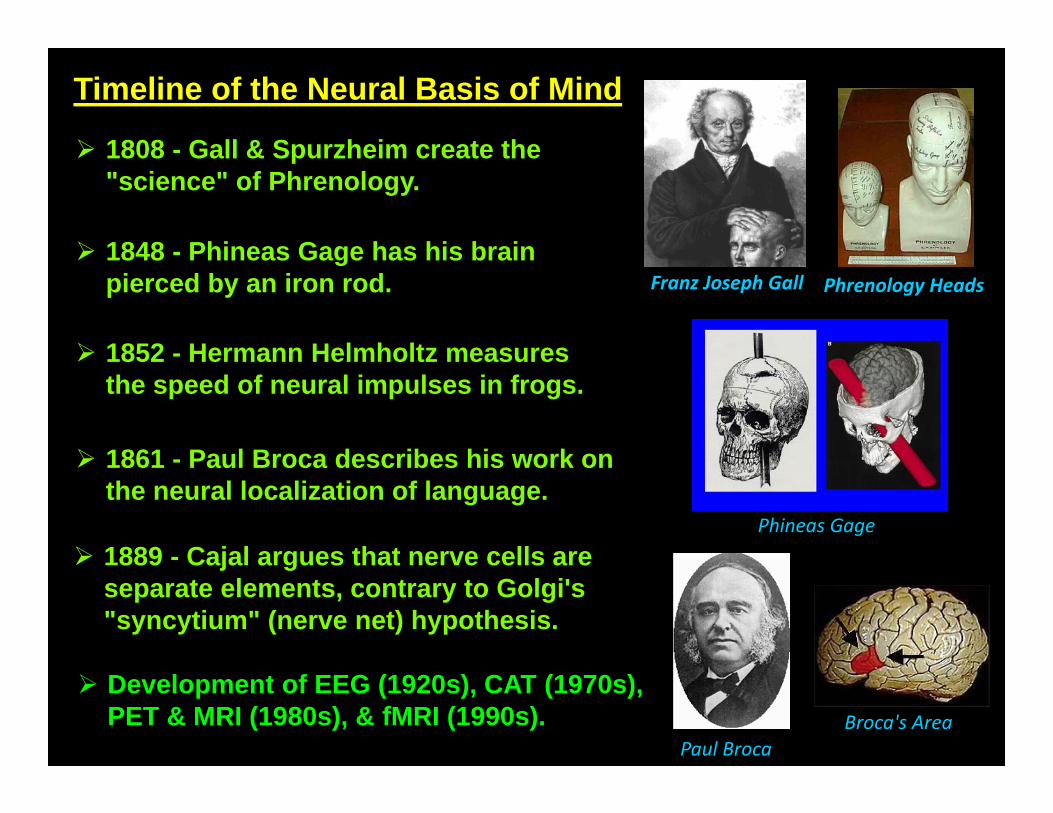
1808 - Gall & Spurzheim create the "science" of Phrenology.
Franz Joseph Gall Phrenology Heads 1848 - Phineas Gage has his brain
pierced by an iron rod.
Phineas Gage
1861 - Paul Broca describes his work on the neural localization of language.
Paul BrocaBroca's Area
Development of EEG (1920s), CAT (1970s), PET & MRI (1980s), & fMRI (1990s).
1852 - Hermann Helmholtz measures the speed of neural impulses in frogs.
Timeline of the Neural Basis of Mind
1889 - Cajal argues that nerve cells are separate elements, contrary to Golgi's "syncytium" (nerve net) hypothesis.
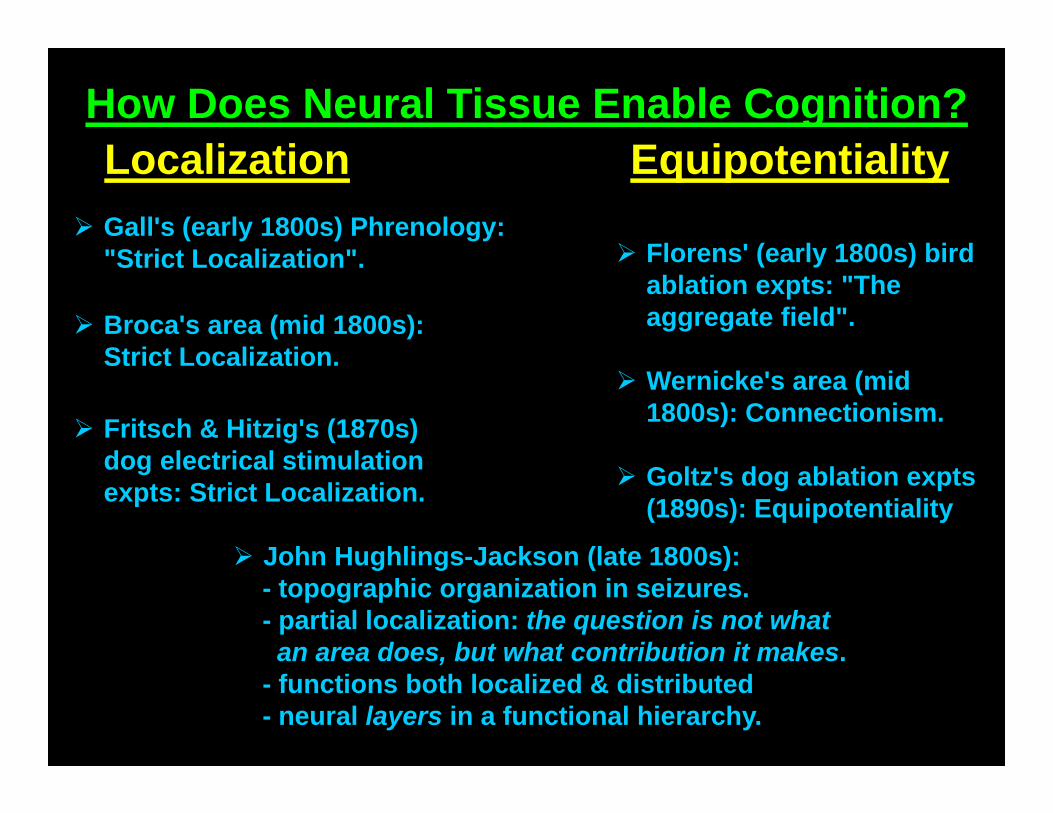
Gall's (early 1800s) Phrenology: "Strict Localization".
How Does Neural Tissue Enable Cognition?
Florens' (early 1800s) bird ablation expts: "The aggregate field". Broca's area (mid 1800s):
Strict Localization. Wernicke's area (mid
1800s): Connectionism. Fritsch & Hitzig's (1870s)
dog electrical stimulation expts: Strict Localization. Goltz's dog ablation expts
(1890s): Equipotentiality
John Hughlings-Jackson (late 1800s):- topographic organization in seizures.- partial localization: the question is not what an area does, but what contribution it makes.
- functions both localized & distributed- neural layers in a functional hierarchy.
Localization Equipotentiality
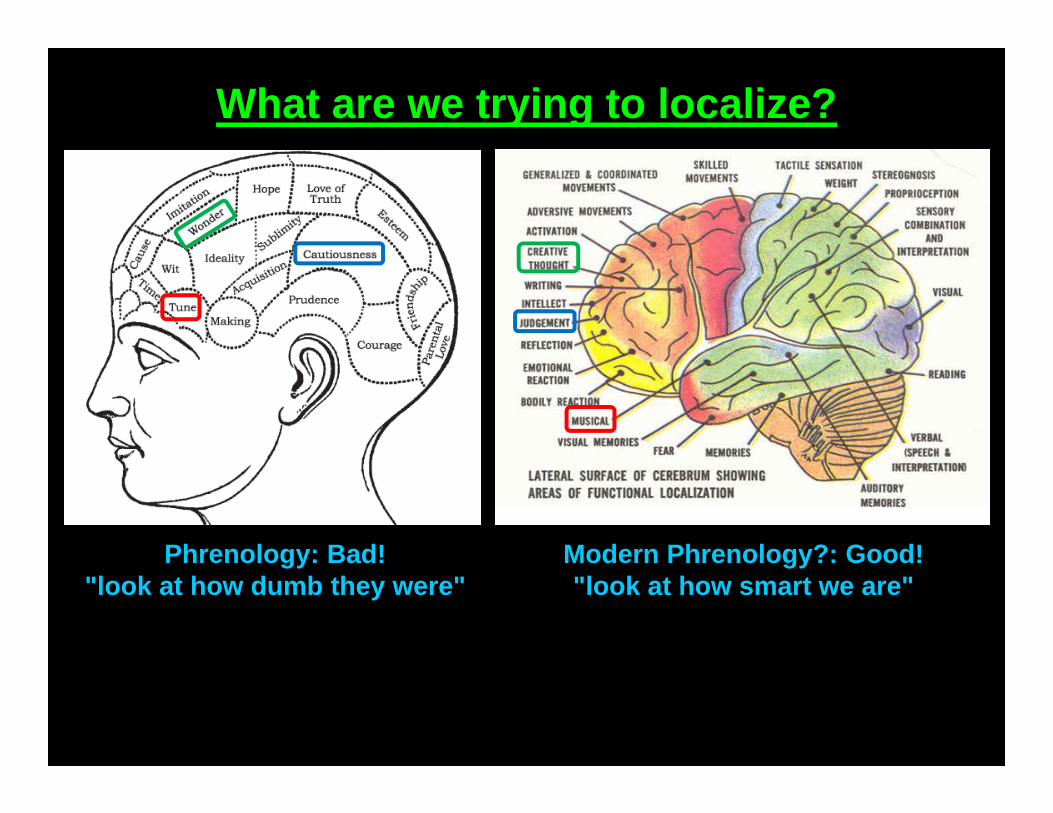
What are we trying to localize?
Phrenology: Bad! "look at how dumb they were"
Modern Phrenology?: Good! "look at how smart we are"
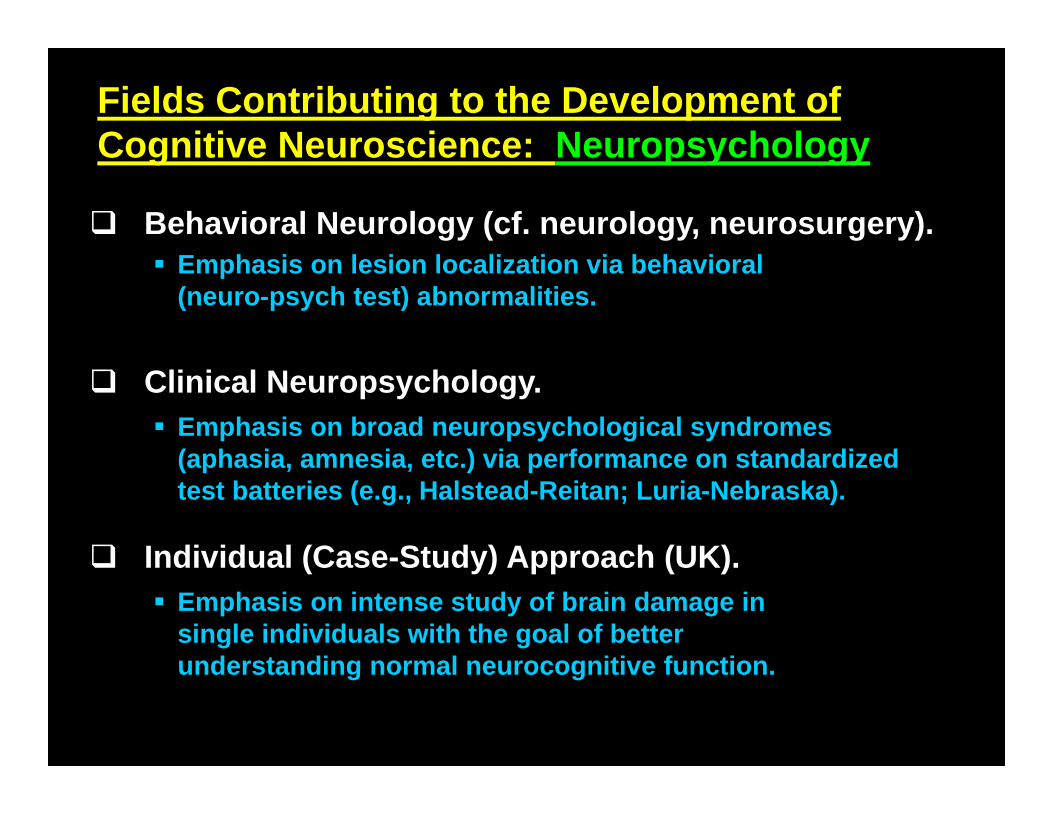
Fields Contributing to the Development of Cognitive Neuroscience: Neuropsychology
Behavioral Neurology (cf. neurology, neurosurgery).
Clinical Neuropsychology.
Individual (Case-Study) Approach (UK).
Emphasis on lesion localization via behavioral (neuro-psych test) abnormalities.
Emphasis on broad neuropsychological syndromes (aphasia, amnesia, etc.) via performance on standardized test batteries (e.g., Halstead-Reitan; Luria-Nebraska).
Emphasis on intense study of brain damage in single individuals with the goal of better understanding normal neurocognitive function.
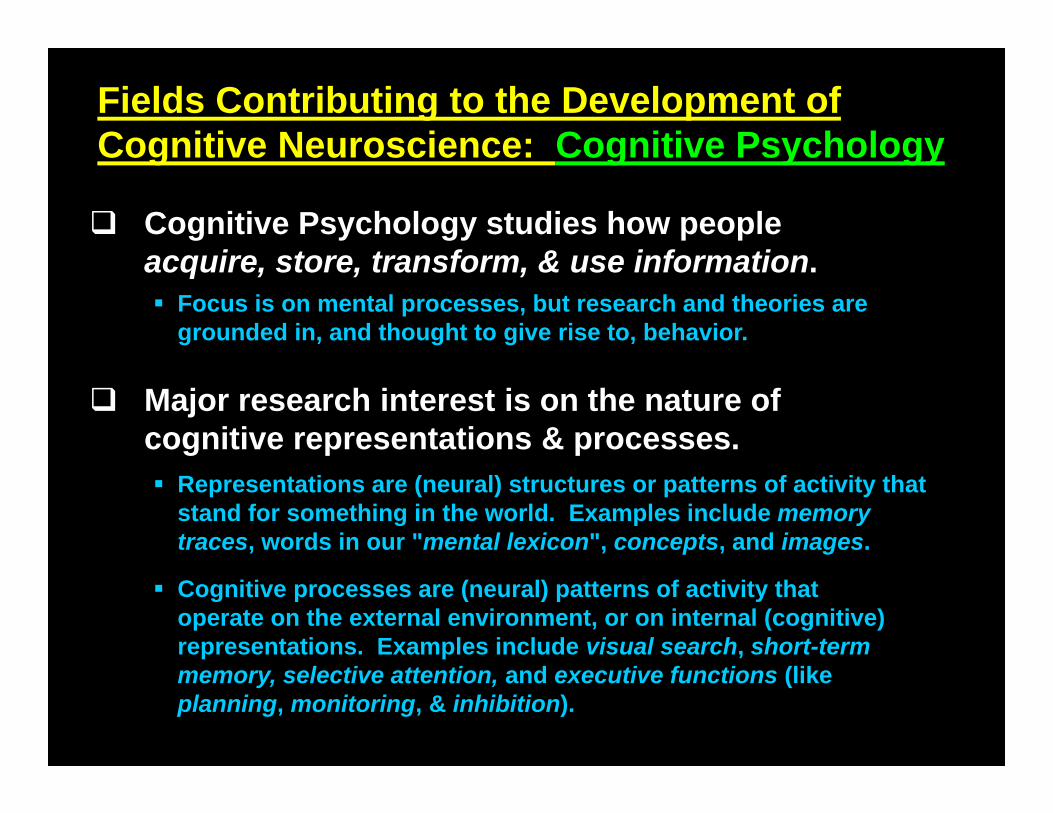
Fields Contributing to the Development of Cognitive Neuroscience: Cognitive Psychology
Cognitive Psychology studies how people acquire, store, transform, & use information.
Major research interest is on the nature of cognitive representations & processes. Representations are (neural) structures or patterns of activity that
stand for something in the world. Examples include memory traces, words in our "mental lexicon", concepts, and images.
Focus is on mental processes, but research and theories are grounded in, and thought to give rise to, behavior.
Cognitive processes are (neural) patterns of activity that operate on the external environment, or on internal (cognitive) representations. Examples include visual search, short-term memory, selective attention, and executive functions (like planning, monitoring, & inhibition).
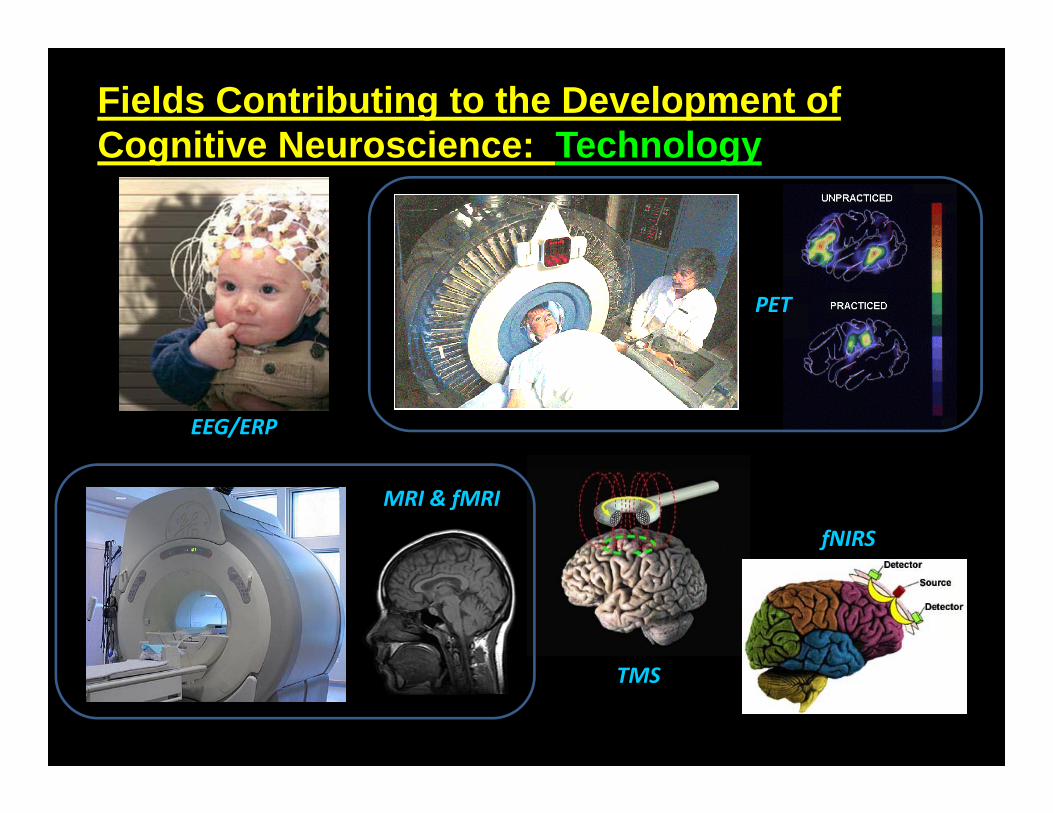
Fields Contributing to the Development of Cognitive Neuroscience: Technology
EEG/ERP
PET
MRI & fMRI
TMS
fNIRS
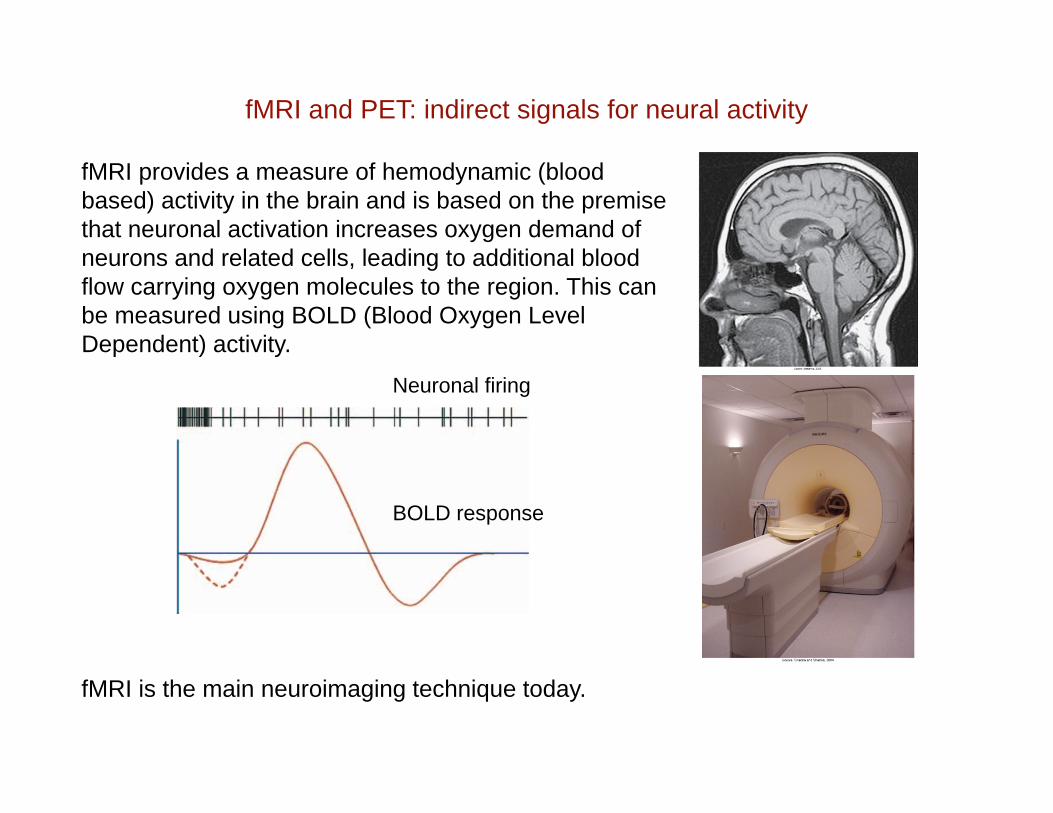
fMRI and PET: indirect signals for neural activity
fMRI provides a measure of hemodynamic (blood based) activity in the brain and is based on the premise that neuronal activation increases oxygen demand of neurons and related cells, leading to additional blood flow carrying oxygen molecules to the region. This can be measured using BOLD (Blood Oxygen Level Dependent) activity.
fMRI is the main neuroimaging technique today.
BOLD response
Neuronal firing
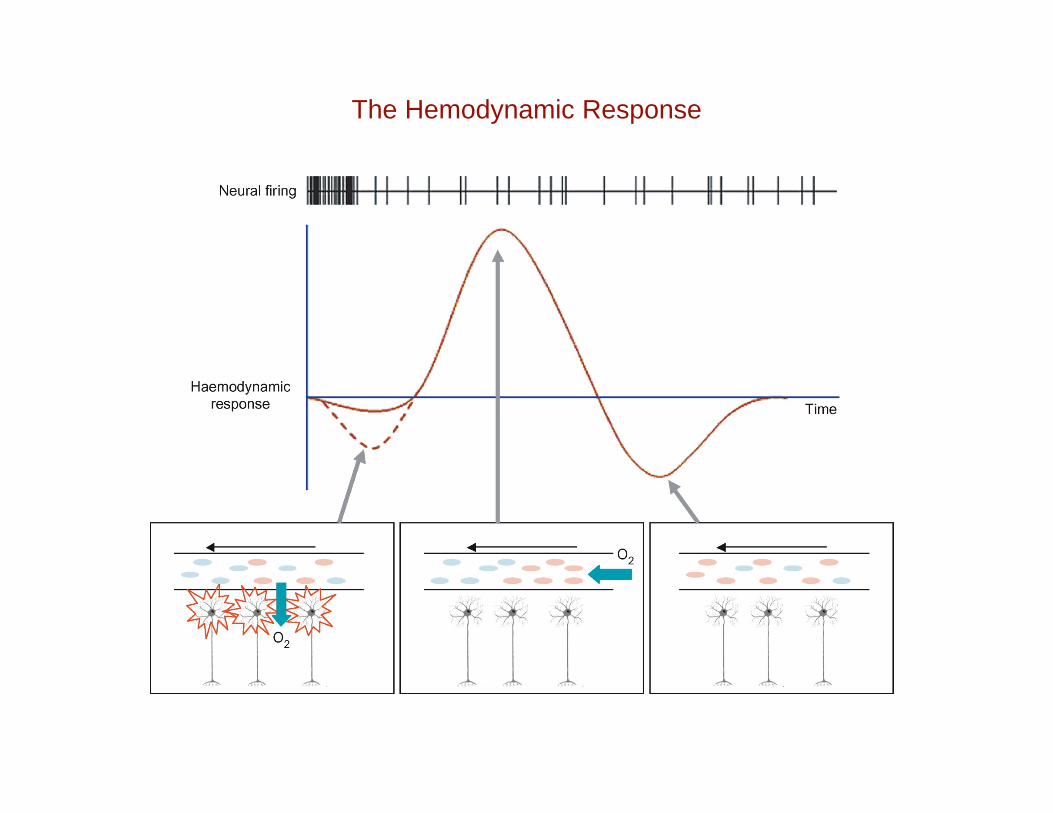
The Hemodynamic Response
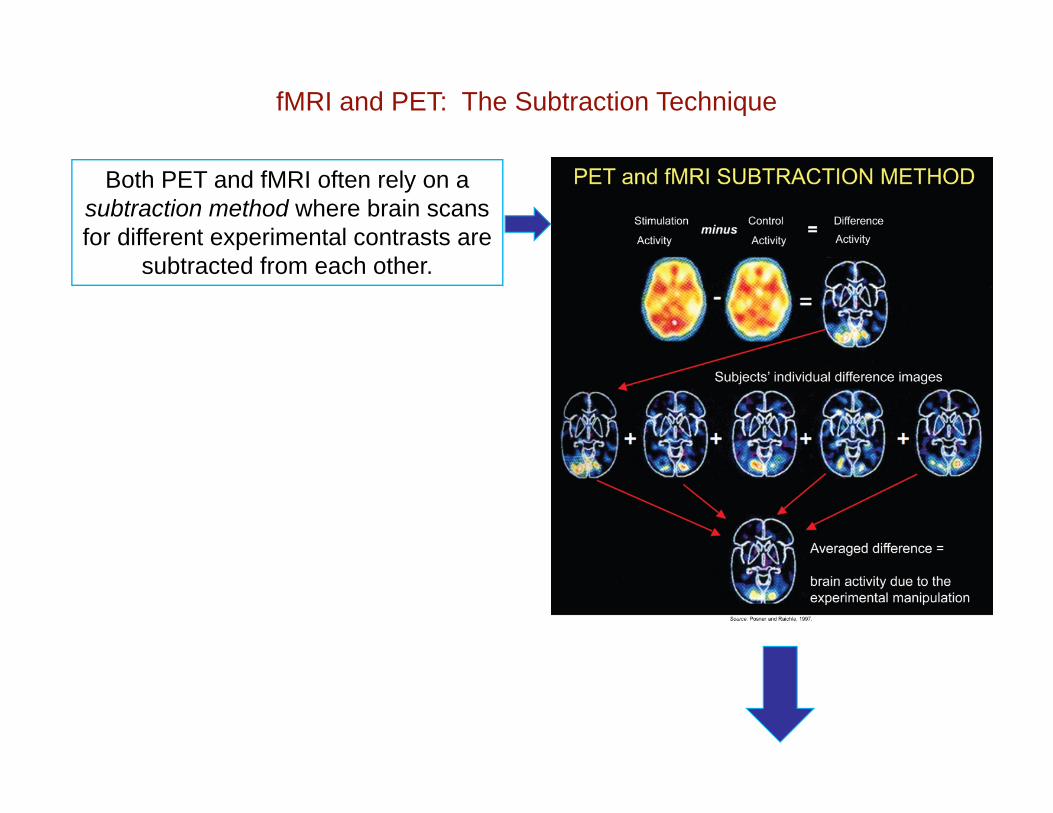
fMRI and PET: The Subtraction Technique
Both PET and fMRI often rely on a subtraction method where brain scans for different experimental contrasts are
subtracted from each other.
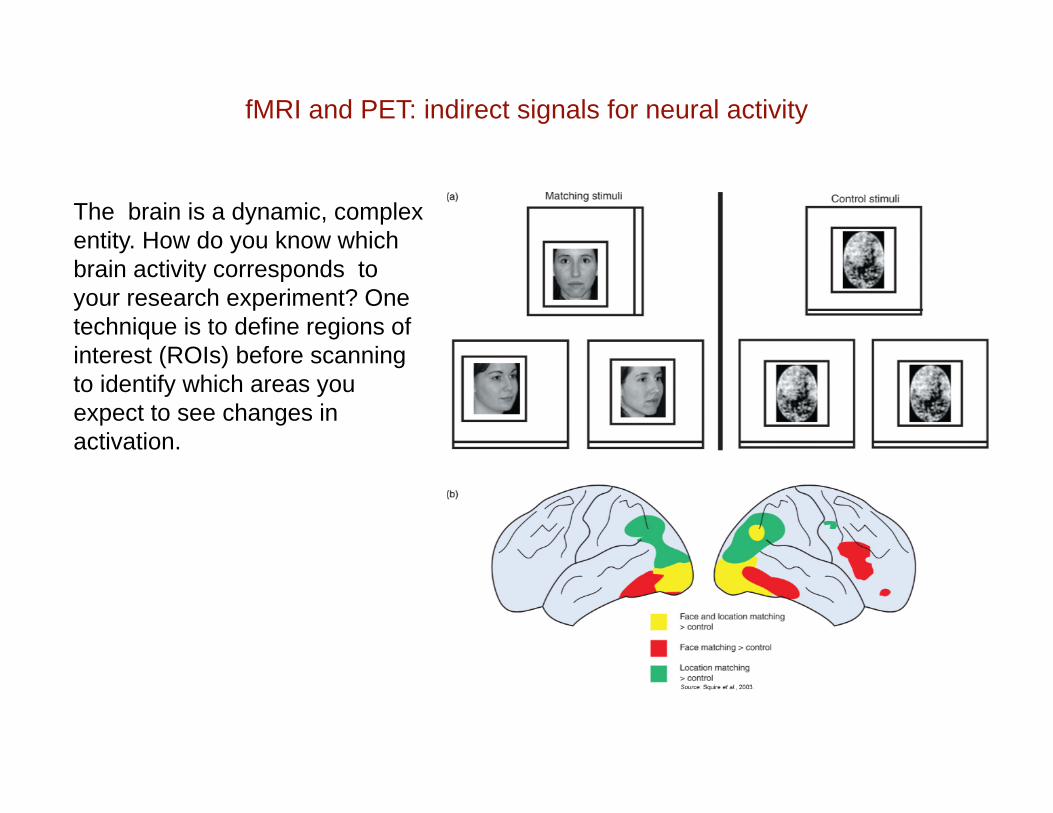
fMRI and PET: indirect signals for neural activity
The brain is a dynamic, complex entity. How do you know which brain activity corresponds to your research experiment? One technique is to define regions of interest (ROIs) before scanning to identify which areas you expect to see changes in activation.
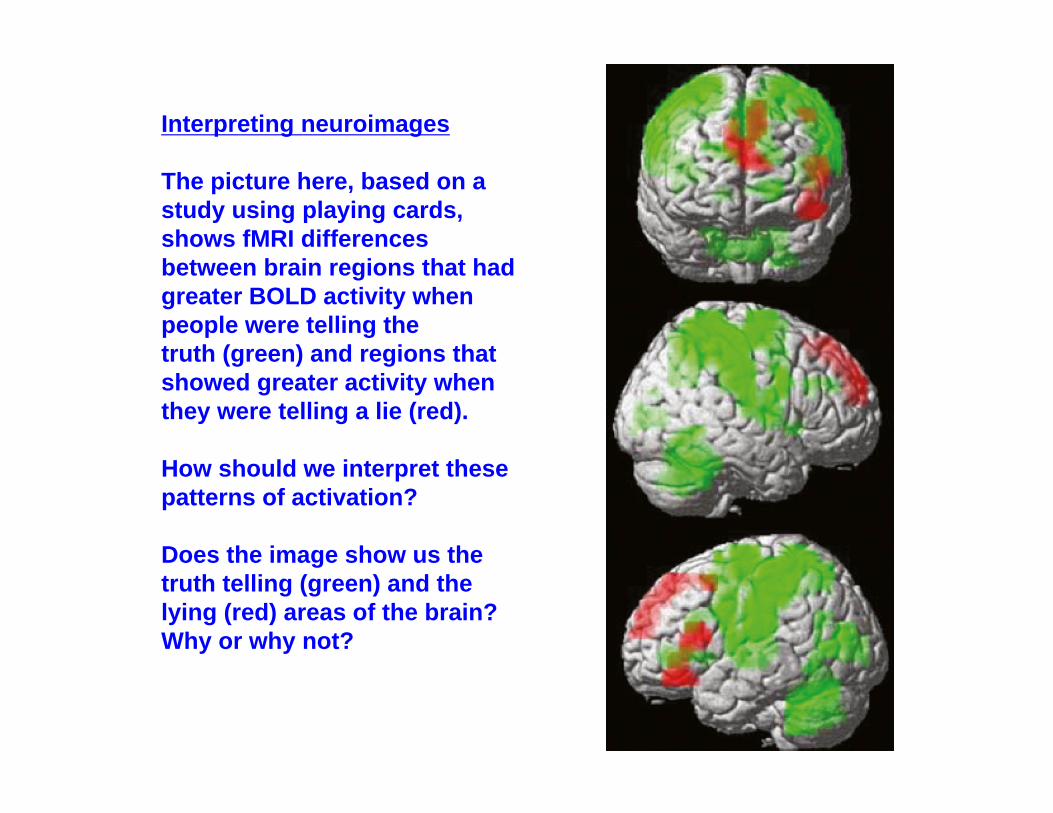
Interpreting neuroimages
The picture here, based on a study using playing cards, shows fMRI differences between brain regions that hadgreater BOLD activity when people were telling thetruth (green) and regions that showed greater activity when they were telling a lie (red).
How should we interpret these patterns of activation?
Does the image show us the truth telling (green) and the lying (red) areas of the brain? Why or why not?
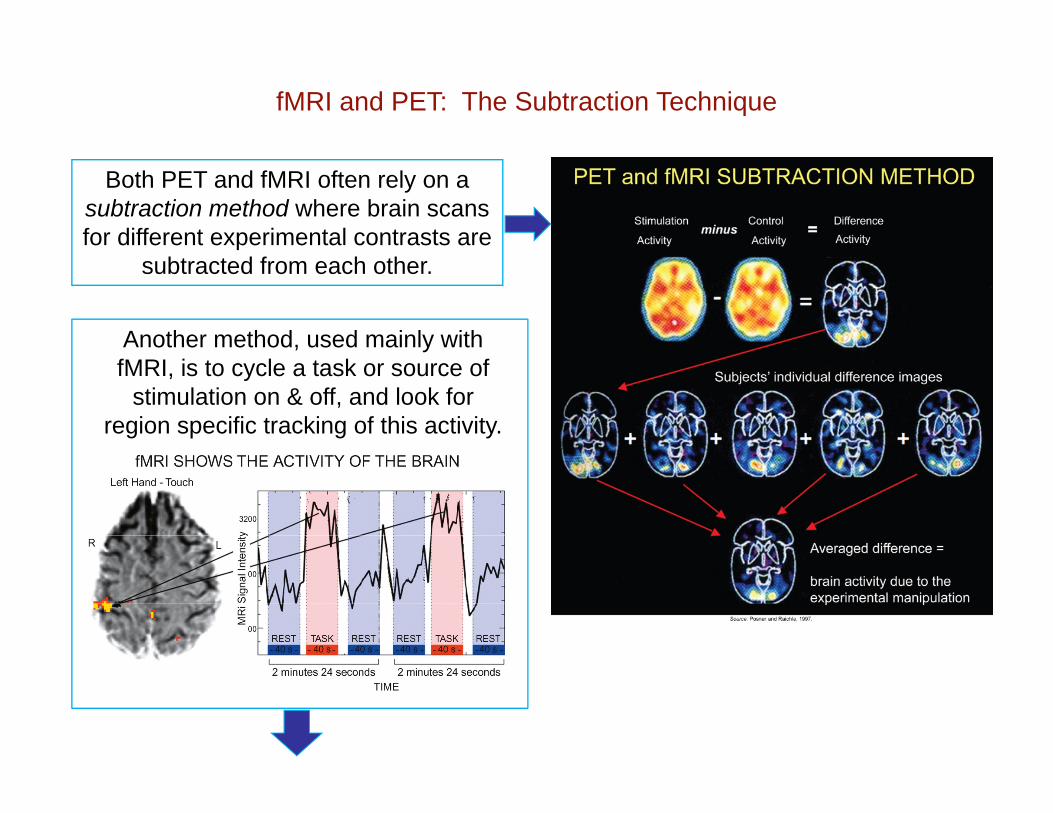
fMRI and PET: The Subtraction Technique
Both PET and fMRI often rely on a subtraction method where brain scans for different experimental contrasts are
subtracted from each other.
Another method, used mainly with fMRI, is to cycle a task or source of
stimulation on & off, and look for region specific tracking of this activity.
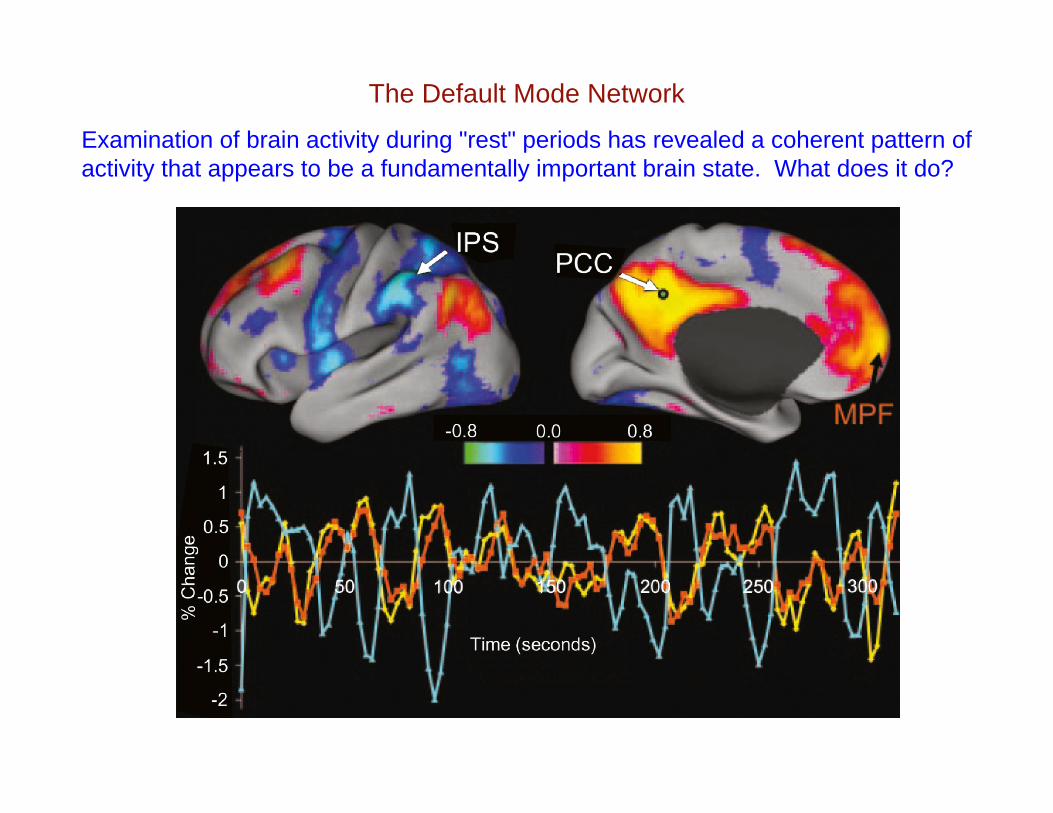
The Default Mode Network
Examination of brain activity during "rest" periods has revealed a coherent pattern of activity that appears to be a fundamentally important brain state. What does it do?
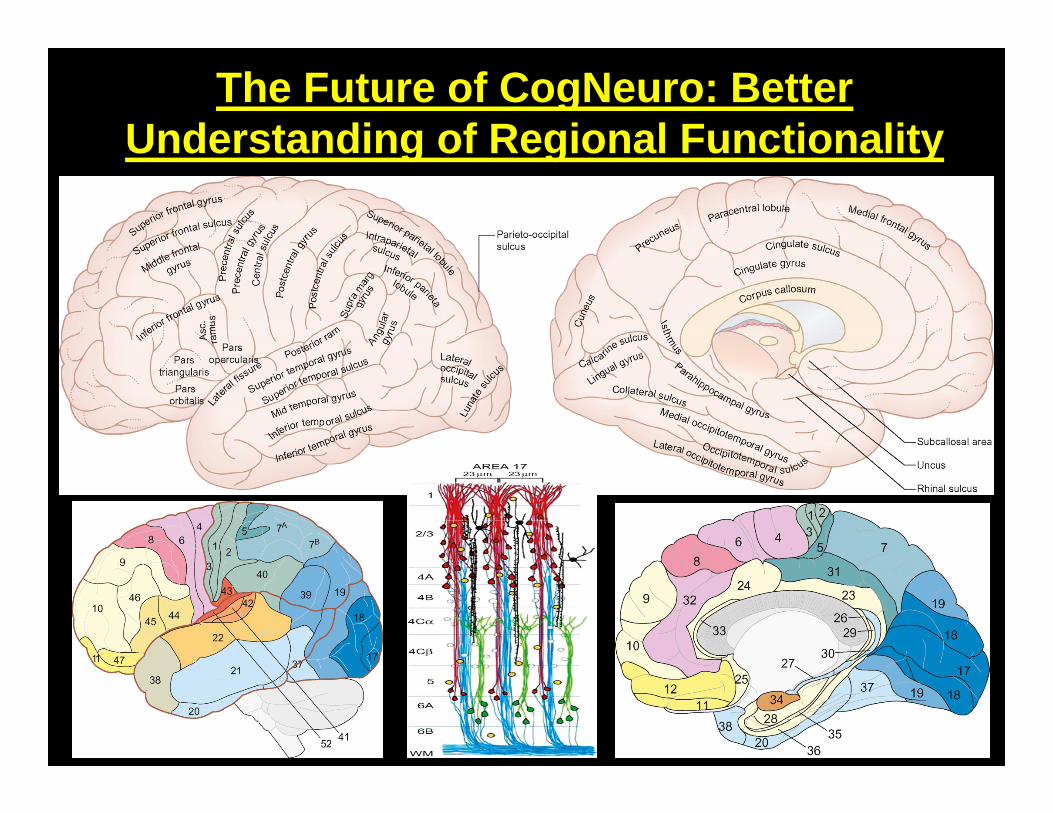
The Future of CogNeuro: Better Understanding of Regional Functionality
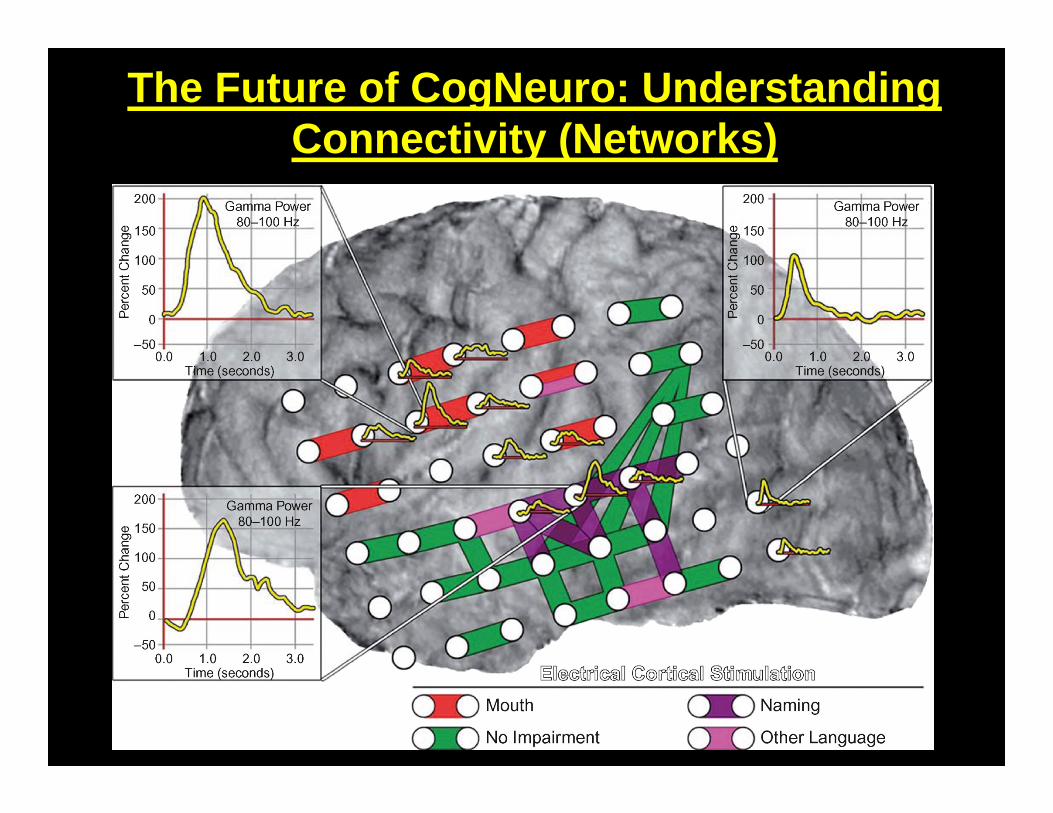
The Future of CogNeuro: Understanding Connectivity (Networks)
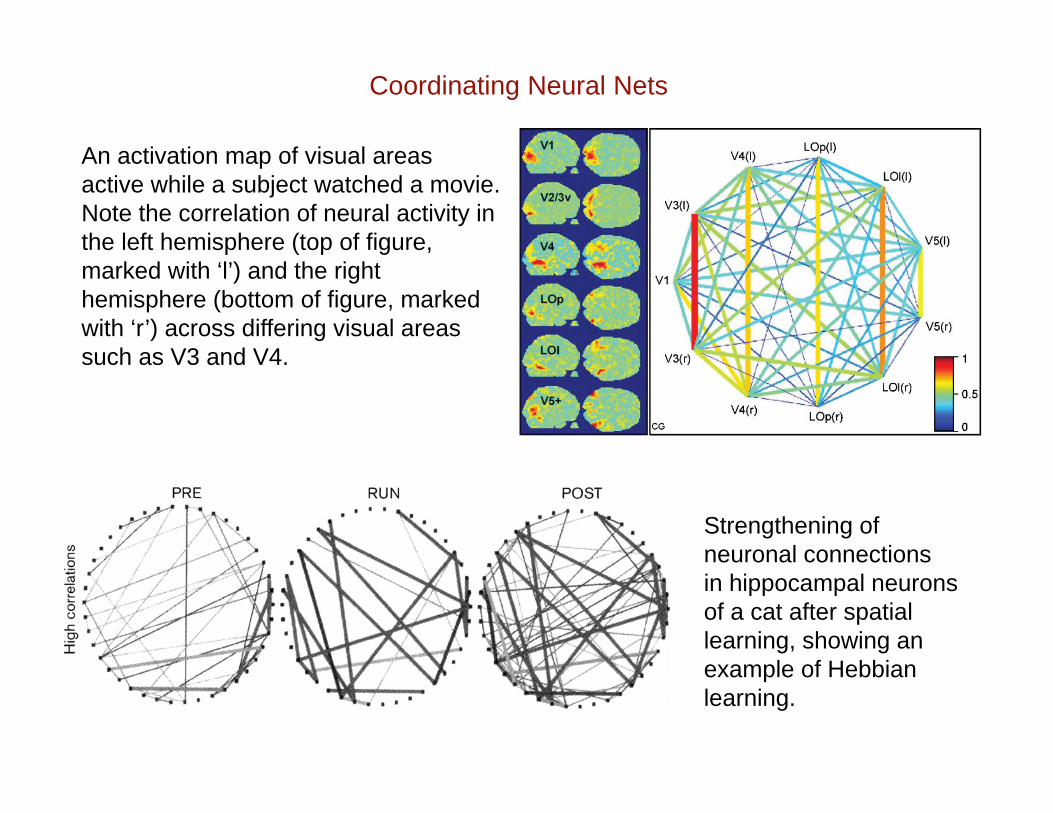
Coordinating Neural Nets
An activation map of visual areas active while a subject watched a movie. Note the correlation of neural activity in the left hemisphere (top of figure, marked with ‘l’) and the right hemisphere (bottom of figure, marked with ‘r’) across differing visual areas such as V3 and V4.
Strengthening of neuronal connectionsin hippocampal neurons of a cat after spatial learning, showing an example of Hebbianlearning.
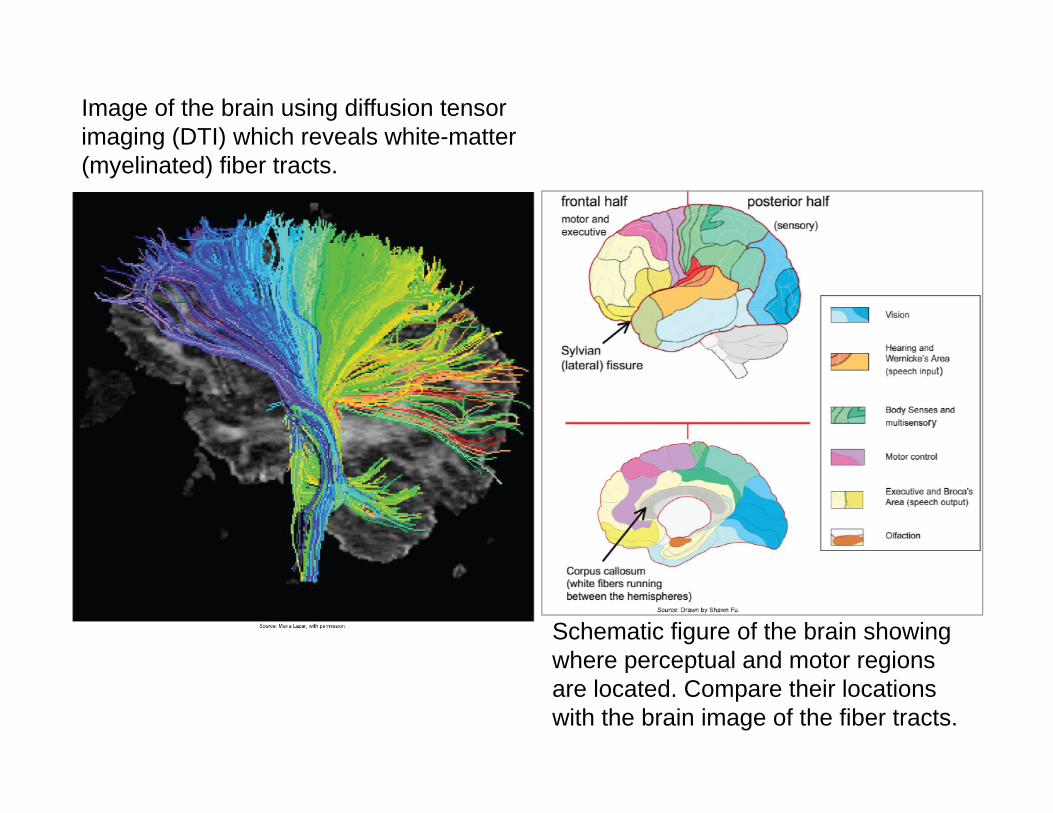
Image of the brain using diffusion tensor imaging (DTI) which reveals white-matter (myelinated) fiber tracts.
Schematic figure of the brain showing where perceptual and motor regions are located. Compare their locations with the brain image of the fiber tracts.
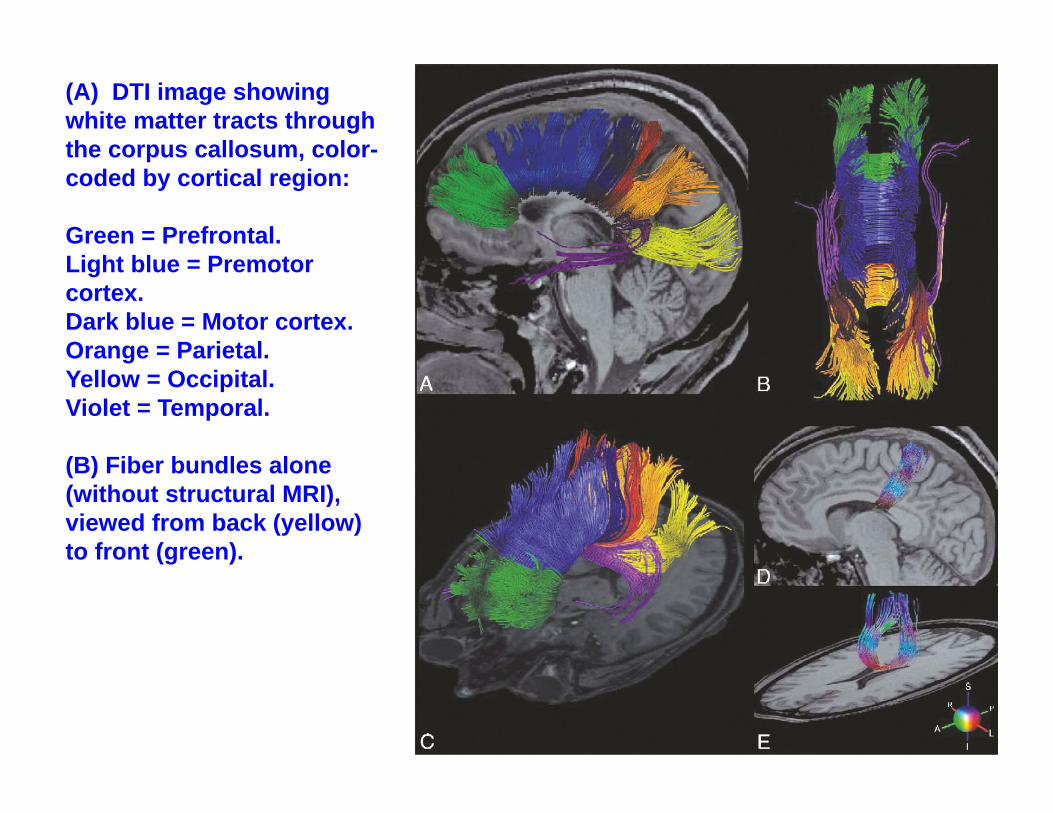
(A) DTI image showing white matter tracts through the corpus callosum, color-coded by cortical region:
Green = Prefrontal.Light blue = Premotor cortex.Dark blue = Motor cortex.Orange = Parietal.Yellow = Occipital.Violet = Temporal.
(B) Fiber bundles alone (without structural MRI), viewed from back (yellow) to front (green).
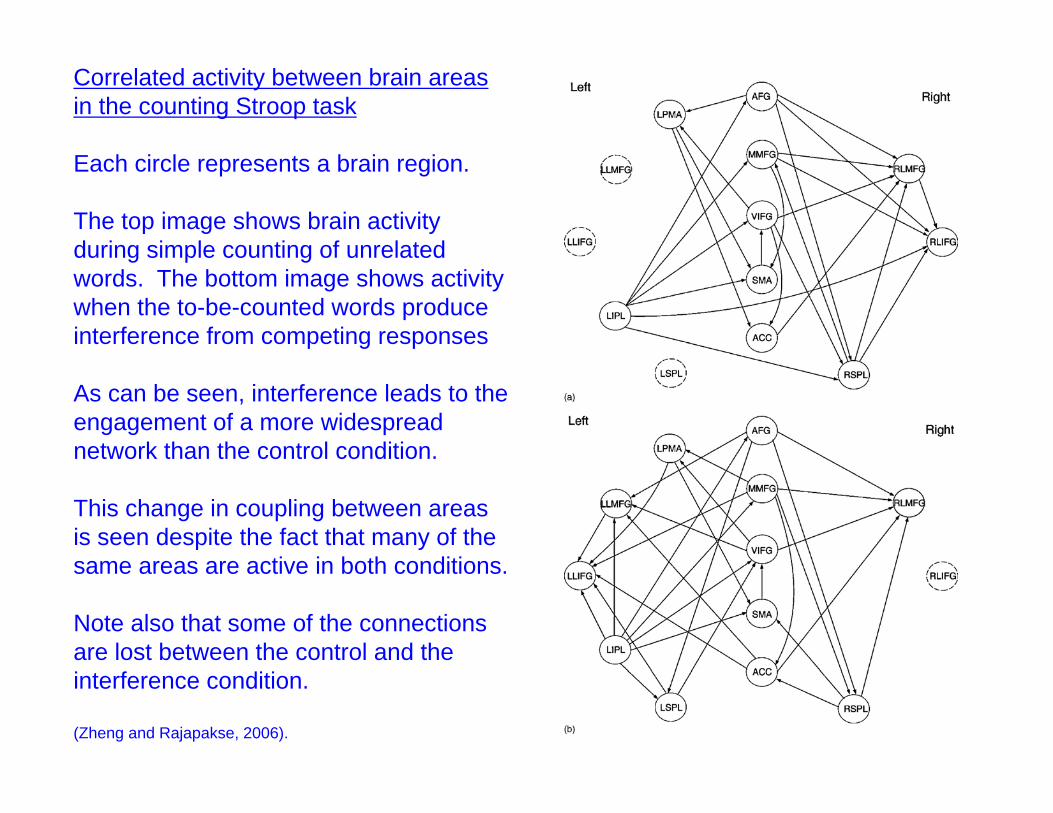
Correlated activity between brain areas in the counting Stroop task
Each circle represents a brain region.
The top image shows brain activity during simple counting of unrelated words. The bottom image shows activity when the to-be-counted words produce interference from competing responses
As can be seen, interference leads to the engagement of a more widespread network than the control condition.
This change in coupling between areas is seen despite the fact that many of the same areas are active in both conditions.
Note also that some of the connections are lost between the control and theinterference condition.
(Zheng and Rajapakse, 2006).
The Future of CogNeuro: Understanding Temporal Relations (Synchrony)
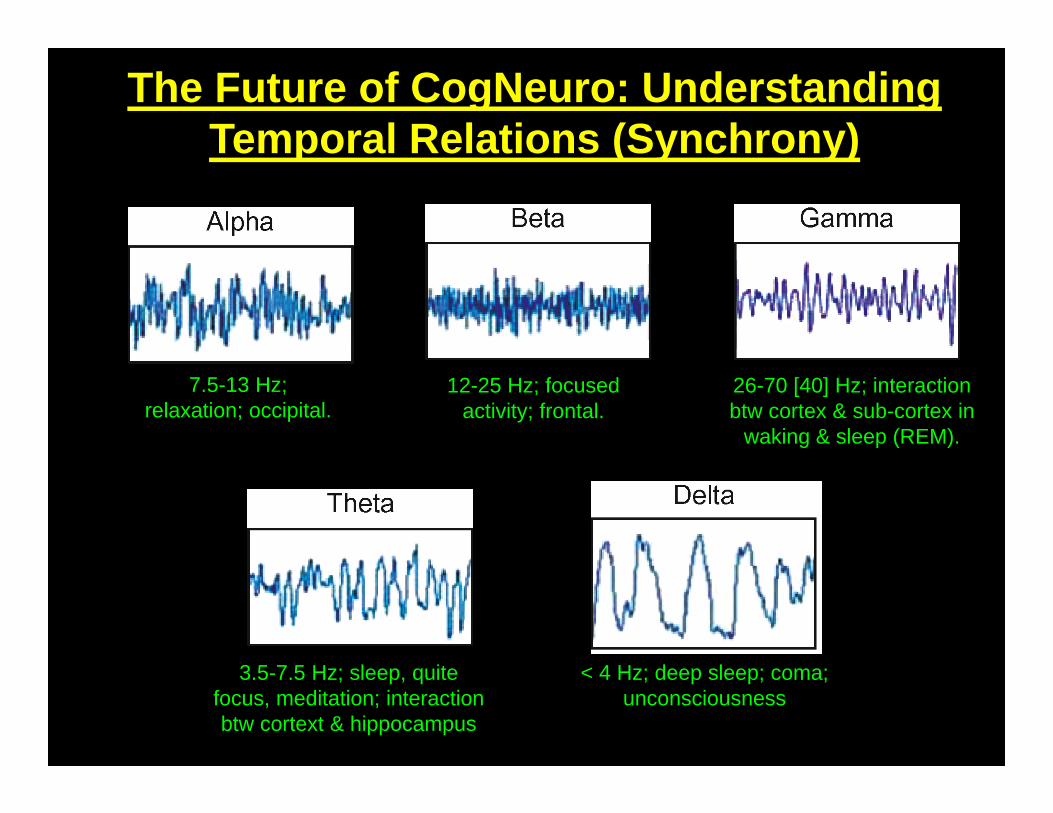
7.5-13 Hz; relaxation; occipital.
12-25 Hz; focused activity; frontal.
26-70 [40] Hz; interaction btw cortex & sub-cortex in
waking & sleep (REM).
3.5-7.5 Hz; sleep, quite focus, meditation; interaction btw cortext & hippocampus
< 4 Hz; deep sleep; coma; unconsciousness
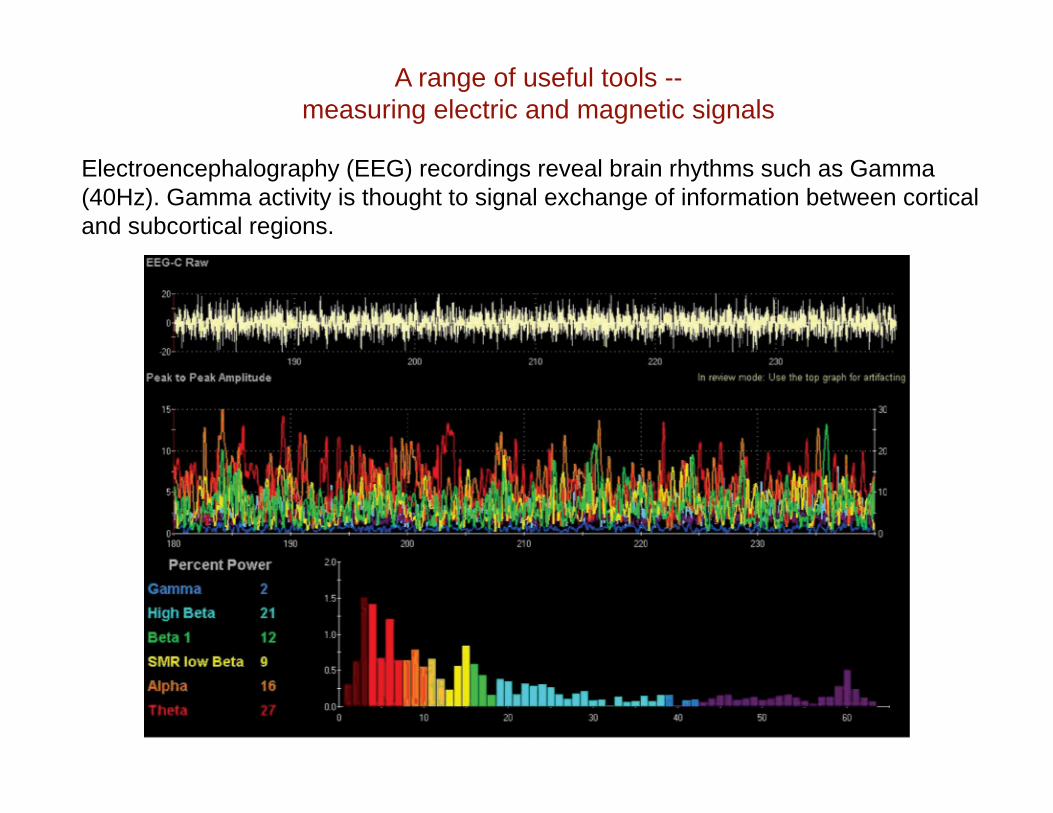
A range of useful tools --measuring electric and magnetic signals
Electroencephalography (EEG) recordings reveal brain rhythms such as Gamma (40Hz). Gamma activity is thought to signal exchange of information between cortical and subcortical regions.
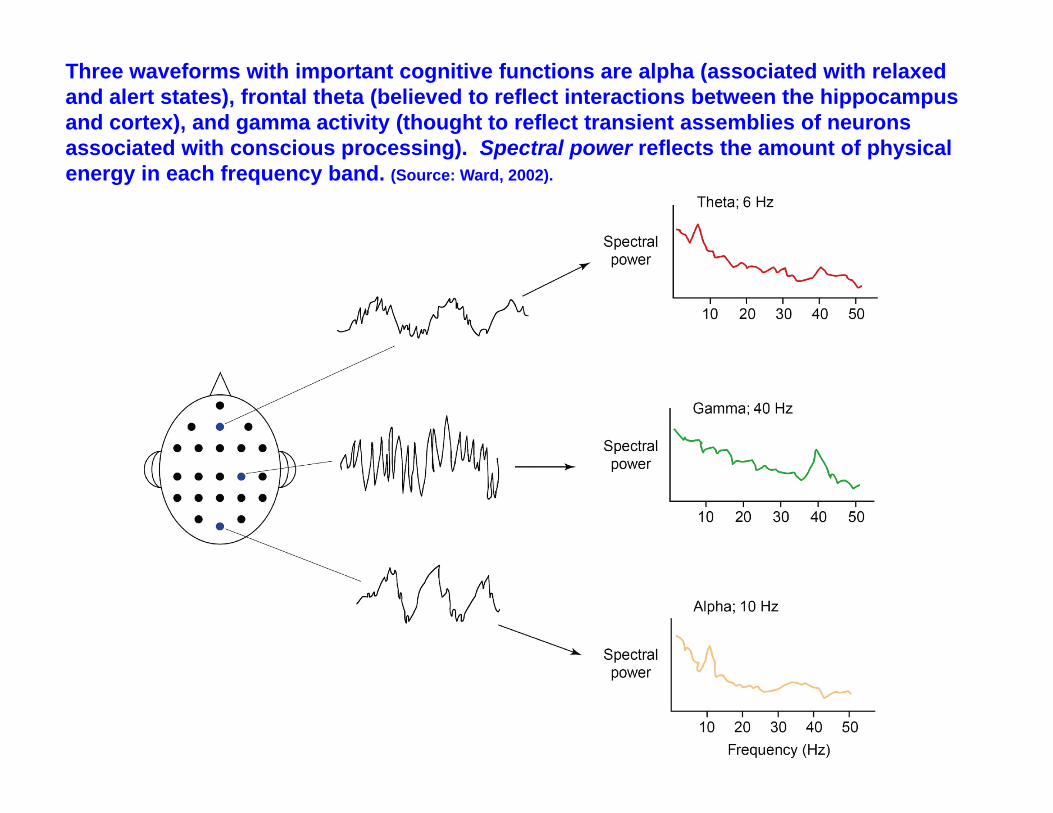
Three waveforms with important cognitive functions are alpha (associated with relaxed and alert states), frontal theta (believed to reflect interactions between the hippocampus and cortex), and gamma activity (thought to reflect transient assemblies of neurons associated with conscious processing). Spectral power reflects the amount of physical energy in each frequency band. (Source: Ward, 2002).