Embed Size (px)
Citation preview
The History of Sinks –An Analysis of NegotiatingPositions in the ClimateRegime
Martina Jung
HWWA DISCUSSION PAPER
293Hamburgisches Welt-Wirtschafts-Archiv (HWWA)
Hamburg Institute of International Economics2004
ISSN 1616-4814
Hamburgisches Welt-Wirtschafts-Archiv (HWWA)Hamburg Institute of International EconomicsNeuer Jungfernstieg 21 – 20347 Hamburg, GermanyTelefon: 040/428 34 355Telefax: 040/428 34 451e-mail: [email protected]: http://www.hwwa.de
The HWWA is a member of:
• Wissenschaftsgemeinschaft Gottfried Wilhelm Leibniz (WGL)• Arbeitsgemeinschaft deutscher wirtschaftswissenschaftlicher Forschungsinstitute
(ARGE)• Association d’Instituts Européens de Conjoncture Economique (AIECE)
HWWA Discussion Paper
The History of Sinks – An Analysisof Negotiating Positions in the
Climate Regime
Martina Jung
HWWA Discussion Paper 293http://www.hwwa.de
Hamburg Institute of International Economics (HWWA)Neuer Jungfernstieg 21 – 20347 Hamburg, Germany
e-mail: [email protected]
This paper was prepared within the HWWA Research Programme „InternationalClimate Policy“.
I gratefully acknowledge the support of Heikki Granholm, Claudio Forner and JennyWong in providing information on the negotiation process.
Edited by the Department World EconomyHead: PD Dr. Carsten Hefeker
HWWA DISCUSSION PAPER 293August 2004
The History of Sinks – An Analysis ofNegotiating Positions in the Climate
RegimeABSTRACT
The issue of terrestrial carbon sinks, officially labelled as Land use, Land-use changeand Forestry (LULUCF) has been one of the most contentious and difficult issues in theinternational climate change negotiations. This study analyses the negotiation processon sinks from the third Conference of the Parties (COP 3) to COP 7 by using amultinomial logit model to identify factors influencing the negotiating positions onLULUCF of 166 Parties to the United Nations Framework Convention on ClimateChange (UNFCCC). The results show that the importance of the forestry sector of acountry does not seem to have affected the negotiation positions on LULUCF.However, the results suggest that the LULUCF issue was used by those Parties with arather negative attitude towards international climate policy to reduce their Kyotocommitments. Pro-sinks Annex I Parties seem to have been motivated by the amountthey were able to reduce their reduction target due to sinks, but not necessarily by thestringency of their target.By applying a zero-inflated count model, the study examines which factors influencedthe participation in the submission process on LULUCF. Those Parties having taken apro-sink position on Article 3.4 have been participating most in the submission process.The exact opposite is the case for the CDM, where the opponents of forestry projectshave been the most active Parties in providing submissions. Delegation size has some,but rather modest influence on the participation in the submission process.
Keywords:Kyoto Protocol, sinks, LULUCF, negotiating positions, multinomial logit model, zero-inflated count model
Martina JungPhone: 040-42834-434E-mail: [email protected]
1
1. Introduction
The United Nations Framework Convention on Climate Change (UNFCCC), a legalframework under which Parties to the Convention commit themselves to stabilizing thegreenhouse gas (GHG) concentration of the atmosphere, entered into force in 1994. Parties tothe UNFCCC have been meeting every year since to develop and further define thisframework. At the third conference of the Parties, COP 3, the Kyoto Protocol was adopted. Itsets legally binding emission reduction targets for the so called Annex I1 countries(industrialized countries and a number of countries with economies in transition) which haveto reduce their overall greenhouse gas emissions by at least 5% below 1990 levels in the firstcommitment period (2008-2012). Thus, in Kyoto, the basic structure of the climate regimewas decided. However, international regimes are under constant development. Many timescertain aspects which are left open to be resolved at later stages of negotiations, and which areconsidered to be of rather technical nature, later turn out to be major issues with great impacton the overall effectiveness of the regime (Depledge 2001). The introduction of sinks in theclimate change regime – officially labeled as Land use, Land-use change and Forestry(LULUCF) – is such an issue.2 In using the example of the negotiations on LULUCF in theKyoto Protocol, I combine qualitative background information with a quantitative approach ofto explain negotiating positions and behavior of Parties to the UNFCCC. As most of thestudies on negotiating positions in international climate policy are of rather qualitative nature,the use of statistical analysis is rather new and can provide additional insights into thenegotiation process. The results obtained from this study can contribute to a betterunderstanding of the negotiation process in general, as well as the role of sequestration in thenegotiation of emission reduction targets. The latter might be especially relevant becausenegotiations on emission reduction targets for a second commitment period are envisaged tostart in 2005.The first part of the paper sketches the negotiation process related to the introduction ofLULUCF in the climate regime. In the second part, I examine possible factors influencingnegotiating positions and the participation of Parties in the negotiation process by usingregression analysis.
2. The history of sinks in the climate negotiations
2.1. LULUCF rules for Annex I PartiesFor analyzing the negotiation process, it is necessary to look at the roots of the sinksdiscussion in the climate regime. The first call for a global effort on sinks creation byafforestation took place at the 1989 Nordwijk conference, one of the first global policymeetings on climate change (Nordwijk Conference 1989). At the United Nations Conferenceon Environment and Development in 1992, the goal to negotiate a forest convention failed.Although, terrestrial carbon sinks play a considerable role as an obligatory element of nationalemission inventories, the (non-binding) targets of the UN Framework Convention on Climate
1 The Parties with their respective reduction commitment are listed in Annex B of the Kyoto Protocol includesalmost the same Parties as the Annex I of the UNFCCC. Both terms are often used interchangeably. In thefollowing, I refer to Annex I Parties as those with reduction commitments.2 The term `sink´ is defined by the UNFCCC as „any process, activity or mechanism which removes agreenhouse gas, an aerosol or a precursor of a greenhouse gas from the atmosphere“ (Article 1.8). In thefollowing, sinks and LULUCF are used interchangeably, although in the strict sense LULUCF activities canencompass sinks as well as sources of emissions from the land use sector.
2
Change (UNFCCC) only refer to emissions. The Convention defines the term sink, but doesnot give any details on how sinks should be accounted for.The Berlin Mandate which was adopted in 1995 in order to strengthen the commitments ofAnnex I Parties under the Convention by the adoption of another protocol or legal instrument,explicitly refers to “emissions by sources and removals by sinks”, thus taking on the languageused in the UNFCCC.3 The Ad Hoc Group (AGBM) installed under the Berlin Mandate meteight times before the third Conference of the Parties (COP 3) to work towards thedevelopment of targets and rules for what then was going to turn into the Kyoto Protocol.Many of the country proposals on quantitative reduction targets – by then labeled QUELROs4
- brought up in the AGBM process included sources as well as removals by sinks. Referringto the submissions by Parties on reduction commitments, the report of the AGBM at its sixthmeeting states that “the alternatives also reflect a range of views on the inclusion of removalsby sinks. Some Parties prefer that sinks and sources be treated equally, while other Partieshave proposed alternative approaches for taking sinks into account.”5 Since most submissionsof countries on QUELROs included sinks, the need for clarification on how to account forthese lead to the establishment of an informal sinks consultation group. A questionnaire wasintroduced to clarify the main issues relating to sinks in establishing reduction commitments.6It was only few months before COP 3 (December 1997) that negotiators became aware ofhow important the sinks issue was for the negotiation of the quantitative reduction targets. Acompilation of the country submissions on the questionnaire was available at the second partof ABGM 8 held in Kyoto days prior to COP 3. Most of the Parties of the Umbrella Group7
were the most active supporters of an introduction of sinks in the calculation of targets, whilethe EU and the Alliance of Small Island States (AOSIS) belonged to the most prominentopponents since Kyoto. 8The chairman of the informal sinks consultation group reported to AGBM 8 a few day beforethe start of the negotiations of COP 3 that all Parties present had agreed that sinks were“important and should be included in commitments, subject to concerns about definitions,timing and scope.”9 However, the informal consultations did not lead to an agreement on thesink categories to be included. Since at COP 3, the numbers on QUELROs could not be fixeduntil this decision was taken, time pressured to finalize the negotiations as soon as possible. Inthe round-the-clock sinks consultations in Kyoto, Parties could agree to include afforestation,reforestation and deforestation (ARD), leading to the wording in Article 3.3.10 But due to the
3 See decision 1/CP.1 FCCC/CP/1995/7/Add.1, I. (f) Coverage of all greenhouse gases, their emissions bysources and removals by sinks and all relevant sectors”, II. 2. The process will, inter alia: (a) Aim, as the priorityin the process of strengthening the commitments in Article 4.2(a) and (b) of the Convention, for developedcountry/other Parties included in Annex I, both - to elaborate policies and measures, as well as - to set quantifiedlimitation and reduction objectives within specified time-frames, such as 2005, 2010 and 2020, for theiranthropogenic emissions by sources and removals by sinks of greenhouse gases not controlled by the MontrealProtocol.4 Abbreviation for quantified emission limitation and reduction obligations5 FCCC/AGBM/1997/3/Add.16 See FCCC/AGBM/1997/87 This group consists of the US, Canada, Japan, New Zealand and Australia, Iceland, Russia, Ukraine andNorway.8 For the submitted proposals of the pre-Kyoto process, see FCCC/AGBM/1997/MISC.4 and Add.1-2, as wellas the compilation FCCC/AGBM/1997/INF.2. Submissions in favour of sinks included those of Australia,Canada, Denmark, Iceland, New Zealand and the European Union, while Japan, Kenya, Marshall Islands andNauru wanted to see sinks to be excluded in the first commitment period. Interestingly, the position in favour ofsinks expressed by the European Union and the rather sceptical position of Japan were the exact opposite of whatboth are pushing for since Kyoto.9 See FCCC/AGBM/1997/8/Add.1, see also tape of report of La Vina to the CoW of COP 3 on 6 December1997.10 Article 3.3: “The net changes in greenhouse gas emissions by sources and removals by sinks resulting fromdirect human-induced land-use change and forestry activities, limited to afforestation, reforestation and
3
lack of scientific knowledge and data on further activities, it was laid down in Article 3.4 thatthese should be decided by COP/MOP 1 and apply only in the second and subsequentcommitment periods. During the final negotiations taking place in the night session of 11December 1997, Japan managed to add to Article 3.4 a sentence allowing additional human-induced activities already in the first commitment period if a Party decided so (Fry, 2002).This sentence should have significant consequences for the further negotiation process byleaving great uncertainties on the magnitude of the already fixed targets and opening aloophole which could be used by Parties in the following to renegotiate their targets. SinceArticle 3.7 stipulates that sinks will not be included in the base year emissions (gross-netapproach), every ton of CO2 accounted for by additional sinks activities under Article 3.4would be a factual decrease of the reduction target for those countries having a net sink in thecommitment period.11 Australia, however, managed to insert an exception into Article 3.7which allows Annex I Parties with net emissions in 1990 from land-use change and forestry touse a net-net approach, by adding land use emissions to their base year emissions. The latter isa special gift to Australia which had considerable net emissions in the LULUCF sector in1990. The EU which came to Kyoto to avoid the inclusion of LULUCF, slowly movedtowards accepting certain sinks activities, partly for tactical reasons and partly due to internalopposition from France, Finland, Sweden and Italy (Oberthür and Ott 1999; Fry 2002).Therefore, the text on sinks (Article 3) coming out of Kyoto, taken under the severe timepressure and lack of data, left many issues unclear and open to different interpretations. Thefollowing negotiations – especially the ones on Article 3.4 - were then used by some countriesto reopen the negotiation on the targets decided at COP 3 by reinterpreting the LULUCFdecision. Recognizing the lack of scientific knowledge, the session of the Subsidiary Bodiesin June 1998 asked the Intergovernmental Panel on Climate Change (IPCC) to produce aSpecial Report on LULUCF. The negotiation on LULUCF came to a hold until the report waspublished in May 2000 (IPCC 2000) because it was expected to deliver the scientificbackground on LULUCF carbon sequestration relevant for the further decision-making underthe Kyoto Protocol. The report was perceived as quite supportive of sinks. Seeminglytechnical issues, as for example how to define a forest, and how to differentiate betweendeforestation and harvest, were as much a source of disagreement as the decisions on whichadditional LULUCF activities to include under Article 3.4. At the SBSTA meeting in Lyon, inSeptember 2000, it became clear that uncertainties regarding Article 3.4 were still significant.Australia and Japan pushed for narrow definitions of additional activities (e.g. fire control,pest control) fearing that broad definitions (forest management, cropland management etc.) asfavored by the US and Canada would lead to a disproportionately large flow of sinks creditsinto the two latter countries. The EU which had initially opposed any inclusion of additionalactivities was a weak opponent due to internal differences. Finally, broad definitions wereadopted (Fry 2002). The developing countries had hardly been heard regarding this issue.However, at SBSTA 13, Brazil, speaking on behalf of G77 and China introduced a set ofprinciples addressing developing country concerns regarding LULUCF in the Kyotoframework. The additional activities under Article 3.4 became the crunch issues, leading tothe collapse of the negotiations in November 2000 in The Hague. A compromise paperelaborated by the President of COP 6, Jan Pronk, could not break the deadlock in thenegotiations. (Ott 2001; Grubb and Yamin 2001) The resumed session in July 2001, tookplace under politically different circumstances since President Bush had announced thewithdrawal of the US from the Kyoto Protocol, thus giving further power to the rest of theUmbrella group whose ratification was now needed to let the Kyoto Protocol enter into force.
deforestation since 1990, measured as verifiable changes in carbon stocks in each commitment period, shall beused to meet the commitments under this Article of each Party included in Annex I….”11 However, as described below, not all of the additional activities under Article 3.4 have been included based ona gross-net approach.
4
At the resumed COP 6bis (July 2001) in Bonn, countries tried to find a rule for how toaccount for additional activities. Parties were allowed to propose their own forestmanagement cap which then entered into what became known as ‘Appendix Z’. The latterincludes the maximum allowable amount of forest management that can be accounted for byeach Party. As these caps represent a proportion of the forest management activitiesundertaken anyway, and are accounted for on a gross-net basis, they lower the factualreduction targets of Parties. Russia, not being able to propose a figure, introduced a paragraphallowing to revise the figure on the forest management cap at a later stage. The finaldecisions on the negotiating text was therefore postponed until COP 7 where Russia managedto double the provisional figure given at COP 6bis.12 The LULUCF text was finally adoptedat COP 7 in Marrakech. Eligible activities as stipulated by the Marrakech Accords areafforestation, reforestation and deforestation (Article 3.3), as well as forest management,revegetation, cropland management and grazing land management (Article 3.4). While allforest activities are accounted for on a gross-net basis and are limited by a country specificcap, cropland and grazing land management as well as revegetation are included without anylimits, but are based on a net-net approach. Parallel to the discussion on additional activitiesunder Article 3.4, it was decided at COP 7 to include LULUCF into the CDM. The followingparagraph will shortly summarize the process leading to this decision.
2.2. LULUCF in the Clean Development MechanismThe draft text on Clean Development Mechanism (CDM, Article 12) contained a note thatsinks might be included in the CDM depending on the resolution of the issue under Article 3(Fry 2002; Depledge 2001). However, in the final version coming out of Kyoto, this footnotehad been erased. Thus, the text on Article 12 only refers to emission reductions. It remainedunclear if this wording meant that sinks were to be excluded from the CDM or not. (Depledge2001).A number of countries have kept this debate alive since Kyoto and have demanded that sinksshould be eligible.13 The main supporters of LULUCF in the CDM were the US, Canada,Japan, and the coalition of Latin-American countries GRILA.14 The European Union, Brazil,China and India, AOSIS and Russia belong to the countries having opposed the inclusion ofLULUCF in the CDM. The decision on the issue was passed between the CDM and theLULUCF contact group until COP 6bis, with no group wanting to take the responsibility forthe subject.It was not only contentious whether to include LULUCF at all, but also which activitieswould be eligible in the case of such an inclusion. Some countries were aiming at an evenwider inclusion of LULUCF than stipulated under Article 3. Opinions differed especiallyconcerning the viability of avoided deforestation – emission avoidance through forestprotection projects – in the CDM. The potential scale, leakage problems, socio-economic aswell as sovereignty concerns have been brought up as arguments against its inclusion.The final decision at COP 7, only includes afforestation and reforestation, while avoideddeforestation is eligible under the Adaptation Fund of the Kyoto Protocol. The use ofLULUCF credits for complying with the reduction targets was limited to 1% of base yearemissions of each Annex I Parties per year. Nevertheless, concerns regarding non-permanenceof carbon sequestration as well as social and environmental effects were still prevailing. At
12 See also Fry (2002) as well as Jung et al. (2004)13 See also FCCC/CP/1998/MISC.714 The Latin American group GRULAC has split up over the issue of sinks in the CDM. While Brazil and Peruwanted to see any sinks projects excluded, most of the resting Latin-American Parties formed the GRILA groupwhich was actively pushing for sinks in the CDM.
5
COP 9, expiring credits which are supposed to address the concerns regarding the reversibilityof carbon sequestration in afforestation and reforestation projects were adopted.
3. Country negotiating positions
In the following, I analyze the distribution of positions of countries in the negotiation processon LULUCF. We focus on the three most important negotiation issues regarding LULUCF:the inclusion of mandatory LULUCF activities in Article 3.3 as negotiated mainly at COP 3,the inclusion of additional LULUCF activities in Annex I under Article 3.4 as well as theinclusion of LULUCF in the CDM – both under negotiation until COP 7. The negotiatingpositions described here represent the position Parties have voiced during the greatest part ofnegotiation on the respective issue.15
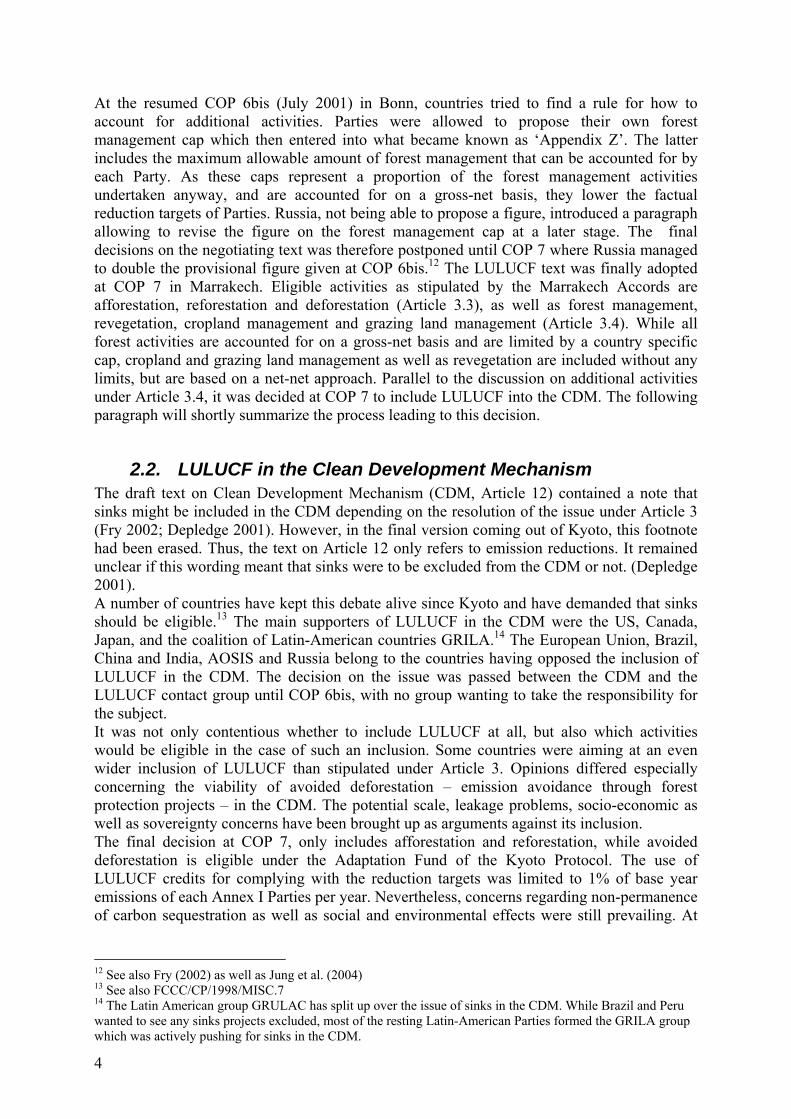
Figure 1: Country negotiating positions versus negotiation result
The position taken by a Party during the negotiations, however, does not necessarily reflectwhat it agreed to in the final decision. Since decisions in the international climate regime haveto be taken by consensus, the text over which Parties are negotiating has to be adapted in sucha way that all Parties will be able to consent to it.16
For understanding better how decisions are taken in the framework of the internationalclimate regime, it has to be emphasized that decisions are not simple yes-versus-no options.Negotiations are the development of a legal text in which Parties and negotiating coalitionstry to introduce as much of their own position as possible. The search for compromise
15 Voicing a position does not necessarily mean that a Party expressed this position in an official document, sinceinformal meetings and conversation in the door halls are an important element of international climate changenegotiations as well. Since we conduct a cross-sectional analysis, we cannot consider changes in countrypositions over time. This approach is justified, when assuming that the respective position is the one expressedduring the biggest part of the negotiation process.16 However, no clear definition of consensus exists. The latter is necessary due to the lack of an agreement on avoting rule. Often it is defined negatively to mean that there are no stated or formal objections to a decision. AParty can reluctantly consent to a decision, but then ask for its concerns to be noted in the report after adoption.There is a great level of discretion of the presiding officer to decide whether the objection of a Party has to beformally considered or only represents some lesser level of discontent that will allow a decision to go forwardafter the adoption (Depledge 2001).
Gross-net
6
consists of the change in parameters of the decision along different dimensions, trying to findthe point that will make consensus possible. Graphically, this can be represented by a three-dimensional diagram as the one represented in Figure 1, which plots in a very simplifiedmanner the positions of the Umbrella group and the EU versus the final outcome. In reality,even more dimensions and areas outside of the LULUCF negotiations will have to beconsidered elucidating the complexity delegates are facing at international climate changenegotiations.17 The country positions this paper is referring to are the ones that a Party waspursuing in the negotiations (in our graph represented by the bowls “EU” and “Umbrella”),independently of what was the final outcome of the negotiations (bowl “Result” in Figure 1).The following paragraphs describe the negotiating positions of 166 Parties18, measured on ascale from “strongly against”, “against”, “neutral”, “in favor”, and “strongly in favor”.
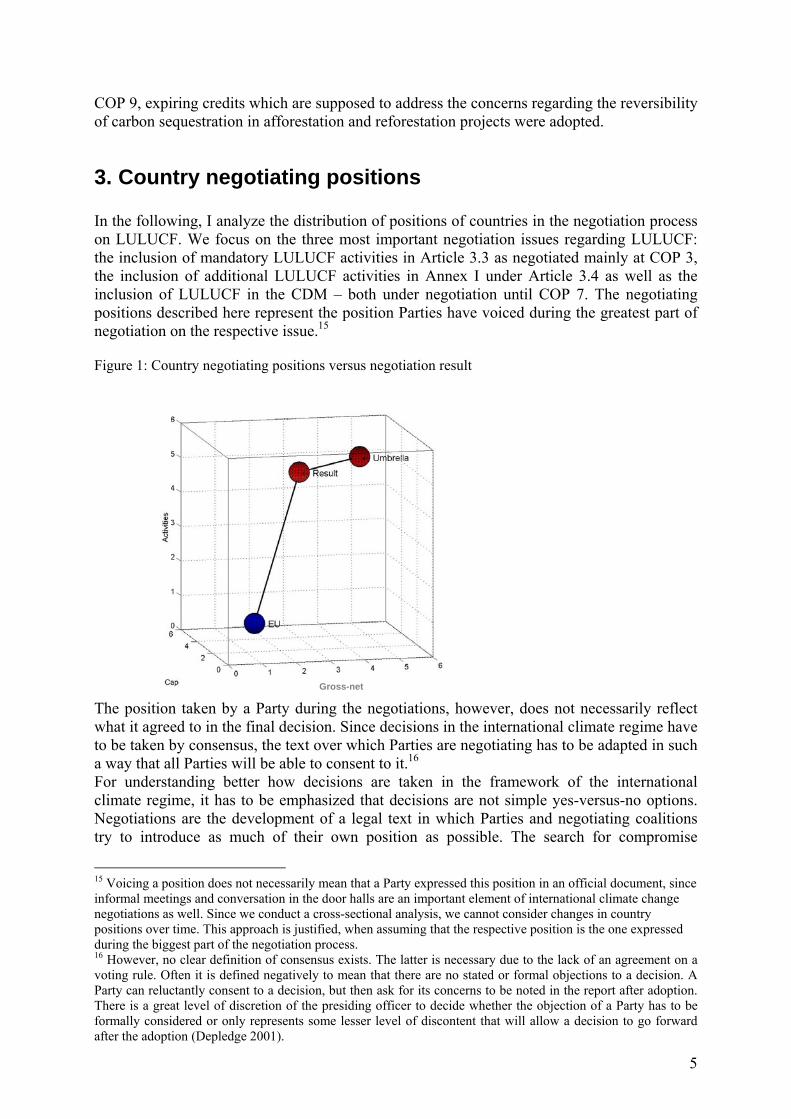
3.1. LULUCF in Annex I countriesFigure 2 a) illustrates the distribution of negotiating positions of Parties regarding the debateheld at COP 3 in Kyoto on whether to include LULUCF in the calculation of reductioncommitments at all.
Figure 2: Distribution of Parties´ negotiating positions on Article 3
strongly in favor
in favor
neutral
against
strongly against
Num
ber o
f Par
ties
100
80
60
40
20
0strongly in favor
in favor
neutral
against
strongly against
100
80
60
40
20
0
ANNEX
Annex I
Non Annex I
The relatively big proportion of Parties taking a neutral stance in Kyoto can be explained bethe above mentioned lack of knowledge on the subject. Only a small proportion of mainlyAnnex I countries has been pushing for the inclusion of LULUCF, while a significantcoalition of Annex I and Non-Annex I sinks opponents has voiced strong concerns. The groupof strong opponents consisted mainly of AOSIS, India, Brazil, and the EU with the exceptionof Finland, France, Italy and Sweden, while the Umbrella group was actively pushing for theinclusion of sinks at Kyoto.
17 The most important parameters along which negotiators moved in the negotiations on LULUCF are thenumber and type of eligible LULUCF activities, the degree to which the use of these different activities waslimited by a cap, the definition of forest, the discounts applied to LULUCF activities for example in the case offorest management, the reporting and verification procedures as well as the inclusion of LULUCF activities inthe base year of the emission inventory (gross-net versus net-net calculation).18 The 166 countries encompass most of the Parties to the UNFCCC at COP 3. Literature review, interviews of(former) delegates and UNFCCC recordings were used for collecting this information.
b) Art. 3.4a) Art. 3.3
7
There was considerably more time for Parties to develop a position towards the inclusion ofadditional LULUCF activities under Article 3.4 after Kyoto. Figure 2.b) illustrates thechanges in the distribution of positions in the post-Kyoto phase (Article 3.4) as compared tothe ones on Article 3.3 at COP 3. Most of the neutral Non- Annex I Parties on Article 3.3 hadshifted to the group of opponents of the inclusion of additional activities, while the coalitionsrepresenting the supporters and strong opponents had remained unchanged. It can be seen thatthe division on LULUCF was not between Annex I and Non-Annex I Parties, but caused bydifferent criteria.
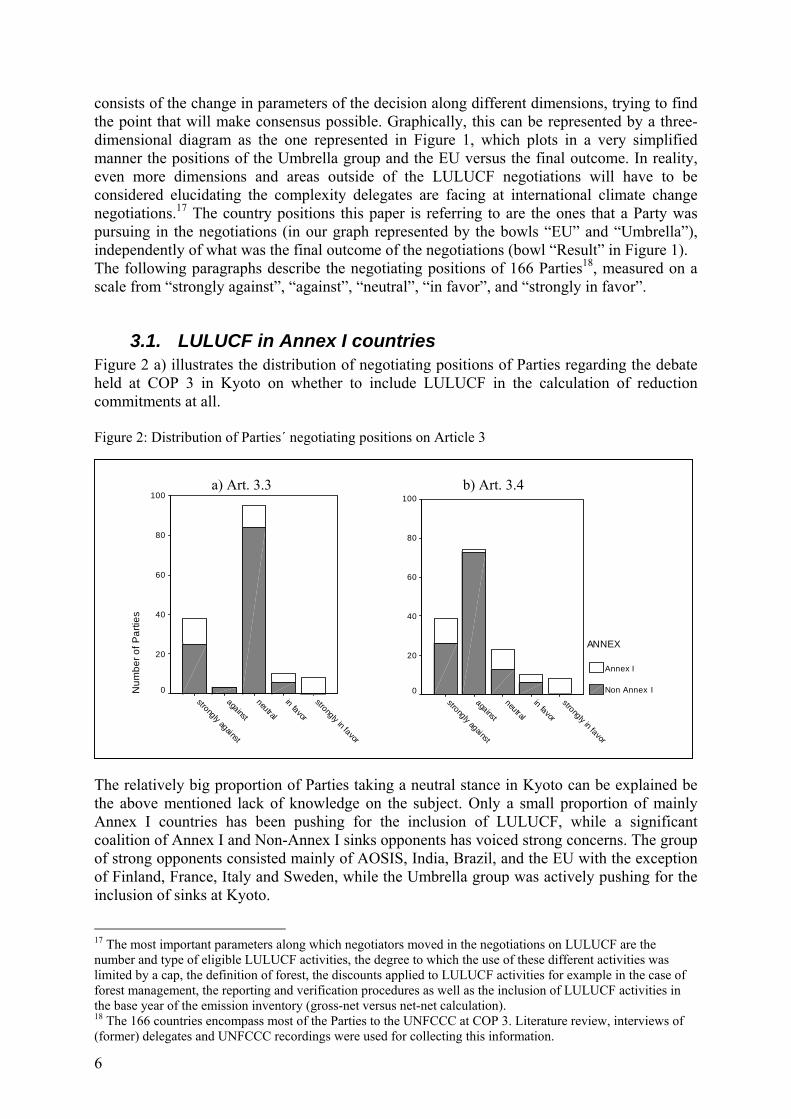
3.2. LULUCF in the CDMThe negotiating positions on the issues of whether to include LULUCF in the CDM, as shownin Figure 3, follow a different pattern than on Article 3.
Figure 3: Distribution of Parties´ negotiating positions on LULUCF projects in the CDM
strongly in favor
in favor
neutral
against
strongly against
Num
ber o
f Par
ties
100
90
80
70
60
50
40
30
20
10
0
ANNEX
Annex I
Non Annex I
The coalitions of Annex I Parties taking a strong position in favor and against sinks underArticle 3 did so as well for sinks in the CDM. However, a relatively big proportion of Partiesremained undecided on the issue, while the Annex I supporters have been joined by asignificant coalition of Non-Annex I Parties in favor of including sinks in the CDM. WhileParties belonging to the African group, OPEC as well as the Environmental Integrity Groupvoiced some support for the issue, the Latin-American CDM sinks supporters (GRILA)strongly fought for the inclusion of forestry projects in the CDM.The inclusion of LULUCF in the CDM is often mentioned as the issue over which there hasbeen a significant split of G77 and China. This is due to the fact that Non-Annex I Parties canbe found in both extreme positions, strongly pushing for as well as strongly being against thesinks inclusion. This split is mainly represented by the coalition of most Latin-Americancountries strongly interested in sinks in the CDM facing the rather skeptical coalition ofChina, Brazil, AOSIS and many Asian countries.
8
3.3. Number of Parties versus powerThe above description of the distribution of negotiating positions, however, does not tellmuch about why certain decisions were taken the way they were. The sheer number of Partiestaking each position does not equal the negotiating power represented by the respectivecoalition. In reality, only a few number of Parties is actually influencing the outcome of thenegotiations, while especially most Non-Annex I Parties remain sidelined.The main goal of this paper is, however, to find factors explaining Parties´ negotiatingpositions by conducting a statistical analysis, and not explaining the outcome of thenegotiations.
4. Statistical analysis of country positions and participationin the negotiations
After having identified the negotiating positions of countries, I use two different regressionmodels for categorical independent variables to analyze issue related to the negotiatingpositions. First, a multinomial logit model is applied to identify factors affecting therespective positions taken in the negotiations. Second, I examine factors influencing theparticipation of Parties in the submission process in the international climate negotiations byusing a zero-inflated count model.
4.1. A multinomial logit model of negotiating positionsWhen using the negotiating position as the dependent variable, the outcome categories of“strongly against” to “strongly in favor” represent a Likert scale which is frequentlyinterpreted as a continuous scale in order to be able to conduct a standard linear regressionanalysis. Long (1997), however, remarks that such an assumption often leads to distortedresults, and that an ordered logit/probit or a multinomial logit model are more appropriate fordependent variables with categorical outcomes. I use the multinomial logit model to avoid theparallel regression assumption of the ordered logit model.19
The multinomial logit model is used for estimating a regression model with nominaldependent variables. In the following, each of our country positions represents a nominaloutcome.20 However, the dependent variable is recoded to only three outcome categories by
19 The outcomes of negotiating positions can be seen as an ordered scale, which makes the ordered logit modelthe first choice. For using the latter, parallel regression assumption has to be fulfilled, though, which is not thecase in this analysis. For details on the parallel regression assumption in ordered logit models see Long (1997),page 140-145.20 The model can be derived as a probability model as specified by the following equation:
∑=
+== J
jji
miii
ßx
ßxxmy
2)exp(1
)exp()Pr(
, for m>1Let y be the dependent variable with J nominal outcome categories. Then )Pr( ii xmy = is the probability ofobserving outcome m given the ith observation of the independent variable x. The ß´s represent the coefficientswhich are obtained by maximum likelihood estimation. The maximum likelihood estimator used for theestimation of the results is based on the probability equation is:
∏∏∑= =
=
=J
m myJ
jji
miJ
i x
xXyL1
1
2
)exp(
)exp();;.....,(β
βββ
9
joining the two categories “against” and “strongly against” as well as “in favor” and “stronglyin favor”. Consequently, the resulting scale used in the multinomial logit analysis consists of“against”, “neutral” and “in favor”.21 The research questions guiding this analysis are based on different hypothesis which aresupposed to be tested by the model. The first hypothesis assumes that there are certaindomestic interests from a forestry lobby influencing the negotiating position towardsLULUCF. Should this hypothesis hold, Parties with a bigger forestry lobby should have ahigher probability to be in favor of including LULUCF in the climate regime. The size of theforestry lobby is captured by the variable export of forest products as % of GDP.The second hypothesis stipulates that the LULUCF issue was used by those Parties with arather negative attitude towards international climate policy to reduce their Kyoto reductiontargets or compliance costs through the backdoor. The part regarding the general attitudetowards climate policy is operationalized by the independent variable “number of the Fossil-of-the-Day Awards” representing the degree of destructive participation of a Party in theclimate negotiations. The “Fossil of the Day Award” is granted at a daily basis at theinternational climate change negotiations to those countries which are considered to havemade the worst input to or to have blocked the progress of the negotiations. The problem thata certain number of awards has been granted for the support of LULUCF, which would makeour model tautological, has been accounted for by not considering those awards granted forissues related to LULUCF.22
Table 1: Independent variables of the multinomial logit model (explaining negotiating positions)
Hypo-theses
Independentvariables
Concept abbreviation Source
1Export of forestproducts(% of GDP)
Importance of forestindustry
export_gdp Calculated based on datafrom FAO (2003)
Distance to target withsinks(in % of AAUs)
Stringency of Kyotoreduction target withLULUCF in Article 3
gap_sinks
Distance to targetwithout sinks(in % of AAUs)
Stringency of Kyotoreduction target withoutLULUCF
gap_nosink
Reduction in distanceto target due to Article3 sinks (in % ofAAUs)
Gain due to introduction ofsinks in Article 3
gain_sinks
Own calculations basedon UNFCCC datareported in IEA (2003),page15(business as usualemissions are obtainedby linear extrapolationof the change inemissions 1990-2001 tothe year 2012)
2
Number of Fossil ofthe Day Awards (COP5-COP 9)
Destructive participation inthe climate negotiations
Fossil www.fossil-of-the-day.org
Membership inG77+China
Developing country g77
The independent variables representing the stringency of the respective Kyoto reduction target(distance to target) and the gain due to the introduction of sinks under Article 3 (reduction indistance to target) are used to analyze the second part of the hypothesis referring to themotivation to renegotiate the target. Should this hypothesis hold, Parties with a high number Taking the logs of L, we obtain the log likelihood equation which can be maximised by applying iterativenumerical methods. For further details on the MNLM see Long (1997), Long and Freese (2003), Powers and Xi(2000), Menard (2001) and Agresti (2002).21 This is done to guarantee that each category at least comprises a minimum amount of observations. The otherreason is to avoid any doubt about the independence of outcome categories.22 The award is an initiative of the Climate Action Network (CAN). A list of the number of awards per Partyincluding the reasons for the respective awards can be found at www.fossil-of-the-day.org.
10
of awards, a relatively stringent target and/or a relatively high decrease in the target due to theinclusion of sinks should be the ones favoring sinks and vice versa.Furthermore, the membership of G77 and China is used as a dummy variable to examine ifthe negotiating position is influenced by the membership in the negotiation group of thedeveloping countries. The independent variables included in the analysis are summarized inTable 1.
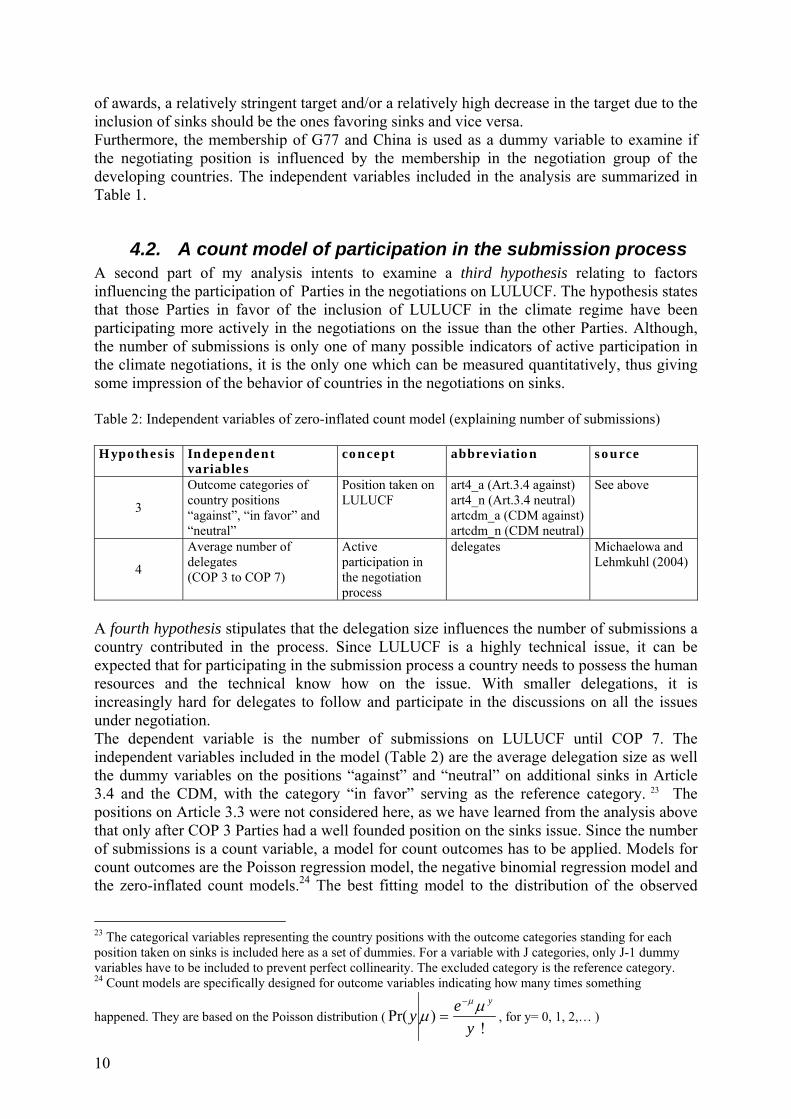
4.2. A count model of participation in the submission processA second part of my analysis intents to examine a third hypothesis relating to factorsinfluencing the participation of Parties in the negotiations on LULUCF. The hypothesis statesthat those Parties in favor of the inclusion of LULUCF in the climate regime have beenparticipating more actively in the negotiations on the issue than the other Parties. Although,the number of submissions is only one of many possible indicators of active participation inthe climate negotiations, it is the only one which can be measured quantitatively, thus givingsome impression of the behavior of countries in the negotiations on sinks.
Table 2: Independent variables of zero-inflated count model (explaining number of submissions)
Hypothesis Independentvariables
concept abbreviation source
3
Outcome categories ofcountry positions“against”, “in favor” and“neutral”
Position taken onLULUCF
art4_a (Art.3.4 against)art4_n (Art.3.4 neutral)artcdm_a (CDM against)artcdm_n (CDM neutral)
See above
4
Average number ofdelegates(COP 3 to COP 7)
Activeparticipation inthe negotiationprocess
delegates Michaelowa andLehmkuhl (2004)
A fourth hypothesis stipulates that the delegation size influences the number of submissions acountry contributed in the process. Since LULUCF is a highly technical issue, it can beexpected that for participating in the submission process a country needs to possess the humanresources and the technical know how on the issue. With smaller delegations, it isincreasingly hard for delegates to follow and participate in the discussions on all the issuesunder negotiation.The dependent variable is the number of submissions on LULUCF until COP 7. Theindependent variables included in the model (Table 2) are the average delegation size as wellthe dummy variables on the positions “against” and “neutral” on additional sinks in Article3.4 and the CDM, with the category “in favor” serving as the reference category. 23 Thepositions on Article 3.3 were not considered here, as we have learned from the analysis abovethat only after COP 3 Parties had a well founded position on the sinks issue. Since the numberof submissions is a count variable, a model for count outcomes has to be applied. Models forcount outcomes are the Poisson regression model, the negative binomial regression model andthe zero-inflated count models.24 The best fitting model to the distribution of the observed
23 The categorical variables representing the country positions with the outcome categories standing for eachposition taken on sinks is included here as a set of dummies. For a variable with J categories, only J-1 dummyvariables have to be included to prevent perfect collinearity. The excluded category is the reference category.24 Count models are specifically designed for outcome variables indicating how many times something
happened. They are based on the Poisson distribution (!
)Pr(y
eyyµµ
µ−
= , for y= 0, 1, 2,… )
11
number of submissions is the zero-inflated Poisson model, which will be applied in thefollowing. For details on the model selection, see Appendix B. In the following, the results ofthe two models are presented.
5. Results
5.1. Factors influencing negotiating positions
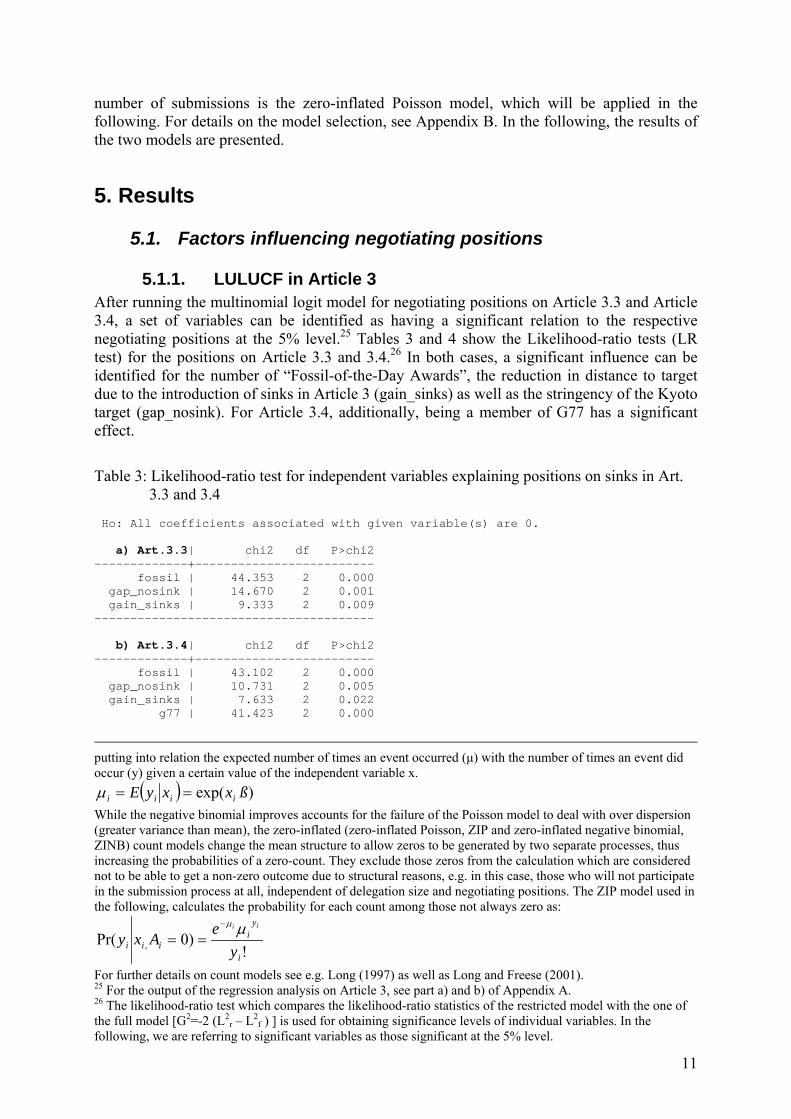
5.1.1. LULUCF in Article 3After running the multinomial logit model for negotiating positions on Article 3.3 and Article3.4, a set of variables can be identified as having a significant relation to the respectivenegotiating positions at the 5% level.25 Tables 3 and 4 show the Likelihood-ratio tests (LRtest) for the positions on Article 3.3 and 3.4.26 In both cases, a significant influence can beidentified for the number of “Fossil-of-the-Day Awards”, the reduction in distance to targetdue to the introduction of sinks in Article 3 (gain_sinks) as well as the stringency of the Kyototarget (gap_nosink). For Article 3.4, additionally, being a member of G77 has a significanteffect.
Table 3: Likelihood-ratio test for independent variables explaining positions on sinks in Art. 3.3 and 3.4
Ho: All coefficients associated with given variable(s) are 0.
a) Art.3.3| chi2 df P>chi2-------------+------------------------- fossil | 44.353 2 0.000 gap_nosink | 14.670 2 0.001 gain_sinks | 9.333 2 0.009---------------------------------------
b) Art.3.4| chi2 df P>chi2-------------+------------------------- fossil | 43.102 2 0.000 gap_nosink | 10.731 2 0.005 gain_sinks | 7.633 2 0.022 g77 | 41.423 2 0.000
putting into relation the expected number of times an event occurred (µ) with the number of times an event didoccur (y) given a certain value of the independent variable x.
( ) )exp( ßxxyE iiii ==µWhile the negative binomial improves accounts for the failure of the Poisson model to deal with over dispersion(greater variance than mean), the zero-inflated (zero-inflated Poisson, ZIP and zero-inflated negative binomial,ZINB) count models change the mean structure to allow zeros to be generated by two separate processes, thusincreasing the probabilities of a zero-count. They exclude those zeros from the calculation which are considerednot to be able to get a non-zero outcome due to structural reasons, e.g. in this case, those who will not participatein the submission process at all, independent of delegation size and negotiating positions. The ZIP model used inthe following, calculates the probability for each count among those not always zero as:
!)0Pr( ,
i
yi
iii yeAxy
ii µµ−
==
For further details on count models see e.g. Long (1997) as well as Long and Freese (2001).25 For the output of the regression analysis on Article 3, see part a) and b) of Appendix A.26 The likelihood-ratio test which compares the likelihood-ratio statistics of the restricted model with the one ofthe full model [G2=-2 (L2
r – L2f ) ] is used for obtaining significance levels of individual variables. In the
following, we are referring to significant variables as those significant at the 5% level.
12
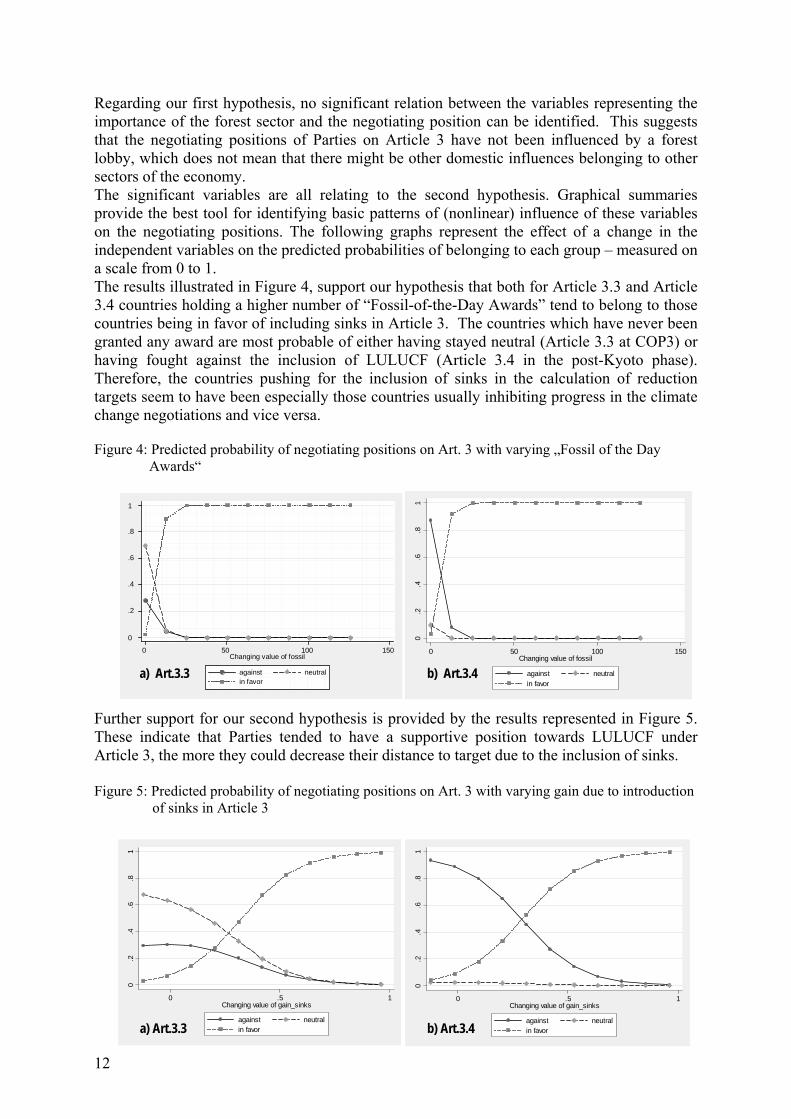
Regarding our first hypothesis, no significant relation between the variables representing theimportance of the forest sector and the negotiating position can be identified. This suggeststhat the negotiating positions of Parties on Article 3 have not been influenced by a forestlobby, which does not mean that there might be other domestic influences belonging to othersectors of the economy.The significant variables are all relating to the second hypothesis. Graphical summariesprovide the best tool for identifying basic patterns of (nonlinear) influence of these variableson the negotiating positions. The following graphs represent the effect of a change in theindependent variables on the predicted probabilities of belonging to each group – measured ona scale from 0 to 1.The results illustrated in Figure 4, support our hypothesis that both for Article 3.3 and Article3.4 countries holding a higher number of “Fossil-of-the-Day Awards” tend to belong to thosecountries being in favor of including sinks in Article 3. The countries which have never beengranted any award are most probable of either having stayed neutral (Article 3.3 at COP3) orhaving fought against the inclusion of LULUCF (Article 3.4 in the post-Kyoto phase).Therefore, the countries pushing for the inclusion of sinks in the calculation of reductiontargets seem to have been especially those countries usually inhibiting progress in the climatechange negotiations and vice versa.
Figure 4: Predicted probability of negotiating positions on Art. 3 with varying „Fossil of the Day Awards“
Further support for our second hypothesis is provided by the results represented in Figure 5.These indicate that Parties tended to have a supportive position towards LULUCF underArticle 3, the more they could decrease their distance to target due to the inclusion of sinks.
Figure 5: Predicted probability of negotiating positions on Art. 3 with varying gain due to introduction of sinks in Article 3
0
.2
.4
.6
.8
1
0 50 100 150Changing value of fossil
against neutralin favor
0.2
.4.6
.81
0 50 100 150Changing value of fossil
against neutralin favor
a) Art.3.3 b) Art.3.4
0.2
.4.6
.81
0 .5 1Changing value of gain_sinks
against neutralin favor
0.2
.4.6
.81
0 .5 1Changing value of gain_sinks
against neutralin favora) Art.3.3 b) Art.3.4
13
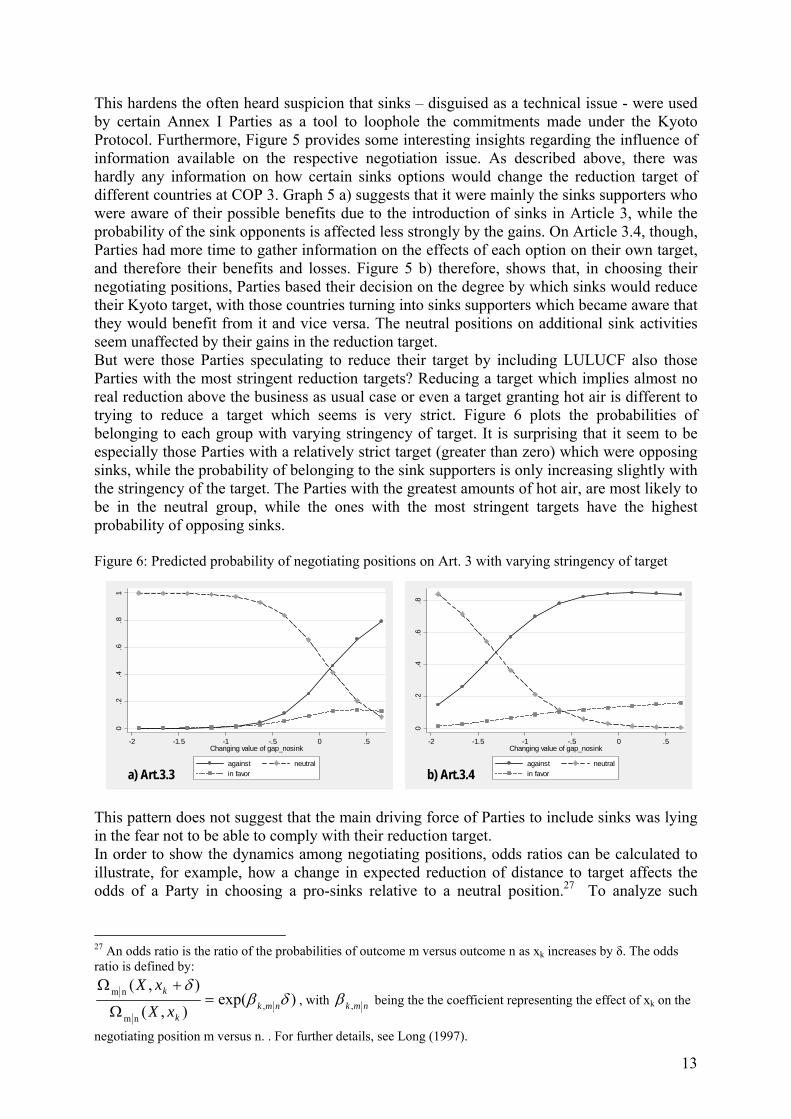
This hardens the often heard suspicion that sinks – disguised as a technical issue - were usedby certain Annex I Parties as a tool to loophole the commitments made under the KyotoProtocol. Furthermore, Figure 5 provides some interesting insights regarding the influence ofinformation available on the respective negotiation issue. As described above, there washardly any information on how certain sinks options would change the reduction target ofdifferent countries at COP 3. Graph 5 a) suggests that it were mainly the sinks supporters whowere aware of their possible benefits due to the introduction of sinks in Article 3, while theprobability of the sink opponents is affected less strongly by the gains. On Article 3.4, though,Parties had more time to gather information on the effects of each option on their own target,and therefore their benefits and losses. Figure 5 b) therefore, shows that, in choosing theirnegotiating positions, Parties based their decision on the degree by which sinks would reducetheir Kyoto target, with those countries turning into sinks supporters which became aware thatthey would benefit from it and vice versa. The neutral positions on additional sink activitiesseem unaffected by their gains in the reduction target.But were those Parties speculating to reduce their target by including LULUCF also thoseParties with the most stringent reduction targets? Reducing a target which implies almost noreal reduction above the business as usual case or even a target granting hot air is different totrying to reduce a target which seems is very strict. Figure 6 plots the probabilities ofbelonging to each group with varying stringency of target. It is surprising that it seem to beespecially those Parties with a relatively strict target (greater than zero) which were opposingsinks, while the probability of belonging to the sink supporters is only increasing slightly withthe stringency of the target. The Parties with the greatest amounts of hot air, are most likely tobe in the neutral group, while the ones with the most stringent targets have the highestprobability of opposing sinks.
Figure 6: Predicted probability of negotiating positions on Art. 3 with varying stringency of target
This pattern does not suggest that the main driving force of Parties to include sinks was lyingin the fear not to be able to comply with their reduction target.In order to show the dynamics among negotiating positions, odds ratios can be calculated toillustrate, for example, how a change in expected reduction of distance to target affects theodds of a Party in choosing a pro-sinks relative to a neutral position.27 To analyze such
27 An odds ratio is the ratio of the probabilities of outcome m versus outcome n as xk increases by δ. The oddsratio is defined by:
)exp(),(
),(,
nm
nm δβδ
nmkk
k
xX
xX=
Ω
+Ω, with nmk ,β being the the coefficient representing the effect of xk on the
negotiating position m versus n. . For further details, see Long (1997).
0.2
.4.6
.81
-2 -1.5 -1 -.5 0 .5Changing value of gap_nosink
against neutralin favor
0.2
.4.6
.8
-2 -1.5 -1 -.5 0 .5Changing value of gap_nosink
against neutralin favora) Art.3.3 b) Art.3.4
14
Factor Change Scale Relative to Category against
Logit Coefficient Scale Relative to Category against
0
-5.95
.01
-4.44
.05
-2.92
.25
-1.4
1.12
.11
5.11
1.63
23.28
3.15
106.08
4.66
483.38
6.18
N I
A
N I
A
N I
A
N I A
fossil Std Coef
gain_sinks Std Coef
gap_nosink Std Coef
g77 0/1
Factor Change Scale Relative to Category against
Logit Coefficient Scale Relative to Category against
.28
-1.26
.74
-.31
1.91
.65
4.94
1.6
12.81
2.55
33.22
3.5
86.11
4.46
223.25
5.41
578.76
6.36
N I
A
N I
A
N I
A
fossil Std Coef
gain_sinks Std Coef
gap_nosink Std Coef
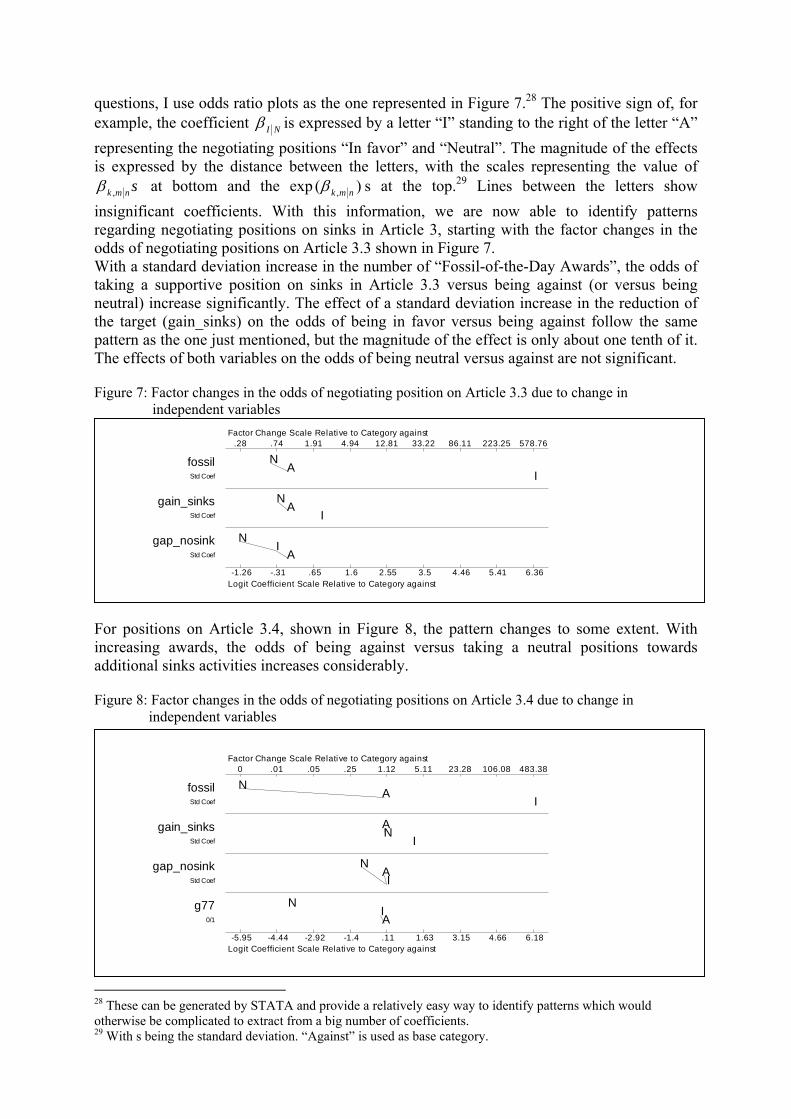
questions, I use odds ratio plots as the one represented in Figure 7.28 The positive sign of, forexample, the coefficient NIβ is expressed by a letter “I” standing to the right of the letter “A”representing the negotiating positions “In favor” and “Neutral”. The magnitude of the effectsis expressed by the distance between the letters, with the scales representing the value of
snmk ,β at bottom and the exp )( , nmkβ s at the top.29 Lines between the letters showinsignificant coefficients. With this information, we are now able to identify patternsregarding negotiating positions on sinks in Article 3, starting with the factor changes in theodds of negotiating positions on Article 3.3 shown in Figure 7.With a standard deviation increase in the number of “Fossil-of-the-Day Awards”, the odds oftaking a supportive position on sinks in Article 3.3 versus being against (or versus beingneutral) increase significantly. The effect of a standard deviation increase in the reduction ofthe target (gain_sinks) on the odds of being in favor versus being against follow the samepattern as the one just mentioned, but the magnitude of the effect is only about one tenth of it.The effects of both variables on the odds of being neutral versus against are not significant.
Figure 7: Factor changes in the odds of negotiating position on Article 3.3 due to change in independent variables
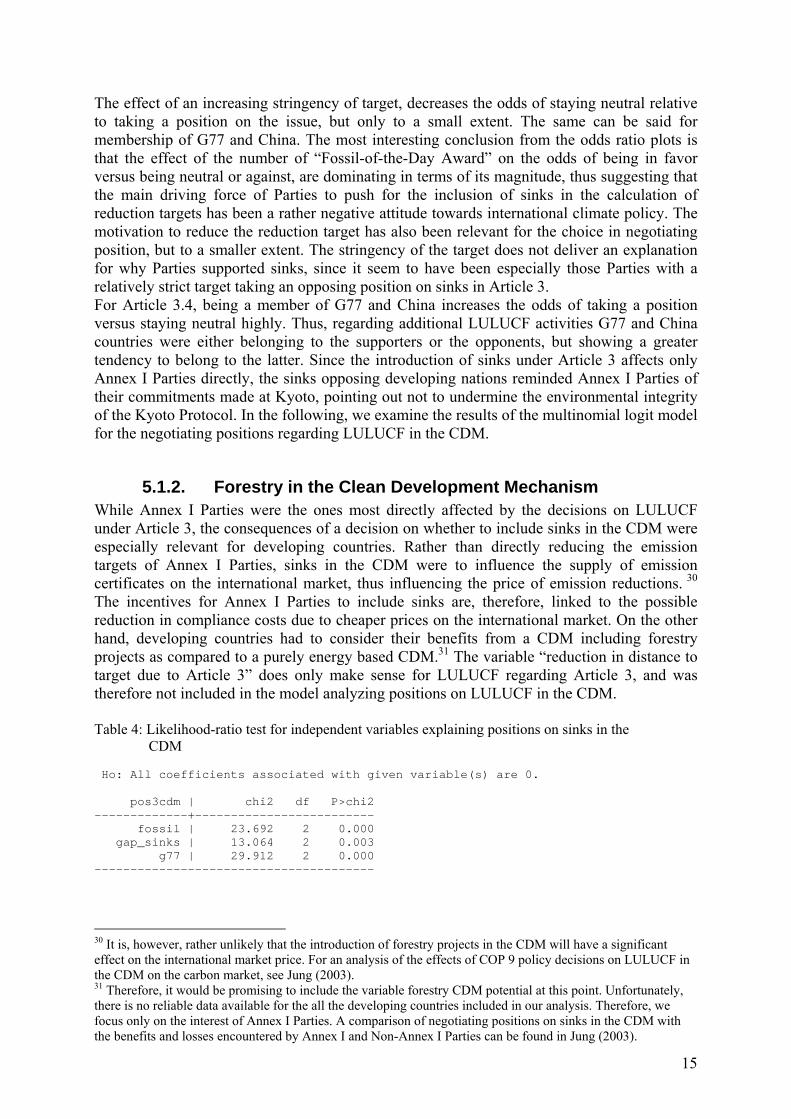
For positions on Article 3.4, shown in Figure 8, the pattern changes to some extent. Withincreasing awards, the odds of being against versus taking a neutral positions towardsadditional sinks activities increases considerably.
Figure 8: Factor changes in the odds of negotiating positions on Article 3.4 due to change in independent variables
28 These can be generated by STATA and provide a relatively easy way to identify patterns which wouldotherwise be complicated to extract from a big number of coefficients.29 With s being the standard deviation. “Against” is used as base category.
15
The effect of an increasing stringency of target, decreases the odds of staying neutral relativeto taking a position on the issue, but only to a small extent. The same can be said formembership of G77 and China. The most interesting conclusion from the odds ratio plots isthat the effect of the number of “Fossil-of-the-Day Award” on the odds of being in favorversus being neutral or against, are dominating in terms of its magnitude, thus suggesting thatthe main driving force of Parties to push for the inclusion of sinks in the calculation ofreduction targets has been a rather negative attitude towards international climate policy. Themotivation to reduce the reduction target has also been relevant for the choice in negotiatingposition, but to a smaller extent. The stringency of the target does not deliver an explanationfor why Parties supported sinks, since it seem to have been especially those Parties with arelatively strict target taking an opposing position on sinks in Article 3.For Article 3.4, being a member of G77 and China increases the odds of taking a positionversus staying neutral highly. Thus, regarding additional LULUCF activities G77 and Chinacountries were either belonging to the supporters or the opponents, but showing a greatertendency to belong to the latter. Since the introduction of sinks under Article 3 affects onlyAnnex I Parties directly, the sinks opposing developing nations reminded Annex I Parties oftheir commitments made at Kyoto, pointing out not to undermine the environmental integrityof the Kyoto Protocol. In the following, we examine the results of the multinomial logit modelfor the negotiating positions regarding LULUCF in the CDM.
5.1.2. Forestry in the Clean Development MechanismWhile Annex I Parties were the ones most directly affected by the decisions on LULUCFunder Article 3, the consequences of a decision on whether to include sinks in the CDM wereespecially relevant for developing countries. Rather than directly reducing the emissiontargets of Annex I Parties, sinks in the CDM were to influence the supply of emissioncertificates on the international market, thus influencing the price of emission reductions. 30
The incentives for Annex I Parties to include sinks are, therefore, linked to the possiblereduction in compliance costs due to cheaper prices on the international market. On the otherhand, developing countries had to consider their benefits from a CDM including forestryprojects as compared to a purely energy based CDM.31 The variable “reduction in distance totarget due to Article 3” does only make sense for LULUCF regarding Article 3, and wastherefore not included in the model analyzing positions on LULUCF in the CDM.
Table 4: Likelihood-ratio test for independent variables explaining positions on sinks in the CDM
Ho: All coefficients associated with given variable(s) are 0.
pos3cdm | chi2 df P>chi2-------------+------------------------- fossil | 23.692 2 0.000 gap_sinks | 13.064 2 0.003 g77 | 29.912 2 0.000---------------------------------------
30 It is, however, rather unlikely that the introduction of forestry projects in the CDM will have a significanteffect on the international market price. For an analysis of the effects of COP 9 policy decisions on LULUCF inthe CDM on the carbon market, see Jung (2003).31 Therefore, it would be promising to include the variable forestry CDM potential at this point. Unfortunately,there is no reliable data available for the all the developing countries included in our analysis. Therefore, wefocus only on the interest of Annex I Parties. A comparison of negotiating positions on sinks in the CDM withthe benefits and losses encountered by Annex I and Non-Annex I Parties can be found in Jung (2003).
16
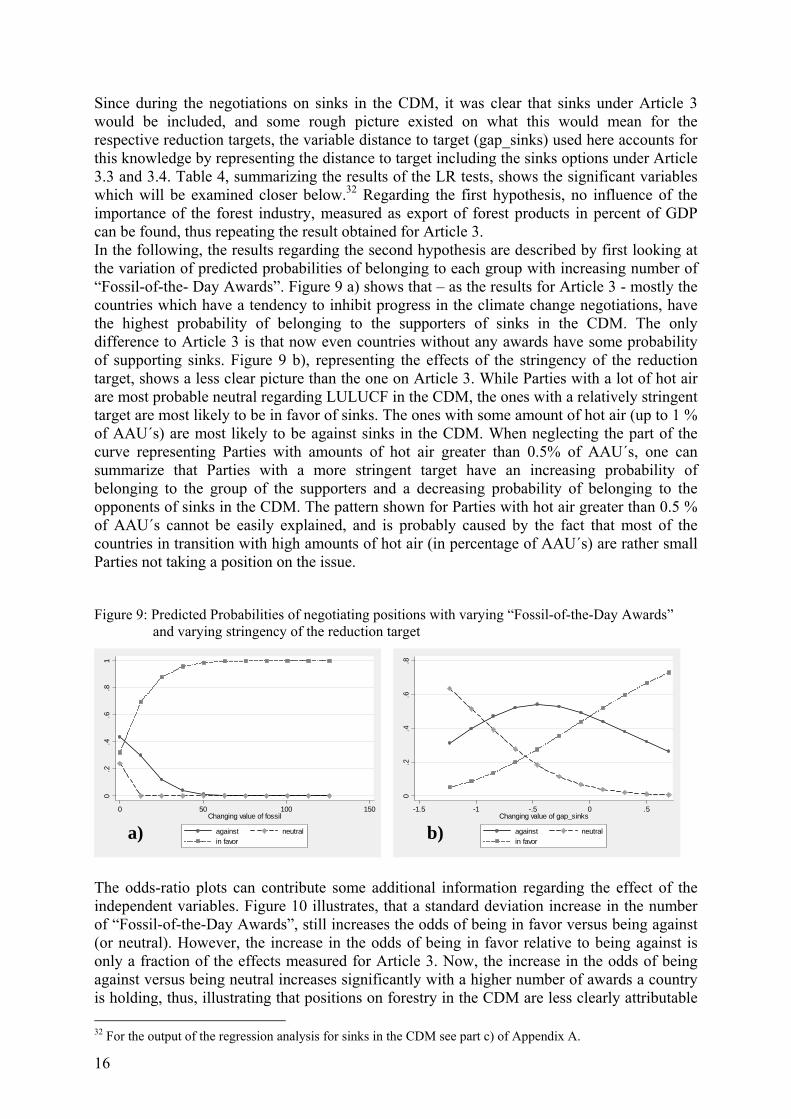
Since during the negotiations on sinks in the CDM, it was clear that sinks under Article 3would be included, and some rough picture existed on what this would mean for therespective reduction targets, the variable distance to target (gap_sinks) used here accounts forthis knowledge by representing the distance to target including the sinks options under Article3.3 and 3.4. Table 4, summarizing the results of the LR tests, shows the significant variableswhich will be examined closer below.32 Regarding the first hypothesis, no influence of theimportance of the forest industry, measured as export of forest products in percent of GDPcan be found, thus repeating the result obtained for Article 3.In the following, the results regarding the second hypothesis are described by first looking atthe variation of predicted probabilities of belonging to each group with increasing number of“Fossil-of-the- Day Awards”. Figure 9 a) shows that – as the results for Article 3 - mostly thecountries which have a tendency to inhibit progress in the climate change negotiations, havethe highest probability of belonging to the supporters of sinks in the CDM. The onlydifference to Article 3 is that now even countries without any awards have some probabilityof supporting sinks. Figure 9 b), representing the effects of the stringency of the reductiontarget, shows a less clear picture than the one on Article 3. While Parties with a lot of hot airare most probable neutral regarding LULUCF in the CDM, the ones with a relatively stringenttarget are most likely to be in favor of sinks. The ones with some amount of hot air (up to 1 %of AAU´s) are most likely to be against sinks in the CDM. When neglecting the part of thecurve representing Parties with amounts of hot air greater than 0.5% of AAU´s, one cansummarize that Parties with a more stringent target have an increasing probability ofbelonging to the group of the supporters and a decreasing probability of belonging to theopponents of sinks in the CDM. The pattern shown for Parties with hot air greater than 0.5 %of AAU´s cannot be easily explained, and is probably caused by the fact that most of thecountries in transition with high amounts of hot air (in percentage of AAU´s) are rather smallParties not taking a position on the issue.
Figure 9: Predicted Probabilities of negotiating positions with varying “Fossil-of-the-Day Awards” and varying stringency of the reduction target
The odds-ratio plots can contribute some additional information regarding the effect of theindependent variables. Figure 10 illustrates, that a standard deviation increase in the numberof “Fossil-of-the-Day Awards”, still increases the odds of being in favor versus being against(or neutral). However, the increase in the odds of being in favor relative to being against isonly a fraction of the effects measured for Article 3. Now, the increase in the odds of beingagainst versus being neutral increases significantly with a higher number of awards a countryis holding, thus, illustrating that positions on forestry in the CDM are less clearly attributable 32 For the output of the regression analysis for sinks in the CDM see part c) of Appendix A.
0.2
.4.6
.8
-1.5 -1 -.5 0 .5Changing value of gap_sinks
against neutralin favor
0.2
.4.6
.81
0 50 100 150Changing value of fossil
against neutralin favor
a) b)
17
Factor Change Scale Relative to Category against
Logit Coefficient Scale Relative to Category against
0
-6.61
0
-5.5
.01
-4.38
.04
-3.26
.12
-2.15
.36
-1.03
1.09
.09
3.33
1.2
10.17
2.32
N I
A
N I
A
N I
A
fossil Std Coef
gap_sinks Std Coef
g77 0/1
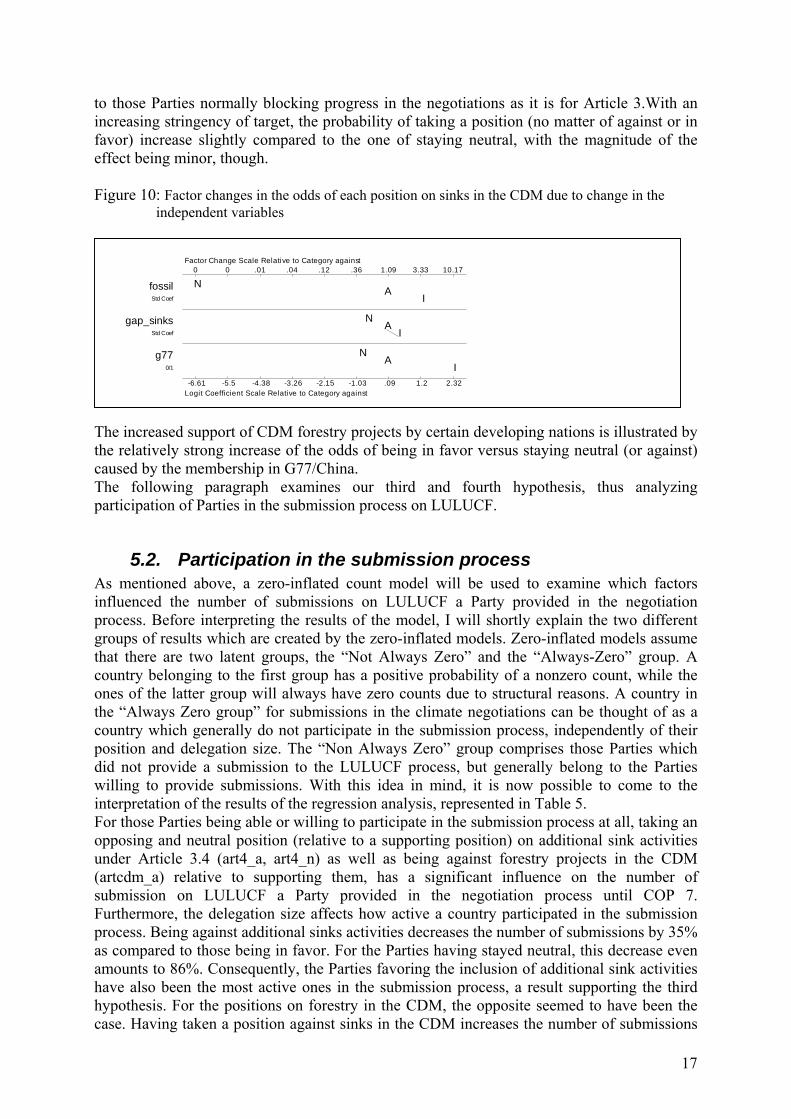
to those Parties normally blocking progress in the negotiations as it is for Article 3.With anincreasing stringency of target, the probability of taking a position (no matter of against or infavor) increase slightly compared to the one of staying neutral, with the magnitude of theeffect being minor, though.
Figure 10: Factor changes in the odds of each position on sinks in the CDM due to change in the independent variables
The increased support of CDM forestry projects by certain developing nations is illustrated bythe relatively strong increase of the odds of being in favor versus staying neutral (or against)caused by the membership in G77/China.The following paragraph examines our third and fourth hypothesis, thus analyzingparticipation of Parties in the submission process on LULUCF.
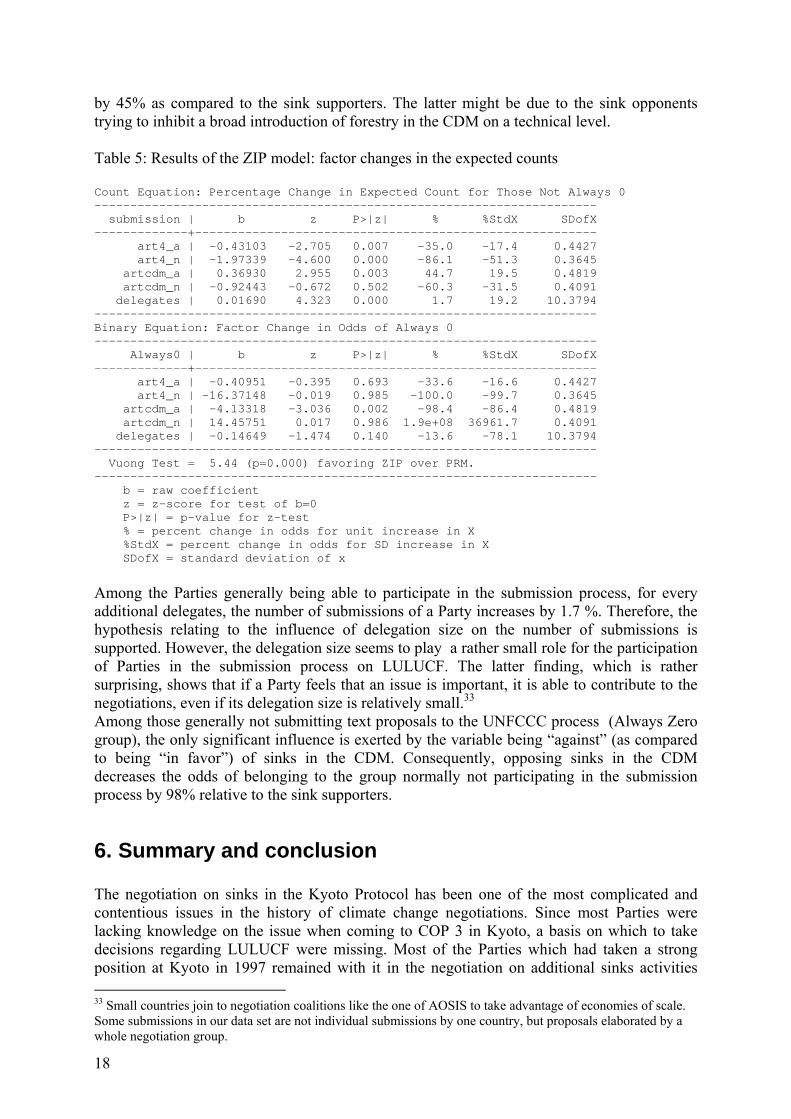
5.2. Participation in the submission processAs mentioned above, a zero-inflated count model will be used to examine which factorsinfluenced the number of submissions on LULUCF a Party provided in the negotiationprocess. Before interpreting the results of the model, I will shortly explain the two differentgroups of results which are created by the zero-inflated models. Zero-inflated models assumethat there are two latent groups, the “Not Always Zero” and the “Always-Zero” group. Acountry belonging to the first group has a positive probability of a nonzero count, while theones of the latter group will always have zero counts due to structural reasons. A country inthe “Always Zero group” for submissions in the climate negotiations can be thought of as acountry which generally do not participate in the submission process, independently of theirposition and delegation size. The “Non Always Zero” group comprises those Parties whichdid not provide a submission to the LULUCF process, but generally belong to the Partieswilling to provide submissions. With this idea in mind, it is now possible to come to theinterpretation of the results of the regression analysis, represented in Table 5.For those Parties being able or willing to participate in the submission process at all, taking anopposing and neutral position (relative to a supporting position) on additional sink activitiesunder Article 3.4 (art4_a, art4_n) as well as being against forestry projects in the CDM(artcdm_a) relative to supporting them, has a significant influence on the number ofsubmission on LULUCF a Party provided in the negotiation process until COP 7.Furthermore, the delegation size affects how active a country participated in the submissionprocess. Being against additional sinks activities decreases the number of submissions by 35%as compared to those being in favor. For the Parties having stayed neutral, this decrease evenamounts to 86%. Consequently, the Parties favoring the inclusion of additional sink activitieshave also been the most active ones in the submission process, a result supporting the thirdhypothesis. For the positions on forestry in the CDM, the opposite seemed to have been thecase. Having taken a position against sinks in the CDM increases the number of submissions
18
by 45% as compared to the sink supporters. The latter might be due to the sink opponentstrying to inhibit a broad introduction of forestry in the CDM on a technical level.
Table 5: Results of the ZIP model: factor changes in the expected counts
Count Equation: Percentage Change in Expected Count for Those Not Always 0---------------------------------------------------------------------- submission | b z P>|z| % %StdX SDofX-------------+-------------------------------------------------------- art4_a | -0.43103 -2.705 0.007 -35.0 -17.4 0.4427 art4_n | -1.97339 -4.600 0.000 -86.1 -51.3 0.3645 artcdm_a | 0.36930 2.955 0.003 44.7 19.5 0.4819 artcdm_n | -0.92443 -0.672 0.502 -60.3 -31.5 0.4091 delegates | 0.01690 4.323 0.000 1.7 19.2 10.3794----------------------------------------------------------------------Binary Equation: Factor Change in Odds of Always 0---------------------------------------------------------------------- Always0 | b z P>|z| % %StdX SDofX-------------+-------------------------------------------------------- art4_a | -0.40951 -0.395 0.693 -33.6 -16.6 0.4427 art4_n | -16.37148 -0.019 0.985 -100.0 -99.7 0.3645 artcdm_a | -4.13318 -3.036 0.002 -98.4 -86.4 0.4819 artcdm_n | 14.45751 0.017 0.986 1.9e+08 36961.7 0.4091 delegates | -0.14649 -1.474 0.140 -13.6 -78.1 10.3794---------------------------------------------------------------------- Vuong Test = 5.44 (p=0.000) favoring ZIP over PRM.---------------------------------------------------------------------- b = raw coefficient z = z-score for test of b=0 P>|z| = p-value for z-test % = percent change in odds for unit increase in X %StdX = percent change in odds for SD increase in X SDofX = standard deviation of x
Among the Parties generally being able to participate in the submission process, for everyadditional delegates, the number of submissions of a Party increases by 1.7 %. Therefore, thehypothesis relating to the influence of delegation size on the number of submissions issupported. However, the delegation size seems to play a rather small role for the participationof Parties in the submission process on LULUCF. The latter finding, which is rathersurprising, shows that if a Party feels that an issue is important, it is able to contribute to thenegotiations, even if its delegation size is relatively small.33
Among those generally not submitting text proposals to the UNFCCC process (Always Zerogroup), the only significant influence is exerted by the variable being “against” (as comparedto being “in favor”) of sinks in the CDM. Consequently, opposing sinks in the CDMdecreases the odds of belonging to the group normally not participating in the submissionprocess by 98% relative to the sink supporters.
6. Summary and conclusion
The negotiation on sinks in the Kyoto Protocol has been one of the most complicated andcontentious issues in the history of climate change negotiations. Since most Parties werelacking knowledge on the issue when coming to COP 3 in Kyoto, a basis on which to takedecisions regarding LULUCF were missing. Most of the Parties which had taken a strongposition at Kyoto in 1997 remained with it in the negotiation on additional sinks activities 33 Small countries join to negotiation coalitions like the one of AOSIS to take advantage of economies of scale.Some submissions in our data set are not individual submissions by one country, but proposals elaborated by awhole negotiation group.
19
afterwards, while the majority of developing countries, mostly unaware about the issue whencoming to Kyoto, had moved to the group opposing additional sink activities afterwards.Regarding sinks in the CDM, however, the Annex I sink supporters were joined by arelatively big coalition of developing countries interested in attracting CDM forestry projects.A multinomial logit regression is conducted to test two hypothesis regarding factorsinfluencing Parties´ negotiation position on LULUCF. The results do not support that theimportance of the forestry sector of a country has a significant influence on the countries´negotiating position on LULUCF. They, however, suggest that the LULUCF issue was usedby those Parties with a rather negative attitude towards international climate policy to reducetheir Kyoto reduction targets. The countries holding a higher number of “Fossil-of-the-DayAwards”, which is supposed to represent the general attitude towards international climatepolicy, have a strongly increasing probability to have supported the inclusion of sinks in theclimate regime. In choosing their negotiating position regarding sinks in Article 3, Annex IParties seem to have been motivated by the amount they were able to reduce their reductiontarget due to sinks. Interestingly, though, it have been rather those countries with strictertargets which have the highest probability of opposing sinks in Article 3, while the probabilityof belonging to the sinks supporters is only slightly increasing with the stringency of thetarget. The general attitude towards climate policy seems to have been a major driving forcefor the Parties pushing for sinks, while the rationale to reduce the reduction target played animportant, but smaller role in determining the pro-sink positions. Regarding the inclusion offorestry projects in the CDM, Parties were increasingly “in favor” and decreasingly “against”with a growing distance to target. However, for the issue of forestry in the CDM, theinfluence of the general attitude towards international climate policy is unclear, since anincrease in this variable leads to an increase in the odds of supporting as well as opposingsinks. An important variable able to contribute more to the explanation of the main reasonsfor positions on sinks in the CDM might be the benefits or losses encountered by Parties dueto the introduction of forestry in the CDM. Since no data on CDM potentials is available forall the Parties included in our analysis, this paper is not able to answer how much this factorcontributed to the choice of negotiating position on the issue.A second part of the paper, analyzes two hypothesis relating to the participation of Parties inthe submission process by applying a zero-inflated Poisson model. For those Parties havingtaken a pro-sink position on Article 3.4, results suggest that sinks supporters have been moreactively participating in the submission process, while the exact opposite seems to be the casefor the Parties being “in favor” of forestry projects in the CDM. The countries opposing sinksin the CDM obviously tried to inhibit a broad inclusion of sinks by influencing the negotiationoutcome on a technical level.The last hypothesis stipulating that Parties with bigger delegations tend to provide a highernumber of submissions is supported by the results of the zero-inflated Poisson model,although the influence of the delegation size on the number of submissions is found to berather modest. Thus, active participation seems to be less a question of negotiation resourcesbut rather of how much a Party is interested in an issue.Although, all the Parties have one vote in the climate change negotiations, in realitynegotiation power is distributed quite unequally. Since the LULUCF issue touches the basicstructure of the climate change regime, namely the size of reduction commitments (Article 3)and the compliance costs (CDM), our analysis of LULUCF positions can be seen as arepresentative picture of the constellation of countries in the regime. It raises the question ofhow far climate policy at the international level will be able to go ahead if this constellation ofinterest remains.Regarding the future development of the regime, it can be suspected that a coalition of Partiessimilar to the ones supporting LULUCF will try to introduce further sequestration options,including ocean and geological sequestration. If the negotiations on targets for a second
20
commitment period will start in 2005 as foreseen, then Parties should have learned theirlessons from the negotiation on LULUCF. These lessons include the knowledge that agreeingon targets before the detailed rules are fixed will lead to a renegotiation of targets on the basisof bending the rules at later stages. Furthermore, all Parties should be well prepared onimportant issues to avoid having to take decisions without sufficient information, as happenedat COP 3 in Kyoto, so that they will be able to negotiate on more equal grounds. If someParties are given a first mover advantage, the others will not be able to react until they cangather some knowledge on the issue by themselves. While LULUCF has been said to havefunctioned as the “valve” of the system which kept certain countries on board, futureconstructions of the climate regime – whatever it may look like – should build the valve insuch a way that the amount of air able to escape will be limited enough to guarantee theenvironmental integrity of the regime.
21
References
Agresti (2001): Categorical Data Analysis, Second Edition, John Wiley & Sons, Inc.,Hoboken, New Jersey.
Anderson, David; Grant, Robert; Rolfe, Chris (2001): Taking credit. Canada and the role ofsinks in international climate negotiations, Vancouver
Depledge, Joanna (2001): The organization of the Kyoto Protocol negotiations: Lessons forglobal environmental decision-making. Ph.D. thesis, University College London, Departmentof Geography
Depledge, Joanna (2000): Tracing the origins of the Kyoto Protocol: an article-by-articletextual history, FCCC/TP/2000/2, Bonn
FAO (2003): State of the World's Forests 2003. FAO, Rome
Fry, Ian (2002): Twists and Turns in the Jungle: Exploring the Evolution of Land Use, Land-use Change and Forestry Decisions within the Kyoto Protocol. Reciel 11 (2), pp. 159-168
Grubb, Michael; Farhana,Yamin (2001): Climatic collapse and The Hague: what happened,why, and where do we go from here? International Affairs 77, 2 (2001) 261-276
IEA (2003): CO2 emissions from fuel consumption, highlights 1970-2000, IEA, Paris
IPCC (2000): Land Use, Land-Use Change, and Forestry. Watson, R.T., I.R. Noble, B. Bolin,N.H. Ravindranath, D.J. Verardo, and D.J. Dokken, eds. A Special Report of the IPCC.Cambridge University Press, Cambridge, UK.
Jung, Martina (2003): The role of forestry sinks in the Clean Development Mechanism,HWWA Discussion Paper 241
Jung, Martina; Michaelowa, Axel; Nestle, Ingrid; Greiner, Sandra; Dutschke, Michael (2004):Common Policy on Climate Change: Carbon Sinks, Domestic Stakeholders, and E.U. ForeignPolicy. In: [Harris, Paul G. (ed.) ], Global Warming and European Foreign Policy (2004),forthcoming, St. Martin´s Press, New York.
Long, J. Scott (1997): Regression Models for Categorical and Limited Dependent Variables.Advanced Quantitative Techniques in the Social Science. SAGE Publications, ThousandOaks, London, Delhi
Long and Freese (2003): Regression Models for Categorical Dependent Variables using Stata.Revised Edition. Stata Press Publication, College Station Texas.
Menard, Scott W. (2001): Applied logistic regression analysis. Series QuantitativeApplication in the Social Science 106, SAGE Publications, Thousand Oaks, London, Delhi
22
Michaelowa, Axel; Lehmkuhl, David (2004): Interest groups in the negotiation process of theUnited Nations Framework Convention on Climate Change (UNFCCC) from 1991 to 2002: Aquantitative analysis of stakeholder participation, in: Fort, Bertrand (ed.): Finding the pathfrom Johannesburg, Asia-Europe Foundation, Singapore, p. 88-104
Oberthür, Sebastian; Ott, Hermann (1999): The Kyoto Protocol, Springer, Heidelberg
Ott, Hermann (2001): Climate change: an important foreign policy issue. International Affairs77, 2 (2001) 277-296
Powers, Daniel A.; Xie, Yu (2000): Statistical methods for categorical data analysis.Academic Press, San Diego, London.
UNFCCC (1992): United Nations Framework Convention on Climate Change
UNFCCC (1995): Report of the Conference of the Parties on its first session,FCCC/CP/1995/7/Add.1, 6 June 1995
UNFCCC (1997a): Report of the Ad Hoc Group on the Berlin Mandate on the work of itssixth session. FCCC/AGBM/1997/3/Add.1, 22 April 1997
UNFCCC (1997): of the Ad Hoc Group on the Berlin Mandate on the work of the second partof its eighth session. FCCC/AGBM/1997/8/Add.1, FCCC/AGBM/1997/8/Add.1, 2December 1997
UNFCCC (1997): Response from Parties on issues related to sinks.FCCC/AGBM/1997/MISC.4, 18 November 1997
UNFCCC (1997): Response from Parties on issues related to sinks.FCCC/AGBM/1997/MISC.4/Add.1, 24 November 1997
UNFCCC (1997): Response from Parties on issues related to sinks.FCCC/AGBM/1997/MISC.4/Add.1, 27 November 1997
UNFCCC (1997): Compilation of responses from Parties on issues related to sinks,FCCC/AGBM/1997/INF.2, 29 November 1997
UNFCCC (1997): Compilation of responses from Parties on issues related to sinks,FCCC/AGBM/1997/INF.2, 29 November 1997
23
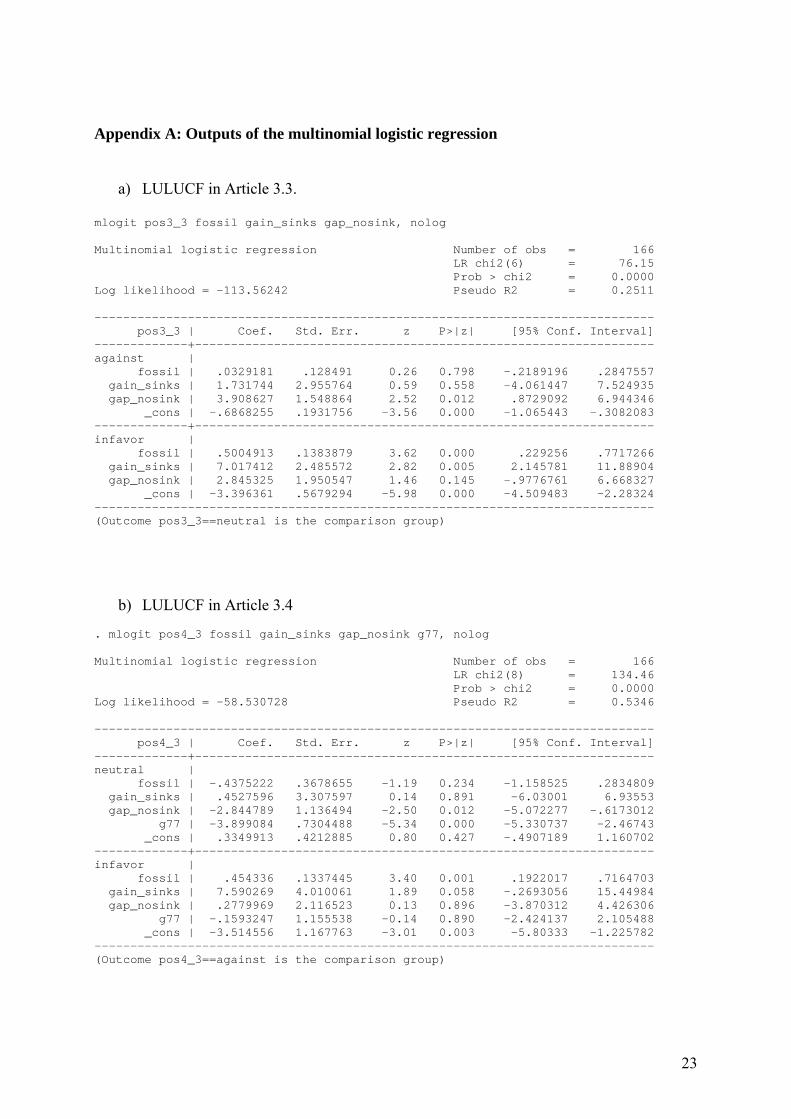
Appendix A: Outputs of the multinomial logistic regression
a) LULUCF in Article 3.3.
mlogit pos3_3 fossil gain_sinks gap_nosink, nolog
Multinomial logistic regression Number of obs = 166 LR chi2(6) = 76.15 Prob > chi2 = 0.0000Log likelihood = -113.56242 Pseudo R2 = 0.2511
------------------------------------------------------------------------------ pos3_3 | Coef. Std. Err. z P>|z| [95% Conf. Interval]-------------+----------------------------------------------------------------against | fossil | .0329181 .128491 0.26 0.798 -.2189196 .2847557 gain_sinks | 1.731744 2.955764 0.59 0.558 -4.061447 7.524935 gap_nosink | 3.908627 1.548864 2.52 0.012 .8729092 6.944346 _cons | -.6868255 .1931756 -3.56 0.000 -1.065443 -.3082083-------------+----------------------------------------------------------------infavor | fossil | .5004913 .1383879 3.62 0.000 .229256 .7717266 gain_sinks | 7.017412 2.485572 2.82 0.005 2.145781 11.88904 gap_nosink | 2.845325 1.950547 1.46 0.145 -.9776761 6.668327 _cons | -3.396361 .5679294 -5.98 0.000 -4.509483 -2.28324------------------------------------------------------------------------------(Outcome pos3_3==neutral is the comparison group)
b) LULUCF in Article 3.4
. mlogit pos4_3 fossil gain_sinks gap_nosink g77, nolog
Multinomial logistic regression Number of obs = 166 LR chi2(8) = 134.46 Prob > chi2 = 0.0000Log likelihood = -58.530728 Pseudo R2 = 0.5346
------------------------------------------------------------------------------ pos4_3 | Coef. Std. Err. z P>|z| [95% Conf. Interval]-------------+----------------------------------------------------------------neutral | fossil | -.4375222 .3678655 -1.19 0.234 -1.158525 .2834809 gain_sinks | .4527596 3.307597 0.14 0.891 -6.03001 6.93553 gap_nosink | -2.844789 1.136494 -2.50 0.012 -5.072277 -.6173012 g77 | -3.899084 .7304488 -5.34 0.000 -5.330737 -2.46743 _cons | .3349913 .4212885 0.80 0.427 -.4907189 1.160702-------------+----------------------------------------------------------------infavor | fossil | .454336 .1337445 3.40 0.001 .1922017 .7164703 gain_sinks | 7.590269 4.010061 1.89 0.058 -.2693056 15.44984 gap_nosink | .2779969 2.116523 0.13 0.896 -3.870312 4.426306 g77 | -.1593247 1.155538 -0.14 0.890 -2.424137 2.105488 _cons | -3.514556 1.167763 -3.01 0.003 -5.80333 -1.225782------------------------------------------------------------------------------(Outcome pos4_3==against is the comparison group)
24
c) LULUCF in the CDM
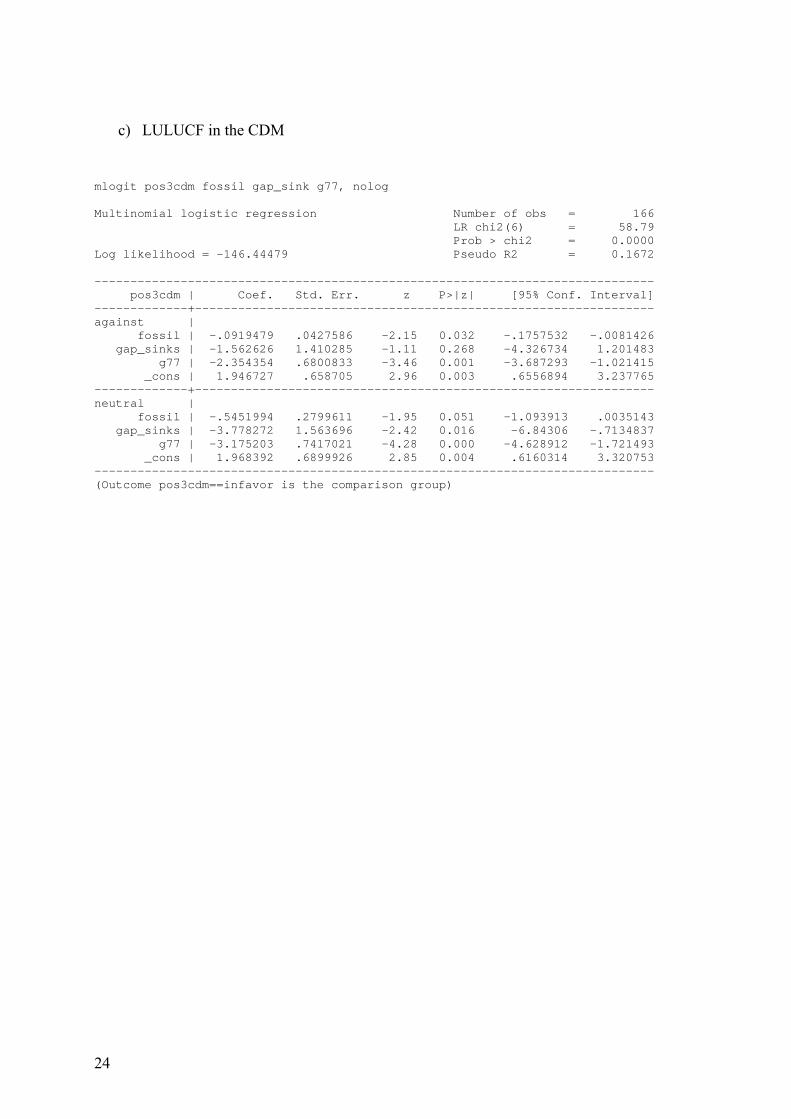
mlogit pos3cdm fossil gap_sink g77, nolog
Multinomial logistic regression Number of obs = 166 LR chi2(6) = 58.79 Prob > chi2 = 0.0000Log likelihood = -146.44479 Pseudo R2 = 0.1672
------------------------------------------------------------------------------ pos3cdm | Coef. Std. Err. z P>|z| [95% Conf. Interval]-------------+----------------------------------------------------------------against | fossil | -.0919479 .0427586 -2.15 0.032 -.1757532 -.0081426 gap_sinks | -1.562626 1.410285 -1.11 0.268 -4.326734 1.201483 g77 | -2.354354 .6800833 -3.46 0.001 -3.687293 -1.021415 _cons | 1.946727 .658705 2.96 0.003 .6556894 3.237765-------------+----------------------------------------------------------------neutral | fossil | -.5451994 .2799611 -1.95 0.051 -1.093913 .0035143 gap_sinks | -3.778272 1.563696 -2.42 0.016 -6.84306 -.7134837 g77 | -3.175203 .7417021 -4.28 0.000 -4.628912 -1.721493 _cons | 1.968392 .6899926 2.85 0.004 .6160314 3.320753------------------------------------------------------------------------------(Outcome pos3cdm==infavor is the comparison group)
25
Appendix B: Selection of count model
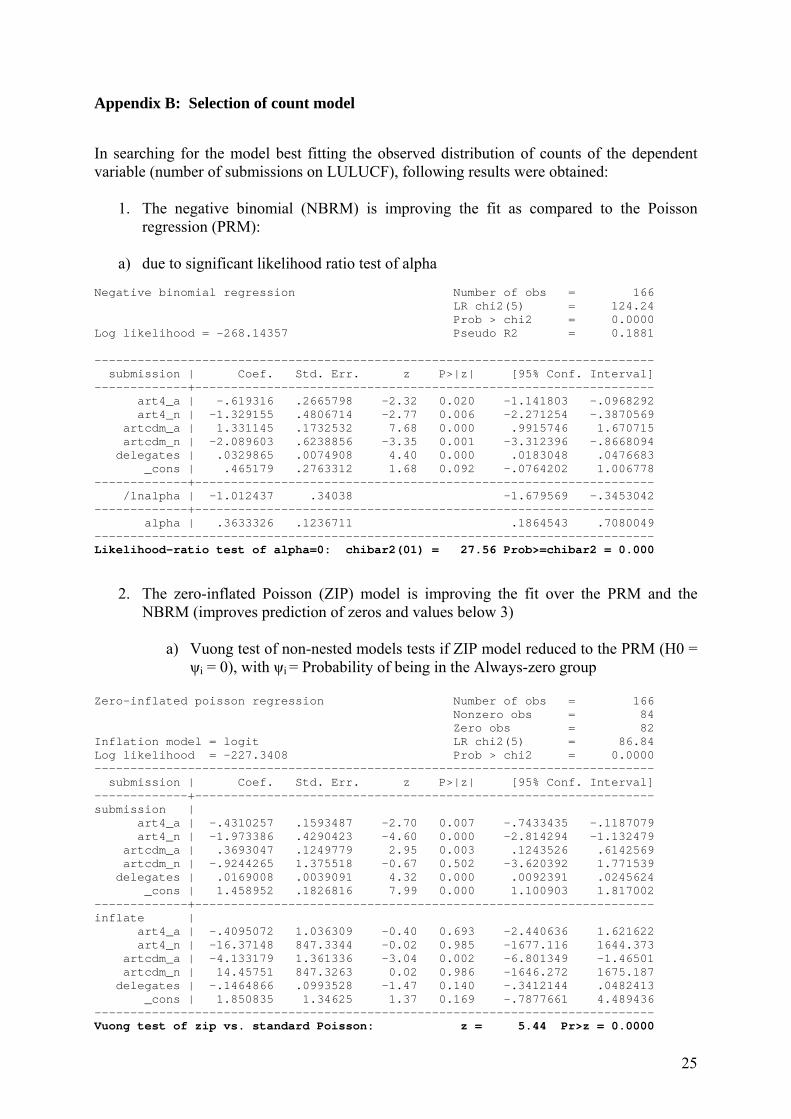
In searching for the model best fitting the observed distribution of counts of the dependentvariable (number of submissions on LULUCF), following results were obtained:
1. The negative binomial (NBRM) is improving the fit as compared to the Poissonregression (PRM):
a) due to significant likelihood ratio test of alpha
Negative binomial regression Number of obs = 166 LR chi2(5) = 124.24 Prob > chi2 = 0.0000Log likelihood = -268.14357 Pseudo R2 = 0.1881
------------------------------------------------------------------------------ submission | Coef. Std. Err. z P>|z| [95% Conf. Interval]-------------+---------------------------------------------------------------- art4_a | -.619316 .2665798 -2.32 0.020 -1.141803 -.0968292 art4_n | -1.329155 .4806714 -2.77 0.006 -2.271254 -.3870569 artcdm_a | 1.331145 .1732532 7.68 0.000 .9915746 1.670715 artcdm_n | -2.089603 .6238856 -3.35 0.001 -3.312396 -.8668094 delegates | .0329865 .0074908 4.40 0.000 .0183048 .0476683 _cons | .465179 .2763312 1.68 0.092 -.0764202 1.006778-------------+---------------------------------------------------------------- /lnalpha | -1.012437 .34038 -1.679569 -.3453042-------------+---------------------------------------------------------------- alpha | .3633326 .1236711 .1864543 .7080049------------------------------------------------------------------------------Likelihood-ratio test of alpha=0: chibar2(01) = 27.56 Prob>=chibar2 = 0.000
2. The zero-inflated Poisson (ZIP) model is improving the fit over the PRM and theNBRM (improves prediction of zeros and values below 3)
a) Vuong test of non-nested models tests if ZIP model reduced to the PRM (H0 =ψi = 0), with ψi = Probability of being in the Always-zero group
Zero-inflated poisson regression Number of obs = 166 Nonzero obs = 84 Zero obs = 82Inflation model = logit LR chi2(5) = 86.84Log likelihood = -227.3408 Prob > chi2 = 0.0000------------------------------------------------------------------------------ submission | Coef. Std. Err. z P>|z| [95% Conf. Interval]-------------+----------------------------------------------------------------submission | art4_a | -.4310257 .1593487 -2.70 0.007 -.7433435 -.1187079 art4_n | -1.973386 .4290423 -4.60 0.000 -2.814294 -1.132479 artcdm_a | .3693047 .1249779 2.95 0.003 .1243526 .6142569 artcdm_n | -.9244265 1.375518 -0.67 0.502 -3.620392 1.771539 delegates | .0169008 .0039091 4.32 0.000 .0092391 .0245624 _cons | 1.458952 .1826816 7.99 0.000 1.100903 1.817002-------------+----------------------------------------------------------------inflate | art4_a | -.4095072 1.036309 -0.40 0.693 -2.440636 1.621622 art4_n | -16.37148 847.3344 -0.02 0.985 -1677.116 1644.373 artcdm_a | -4.133179 1.361336 -3.04 0.002 -6.801349 -1.46501 artcdm_n | 14.45751 847.3263 0.02 0.986 -1646.272 1675.187 delegates | -.1464866 .0993528 -1.47 0.140 -.3412144 .0482413 _cons | 1.850835 1.34625 1.37 0.169 -.7877661 4.489436------------------------------------------------------------------------------Vuong test of zip vs. standard Poisson: z = 5.44 Pr>z = 0.0000
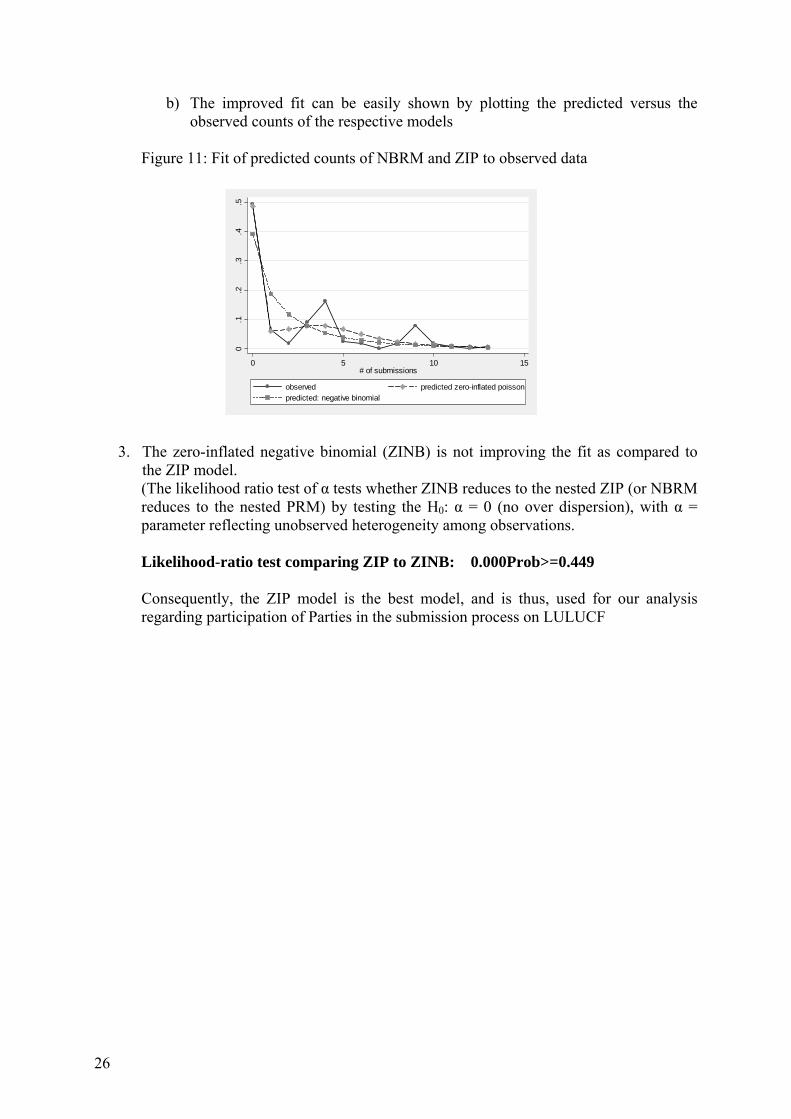
26
b) The improved fit can be easily shown by plotting the predicted versus theobserved counts of the respective models
Figure 11: Fit of predicted counts of NBRM and ZIP to observed data
3. The zero-inflated negative binomial (ZINB) is not improving the fit as compared tothe ZIP model.(The likelihood ratio test of α tests whether ZINB reduces to the nested ZIP (or NBRMreduces to the nested PRM) by testing the H0: α = 0 (no over dispersion), with α =parameter reflecting unobserved heterogeneity among observations.
Likelihood-ratio test comparing ZIP to ZINB: 0.000Prob>=0.449
Consequently, the ZIP model is the best model, and is thus, used for our analysisregarding participation of Parties in the submission process on LULUCF
0.1
.2.3
.4.5
0 5 10 15# of submissions
observed predicted zero-inflated poissonpredicted: negative binomial