Embed Size (px)
Citation preview

THE HOME ENVIRONMENT AND
EDUCATIONAL MOTIVATION AND ACHIEVEMENT
Valerie Miller
CSDS Research Report No. 3

THE HOME ENVIRONMENT
AND
EDUCATIONAL MOTIVATION AND ACHIEVEMENT:
A THREE GENERATION HOUSEHOLD STUDY
Valerie Mil ler
Centre for Social and Development Studies
University of Natal
Durban
1994
Report prepared for the Co-operative Research Programme : South African Youth
The Centre for Social and Development Studies was established in 1988 through the merger of the Centre for Applied Social Science and the Development Studies Unit. The purpose of the Centre is to focus university research in such a way as to make it relevant to the needs of the surrounding developing communities, to generate general awareness of development problems and to assist in aiding the process of appropriate development planning.
ISBN NO: 1-86840-069-7

LIST OF CONTENTS Page
Executive summary iv Acknowledgements vii
THE RESEARCH BRIEF 1 The three generation household 1 The organisation of this report 3 Method 3 The sample 5 Theoretical underpinnings 7 Limitations of the study 8
FINDINGS
SCHOOLING AND THE SCHOOL ENVIRONMENT 11 Schools 11 Perception of standard of school 12 Educational attainment 12 Regular school attendance 12 Educational motivations: Assessment of school life 14 Motivating factors 14 Frustrating factors 1 5 Demotivation 16 Attitudes towards school boycotts 17 Educational aspirations 18 School marks 18 Subjective assessment of achievement 19 Recommendations for improving school performance 19 Perceptions of factors which influence success in school 20
SCHOOLING IN THE HOME ENVIRONMENT: FAMILY INPUTS IN EDUCATION 33 Adult influence on school performance 34 Supportive family roles in education 34 Study habits 35 Homework patterns 36 Motivation 39
i

Page
FAMILY SOLIDARITY 45 Affect 45 Contact 46 Consensus 47 Exchanges 47 An assessment of family life 49 Complaints about family life 49 Pride in the family 50
CULTURAL VALUES 60 The role of parents as buffers 60 The role of parents as decision makers 61 Cultural values 61 Educational values 62 Findings 63
DISCUSSION AND CONCLUSIONS: TOWARDS AN INTEGRATED SUPPORT SYSTEM FOR HIGH SCHOOL PUPILS 82
SELECT BIBLIOGRAPHY 82
APPENDIX 84
ii

LIST OF TABLES Page
1. Education indicators 22 2. Rewarding aspects of school life 24 3. Frustrating aspects of school life 26 4. Demotivation 28 5. Attitudes to school boycotts 28 6. Educational aspirations 29 7. Recommendations for improving pupil performance 30 8. Perceived factors influencing success in school 31 9. Adult influence on school performance 32
10. Family inputs in education 41 11. Study habits 42 12. Homework patterns 43 13. Family solidarity indicators 54 14. Major complaint about family life 57 15. Main reason for being proud of family 58 16. Attitudes and values 69
APPENDIX
Household characteristics 85
Individual characteristics:
Religion 88 Marital status 88 Rural-urban background 88 Quality of life indicators 89 Social integration indicators 90
iii

EXECUTIVE SUMMARY Three hundred households in Soweto and Durban townships participated in a study designed to explore the possible influence of the home environment and family life on attitudes to schooling and educational achievement. The sample consisted of three-generation households in which 150 male and 150 female high school pupils were living with one or both parent{s) and grandparent(s). The three-generation extended household was chosen as the optimal model for family support. The survey was carried out towards the end of the school year in 1992.
Given the small sample size the survey rates as a case study. Findings cannot be generalised indiscriminately. However results can suggest directions for policy planning and intervention.
Three persons in each household gave personal interviews yielding a total sample size of 900. The items put to the youth on the family were the same as those put to the designated parent and grandparent. In addition, demographic information on all members of the household was compiled. The unique survey design allows for special insights into intergenerational relations and exchanges and opinions. Information was obtained on the schooling of the youth in the family, as well as on aspects of home life and family solidarity and values.
Preliminary findings indicate that pupils with supportive families were more likely to give a positive evaluation of their school and school life. Youth from harmonious family backgrounds liked going to school and achieved better results. Pupils attending good schools according to family ratings and participating in extra-curricular classes achieved higher grades in their mid-term examinations.
The study produced the following pointers for consideration when planning policy and intervention: o Families transmitted values and reference norms which have a positive
influence on educational motivation. Families agreed that academic achievement rests mainly with the pupils themselves; hard work and perseverance is the key to success in education.
o Positive morale and self-esteem, which was more prevalent in cohesive families, appears to facilitate educational motivation and achievement. Youth over 17 years were more disillusioned about their future prospects than younger youth.
o The value of education is perceived to be an extrinsic one. Youth viewed going to school and doing homework as means-to-an-end activities to achieve longer-term goals.
iv

o Although parents foster the intrinsic value of education, i.e. the love of learning, few high school pupils participate in educational activities purely for fun and enjoyment. Perseverance and hard work are the recipes most in favour among the youth for success in education.
o The positive influence of family solidarity may be related to the norms of firm guidance, sense of discipline and mutual respect. These values are practised in everyday family life.
o Family solidarity was associated with greater social tolerance, the kind of broadmindedness which education seeks to achieve.
o The preliminary data analysis found few signs of the 'so-called' generation gap. There was a fairly high consensus between the generations regarding many attitudes and opinions. The expression of solidarity in terms of value consensus may be more pronounced in three-generation than in non-extended families.
o Mothers, grandmothers and siblings typically assume supportive roles in education by taking an interest in progress made at school, assisting with homework, and promoting literacy and the oral tradition. It is probable that the extended family may draw on a larger pool of resources for these support activities. Older youth also look to age peers for educational support, a situation which may interfere with family cohesion.
o There appear to be established homework routines in most households. Parents and grandparents may not always be aware where homework is done, making supervision more difficult.
o Saturday schools which were attended by a substantial minority helped to boost achievement; study groups made little impact. One in two high school pupils belonged to a study group. The reasons underlying the negligible positive influence of studying in groups warrant further investigation.
o Youth attending schools which received a poor rating emphasised the need for better facilities; pupils in the better rated schools called for more extra-curricular activities to improve their school performance.
o Youth identified poor quality teaching and negative attitudes on the part of their teachers as major disincentives to learn. School could not be 'exciting and rewarding' without a positive contribution from teachers. It appears that parents may be less aware of this problem.
o It is concluded that the optimal combination for the positive school experience occurs when pupils like to learn, teachers like to teach, and parents take an
v
active interest in their children's progress at school. Strong cohesive families are better able than weak ones to play their part in this model of co-operation between home and school.
vi

Acknowledgements As with all research one can never manage on one's own. There are a lot of intellectual debts to friends and colleagues. First of all I wish to thank Professor Nathan Caplan, Program Director at the Institute for Social Research, University of Michigan. Nathan Caplan visited South Africa and sowed the seed of an idea to be tested. A year later, Nathan again took time to hear what had become of the idea when I visited him in Ann Arbor.
A debt is also owed to Michael O'Dowd whose Optima paper on education in South Africa was a further source of inspiration.
Dr Mark Elchardus, Vrije Universiteit Brussels, generously agreed to let me attempt a cross-cultural application of his motivational analysis of time use data.
I wish to thank the Steering Committee of the Co-operative Programme on the Youth for allocating the grant to carry out this project. The generous financial assistance of the Co-operative Research Programme on Ageing, the Chairman's Fund Educational Trust and Unilever is gratefully acknowledged.
The following persons shared their expertise and provided assistance in the research process: The field staff of Decision Surveys International carried out the fieldwork under the professional direction of Jennifer Hackney. Jenny's assistance in reducing and refining the instrument was invaluable. Carmen Mayers oversaw the coding and processing of the data. Some of Carmen's handiwork is reproduced verbatim in the tables.
Colleagues at the HSRC in Durban, Dr Jane Kvalsvig and Edmund Pillay exchanged both ideas and data from the Durban Functional Region youth survey. Their efforts in bringing together the youth researchers from the region is much appreciated. Dr Johan Olivier, Manager of the Youth research programme at the Centre for Science Development, and his staff assisted with practical matters and encouragement.
Colleagues in the Centre for Social and Development Studies, Dr Paulus Zulu, Bonga Mlambo, and Bongekile Nxumalo, who are actively involved in youth work and education research in the Durban townships, offered useful advice and shared ideas. Although we certainly did not bias the results in his favour, Paulus Zulu will be gratified to learn that Umlazi and the Saturday schools feature prominently as positive examples in the findings. Nicolette Wells and Judy Ngcobo processed the tables in record time. A special vote of thanks goes to Richard Devey who swiftly produced the first batch of calculations and data overviews as the basis for this preliminary report. I look forward to working with Richard on the next round of inquiry.
vii

Although 1 am most grateful to all the persons mentioned above for making this research task 'exciting and rewarding', I take responsibility for the outcome.

THE RESEARCH BRIEF This study looks into the influence of the home environment on the educational motivation and achievement of black high school children in two townships. Education does not occur in a vacuum. Responsibility for the education of young people in modern industrial society has shifted from the family to the school. During the process of displacement, educationists thought that the school environment would overrule the influence of the home environment. The idea was that schools could compensate for shortcomings of the home environment. However, current educationists agree that the two primary influences in a young person's life, the institutions of the family and the school, must work in tandem if education is to succeed. There needs to be harmony in the relationship between teachers, parents and schoolchildren. A spirit of co-operation is needed between the home and the school. Children need to feel 'at home' in school. Children who feel alienated from the older generation, either teachers or parents, will have greater difficulties adjusting to the requirements of a modern education system and to achieving within the system.
The 1980s saw the disruption of black education as part of the strategy of making the townships ungovernable. At the beginning of the 1990s South African youth have been called back to school. However, the legacy of apartheid has remained. Education in the townships is still in disarray in the 1990s. What is locally referred to as the 'culture of learning' has broken down. The breakdown of education and the culture of learning has had implications for all three parties involved in the education process, the pupils, their parents and their teachers. During the 'liberation before education' movement youth became alienated from their teachers and their families. The gulf between the youth and the older generation became wider. The youth gained control in the upheavals which followed and dominated the fledgling structures which emerged to replace apartheid ones. It is against this background that the research task at hand was conceived.
The focus in this study is on the home environment and its possible influence on the high school child. The home environment is defined very broadly to encompass various social influences. The emphasis is on interpersonal relationships in the family setting.
The three generation household Three hundred three-generation households are involved in the study. The sample drawn for the study is unique. Information on education and family relationships has been obtained from representatives of three generations, high school children, their parents and grandparents.
The three generation household is the prototype of the extended African family. Much has been written about the breakdown of the South African black family as
1

a result of circulatory migration and urbanisation. The fact that the incidence of three generation households is still fairly high is an indication of the strength of the institution. A recent representative sample survey of elderly South Africans reports that some 58 percent of urban blacks over 60 years of age live in three generation households (Ferreira, Mil ler, Prinsloo & Gillis, 1992). Unpublished findings from a representative sample survey of youth 16 to 20 years of age living in the Durban Functional Region indicate that 85 percent live with one or both parents, 12 percent co-reside with one or both grandparents, and 22 percent live in three generation households.1
High school children living in intact three generation families may be more protected than other youth. Township violence has uprooted and displaced many households. The common assumption is that the extended family provides a mutual support system for its members. In the case of school children it is assumed that the support function includes emotional and financial resources which can be invested in the youngest generation's education. This investment is a long term one, which will bear the fruits to support the older generation and the next generation to follow.
There is a possibility that three generation families create other problems in the urban setting. For example, physical constraints such as crowding may create stressful family relationships. The economic advantages of the extended family may be eroded by unemployment. Obviously stress will undermine the positive influence of the home environment. This study explores net support for schoolchildren in terms of assistance and stress.
The study follows the tradition of the three generation family study. The first studies in this tradition were concerned with the top generation, which resulted in the grandparent generation being referred to as Generation 1; G1 for short. We shall follow this convention and refer to the generations in the following sequence:
G1 Grandparent generation G2 Parent generation G3 Schoolchild generation
Three generation studies focus on dyadic relationships between child and parent and child and grandparent with the child-parent dyad occurring twice within the three generation household.
We have made two significant deviations from the conventional three generation studies. Firstly, in contrast to many conventional three generation studies, this study used the schoolchild, G3, as the reference generation. In this study we have limited observations on dyadic relationships to those involving the schoolchild. Secondly, the three generations had to be living under one roof. It is in this sense
2

that the concepts of three generation household and three generation family are used interchangeably in this report. The rationale for restricting the inquiry to the co-resident three generation families was simply the practical consideration that it would be too difficult to measure the influence of non-resident members of the family on daily lifestyles.
The study looks into multi-generational assessments of the schoolchild's motivation and achievement, study habits and intergenerational family solidarity. The concept of family solidarity (Mangen et aL, 1988) is multifacetted and can be described in terms of family structure, contacts, affection, agreement on basic values, interactions and exchanges.
The organisation of this report The method used to collect information is given below, followed by a description of the sample. A brief introduction is given to the theoretical orientation of the study. The shortcomings of the study must be borne in mind if the interpretation of the findings is to lead to conclusions which are useful for policy planning and practical intervention purposes.
The findings are presented under the four headings: Education, home environment, family solidarity, and social values. A last section inquires into the links between factors related to the home environment and family solidarity on the educational motivation and achievement of the high school child. Owing to time constraints, this report gives only preliminary findings from the study.
Method A mixture of quota-controlled and random sampling procedures were applied to select 300 three-generation households in six areas of Soweto (Pimville, Dube, Moroka, Orlando East, Diepkloof, and Dobsonville) and in Durban's Umlazi and KwaMashu townships. Four randomly selected starting points were used in each area of Soweto, and eight in each of the two Durban townships. Interviewers moved from these points in search of households which met the quota requirements of male and female high school children with co-resident parents and grandparents. Personal interviews were conducted with a representative of the high school child (G3), the parent (G2) and the grandparent (G1) generation, resulting in a sample size of 3 x 300 = n 900 individuals. Where available, the same-sex parent and grandparent were interviewed.
Interviews were conducted in the respondents' homes. Fieldworkers interviewed respondents on their own as far as was feasible.
The survey instrument consisted of three questionnaires:
The screening interview was conducted with a contact person for the household. The schedule used for the screening covered demographic information on the
3

household and all its members. The demographic data contain information on the structural dimension of family solidarity.
The main interview was conducted with G1, G2, and G3 individuals in the household. Items covered in the main interview included educational achievement and motivation, study habits and aspects of family solidarity other than the structural dimension which had already been covered in the screening interview. Three generation household studies usually focus exclusively on dyadic, interpersonal and intergenerational relationships. Apart from core family values, the content of values explored in these studies is usually left open. For purposes at hand, educational values, conservatism and authoritarianism and social tolerance were included in the list. Self-esteem and personal efficacy (locus of control) - factors which are claimed to have a bearing on study habits and educational achievement - made up an additional set of items.
A unique feature of the survey is that essentially the same items were put to the representatives of three generations. Items were suitably rephrased for each generation level.
At the end of the main interview session the interviewer left a diary with the respondents for them to complete on a specified weekday (Monday to Thursday). The members of the same household recorded the events of the same day, thus the diaries placed with each household capture the events of one day from the perspective of three generations. Respondents were asked to make a written or mental note of the activities of the day, times of starting and finishing activities, as well as details of where and with whom the events took place. A diary schedule was placed with respondents as an aide memoir. The prompt sheet indicated 15 minute time intervals on the left hand margin and provided space to note the activities of the day and the details of where and with whom they took place. The majority of the respondents made use of the diary sheets.
The ' tomorrow' diary is a standard time budget technique that has been applied successfully in a wide variety of settings. Time use research experts regard the free-flow 'tomorrow' diary, which allows respondents to describe the daily round of events in their own words, as the most accurate means of collecting time use data. The technique was also considered the most appropriate one for the South African setting. The method caters for the age-graded sample. Earlier research in the local context had proved the method to be workable among both literate youth and semi-literate older adults.
The interviewer collected the diaries the following day or as soon as technically feasible. In the follow-up interview the interviewer reviewed the events of the diary day with the respondent to make sure all details had been recorded, and asked for additional information on motivations underlying the events, and an evaluation of the day.
4

The events of the day were categorised according to the standard scheme used in the classical Multinational Survey (the Szalai scheme) to ensure international comparability. Activities focusing on educational events were categorised in greater detail to meet the needs of this study. Following recommendations of the International Association for Time Use Research, the categories developed to capture local events can be reduced to the conventional 35-40 and 10-14 category schemes used for international comparative purposes.
The standard questionnaire schedule consisted of open- and closed-ended items. The questionnaire schedule, which was piloted prior to commencement of the survey, was available in English, Zulu, and Sotho. Respondents were interviewed in the language of their choice. Responses were recorded in separate questionnaires for each respondent. The households in the survey were presented with a token gift in appreciation of their participation in the study. A joint gift to the entire household can be seen to be in keeping with the notion of family solidarity.
The fieldwork was undertaken by Decision Surveys International (DSI), a professional social research organisation in Johannesburg. Interviews were conducted by trained investigators in the employ of DSI. Prior to the commencement of the study, field workers were thoroughly briefed by the senior professional in charge of the project who worked closely with the author in finalising the survey instruments. Fieldwork commenced on October 3, 1992 and was completed by 17 October, 1992. The field work was monitored throughout the survey to ensure uniformity of approach in the two survey sites. Questionnaires were checked daily and a ten percent quality control was applied.
The data was coded by DSI and processed on their IBM 4341 Model 2 main frame computer. The data was then transferred to the University of Natal computer for further statistical analysis.
The sample The sample characteristics are given in the Appendix. Only characteristics which are of particular relevance for the reporting to follow will be highlighted here. As mentioned under the methods heading, households in the study are distributed evenly between Soweto and Durban. The majority of households have Zulu as their home language. The majority of households are well established in their current residential circumstances. Households are fairly large with an average of 8 to 9 persons. This result supports the notion that the three generation extended family may be more common in well established residential areas while the shack areas cater for the smaller families.
The generation status of all members of the 300 households was identified, so that the social characteristics of the 900 key participants in the main survey could
5

be compared with the total population of the 300 households. The median ages of the key individuals in the survey were, 17 years for the school child generation, 38 years for the parent generation, and 66 years for the grandparent generation. These ages compare favourably with the total household population. The schoolchild subsampie is divided evenly into young men and women by quota definition. The parent and grandparent generations were mainly female, significantly more so than the total household population.
Referring to the 900 key respondents, approximately half of the key G3 high school pupils were single without a steady boyfriend, the remainder had a steady boyfriend. Half of the G2 females were single, half of the G2 males were married. The incidence of divorced or separated parents was 11 percent for the men and 15 percent for the women in the G2 subsampie. Sixty percent of the males in the grandparent subsampie were married, 72 percent of the women were widowed.
Among the 900 key respondents, 78 percent of the G2 parents had grown up in town. Over half of the G1 grandparents in the study had grown up in the rural areas.
Fourteen percent of the G2 key parent respondents and 58 percent of the key G1 grandparent respondents were heads of households. Noteworthy is the preponderance of the headship with the top generation and males. For example, in the total household sample 76 percent of persons identified as grandfathers to G3 respondents were heads of households, 54 percent of grandmothers, 39 percent of fathers, and 7 percent of mothers. Due to women outnumbering men in the top generation, grandmothers to G3 accounted for headship in 52 percent of the 300 households in the study.
The household data shows the rapid progression in access to formal education by generation. In the top generation one fifth to one quarter had received no education and less than 5 percent had achieved post matric qualifications. In the middle generation most had primary, and up to one quarter had attained post-matric qualifications.
In the total household population, between 60 and 73 percent of men and women in the top generation were pensioners or retired. Noteworthy is the fact that one quarter of the men in the top generation were employed full-time. In the middle generation 43 percent of men and 47 percent of women were employed full-time, and 42 percent of men and 32 percent of women were unemployed. The rate of employment was higher for the 300 key G2 parents than for the middle generation as a whole.
According to characterisations obtained from the key respondents, the majority of households were 'making ends meet but had no luxuries'. This description fitted
6

the interviewer's assessment of the socio-economic levels of households in the sample. Sixty-four percent of the 300 key youth, but only 47 percent of the key respondents in the parent and grandparent generations, indicated that they were satisfied with their life as a whole. Similarly, significantly higher proportions of the youth (63 percent - 73 percent) than of their parents (41 percent - 52 percent) and grandparents (35 percent - 42 percent) felt their lives were 'rewarding', 'exciting' and 'getting better'. Optimism decreased progressively with each generation from grandchild to grandparent.
The vast majority of the key respondents in the child and parent generations were healthy. Two thirds of the top generation respondents indicated that they were fit and healthy relative to their age.
Concerning social integration, approximately four in five of the key respondents at each age level had a confidant and one in four was a club member. The majority of the households belonged to mainstream Christian churches including the Catholic church. Substantial minorities were members of African independent churches and Pentecostal churches.
Theoretical underpinnings The direction of this research has been influenced by three distinct strands of literature and intellectual endeavour. This report makes no attempt to do justice to the rich literature on the subject of educational achievement. This might be attempted in a later publication. The review which follows highlights the themes in the literature which shaped the survey instrument and its interpretation.
1. Educational achievement. The literature is vast and it was necessary to be selective in reading for this study. The idea for the research came from the Caplan, Whitmore and Choy (1989) study of educational achievement among the boat people in America. Three factors stood out as decisive for the rapid progress which immigrant schoolchildren made in US schools. Family values which were compatible with the 'American dream', a supportive home environment, and sheer hard work on the part of the schoolchildren led to their success in the American education system.
2. The African American educational experience. The experience of the boat people appeared to be far removed from the situation of township youth in South Africa. The past and current situation of black schoolchildren in US ghettos appeared to be more relevant to the local situation. Of all immigrants to the United States, the African sector of the population started off with the highest level of discrimination and apparently have made the least socio-economic progress. Nevertheless, from an historical perspective, considerable educational achievement has been made. The history of black Americans contains themes which are similar to South
7

African ones. Oppression, limited access to education, and inferior education are experiences which black US schoolchildren share with their South African counterparts. The effects of slavery and emancipation on African American family structure and values may be vaguely similar to those of the migrant labour system and the restrictions of apartheid on the local black family structure and values. Therefore the history of the advancement of African American youth was drawn upon. Here historians have recorded that advantage breeds advantage. For example, black Americans who entered the mainstream came predominantly from relatively advantaged groups, such as the freed slaves, who were urbanised and had better access to education before other groups of blacks became emancipated.
3. Intergenerational relations. Another strand in the literature places emphasis on family tradition and the values passed on from one generation to the next. The notion of continuity or steady advancement in education through family lineages suggested the focus on an intergenerational study. The educational status of parents, in particular the mother, has been considered a critical variable for educational motivation and achievement. Pre-school socialisation is often in the hands of the women in the household. The role of the grandmother has often been considered a crucial one in the upbringing of local African children. All these points suggested the three generation emphasis of this study. The co-resident township family was selected as the target group to eliminate the need to consider additional co-factors.
Limitations of the study The unique survey design has drawbacks as well as advantages. Although the study includes information on 900 respondents, and limited household data pertaining to some 2555 persons, it is a cluster sample of 300 urban households. The cluster data yields special insights into household interactions. However, given the small number of households caution is in order when making generalisations from findings.
For the sake of expedience, results are shown for the total in each age group. It is assumed that the sampling procedures employed yielded a sample in which there is sufficient variation on variables which are critical for family cohesion and educational motivation and achievement to be useful for the purposes of the study.
Given the current situation in South African education and the transition period there are several flaws built into the study. These built-in flaws could hardly be avoided and need to be recognised at the outset in order to assess the value of the study for practical intervention and policy purposes.
8

Flaws One of the fundamental flaws of this study has to do with its timing. South Africa is currently witnessing an education 'crisis'. As noted elsewhere, it is not so much the values of education which are in question as the delivery system. Under these conditions, where education is in disarray, it will be difficult to claim absolute validity for any of the measures of educational success used in the study. In other research contexts proxy measures for educational achievement are IQ scores, aptitude test marks and school marks. In this study we have had to make do with far inferior proxy measures. The project went into the field in the second half of the school year. Therefore mid-term marks were selected as the criterion for academic performance. At the same time we were fully aware that marks given to pupils attending different schools may not be comparable. In some instances where teachers are intimidated by pupils, good marks as a badge of achievement mean very little, unless they are taken as proxy measures of pupil empowerment.
The hard outcome measures pertaining to educational achievement might be considered invalid by some. This group would argue that high school pupils reject the current education system. If the system is considered so flawed, then there is no merit in measuring achievement against invalid criteria. Thus we are working with a built-in f law from the beginning.
A second consideration is that students attending poor schools might be in a better position than others to falsify or manipulate their marks. Therefore it would be futile to compare standards of achievement across schools. However, consider that the pupils who make a mockery of the present examination system by falsifying or extorting marks are actually expressing their desire for educational achievement. In a period which has seen the disintegration of education, the finding that youth profess belief in the value of education, at least as a means to an end, may be considered an important finding in its own right.
Missing values. A related difficulty is missing values for the key dependent variables in the study. Many students have not been tested or informed of the marks for their school-work due to disruptions in the classroom. In view of the fact that there may be no 'hard, objective' measures of academic performance at this time, we have made liberal use of 'softer' outcome measures such as pupil perceptions of academic performance and satisfaction with the school situation. It is true that such measures may be considered mediating factors rather than true outcome variables. Be that as it may, subjective measures of success at school may have greater validity than objective measures in that they may be more sensitive to what is ailing the contemporary South African schoolchild. Without false pretensions of precision the proxy measures used in this study may nevertheless provide useful pointers for practical interventions in education to solve the problem of black underachievement.
9

Response bias. The survey topics of intergenerational relations and education lend themselves to responses biased in terms of social desirability. Respondents may be tempted to answer in a manner which they feel is pleasing to the interviewer or fellow members of the household and to supply the socially or politically correct answers.
The cluster sample situation may have exaggerated the problem. Cluster data always presents the problem of correct interpretation of interdependence between the information supplied by individuals from the same household. Although individuals were interviewed on their own, in some cases limited space in the surveyed homes and social circumstances will have meant that other persons may have listened in. Because the same field worker interviewed all members in one household, he or she may have unwittingly assisted in the process.
We have chosen to interpret all results at face value. Convergence between data pertaining to members of the same household will be interpreted as consensus wi th other members' attitudes and opinions.
There is an interesting twist to the argument put forward here. Consider the following case. If our results are indeed biased towards social desirability, then we would nevertheless know whether or not the social norms and values under study are intact. Given the transitional nature of current South African society, even findings tainted by social desirability would nevertheless pass comment on the current state of alienation and normlessness or the opposite. In other words, the findings would be useful in any case.
We do not wish to make light of these methodological problems of validity and reliability. However, we feel there is no need to abandon the original aims of the study in the face of difficulties. A survey instrument is always a heavy-handed instrument per se. It requires the light touch of subtle interpretation in context. The point we wish to make here is that social scientists are adept at coping with these seemingly insurmountable problems. There is no need to discard data which is not perfect. The challenge is to tread softly.
A key question in the study concerns responsibility for education outcomes. We wish to know where responsibility currently rests for educational motivation or achievement in the eyes of township dwellers. Do the pupils themselves, or the parents as custodians of family and cultural values, or the teachers feel responsible for educational achievement? If the study can comment on this critical question concerning the roles of the key actors in the education endeavour, it will have fulfilled its purpose.
10
FINDINGS
SCHOOLING AND THE SCHOOL ENVIRONMENT In this section we look at variables which describe the school environment, educational attainment (level of education passed relative to age), achievement (proxy measures such as reported marks in mid-year examinations), motivation, aspirations, and personal evaluation of school performance. Most of this information is obtained from the G3 schoolchild. In some instances the same information with respect of G3 is also obtained from the G2 parents and G1 grandparents which allows for intergenerational comparisons. The multiple measures yield insights into possible areas of intergenerational influences on education beyond family status variables, such as socio-economic status, and father's and mother's educational level.
A special section deals with study habits, particularly homework practice. This is one of the areas where the home may have the highest degree of influence. In the township setting, where schooling has been severely disrupted, study at home and extra tuition on offer through Saturday schools and Winter schools play a compensatory rather than a complementary role to the regular contact hours at school.
As a genera! rule, it is thought that high educational achievers have high educational aspirations which are often class related. The educational status of female members of the family are regarded as more telling than those of males. Among US blacks, historians trace educational advancement through the female lineage. For historical reasons, social mobility for black women was related to education, whereas men advanced materially through job migration. A similar case may obtain for black advancement in South Africa where the teaching and nursing professions have been the chief channels for advancement for black women. It is not quite clear whether parental influence derives from socio-economic status or whether family status factors indirectly influence educational aspirations, expectations and achievement through family life styles. Slaughter & Epps (1987) speculate whether socio-economic status may be an indirect measure of atmosphere in the home and child-rearing practices. Factors such as reading in the home, and disciplinary methods tend to be related to social class. In the South African context, rural and urban background of the parents may compete with material advantages in shaping the atmosphere in the home.
Schools G3 respondents attended 143 different schools in Soweto and Durban suburbs. The majority (91 percent) of Soweto pupils were enrolled in Department of Education and Training (DET) schools, a further 7 percent attended private schools, and 1 percent an open school. Eighty-eight percent of the Durban pupils
11
attended KwaZulu controlled schools, 8 percent DET schools, and 2 percent open schools outside KwaMashu and Umlazi. Only two persons from Durban went to a private school and a community run school, respectively (cf. Table 1(1) ).
Perception of standard of school The reference persons in the household were asked to rate the school in which the G3 respondent was enrolled on a five-point scale from 'very good' to 'very poor', with the mid-point described as 'average'. Over 55 percent in each generation rated their school as above average, one-fifth or less as below average (cf. Table 1(2) ). Fifty-eight percent of pupils in KwaZulu schools rated their schools above average, whereas only half of pupils in DET school pupils did so. An exceptionally high 72 percent of Umlazi pupils rated their schools as good compared to between 39 and 52 percent of pupils attending schools in other Soweto areas and in Durban's KwaMashu.
There was high intergenerational consensus regarding the excellence rating of the schools which G3 respondents were attending. There was full agreement in approximately 60 percent of cases, similar views were held in 30 percent of cases, and disagreement occurred in only 10 percent that the school in question was good, poor or average. (Pearsons r, G3:G2 = 0,39; G3:G1 = 0,41).
Educational attainment Approximately equal numbers of G3 respondents were attending school at each high school level from Standard 6 through Standard 10 at the time of survey (cf. Table 1(3) ).
Some 55 percent reported that they had repeated a class at some stage of their educational career (cf.Table 1(4) ).
Further analysis revealed that 61 percent were 'on track' in terms of their educational attainment, that is, attending the right class for their age2. In order to calculate a measure of educational attainment, the reference age was set at 13 years for Standard 6, 14 years for Standard 7 and so forth. The criterion used for being 'on track' was that pupils should be no more than two years older than the reference age.
A higher proportion of male (44 percent) than female (34 percent) pupils were too old for their class at school. However, this difference is not statistically significant. The proportion of 'on-track' high school pupils decreases consistently over the five years of high school. At the Standard 6 level 74 percent of pupils were on track, the percentage was reduced to a significantly lower 42 percent at matric level.
Regular school attendance Only 17 percent indicated that they had been out of school for a period of over two weeks during the past school year, although reference was made throughout
12

the study to disruptions of schooling. The cue used to elicit absence from school may have been misleading. It was not quite clear whether the two weeks referred to two consecutive weeks of school missed or fourteen days over the entire school year. Whichever the case the item tapped only an extreme group (cf. Table 1(5) ).
The major reasons for missing school were external factors, mainly school disturbances caused by pupil and teacher school boycotts, township violence and lack of money for education {Table 1(6) ). External factors, such as unrest, compete with internal factors, such as illness, as disruptive factors in education. Only 3 of 150 female students were out of school because they were pregnant compared to 8 absent due to violence and boycotts. However, illness and pregnancy accounted for 60 percent of female long-term absence from school. In one case family obligations disrupted school. A female pupil said she was out of school for a longer period while she was looking after a relative.
In the case of the pupils who had missed two or more weeks of school, G3 respondents reported that their families had been 'upset or angry' {Table 1{7) ). In fewer cases, parents had been understanding or insisted that schoolwork be made
Four out of five pupils in this group judged the reactions of their parents correctly. The minority tended to overestimate the anger of their parents. Judging only from these few cases it appears that high school pupils judge family reactions to absence from school correctly.
G2 parents and G1 grandparents were asked a general question about how they reacted to their children and grandchildren missing school ('How do you usually react to your child/grandchild missing time at school?'). Over 70 percent stated that they reacted negatively with anger (cf. Table 1(7) ). Between 8 and 9 percent reported that they insisted that school work be made up, a further 6-7 percent said they were understanding. Only a small proportion, but more grandparents (9 percent) than parents(4 percent), reported that they did not notice when their children and grandchildren missed school. Deviating from the fixed response format of the questionnaire, between 7-8 percent said that their children never missed school.
Although numbers are small, judging from the 51 cases of longer term absence from school, parents and grandparents were inclined to be more sympathetic in cases of illness and school boycotts, in some instances expecting only that the work be made up. In the cases of teacher chalk-downs and political violence the reaction was usually one of anger. In the three cases of pregnancy, parents and grandparents stated they were 'angry and upset'.
13

Educational motivations: Assessment of school life All three reference persons in the household were asked to describe G3's experience at school. The perceived rewards gained from education act as reinforcement of educational aspirations and achievements and may be taken as an indicator of educational motivation.
Fifty-six percent of G3 respondents characterised their school life as rewarding and exciting, 31 percent as frustrating and boring (Table 1 (8)). The distribution of the evaluations of parents and grandparents were similar but with a distinct bias towards a positive assessment, indicating that the older generations may not always be sensitive to youthful disappointments in school. Alternatively, youth may not communicate their real feelings about school life to their families.
A higher proportion of positive evaluations was obtained from youth under 17 years, Umlazi, the more affluent families, those attending better schools, and those perceiving their life in general and their family life to be more satisfying.
Pupils who saw their lives in general as rewarding rather than frustrating were also more likely to view school life in similar fashion. However, we are not able to tell from the data, whether general feelings of life satisfaction colour pupils' perceptions of school life, or if satisfaction with school life leads to more general happiness.
Motivating factors. Table 2 gives an overview of the factors which reportedly contribute to satisfaction and frustration with school life from the perspective of the school child, the parent and the grandparent. Spontaneous responses are grouped under several broad headings to give a better overview. The headings are ordered according to the child perspective.
1. Pupil motivation. Pupils indicated that they were gaining in knowledge, found their school work interesting and were making progress at school. Students stressed their belief in the deferred rewards of education as leading to success in jobs or life in general. Some few respondents referred to school as a means of keeping busy or out of trouble.
2. Pupil development. Under this heading students simply qualified their positive assessment of school life by repeating their current liking of, enjoyment of or enthusiasm for school, or by reporting evidence of their motivation to participate fully by working hard. Reference was also made to good marks.
3. Teacher motivation. From the child's point of view school life was exciting and rewarding if their positive motivations were reciprocated. School was more fun if teachers were seen to be performing well, taking an interest in teaching, and
14

showing enthusiasm for their task. The manner in which answers were phrased suggested that pupils were comparing this year's teacher performance with poor performance in the past.
4. Discipline. The fact that discipline was good at their school and schoolchildren were attending classes regularly was cited as positive evidence of rewarding school life.
5. Curriculum. Certain aspects made the school experience more positive. The phrasing of the question with reference to 'exciting' may have elicited this response. Reference was made to extra-mural activities, sports and additional classes. Students attending open schools were pleasantly surprised at the different subject options available to them.
6. Social support. Students commented positively on the social environment at school. Attending school with friends was important. Knowing that assistance from parents or other persons would be forthcoming was gratifying for a few.
7. Facilities. Improvements in school facilities received only a few positive mentions.
Parents and grandparents can only experience school life vicariously through their children. The parents and grandparents in the study appear to gain their insights from observing their children and hearing their reports on school. Parents and grandparents qualified their statements concerning the rewarding school lives of the children in terms of the children's motivation and achievement. Their children and grandchildren were making good progress at school, were enthusiastic or talked a lot about school, and appeared to enjoy going to school and were happy. A further indicator of positive adaptation to school life was seen in factors which we have ordered under the discipline heading. The fact that the children were attending school regularly and were concerned about regular school attendance was cited as evidence of positive motivation.
Frustrating factors. Frustrating factors are shown in Table 3 under six headings.
1. Discipline. A wide range of responses is grouped under this heading. A common theme was that schooling had been disrupted and contact hours with teachers reduced. The different categories which figure under the discipline heading describe the symptoms and identify the source of the disturbance. These included student stayaways, teacher chalk downs, and other action which prevented pupils from attending school. Pupils reported that township violence had been brought into the classroom. The schools were no longer a safe and morally healthy environment. Pupils even carried weapons to school. Teachers and pupils felt
15

threatened by unruly elements inside and outside the schools. Pupils resented the fact that the activities of student organisations interfered with their school periods. The behaviour of pupils and teachers reflected lack of discipline and demotivation. A visible sign of the breakdown of discipline in schools was students out of uniform.
2. Teaching. Pupils stated that they were 'turned off ' by the poor attitudes and incompetence of their teachers. The poor standard of education in township schools was a further frustrating and demotivating factor.
3. Lack of motivation. Some pupils simply qualified their assessment of school life by stating that they could not work up interest or enthusiasm for their school work.
4. Facilities. A small percentage referred to the poor condition of their school, lack of facilities and equipment, shortage of teachers and classroom places.
Factors related to finance and performance were mentioned by a few G3 respondents.
The parent and grandparent viewpoint: As noted earlier in connection with the rewarding aspects of school life, the older generations view school life from a distance and vicariously through the eyes of the schoolchildren. Parents and grandparents were equally concerned with the breakdown of discipline. Responses suggested that parents do not exonerate youth, although their own children might be blameless victims. For example, grandparents were appalled that students threatened their teachers and showed general disrespect towards their elders. Parents and grandparents commented that they saw schoolchildren roaming the streets during school hours, obviously skipping classes. The older generations more than the youth were likely to comment on poor school performance as a sign of frustration. Twice as many youth than parents and grandparents associated the negative school experience with teacher behaviour. This is the most striking difference between the generations.
To sum up: from the perspective of the youth school is frustrating if teachers don't teach and the school environment is not conducive to learning. The breakdown of the regular school routine is experienced as frustrating and demotivating. Elders hold similar views, but are alerted to the manifest signs of the disruption of schooling, and are less appreciative of the crucial role of the teachers in making school fun and rewarding for the youth.
Demotivation G3 respondents were asked if they had ever felt lack of motivation to learn. The question was phrased as a leading one, suggesting that lack of motivation was
16
considered natural and to be expected under certain circumstances. In spite of the leading question, only 29 percent replied in the affirmative (See Table 4).
Qualifications for demotivation were divided into internal and external sources. Internal factors included physical and mental fatigue brought on by heavy workloads at school or at home. Laziness and delay tactics were reported as a natural inclination of students. One youth quoted the nursery rhyme 'all work and no play makes Jack a dull boy' in response to this survey cue.
External factors, such as teacher behaviour and problems in understanding subject material were major demotivators. Distractions, which included spending too much time with friends, watching television, or problems in the home also interfered with intentions to study.
On the whole, the youth in the study exhibited a healthy attitude to their schoolwork. They were serious about their work, but not 'nerds'; they attempted to strike a balance between work and play.
The time budget data yields further information on motivational aspects of learning. For each activity of the diary day, respondents were asked to indicate two reasons for participation from a given list of seven. Reasons included obligation, sense of duty, improved interpersonal relations, means to an end {activities done to achieve another goal), enjoyment/fulfilment, physical need, and to pass the time or prevent boredom. Based on these evaluations a motivation profile was developed for specific types of activities.
Attending school featured 444 times in the 300 diaries kept by the G3 respondents. The majority of pupils who went to school on the diary day described school as a means-to-an-end activity which allowed them to achieve their goals. Substantial numbers stated that they felt obliged/forced to go to school, or perceived it as a duty. Although the number of events {n 10) was very small, a similar pattern obtained for other classes outside regular school hours.
The reason analysis included in the time budgets gives insight into the meaning of attending school in daily life. Results emphasise the instrumental value of education for schoolchildren.
Attitudes towards school boycotts G3 respondents were asked how they felt about school boycotts. There was general consensus regarding the effects of the school boycotts of the 1980s.The vast majority (87 percent) indicated that school boycotts had made it more difficult for young people to resume learning and to complete their education. Only a minority (13 percent) stated that school boycotts had improved the life chances of young people (cf. Table 5).
17

Educational aspirations All generations were asked about their educational aspirations with respect to G3. A Standard 10 and matric exemption was seen as the minimum requirement for G3 to obtain a suitable job. The majority of pupils and parents believed that post-matric qualifications would be necessary to meet job requirements (cf. Table 6).
Superficially seen there appears to be a progressive rise in educational aspirations from the oldest to the youngest generation. This trend is deceptive. One-quarter of grandparents and 10 percent of parents did not know what job their grandchild wanted to take up nor the educational requirements for the job in question. Taking only the substantial responses on educational levels, the difference between the generations is minimal. A clear majority in each generation aspires to post-matriculation qualifications for the schoolchild in the household. The younger grandparents exhibit the higher educational aspirations which are typical of the younger generation. Educational aspirations appear to be higher in the more affluent households. These findings are consistent with those reported in the literature.
School marks Pupils were asked to indicate which subjects they were studying at school and what mid-term marks they had been awarded in these subjects.
Over 23 subjects were represented in the list compiled from the G3 reports. In terms of participation rates, the most important subjects were English (92 percent), Afrikaans (84 percent), Maths (67 percent), Biology (51 percent), History (48 percent), and Business Economics (34 percent). Most pupils were studying an African language. As Zulu was the home language of the majority, the participation rate for Zulu was highest with 57 percent.
Of the 1986 possible marks for the subjects taken, 4,3 percent were not available because students did not write. In a further 3,4 percent of cases students did not know their marks. In 52,7 percent of cases marks were indicated only as a 'pass' or 'fail '. Percentage grades or symbols were stated in 39,5 percent of cases. The pass rates were higher for subjects taken at higher than standard grade.3
The following statistics on mid-term examination results were compiled for the total sample: 5,7% of students did not know their marks 5,7% of students did not write 53% of students were taking 6 subjects 44% of students were taking 7 or more subjects 13% achieved A or B symbols (70 percent-100 percent) for one or more subjects 41% achieved C or D symbols (50 percent-69 percent) for one or more subjects
18

35% achieved an E symbol (40 percent-49 percent) for one or more subjects 59% failed one or more subjects4
37% of Maths/Science students passed both subjects
A measure of overall academic achievement for each G3 pupil was obtained by calculating the ratio of the total number of subjects passed in the mid-year examination to the total number of subjects taken for which the examination result was known. The mean ratio was .83 for the sample as a whole. This indicates that the average pupil taking 6 subjects passed 5 out 6 subjects at mid-term.
Further analysis showed that pass rates varied by subjects. Students of African languages and English were most likely to pass their examinations; students of Maths and physical science subjects and Afrikaans were least likely to succeed.
If subjects are grouped under seven headings, the pass rates were as follows for the total G3 subsample:
African languages 92,9% (n253) English 92,0% (n277) Vocational subjects 86,7% {n 60) Economics, accountancy 85,4% (n220) Social sciences 78,1% (n279) Afrikaans 71,3% (n251) Maths, physical sciences 71,2% (n484)
Subjective assessment of achievement All generations were asked if they were satisfied with G3's school performance. Sixty-eight percent of pupils indicated that they were doing well in school to their liking. Slightly higher percentages of parents and grandparents stated the same view {Table 1(9) ).
Doing well at school is associated with factors such as going to a good school and coming from a more affluent home. Satisfaction with educational performance is also related to life satisfaction and a harmonious family life. These relationships hold at each generational level.
Recommendations for improving school performance All respondents in the survey were asked to name ways of improving G3's performance in school. Results are shown in Table 7.
The youth recommended extra tuition and participation in study groups as a top priority. Noteworthy is that some 87 percent are already participating in extra lessons or in study groups.
19

Further recommendations concerned student and teacher behaviours: Students and teachers must apply themselves; students must study hard and teachers must take their tasks seriously. Educational facilities and the standard of education for black students must be improved. Youth placed special emphasis on the provision of library facilities and textbooks. Youth needed more time to study and assistance and encouragement, including parent inputs, to produce good work. In individual cases financial assistance and a change to a better school were thought to be the optimal solutions.
The list of recommendations compiled by the parents featured the same order of priorities. There was greater emphasis on extra tuition and less emphasis on the quality of teaching and on educational facilities. Parents did not perceive the need for library facilities or for more time to study.
Parents and grandparents focussed their attention on the need to study hard and to participate in extra tuition and study groups. Regular school attendance and pupil discipline ranked second in importance in the list compiled by grandparents. It is also apparent that parents and grandparents take their decision-making role in education seriously. They were more concerned than youth about financing better education for their children and selecting an appropriate school for their child.
Youth attending schools which received a poor rating emphasised the need for better educational facilities (including library facilities and textbooks} and a higher standard of teaching. Some pupils from poor schools saw no option other than a change of school if they were to improve their chances of getting a better education. Pupils from better schools were more likely to call for extra-curricular schooling. Although numbers are small, it is noteworthy that it is mainly pupils from the better schools who perceived parent-teacher communication and co-operation as a high priority.
Perceptions of factors which influence success in school Respondents were presented with a list of factors which could lead to better achievement in high school. Factors ranged from love of learning, to perseverance, advantages in terms of superior instruction, intelligence, natural aptitude, and luck.
All three generations agreed on the following order of importance of success factors (cf. Table 8):
Application ('They study hard') Perseverance ('They try until they succeed') Love of learning Good teachers
Thereafter there was less consensus on the role of 'good schools' and 'intelligence' factors. Pupils attached greater importance than their elders to
20

intelligence and ranked it before good schools. Parents and grandparents emphasised perseverance over intelligence.
In summary, families agree that academic achievement by and large rests with the pupils themselves. Hard work and perseverance is the key to success in education.
NOTES
1 The author is grateful to Jane Kvalsvig, Human Sciences Research Council, Durban, for kind permission to draw on unpublished results from the Durban youth study. The study was conducted for the Co-operative Research Programme on South African Youth.
2 The author wishes to thank Jane Kvalsvig, Human Sciences Research Council, Durban, for suggesting the use of this outcome variable.
3 At higher grade, an 85,5% pass rate was achieved, at standard grade, a 75,4% pass rate. In the case of pupils not knowing whether they were taking subjects at higher or standard grade, the pass rate was 75,4% with the exception of Biology and Economics which were more often taken at higher grade, the distribution of the higher/standard grade distinction was fairly even over all subjects. Therefore, no account was taken of this distinction when calculating average pass rates.
4 Forty percent and higher was taken as the pass mark for the mid-term examinations.
5 The n refers to number of marks reported for each group of school subjects.
21

Table 16
Education indicators G3 G2 G1
n 300 300 300 % % %
(1) Type of school DET 49,7 KwaZulu 44,0 Private school 3,7 Open school outside township 1,7 Community run school 0,3 Don't know 0,7
100,0 (1) Standard of school (subjective assessment) Very good 22 19 18 Good 33 37 37 Average 25 24 28 Poor 15 13 12 Very poor 5 3 5 Don't know 4
100 100 100 (3) Current level at school Standard 6 19 Standard 7 19 Standard 8 20 Standard 9 22 Standard 10 19
99 (4) Repetition of a standard Yes 55
(5) Spent two or more weeks out of school during past year 17
(6) Reasons for G3 being out of school G3 G3m G3f in the past year n 51 23 28
% % % Illness 39 26 50 Teacher boycotts 18 26 11 Student boycotts 14 22 7 No money 8 13 4 Pregnancy 6 11 Political violence 6 11 Looking after a relative 2 4 Other 8 13 4
22

Education indicators continued G3 G2 G1
n 300 300 300 % % %
(7) Reactions of family*/G2/G1 when G3 misses school n51 *
Understanding 8 7 6 Angry or upset 86 73 70 Insist that work is made up 6 9 8 Don't notice 4 9 It is G3's business 0 -
G3 never misses school 7 8 100 100 101#
(8) Description of G3's school life G3 G2 G1 n 300 300 300
% % %
Exciting, rewarding 56 64 61 In between 12 10 11 Frustrating, boring 31 25 25 Don't know 1 1 3
100 100 100
(9) Perception of progress G3: 'Are you doing as well in school as you would like to?' G2,G1: 'Is (G3) doing as well in school as you would like him/her to?'
% % %
Yes {doing well) 68 72 77 No 31 30 21 Don't know 1 - 3
100 102 101
Only G3 respondents who had actually missed school answered the question If columns do not add up to 100% in this and the following tables it is due to rounding
23

Table 16
Rewarding aspects of school life
G3: 'How would you describe school life these days? Is school life exciting and rewarding or frustrating and boring?'
G2, G1: 'How would you describe your son's/daughter's/grandchild's school life these days? Is your son's/daughter's/grandchild's school life exciting and rewarding or frustrating and boring?'
G3 G2 G1 n 287 298 299
% % %
Motivation and values 29 58 52 Education will get us better jobs/success/ achieve our goals 8 3 1
Very enthusiastic about school/talks about school 6 27 24
Enjoys/looks forward to school/happy 6 19 21 Studies every day/works regularly/always does homework 2 9 6
Keeps me busy/off streets/out of trouble 2 Other positive 5
Development, achievement, performance 26 40 40 Learn, develop, gain knowledge, it's interesting 13 3 1
Good progress/performance/results/doing well 12 31 33 Has improved since attending school in town 1 2 2 Behaves well/no complaints, praise from teachers 4 4
Teachers 18 1 1 Teachers have improved/are more enthusiastic/ trying hard/do help us
Discipline 14 13 20 Good discipline at our school 4 2 1 Pupils attend class regularly 3 7 9 Never misses school unnecessarily/anxious, angry if there is a school boycott or chalk down 1 4 7
Order at school this year 6 0 3
24

Rewarding aspects of school life continued G3: 'How would you describe school life these days? Is school life exciting
and rewarding or frustrating and boring?' G2,G1: 'How would you describe your son's/daughter's/grandchild's school life
these days? Is your son's/daughter's/grandchild's school life exciting and rewarding or frustrating and boring?'
G3 G2 G1 n 287 298 299
% % %
Curriculum 11 4 4 Extra-mural activities/sports/music offered at school 9 3 4
Extra lessons offered 1 0 0 Go on school trips/tours 1 3 -
Social support 8 4 1 Meet friends, colleagues at school 7 1 0 Asks for assistance if there is a problem/ discusses problems with parents/when I've got a problem there is someone to help
Facilities Repairs, improvements to our school
25

Table 16
Frustrating aspects of school life
G3: 'How would you describe school life these days? Is school life exciting and rewarding or frustrating and boring?'
G2, G1: 'How would you describe your son's/daughter's/grandchild's school life these days? Is your son's/daughter's/grandchild's school life exciting and rewarding or frustrating and boring?'
G3 G2 G1 n 287 298 299
% % %
Discipline 38 26 39 Boycotts/stayaways/strikes/no school most of the time 8 6 7
Teacher boycotts/chalk downs/teacher strikes 8 3 3 Student class boycotts/students don't attend classes 3 3 4
No discipline at school/students don't wear uniforms 5 1 2
Violence/killings at school/COSAS disturbs classes 4 2 3
Students carry weapons to school/schools unsafe 2 1 2
Children mix with bad people/get pregnant 0 0 1 Students/teachers drink on premises/take drugs 0 0 1
Don't attend school regularly/roam around streets/come home early/skip classes 5 8 11
Corporal punishment/unfair punishment 1 - -
Teachers 20 12 10 Teachers unenthusiastic/lazy/no longer teach/ absent 16 7 8
Poor standard of education/don't get the education 1 want/boring 4 5 2
Motivation 5 5 3 Unenthusiastic about school/shows no interest in school/we don't do homework 4 5 3
Sometimes like school, sometimes don't 1 0 0
26

Frustrating aspects of school life continued
G3: 'How would you describe school life these days? Is school life exciting and rewarding or frustrating and boring?'
G2, G1: 'How would you describe your son/daughter/grandchild's school life these days? Is your son's/daughter's/grandchild's school life exciting and rewarding or frustrating and boring?'
G3 G2 G1 n 287 298 299
% % %
Facilities 4 2 1 Poor conditions/disrepair/sanitary conditions unhealthy 1 0 0
Shortage of teachers/lack of teachers 1 0 -
Couldn't get into school/schools were full 0 0 0 No facilities at school/desks/books 2 1 0
Finance 2 2 0 Sometimes no money for busfare to go to school 2 2 0
Performance 1 6 4 Poor marks/failed/didn't write exams
27
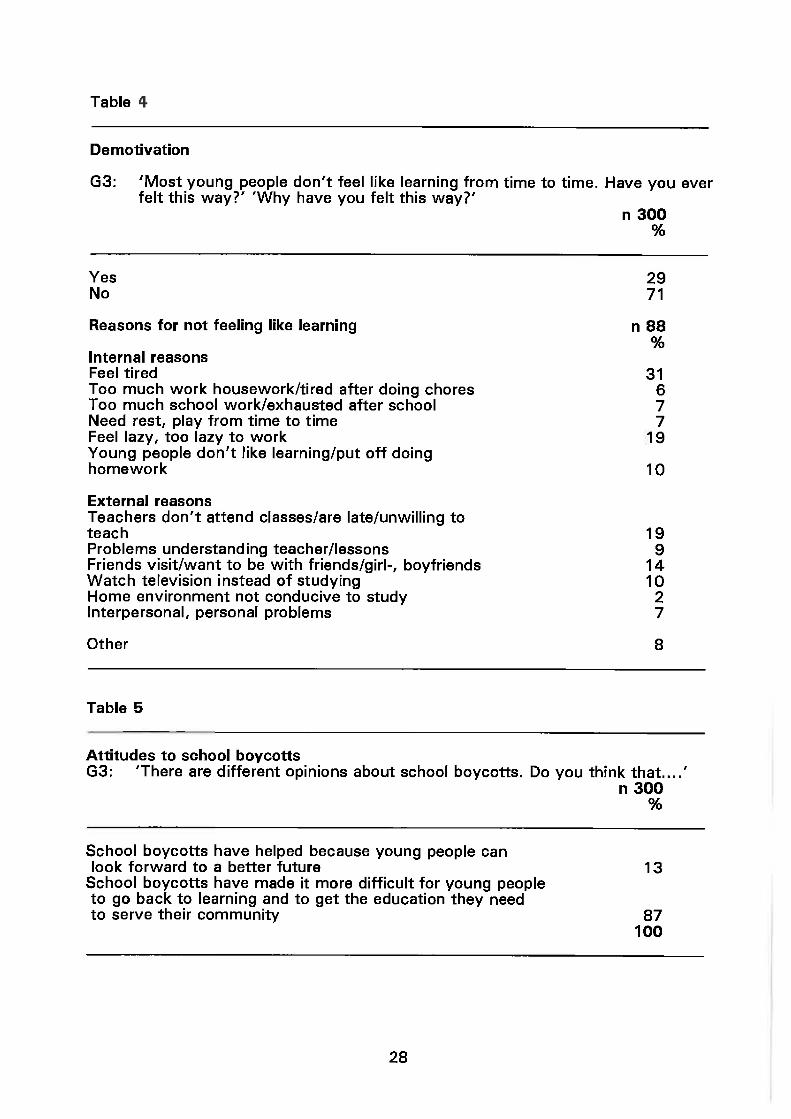
Table 16
Demotivation
G3: 'Most young people don't feel like learning from time to time. Have you ever felt this way?' 'Why have you felt this way?'
n 300 %
Yes 29 No 71
Reasons for not feeling like learning n 88 %
Internal reasons Feel tired 31 Too much work housework/tired after doing chores 6 Too much school work/exhausted after school 7 Need rest, play from time to time 7 Feel lazy, too lazy to work 19 Young people don't like learning/put off doing
homework 10
External reasons Teachers don't attend classes/are late/unwilling to teach 19 Problems understanding teacher/lessons 9 Friends visit/want to be with friends/girl-, boyfriends 14 Watch television instead of studying 10 Home environment not conducive to study 2 Interpersonal, personal problems 7 Other 8
Table 5
Attitudes to school boycotts G3: 'There are different opinions about school boycotts. Do you think that.... '
n 300 %
School boycotts have helped because young people can look forward to a better future 13
School boycotts have made it more difficult for young people to go back to learning and to get the education they need to serve their community 87
100
28

Table 16
Educational aspirations
G3: 'Thinking of the type of job you would like to do when you leave school, what educational qualifications will you need for this job?'
G2,G1: 'Thinking of the type of job you would like your son/daughter/grandchild to do when he/she leaves school, what educational qualifications will he/she need for this job?'
G3 G2 G1 300 300 300
% % %
Necessary qualifications for job aspired to Standard 8 - 0 0 Standard 9 0 1 -
Standard 10/matric 38 39 31 Post-matric qualification 58 50 43 No idea of what l/he/she want(s) to do 3 8 15 No idea of education required 1 2 11 No idea of education required
100 100 100
Adjusted results G3 G2 G1
n289 n270 n222 % % %
Standard 8 _ 0 1 Standard 9 0 1 -
Standard 10/matric 40 43 42 Post-matric qualification 60 56 58
100 100 100
29

Table 16
Recommendations for improving pupil performance
G3:
G2,G1
'Are you doing as well in school as you would like to?' 'What can be done to help you do better?' 'Is your son/daughter/grandchild doing as well in school as you would like him/her to?' 'What can be done to help your son/daughter/grandchild do better?'
G3 n 282
%
G2 300
%
G1 298
%
Extra school, lessons, study groups 29
Students must study hard 20
Teachers must teach 17
Educational facilities 17 {quality and quantity of school, classrooms, pupil teacher ratio)
Better qualified teachers/higher standard
of education 14
Library facilities 12
Access to text books 10
More time to study 10
Help with studies, encouragement 9 Financial assistance 7 (Bursaries, sponsorship, money for education, free education)
Change to a better school 5
Discipline/regular school attendance 4
Curriculum issues 1 (More choice of subjects, career guidance)
Parent involvement/communication between parents, teachers and pupils 5
36
21
11
10
10
8
3
1
9
12
11
9
1
10
17
30
8
5
9
6
2
4
12
18
10
12
30

Table 16
Perceived factors influencing success in school
G1,G2,G3: 'In your opinion...Why do some pupils do better than others in high school?' (Fixed responses, respondents gave two answers).
G3 G2 G1 n 300 300 300
% % %
They like to learn* 32 33 33 They study hard* 59 60 58 They try until they succeed* 36 43 43 They have good teachers* 29 28 28 They go to good schools* 16 17 16 They are more intelligent than others* 20 9 10 Luck is on their side* 4 3 4 They were born to succeed* 2 5 4 Peace in their homes 1 Parents are more supportive 0 - 1 They cheat 0 Co-operation between teachers and students 0 Good behaviour - 0 1 Obedience to teachers and parents - - 0 Free text books - - 0 Don't know 0 1 1
*Given response categories in order in which read out to respondents.
31
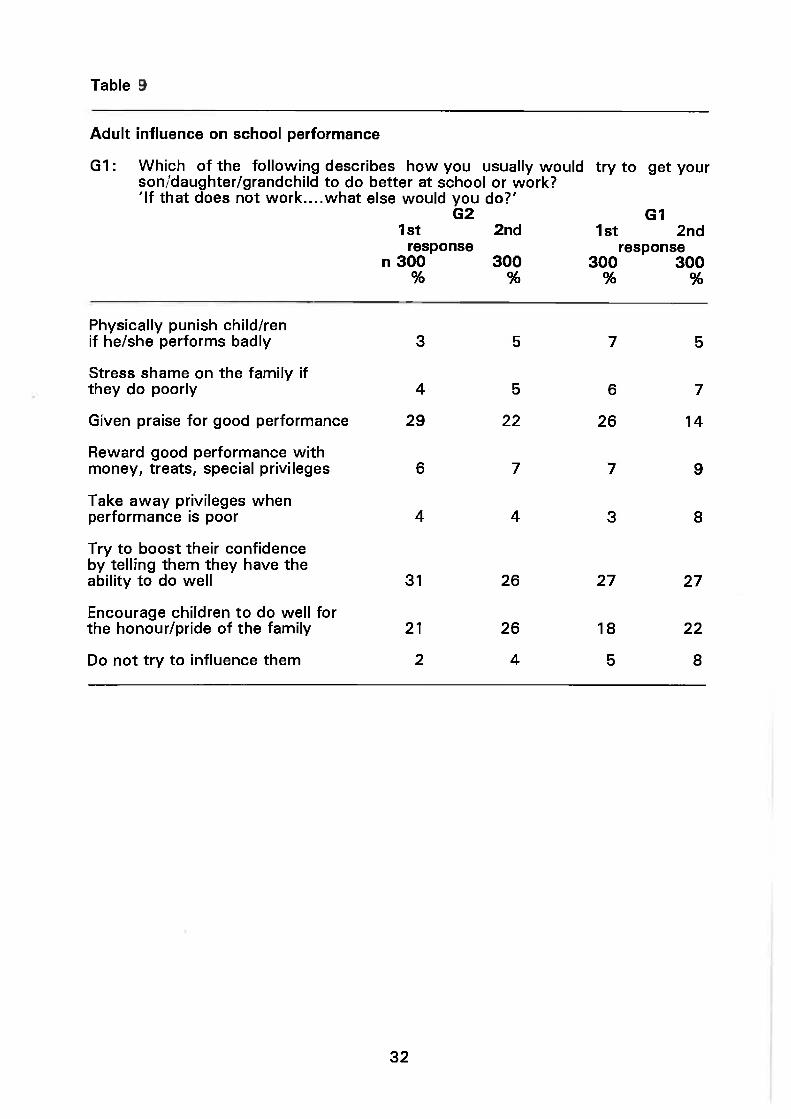
Table 16
Adult influence on school performance
G1: Which of the following describes how you usually would try to get your son/daughter/grandchild to do better at school or work? 'If that does not work....what else would you do?'
G2 G1 1st
response n 300
%
2nd
300 %
1st 2nd response
300 300 % %
Physically punish child/ren if he/she performs badly 3 5 7 5
Stress shame on the family if they do poorly 4 5 6 7
Given praise for good performance 29 22 26 14
Reward good performance with money, treats, special privileges 6 7 7 9
Take away privileges when performance is poor 4 4 3 8
Try to boost their confidence by telling them they have the ability to do well 31 26 27 27
Encourage children to do well for the honour/pride of the family 21 26 18 22
Do not try to influence them 2 4 5 8
32
SCHOOLING IN THE HOME ENVIRONMENT: FAMILY INPUTS IN EDUCATION
Slaughter and Epps (1987) in their review article on black education in the US, cite the role of the family in education as a primary force which affects status achievement over time. This occurs simply because the family is a consistently present influence during childhood and adolescence. One might extend this argument and speculate whether the family influence is not consistently present, even where household structures tend to be fluid and children experience changes in the composition of the co-resident family during childhood and adolescence. The critical factor may be that the family, regardless of its composition, is a constant factor during childhood and adolescence and acts as a reference group. This study looks at permutations concerning the roles of the family member or members who fulfil key support functions for the high school child. One might make the supposition that the extended family, of which the three generation is the prototype, has an edge over smaller township families when allocating educational support roles; an edge which may exert a positive influence on the educational achievement of high school pupils. The three generation family can draw on a larger pool of human resources to provide educational support.
Slaughter and Epps (1987) note that in the United States the headstart programme was designed to compensate for, rather than to invite, parental input. Current thinking is that parent inputs are not dispensable but represent important positive influence on academic achievement. One of the important tasks of this study will be to identify age-appropriate strategies for involving parents in the educational development of their children. In the township family setting, the role of educational support may be shared with the wider family. The three-generation family setting may lend itself to the sharing of educational support tasks. The study looks at the appropriate roles for grandparents and parents and does not ignore the possible participation of siblings in education support.
Positive home influences often go unrecognised. Literacy events in the home may be more crucial than is currently recognised. Literacy events include a positive attitude towards the tradition of knowledge in the form of myths, folk tales or reading aloud. Research among US immigrants indicated that the tone of the event might be more important than the direct literacy effects. Among immigrants from the far East to America it made little difference whether children were read to in the medium of instruction in school or in their home language. In fact, the values relating to pride in one's cultural heritage which would most likely be reinforced through non-English readings in the home, was a positive home influence on academic achievement, probably mediated through feelings of security about one's background and self-confidence (Caplan, Whitmore & Choy, 1989).
33

In different parts of the interview probes were used to tap the possible direct and indirect influences of family on education achievement.
Adult influence on school performance Parents and grandparents were asked about styles of socialisation in the home which might influence the academic achievement of the child.
Respondents were asked to identify their usual approach to child-rearing from a list of eight options ranging from strongly authoritarian ones to subtle praise and encouragement. Results indicated that confidence-building, praise for good performance, and encouragement to do well for the honour of the family are the three most common approaches employed by parents and grandparents to exert positive influence on school performance (cf. Table 9). Few adults reportedly offer positive incentives such as money or gifts. The least popular strategies include physical punishment and the withdrawal of privileges. Only a small minority, and more grandparents than parents (G 1:13 percent, G2:6 percent), stated that they did not try to influence their children. Grandparents tend to be more conservative in their approach to childrearing than parents. G1 grandparents indicated that they were inclined to resort to physical punishment (G1:12, G2:9 percent). Parents were more likely to praise good performance (G2:50 percent, G1:40 percent) and to encourage youth to do well in school to uphold the family honour (G2:46 percent, G1:40 percent).
Supportive family roles in education In the course of the main interview information on three different support roles was elicited. Family roles in education included those of what might be called an education 'confidant', a person who assists with homework, and a person who promotes literacy through reading or storytelling. Respondents from all three generations identified the persons who occupied these roles in their household. Results are shown in Table 10.
Education confidant. The mother and grandmother are the major persons who act as support persons to school children. Other persons in the household also assumed this supportive role.
Ten percent or less in any subgroup stated that the father of G3 took the greatest interest in G3's schooling. Males make up only 12 percent of the G2 parent subsampie. Fourteen percent of male parents compared to 43 percent of female parents stated that their child discussed school issues with them. However, the finding that fathers refer supportive roles in education to the mother is not an unusual one. The importance of the mother in educational support roles is well documented in the literature.
Assistant with homework. There is less consensus between the generations as to who assists with homework. Although respondents were asked to name persons
34

in the household, some respondents chose not to adhere to the survey instructions and identified school friends as the most important source of assistance to the high school pupil in the home.
Siblings, mothers and persons in the household other than fathers and grandparents were identified as the most important sources of assistance with homework. In turn, as reported elsewhere, G3 respondents who have younger siblings, assist them with their homework. Parents, who were mainly mothers, stressed their own role over the role played by schoolfriends in assisting with homework. More than 25 percent of grandparents (28 percent) compared to 20 percent of pupils, and 17 percent of parents stated that pupils did not receive assistance with homework from anyone.
Results suggest that the influence of mothers extends only to the first years of high school. A higher percentage of older than of younger youth (29 percent versus 10 percent) named peers as their assistants with homework. A greater number of yougner than of older youth (26 percent versus 14 percent) received assistance from their mothers. Friends rather than mothers were more likely to assist in families which were not in harmony according to G3 reports (Less harmonious families: 30 percent assistance from friends, 11 percent from mothers, versus harmonious families: 19 percent assistance from friends, 21 percent from mothers).
Reader or storyteller. The grandmother is the storyteller in the family. Grandfathers also tend to play a more important role here. Otherwise the distribution is fairly even over other members of the family including the G3 respondents. Responses from the pupil and parent generation indicate that in approximately a quarter of households no one reads aloud or tells stories. Grandparents give a higher estimate of households without a storyteller, namely 32 percent.
To sum up, supportive educational roles tend to be widely distributed in the family. Mothers tend to be concerned about daily progress, siblings and mothers assist with homework, and grandparents, mainly the grandmother, promote literacy and the oral tradition. Fathers appear to play a less prominent role in these supportive activities. In part this is a reflection of the absence of fathers in many of the households in the study.
STUDY HABITS A section of the interview was devoted to study habits. Results are shown in Table 11.
Extra-curricular educational participation Half of the pupils reported that they participated in study groups, about one in five
35

attended extra lessons after school or Saturday school. Sixteen percent attended courses during the holidays such as Winter School. Thirteen percent participated in none of these groups or activities {Table 11(1) ).
Study groups appeared to be more popular with male pupils and older youth. There was greater participation by Durban pupils in Saturday School and Winter School than by Soweto pupils. Soweto pupils were more likely to participate in extra lessons than were their Durban counterparts. Generally speaking, students from the more affluent homes were more likely to participate in extra-curricular events than students from less affluent homes (16 percent versus 7 percent).
Homework Time spent on homework varies and appears to increase with age (Table 11(2) ). Most pupils stated that they spent between one and three hours on homework on a regular weekday. Forty-nine percent of younger pupils (16 years and younger) and 55 percent of older pupils reportedly spend over two hours on their homework.
Homework is usually done at home (Table 11 (3) ). Three quarters of pupils stated that they did their homework at home, just under one quarter at school. Slightly more males (27 percent) than females {19 percent) study at school rather than at home. There are signs in the data that the choice of the place to study may be dependent on whether the home environment is perceived to be conducive to study. A higher proportion of pupils who were satisfied that family life was harmonious (76 percent), than those who were not (69 percent), reported that they usually did their homework at home.
Pupils as lay teachers. Birth order is presumed to play an important role in educational achievement. The literature suggests that older school children tend to fulfil a teacher role towards the younger children in the family and have an edge over other schoolchildren without siblings.
The majority of students with younger siblings said that they helped their younger brothers and sisters with their homework (Table 11(4) ). Comparing only those pupils who had co-resident brothers and sisters, we find that 93 percent attending good schools compared to 67 percent in average or poor schools helped other children with homework. Ninety-one percent of Soweto pupils but only 67 percent of Durban pupils assisted younger brothers and sisters. Schoolchildren who described their family life as harmonious (87 percent) were more likely to assist brothers and sisters with homework than were persons dissatisfied with family life {76 percent).
Homework patterns All three generations in the study were asked to give a descriptive account of how the G3 schoolgoer in the household set about doing homework assignments.
36

Table 12 gives an overview of the three different accounts. Responses have been grouped according to various aspects of doing homework, including the 'where', 'when', 'with whom' aspects which are regular features of most time budgets. Further sections deal with approaches to the task and an evaluation of the outcome.
Where. The accounts emphasise the fact that homework is usually done at home. It appears that most pupils have a fixed place where they do their homework. Only a small minority vary the place where they study and sometimes do homework at school or take it home. Few pupils worked in the public library, though a few mentioned the library at school. It will, however, be remembered that pupils in schools with a poorer rating called for more library facilities. It is possible that libraries might be used for homework purposes if they were available. Some pupils said they did their homework at school after classes. Some were able to slip in some homework in free periods or between classes. However, only a small minority said they did the bulk of their homework at school.
A few respondents make a distinction between 'homework' and 'study' which is done in different places. In this case, the former is considered to be assigned work, the latter additional work undertaken of their own volition. Contrary to the popular meanings assigned to the concepts 'homework' and 'study', the persons who made this distinction stated that they do their homework at school and study at home.
At home, there appears to be no particular preference for a room in which to do one's homework. The common areas tend to be used more often than bedrooms, though a small minority of pupils said they worked in the bedroom. Respondents stressed the importance of atmosphere rather than the specific room. Approximately one quarter said they preferred to do their homework in a quiet place, possibly alone or at least undisturbed. A few pupils said they locked themselves in their bedrooms to do their homework. One person retired to a backyard room where she could work undisturbed.
When. Homework is typically an after dinner occupation. Mainly older pupils reported that they studied late at night when it was quiet and the family was asleep. Only a few pupils said that they got up early in the morning to study before school. A handful tackled homework before other tasks or recreation. Some indicated that they like to play a while or have a snack before attending to homework. Mainly female pupils reported that they did their housework before sitting down to do their homework. The pupils were more likely to describe where their homework fitted into their after-school schedule than were their parents or grandparents.
37

With whom. The social context of homework varies. There were as many references to doing homework alone, as there were to doing homework with schoolfriends or members of a study group and with family. A greater number of male than of female students reported doing homework with friends which is congruent wi th above results on participation in study groups. Female students made more mention of doing homework with or aided by siblings and other family members. Some reports suggested that persons in attendance were actively involved in the homework process. Other reports suggested that schoolchildren solicited help only if required, but felt assured of a supportive environment.
Members of study groups and gangs were less likely than others to report the assistance of siblings, and were more likely to include studying with friends in their descriptive accounts of doing homework. Gang members also tended to study at night. Age might be the critical factor for this study habit.
The process. A few reports focussed on the process of completing the homework task. The most common description under this heading referred to sitting down to the task wi th the tools of the trade: paper and pen and textbooks. Parents and grandparents gave this description as being the most visible sign of the homework process, and in a few cases, gave the qualifier that they presumed that their children were doing their homework. The pupils were in a better position to give more detailed descriptions of procedures which cannot be observed from outside. A few pupils stated that they limber up by starting with the easier tasks and then graduate to the harder ones. Others reported that they left queries to ask their teachers in class. A substantial group organised their task with the help of a study timetable. Others worked their way through the study material testing their knowledge at regular intervals. This revision strategy may have been overstated due to the date of the survey coming shortly before the end of the year examinations. Only a few pupils stated that they did their homework while listening to the radio or watching television. Parents and grandparents were more likely to make this observation.
Parent and grandparent descriptions of homework: Parents and grandparents gave mainly 'outsider' descriptions of the homework situation. However, the picture remains by and large the same with a slight shift in emphasis. Parents and grandparents noted the visible times and places where homework occurred. The data suggest that the older generation was made more aware of homework if they themselves or other members of the family were drawn into the process. About one-fifth depict homework as a task done alone, without assistance and when one is undisturbed. Parents, and grandparents in particular, tended to understate the role of friends as homework partners. Elders were more inclined than the youth to move from description to evaluation. Assessments were usually positive, 'she does her homework well '. A small percentage, but twice as many grandparents than parents, stated that they did not know how their children did their homework.
38
Some persons in this category indicated that they never saw their child do any homework.
Discussion. To sum up, there seem to be established homework routines in the households under study. The major changes in routine may concern the irregular division of the amount of work done at home or at school. Parents and grandparents may not be aware of what is actually done where. This may make supervision of homework or encouragement to study more difficult.
The routines appear to differ between households. However, the general rule appears to be that homework is done later in the day. Superficially seen the descriptions of how homework is done by the three generations tally with minor shifts of emphasis. Subtle signs in the data suggest that there is awareness of the need for a home environment conducive to study. Set times and places in the home are designated for homework. The need for peace and quiet or assistance is recognised. There is no mention in the data as to which generation initiated the homework routine, so one must assume that the routine was established gradually to match rather than to interfere with the lifestyles of all members of the household. That is, the needs of the younger generation are accommodated and homework does not dominate the domestic routine. Specific mention is made of recreational activities as well as domestic work preceding homework. The question here is whether this is the child's or the parent's choice. Certainly a few G3 respondents, in connection with the item on disinclination to study, indicated that they sometimes felt overtired as a result of their domestic workload. This question calls for further inquiry.
Motivation How are pupils motivated to do their homework? The reason analysis included in the time budgets completed by G3 respondents tells more about how they felt about doing homework on the diary day. Homework accounted for 154 diary entries. Homework was characterised as an achievement-oriented activity (i.e. means to an end), with strong overtones of duty and obligation. The comparison of the two motivation profiles for school attendance and homework is instructive. In the first instance, both school and homework were rated as means-to-ends activities. Thereafter, school was more often associated with obligation, i.e., other-directed compulsion, homework with duty, an inner-directed force.
The scheme used to classify the activities of the diary day made a distinction between homework, reading to learn, and preparing for examinations. The profiles for homework {n154 activities), reading to learn (n26), and preparation for exams (n147) were similar, with emphasis on the achievement orientation as described above, and obligation and duty. As the activity label 'read to learn' suggests, the main emphasis here was on deferred gratification, with less pronounced sense of duty or obligation. In contrast, sense of duty and obligation figured more
39

prominently in the motivation profiles for homework and exam preparations than for reading. Noteworthy is the fact that small percentages also indicated intrinsic satisfaction when participating in homework, reading and preparation work.
These data from the diary material suggest that pupils take their homework seriously. They are motivated because they believe that doing homework will produce positive results. Some schoolchildren are more motivated by inner direction, others by external pressure. The time-budget results also indicate that self-motivation may be a more important factor for homework and independent study than for attending school. The descriptive accounts of homework confirm that many pupils exhibit self-motivation in that they prefer to carry out their homework activities on their own. An intriguing question for future analysis is whether sense of duty rather than obligation exerts a more positive influence on school performance and achievement.
In conclusion, the in-depth study of the homework situation was undertaken with a view to providing pointers for intervention. If the black schoolchild is required to regularly complete specific set work at home rather than in after-school study periods at school, we need to know more about how the home environment promotes or detracts from good study habits.
40
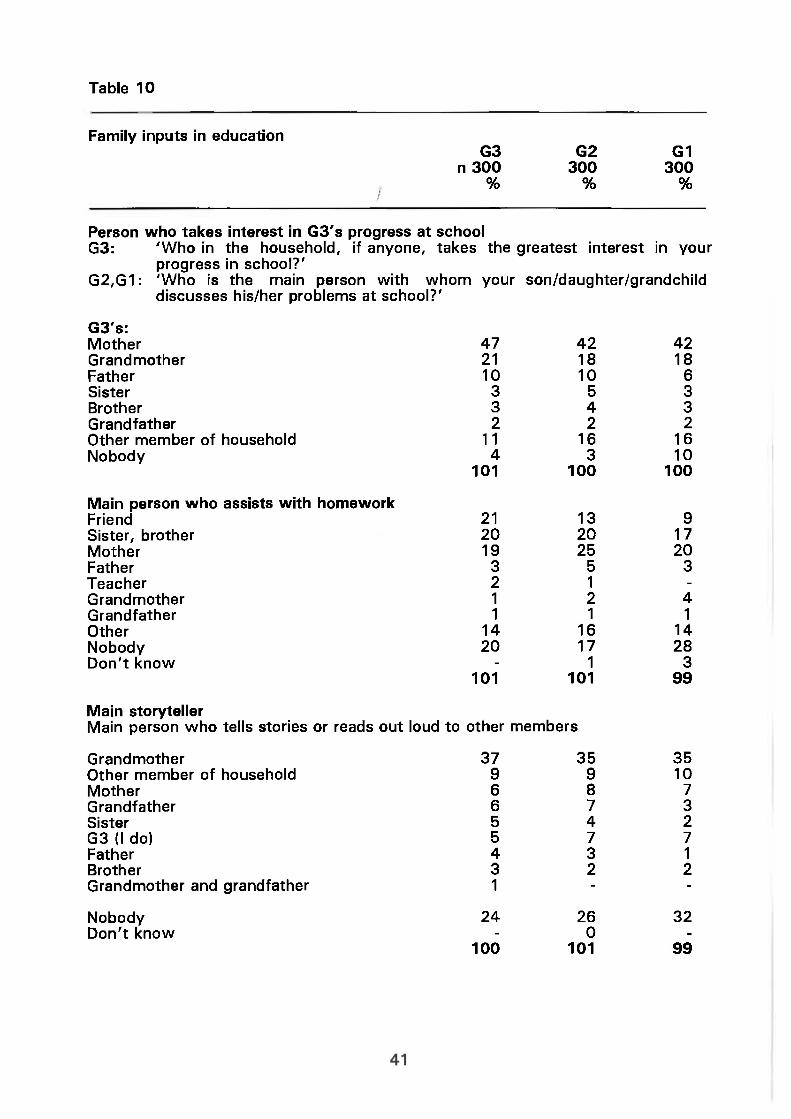
Table 10
Family inputs in education G3 G2 G1
n 300 300 300 % % %
Person who takes interest in G3's progress at school G3: 'Who in the household, if anyone, takes the greatest interest in your
progress in school?' G2,G1: 'Who is the main person with whom your son/daughter/grandchild
discusses his/her problems at school?'
G3's: Mother 47 42 42 Grandmother 21 18 18 Father 10 10 6 Sister 3 5 3 Brother 3 4 3 Grandfather 2 2 2 Other member of household 11 16 16 Nobody 4 3 10
101 100 100
Main person who assists with homework Friend 21 13 9 Sister, brother 20 20 17 Mother 19 25 20 Father 3 5 3 Teacher 2 1 -
Grandmother 1 2 4 Grandfather 1 1 1 Other 14 16 14 Nobody 20 17 28 Don't know - 1 3
101 101 99
Main storyteller Main person who tells stories or reads out loud to other members
Grandmother 37 35 35 Other member of household 9 9 10 Mother 6 8 7 Grandfather 6 7 3 Sister 5 4 2 G3 (I do) 5 7 7 Father 4 3 1 Brother 3 2 2 Grandmother and grandfather 1 - -
Nobody 24 26 32 Don't know - 0 -
100 101 99

Table 16
Study habits G3 n 300
(1) Participation in n 300 %
Study group 54 Extra lessons 20 Courses during term (e.g. Saturday school) 22 Courses during holiday (e.g. Winter school) 16 None of above 13
(2) Average time spent on homework on weekday Total -16 years 17 + years
n 300 122 178 % % %
Up to 1 hour 7 6 8 1 up to 2 hours 41 45 38 2 up to 3 hours 31 30 33 3 up to 4 hours 15 16 15 4 and more 5 3 7
99 100 101
(3) Usually do homework at n 300 %
Home 75 School 23 Friend's house 2 Library 0 Church 0
100
(4) Usually helps younger brother/sister with their homework
% Adjusted %
Yes 72 85 No 12 15 Not applicable 16 -
100 100
42

Table 16
Homework patterns
G3: 'How do you go about doing your homework?' G2,G1: 'How does your son/daughter/grandchild go
r i _ / homework?' about doing his/her
G3 G2 G1 n 300 300 300
% % %
Where
Do homework at home* 19 20 18 At school: after school/during the study, free period, free period in between/ do bulk at school/school library 15 8 5
Local library - 0 0 Sometimes at home and sometimes at school 5 1 2 Do homework at school, study at home 3 0 1 Bedroom/locked in bedroom/relaxing on bed 3 7 5 Other room (dining, kitchen, lounge, backroom) 4 9 13
In a quiet place/where not disturbed 10 8 6
When
Early in the morning/before school 3 2 1 After school 6 0 2 Immediately after school before anything else 4 2 3 Go out/relax first (play, go to gym, eat, watch television first) 3 2 2
Do homework after housework 8 6 6 At night/in the evening/after supper 17 20 23 After the family has gone to sleep/stay up late 7 7 9
With whom G3 G2 GT
With friends/with study group 17 13 10 Do homework with sister/brother 1 2 3 Helped by sister, brother,family member 14 16 9
Ask if have problems, don't understand, need assistance 4 7 3
Do homework by myself/without assistance 3 3 1 Alone/undisturbed 14 17 20
43

Homework patterns continued
G3: 'How do you go about doing your homework?' G2,G1: 'How does your son/daughter/grandchild go about doing his/her
homework?'
G3 G2 G1 n 300 300 300
% % %
Method
Start with easy parts/do what I can on my own 1
Take/sit down with books/use textbooks/ sit at table 8 9 7
Read and test myself/revision 8 0 1 Read/write/reads and writes/see him (her) writing presume it's homework 6 10 7
Have a study timetable 1 0 1 Leave problems, queries for teacher 2 0 -While listening to radio/watching
television 1 4 2
Evaluation Do/es homework very well 1 6 4 Only studies when forced to/reminded - 1 3 Do not know/never see him doing homework/ no idea 0 6 11
The phrasing used in the descriptions are those of G3 except where responses came mainly from parents and grandparents.
44

FAMILY SOLIDARITY The home environment does not only consist of shared physical space. The social relationships between the persons sharing residential space make up the non-tangible dimension of the home environment. An understanding of family activities and life styles is essential to an effective home-based intervention programme. Anecdotal evidence from KwaMashu (Nxumalo, 1993) suggests that pupils and teachers realise that education development begins in the home. This study used the concept of family solidarity as an approximation of the interpersonal dimension of co-residence. Family solidarity is usually subdivided into several dimensions. Following conventional methods used in studies of intergenerational relations, this research applied indicators concerning each of these dimensions to explore the interpersonal aspect of the home environment.
A methodological note may be appropriate before presenting the findings on family solidarity. For reasons of convenience, the terms family and household were used interchangeably. With few exceptions, it is essentially the members of the extended family who make up the households in this study. Simplifications were made regarding probes into intergenerational relations. Only a limited number of dyads were reviewed concerning the designated child, parent, and grandparent in each household. In consequence, the information yielded by this study is restricted mainly to same-sex intergenerational relations, whereas conventional studies compare relations in same- as well as opposite-sex dyads. In some instances the cue used in this study referred more generally to 'parents' or even to the 'family' rather than to a specific gender-defined relation to the G3 respondent.
The findings in this section are ordered under five headings of solidarity: Affect, contact, consensus, and exchanges. The fifth dimension concerning family norms is discussed in the following section of this report dealing with attitudes and values.
Affect Sentiment is thought to be the foundation of good family life. Families can survive intact without affection for each other. However, persons who live in close quarters under one roof, such as the three generation families in the survey, will have difficulties carrying out their daily round of activities without positive feelings for each other.
Figures shown in Table 13 indicate that a large majority of G3 youth, over 85 percent, felt that their family understands, respects and loves them. They felt they were treated fairly and were trusted by their families. Only one percent of the youth stated that their family did not love them. However, youth appeared to be less assured than older generations that the family had these positive sentiments for them.
45

Over 80 percent of youth expressed satisfaction with family life, saying there was peace and harmony in the family. These feelings were shared by the older generations.
Youth were more likely to discuss important matters with their parents (78 percent of youth do so) than with their grandparents (68 percent of youth do so). This was confirmed by the parents and grandparents participating in the study.
Generally, relationships between the youngest and the other generations in the household were good. Youth stated that they got on equally well with both their parents and their grandparents. This sentiment was a mutual one between generations. Younger pupils, Durban youth, and those attending the better schools tended to get on better with their parents than others. The small number of G3 respondents who were indifferent towards their parents were also those who perceived their home life to be disharmonious.
Contact The physical proximity factor is considered to be one of the strongest determinants of family solidarity. Although communication and some types of support at a distance are possible, living under the same roof, next door, or in the neighbourhood, makes for greater ease of exchanges between family members. Proximity is often considered a prerequisite for some types of mutual assistance between family members. Furthermore, family members living in close quarters may feel they are under greater obligation to assist than those who live farther away.
The three generation household represents a special case of proximity. From a methodological point of view proximity is held constant. Although physical distance between individual family members may be minimal, there is the possibility that individuals who are not on good terms may avoid interactions with other members of the family in the interest of peace and harmony in the home. Similarly, individuals may avoid discussing subjects which they know will lead to family differences of opinion or family arguments.
Only one indicator of social interaction between family members was used in the study. The respondents were asked if they participated in shared activities with the designated members of the other generations in the household. The item was designed to tap common interests rather than incidental contacts between the generations. The time budgets yield information about which members of the family are present during each activity of the diary day.
About 55 percent of the youth stated that they often did things together with their parents and grandparents, respectively. Approximately one-fifth had no shared
46

activities with the older generations. Parents and grandparents overstated their shared interests with the youngest generation.
Intergenerational contact appeared to be greater among persons who were content with their family life and their life in general. Younger schoolchildren and grandparents and females of all ages reported more shared activities. This finding supports the idea that mutual aid in families is mainly a female affair {Young and Willmott, 1973).
Consensus The family solidarity model allows for some leeway in the sharing of ideas. The argument is that families need to talk to one another but they need not agree on all points of the discourse.
After giving reassurance to the respondents that some differences of opinion are normal, respondents were asked if they disagreed with members of the other generations 'about important things in life.' Youth stated that they disagreed more often with their parents (56 percent) than with their grandparents (48 percent). This finding suggests that parents may be seen to be more critical of youthful opinions, grandparents more indulgent towards youth. Alternatively, youth do not share their views on important concerns with grandparents and thus avoid confrontations. Parents and grandparents were more likely to state that they did not share important viewpoints with the youth. Above-average proportions of school pupils who reported lower levels of overall life satisfaction and discontent with their home life stated that they disagreed with their families about major issues.
A further test of consensus between the generations can be made by comparing reactions to values statements reported elsewhere in this report. To give a preview of results to follow, there was considerable consensus of opinion between the generations on a wide range of issues. Consistent with the literature on family solidarity the degree of consensus appears to be dependent on the issue in question. For example, there was greater consensus of opinion concerning family values than concerning moral and behaviour prescriptions. Grandparents exhibited the most conservative views concerning morals and appropriate behaviour codes.
Exchanges In one manner of thinking, positive sentiment, physical proximity, and consensus on family norms are but preconditions for ensuring that family solidarity works. This study set out to explore the support functions assumed by each generation in the extended township family. The section on exchanges in Table 13 shows the contributions made to the household by each generation according to each generation's self report. A general picture which does not consider gender differences is as follows:
47
The contributions of the youngest generation consist of housework, shopping and errands, assistance to older members, and gardening and repair. Over half are involved 'a great deal' in all these activities except yard work which occupies only 45 percent.
The middle generation makes the greatest number of contributions to the welfare and well-being of household members. It contributes a great deal to the general household finances and school expenses. More parents than schoolchildren do a lot of housework. Parents and youth share equally in errands and shopping. Care of the elderly is mainly in the hands of the middle generation. Parents share gifts and treats with other members to a greater degree than the other generations.
Members of the oldest generation make contributions to general household expenses on a par with their adult children. They also share in the housework. Grandparents make the greatest contribution to childcare overall, with some assistance from the middle and youngest generations. In a substantial number of households grandparents also contribute to school expenses and special treats.
The above distribution of labour in the household is a reflection of the financial resources, time and physical strength of each generation. In addition, norms governing the appropriate age-gender roles will certainly play an important role. As we shall see later, making larger or smaller contributions than is appropriate in terms of prescribed age-sex roles are common sources of tension in family life.
Important for the focus of education in this study is the fact that youth are wholly dependent on their parents and grandparents for their school fees and other educational expenses. The burden of most family and household duties falls squarely on the shoulders of the middle generation. Youth are clearly expected to pull their weight by sharing domestic work. The major contributions of the grandparents to the economic well-being of three generation households is noteworthy.
Summary. The youth's overall view of family life is a positive one of peace and harmony. Emotional support is forthcoming for most young people in the study. The youth appear to be somewhat less confident of the emotional support of their family than the older generations. This may be attributed to emotional turbulence during adolescence and may be a passing phase in life.
Youth in three generation households share activities with their parents and grandparents. Reportedly, they feel they can discuss their ideas with their parents and grandparents who share their opinions in important matters. Parents and grandparents are less inclined to feel they see eye to eye with the younger generation. This may be one of the few signs in the data of the so-called 'generation gap'.
48

Even though youth may not feel as free to discuss issues with their grandparents as with their parents, they get on equally well with both parents and grandparents. In fact, a slightly higher proportion of youth said they got on better with grandparents than with their parents. Findings reported in other sections of the report suggest that parents may be more critical of their adolescent children. Grandparents may be more concerned with cultural values and mores. There is further confirmation of these subtle distinctions in the information collected on family grievances.
AN ASSESSMENT OF FAMILY LIFE Three generation living calls for exceptional consideration on the part of all members if it is to be successful. It can be expected that not all aspects of family life are satisfying and that satisfactions and grievances may assume different forms for the different generations. Where grievances exceed the satisfactions derived from family life, there will be a strong temptation to quit the family home. Family norms and financial resources may suppress such thoughts, just as peer pressure may nurture them. Anecdotal evidence from trouble-torn township areas indicate that youth whose political sympathies or deviant behaviour have become a source of embarrassment or danger to the family have left home or been expelled.
Complaints about family life An item put to respondents towards the end of the section on family issues explored the major problems or complaints about family life. The intention was to show up emergent grievances which might upset the support role of the family and home life for the school child. A second item probed the sources of pride in one's family which might counteract grievances and serve as points of positive reference to the family and its norms. It was reasoned that youth who take pride in their families might be more likely to look to the family for their role models. The comparison of the response patterns of the three generations in the study yields special insights into the 'generation gap'.
Results in Table 14 are shown in order of mention of grievances received from the schoolchild generation. Thirteen major sources of grievances are identified:
Major grievances with family living for youth included: o Parental restrictions o Poor family relationships o Shortage of money in the family o Personal problems o Housing quality o Perceived unfair treatment
49

Youth were most concerned about restrictions on their freedom of movement. Parents were too strict, did not understand that they needed time off to get out and be with their friends, etc. Tensions and poor relations between family members was another major complaint. In a few cases alcoholism caused mounting tension in the household. A few persons mentioned lack of mutual respect between family members as the cause of the deterioration in family relationships in their homes. Lack of money in the household was a further major factor which caused friction in family life. Personal problems such as illness and personal failures were negative issues for a substantial number. A small number of youth made specific mention that their performance at school had a negative influence on their family life.
Youth felt hard done by if they were required to work too hard in the home or did not get the clothes of their choice. Similarly, some youth stated that they resented favouritism in the family when siblings got more than their fair share of material rewards or did not pull their weight with the housework.
In a few cases a major complaint was noise and disturbances in the home which kept one awake at night or made it difficult to study.
Only in very few cases was direct mention made of township violence intruding on family life. Some youth cited fear of, or incidents of, attack by hostel dwellers as a major problem for their family.
Noteworthy is that a sizeable majority of youth could find no fault with their family life. Sixty-two percent indicated no complaints in response to the item in question. In contrast, only one-fifth of youth could not name a reason for being proud of their family in the past year.
Pride in the family
Four in five youth named a specific source of pride in their family (cf. Table 15).
Major reasons for youth taking pride in the family included:
o Love and care o Good family relationships o Educational and material needs met o Home and social status improvements o Special attention
The most common reference is to sentiment. Youth felt loved and cared for by their family. Pride was taken in the family if family relationships were good. Special mention was made of mutual respect and mutual financial support as
50

sources of pride. Youth were proud that their educational and basic needs were met. Signs of material success were important to youth: Home improvements, including the installation of electricity, figured prominently under this heading. Youth appreciated being the centre of attention and enjoyed receiving special gifts and treats, the clothing of their choice and being feted with a party in their honour. It is apparent that these tokens of affection serve as reinforcements of family support and also instil confidence in young people's self-worth and positive image. The findings indicate the importance which youth attach to fashionable clothes as image makers .
Celebratory family events figured prominently in the list of items referring to pride in one's family. Mention has already been made of parties and of the introduction of electricity into the home. Other major events include an engagement or a marriage in the family, or a job for a family member. Being nursed back to health by family was a source of pride for some youth.
In some cases youth commented positively on family mores or behaviour changes. For example, youth noted approvingly that family members were religious observers. In another case a youth reported that a family member had given up alcohol.
Comparative perspectives of three generations. The comparison with the perspectives of the other generations shows that youth are more sensitive to their own immediate needs, such as education and clothing. The importance of clothing as a source of positive identification is noteworthy. A sense of entitlement may be attached to fashionable clothes and special treatment. It is possible that treats are seen as justified rewards for participation in housework. Just as perceptions of unfair treatment alienate youth from their families and make them resentful, so peer pressure may make youth less modest about their demands for participation in fashion and other status-enhancing events.
Results suggest that parents are more concerned with material issues which affect the well-being of the family as a whole. In view of the fact that the parent generation tends to be the main breadwinner, it is hardly surprising that material success factors are all-important to parents. Money matters, poor family relationships and physical housing issues head the list of parental concerns. While youth expressed their feelings of being restricted in terms of parental constraints on their movements, some parents stated their desire to move out to a home of their own. Housing rather than clothes may be the area where parents express their feelings of resentment or relative deprivation. The middle-aged G2 parent is simultaneously parent and adult child. The person-in-the-middle in a co-resident household situation may be more caught up in family tensions than other family members. It is the middle generation which dispenses love and care to both the older and younger generation and which gives rather than receives treats and
51

favours. Survey results confirmed that members of the G2 parent generation were least likely to cite love and care received as a source of pride in the family. For many youth and grandparents this was an important factor. Similarly, more youth and grandparents than parents took delight in gifts presented to them and in parties thrown in their honour.
Grandparents shared the concern of the middle generation about financial problems in the household. Personal problems, mainly concerns related to ill-health weighed more heavily on grandparents. Health also was more often a source of positive satisfaction with family living. A substantial number complained of poor family relations, in particular of troublesome and rude and disrespectful children and grandchildren. Lack of respect in the family was a factor which concerned more people in each successive generation. Grandparents appeared to be more irritated by noise and disturbance factors in the extended family household. Home improvements were a very important source of satisfaction to grandparents. Homeboundedness may play an important role here.
All generations appear to take considerable pride in good family relationships, but respect from the family was a particularly important factor contributing to the pride which parents and grandparents take in their family. Parents and grandparents participate vicariously in the success of family members. Being able to take pride in the child's school performance was a very important source of pride for parents in particular, and also for grandparents.
To sum up, the review of positive and negative factors of family life confirm the results of the summary indicators of family solidarity reviewed earlier. The greater number of points for pride than for complaints came as a surprise. From previous research experience, people seem to find it easier to identify their specific grievances with living circumstances than to pinpoint areas of satisfaction. Positive aspects seem to be diffuse and defy exact definition; they appear to be more difficult to describe. The explanation for the overall positive evaluation must surely rest with the emphasis on the importance of family relations.
By and large family life in the three generation families in the survey is peaceful and harmonious. Tensions from within are perceived as threats to a home life of quality. High school pupils perceive their home environment to be supportive. The fact that the good school performance of youth features as second only to good intergenerational relationships as a source of pride for parents is suggestive of a supportive home environment. This section picks up a recurrent theme in the findings reviewed so far: the need for peace and harmony in the family. Peace and harmony in the family is also a co-determinant of satisfaction with other aspects of life, including school life. The link between home and the school is perhaps best exemplified by the fact that high school pupils who perceive their home life to be peaceful and harmonious, are more likely to do their homework at home and thus
52

receive more assistance from their family. At the same time, pupils content with their home life are also more likely to see their school life as rewarding and they are doing better at school.
Earlier research found that personal and family life were the only spheres of life which consistently made positive contributions to overall perceived well-being. Satisfaction with peace and harmony in the family was one of the highest priority issues for the perceived quality of life of all South Africans (Miller, Schlemmer & DuToit, 1987). This study confirms the salience of family life for overall well-being and as a basis for satisfaction in other domains of life.
53

Table 16
Family solidarity indicators G3 n 300
%
G2 300
%
G1 300
%
Affect (1)
'Do you tend to agree or disagree that your family ?'
Understands you (agree) Trusts you (agree) Is fair towards you (agree) Respects you (agree) Loves you (agree)
Affect (2)
'How satisfied are you that there is peace and harmony in this household?'
Very satisfied Satisfied Neither/nor, dissatisfied, very dissatisfied
85 (5)a 95 (2) 92 (2) 85 (5) 93 (5) 94 (3) 87 (7) 91 (5) 88 (4) 87 (6) 96 (2) 93 (1) 95 (4) 96 (3) 91 (7)
45 37
18 100
43 37
20 100
44 35
20 99
a Figures in brackets are percent 'uncertain'.
54

Family solidarity indicators continued G3 G2 G3 G1
n 300 300 300 300 % % % %
Affect (3) 'Do you tend to exchange ideas or talk about things that really concern you with your parents/grandparents?'
Yes 78 (79)b 68 (65) No 21 (21) 31 (35) Don't know 1 (-) 1 (-)
100 (100) 100 (100)
Affect (4) 'Overall, how well do you get on with your parent/grandparent these days? Would you say the relationship is ....?'
Very good 54 (58) 59 (55) Good 35 (35) 34 (34) Indifferent, bad, very bad 11 (7) 7 (11)
100 (100) 100 (100)
Contact
'How often do you do things together with your parents/grandparents....?' Very often 33 (42) 34 (38) Quite often 23 (30) 21 (27) Sometimes 26 (20) 25 (19) Seldom, never 18 (8) 21 (16)
100 (100) 101 (100)
Consensus
'Even people who get on well together sometimes disagree with each other on some points. Do you disagree with your parent(s)/grandparent(s) about important things in life?'
Yes, disagree No
56 44
(65) (35)
48 52
(51) (49)
Figures in brackets are from the perspective of the parent (G2) or the grandparent (G1). Eg.' Do you tend to exchange ideas....with your child/grandchild?' ' . ..how well do you get on with your child/grandchild?' '...do you do things together with your child/grandchild?' 'Do you disagree with your child/grandchild?'
55

Family solidarity indicators continued G3 G2 G1 n 300 300 300
% % %
Exchanges (There are) 'various ways in which a household member can contribute to the well-being of the household...please tell me if you contribute a great deal, a little or not at all?'
Contribute money to general household expenses Great deal 4 Little 6 Not at all 90
Paying for school fees, books or uniforms Great deal 3 Little 8 Not at all 89
Giving gifts and treats Great deal 14 Little 48 Not at all 38
Doing housework Great deal 76 Little 18 Not at all 6
Doing shopping and running errands Great deal 59 Little 26 Not at all 15
Doing gardening and repairs Great deal 45 Little 26 Not at all 29
Looking after/caring for small children Great deal 24 Little 33 Not at all 43
Assisting older members of the family Great deal 58 Little 29 Not at all 14
67 24
9
71 17 12
44 35 21
67 24
9
62 26 12
24 27 49
38 28 34
70 21
9
65 27
8
33 26 42
27 43 30
43 36 21
25 25 50
21 23 56
44 23 32
Sections add to 100% or slightly below or above due to rounding
* Not asked
56

Table 10
Major complaint about family life G3 G2 G1 n 300 300 300
% % %
Restrictions, freedom of movement Parents strict/restrict free time/going out with friends/seldom get out 6,7 1,3 0,3
Family relationships Misunderstandings/bad relationships/
disagreements/problems 6,3 9,3 6,3
Children, grandchildren, troublesome 0,3 1,3 5,0
Financial hardship Shortage of money/difficulty making ends meet/no financial support/family member
unemployed/children borrow money from me 6,3 16,3 16,3
Personal problems
Illness/death of loved one/failures 5,0 4,3 9,3
Household chores
Have to do chores/work very hard 4,3 1,0 0,7
Housing issues Physical quality(small/old/no electricity) 3,7 7,0 3,0 Want own home, to live alone 0,3 4,3 0,3 Home environment (bad, disorderly) - 0,3 0,3 Clothing
Don't get the clothes I want 3,3
Favouritism
Siblings favoured/get more/work less 1,3 0,7
Education Unhappy at school/failing/poor education 1,3 0,7 0,7 Noise and disturbances Noise/kept awake, come home late/can't
study 1,3 1,3 2,7
Respect Lack of mutual respect/children rude,
disrespectful 1,0 1,7 4,3
Alcoholism
Family member drinks heavily 1,0 2,0 3,0
Hostel dwellers
Afraid of, attacked by 0,7 0,3 0,7
Other 1,0 0,7 0,3
Nothing To complain about, don't know 61,7 52,7 55,7 57

Table 10
Main reason for being proud of family G3 G2 G1 n 300 300 300
% % %
Love and care for me 18,7 4,7 10,3
Good family relationships Understanding/co-operation/solidarity/ spend time together/united/communicate 18,3 28,0 17,3
Gifts Received gifts/money 8,7 4,3 5,3
Education Provide for education (all 1 need/sent to good school)
Performance (doing well at school/passed/ regular attendance
8,0
8,0
1,3
23,0
0,3
13,0
Basic needs Can maintain family/look after children/ never without food, clothing
7,0 3,7 2,7
Home improvement Improved/extendedhome/lifestyle/ furnishings and appliances (television) 6,3 4,7 7,0
Respect Respect me/mutual respect/children taught respect 4,7 10,0 10,0
Party Organised a party for me 4,0 1,0 3,3
Clothing 3,3 - -
Personal: good health 3,3 3,7 5,3
Financial support, mutual support 2,0 0,3 0,3
Marriage, engagement in the family 1,7 3,0 2,7
Employment Family member found work/got job 1,3 1,7 2,0
Electricity We applied for/installed electricity 1,0 2,3 1,7
Homeownership Family member bought house of own 0,7 0,3 0,3
Religious observance Family attends church/ reads Bible every day 0,3 0,7 1,3
Rfi

Main reason for being proud of family G3 G2 G1 continued n 300 300 300
% % %
Alcoholism
Family member gave up drink
Behaviour Parents happy with my behaviour/family well behaved
Help with homework
Other
Nothing
0,3 0,7 0,7
0,3 1,7 2,0
0,7 1,7
0,7
21,3 19,7 28,7
59

CULTURAL VALUES
Introduction Parenting and the family must be seen in the larger socio-cultural context. Children experience the wider environment through the values and norms of their families. In adolescence, the family influence is more subtle but nonetheless acts as a directive, if only to be rejected in youthful rebellion.
In South Africa, one might expect the general rule to be overturned: Intergenerational relations became strained during the 1980s when youth declared war on their elders and took control of community affairs. The older generations were forced to see the world through the eyes of the zealot youth.
Recent US literature on three generation families shows that although the rule of the transfer of values down the generations may be the overall norm, there is still considerable intergenerational influence. In particular, the older generations learn to be less conservative and to accept fashions and modern values through their children and grandchildren.
Earlier research into the situation of rank and file township youth (Mtfller, Richards, and Mthembu,1991) suggested that parental control was still intact and valued by youth, at least in some spheres of life. For example, youth were concerned that their families should support their leisure activities. Youth usually informed their parents of their whereabouts when they went out. This information might have been offered as a mere courtesy or for reasons of safety, a question still to be researched.
In the literature, the role of the family in communicating the social values which influence achievement development is fourfold: the family acts as interpreter, mediator, buffer, and as decision maker. All four functions may apply in the township setting. The role of family as interpreter and mediator of the culture of learning has been discussed in the section dealing with schooling in the home environment. We now turn to the role of the family as a buffer against externalities and as decision maker in educational matters.
The role of parents as buffers Recent anecdotal evidence collected by Nxumalo (1993) in KwaMashu suggests that teachers feel that parents are overly protective of their children who exhibit unacceptable behaviour at school. Teachers were also of the opinion that respect for teachers needs to be mediated by parents, who still retain the respect of children in the home. Loss of respect for the older generation and mutual respect and trust is a recurrent theme in recent research undertaken in the urban black community.
60

Parents who experience a sense of potency may instil in their children the confidence necessary to perform successfully at school. Pessimism on the part of the parents may cause educationally disadvantaged pupils to believe that academic excellence is unrelated to future occupational and economic success. In this study we have made liberal use of measures of parent well-being, parent self-esteem and potency, the rationale being that these factors may colour the atmosphere in the home. It is assumed that the parents' view of the future, their hopes and disappointments, and their sense of optimism or despair will subtly influence the tenor of daily interactions with the younger generation in the domestic situation.
The role of parents as decision makers In recent years South Africa has witnessed the growth of parent movements to address the crisis in education. This reflects a sense of potency at the collective level. At the individual level, parental decisions concerning the choice of school may be critical if the child is to benefit from the education on offer. Where parents must pay for basic education, the financial resources of parents may restrict the scope of parent decision-making. However, parental decision-making may be more subtle and less dependent upon economic resources as in the case of encouraging a child to take a vocational or academic stream, to attend school regularly or to do homework or read a book. The more subtle decision-making is often a reflection of the cultural values held by parents, the topic of discussion in this chapter.
Cultural values Research in other settings has shown that cultural values have an influence on educational motivation and achievement. Values are cultural givens which are assimilated during childhood and adolescence. The family is widely regarded as the primary socialisation agent which transmits cultural values. In a stable society values remain much the same over longer periods of time, and older and younger generations share similar ideas. However, in a society characterised by rapid change one might see values shifting in the course of a few decades.
Individual life cycle influences. People are born into a society and adopt its values as a matter of course. However, this does not mean that values are immutable and do not change in the course of a lifetime. Whereas younger children may accept their parents' values without question, adolescents may rebel against their parents' ideas. Later in life there may be convergence between the values of the younger and older generations. Rossi and Rossi (1990) argue that as the younger generation matures and shares the life experiences of the preceding generation, the values of their parents become more salient and acceptable to them. This is a continuing process and G2 individuals may come to share the values of their ageing G1 parents.
61

Societal influences. Values reflect people's understanding of how society works. Values represent continuity in the life of the individual and a people. Individuals need to attune their own values to changing experiences in the world around them. During periods of transition, the rapidly changing external situation may call into question values which have been internalised. Societal change impacts on people of all ages and may cause the values of an entire population to change. Value shifts are an indication of a society in change. One usually expects the youngest generation which is unhindered by the weight of experience to adopt such changes with greater alacrity or enthusiasm. For the older generation changing one's values may be tantamount to dropping the friends of a lifetime and to betrayal of one's cultural heritage. It is generally believed that older persons are more conservative and reluctant to change the values of a lifetime. This may account for the so-called 'generation gap' in ideas.
To sum up, when reviewing the values expressed by three generations we would expect core values to be resistant to change. Some discrepancies between generations might be accounted for by temporary youthful rebelliousness or lack of maturity. In the following section we review some of the values held by the three generations in the study.
Educational values Regarding educational values, John Ogbu's observations of black schoolchildren in US ghettos are pertinent to the South African educational scene (Slaughter & Epp, 1987). Ogbu argues that subcultural minorities which have experienced caste-like restrictions in access to education may develop largely negative attitudes towards the school setting. In South Africa, black reactions to Bantu education fit this description. Many schools were burnt to the ground during the turbulent 1980s. However, the question remains whether broader educational values and aspirations have been stifled in the process. Consider that school boycotts and strikes are mainly a reflection of how strongly young people feel about the quality of education they are receiving. The value of education, either as a value in itself or as a channel for advancement, may still be intact. This study has looked at how township families view the salience of education in their lives. Is education an end in itself, expressed by thirst for knowledge, love of learning for the sake of knowledge, or is education seen as an instrumental value, i.e. as a passport to a job. Without either type of motivation, black advancement in education is in jeopardy.
The'education before liberation' movement of the 1980s may have enhanced rather than devalued the value of education. Freedom and education were placed in the balance. By expecting youth to sacrifice their education in the name of human rights, education may have assumed mystical qualities. On the other hand, the economic recession may have undermined the instrumental value of education for many adolescents. Youth face a dilemma. The few available job openings most
62

certainly require formal educational qualifications. Most youth will know of individuals in their circle of acquaintances who are out of work in spite of higher educational qualifications. The recession has caused inflation in education. Jobs which a few years ago called for a matriculation exemption now call for post-matric qualifications. Inflation in education is partly a reflection of the lowering of standards in education. At the same time the cost of education has increased. School-leavers report that they are caught up in a vicious circle. Potential employers are looking for applicants with practical job experience as well as formal qualifications. However, without entering the job market, they cannot gain the requisite experience for their first job.
It is argued that the peer culture provides alternative opportunities for adolescents, young males in particular, to demonstrate competence and self-respect which cannot be found in the schools. In many township schools, the school culture has given way to peer culture. Peer culture, the culture of socially deviant groups, or highly politicised student organisations have disrupted the regular classroom schedule and displaced school culture. In consequence, many schoolchildren experience little distinction between school and leisure time.
Findings An inventory of 42 statements calling for an 'agree-disagree' or 'true-false' response were read out to all respondents at the end of the main interview.
For practical purposes we shall assume that core values are those which are taken for granted and accepted without question by the majority. In Table 16 all statements endorsed by over 70 percent or less than 30 percent fall into the band of core values which we assume are self-evident truths. The level of uncertainty indicated by the percentage of 'undecided' or 'don't know' responses may be a sign of individual or societal value shifts. Items are ordered according to broad topics to gain a better overview.
Authority and discipline Educationists argue that students who are less dogmatic and rigid in their thinking are more receptive to innovative study habits. In particular they may be able to study on their own with less direct help from teachers. Personal responsibility for pursuing one's studies may be of great importance to township pupils whose education has been disrupted.
Conservatism is thought to be more characteristic of the older generation. However, during times of social transition a swing to conservatism and authoritarianism is anticipated. The need for strong leadership and direction is a typical reaction of people in uncertain times.
Figures in the top band of Table 16 indicate that attitudes towards authority are not clear-cut. Noteworthy is that there is a high level of acceptance that
63

contemporary youth need direction. Core values are discipline and obedience to parents without question. Substantial proportions of all generations accept these values. However, a significantly lower proportion of G3 youth endorsed these items.
There is also lack of consensus between the generations concerning the exposure of youth to new ideas. The two older generations felt strongly that young people should not be allowed to read subversive literature ('books that confuse' young minds). Only 65 percent of the youth felt this way. A maturity effect may be operative here. A slightly higher proportion of the youth over 17 years indicated that the reading of their younger counterparts should be subject to censorship.
There is greater consensus between the generations on the other items designed to measure authoritarianism and conservatism viewpoints with no specific reference to inter-generational relations.
There is also lack of intra-generational consensus. For example, there is substantial uncertainty regarding public whipping for social deviants, strong leadership, adherence to the ways of the forefathers, and restrictions on the freedom of women. The question of women's rights is the most controversial issue with only half of the G3 and G2 generations agreeing that ' it is only natural and right that women should be more restricted in some of the ways in which men have more freedom'.
Moral issues The level of acceptance of the two moral items in the inventory suggest that there is a high degree of moral certainty. There was general disapproval for allowing truth to succumb to expediency and to cheat in exams.
Trust and confidence Majorities believe in mutual trust relationships and report the availability of a confidant.
Cultural continuity Other studies of educational achievement found that students whose belief in cultural continuity was strong tended to be more motivated to learn. In this study belief in the importance of the past was a core value for all generations.
Social tolerance Education is a threat to conservatism and intolerance. Education is thought to broaden horizons and acceptance for novel ideas and tolerance towards opposing views to one's own. In the past education as a value was rejected by groups in society who feared that the old social order might be overturned or that young people might adopt fancy ideas or reject their parent's authority and the ways of the forefathers.
64
It is argued that the breakdown in the culture of learning is a symptom of the current social tensions in the townships. Social tolerance has been one of the first casualties of the student unrest of the 1980s. The items used in the survey were meant to tap the notion of ubuntu or humanity, which translates roughly into the concept of social respect.
Judging from the survey response to two related items, the abstract notion of respect for other people is a core value; qualified social tolerance is not. About 95 percent agreed with the item: 'The most important thing that a person can learn is to respect others and be tolerant of their ideas'. The item in question is a double-barreled one, so one cannot be certain if respondents were endorsing the notion of respect for the person or the tolerance of the persons' ideas or both. Only about half were prepared to respect persons whose values they did not share: 'There can be no respect for people who have ideas which you do not share.' Judging from the reactions to the second item, it seems that respect demands value consensus and there is a question mark over unqualified social tolerance.
The level of uncertainty is relatively high indicating that the social tolerance issue might be a value under review. In line with the notion of the more conservative older generation, G1 respondents indicated the highest intolerance for different ideas.
Familism Of all the values under study here, the greatest degree of certainty was attached to family values. Respondents believed that the attitudes and behaviour of individual members should conform to the needs of the family. Furthermore, there should be consensus of opinion in the family on important matters.
Surprisingly the views of grandparents on family issues are not very much stronger than those of the younger generations. There appears to be less consensus between the generations when it comes to the practical application of family norms.
The most controversial statement in the set referred to a practical parenting issue concerning the independence of the youngest generation. There was lack of consensus within and between generations concerning the item: 'parents must allow their children to make their own decisions'. The majority of all respondents (G3:54 percent, G2:60 percent, G1:71 percent) believed children should not make their own decisions. However, among the older group of youth (17 years and older) only 47 percent endorsed parental decision-making on their behalf. The level of acceptance of the younger G3 youth with 63 percent is more similar to that of their parents.
65

A reflection of youthful rebelliousness may be found in the response pattern to the item: 'If your family disapproves of the company you keep then you should change it. ' Only two thirds of the G3 youth compared to 77 percent of their parents and 83 percent of their grandparents were prepared to bow to family dictate on their circle of friends.
Filial piety, the obligation to look after one's parents in old age,is intact. Over 90 percent in any generation believe in this norm. There are, however, signs that practical concerns may be eroding traditional norms of filial piety. Using the 30 percent mark as the criterion, two items related to filial piety do not qualify as core values. Just over one-third in the younger generations agreed that 'it is better for older people to be cared for by experts like nurses than by their families'. Twenty-seven percent of G1 respondents shared this view. Over one-third of the middle and older generation were of the opinion that 'grandparents tend to be financial burdens on their families'. The older G3 youth were more likely to echo this viewpoint than the younger members of their age cohort.
Virtually all respondents prescribed activity as the key to successful ageing. On the other hand, over 70 percent in each generation associated dignity in old age with sedentary habits ('It is dignified for grandparents to sit and rest most of the time'). One must assume that the respondents saw no apparent contradictions in these two viewpoints.
Education The education items used in the survey are all controversial ones which fall within the 30 to 70 uncertainty band. The description which follows starts with the least controversial and moves to the items which achieved somewhat greater consensus.
About 30 percent to one-third in all generations agreed that the main thing was to pass their subjects at school. However, in view of the low level of matric pass rates in black schools, the 50 percent score referred to in the statement may have seemed overly ambitious to many respondents.
Thirty percent of G3 respondents and over 40 percent of parents and grandparents agreed that working in a job might be a greater learning experience than high school. Again, this viewpoint may be a reflection of the poor standard of black education rather than a negation of educational values as such.
Over one third and slightly more youth than parents and grandparents agreed that 'there are other more important things in life than studying and doing well in school'. Taken at face value, this response indicates that little value is attached to education. Alternatively, endorsement of the importance of other values besides education can be interpreted as a balanced viewpoint and a sign of maturity. The
66
schoolgoers in the sample can hardly be accused of being obsessed with educational achievement to the exclusion of other activity.
The last item concerns the entitlement of youth to jobs regardless of their educational qualifications. The item read: 'school leavers are entitled to jobs even if they don't pass matric because they need a break.' Half the parents and grandparents agreed with the statement, but only 38 percent of youth. It is difficult to interpret responses unambiguously. In terms of cognitive dissonance one might suppose that youth still at school would be reluctant to admit that matriculation exemption is not the passport to s job. If this interpretation is correct the youth vote is more indicative of the instrumental value of education than the votes cast by their parents and grandparents.
To sum up, the education items were meant to be provocative and reactions suggest that this was the case. The disadvantage of provocative items is that responses are difficult to interpret. One can say with conviction that people are not obsessed with education. None of the items referred to education or to learning as ends in themselves and there appears to be some disillusionment regarding the instrumental value of education. This may be a reflection on the state of economy rather than an indication of deep-seated anti-education feelings. Youth appear to be less disillusioned than their parents. This may be a healthy sign that young people still hope to gain from their education.
Personal control, fatalism Slightly more than one-third in any generation stated feelings of powerlessness. Approximately one-third believed that a person cannot rise above his or her family background and that one cannot determine one's own fate. One-third stated that they do not insist on voicing their own opinion if it is not shared. Younger members of the G3 category were less likely than their older counterparts to feel in control of their lives which may be a reflection of their objective situation. Between 80 and 84 percent in any generation indicated satisfaction with control of their lives. Well over 70 percent of G3 respondents over 17 years and G2 and G1 respondents agreed that they determined their personal destiny. This meets the 70 percent criterion of group certainty. The fact that the younger group of G3 respondents fall below the 70 percent mark may have more to do with their actual situation than with their belief in fate.
Self-esteem Items on anxiety and self-esteem were introduced into the study as control measures. Anxiety and self-esteem are considered to be intervening variables which amplify or depress educational motivation and achievement. Students who are anxious and lack self-esteem have been known to perform below capacity.
67

The direction of causality between anxiety and self-esteem on the one hand, and educational motivation and achievement on the other, is uncertain. Anxiety and self-esteem may be less stable than the values discussed above.
Temporary loss of self-esteem may have a negative effect on the motivation to learn and to perform well. Conversely praise or encouragement for promising performance may relieve anxiety and boost self-esteem so that students break out of the vicious circle of underachievement.
Ten items were used in this study to tap anxiety and self-esteem as shown in Table 16. Scores on eight of the items were outside the 30-70 percent band, indicating low anxiety and high self-esteem. Only on two self-esteem items was there evidence of feelings of low self-worth and lack of self-confidence. Approximately one in three persons felt 'I don't have much to be proud of ' , and approximately 60 percent stated that 'there are very few things I feel sure about.' Although not significant in most cases, a general trend was observed for self-esteem to be less pronounced in the older generations.
To sum up, lack of personal efficacy appears to be a more widespread problem for the youth in the study than self-esteem. Lack of self-esteem affects only a minority of high school students. Moreover, this pattern obtains in all generations and is not unique to adolescence. This last finding bodes well for building the self-confidence required among the youth to achieve in their educational careers.
68

Table 16
Attitudes and values
Percentage agreeing with statement/ G3 indicating statement true % Figures in brackets refer to 'uncertain' responses
G2 %
G1 %
Authoritarianism, conservatism, discipline The most important thing to teach children is to obey their parents without question 72
Young people should not be allowed to read books that are likely to confuse them 66 (3)
Things are so complicated these days, the only way to know what to do is to rely on strong leaders 58(10)
It is wrong to do things differently from the way your forefathers did 53 (8)
People who disregard community rules should be publicly whipped or worse 33 (4)
It is only natural and right that women should be restricted in some of the ways in which men have more freedom 50 (5)
What the youth need most is strict discipline 78 (3)
Moral issues If something you do works out it does not matter whether it is right or wrong 27 (7)
It is not right for students to cheat in their exams even if they risk failing by not doing so 86 (1)
Trust
Most people can be trusted if you trust them 70 (3)
Cultural continuity Knowing about our people's history is just as important as knowing about the present 85 (4) Tolerance The most important thing that a person can learn is to respect others and be tolerant of their ideas 95 (2)
There can be no respect for people who have ideas which you do not share 51 (7)
76
80 (1)
66(10)
64 (4)
48 (2)
90 (1}
29 (6)
87 (1)
70 (2)
85 (5)
94 (2)
49 (6)
91 (1)
82 (2)
64(13)
74 (4)
25 (5) 32 (8)
63 (3)
96
6(30)
87 (1)
68 (9)
88 (5)
97 (2)
57 (7)
69

Attitudes and values continued
Percentage agreeing with statement/ G3 indicating statement true % Figures in brackets refer to 'uncertain' responses
G2 %
G1 %
Education
There are other more important things in life than studying and doing well in school 3 3 ( 4 ) 3 6 ( 1 ) 3 8 ( 3 )
A person can learn more by working in a job for five years than by going to high school 30 (5) 42 (4) 41 (9)
It is a waste of effort to pass subjects at school with more than 50 percent (madoda
scores), the main thing is to pass 31 (2) 3 4 ( 5 ) 32(12)
School-leavers are entitled to jobs even if they
don't pass matric because they need a break 38 (3) 51 (1) 53 (5)
Familism Parents must allow their children to make their own decisions 4 3 ( 3 ) 3 8 ( 1 ) 2 7 ( 2 )
It is good for a child to have the same ideas on important matters as his/her parents 77 (3) 81 (4) 85 (3)
Family members should give more weight to each other's opinions than to those
of outsiders 9 3 ( 1 ) 9 3 ( 1 ) 9 7 ( 1 )
Spending time with friends is more important
than spending it with your family 1 7 ( 1 ) 1 0 ( 2 ) 1 0 ( 2 )
If your family disapproves of the company
you keep then you should change it 65 (4) 77 (4) 83 (2)
It is a child's duty to look after his/her parents when they are old 9 0 ( 1 ) 89 9 5 ( 1 ) It is better for older people to be cared for by experts like nurses than by their
families 35 (2) 32 (1) 27 (1)
Grandparents tend to be financial burdens
on their families 3 0 ( 7 ) 3 7 ( 1 ) 3 6 ( 2 )
It is dignified for grandparents to sit
and rest most of the time 71 (1) 7 2 ( 1 ) 74
Active older people are happier than those who just sit around 90 (3) 96 (2) 95 (2) 70

Attitudes and values continued
Percentage agreeing with statement/ G3 indicating statement true % Figures in brackets refer to 'uncertain' responses
G2 %
G1 %
Persona] control, fatalism
A person born into a poor family will not improve his lot even if he is ambitious and
hardworking 34 (1) 30 ( ! ) 36
What happens in my life is my own
doing 68 77 74
I always insist on my own opinion even if
the group disagrees with me 65 61 60
Anxiety
I often feel powerless to get what 1 want
out of life 45 58 56
I often feel downcast and dejected 19 29 27
Self-esteem
Mostly I feel just as adequate and
worthwhile as others 87 87 82
I feel satisfied about who and what
I am 91 84 86
All in all, I am inclined to feel I am
a failure 8 17 19
I am able to do things as well as most
people 91 92 83
Sometimes ! think I am no good at all 25 22 27
I feel I don't have much to be proud
of 34 34 39
When I do a job, I do it well 94 96 96
I often feel useless to others 16 18 21
There are very few things I feel sure
about 60 62 59
Availability of a confidant I have a person to whom I can confide all my problems 79 89 81
71

DISCUSSION AND CONCLUSIONS: TOWARDS AN INTEGRATED SUPPORT SYSTEM FOR HIGH SCHOOL PUPILS
[n this final chapter an attempt is made to pull together the various strands of the inquiry. The aim is to explore the links between the topics introduced so far: the school experience, the home environment, family solidarity, and cultural values.
In order to gain a better overview of the material collected in our 300 families, a series of exploratory bivariate and multivariate analyses were conducted. We compared the various attitudes and behaviours reported by the G3 pupils in the study concerning their school and home life, family interactions, and their values against four measures of achievement. The outcome measures were:
o Whether pupils were 'on track' with their schooling, i.e., in the right school class for their age;
o How well they had performed in the mid-year examinations: the number of school subjects passed in relation to numbers of subjects taken;
o Perception of doing well in school;
o Perception of school life as an exciting and rewarding versus a frustrating experience.
The first two 'objective' measures are admittedly crude yardsticks, but the best we could obtain under the circumstances. The third and fourth measures are subjective ones which may give greater insight into the reality of school life. They too are not unproblematic in that they may reflect temporary states and are related to one another. In spite of these limitations, the results are promising.
As more pieces of evidence were added bit by bit to the jigsaw puzzle, a clearer picture emerged. The picture is by no means complete - not all pieces have fallen into place - but even at this stage the broad outlines are discernible.
To conclude this report a broad brush picture of emergent themes is painted. For the sake of brevity and readability, statistical information is omitted and only the dominant themes are discussed under broad headings.
Maturity and gender issues Few gender differences were observed in attitudes and values or achievement. However, it is apparent that high school students, as they grow older, also become more critical and disillusioned. Of particular concern is that the older students find school life less rewarding precisely at the stage when they need to
72

be giving of their best. There is some slight evidence that pupils in the last years of high school may be getting better grades than the younger students, so the problem may be one of morale rather than aptitude. One cannot overlook the possibility that the older youth are reflecting on their life chances beyond matric, which strictly speaking is beyond the scope of this study which focuses on high school achievement. If we review only the current situation, another possibility is that the older pupil receives less support in the home either by choice or necessity. Our data suggests that the older pupils look outside the home for assistance with homework and tend to associate more with their peers than family members. On the other hand, there are trends which point to growing convergence of ideas between the younger generation and their elders as they mature. Questions concerning the relationship between peer and family influence and its effect on subjective well-being needs further investigation.
The achiever The student who gets C or D symbols (50 percent-69 percent) is the prototype of the achiever according to the criterion of good examination results. The C-D student is the dominant type in the sense that most students who were awarded higher marks in some of their subjects, achieved the typical C-D results for their other subjects. Pupils who achieve A or B results (over 70 percent) and passes in Maths or Science subjects are the exception rather than the rule. In the regression analysis, overachievement in terms of A,B results or a Maths/Science pass made independent contributions to good examination results.
The attitudes of pupils seemed to play an important part in the overall distribution of marks of achievement. Strong educational aspirations and perseverance were the attitudes which were associated with good examination results.
The motivated high school pupil The prototype of the well-motivated high school youth is the pupil who likes going to school, never misses school, feels he or she is doing well at school and knows that the family is supportive of efforts to do well in school. The peace of mind resulting from good family relationships appears to enhance the rewarding school experience. Students need to have faith in their schools and their teachers. Enrolment in a school that received a positive rating from pupils was positively associated with the good school experience. As mentioned earlier, a positive response from teachers appears to be a critical factor in sustaining good study habits among pupils.
Morale There are many signs in the data that a positive outlook on life and good morale may be a prerequisite to achievement. More than likely it is also a consequence of good school performance. Certainly, on-track students were ones who had a
73

cheerful disposition, looking on the bright side of life. The theme of positive morale is a recurrent one. It may in part be rooted in material advantages, but it is also strongly related to a positive home environment and good family relationships and self-confidence. However, the personal well-being which may be born of security in the home appears to operate as an independent factor which assists pupils to sustain good performances in the longer term.
Of course the causality question remains, but from a practical point of view morale as an achievement-enhancing factor in education cannot be discounted. The promotion of morale or positive adjustment of students may require better co-operation between teachers and parents. The results of this study suggest that morale is not just a personality trait with which people are born. Family influence may be crucial. Family support may act as a buffer to help pupils to weather personal setbacks. However, the family back-up system cannot withstand all negative influences from outside. Poor teacher attitudes appear to depress morale and demotivate pupils.
Self-esteem Self-esteem is related to morale and cannot be overlooked when discussing pupil performance. It appears that pupils with high self-esteem and the backing of a happy family life gain more from their school experience. Promoting self-esteem in the child may by and large be a task for parents and guardians. The school can then build on this foundation. The picture gained from our data so far is that a strong sense of family orientation goes hand in hand with self-confidence. The transmission of self-esteem through the family is a further area for intervention in the field of education which may have been neglected so far.
Parents as educational decison-makers: the role of good schools for educational achievement Direct family influence on educational achievement through socio-economic status cannot be discounted. Children attached to the more affluent households appear to be advantaged in terms of the calibre of reference persons and choice of school environments. For example, the educational attainment of co-residents was higher in the more affluent homes, which may have influenced the higher educational aspirations of the pupils and parents in these homes. Pupils from the more affluent homes were more likely to attend private schools, suggesting greater leeway in parental decision-making concerning education.
Nevertheless, the broad picture suggests that it is the quality of the school rather than the socio-economic level of the household which is the critical factor for educational achievement. There are signs in the data that some pupils from less affluent backgrounds and from households with unemployed members are doing better in school than others. The unemployment factor may be masking regional differences. Even if this were the case, these preliminary findings suggest that
74

non-material support factors may be as important as material ones for student well-being and achievement. In some instances, parents may be able to overcome socio-economic disadvantage and exert their positive influence with regard to choice of school and the quality of education which their children receive.
In terms of parental influence, certainly the choice of school appears to be critical. The good school factor, as assessed by pupils and parents is of course only a proxy measure. Although it was introduced merely as a control factor to eliminate the influence of major differences in standards of excellence, it tended to consistently dominate the picture even in connection with the more objective outcome measures. In the light of these findings, the concern expressed by some parents that they could not afford to send their child to a better school or wished to transfer their child to a better school may be justified. There may be further factors involved here than the quality of the school as such. It is possible that the lack of confidence in the quality of the school in which the child is enrolled may have a negative influence on the motivation and performance of the child over and above the poor standard of schooling.
After the critical choice of the school, the second parent choice factor relates to extra schooling. Extra-curricular schooling such as Saturday school and Winter school seem to give the successful pupils an edge over their peers. One may regret that additional schooling is necessary to achieve good school results. Some might argue that the need for extra schooling reflects poorly on the regular education system. Be that as it may, the results of our study suggest that Saturday school enhances the chances of success of high school pupils. Saturday school, more than other extra-curricular options, represents a sustained year round effort. Our evidence suggests that Saturday school may reinforce achievement-enhancing values and motivations which are transmitted in the home.
The role of the supportive home environment Once the decision concerning the choice of school is made, the family influence on schooling patterns may be more subtle but nevertheless important. Strong family values, a sense of solidarity, and above all peace and harmony in the family appear to provide a firm basis of security for high school youth. Pupils who expressed pride in their family and were assured of a reference person in the family who took an interest in their education were more likely to remain on track and feel they were making progress at school.
In homes where a person takes an active interest in schooling issues, the child is likely to do homework at home rather than away from home, and the mother or grandmother is often the person who assists with homework. Where a friend assists there are no apparent signs of friction between family and peers. Findings are suggestive that the pride that a schoolchild takes in his or her family is in part derived from the interest and encouragement received for good school
75

performance. Pupils expressed gratitude and pride with respect to their parents' material investments in their education and support and encouragement.
The presence of a key reference person in the family, the education 'mentor', as we have called this person, may play an important role in passing on the motivation and the values which are conducive to academic achievement. Typical parenting styles in the families under study incorporated a mix of encouragement and reinforcement of good performance and disapproval for poor study habits. Good performance was praised and encouraged - often with reference to the honour of the family. Irregular attendance at school met with parental disapproval. The majority of parents stated they were angry and upset if their child missed school. It is perhaps telling that pupils whose mothers assisted them with their homework were more likely than others to adopt an anti-school-boycott stance. This negative view of disruptions in education may have been influenced by parental attitudes.
Our study material suggests that the choice of an education reference person outside the home may reduce family solidarity. Where the mother or grandmother does not assist with homework, an age peer outside the home may act as homework partner. Further results are suggestive that where tension exists in the home pupils look to their age peers for emotional support. For example, pupils who were most likely to have access to a person in whom they could confide their problems were individuals who had upset their parents by missing school. Others in this category expressed no pride in their families.
Family values and firm direction Strong family values, which go hand in hand with satisfaction with family life and pride in one's family, may provide the firm direction which youth need to succeed in school. An interesting finding is that the measure of family cohesion used in the study was associated with authoritarian values, suggesting that family solidarity may provide youth with the firm guidance and sense of direction they need to succeed. Results from the time budgets indicate that pupils felt compelled by a sense of obligation or duty to go to school, do homework and study for exams. This sense of commitment may be a product of strong family values.
Other results suggest that the direction which family values give does not stifle personal initiative and self-direction. On the contrary, family values appear to instil values of self-reliance in education and hard work. Pupils who came from homes where an interest was taken in their schooling were more likely to express self-directed motivations. In homes which offered support to the child the recipe for success was a love of learning and perseverance. Other-directedness was more pronounced among pupils who came from homes where there was no education mentor. The latter group were more likely to think that doing well at school rested with their teachers rather than themselves.
76

Social tolerance and mutual respect We have reviewed results which identified on-track students and pupils who felt they were doing well in school as the individuals who received support from their families and expressed pride in their families. Different combinations of results showed that on-track students tended to express more progressive and anti-authoritarian views than most of their age peers. Similarly pupils who were doing well in school were more likely to express tolerance for persons whose ideas differed from their own. It is likely that the self-confidence derived from security in the home may promote greater social tolerance. The need for mutual respect emerged as a dominant theme in the discussion of family life. It was evident that the norms of respect for others practised in the home were used as the standard for judging pupil and teacher behaviour in the classroom and the school yard. Good interpersonal relations in the family and mutual respect were considered the foundation of family solidarity by members of all generations. These findings indicate that during the transition period families may be capable of sustaining the moral values which may ease the current social tensions in the wider community. In other words, the family is still laying the foundation on which education can build: education to broaden horizons and open minds.
Competition between family and peer influences The three generation study was not designed to examine extra-family influences on learning behaviour. Therefore note should be taken in the instances where outsiders crept into the picture without prior invitation.
Our data material intimates that youth may be disappointed with their families if they do not receive educational support in the home. Where youth are alienated from their families they may seek alternative reference groups. For example, in the cases where the mother or grandmother did not assist with homework, an age peer outside the home often acted as homework partner. Youth who stated that they needed a person in whom they could confide their problems were predominantly individuals who had upset their parents by missing school. Persons with access to a confidant were also more often individuals who expressed no pride in their families. Similarly, the members of study groups were more willing than other youth to state that they were not proud of their families. Taken together, these results suggest that where tension exists in the home pupils look to their age peers for educational and emotional support. Alternatively, peer influence may be the source of tension in families.
Educational reference groups outside the home The study uncovered a range of memberships which may act as additional support groups for high school pupils. It appears that memberships do not overlap to a great extent and each type of support group embodies different strategies for
77
academic success. A characterisation of the groups is based on a composite picture gained from bivariate analysis.
Gangs. Members of gangs are a minority group. They tend to be older youth who do not belong to youth clubs or study groups. Their strategy for staying on track is extra lessons and longer hours of study. It is possible that gangs need to make up for time lost because of missing school during the past year. There are indications that gang members are dissatisfied with their teachers which may account for the need to participate in extra lessons. Gang members enjoy educational support in the home and many help their siblings with their homework.
Youth clubs. Members of clubs tend to be younger than members of gangs. Club members don't hang out with friends like members of gangs, suggesting that the former mix mainly with fellow club members. Unlike most youth in their age group they do not find school rewarding. It is possible that their dissatisfaction is related to a more critical view of the current problems in education. Youth club members have the higher educational aspirations which are characteristic of high school pupils who manage to stay on track and achieve good marks in school. There are no signs of alienation. Youth club members express pride in their families.
Study groups. An alternative to gang membership is the study group or the Saturday school. There are signs of alienation here. Study group members are more likely to complain about family life than others. The study group's strategy for success is long hours of homework.
Saturday school. Pupils who attend Saturday school do not belong to a study group. Saturday school membership is indicative of finding school rewarding, staying on track and achieving good marks. Members have higher educational aspirations than other youth.
Winter school. Persons who attend Winter school express the two values which were most often associated with high marks in the mid-term examinations. Their motto is to try until you succeed. Winter school pupils share the high educational aspirations of their Saturday school counterparts and often assist their younger brothers and sisters with their homework. Dual membership in Saturday and Winter school is possible.
The results suggest that the Saturday school strategy is currently the most successful one for educational achievement, the study group the least successful one. There are indications that the extra lesson strategy adopted by gang members is a stop-gap one which allows gang members to stay on track but not to achieve better marks. Gang members may lack the high educational aspirations that drive the persons who adopt the other winning strategies.
78

Three recipes for success Saturday school pupils, Winter school pupils, and youth club members share the high educational aspirations which appear to be associated with good marks at school. In turn high educational aspirations are associated with three recipes for success.
Love of learning Perseverance: 'try until you succeed' Hard work: 'study hard'
Love of learning appears to be in opposition to the hard-work strategy to success. The former is also the strategy which is more often advocated in homes where there is an education mentor. It appears that this more playful approach to education is foreign to many high school pupils. The more serious approaches gain more favour. Love of learning may reflect more the intrinsic value of education which was rarely expressed by the G3 respondents in the study. A recurrent theme was the implicit instrumental or means-to-an-end value of education in daily life. This finding confirms earlier research on the education values of young people in the townships: Education is worthwhile but not particularly fun. An intriguing question, still to be explored, is whether youth who were motivated by intrinsic satisfaction with educational activities, i.e. who enjoyed their school or homework, would endorse the love of learning recipe for success.
The teacher factor The notion of individual perseverance as the means to success advocated by some of the better achievers among the pupils in the study was in direct opposition to the idea that success rests with the teacher. Homes in which there was plenty of support for the school child were less inclined to support the value of good teachers over self-direction in study. On the other hand, pupils who endorsed the importance of teachers were more likely to seek educational support outside the home. It is possible that pupils who were not doing well at school and received less educational support in the home were using their teachers as targets for misplaced anger. Pupils who were opposed to school boycotts tended to attach more importance to the role of teachers in achieving success in education.
Perseverance, hard work and love of learning, the three recipes for success advocated by the majority of pupils, suggest that pupils can manage on their own without the help of the teacher. Although no questions in the study addressed the role of the teacher directly, it emerged as an important theme. Pupils stated that they felt motivated and enjoyed going to school if their teachers kept them interested in their learning. Complaints about teachers were cited as the main cause of pupil demotivation. Pupils who liked to learn and never missed school were ones who were happy with their teachers and described their school lessons
79

as interesting and exciting. Pupils explained that they needed to see their own enthusiasm for education reciprocated by their teachers.
Although we set out to describe the major themes which emerged in the study, it may be equally important to mention a theme which so often plays a prominent role in the discussion of education issues in South Africa. Very often the blame for the poor track record of township schools is attributed to poor educational facilities. In this study, poor educational facilities were not an issue - although they may have figured in the overall ratings that the respondents gave to the schools. It was the human factor which was centre stage. The response patterns stressed that people, their attitudes, values and behaviour hold the key to educational satisfaction and achievement.
80

Conclusion The picture gained from this study of three-generation township families confirms the idea put forward in the literature that the well-adjusted school child is one who feels equally comfortable at home and at school. This adjustment appears to be the product of the co-operation between reference persons in the home and the school and the convergence of the values promoted in school and at home. The study has highlighted the important role of parental decision-making in the choice of school and extra-curricular schooling. Given the current education crisis the schoolchild who has the regular benefit of extra tuition may have an edge over other age peers. The influence of family cohesion and the self-confidence and positive outlook on life which strong family values seem to foster are factors which have been overlooked in the education question. This is not to say that excellence in teaching and good facilities are not important. The results of this study suggest that schools will achieve more if they receive the backing of parents. Three generation families may be better equipped than smaller families to assume the educational support role in the home in that they have more human resources. However, there is nothing in the findings of the study to suggest that smaller families cannot play similarly positive roles in education. The optimal combination for the positive school experience occurs when pupils like to learn and teachers like to teach and parents take an active interest in their children's progress. The three generation household study has demonstrated how families can best play their part in education.
81

SELECT BIBLIOGRAPHY
Alwin, D.F., Thornton, A. 1984. Family origins and the schooling process: Early versus late influence of parental characteristics. American Sociological Review, 49(6):784-802.
Atkinson, M.P., Kivett, V.R. & Campbell, R.T. 1986. Intergenerational solidarity: An examination of a theoreticl model. Journal of Gerontology, 41(3):408-416.
Caplan, N., Whitmore, J.K. & Choy, M.H. 1989. The boat people and achievement in America: A study of family life, hard work, and cultural values. Ann Arbor: University of Michigan Press.
Cosser, E. (ed.). Education for life: The challenge of schooling for all. Johannesburg: Christian Research, Education and Information for Democracy.
Elcardus, M. & Glorieux, I. 1992. Towards a semantic taxonomy: Classifying activities on the basis of their meaning. Unpublished conference paper. International Association for Time Use Research, Rome, June 15-18.
Everatt, D. & Sisulu, E. (eds). 1992. Black youth in crisis: Facing the future. Johannesburg: Raven Press.
Ferreira, M., MeSller, V., Prinsloo, F.R. & Gillis, L.S.. 1992. Multidimensional survey of elderly South Africans, 1990-91: key findings. Cape Town: HSRC/UCT Centre for Gerontology.
Glass, J., Bengtson, V.L. & Dunham, C.C. 1986. Attitude similarity in three-generation families: Socialization, status inheritance, or reciprocal influence. American Sociological Review, 51:685-698.
Hartshorne, K. 1992. Education and employment. In: Everatt, D. & Sisulu, E. (eds.). Black youth in crisis. Johannesburg: Raven Press, pp. 52-68.
Mangen, D.J., Bengtson, V.L. & Landry Jr.,P.H. (eds.). 1988. Measurement of intergenerational relations. Newbury Park, Calif.:SAGE publications.
Mare, R.D. & Winship, C. 1984. The paradox of lessening racial inequality and joblessness among black youth: Enrollment, enlistment, and unemployment 1964-1981. American Sociological Review. 49(1):39-55.
Miller, K.A., Kohn, M.L. & Schooler, C. 1986. Educational self-direction and personality. American Sociological Review. 51:372-390.
Mogano, R. 1993. The resurgence of pupil power: Explaining violence in African schools. Unpublished conference paper. Association for Sociology in South Africa, Johannesburg, January.
Mil ler, V. (ed.), Richards, R. & Mthembu, T. 1991. Lost generation found: Black youth at leisure. Special Report. Indicator Project South Africa, Centre for Social and Development Studies, University of Natal, Durban.
Mil ler, V., Schlemmer, L. & DuToit, S.H.C. 1987. Quality of life in South Africa: measurement and analysis. Report S-167. Pretoria: Human Sciences Research Council.
Moulder, J. 1990. Education for employment - It's purely academic. Special issue on education. Optima. 37(3): 106-111.
Mullins, E.I. & Sites, P. 1984. The origins of contemporary eminent black Americans: A three-generation analysis of social origin. American Sociological Review. 49(5):672-685.
Nzimande, B. & Thusi, S. 1991. 'Children of war': The impact of political violence on schooling in Natal. Education Projects Unit, University of Natal, Durban.
Nxumalo, B. 1993. The culture of learning: A survey of KwaMashu schools. Indicator South Africa. 10(2):55-60.
Roberts, R.E.L., Richards, L.N. & Bengtson, V.L. 1991. Intergenerational solidarity in families: Untangling the ties that bind. Marriage and Family Review. (16(1/2):11-46.
82

Rossi, A.S. & Rossi, P.H. 1990. Of human bonding: Parent-child relations across the life course. New York: Aldine de Gruyter.
Scott-Jones, D. 1987. Mother-as-teacher in the families of high-and low-achieving low-income black first-graders. Journal of Negro Education. 56(1):21-34.
Slaughter, D.T. & Epps, E.G. 1987. The home environment and academic achievement of black American children and youth: An overview. Journal of Negro Education. 56(1):3-20.
Smith, T.E. 1981. Adolescent agreement with perceived maternal and paternal educational goals. Journal of Marriage and the Family. 43:85-93.
Smith, T.E. 1984. School grades and responsibility for younger siblings: An empirical study of the "teaching function". American Sociological Review. 49(2):248-260.
Steele, S. 1990. The content of our character: A new vision of race in America. New York: St. Martins Place.
Sowell, T. 1981 Ethnic America: A history.New York: Basic Books. Young, M. & Willmott, P. 1973. The symmetrical family: A study of work and
leisure in the London Region.London: Routledge & Kegan Paul.
83

APPENDIX
84

Appendix
Household characteristics {1}
Area of residence %
Soweto
Diepkloof 5,7 Dobsonville 8,0 Dube 7,3 Moroka 13,7 Orlando East 9,3 Pimville 6,0
Durban Kwa-Mashu 25,0 Umlazi 25,0 n 300 100,0
Home language % Zulu 67,0 South Sotho 13,0 Tswana 11,7 Xhosa 4,0 North Sotho 3,0 Other 1,3 n 300 100,0
Soweto Durban Total
Mean length of residence in area (years) 28,7 26,6 27,6 G1 respondents lived in household for over 10 years 98 % 94 % 96 Mean household size 8,2 9,4 8,8
85

Appendix
Household characteristics (2) Total Total Total
G3 G3 G2 G2 G1 G1 n 300 1 382 300 822 300 379
Age Median years 17 15 38 35,5 66 65,5
Gender % % % % % % Male 50 48 22 41 12 24 Female 50 52 78 59 88 75
100 100 100 100 100 99
Head of household % % % % % % Yes 0 0 14 9 58 59 No 100 100 86 91 42 41
100 100 100 100 100 100
Male educational level attained n 150 423 66 334 35 91
% % % % % % None 3 2 26 22 Some primary 2 13 11 13 11 18 Primary 98 75 62 62 54 53 Secondary 11 20 21 6 4 Diploma 4 2 3 2
100 99 100 100 100 99
Female educational level attained n 150 453 234 484 265 288
% % % % % % None 1 1 18 18 Some primary 10 9 9 31 31 Primary 100 79 72 65 47 47 Secondary 11 15 22 2 2 Diploma 3 3 1 1 Don't know 1 1
100 100 100 100 100 100
Male occupation n 150 441 66 338 35 91 % % % % % %
School 100 76 5 Technikon/University 2 1 1 Full-time job 6 53 43 26 24 Part-time job 1 9 6 8 4 Retired/pensioner 5 3 60 67 Unemployed 14 32 42 6 4
100 99 100 100 100 99
86

Appendix
Household characteristics (2) continued Total Total Total
G3 G3 G2 G2 G1 G1 n 300 1 382 300 822 300 379
Female occupation n 150 473 234 484 265 288 % % % % % %
School 100 78 4 Technikon/University 1 0 Full-time job 5 52 47 14 14 Part-time job 2 13 8 5 5 Housewife 0 6 6 3 4 Retired/pensioner 2 3 73 72 Unemployed 14 27 32 5 5
100 100 100 100 100 100
87

Appendix
Religion G3 %
G2 %
G1 %
Mainstream Christian churches 45,7 53,7 52,7 Roman Catholic 19,7 15,0 13,3 African Independent Churches 15,0 15,0 17,3 Pentecostal churches 11,7 11,7 12,0 Other Christian churches 1,3 1,7 2,3 Muslim 0,3 0,3 0,3 Other 0,3 0,3 -
None 6,0 2,3 2,0 100,0 100,0 99,9
300 300 300
Marital status G3m G3f G2m G2f G l m G1f % % % % % %
Single, no steady girl/boyfriend 51 56 Single, steady girl/boyfriend 49 44 Single 36 50 3 3 Married, living together 51 27 60 21 Divorced, separated 11 15 11 4 Widowed 2 8 26 72
100 100 100 100 100 100 150 150 66 234 35 265
Co-resident spouse % % % % Yes 85 84 91 90
33 63 21 57
Rural-urban background G2 %
G1 %
Grew up in: Town Rural areas Both
78 15
7 100 300
34 54 12
100 300
88

Appendix
Quality of life indicators G3 G2 G1 % % %
n 300 300 300
Socio-economic group (interviewer rating) A highest B
D iowest
Self-assessed socio-economic status Wealthy, rich Living comfortably Making ends meet, no luxuries Scraping an existence, poor destitute
Life satisfaction Very satisfied, satisfied Neither, nor Dissatisfied, very satisfied
Life is: Rewarding In between Frustrating
Exciting In between Boring
Getting better In between, about the same Getting worse
Self-assessed health (Relative to age) Feels fit and healthy
4,0 20,3 61,0 14,7
0,3 1,0 1,7 25,0 18,0 14,3 66,7 71,3 70,3
8,0 9,7 13,7 100,0 100,0 100,0
64 47 47 18 22 23 18 31 30
100 100 100
63 41 35 25 26 35 12 33 30
100 100 100
66 44 37 21 23 33 13 33 30
100 100 100
74 52 42 16 19 28 11 29 30
100 100 100
94 90 66
89

Appendix
Social integration indicators G3 G2 G1 n 300 300 300
% % %
Availability of a confidant 79 89 81 Hangs around with friends on regular basis 62 * *
Hangs around with a gang on regular basis 20 * *
Belongs to a club which meets regularly 28 28 30 Belongs to a youth club which meets regularly 26 * *
* Not asked
90

This work is licensed under a Creative Commons Attribution - Noncommercial - NoDerivs 3.0 Licence.
To view a copy of the licence please see: http://creativecommons.0rg/licenses/by-nc-nd/3.O/