Embed Size (px)
Citation preview

To Be a Good Corporate CitizenTo Invest in Our Country
To Invest in Our PeopleTo Empower Our Communities
To Conserve Our EnvironmentTo Value Human Rights
To Create WellnessTo Encourage Responsible Consumption
To Invest In Our Country’s Culture& Sports Through SponsorshipTo Give Back To Our CommunityPROUDLY TANZANIAN SINCE 1933
THE HOME OF FINE BEERS
INTRODUCING
THE TASKSOF TBL
ANNUALREPORT
2015
A subsidiary of SABMiller plc

TBLANNUALREPORT
2015TABLE OF CONTENTS
10 Year Review 2
Group Cash Value Added Statement 3
Chairman’s Statement 4
Taarifa ya Mwenyekiti 6
Vision, Mission & Company Values 8
Director’s Report 9
Statement of Director’s Responsibilities 15
Managing Director’s Report 16
Ripoti ya Mkurugenzi Mtendaji 18
TBL Responsible Way - Kuwajibika kwa TBL 20
Report of the independent auditor 22
Financial Statements:
Statement of Profit or Loss and Other Comprehensive Income 23
Statement of Financial Position as at 31st March 24
Statement of Changes in Equity 25
Statement of Cash Flow 27
Notes on the Financial Statements 30
The Tasks of TBL
Task 1: To be a Good Corporate Citizen 21
Task 2: To Invest in Our Country 28
Task 3: To Invest in Our People 35
Task 4: To Empower Our Communities 40
Task 5: To Conserve Our Environment 44
Task 6: To Value Human Rights 59
Task 7: To Create Wellness 66
Task 8: To Encourage Responsible Consumption 74
Task 9: To Invest in Our Country’s Culture & Sports Through Sponsorship 80
Task 10: To Give Back to Our Community 86
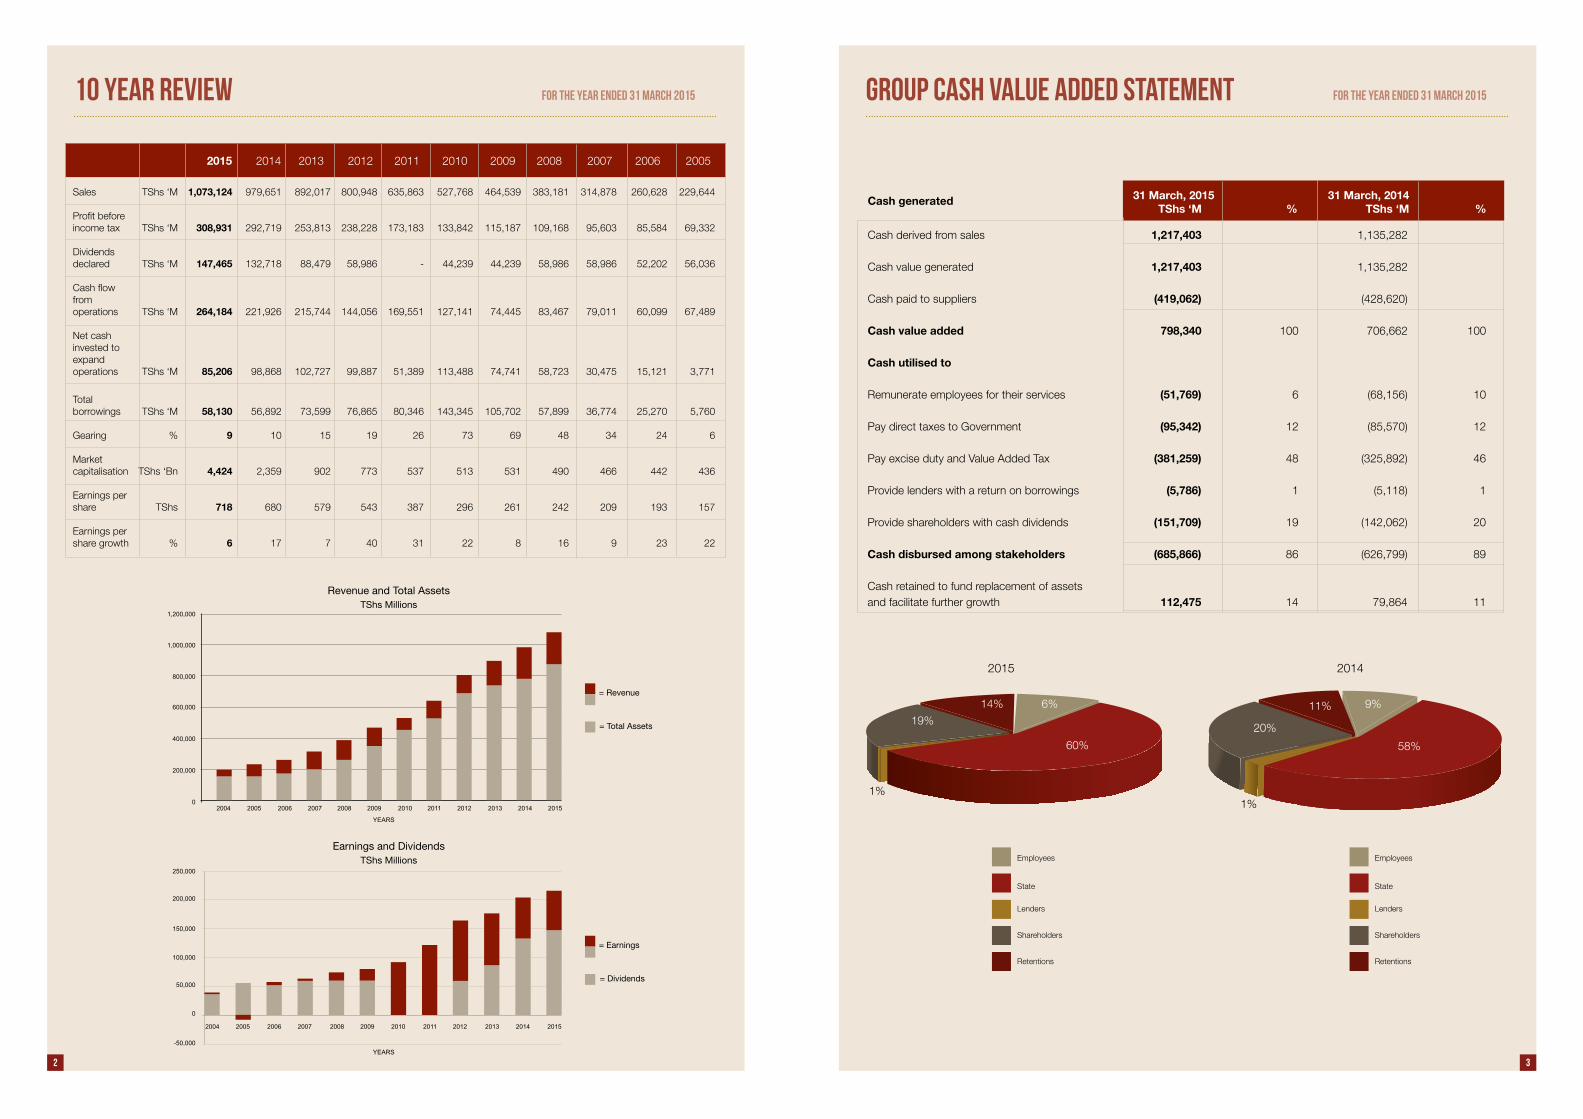
10 YEAR REVIEW
Sales TShs ‘M 1,073,124 979,651 892,017 800,948 635,863 527,768 464,539 383,181 314,878 260,628 229,644
Profit beforeincome tax TShs ‘M 308,931 292,719 253,813 238,228 173,183 133,842 115,187 109,168 95,603 85,584 69,332
Dividendsdeclared TShs ‘M 147,465 132,718 88,479 58,986 - 44,239 44,239 58,986 58,986 52,202 56,036
Cash flowfromoperations TShs ‘M 264,184 221,926 215,744 144,056 169,551 127,141 74,445 83,467 79,011 60,099 67,489
Net cash invested toexpandoperations TShs ‘M 85,206 98,868 102,727 99,887 51,389 113,488 74,741 58,723 30,475 15,121 3,771
Totalborrowings TShs ‘M 58,130 56,892 73,599 76,865 80,346 143,345 105,702 57,899 36,774 25,270 5,760
Gearing % 9 10 15 19 26 73 69 48 34 24 6
Marketcapitalisation TShs ‘Bn 4,424 2,359 902 773 537 513 531 490 466 442 436
Earnings pershare TShs 718 680 579 543 387 296 261 242 209 193 157
Earnings pershare growth % 6 17 7 40 31 22 8 16 9 23 22
GROUP CASH VALUE ADDED STATEMENT
Employees
State
Lenders
Shareholders
Retentions
2014
Cash derived from sales 1,217,403 1,135,282
Cash value generated 1,217,403 1,135,282 Cash paid to suppliers (419,062) (428,620) Cash value added 798,340 100 706,662 100 Cash utilised to Remunerate employees for their services (51,769) 6 (68,156) 10 Pay direct taxes to Government (95,342) 12 (85,570) 12 Pay excise duty and Value Added Tax (381,259) 48 (325,892) 46 Provide lenders with a return on borrowings (5,786) 1 (5,118) 1 Provide shareholders with cash dividends (151,709) 19 (142,062) 20 Cash disbursed among stakeholders (685,866) 86 (626,799) 89 Cash retained to fund replacement of assets and facilitate further growth 112,475 14 79,864 11
31 March, 2015 31 March, 2014 TShs ‘M % TShs ‘M %
Cash generated
FOR THE YEAR ENDED 31 MARCH 2015FOR THE YEAR ENDED 31 MARCH 2015
19%
1%1%
Employees
State
Lenders
Shareholders
Retentions
14%
2015
6% 9%11%
20%
60% 58%
2015 2014 2013 2012 2011 2010 2009 2008 2007 2006 2005
Earnings and DividendsTShs Millions
YEARS
Revenue and Total AssetsTShs Millions
YEARS
1,200,000
1,000,000
800,000
600,000
400,000
200,000
02004 2005 2006 2007 2008 2009 2010 2011 2012 2013 2014 2015
250,000
200,000
150,000
100,000
50,000
-50,000
0
2004 2005 2006 2007 2008 2009 2010 2011 2012 2013 2014 2015
2 3

CHAIRMAN’S STATEMENT (continued)
CHAIRMAN’S STATEMENTTanzania Breweries Limited Group of Companies (“TBL Group”)
is pleased to report its results for the financial year ended 31
March 2015. This was a year in which the Group was confronted
by many challenges, however managed to emerge more resilient.
We witnessed a 20% increase in excise duty rate, which led to
decline in monthly sales volume. This situation created financial
pressure which required the Company to find means of controlling
costs in order not to negatively affect the Company’s results.
Despite these tough market conditions, we are proud of the
results achieved. We have demonstrated agility in responding to
the changing environment and have made a number of
interventions to enhance the positions of our brands and to
strengthen the business for future growth. Whilst operating in a
competitive environment, we have continued to operate our
business on the highest standards of brewing ensuring
consumers enjoy our products of highest quality, efficient sales
and distribution thereby providing superior customer service,
together with a balanced brand portfolio which resonated well
with consumers.
Sales revenue registered a 10% growth with a corresponding
operating profit growth of 7% amounting to TShs 318,339 million.
Lower sales volumes were offset by price adjustments, variable
cost savings, favourable product mix as well as an exceptional
performance of the wines and spirits business.
The Tanzania beer industry witnessed a slowdown of 6.5% as
a result of increase in excise duty. While overall sales volumes
declined, wines and spirits volumes however registered strong
growth. The quality performance of our brands in the market
remains unmatched, being driven by sustainable quality systems
and continuous production improvements.
Despite declining volumes, operating profit registered a 7%
increase over prior year. TBL continued to make a significant
contribution to Government revenue by way of corporate, excise
and value added taxes. Payments to Government during the
year were TShs 476,601 million, an increase of 15.8% over prior
year.
Given the 6.5% decline in beer industry during the year, it was
clear that the Company had to scale back capital expenditure
relating to additional capacity. A total of TShs 84,931 million was
invested in fixed assets compared to TShs 101, 850 million in
prior year.
From this sound financial performance it was possible for the
Company to propose a dividend payment of TShs 151,709
million for the year which works out to be a record Tshs 500 per
share, 11% over that for the prior year. Our partnership with the
Government has significantly benefited all shareholders,
stakeholders, the national economy and the consumers of TBL
products, as well as the committed and skilled labour force which
makes TBL a truly world class Company.
We remain committed to the growth and development of our staff
and continue to attract and retain some of the best talent in the
market. The Company continued to upgrade capability within the
organization, investing in talent development and training. The
Company continued to build an engaging and high
organizational performance culture resulting in capability
improvement and high employee engagement scores, as
observed in our value surveys.
Over the year, the Company re-enforced its highly valued image
as a responsible corporate citizen. Our “Bila Maji Hakuna Uhai”
initiative has so far provided over 1 million people with safe, clean
drinking water across the country. We are committed to
making a positive contribution to the sustainable development of
the communities in which we operate. Our efforts in the
growing of malting barley resulted in contracting over 25,791
acres of barley of which for the first time we were able to buy
over 14,000 tons of barley sufficient to run the Moshi Maltings
for the year. Efforts to obtain large farms for commercial farming
could not bear expected results.
Looking ahead, TBL is committed to focusing on the
following strategic objectives:
(i). To continue to engage with the Government to encourage
adoption of a predictable policy with regards adjusting the annual
excise rate by the rate of inflation. Such a system will stabilize
prices for the consumers, the industry and the Government. It is
a fact that for the past ten years increase of excise rate has been
above inflation, forcing the Company to pass over such increases
directly to the consumers, thus pushing up retail prices.
(ii). To enhance our ability to influence consumer and retailer
buying decisions by continually improving customer service
levels, providing consumers with greater access to our full brand
portfolio and providing consumers with optimal value for money
products.
(iii). To develop the affordable beer brands aimed at recruiting
consumers from the informal alcohol. Development and
expanding Traditional Businesses like Darbrew and Nzagamba is
the right way to tap this informal market.
(iv). To continue efforts to gain self-sufficiency through local
sourcing by guaranteeing markets a fair price for their crops,
and helping to improve quality and yields, through an integrated
farming model that will meet both our needs and those of the
smallholder model. The success obtained from the joint
co-operation with John Deere and the Agricultural Chemical
Suppliers should continue.
(v). To increase our focus on giving our high performing staff
opportunities to work in some of our key strategic areas to
enable them achieve both professional and personal goals.
(vi). To promote exports of the selected TBL brands to
neighbouring and other niche markets.
In conclusion, I would wish to assure all our stakeholders that
TBL Group is a much stronger Company today than it has ever
been. All our human and material resources are being harnessed
every day to meet the business and other challenges that may
confront us as we strive to achieve our strategic objectives and
become responsible corporate citizens. I remain optimistic about
what the future holds, not only for TBL Group but also for the
national economy.
I am confident that TBL will continue its proud record of positive
growth in earnings and dividends and its contribution to the
economy of Tanzania. These achievements have been attained
because of the commitment, dedication and hard work by the
management and staff of TBL Group.
As we increase expansion of our business across the region, we
are confident that we shall retain our position as one of the most
respected publicly listed companies in Tanzania.
Finally, on behalf of the Board, I want to sincerely thank all our
employees and management staff serving in all our units and
stations across Tanzania. Without their dedicated and exemplary
service, none of the results I have mentioned above could have
been achieved over the last year.
___________________________
Cleopa David Msuya
Chairman of the Board
4 5

TAARIFA YA MWENYEKITI (inaendelea)
6 7
TAARIFA YA MWENYEKITI
Kampuni ya Bia Tanzania Breweries Limited (TBL) na kampuni
zake tanzu wanayofuraha kutoa ripoti yake ya fedha kwa
mwaka wa fedha unaoishia tarehe 31 Machi 2015. Mwaka huu
tumekutana na changamoto nyingi, hata hivyo tumekabiliana
nazo kwa ujasiri mkubwa. Tumeshuhudia ongezeko la asilimia 20
la kiwango cha ushuru wa bidhaa, ambalo lilisababisha kuanguka
kwa mauzo ya mwezi kwa kila mwezi uliofuatia ongezeko hili.
Hali hii imeleta changamoto ya kifedha ambapo ilibidi Kampuni
kubuni mbinu mbali mbali za kubana matumizi yake ili kuhakikisha
mapato na faida ya Kampuni yasidhurike.
Ukiachilia mbali changamoto zote hizi za kisoko, tunajivunia
kwa matokeo mazuri tuliyoyapata. Tumeonyesha nguvu na ari
katika kukabiliana na mabadiliko ya mazingira ya kibiashara na
tumeweza kufanya mbinu mbalimbali zenye kuimarisha bidhaa
na biashara yetu kwa vipindi vijavyo. Tumeendelea kuendesha
biashara yetu katika misingi bora ya uzalishaji, usambazaji na
uuzaji wa bia, ambao pia unaendana na bidhaa bora, huduma
bora ya hali ya juu kwa wateja, ufanisi mkubwa na usimamizi wa
mtaji katika mazingira haya ya ushindani.
Tumepata ongezeko la asilimia 10 kwenye mauzo sambamba
na kukua kwa faida ya uendeshaji ya asilimia 7 sawa na shilingi
milioni 318,339. Pamoja na kupungua kwa wingi wa bidhaa
zilizouzwa, mapato yatokanayo na mauzo yaliongezeka kutokana
na kufanya marekebisho katika bei, kubana matumizi haswa ya
uzalishaji, ongezeko la mauzo ya bidhaa zilizo na faida kubwa na
ufanisi mkubwa kutoka kwenye vinywaji vikali na mvinyo.
Kiwango cha mauzo ya bia kwa ujumla kilishuka kwa asilimia 6.5
kutokana na ongezeko la ushuru wa bidhaa, lakini kwa upande
wa mvinyo na vinywaji vikali, mauzo yaliongezeka kutokana na
kuhama kwa wateja wa bia kwenda kwenye vinywaji vikali. Ubora
wa bidhaa zetu umebaki kuwa wa hali ya juu usiolinganishwa
kutokana na uboreshwaji na mfumo endelevu wa ubora.
Licha ya kushuka kwa mauzo, faida ya uendeshaji imeongezeka
kwa asilimia 7 ukilinganisha na mwaka uliopita. Kampuni ya
Bia Tanzania (TBL) imeendelea kuwa moja ya vyanzo vikuu
vya mapato serikalini kwa kulipa kodi mbalimbali kama kodi ya
mapato, ushuru wa bidhaa and kodi ya ongezeko la thamani
kama kampuni. Malipo hayo yalikuwa ni shilingi milioni 476,601,
ongezeko la asilimia 15.8 zaidi ya mwaka uliopita.
Kampuni ilipunguza kiwango cha uwekezaji kwenye dhamana
za kudumu kutokana na kushuka kwa mauzo kwa asilimia 6.5.
Katika mwaka huu wa fedha, jumla ya shilingi milioni 84,931
ziliwekezwa ukilinganisha na shilingi milioni 101,850 kwa mwaka
uliopita. Kwa mafanikio haya ya kiutendaji, Kampuni ilipendekeza
gawio la shilingi millioni 151,709, sawa na shilingi 500 kwa hisa,
ikiwa ni ongezeko la asilimia 11 ukilinganisha na mwaka jana.
Ubia wetu na serikali umenufaisha wanahisa wote, wadau,
uchumi wa nchi na wateja wote wa bidhaa za TBL pamoja
na wafanyakazi wanaojituma wa Kampuni ya bia ya Tanzania,
ambayo ni mojawapo ya kampuni bora duniani.
Tunaendelea kuweka mkazo katika kuboresha na kuwaendeleza
wafanyakazi wetu kwa kuendelea kuvutia na kukuza vipaji vya
ajira kwenye soko. Kampuni yetu imeendelea kuboresha uwezo
wa wafanyakazi ndani ya taasisi zake, kuwekeza katika kuibua
vipaji na mafunzo kwa wafanyakazi. Kwa kuongezea, Kampuni
imejenga utamaduni mzuri wa kiutendaji baina ya wafanyakazi
ambao umechangia kukua kwa uwezo wa kufanya kazi na
waajiriwa kushiriki kikamilifu kama yalivyoonyesha matokeo ya
tafiti zetu.
Kwa miaka kadhaa Kampuni imekuwa ikitoa misaada mbalimbali
na kuwajibika kwa jamii. Mradi wetu wa “Bila Maji Hakuna Uhai”
umewapatia zaidi ya watu millioni moja maji safi na salama ya
kunywa nchi nzima tokea kuanzishwa. Tumejikita kusaidia
maendeleo endelevu ya jamii sehemu tulizokuwa na miradi.
Jitihada zetu za kulima shayiri zimeleta matokeo ya kuanzishwa
kwa zaidi ya heka 25,791 za shayiri ambapo kwa mara ya kwanza
tumeweza kununua kiasi cha tani 14,000 za shayiri ambacho
kinachotosheleza mahitaji ya Kiwanda cha Kimea Moshi kwa
mwaka. Jitihada za kupata mashamba makubwa zaidi kwa ajili
ya kilimo cha biashara hazikuzaa matunda yaliyotarajiwa.
Matarajio ya baadaye, TBL ina lenga katika mipango
ifuatayo:
(i) Kuendelea kujadiliana na Serikali kuwa na sera ili kuitaka
iwe na sera zinazotabirika hasa katika kurekebisha kiwango
cha ongezeko la ushuru wa bidhaa unaoendana na mfumuko
wa bei. Mfumo huo utaweza kutuliza bei kwa walaji, viwanda
na Serikali na utakaosaidia kupunguza mfumuko wa bei kwa
wateja,viwanda na Serikali. Ni dhahiri kuwa kwa muda wa miaka
kumi sasa, kiwango cha ushuru kimekuwa kikiongezeka kwa
kiwango zaidi ya ongezeko la mfumuko wa bei, hivyo kuifanya
Kampuni kupeleka gharama zote zinazotokana na ongezeko
hilo kwa mlaji wa bidhaa na kufanya bei ya ununuzi kwa mlaji
kuongezeka mwaka hadi mwaka.
(ii) Kuongeza uwezo wetu wa kuwashawishi wateja na
wafanyabiashara wa rejareja kwa kuendelea kuongeza huduma
bora kwa wateja, kuwawezesha wateja wetu kutufahamu na
kuzijua bidhaa zetu kuwawezesha kuwawezesha kupata bidhaa
bora zinazolingana na thamani ya pesa zao.
(iii) Kuzalisha bia bora na za bei nafuu kwa wateja ili kuwaepusha
kutumia vilevi zisivyo rasmi na vyenge viwango hafifu. Juhudi za
kuviboresha na kupanua biashara ya bia za jadi kupitia kiwanda
cha Darbrew na bia ya Nzagamba ni moja ya mbinu za kuliteka
soko hili lisilo rasmi.
(iv) Kuendeleza jitihada za kujitosheleza kupitia upatikanaji
wa malighafi kutoka vyanzo vya hapa hapa nchini, kuwapatia
wakulima wa hapa nchini masoko ya uhakika na bei za mazao
yao, kuwasaidia kuongeza ubora na wingi mazao kupitia
kilimo cha pamoja ambacho kitatunufaisha sote. Tutaendeleza
mafanikio yaliyopatikana kutokana na ushirikiano na John Deere
na wasambazaji wa madawa ya kilimo (Agricultural Chemical
Suppliers).
(v) Kuongeza jitihada katika kutoa nafasi kwa wafanyakazi wetu
waofanya kazi kwa bidii kufanya kazi katika miradi yetu tuliyoipa
kipaumbele ili kuwawezesha kupata ujuzi zaidi na kutimiza
malengo yao.
(vi). Kukuza mauzo ya bidhaa zetu zilizochaguliwa katika masoko
ya nchi jirani na masoko mengine duniani.
Katika kuhitimisha, napenda kuwahakikishia wadau wetu
kwamba, Kampuni ya Bia Tanzania na kampuni zake tanzu
zimekuwa kampuni bora hii leo kuliko hapo awali. Watu wetu na
rasilimali zetu kwa pamoja wamefanya kazi kwa bidii kuhakikisha
tunakabiliana na changamoto za kibiashara ili kufanikisha malengo
yetu na kutufanya tuwajibike ipasavyo kwa jamii ya Watanzania.
Nina matumaini makubwa ya maendeleo na mafanikio sio tu kwa
Kampuni yetu bali pia kwa uchumi mzima wa nchi yetu.
Nina matumaini kuwa TBL itaendelea kutunza rekodi yake ya
kukuza mapato na gawio na kuchangia kikamilifu katika uchumi
wa Tanzania. Mafanikio haya yamepatikana kutokana na kujitoa
na bidii iliyofanywa na menejimenti na wafanyakazi wa TBL na
kampuni zake tanzu.
Tukiwa tunaendelea kupanua biashara yetu nchi nzima,
tunajiamini kuwa tutaendelea kuwa kampuni inayoheshimiwa
miongoni mwa makampuni yaliyosajiliwa katika soko la hisa
nchini Tanzania.
Mwisho kabisa, kwa niaba ya Bodi, napenda kuwashukuru
wafanyakazi na menejimenti toka kila idara yetu Tanzania nzima.
Bila kujitolea kwa ukamilifu nisingetaja mafaniko yote haya
tuliyoyapata kwa mwaka uliopita.
___________________________
Cleopa David MsuyaMwenyekiti wa Bodi
6 7

VISION, MISSION & COMPANY VALUES
VisionTo be the most admired Company in Tanzania
• The investment of choice
• The employer of choice
• The partner of choice
MissionTo own and nurture local and international brands which are the first choice of the consumer
ValuesOur people are our enduring advantage
• The caliber, passion and commitment of our people sets us apart
• We value and encourage diversity
• We select and develop people for the long term
• Performance is what counts
Accountability is clear and personal
• We favour decentralised management and a practical maximum of local autonomy
• Goals and objectives are aligned and clearly articulated
• We prize both intellectual rigour and emotional engagement
• We are honest about performance
• We require and enable self-management
We work and win in teams
• We actively develop and share knowledge within the group
• We consciously balance local and group interests
• We foster trust and integrity in internal relationships
• We encourage camaraderie and a sense of fun
We understand and respect our customers and consumers
• We are endlessly concerned with our customers’ needs and perceptions
• We build lasting relationships, based on trust
• We aspire to offer the preferred choices of product and service
• We innovate and lead in a changing world
Our reputation is indivisible
• Our reputation relies on the actions and statements of every employee
• We build our reputation for the long term
• We are fair and ethical in all our dealings
• We benefit the local communities in which we operate
DIRECTOR’S REPORT FOR THE YEAR ENDED 31 MARCH 2015
The Directors submit their annual report together with the audited financial statements for the year ended 31 March 2015, which disclose the state of affairs of Tanzania Breweries Limited (the “Company”) and its subsidiaries, Tanzania Distilleries Limited, Darbrew Limited and Kibo Breweries Limited, (together the ‘’Group’’).
1. INCORPORATIONTanzania Breweries Limited is incorporated in the United Republic of Tanzania under the Companies Act as a limited liability Company. The Company is listed on the Dar es Salaam Stock Exchange and is domiciled in the United Republic of Tanzania. The address of its registered office and the principal place of business is:
Uhuru Street,Mchikichini, Ilala District,Plot 79, Block “AA”,PO Box 9013,Dar es Salaam, Tanzania.
2. PRINCIPAL ACTIVITIESThe Company’s principal activities are the production, distribution and sale of malt beer, non-alcoholic malt beverages and alcoholic fruit beverages (AFB’s) in Tanzania. It operates breweries in Dar es Salaam, Arusha, Mwanza and Mbeya and ten depots throughout the country. It also produces malt at its malting plant in Moshi.
The Company has controlling interest in Tanzania Distilleries Limited, a spirituous liquor company that is situated in Dar es Salaam and Darbrew Limited an opaque beer company located in Dar es Salaam. It also fully owns Kibo Breweries Limited, an asset management Company domiciled in Dar es Salaam. The Group owns some of Tanzania’s most popular liquor brands, notably: Safari Lager, Kilimanjaro Premium Lager, Ndovu Special Malt andKonyagi.
The Company also produces and distributes Castle Lager, Castle Milk Stout, Castle Lite, Peroni and Redds Premium Cold under licence from SABMiller International BV. The subsidiary undertaking, Tanzania Distilleries Limited, also distributes Amarula and various other international brands of wines and spirits under licence from Distell (Pty) Limited of South Africa.
3. VISIONTo be the most admired Company in beer industry in East Africa:• The investment of choice;• The employer of choice; and• The partner of choice.
4. MISSIONTo own and nurture local and international brands which are the first choice of the consumer.
5. OPERATING AND FINANCIAL REVIEWMarket overviewThe beer industry in Tanzania and in East Africa in general is becoming more competitive with more choices becoming available for the consumers. The business environment in Tanzania remained challenging with interrupted electricity supply hampering production and general infrastructure shortcomings causing challenges in delivering our products. Despite these challenges, the Company still managed to record moderate volume growth during the year.
Performance for the yearThe Group is pleased to report a solid set of results for the year despite inflationary cost increases, market liquidity pressures and lower consumer disposable income.
Revenue of TShs 1,073,124 million represents a growth of 10% on prior year and is attributable to volume growth as well as inflationary price increases, improved efficiencies and focused cost saving initiatives. These initiatives led to 7% growth in the trading profit compared to prior year and resulted in to increase in profit for the year to TShs 216,555 million from TShs 203,707 million in 2014.
A total of TShs 84.9 billion was invested in capital investment compared to TShs 101.9 billion in the prior year.
Despite increased operational cost pressures resulting from a combination of rising fuel, energy and raw materials prices, the group’s cash generated from operations was TShs 365 billion reflecting a 17% increase on prior year. Of this amount, TShs 95 billion was utilised to pay corporate income tax and the remaining amount funded capital expenditure, repayment of bank borrowings, interest expenses and dividends paid to shareholders.
Future developmentThe level of business and the year-end position is satisfactory. The Company will continue with its expansion and facility upgrade programme. The Directors consider that the future prospects of the Company and the Group are promising.
6. DIVIDEND The Board of Directors approved payment of the first, second and third interim dividend for the year ended 31 March 2015 of TShs 500 per share amounting to TShs 147,464 million (2014: TShs 500 per share amounting to TShs 147,464 million). The Directors do not recommend the payment of a final dividend.
8 9

DIRECTOR’S REPORT (continued) FOR THE YEAR ENDED 31 MARCH 2015
Hon. C. D. Msuya Tanzanian
Mr. W. Hall South African
Mr. D. Carruthers British
Mr. I. Penhale British
Mr. R. Jarrin Ecuadorian
Ambassador A. R. Mpungwe Tanzanian
Ms. E. Nyambibo Tanzanian
Mr. R. O. S. Mollel Tanzanian
Mr. A. B. S. Kilewo Tanzanian
Mr. P. J. I. Lasway Tanzanian
Mr. Uledi A. Mussa Tanzanian
Chairman. He is the (Rtd) Vice President and Prime Minister and was appointed on the TBL Board on the 18 August 2005. For the year under review, he was an appointee of SABMiller Africa BV.
Commercial Director Africa appointed on the TBL Board on 25 January 2012. He is an appointee of SABMiller Africa BV.
Director of Marketing of SABMiller Africa, he was appointed to the Board on 1 July 2001 and retired on 8th October 2014. He was an appointee of SABMiller Africa BV.
Director Marketing for SABMiller Africa,. He was appointed to the Board on 9 October 2014. He is representing SABMiller Africa BV.
Director of Operations, East Africa, and the Managing Director, Tanzania Breweries Limited. He was appointed to the Board on 1 May 2014. He is representing SABMiller Africa BV.
Businessman, appointed by SABMiller Africa BV, in October 2001.
She is the Deputy Permanent Secretary, Ministry of Finance, sitting on the Board as the Government’s representative with effect from 17 August 2011.
(Rtd) Permanent Secretary, Vice President’s Office. Appointed to the Board in 1997, representing the Government of Tanzania up to April 2000 and from May 2002 he was an appointee of SABMiller Africa BV, he retired on the 14th September 2014 and was the Chairman of the Group Audit Committee.
Former Executive Managing Director of Tanzania Breweries Limited. He was appointed in September 1999. He is an appointee of SABMiller Africa BV.
Business Consultant. He was appointed on 18 February 2010. He is an appointee of SABMiller Africa BV.
He is the Permanent Secretary Ministry of Trade, Industry and Marketing. He was appointed on 11 October 2013.
Name Nationality Remarks
In accordance with the Company’s Articles of Association, the directors are not required to retire by rotation. The Board met four times during the year.
7. COMPOSITION OF THE BOARD OF DIRECTORSThe Directors of the Company at the date of this report, all of whom have served since 1 April 2014, unless otherwise stated, are:
DIRECTOR’S REPORT (continued) FOR THE YEAR ENDED 31 MARCH 2015
Ordinary Ordinary Shares Shares
2015 2014 C. D. Msuya 8,000 8,000R. O. S. Mollel 3,600 3,600A. R. Mpungwe 7,000 7,000A. B. S. Kilewo 37,641 37,641P. J. I. Lasway 36,162 36,162
Total 92,403 92,403
Mr. R. Jarrin Ecuadorian
Mr. K. H. O’Flaherty South African Ms. K. Thomas South African Mr. P. J. I. Lasway Tanzanian Mr. S. F. Kilindo Tanzanian Mr. G. Van Wijk South African Mr. M. Benjamin South African Mr. D. Mgwassa Tanzanian Mr. D. Cason South African Mr. K. Suma Tanzanian
Mr. D. Magese Tanzanian Mr. M. van Geldern Dutch
Managing Director, Tanzania Breweries Limited. Appointed on the 1st of April, 2014.
Finance Director. Appointed in May 2008.
Marketing Director. Appointed in October 2011.
External Affairs and Special Projects Director. Appointed in February 2010.
Corporate Affairs and Legal Director. Appointed in March 2008.
Technical Director. Appointed in April 2011.
Sales and Distribution Director. Appointed in January 2013.
Managing Director, Tanzania Distilleries Limited. Appointed in June 2008.
Head of the Opaque Beverage Business. Appointed on 1 October 2014.
Head of Opaque Beverage Business. Appointed in October 2012 and retired in August 2014.
Human Resources Director. Appointed on 1 September 2013.
Strategy Director. Appointed on 1 September 2015.
COMPOSITION OF THE BOARD OF DIRECTORS (continued)Operating Board
Name Nationality Remarks
Company secretary as at the date of this report who has served throughout the year is Huruma Ntahena.
As at the date of this report, the Directors holding shares are listed below:
10 11

DIRECTOR’S REPORT (continued) FOR THE YEAR ENDED 31 MARCH 2015
8. CORPORATE GOVERNANCEThe Board of the Company consists of ten Directors. Apart from the Managing Director, no other directors hold executive positions in the Company. The Board takes overall responsibility for the Company, including responsibility for identifying key risk areas, considering and monitoring investment decisions, considering significant financial matters, and reviewing the performance of management business plans and budgets. The Board is also responsible for ensuring that a comprehensive system of internal control policies and procedures is operative, and for compliance with sound corporate governance principles.
The Board is required to meet at least four times a year. The Board delegates the day to day management of the business to the Managing Director assisted by senior management. Senior Management is invited to attend board meetings and facilitates the effective control of all the Company’s operational activities, acting as a medium of communication and coordination between all the various business units.
The Company is committed to the principles of effective corporate governance .The directors also recognize the importance of integrity, transparency and accountability. During the year the Board had board sub-committees to ensure a high standard of corporate governance throughout the Company. These are audit and remuneration sub-committees.
Group Audit CommitteeThe Group Audit Committee monitors and reviews the effectiveness of the internal control and the internal financial control of the Company and its subsidiaries. The Group Audit Committee is a sub-committee of the Board and comprises of three non-executive members. It is regulated by specific terms of reference and meets at least three times during the year. The Committee meets the external auditors and the internal audit department to review inter alias, accounting, auditing, internal control, financial reporting matters and the published financial statements of the Company and the Group. The external auditors have unrestricted access, at all times, to the Group and subsidiary audit committees. Mr. R.O.S. Mollel has chaired the Group Audit Committee during the year up to the date of his retirement on 14 September 2014. Mr A.B.S. Kilewo has subsequently been chairing the Group Audit Committee.
The overall objective of the Group Audit Committee is to ensure that the operating board has created and maintained an effective control environment within the organization and that management demonstrates and stimulates the necessary respect of the internal control structure amongst all parties.
The Group Audit Committee members, as well as the internal and external auditors, have unlimited access to whatever information they require in performing their responsibilities.
The Company also has an audit sub-committee which meets
quarterly and reviews the effectiveness of risk management processes; the appropriateness and adequacy of the systems of internal financial and operational controls. The audit sub-committee also tracks timeliness of management implementation of prior audit recommendations, and is chaired by the Group Internal Audit Manager.
Remuneration CommitteeThe remuneration committee comprises the Managing Director and one non-executive member who chairs the committee. The committee is responsible for the assessment and approval of a broad remuneration strategy for the Company, including short term incentives for executive and senior management. The remuneration strategy is aimed at rewarding employees at market related levels and in accordance with their contribution to the Company’s operating and financial performance in terms of basic pay as well as short-term incentives.
9. CAPITAL STRUCTURE AND SHAREHOLDERSThe Company’s authorised, issued and fully paid up share capital during the year was 294,928,463 ordinary shares of a par value of TShs 100 each (2014: 294,928,463). The Company has only one class of ordinary shares which carries no right to fixed income. The ownership structure is as set out in Note 22.2 of the financial statements.
10. MANAGEMENTThe Management of the Company is under the Managing Director and is organized in the following departments:• Finance department;• Technical department;• Marketing department;• Sales and distribution department;• Human resources department; and • Corporate affairs and legal department.
11. STOCK EXCHANGE INFORMATIONThe Company is listed on the Dar es Salaam Stock Exchange. The share price at 31 March 2015 was TShs 15,000 (31 March 2014: TShs 8,000) and market capitalization was TShs 4,423 billion (31 March 2014: TShs 2,359 billion).
12. RISK MANAGEMENT AND INTERNAL CONTROLThe Board accepts full responsibility for the risk management and internal control systems of the Company. It is the task of management to ensure that adequate internal financial and operational control systems are developed and maintained on an on-going basis in order to provide reasonable assurance regarding:• The effectiveness and efficiency of operations;• The safeguarding of the Company’s assets;• Compliance with applicable laws and regulations;• The reliability of accounting records;• Business sustainability under normal as well as adverse
conditions; and
DIRECTOR’S REPORT (continued) FOR THE YEAR ENDED 31 MARCH 2015
• Responsible behaviours towards all stakeholders.
The efficiency of any internal control system is dependent on the strict observance of prescribed measures. There is always a risk of non-compliance with such measures by staff. Whilst no system of internal control can provide absolute assurance against misstatement or losses, the Company system is designed to provide the Board with reasonable assurance that the procedures in place are operating effectively. The Board assessed the internal control systems throughout the financial year ended 31 March 2015 and is of the opinion that they met accepted criteria. The Board carries out risk and internal control assessment through the Audit Committee.
13. SOLVENCYThe Board of directors confirms that applicable accounting standards have been followed and that the financial statements have been prepared on a going concern basis. The Board of directors has reasonable expectation that the Company has adequate resources to continue in operational existence for the foreseeable future.
14. EMPLOYEE WELFAREManagement and Employees’ RelationshipRelations between employees and management continued to be good during the year. A healthy relationship continues to exist between management and trade union. The Company is an equal opportunity employer. It gives equal access to employment opportunities and ensures that the best available person is appointed to any given position free from discrimination of any kind and without regard to factors like gender, marital status, tribe, religion and disability which does not impair ability to discharge duties.
Training FacilitiesThe Company spent about TShs 1,191 million for staff training programs in the year compared to TShs 1,175 million in 2014. The programs are aimed at improving the employee’s technical skills and hence effectiveness. Training programs have been and are continually being developed to ensure employees are adequately trained at all levels. All employees have some form of annual training to upgrade skills and enhance development.
Medical AssistanceThe Company provides medical services through on site dispensaries and outside hospitals. Staff are entitled to access referral hospitals as the need arises. The Company places considerable value on the involvement of its employees and has continued its previous practice of keeping them informed on matters affecting them as employees. This is achieved through formal and informal meetings.
All members of staff, their spouses and four children to the age of 21 years were availed medical insurance. Currently these services are provided by Metropolitan Tanzania Insurance Limited.
Health and SafetyThe Company has a strong health and safety department which ensure that a strong culture of safety prevails at all times. A safe working environment is ensured for all employees and contractors by providing adequate and proper personal protective equipment, training and supervision as necessary. All breweries and a malting plant operated by the Company are audited by National Occupational Safety Association (NOSA) annually.
Financial Assistance to StaffLoans are available to all employees depending on the assessment of and the discretion of management as to the need and circumstances. Management has established an emergency loan facility with favourable borrowing terms with a commercial bank and has assisted staff to establish and join the Company Savings and Credit Co-operative Society (SACCOS) to assist in promoting the welfare of its employees.
Persons with DisabilitiesApplications for employment by disabled persons are always fully considered, bearing in mind the aptitudes of the applicants concerned. In the event of members of staff becoming disabled, every effort is made to ensure that their employment with the Company continues and that appropriate training is arranged. It is the policy of the Company that the training, career development and promotion of disabled persons should, as far as possible, be identical to that of other employees.
Employees Benefit PlanThe Company pays contributions to two publicly administered defined contribution plans namely; the Parastatal Pension Fund (PPF) and the National Social Security Fund (NSSF) on a mandatory basis.
15. GENDER PARITYAt 31 March 2015, the Company had 1,868 (2014: 1,830) employees, out of which 255 (2014: 252) were female and 1,613 (2014: 1,578) were male.
16. RELATED PARTY TRANSACTIONSAll related party transactions and balances are disclosed in note 34 to the financial statements.
17. POLITICAL AND CHARITABLE DONATIONSThe Company did not make any political donations during the year. Donations made to charitable organisations during the year amounted to TShs 418 million (2014: TShs 444 million).
18. ENVIRONMENTAL CONTROL PROGRAMMEWith continuous focus at water and energy usage, new reduction targets of 9% per annum, going forward to 2020, were introduced by SABMiller. With dedicated performance improvement teams in place at each site, the Company achieved a 12.7% reduction in water usage over the prior year, despite the challenges of
12 13

DIRECTOR’S REPORT (continued) FOR THE YEAR ENDED 31 MARCH 2015
water quality. Energy reduction achieved a 6.7% reduction over the prior year, with challenges being faced by shortfalls in the National grid supply.
The Water Futures PartnershipThe Company has been an active member of the 2030 WRG (2030 Water Resources Group), an association which addresses degradation of water sources and catchment areas for future generation use. Through this Partnership which involves both public and stakeholders, including the Ministry of Water, Dar es Salaam Water & Sewage Company (DAWASCO), and private sector; strategies have been developed in ensuring the identified potential risks are managed and/or mitigated immediately. Going forward, more funding is required to execute the key priority areas agreed during the short term period for quick win-win results, while for the medium and long term ones, a comprehensive program is developed, including sourcing funds and develop capacity to execute and implement various projects proposed by the work streams.
The partnership has confirmed one new corporate partner and is close to bringing in an additional donor. Due to bureaucratic challenges which need to be navigated through we are working hard to ensure the best possible outcome for the Company.
19. CORPORATE SOCIAL RESPONSIBILITYNo Water No Life (Bila Maji Hakuna Uhai) ProgramWater continues to be our top priority as the natural sources of this precious resource are shrinking. Climate change and population growth are a few of the major factors that contribute to this. One of our ambitions is to ‘Prosper’ by working together hand-in-hand with communities and institutions to share and provide continuous access to water.
Our ‘No Water No Life’ (Bila Maji Hakuna Uhai) campaign has given over 280,000 people uninterrupted access to clean and safe water in both rural and urban areas around the country. The Corporate Social Investment (CSI) of roughly TShs1,980 per beneficiary and a total of over TShs 555m has been invested in water access via the construction of boreholes.
With the majority (more than three quarter) of the population living in the rural areas (source: WHO) using 92.9%of the country’s water (source: UN-Water) for agricultural uses, ‘No Water No Life’ will focus on working with rural farming communities to secure water sources, improve water access so that the water supply is sustainable to give the beneficiaries the opportunity of managing it efficiently.
Other Corporate Social Investments:The company’s partnership with the Tanzania Police Force - Traffic Division each year on Road Safety Week continues to raise awareness on drinking and driving. Over the past two years, the partnership has taken a holistic approach by combining road safety and public health. TBL funded the establishment of
three health check points along the busy highways in Mikese (Morogoro), Msata (Coast) and Makuyuni (Arusha). At these points, Medical practitioners from the Tanzania Police Force conducted voluntary medical checks for long-distance bus and truck drivers over. 1,898 drivers were tested for malaria, blood pressure, blood sugar, vision, Sexually Transmitted Infections (STI) and Voluntary Counselling & Testing (VCT) between 22nd and 28th September 2014.
20. AUDITORThe auditor, PricewaterhouseCoopers, has expressed its willingness to continue in office as auditor and is eligible for re-appointment. A resolution proposing the re-appointment of PricewaterhouseCoopers as auditor of the Company for the financial year 2015 will be put to the Annual General Meeting.
BY ORDER OF THE BOARD
___________________________ Hon. C.D. Msuya, 17 August 2015 Chairman
FOR THE YEAR ENDED 31 MARCH 2015
The Companies Act, CAP 212 Act No.12 of 2002 requires directors to prepare financial statements for each financial year that give a true and fair view of the state of affairs of the Company as at the end of the financial year and of its profit or loss for the year. It also requires the directors to ensure that the Company keeps proper accounting records that disclose, with reasonable accuracy, the financial position of the Company. They are also responsible for safeguarding the assets of the Company and hence taking reasonable steps for the prevention and detection of fraud, error and other irregularities.
The directors accept responsibility for the financial statements, which have been prepared using appropriate accounting policies supported by reasonable and prudent judgments and estimates, in conformity with International Financial Reporting Standards (IFRS) and the requirements of the Companies Act, CAP 212 Act No.12 of 2002. The directors are of the opinion that the financial statements give a true and fair view of the state of the financial affairs of the Company and of its financial performance in accordance with International Financial Reporting Standards (IFRS). The directors further accept responsibility for the maintenance of accounting records that may be relied upon in the preparation of financial statements, as well as designing, implementing and maintaining internal control relevant to the preparation and fair presentation of financial statements that are free from material misstatement whether due to fraud or error.
Nothing has come to the attention of the directors to indicate that the Company will not remain a going concern for at least twelve months from the date of this statement.
Approved by the board of directors on and signed on its behalf by:
___________________________Hon. C.D. Msuya, 17 August 2015Chairman
STATEMENT OF DIRECTORS’ RESPONSIBILITIES
14 15

16 17
MANAGING DIRECTOR’S REPORT FOR THE YEAR ENDED 31 MARCH 2015
This past year saw business in Tanzania continue to face challenging operating circumstances. Markets, categories, price points and brands have been affected, but in different ways and to differing degrees. This variability and the unpredictability it created characterized the year. Tanzania Breweries Limited Group was able to achieve a 7% increase in operating profit over prior year despite an overall volume decline of 4%. A great performance, considering the challenging macroeconomic landscape during the year; decline in volumes following a 20% increase in excise rate in July 2014, weakening of Tanzanian shilling exacerbated by demand for US dollars, and increased competitive environment.
Tanzania Breweries Limited (TBL) experienced volume losses across most brands and across all regions. In order to arrest decline in sales volume, efforts made to push brands with favourable product mix, introduced new packs, roll back in prices in some brands and in different regions, resulted in sales revenue growth of 10%. The impact of 20% increase in excise duty rate, resulted in total excise revenue collection of 21% over prior year but 6% below budget. Most of this growth came from the growth of the Wines and Spirits business.
The Tanzanian Shilling showed some depreciation and is expected to weaken further as the wide fiscal and current deficits weigh on the currency, which will be exacerbated by the demand for US dollars and the strong USA economy. By end of March, the shilling had depreciated by 25% against the US dollar. In spite of decline in the world market for oil, there was no significant prices advantage to our operating costs. The impact of these increases was compensated by effective cost controls and improved efficiencies.
The clear beer market has stagnated over the past 4 years, with per capita consumption slowly declining since 2009. Tanzanian consumption is approximately where one would expect given income and population. In order to significantly increase per capita consumption, clear beer must become more affordable to the end consumer. Recent excise increases and pre-existing affordability issues have prevented clear beer from reaching its potential. Nevertheless, spirits and informal alcoholic beverages have grown at over 20% per year, and carbonated soft drinks, light malts have grown volumes. We are seeking a freeze of the excise duty over a period of time to enable the industry to recover from volume declines, together with efforts by the Company to either create or enter new markets that will deliver volume growth. TBL has introduced multiple innovations in order to develop the category including Chibuku Super and introducing different packs to its Chibuku brand.
During the year various distribution initiatives were undertaken
aimed at improved efficiencies as well as cost reduction. This
included Fleet Logistic Optimization through re-measuring and
mapping of all routes as well as rate negotiation in line with lower
fuel costs.
Tanzania Distilleries Limited continued to record excellent volume
growth, ending the year with a 36% growth over prior year. The
Konyagi anti-counterfeiting campaign was given a new look in
February by changing the sachet back prints from orange to
yellow in order to disrupt the counterfeiters. The launch of new
labels for Vladimir Vodka in January 2015 revamped the brands
image in the market and hence boosted the sales volume.
Despite the fierce competition from the parallel trade, Savanna
brand had a steady growth.
Improved efficiencies and cost management allowed operating
profit to end 7% ahead of prior year. Cash generated from
operations amounted to TShs 365,312 million, 16% up against
prior year. TShs 95,342 million was utilised to pay corporate tax,
an increase of 11.4% while the remainder was applied towards
funding of interest, capital expenditure and paying dividends. The
Board approved a total dividend for the year of TShs 500 per
share, which was 11% higher than the dividend declared last
year.
The TBL Group is committed to conducting its operations in a
socially and environmentally responsible way. We acknowledge
the importance of integrating corporate social responsibility
(CSR) into our business functions in order to maintain our licence
to operate, address risks, create new commercial and efficiency
opportunities, and to make a positive impact on the societies in
which we operate. The enterprise development initiative, part of
our approach to sustainable development to support our supply
chain through local sourcing of key raw materials, did produce
the results that had been anticipated as 25,791 acres of land
on barley were contracted which yielded over 14,000 tons of
malting barley, a record harvest that has enabled our Malting
Plant to operate throughout the year. In line with this initiative,
the decision to produce more wines using locally grown grapes,
has shown significant progress resulting in contracting additional
farmers in central Dodoma region, where grapes produced from
small scale farmers are used by Tanzania Distilleries Limited in
the production of Valeur brandy as well as their different brands
of local wines.
TBL’s Alcohol Policy is based on the principle to brew, market,
and sell beer in ways that have a positive impact on society
at large. With this policy, TBL promotes awareness of the
advantages and disadvantages of alcohol, encouraging informed
consumers to be accountable for their own actions, and drink
in moderation. Markets are becoming more and more engaged
to promote responsible consumption through different means
of communication. Our internal programs and Responsible
Commercial Communication, which are being monitored
continuously, remain important building blocks of our policy. We
MANAGING DIRECTOR’S REPORT FOR THE YEAR ENDED 31 MARCH 2015
are also actively engaged in the process of the World Health
Organization in developing a National Alcohol Policy. The newly
launched initiative of ``The Prosper’’ replacing the “Ten Priorities
One Future”, puts priority on sustainable development, and is
embedded in our operations and our staff. Responsible Drinking
is communicated internally through weekly alcohol messages
circulated electronically and posted on all notice boards.
In alignment with SABMiller’s ‘Licence to Trade’ way, Corporate
Social Investments (CSI) are made in the communities where TBL
operates in. Primary focus of CSI is on Water. “No Water No Life”
initiative’s sole purpose is to improve the supply of clean and safe
water to disadvantaged communities and institutions. From the
year in which this initiative was started five years ago, “No Water
No Life” has aided over 1,608,352 beneficiaries nationwide
gaining access to water through boreholes, wells, installed and
upgraded piped-water systems.
Our employees are our most important asset and we dedicate
significant amounts of time and resources to their growth,
development and well-being. In our Human Resource (HR) plan
we outline three key goals:
• Ensure we have the right people at the right time in the
right job
• Create a culture that drives performance
• Implement reliable HR services
During the year, we continued our journey towards these goals
by building upon the existing management, leadership and
reward systems in place throughout our organization. The new
Human Resources Operations Model (HROM), which enables
us to identify HR improvement opportunities and fully align our
HR practices with the business requirements of our various
operations, is successfully being implemented.
We continued focusing our thinking and our actions around areas
where we can have a real impact on our business environment
and where the changing business environment has a real impact
on us. These focus areas are:
• Energy: consumption and CO2 emission
• Water: consumption, waste water and discharge
• Safety: of our employees and our installations
• Agriculture: quality and availability of raw materials
• Supply chain responsibility
• Responsible alcohol consumption
The outlook for the year ahead is promising. TBL will prioritize
affordability with an aim to price moderately in market and regain
volume growth, will accelerate its plan to source from informal
alcohol, will tap into new consumer occasions with innovative
new product development, and keep enhancing our Route to
Market via investing in technology.
A significant part will also depend on the sustainability of
the economy, excise rate increases, utilities increases and
infrastructure development as well as the stability of the Tanzanian
Shilling.
I believe that the combination of our actions, our commitments
and our people will ensure that Tanzania Breweries Limited will
emerge as an even stronger and more competitive company.
___________________________
Roberto Jarrin
Managing Director
16 17
RIPOTI YA MKURUGENZI MTENDAJI KWA MWAKA ULIOISHIA 31 MACHI 2015
Katika mwaka uliopita, biashara nyingi za Tanzania zimekabiliwa
na changamoto nyingi katika mazingira ya uendeshaji. Athari hizo
zimeonekana katika masoko, aina mbalimbali za bidhaa, pamoja
na bei kwa namna na viwango tofauti. Kampuni ya Bia Tanzania
na washirika wake wameweza kufikia ongezeko la asilimia 7
katika faida ya uendeshaji ukilinganisha na mwaka uliopita licha
kuanguka kwa mauzo kwa asilimia 4. Matokeo haya ni mazuri
ukizingatia changamoto za uchumi zilizojitokeza katika mwaka
huu wa fedha kama ongezeko la ushuru wa bidhaa kwa asilimia
20 kuanzia Julai 2014, kushuka kwa thamani ya shilingi ya
kitanzania iliyotokana na ongezeko la hitaji la dola za kimarekani
na ongezeko la ushindani wa kibiashara.
Kampuni ya Bia Tanzania iliathirika na kushuka kwa mauzo
karibu kila bidhaa zake za bia na katika mikoa yote. Ili kupunguza
kuporomoka kwa mauzo zaidi, juhudi zilifanywa kuongeza
mauzo ya bidhaa zenye faida zaidi, kuzalisha bidhaa katika
aina mbali mbali ya ujazo, kushusha bei kufikia bei zilizokuweko
awali kwenye baadhi ya bidhaa na kwa mikoa. Jitihada hizi
ziliwezesha mapato yatokanayo na mauzo kukuwa kwa asilimia
10. Ukuaji huu ulichangiwa hasa na mauzo kutoka kwa biashara
ya mvinyo na pombe kali. Matokeo ya ongezeko la ushuru wa
bidhaa kwenye bia yaliongeza makusanyo ya kodi ya ushuru kwa
asilimia 21 ukilinganisha na mwaka jana, licha ya makusanyo
hayo kuwaasilimia 6 chini ya kiwango kilichotarajiwa. Sarafu ya
Tanzania ilianza kuporomoka na inatarajiwa kuendelea kuanguka
kwa kasi zaidi kutokana na uchumi hafifu na kuimarika kwa
uchumi wa nchi ya Marekani. Mpaka Machi 2015, sarafu ya
Tanzania ilikuwa imeshuka thamani yake kwa zaidi ya asilimia 25
ukiilinganisha na dola ya kimarekani. Pamoja na kushuka kwa bei
ya mafuta kwenye soko la ulimwengu, Kampuni haikupata unafuu
mkubwa katika gharama za uendeshaji. Madhara yaliyotokana na
sababu hizi yalipunguzwa kwa kubana matumizi na kuongeza
ufanisi.
Ingawa Kampuni ya Bia, TBL inaongoza kwenye soko la bia hapa
nchini, ongezeko la ushuru wa mara kwa mara umesababisha
kuanguka kwenye uwezo wakununua bidhaa hii kwenye soko.
Pamoja na juhudi za kukuza mauzo ya bia, soko hili limedumaa
takribani kwa miaka 4 sasa, kusababisha unywaji kwa mtu mmoja
mmoja kuanza kushuka. Ili kuongeza kiwango cha unywaji kwa
mtu mmoja mmoja, bei ya bia ni lazima iwe nafuu ili yule mnywaji
wa mwisho aweze kuimudu. Licha ya hivyo, soko la vinywaji vikali
limekuwa likikuwa kwa asilimia 20 kwa mwaka, vinywaji baridi na
vinywaji visivyo na kilevi vitokanavyo na kimea vimekuwa navyo
vikikuwa. Kampuni ya Bia inaitafadhalisha Serikali isimamishe
ongezeko la ushuru kwa muda kwenye bidhaa za vinywaji ili
kuvipa fursa ya kusitisha kuanguka kwa mauzo, pamoja na
kuzipa Kampuni muda na nafasi ya kutafuta masoko mapya
ambayo yataweza kurudisha ukuaji wa mauzo. Kampuni ya Bia
imejitahidi kufanya uvumbuzi na kuleta mbinu mpya za kutatua
tatizo hili kwa kuanzisha uzalishaji wa Chibuku Super na kuleta
vifungaji vyenye uzito na ujazo mbali mbali.
Kwa kipindi cha mwaka uliopita, mbinu mbali mbali kwenye
uzambazaji zilitekelezwa kwa ajili ya kuongeza ufanisi na
kupunguza matumizi yasiyo ya lazima. Mbinu hizi zilihusisha
kuangalia kwa upya njia zetu za usambazaji kwa kupima upya
barabara zote zinazotumika na magari yetu kusambaza bidhaa,
pamoja na kuangalia upya gharama za usambazaji ili kuendana
na kushuka kwa bei ya mafuta. Kampuni ya Kutengeza Vinywaji
Vikali, Tanzania Distilleries LImited (TDL) iliendeleza rekodi yake
ya kuongeza mauzo yake na ilifanikiwa kupata ongezeko la
asilimia 36 ukilinganisha na mwaka uliopita. Juhudi kubwa za
kupambana na Konyagi za kugushi ilifanikiwa kupata sura mpya
mwezi Februari kwa kubadilisha kabisa maandishi kwenye viroba
kutoka rangi ya chungwa kwenda rangi ya njano ili kuifanya iwe
ngumukughushika.. Kuzindua nembo mpya ya Vladimir Vodka
mwezi wa Januari 2015, kuliboresha taswira ya kinywaji hiki
kwenye soko, hivyo kuwezesha kuongezeka kwa mauzo yake.
Licha ya ushindani usio rasmi kwenye soko, bidhaa ya Savanna
iliweza kuwa na ongezo la kuridhisha.
Maboresho ya ufanisi na usimamizi mzuri wa gharama
kuliwezesha faida ya uendeshaji kukua kwa asilimia 7
ukilinganisha na mwaka jana. Fedha zilizotokana na uendeshaji
zilifikia shilingi milioni 365,312, ikiwa ni asilimia 16 zaidi ya mwaka
jana. Kati ya fedha hizo, kiasi cha shilingi million 95,342 kilitumika
kulipia kodi ya mapato, ikiwa ni ongezeko la asilimia 11.4, wakati
kiasi kilichobakia kilitumika kulipia riba kwa mabenki, ununuzi
wa rasilimali za kudumu, na malipo kwa wenye hisa. Bodi ya
Wakurugenzi waliidhinisha kiasi cha TShs 500 kwa kila hisa, kiasi
ambacho ni asilimia 11 ukilinganisha na kiasi kilichoidhinishwa
mwaka uliopita.
Kampuni ya Bia Tanzania na Kampuni zake tanzu zinaendesha
shughuli zake kwa uwajibikaji kwa jamii na mazingira. Tunatambua
umuhimu wa kuunganisha kampuni na uwajibikaji kwa kijamii
(CSR) katika shughuli zetu za biashara ili kudumisha leseni yetu
ya kufanya biashara, kuainisha madhara, kuunda fursa mpya za
kibiashara na ufanisi na kuleta mabadiliko chanya katika jamii
ambamo tunafanya kazi. Mpango wa maendeleo ya biashara,
sehemu ya mfumo wetu wa maendeleo endelevu kusaidia ugavi
kupitia vyanzo vya ndani vya malighafi muhimu, iliweza kuleta
matokeo ambayo yamekuwa yakitarajiwa, kwani ekari 25,791 za
shayiri zilisainishwa mkataba na kupelekea jumla ya tani 14,000
za shayiri kuvunwa ambazo zimeiwezesha Kampuni ya Kimea
kufanya kazi kwa mwaka mzima. Juhudi zetu za kupata ardhi zaidi
kwa ajili ya kilimo cha mashamba makubwa hakikuzaa matunda.
Sambamba na mpango huu, uamuzi wa kuzalisha mvinyo zaidi
kwa kutumia zabibu inayozalishwa hapa nchini umeonyesha
mafanikio makubwa na kusababisha kuongezeka kwa wakulima
RIPOTI YA MKURUGENZI MTENDAJI KWA MWAKA ULIOISHIA 31 MACHI 2015
katika kanda ya kati Dodoma, ambapo zabibu zinazozalishwa
kutoka kwa wakulima wadogo wadogo hutumiwa na Tanzania
Distilleries Limited katika uzalishaji wa Valeur Brandy na bidhaa
zao mbalimbali zinazotokana na mvinyo.
Sera ya vileo ya TBL imejengwa juu ya kanuni ya kutengeneza
pombe, kwa kutafuta masoko, na kuuza bia katika namna
inayoleta mwelekeo chanya katika jamii kwa ujumla. Kwa sera hii,
TBL inakuza ufahamu wa faida na hasara za pombe, kuhimiza
watumiaji kuwajibika kwa vitendo vyao na kunywa kiasi. Masoko
yanajihusisha zaidi katika kuhimiza watumiaji kunywa kistaarabu
kupitia njia mbalimbali za mawasiliano. Mipango yetu ya ndani
na matangazo yanayohimiza unywaji pombe kistaarabu ambayo
yamekuwa yakisimamiwa kila wakati, yatabakia kuwa muhimu
katika kujenga sera yetu. Tunashiriki kikamilifu katika mchakato
wa Shirika la Afya Duniani katika kuendeleza Sera ya Taifa ya
Vileo. Sera mpya “The Prosper” iliyozinduliwa badala ya ile ya “Ten
Prorities One Future” inatoa kipaumbele ya maendeleo endelevu
imejumuishwa katika uendeshaji wetu wa biashara pamoja na
wafanyakazi wetu.Tahadhari ya Unywaji Pombe Kistaarabu
inaendeshwa kwa wafanyakazi wetu kupitia ujumbe wa kila wiki
unaohusu pombe unaosambazwa kwa njia ya kielektroniki na
kubandikwa katika mabango ya matangazo.
Kuendana na Leseni ya SABMiller ya Biashara, shughuli za
marejesho kwa jamii (CSI) zinafanyika katika maeneo ambamo
TBL inaendesha shughuli zake. Eneo la msingi kabisa ni sekta
ya maji. Kampeni ya “Bila Maji Hakuna Uhai” inalenga kuongeza
upatikanaji na usambazaji wa maji safi na salama kwa jamii
zisizojiweza pamoja na taasisi za umma. Tokea kampeni ya
“Bila Maji Hakuna Uhai” ianzishwe imesaidia zaidi ya walengwa
1,608,352 nchi nzima kupata huduma ya maji kupitia visima
vidogo vidogo na vikubwa na uboreshwaji wa mifumo ya
mabomba ya maji.
Wafanyakazi wetu ni mali yetu muhimu sana na tunajitoleakiasi
kikubwa cha muda na rasilimali kwa ajili `maendeleo na ustawi
wao. Mpango wetu kuhusu rasilimali watuunalenga mambo
makuu matatu:
• Kuhakikisha tuna watu sahihi kwa wakati sahihi kwa kazi
sahihi.
• Kujenga utamaduni unaochochea ufanisi.
• Kuhakikisha tuna mfumo wa rasilimali watu unaoweza
kutegemewa.
Katika mwaka huu, tuliendelea na safari yetu kufikia malengo
haya kwa kujenga mifumo juu ya utawala uliopo, uongozi na
mfumo wa motisha kwa ngazi zote za kiutendaji katika kampuni.
Namna mpya ya kiutendaji ya Rasilimali watu (HROM) ambayo
inatuwezesha kuainisha uboreshaji wa fursa za rasilimali watu
na muelekeo mzima wa shughuli za kiutendaji za rasilimali watu
na mahitaji ya kibiashara katika nyanja mbalimbali za kiutendaji
zilikuwa zimefanyika kikamilifu.
Tumeendelea kuweka umuhimu na dhamira zetu kwenye
maeneo ambayo tunaamini yanaweza yakawa na matokeo
makubwa kwenye shughuli zetu za kibiashara. Maeneo haya ni:
• Nishati: Matumizi na utoaji wa hewa ukaa;
• Maji: Matumizi, maji taka na utoaji ;
• Usalama: Wa wafanyakazi wetu na mitambo;
• Kilimo: Ubora na upatikanaji wa malighafi;
• Uwajibikaji kikamilifu katika Ugavi; na
• Unywaji pombe kistaarabu
Mtazamo wa mwaka unaofuata una matumaini. TBL itatoa
kipaumbele katika unafuu wa bei katika soko na kuongeza
mauzo, itaongeza mpango wake kupata faida kutoka pombe
isivyo rasmi, itatafuta wateja katika maeneo mbalimbali kwa
kubuni bidhaa mpya na kuendelea kuboresha njia za kutafuta
masoko kwa kuwekeza kwenye teknolojia.
Mtazamo huu pia utategemea kwa kiasi kikubwa uchumi
endelevu, kiwango cha ongezeko la uchumi, bei za mafuta,
gharama za umeme na maji pamoja na uimara wa thamani ya
sarafu ya Tanzania.
Naamini kwamba tukiunganisha pamoja utendaji wetu, na
uwajibikaji wa watu wetu tutahakikisha kuwa Kampuni ya Bia
Tanzania itaibuka kuwa imara zaidi na kuwa kampuni yenye
kuleta ushindani zaidi kwa maslahi ya wanahisa, wadau wa
kibiashara na uchumi kwa ujumla.
___________________________Roberto Jarrin Mkurugenzi Mtendaji
18 1918 19

TBL is one of the largest taxpayers in the nation: TShs 2.1 trillion in the last 12 years. For this, we as a company have received several ‘Tax Payer’s Day’ awards from the Tanzania Revenue Authority. Our large-scale growth has resulted in the establishment of business in various sectors (ie. farming, distribution, bottling and printing) allowing us to contribute significantly towards GDP & economic development. In addition, we provide direct employment for over 1,650 people, as well as
creating an additional 84,000 jobs for Tanzanians in the industry. Since TBL’s listing on the Dar Es Salam Stock exchange 16 years ago (1998), the share price has increases by 1,500%. In the last few years our share price has been recorded as the highest in the country. This means that TBL is a high value company and consequently, our shareholders are rewarded generously in the form of dividends. Currently, 33% of the company is Tanzanian owned.
THE TASKSOF TBLTASK 1
TO BE A GOOD CORPORATE CITIZEN
1. RESPONSIBLE ALCOHOL USE
TBL Group practices and promotes the responsible use of
alcohol by those who decide to consume our products, while
at the same time endeavoring to prevent alcohol misuse and
abuse.
2. ALCOHOL POLICY
Our alcohol policy sets a consistent national standard that TBL
Group Companies must meet or exceed, and is integral to how
we do business.
3. EMPLOYEES BEHAVIOR
TBL Group has an employee alcohol policy in place, which
provides guidelines on responsible behavior as related to the use
of alcohol by our employees.
4. COMMERCIAL COMMUNICATION
Our Compliance Committee meet periodically to monitor and
review commercial communications presented by respective
directorates, and develop recommendations and endorsements
while ensuring that these comply with the Company Alcohol
Policy, existing legislation, statutory regulations, self-
regulatory codes and the SABMiller plc Code of Commercial
Communication.
5. DRINKING AND DRIVING
In partnership with the National Road Safety Council and
Tanzania Police Force we have continued to remind drivers and
community, through our campaign, to Drink Responsibly Drive
Responsibly. Annually we sponsor responsible anti-drink and
drive campaign activities, provide communication materials and
meet several of the road safety week event costs.
6. UNDERAGE DRINKING
Our underage restriction signage “Watoto chini ya miaka 18
hawaruhusiwi” reminds all parents and the community that we
are active partners with them in efforts to prevent underage
access in line with the liquor law. Our cooperation with retail
sales people presents a united front and strengthens the retailer’s
hand in refusing alcohol sales to anyone under the age of 18.
7. TRADE BREWING
We have been hosting Barman’s Guild or beer connoisseurs
training for retail establishments to equip our partners with
the skills necessary to serve alcohol responsibly, as well
as intervene effectively with those who may have over-
consumed. The programme has been directed at bartenders,
waiters and waitresses at beer outlets and restaurants, store
clerks, managers in bulk stores, liquor and grocery stores.
1. MATUMIZI MAZURI YA VILEO
TBL na kampuni zake tanzu inatumia na kutangaza matumizi
mazuri ya vileo kwa wale walioamua kutumia bidhaa zetu, na
wakati huohuo tukijitahidi kuzuia matumizi yasiyofaa na mabaya
ya vileo.
2. SERA YA VILEO
Sera yetu ya vileo imeweka viwango vya kitaifa vilivyo thabiti
ambavyo TBL na kampuni zake tanzu inapaswa kuvifikia au
kuvipita, na ni muhimu kwa jinsi tunavyofanya shughuli za
Kibiashara.
3. TABIA ZA WAFANYAKAZI
TBL na kampuni zake tanzu ina sera ya vileo kwa wafanyakazi
inayotumika ambayo inatoa miongozo kuhusiana na matumizi
mazuri na ya kuwajibika ya vileo.
4. MAWASILIANO YA KIBIASHARA
Kamati yetu ya Ridhaa inakutana mara kwa mara ili kufuatilia na
kupitia mawasiliano ya kibiashara yanayowasilishwa na kurugenzi
husika, na kutoa mapendekezo na idhini na wakati huohuo
ikihakikisha kuwa yanakubaliana na Sera ya Vileo ya Kampuni,
Sheria zilizopo, kanuni zilizokubalika na kanuni za udhibiti binafsi
na Kanuni za SABMiller za Mawasiliano ya Kibiashara.
5. KUNYWA VILEO NA KUENDESHA GARI
Kwa kushirikiana na Baraza la Taifa la Usalama Barabarani na
Jeshi la Polisi Tanzania, tumeendelea kuwakumbusha madereva
na wananchi kupitia kampeni yetu, Kunywa kwa Kiasi Endesha
kwa Uangalifu.
6. UNYWAJI VILEO KATIKA UMRI MDOGO
Msemo wetu wa kudhibiti matumizi ya vileo katika umri mdogo,
“Watoto chini ya miaka 18 hawaruhusiwi” unawakumbusha
wazazi na jamii yote kuwa tunashirikiana nao katika jitihada
zetu za kuzuia watoto kupata mwanya wa kutumia vileo kama
sheria ya vileo inavyosema. Ushirikiano wetu na wauzaji reja reja
wa bidhaa zetu ni nguvu dhabiti inayowaimarisha wauzaji hao
katika kuhakikisha hawauzi vileo kwa yeyote mwenye umri chini
ya miaka 18.
7. BIASHARA YA UTENGENEZAJI WA VILEO
Tumekuwa tukidhamini mafunzo ya vyama vya wenye baa na
pia magwiji wa bia yanayohusiana na uanzishaji wa bishara za
rejareja ili kuwapa washirika wetu ujuzi wa kutoa huduma kwa
kiasi pamoja na kuwadhibiti ipasavyo wale wote watakaokuwa
wametumia vileo kupita kiasi. Jitihada hizi zimeelekezwa kwa
wahudumu wa kiume na wa kike katika baa na migahawa na
kwa makarani na mameneja wa maduka ya jumla ya vileo na ya
vyakula.
TBL Responsible Way - Kuwajibika kwa TBL FOR THE YEAR ENDED 31 MARCH 2015
20 21
FINANCIAL STATEMENTS
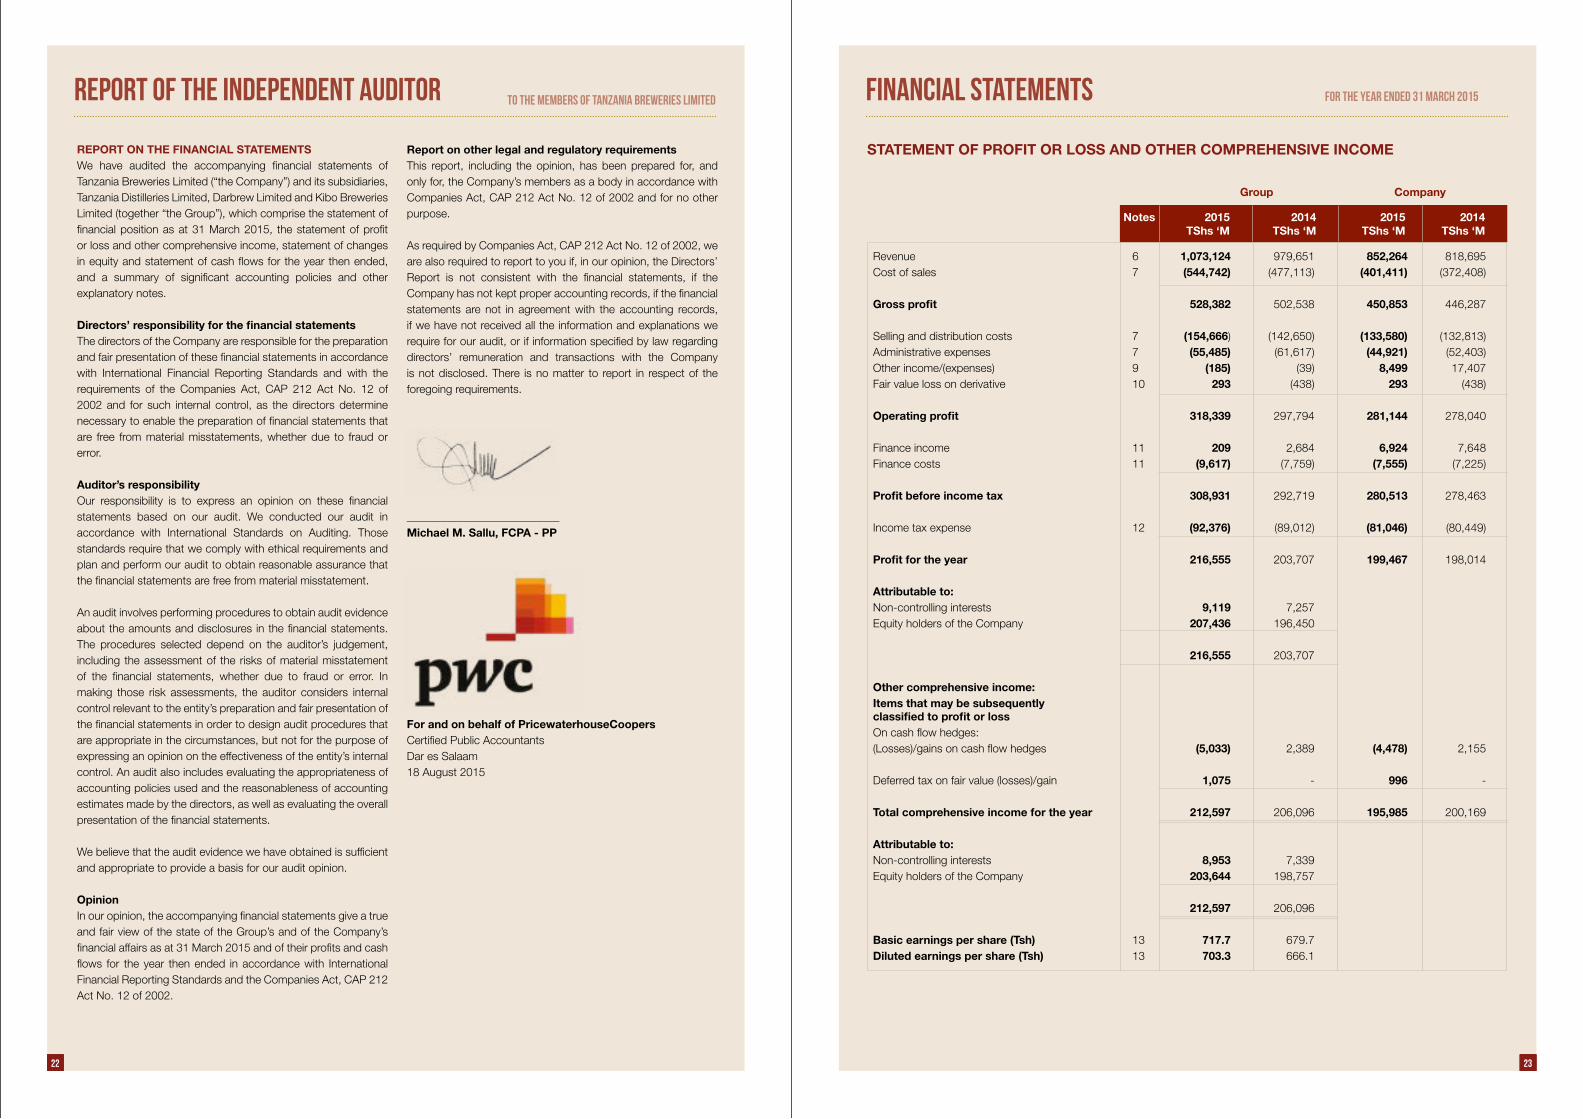
Revenue 6 1,073,124 979,651 852,264 818,695Cost of sales 7 (544,742) (477,113) (401,411) (372,408) Gross profit 528,382 502,538 450,853 446,287 Selling and distribution costs 7 (154,666) (142,650) (133,580) (132,813)Administrative expenses 7 (55,485) (61,617) (44,921) (52,403)Other income/(expenses) 9 (185) (39) 8,499 17,407Fair value loss on derivative 10 293 (438) 293 (438)
Operating profit 318,339 297,794 281,144 278,040 Finance income 11 209 2,684 6,924 7,648Finance costs 11 (9,617) (7,759) (7,555) (7,225) Profit before income tax 308,931 292,719 280,513 278,463 Income tax expense 12 (92,376) (89,012) (81,046) (80,449)
Profit for the year 216,555 203,707 199,467 198,014 Attributable to: Non-controlling interests 9,119 7,257 Equity holders of the Company 207,436 196,450 216,555 203,707
Other comprehensive income:Items that may be subsequentlyclassified to profit or loss On cash flow hedges:(Losses)/gains on cash flow hedges (5,033) 2,389 (4,478) 2,155 Deferred tax on fair value (losses)/gain 1,075 - 996 - Total comprehensive income for the year 212,597 206,096 195,985 200,169 Attributable to: Non-controlling interests 8,953 7,339 Equity holders of the Company 203,644 198,757 212,597 206,096 Basic earnings per share (Tsh) 13 717.7 679.7 Diluted earnings per share (Tsh) 13 703.3 666.1
FOR THE YEAR ENDED 31 MARCH 2015
STATEMENT OF PROFIT OR LOSS AND OTHER COMPREHENSIVE INCOME
Notes 2015 2014 2015 2014 TShs ‘M TShs ‘M TShs ‘M TShs ‘M
Group Company
REPORT OF THE INDEPENDENT AUDITOR
22 23
REPORT ON THE FINANCIAL STATEMENTSWe have audited the accompanying financial statements of Tanzania Breweries Limited (“the Company”) and its subsidiaries, Tanzania Distilleries Limited, Darbrew Limited and Kibo Breweries Limited (together “the Group”), which comprise the statement of financial position as at 31 March 2015, the statement of profit or loss and other comprehensive income, statement of changes in equity and statement of cash flows for the year then ended, and a summary of significant accounting policies and other explanatory notes.
Directors’ responsibility for the financial statementsThe directors of the Company are responsible for the preparation and fair presentation of these financial statements in accordance with International Financial Reporting Standards and with the requirements of the Companies Act, CAP 212 Act No. 12 of 2002 and for such internal control, as the directors determine necessary to enable the preparation of financial statements that are free from material misstatements, whether due to fraud or error.
Auditor’s responsibilityOur responsibility is to express an opinion on these financial statements based on our audit. We conducted our audit in accordance with International Standards on Auditing. Those standards require that we comply with ethical requirements and plan and perform our audit to obtain reasonable assurance that the financial statements are free from material misstatement.
An audit involves performing procedures to obtain audit evidence about the amounts and disclosures in the financial statements. The procedures selected depend on the auditor’s judgement, including the assessment of the risks of material misstatement of the financial statements, whether due to fraud or error. In making those risk assessments, the auditor considers internal control relevant to the entity’s preparation and fair presentation of the financial statements in order to design audit procedures that are appropriate in the circumstances, but not for the purpose of expressing an opinion on the effectiveness of the entity’s internal control. An audit also includes evaluating the appropriateness of accounting policies used and the reasonableness of accounting estimates made by the directors, as well as evaluating the overall presentation of the financial statements.
We believe that the audit evidence we have obtained is sufficient and appropriate to provide a basis for our audit opinion.
OpinionIn our opinion, the accompanying financial statements give a true and fair view of the state of the Group’s and of the Company’s financial affairs as at 31 March 2015 and of their profits and cash flows for the year then ended in accordance with International Financial Reporting Standards and the Companies Act, CAP 212 Act No. 12 of 2002.
Report on other legal and regulatory requirementsThis report, including the opinion, has been prepared for, and only for, the Company’s members as a body in accordance with Companies Act, CAP 212 Act No. 12 of 2002 and for no other purpose.
As required by Companies Act, CAP 212 Act No. 12 of 2002, we are also required to report to you if, in our opinion, the Directors’ Report is not consistent with the financial statements, if the Company has not kept proper accounting records, if the financial statements are not in agreement with the accounting records, if we have not received all the information and explanations we require for our audit, or if information specified by law regarding directors’ remuneration and transactions with the Company is not disclosed. There is no matter to report in respect of the foregoing requirements.
___________________________Michael M. Sallu, FCPA - PP
For and on behalf of PricewaterhouseCoopersCertified Public AccountantsDar es Salaam 18 August 2015
TO THE MEMBERS OF TANZANIA BREWERIES LIMITED
22 2322 2322 2322 23

FINANCIAL STATEMENTS
GROUPYear ended 31 March 2015 At 1 April 2014 29,493 45,346 (10,888) 479,007 542,958 9,645 552,603Comprehensive income Profit for the year - - - 207,436 207,436 9,119 216,555Cash flow hedge fair value gain (net) 23 - - (3,792) - (3,792) (166)) (3,958)Total Comprehensive income - - (3,792) 207,436 203,644 8,953 212,597 Transactions with owners Dividends paid 14 - - - (147,464) (147,464) (4,941) (152,405)
At 31 March 2015 29,493 45,346 (14,680) 538,979 599,138 13,657 612,795
Year ended 31 March 2014 Balance at 1 April 2013 29,493 45,346 (13,195) 415,275 476,919 10,683 487,602Comprehensive income Profit for the year - - - 196,450 196,450 7,257 203,707Cash flow hedge fair value gain (net) 23 - - 2,307 - 2,307 82 2,389Total Comprehensive income - - 2,307 196,450 198,757 7,339 206,096 Transactions with owners Dividends paid 14 - - - (132,718) (132,718) (8,377) (141,095)Balance at 31 March 2014 29,493 45,346 (10,888) 479,007 542,958 9,645 552,603
Notes Share Share Other Retained Non- Total capital premium reserves earnings Total Controlling equity interest TShs ‘M TShs ‘M TShs ‘M TShs ‘M TShs ‘M TShs ‘M TShs ‘M
Attributable to equity holders of the Parent
STATEMENT OF CHANGES IN EQUITY
FOR THE YEAR ENDED 31 MARCH 2015FINANCIAL STATEMENTS
ASSETS Non-current assets Property, plant and equipment 15 503,359 474,670 470,485 445,113Intangible assets 16 49,086 48,981 942 805Investments 17 88 88 53,942 53,942 552,533 523,739 525,369 499,860Current assets Derivative financial instruments 18 813 2,104 779 1,838 Inventories 19 120,309 145,195 90,376 110,885Trade and other receivables 20 157,028 96,985 145,088 114,805Current income tax 29 6,591 - 3,659 -Bank and cash balances 21 35,767 11,090 24,267 6,921 320,508 255,374 264,169 234,449 Total assets 873,041 779,113 789,538 734,309 EQUITY Capital and reserves attributable to theCompany’s equity holders Share capital 22 29,493 29,493 29,493 29,493 Share premium 22 45,346 45,346 45,346 45,346 Retained earnings 538,979 479,007 521,396 469,393Other reserves 23 (14,680) (10,888) (14,443) (10,961) 599,138 542,958 581,792 533,271Non-controlling interests 24 13,657 9,645 - -Total equity 612,795 552,603 581,792 533,271 LIABILITIES Non-current liabilities Borrowings 25 1,500 2,250 - -Deferred income tax liabilities 26 53,178 48,454 50,133 45,310 54,678 50,704 50,133 45,310Current liabilitiesProvisions for other liabilities and charges 27 739 829 739 829Derivative financial instruments 18 3,760 311 3,419 293Trade and other payable 28 144,439 117,849 113,681 101,426Borrowings 25 56,630 54,642 39,774 46,207Current income tax liabilities 29 - 2,175 - 6,973 205,568 175,806 157,613 155,728 Total liabilities 260,246 226,510 207,746 201,038
Total equity and liabilities 873,041 779,113 789,538 734,309The financial statements on pages 23 to 85 were approved by the board of directors on 17 August 2015 and signed on its behalf by:-
____________ Hon. C.D. Msuya Chairman
STATEMENT OF FINANCIAL POSITION AS AT 31 MARCH
Notes 2015 2014 2015 2014 TShs ‘M TShs ‘M TShs ‘M TShs ‘M
FOR THE YEAR ENDED 31 MARCH 2015
Group Company
24 25

FINANCIAL STATEMENTS FOR THE YEAR ENDED 31 MARCH 2015
STATEMENT OF CASH FLOWS
Group Company
Cash flows from operating activities Cash generated from operations 33(i) 365,312 312,614 326,773 275,591 Interest paid 33(ii) (5,786) (5,118) (4,470) (5,064)Income tax paid 33(iii) (95,342) (85,570) (85,859) (73,925)Net cash generated from operating activities 264,184 221,926 236,444 196,602 Cash flows from investing activities Purchase of property, plant and equipment 33(v) (84,931) (101,850) (78,224) (91,898)Purchase of intangible assets 16 (709) (147) (783) (147)Dividend income received 9 - - 9,176 15,558Interest received 33(iv) 312 2,918 7,027 7,882Purchase of a subsidiary - - - (18)Proceeds from disposal of property, plant andequipment 122 211 104 115Net cash utilised in investing activities (85,206) (98,868) (62,700) (68,508) Cash flows from financing activities Dividends paid to Company’s shareholders 33(vi) (146,768) (133,685) (146,880) (133,685)Dividends paid to non-controlling interests 33(vi) (4,941) (8,377) - -Proceeds from borrowings - 3,000 - -Repayment of bank borrowings 33(vii) (2,625) (55,850) (1,875) (55,850)
Net cash utilised in financing activities (154,334) (194,912) (148,755) (189,535) Net increase/(decrease) in cash and cashequivalents 24,644 (71,854) 24,989 (61,441)
Cash and cash equivalents at the start of year (40,772) 34,551 (37,256) 27,174Exchange loss on cash and cash equivalents (3,533) (3,469) (2,787) (2,989)
Cash and cash equivalents at the end of year 21 (19,661) (40,772) (15,054) (37,256)
Notes 2015 2014 2015 2014 TShs ’ M TShs ‘M TShs ‘M TShs ‘M
26 27
FINANCIAL STATEMENTS
COMPANY Year ended 31 March 2015 At 1 April 2014 29,493 45,346 (10,961) 469,393 533,271Comprehensive income Profit for the year - - - 199,467 199,467Cash flow hedge fair value gain (net) 23 - - (3,482) - (3,482)Total comprehensive income - - (3,482) 199,467 195,985 Transactions with owners Dividends to equity holders ofthe company 14 - - - (147,464) (147,464)
At 31 March 2015 29,493 45,346 (14,443) 521,396 581,792
Year ended 31 March 2014 At 1 April 2013 29,493 45,346 (13,116) 404,097 465,820Comprehensive income Profit for the year - - - 198,014 198,014Cash flow hedge fair value gain (net) 23 - - 2,155 - 2,155Total comprehensive income - - 2,155 198,014 200,169 Transactions with owners Dividends to equity holders ofthe company 14 - - - (132,718) (132,718)
Balance at 31 March 2014 29,493 45,346 (10,961) 469,393 533,271
FOR THE YEAR ENDED 31 MARCH 2015
Notes Share Share Other Retained Toatal capital premium reserves earnings equity TShs ‘M TShs ‘M TShs ‘M TShs ‘M TShs ‘M
STATEMENT OF CHANGES IN EQUITY (continued)
26 27

Index to the notes to the consolidated financial statements
Note Page
1 General information 30
2 Significant accounting policies 30
3 Critical accounting estimates and judgments 42
4 Financial risk management 43
5 Business segments information 53
6 Revenue 56
7 Expenses by nature 56
8 Employee benefits expenses 57
9 Other income/(expenses) 57
10 Derivative income/(loss) 57
11 Finance income and costs 57
12 Income tax expense 60
13 Earnings per share 60
14 Dividends 61
15 Property, plant and equipment 62
16 Intangible assets 64
17 Investments 65
18 Derivative financial instruments 67
19 Inventories 68
20 Trade and other receivables 69
21 Bank and cash balances 69
22 Share capital 70
23 Other reserves 71
24 Non-controlling interest 72
25 Borrowings 72
26 Deferred income tax liabilities 75
27 Provisions for other liabilities and charges 76
28 Trade and other payables 76
29 Current income tax (assets)/liability 76
30 Financial instruments by category 77
31 Commitments 77
32 Contingent liabilities 78
33 Cash flow information 79
34 Related party transactions and balances 82
35 Ultimate parent company 85
36 Approval of financial statements 85
THE TASKSOF TBLTASK 2
TO INVEST IN OUR COUNTRY
With over TShs 660 billion invested over the last twelve years, our breweries in Dar Es Salam, Arusha, Mwanza and Mbeya are the best in Africa. The communities surrounding each of our breweries have subsequently seen development and employment growth.
We invest in Tanzania by building leading breweries, running world-class operations and producing beverages of the highest quality.
28 29

NOTES TO THE FINANCIAL STATEMENTS FOR THE YEAR ENDED 31 MARCH 2015
Notes (continued)2. SIGNIFICANT ACCOUNTING POLICIES (Continued)(ii) New standards and interpretations not yet adopted(continued)These are where the intangible asset is expressed as a measure of revenue; or where it can be demonstrated that revenue and the consumption of the economic benefits of the intangible asset are highly correlated. IFRS 9, ‘Financial instruments’, addresses the classification, measurement and recognition of financial assets and financial liabilities. The complete version of IFRS 9 was issued in July 2014. It replaces the guidance in IAS 39 that relates to the classification and measurement of financial instruments. IFRS 9 retains but simplifies the mixed measurement model and establishes three primary measurement categories for financial assets: amortised cost, fair value through OCI and fair value through P&L. The basis of classification depends on the entity’s business model and the contractual cash flow characteristics of the financial asset. Investments in equity instruments are required to be measured at fair value through profit or loss with the irrevocable option at inception to present changes in fair value in OCI not recycling. There is now a new expected credit losses model that replaces the incurred loss impairment model used in IAS 39. For financial liabilities there were no changes to classification and measurement except for the recognition of changes in own credit risk in other comprehensive income, for liabilities designated at fair value through profit or loss. IFRS 9 relaxes the requirements for hedge effectiveness by replacing the bright line hedge effectiveness tests. It requires an economic relationship between the hedged item and hedging instrument and for the ‘hedged ratio’ to be the same as the one management actually use for risk management purposes. Contemporaneous documentation is still required but is different to that currently prepared under IAS 39. The standard is effective for accounting periods beginning on or after 1 January 2018. Early adoption is permitted. The Group and Company is yet to assess IFRS 9’s full impact.
IFRS 15, ‘Revenue from contracts with customers’ deals with revenue recognition and establishes principles for reporting useful information to users of financial statements about the nature, amount, timing and uncertainty of revenue and cash flows arising from an entity’s contracts with customers. Revenue is recognised when a customer obtains control of a good or service and thus has the ability to direct the use and obtain the benefits from the good or service. The standard replaces IAS 18 ‘Revenue’ and IAS 11 ‘Construction contracts’ and related interpretations. The standard is effective for annual periods beginning on or after 1 January 2017 and earlier application is permitted. The group is assessing the impact of IFRS 15.
Amendments to IFRS 10 and IAS 28 regarding the sale or contribution of assets between an investor and its associate or joint venture. These amendments address an inconsistency between IFRS 10 and IAS 28 in the sale or contribution of assets
between an investor and its associate or joint venture. A full gain or loss is recognised when a transaction involves a business. A partial gain or loss is recognised when a transaction involves assets that do not constitute a business, even if those assets are in a subsidiary.Amendment to IAS 27, ‘Separate financial statements’ regarding the equity method. The amendment allows entities to use the equity method to account for investments in subsidiaries, joint ventures and associates in their separate financial statements.
These annual improvements amend standards from the 2010 –2012 reporting cycle. It includes changes to:
• IFRS 3, ‘Business combinations’, and clarifies that an obligation to pay contingent consideration which meets the definition of a financial instrument is classified as a financial liability or equity, on the basis of the definitions in IAS 32, ‘Financial instruments: Presentation’. It also clarifies that all non-equity contingent consideration is measured at fair value at each reporting date, with changes in value recognised in profit and loss.
• IFRS 8, ‘Operating segments’ which is amended to require disclosure of the judgements made by management in aggregating operating segments. It is also amended to require a reconciliation of segment assets to the entity’s assets when segment assets are reported.
• IFRS 13, ‘Fair value’ which amended the basis of conclusions to clarify that it did not intend to remove the ability to measure short term receivables and payables at invoice amounts where the effect of discounting is immaterial.
• IAS 16,’Property, plant and equipment’ and IAS 38,’Intangible assets’ are amended to clarify how the gross carrying amount and the accumulated depreciation are treated where an entity uses the revaluation model.
• IAS 24,’Related party disclosures’ is amended to include, as a related party, an entity that provides key management personnel services to the reporting entity or to the parent of the reporting entity (the ‘management entity’). Disclosure of the amounts charged to the reporting entity is required.
These annual improvements amend standards from the 2011 – 2013 reporting cycle. It includes changes to:
• IFRS 3,’Business combinations’ is amended to clarify that IFRS 3 does not apply to the accounting for the formation of any joint venture under IFRS 11.
• IFRS 13,’Fair value measurement’ is amended to clarify that the portfolio exception in IFRS 13 applies to all contracts (including non-financial contracts) within the scope of IAS 39 or IFRS 9.
There are no other IFRSs or IFRIC interpretations that are not yet
30 3130 31
NOTES TO THE FINANCIAL STATEMENTS
Notes1. GENERAL INFORMATIONTanzania Breweries Limited is incorporated in the United Republic of Tanzania under the Companies Act as a limited liability Company. The Company is listed on the Dar es Salaam Stock Exchange and is domiciled in the United Republic of Tanzania. The principal activities of the Company and its subsidiaries are disclosed in the Annual Report. The address of its registered office is:
Uhuru Street,Mchikichini, Ilala District,Plot 79, Block “AA”,PO Box 9013,Dar es Salaam, Tanzania
2. SIGNIFICANT ACCOUNTING POLICIES The principal accounting policies adopted in the preparation of these financial statements are set out below. These policies have been consistently applied to all years presented, unless otherwise stated.
(a) Basis of preparationThese financial statements have been prepared in compliance with International Financial Reporting Standards (IFRS).The measurement basis applied is the historical cost basis except where otherwise stated in the accounting policies below. The financial statements are presented in Tanzanian Shillings (TShs), rounded to the nearest million.
The preparation of financial statements in conformity with IFRS requires the use of estimates and assumptions. It also requires the directors to exercise their judgment in the process of applying the Group’s and the Company’s accounting policies. The areas involving a higher degree of judgment or complexity, or where assumptions and estimates are significant to the financial statements, are disclosed in Note 3.
Changes in accounting policy and disclosures(i) New and amended standards adopted by the Group TThe following standards have been adopted by the Group for the first time for the financial year beginning on or after 1 April 2014 and have a material impact on the Group and Company.
Amendment to IAS 32, ‘Financial instruments: Presentation’ on offsetting financial assets and financial liabilities. This amendment clarifies that the right of set-off must not be contingent on a future event. It must also be legally enforceable for all counterparties in the normal course of business, as well as in the event of default, insolvency or bankruptcy. The amendment also considers settlement mechanisms. The amendment did not have a significant effect on the Company and Group financial statements.
Amendments to IAS 36, ‘Impairment of assets’, on the recoverable amount disclosures for non-financial assets. This amendment removed certain disclosures of the recoverable amount of CGUs which had been included in IAS 36 by the issue of IFRS 13.
Amendment to IAS 39, ‘Financial instruments: Recognition and measurement’ on the novation of derivatives and the continuation of hedge accounting. This amendment considers legislative changes to ‘over-the-counter’ derivatives and the establishment of central counterparties. Under IAS 39 novation of derivatives to central counterparties would result in discontinuance of hedge accounting. The amendment provides relief from discontinuing hedge accounting when novation of a hedging instrument meets specified criteria. The Group has applied the amendment and there has been no significant impact on the Company and Group financial statements as a result.
IFRIC 21, ‘Levies’, sets out the accounting for an obligation to pay a levy if that liability is within the scope of IAS 37 ‘Provisions’. The interpretation addresses what the obligating event is that gives rise to pay a levy and when a liability should be recognised. The Group is not currently subjected to significant levies so the impact on the Company and Group is not material.
Amendments to IFRS 10, 12 and IAS 27 on consolidation for investment entities. These amendments mean that many funds and similar entities will be exempt from consolidating most of their subsidiaries. Instead, they will measure them at fair value through profit or loss. The amendments give an exception to entities that meet an ‘investment entity’ definition and which display particular characteristics. Changes have also been made IFRS 12 to introduce disclosures that an investment entity needs to make.
(ii) New standards and interpretations not yet adoptedA number of new standards and amendments to standards and interpretations are effective for annual periods beginning after 1 April 2015, and have not been applied in preparing these financial statements. None of these is expected to have a significant effect on the financial statements of the Company and the Group, except the following:
Amendment to IAS 16, ‘Property, plant and equipment’ and IAS 38, ‘Intangible assets’ regarding depreciation and amortisation. This amendment clarifies that the use of revenue-based methods to calculate the depreciation of an asset is not appropriate because revenue generated by an activity that includes the use of an asset generally reflects factors other than the consumption of the economic benefits embodied in the asset.
This has also clarified that revenue is generally presumed to be an inappropriate basis for measuring the consumption of the economic benefits embodied in an intangible asset. The presumption may only be rebutted in certain limited circumstances.
FOR THE YEAR ENDED 31 MARCH 2015
30 31

NOTES TO THE FINANCIAL STATEMENTS FOR THE YEAR ENDED 31 MARCH 2015
Notes (continued) 2. SIGNIFICANT ACCOUNTING POLICIES (Continued) (ii) Transactions and balancesForeign currency transactions are translated into Tanzania Shillings using the exchange rate prevailing at the dates of the transactions. Monetary assets and liabilities at the statement offinancial position date, which are expressed in foreign currencies, are translated into Tanzania Shillings at rates ruling at that date. Foreign exchange gains and losses resulting from the settlement of such transactions and from the translation at the year-end exchange rates of monetary assets and liabilities denominated in foreign currencies are recognised in profit or loss, except when deferred in other comprehensive income as qualifying cash flow hedges. Foreign exchange gains and losses that relate to borrowing and cash and cash equivalents are presented in the profit or loss within ‘finance income or cost’. All other exchange gain or losses are presented in the profit or loss within ‘other (losses)/gains’.
(e) Property, plant and equipmentLand and buildings comprises mainly factories, depots and offices.All property, plant and equipment are shown at cost, less subsequent depreciation and impairment. Cost includes expenditure directly attributable to the acquisition of the items. Costs may also include transfers from equity of any gains/losses on qualifying cash flow hedges of foreign currency purchase of property plant and equipment.
Subsequent costs are included in the asset’s carrying amount or recognized as a separate asset, as appropriate, only when it is probable that future economic benefits associated with the item will flow to the Group or Company and the cost of the item can be measured reliably.
Subsequent costs are included in the asset’s carrying amount or recognized as a separate asset, as appropriate, only when it is probable that future economic benefits associated with the item will flow to the Group or Company and the cost of the item can be measured reliably.
Repair and maintenance costs are charged to profit or loss during the financial period in which they are incurred.
Depreciation is calculated using the straight-line method to allocate the cost of each asset to its residual value over the estimated useful life, as follows:
Buildings Shorter of the lease term or 50 yearsPlant and machinery 10 – 15 yearsFurniture, equipment 3 yearsand vehicles 3 – 12 years
Containers in circulation are recorded within property, plant and equipment at cost net of accumulated depreciation less
any impairment loss. Depreciation of returnable bottles and containers is recorded to write the containers off over the course of their economic life. Breakages and losses in trade are written off from the relevant cost and accumulated depreciation accounts.
Major renovations are depreciated over the remaining useful life of the related asset or to the date of the next major renovation, whichever is sooner. All other repairs and maintenance expenditures are charged to profit or loss during the financial period in which they are incurred.
Assets in the course of construction are carried at cost less any impairment loss. Cost includes professional fees and, for qualifying assets, certain borrowing costs. When these assets are ready for their intended use, they are transferred into the appropriate category. At this point, depreciation commences on the same basis as on other property, plant and equipment.
The assets’ residual values and useful lives are reviewed, and adjusted if appropriate, at each statement of financial position date. An asset’s carrying amount is written down immediately to its recoverable amount if the asset’s carrying amount is greater than its estimated recoverable amount.
Gains and losses on disposals are determined by comparing proceeds with carrying amount and are included in profit or loss.
(f) Intangible assets(i) GoodwillGoodwill arising on consolidation represents the excess of the costs of acquisition over the Group’s interest in the fair value of the identifiable assets (including intangibles), less liabilities and contingent liabilities of the acquired entity at the date of acquisition. Where the fair value of the Group’s share of identifiable net assets acquired exceeds the fair value of the consideration, the difference is recorded as negative goodwill. Negative goodwill arising on an acquisition is recognised immediately in profit or loss.
Goodwill is stated at cost less impairment losses and is reviewed for impairment on an annual basis or more frequently if events or changes in circumstances indicate a potential impairment. Any impairment identified is recognised immediately in profit or loss and is not reversed.
(ii) SoftwareWhere computer software is not an integral part of a related item of property, plant and equipment, the software is capitalised as an intangible asset.
Acquired computer software licenses are capitalised on the basis of the costs incurred to acquire and bring them to use. Direct costs associated with the production of identifiable and unique internally generated software products controlled by the Group or Company are recognised as intangible assets, when
NOTES TO THE FINANCIAL STATEMENTS
Notes (continued) 2. SIGNIFICANT ACCOUNTING POLICIES (Continued) (ii) New standards and interpretations not yet adopted(continued)effective that would be expected to have a material impact on the Group and the Company.
(b) Consolidation(i) SubsidiariesSubsidiaries are all entities (including structured entities) over which the group has control. The group controls an entity when the group is exposed to, or has rights to, variable returns from its involvement with the entity and has the ability to affect those returns through its power over the entity
De-facto control may arise in circumstances where the size of the group’s voting rights relative to the size and dispersion of holdings of their shareholders give the group the power to govern the financial and operating policies.
Subsidiaries are fully consolidated from the date on which control is transferred to the Group and are de-consolidated from the date that control ceases.
The Group applies the acquisition method to account for business combinations. The consideration transferred for the acquisition of a subsidiary is the fair values of the assets transferred, the liabilities incurred to the former owners of the acquiree and the equity interests issued by the Group. The consideration transferred includes the fair value of any asset or liability resulting from a contingent consideration arrangement. Identifiable assets acquired and liabilities and contingent liabilities assumed in a business combination are measured initially at their fair values at the acquisition date. The Group recognises any non-controlling interest in the acquiree on an acquisition-by-acquisition basis, either at fair value or at the non-controlling interest’s proportionate share of the recognised amounts of acquiree’s identifiable net assets.
Acquisition-related costs are expensed as incurredIf the business combination is achieved in stages, the acquisition date fair value of the acquirer’s previously held equity interest in the acquiree is measured to fair value at the acquisition date; any gains or losses arising from such re-measurement are recognised in profit or loss.
Any contingent consideration to be transferred by the group is recognised at fair value at the acquisition date. Subsequent changes to the fair value of the contingent consideration that is deemed to be an asset or liability is recognised in accordance with IAS 39 either in profit or loss or as a change to other comprehensive income. Contingent consideration that is classified as equity is not re-measured, and its subsequent settlement is accounted within equity.
Goodwill is initially measured as the excess of the aggregate of the consideration transferred and the fair value of non-controlling interest over the net identifiable assets acquired and liabilities assumed. If this consideration is lower than the fair value of the net assets of the subsidiary acquired, the difference is recognised in profit or loss.
Inter-company transactions, balances and unrealised gains on transactions between Group companies are eliminated. Profit or losses resulting from inter-company transactions that are recognised in assets are also eliminated. Accounting policies of subsidiaries have been changed where necessary to ensure consistency with the policies adopted by the Group.
(ii) Changes in ownership interests in subsidiaries without change of controlTransactions with non-controlling interests that do not result in loss of control are accounted for as equity transactions – that is, as transactions with the owners in their capacity as owners. The difference between fair value of any consideration paid and the relevant share acquired of the carrying value of net assets of the subsidiary is recorded in equity. Gains or losses on disposals to non-controlling interests are also recorded in equity.
(iii) Disposal of subsidiariesWhen the group ceases to have control any retained interest in the entity is re-measured to its fair value at the date when control is lost, with the change in carrying amount recognised in profit or loss. The fair value is the initial carrying amount for the purposes of subsequently accounting for the retained interest as an associate, joint venture or financial asset. In addition, any amounts previously recognised in other comprehensive income in respect of that entity are accounted for as if the group had directly disposed of the related assets or liabilities. This may mean that amounts previously recognised in other comprehensive income are reclassified to profit or loss.
(c) Segment reportingOperating segments are reported in a manner consistent with the internal reporting provided to the chief operating decision maker. The chief operating decision maker is responsible for allocating resources and assessing performance of the operating segments. The chief operating decision maker has been identified as operating board that makes strategic decisions.
(d) Foreign currency translation(i) Functional and presentation currencyItems included in the financial statements of each of the Group’s entities are measured using the currency of the primary economic environment in which the entity operates (the functional currency). The financial statements are presented in Tanzanian Shillings (TShs), rounded to the nearest million, which is the Group and Company’s functional currency.
FOR THE YEAR ENDED 31 MARCH 2015
32 33

THE TASKSOF TBLTASK 3
TO INVEST IN OUR PEOPLE
Our people are one of our most valuable assets: we refer to them as talent. We work together with our talent, helping them take control of their careers through Learning and Development.We aim to nurture, develop, manage and showcase our talent in all our operations. This includes career development, mentoring, job shadowing and secondments. The Learning and Development plan is diversified into several disciplines where training includes Performance Management, Engineering Technology and Alcohol Behavior & Communication. In addition we provide the opportunity for TBL artisans in Mbeya to acquire training in brewing, packaging and utilities (maintenance) through our partnership with the Mbeya University of Science and Technology (MUST). We encourage our talent to be proactive with all the training, constantly evaluating to ensure a positive overall effect on workplace performance.
We care about our people and their well being is of paramount importance to us, so in addition we have a company wellness programme that is rolled out to all our employees. The programme is driven by 110 Wellness Educators and covers the following; on going wellness education, health, fitness and counseling. Wellness for each employee is extended to up to five dependents of their family entitling them to a fully comprehensive medical scheme and is uniform across all employment grades. Our holistic approach to investing in our talent creates an environment that is employee focused. Investing in career development and wellness has guaranteed a high performance, results-oriented culture. Our employees are consistently productive, healthy and highly engaged in the company and involved in their communities.
34 35

NOTES TO THE FINANCIAL STATEMENTS FOR THE YEAR ENDED 31 MARCH 2015
Notes (continued)2. SIGNIFICANT ACCOUNTING POLICIES (Continued)(i) Inventories (continued) and rebates on a weighted average basis; and• Finished goods and work in progress: Raw material cost plus direct costs and a proportion of manufacturing overhead expenses on a FIFO basis.
Net realisable value is the estimated selling price in an open market less further costs expected to be incurred to completion and disposal.
(j) Deposits by customersBottles and containers in circulation are recorded within property plant and equipment and a corresponding liability is recorded in respect of the obligation to repay customers’ deposit. Deposits paid by customers for branded returnable containers are reflected in statement of financial position within current liabilities. Any estimated liability that may arise in respect of deposits for containers and bottles is shown in provisions.
(k) Trade receivablesTrade receivables are initially recognised at fair value and subsequently measured at amortised cost.
Provision for impairment of trade receivables is established when there is objective evidence that the Group or Company will not be able to collect all amounts due according to the terms of the receivables. The amount of the provision is the difference between the asset’s carrying value and the present value of the estimated future cash flows discounted at the original effective interest rate. This provision is recognised in profit or loss.
(l) Cash and cash equivalentsCash and cash equivalents include cash in hand, bank deposits payable on demand, other short-term highly liquid investments with original maturities of three months or less, and bank overdrafts.
Bank overdrafts are shown within borrowings in current liabilities on statement of financial position and are included within cash and cash equivalents on the face of the cash flows as they form an integral part of the Group’s or Company’s cash management.
(m) Share capitalOrdinary shares are classified as equity. Incremental costs directly attributable to the issue of new shares or options are shown in equity as a deduction, net of tax, from the proceeds.
(n) Investment in own shares (treasury and shares held by employee benefit trusts)Shares held by employee share benefit trusts and in treasury are treated as a deduction from equity until the shares are cancelled, reissued or disposed off.
Purchases of such shares are classified in the cash flow statement of cash flows as a purchase of own shares for share trust or purchase of own shares for treasury within net cash from financing activities.
Where such shares are subsequently sold or reissued, any consideration received, net of directly attributable incremental costs and related tax effects, is included in equity attributable to the Company’s equity shareholders.
(o) Trade payablesTrade payables are obligations to pay for goods or services that have been acquired in the ordinary course of business from suppliers. Trade payables are classified as current liabilities if payment is due within one year or less (or in the normal operating cycle of the business if longer). If not, they are presented as non-current liabilities.
Trade payables are recognised initially at fair value and subsequently measured at amortised cost using the effective interest method.
(p) ProvisionsProvisions are recognised when there is a present obligation, whether legal or constructive, as a result of a past event for which it is probable that a transfer of economic benefits will be required to settle the obligation and a reliable estimate can be made of the amount of the obligation. Such provisions are calculated on a discounted basis where the effect is material to the original undiscounted provision. The carrying amount of the provision increases in each period to reflect the passage of time and the unwinding of the discount and the movement is recognised in profit or loss within finance costs. (q) Income taxIncome tax expense is the aggregate of the charge in profit or loss in respect of current and deferred income tax. Current income tax is the amount of income tax payable on the taxable profit for the year determined in accordance with the Tanzania Income Tax Act, 2004.
Deferred income tax is provided in full using the liability method on temporary differences arising between the tax bases of assets and liabilities and their carrying amounts in the financial statements. Deferred income tax is determined using tax rates (and laws) that have been enacted or substantively enacted at the statement of financial position date and are expected to apply when the related deferred income tax asset is realized or the deferred income tax liability is settled.
Deferred income tax assets are recognised to the extent that the directors consider that it is probable that future taxable profit will be available against which the temporary differences can be utilised.
NOTES TO THE FINANCIAL STATEMENTS
Notes (continued)2. SIGNIFICANT ACCOUNTING POLICIES (Continued)(ii) Software (continued)
the following criteria have been met:
• It is technically feasible to complete the software product so that it will be available for use;
• Management intends to complete the software product and use or sell it;
• There is an ability to use or sell the software product;• It can be demonstrated how the software product will generate probable future economic benefits; • Adequate technical, financial and other resources to complete the development and to use or sell the software product are available; and• The expenditure attributable to the software product during its development can be reliably measured.
Direct costs include software development employment costs (including those of contractors used) and an appropriate portion of overheads.
Other development expenditures that do not meet these criteria are recognised as an expense as incurred. Development costs previously recognised as an expense are not recognised as an asset in a subsequent period.
Capitalised computer software, license and development costs are amortised over their useful economic lives of between 3 and 5 years.
Internally generated costs associated with maintaining computer software programmes are expensed as incurred.
(iii) BrandsBrands are recognized as an intangible asset where the brand has a long-term value. Acquired brands are only recognized where title is clear or the brand could be sold separately from the rest of the business and the earnings attributable to it are separately identifiable.
Acquired brands are amortised. In respect of brands currently held the amortization period is 10 to 40 years, being the period for which the group has exclusive rights to those brands.
(g) Impairment of assetsThis policy covers all assets except inventories (see note j), financial assets (see note x) and deferred income tax assets (see note q).
Impairment reviews are performed by comparing the carrying value of the non-current asset to its recoverable amount, being the higher of the fair value less costs to sell and value in use.
The fair value less costs to sell is considered to be the amount that could be obtained on disposal of the asset. The value in use of the asset is determined by discounting, at a market based pre-tax discount rate, the expected future cash flows resulting from its continued use, including those arising from its final disposal. When the carrying values of non-current assets are written down by any impairment amount, the loss is recognised in profit or loss in the period in which it is incurred. Where the asset does not generate cash flows that are independent from the cash flows of other assets, the group or Company estimates the recoverable amount of the cash generating unit (CGU) to which the assets belongs. For the purpose of conducting impairment reviews, CGUs are considered to be groups of assets and liabilities that have separately identifiable cash flows. They also include those assets and liabilities directly involved in producing the income and a suitable proportion of those used to produce more than one income stream.
When impairment is recognised, the impairment loss is held firstly to reduce the carrying amount of any goodwill allocated to the CGU then to the other assets of the unit pro rata on the basis of the carrying amount of each asset in the unit.
Should circumstances or events change and give rise to a reversal of a previous impairment loss, the reversal is recognised in profit or loss in the period in which it occurs and the carrying value of the asset is increased. The increase in the carrying value of the asset is restricted to the amount that it would have been had the original impairment not occurred. Impairment losses in respect of goodwill are irreversible.
Intangible non-current assets with an indefinite life and goodwill are tested annually for impairment. Assets subject to amortisation are reviewed for impairment if circumstances or events change to indicate that the carrying value may not be fully recoverable.
(h) Investments in subsidiariesInvestments in subsidiaries are carried at cost. If there is objective evidence that an impairment loss has been incurred on investments in subsidiaries, the amount of the loss is measured as the difference between the asset’s carrying amount and the present value of estimated future cash flows, discounted at the current market rate of return for a similar financial asset. Any subsequent reversal of an impairment loss is recognised in the statement of profit or loss and other comprehensive income.
(i) InventoriesInventories are stated at the lower of cost incurred in bringing each product to its present location and condition, and net realisable value, as follows:
• Raw materials: Purchase cost net of discounts and rebates on a first-in first-out basis (FIFO);• Consumable stores and spares: Purchase cost net of discounts
FOR THE YEAR ENDED 31 MARCH 2015
36 37

NOTES TO THE FINANCIAL STATEMENTS FOR THE YEAR ENDED 31 MARCH 2015
Notes (continued)2. SIGNIFICANT ACCOUNTING POLICIES (Continued)(w) Borrowings (continued)cost; any difference between proceeds (net of transaction costs) and the redemption value is recognised in profit or loss over the period of the borrowings, using the effective interest method.
Fees paid on the establishment of loan facilities are recognised as transaction costs of the loan to the extent that it is probable that some or all of the facility will be drawn down. In this case, the fee is deferred until the draw-down occurs. To the extent there is no evidence that it is probable that some or all of the facility will be drawn down, the fee is capitalised as a pre-payment for liquidity services and amortised over the period of the facility to which it relates.
Borrowings are classified as current liabilities unless the Group or Company has an unconditional right to defer settlement of the liability for at least 12 months after the end of the reporting period.
(x) Borrowing costGeneral and specific borrowing costs directly attributable to the acquisition, construction or production of qualifying assets, which are assets that necessarily take a substantial period of time to get ready for their intended use or sale, are added to the cost of those assets, until such a time as the assets are substantially ready for their intended use or sale.
Investment income earned on the temporary investment of specific borrowing pending their expenditure on qualifying assets is deducted from the borrowing costs eligible for capitalisation.
All other borrowing costs are recognised in profit or loss in the period in which they are incurred.
(y) Financial assets(i) ClassificationThe group classifies its financial assets in the following categories: at fair value through profit or loss, loans and receivables, and available for sale. The classification depends on the purpose for which the financial assets were acquired. Management determines the classification of its financial assets at initial recognition.
Loans and receivables are non-derivative financial assets with fixed or determinable payments that are not quoted in an active market. They are included in current assets, except for maturities greater than 12 months after the end of the reporting period. These are classified as non-current assets. The group’s loans and receivables comprise ‘trade and other receivables’ and ‘cash and cash equivalents’ in the statement of financial position.
(ii) Recognition and measurementRegular purchases and sales of financial assets are recognised on the trade-date – the date on which the group commits to purchase or sell the asset. Loans and receivables are subsequently carried at amortised cost using the effective interest method.
(z) Impairment of financial assetsAssets carried at amortised costThe group assesses at the end of each reporting period whether there is objective evidence that a financial asset or group of financial assets is impaired. A financial asset or a group of financial assets is impaired and impairment losses are incurred only if there is objective evidence of impairment as a result of one or more events that occurred after the initial recognition of the asset (a ‘loss event’) and that loss event (or events) has an impact on the estimated future cash flows of the financial asset or group of financial assets that can be reliably estimated.
Evidence of impairment may include indications that the debtors or a group of debtors is experiencing significant financial difficulty, default or delinquency in interest or principal payments, the probability that they will enter bankruptcy or other financial reorganisation, and where observable data indicate that there is a measurable decrease in the estimated future cash flows, such as changes in arrears or economic conditions that correlate with defaults.For loans and receivables category, the amount of the loss is measured as the difference between the asset’s carrying amount and the present value of estimated future cash flows (excluding future credit losses that have not been incurred) discounted at the financial asset’s original effective interest rate. The carrying amount of the asset is reduced and the amount of the loss is recognised in the consolidated income statement. If a loan or held-to-maturity investment has a variable interest rate, the discount rate for measuring any impairment loss is the current effective interest rate determined under the contract. As a practical expedient, the group may measure impairment on the basis of an instrument’s fair value using an observable market price.
If, in a subsequent period, the amount of the impairment loss decreases and the decrease can be related objectively to an event occurring after the impairment was recognised (such as an improvement in the debtor’s credit rating), the reversal of the previously recognised impairment loss is recognised in the consolidated income statement.
38 39
NOTES TO THE FINANCIAL STATEMENTS
Notes (continued)2. SIGNIFICANT ACCOUNTING POLICIES (Continued) (q) Income tax (continued)Deferred income tax assets and liabilities are offset when thereis a legally enforceable right to offset current tax assets against current tax liabilities and when the deferred income taxes assets and liabilities relate to income taxes levied by the same taxation authority on either the same taxable entity or different taxable entities where there is an intention to settle the balances on a net basis.
(r) Operating leasesLeases in which a significant portion of the risks and rewards of ownership are retained by the lessor are classified as operating leases. Leases in which a significant portion of the risks and rewards of ownership are retained by the lessor are classified as operating leases. Payments made under operating leases (net of any incentives received from the lessor) are charged to profit or loss on a straight-line basis over the period of the lease.
(s) Employee benefits(i) Bonus plansThe Group and the Company recognises a liability and an expense for bonuses, based on a formula that takes into consideration the profit attributable to the Company’s shareholders after certain adjustments. The Group and the Company recognise a provision where contractually obliged or where there is a past practice that has created a constructive obligation.
(ii) Defined contribution plan The Group and Company pay contributions to the National Social Security Fund (NSSF) and Parastatal Pensions Fund (PPF), which are publicly, administered pension plans, on a mandatory basis. These are defined contribution schemes. A defined contribution plan is a pension plan under which the Group and the Company pay fixed contributions into a separate entity.
The Group and the Company have no legal or constructive obligations to pay further contributions if the fund does not hold sufficient assets to pay all employees the benefits relating to employee service in the current and prior periods. The Group’s and the Company’s contributions are recognised as employee benefit expense when they are due.
(t) Earnings per shareBasic earnings per share represent the profit on ordinary activities after taxation attributable to the equity shareholders of the parent entity, divided by the weighted average number of ordinary shares outstanding during the year, excluding the weighted average number of ordinary shares held in the Group’s and the Company’s employee benefit trust during the year.
Diluted earnings per share represent the profit on ordinary
activities after taxation attributable to the equity shareholders, divided by the weighted average number of ordinary shares outstanding during the year, including the weighted average number of ordinary shares held in the Group’s and the Company’s employee benefit trust during the year, plus the weighted average number of dilutive shares resulting from share options and other potential ordinary shares outstanding during the year.
(u) Dividends distributionDividend distribution to the Company’s shareholders is recognised as a liability in the Group’s financial statements in the period in which the dividends are approved by the Company’s shareholders.
(v) Revenue recognition(i) Sale of goods and servicesRevenue represents the fair value of consideration received or receivable for goods and services sold to third parties and is recognised when the risks and rewards of ownership are substantially transferred. Risks and rewards are deemed to have substantially transferred once goods leave the relevant TBL Group’s warehouse or depot, based on a customer’s order.
The Group and Company present revenue gross of excise duties because unlike value added tax, excise is not directly related to the value of sales. It is not recognised as a separate item on invoices. Increases in excise duties are not always directly passed on to customers, and the Group and Company cannot reclaim the excise duties where customers do not pay for product received. The Group and Company, therefore, consider excise duties as a cost to the entity and reflect it as a production cost. Consequently any excise duties that is recovered in the sale price is included in revenue.
Revenue excludes value added tax. It is stated net of price discounts, promotional discounts and after an appropriate amount has been provided to cover the sales value of credit notes yet to be issued that relate to the current and prior periods. The same recognition criteria also apply to the sale of by-products and waste (such as spent grain, malt dust and yeast).
(ii) Interest incomeInterest income is recognised using the effective interest method.
(iii) Royalty incomeRoyalty income is recognised on an accruals basis in accordance with the relevant agreements and is included in other income.
(iv) Dividend income Dividend income is recognised when the right to receive payment is established.
(w) BorrowingsBorrowings are recognised initially at fair value, net of transaction costs incurred. Borrowings are subsequently stated at amortised
FOR THE YEAR ENDED 31 MARCH 2015
38 39

TASK 4to empower our communities
We are a proudly Tanzanian Company and strongly believe in empowering Tanzanian businesses. We source the majority of our resources locally, thus boosting the economy and making the country les reliant on foreign imports. Over 30,000 Tanzanian people are currently benefiting directly and indirectly from agricultural activities supported by TBL.
Sugar, barley, sorghum and maize are all grown and purchased locally: this has seen us inject Tshs 84 billion in the Tanzanian economy. We also work closely with local farmers, providing much needed skills in farming techniques. This work has produced amazing results; with the 2014 barley crop (12,000 tons) being the most successful harvest since farming began in Tanzania. The farmers subsequently earned a profit of TShs 13.4 billion from their barley crop alone that year.
Tanzania Distilleries Limited (TDL), a subsidiary of TBL, also invests in the Tanzanian Grape Farming industry. They provide seedlings, equipment and training on modern farming techniques to over 700 farmers. The benefit to local farmers has been huge; tons of higher quality grapes per acre, more income to support their families and even scholarships for the children of wine farmers who can’t afford to send their kids to school.
In addition to farmers, TBL also offers business supports to their distributers in the form of free training, enabling them to expand in size, customer base and revenue. We also offer huge incentives for good performance.
THE TASKSOF TBL
40 41

NOTES TO THE FINANCIAL STATEMENTS
Notes (continued)3. CRITICAL ACCOUNTING ESTIMATES AND JUDGMENTS(Continued)(ii) Impairment of goodwill (continued)
The recoverable amounts of cash-generating units have been determined based on value-in-use calculations. These calculations require the use of estimates.
No impairment charge arose during the course of the year. The value in use as at 31 March 2015 was estimated at TShs 4,106 billion (2014: TShs 3,528 billion). If the budgeted EBIDTA growth rate used in the value-in-use calculation for the Clear beer segment had been 10% lower than management’s estimates at 31 March 2015, the estimated value in use would have been TShs 49.8 billion (2014: TShs 43 billion) lesser than the management estimated value and would have resulted to no impairment of goodwill.
If the estimated cost of capital used in determining the pre-tax discount rate for the Clear beer segment had been 10% higher than management’s estimates, the fair value would have been TShs 701 billion (2014: TShs 639 billion) higher than the estimated amount, which will result to no impairment of goodwill.
If the estimated long-term growth rate used in determining the value in use of the clear beer segment had been 10% lower than management’s estimates, the fair value would have been TShs 354 billion (2014: TShs 315 billion) lower than the estimated amount, which will result to no impairment of goodwill.
(iii) Property, plant and equipment The determination of the useful economic life and residual values of property, plant and equipment is subject to management estimation. The Group and Company regularly reviews all of its
depreciation rates and residual values to take account of any changes in circumstances, and any changes that could affect prospective depreciation charges and asset carrying values.
4. FINANCIAL RISK MANAGEMENT 4.1. Financial risk factorsThe Group’s and Company’s activities expose them to a variety of financial risks including: market risk (including foreign exchange, interest rate and price risk), credit risk and liquidity risk. The Group’s overall risk management programme seeks to minimize potential adverse effects on the Group’s financial performance. Risks management is carried out by the management on behalf of the Board of Directors.
Market risk(i) Foreign exchange riskThe Group and Company import raw materials, capital equipment and services and are exposed to foreign exchange risk arising from various currency exposures, primarily with respect to the US dollar, Euro and SA Rand. Foreign exchange risk arises from future commercial transactions, and recognised assets and liabilities.
Currency exposure arising from liabilities denominated in foreign currencies is managed primarily through the holding of bank balances in the relevant foreign currencies. The group and company are required to hedge the entire foreign risk exposure with the group treasury.
The Group adopts a policy of ensuring that net monetary assets or liabilities denominated in a non-functional currency are lower than TShs 20 billion. In addition, the Group’s policy is to limit the impact to 1% of Group operating profit (excluding exceptional items) for each 10% change in foreign exchange rates.
The tables below set out the Group’s currency exposures from
FOR THE YEAR ENDED 31 MARCH 2015
Exposure Exposure Exposure Total in ZAR in US$ in Euro exposure
GROUP TShs ‘M TShs ‘M TShs ‘M TShs ‘M31 March 2015
Financial assets/(liabilities) Cash and cash equivalents 449 4,901 4,755 10,105 Trade and other receivables - 6,576 599 7,175 Borrowings (411) (77) - (488)Trade and other payable (2,537) (8,744) (6,183) (17,464)
Net monetary assets/ (liabilities) (2,499) (2,656) (829) (672)
31 March 2014 Financial assets/(liabilities) Cash and cash equivalents 666 2,746 186 3,598Trade and other receivables 252 3,589 306 4,147Borrowings (165) (78) - (243)Trade and other payable (9,116) (12,307) (13,913) (35,336)
Net monetary assets / (liabilities) (8,363) (6,050) (13,421) (27,834)
42 43
NOTES TO THE FINANCIAL STATEMENTS
Notes (continued)2. SIGNIFICANT ACCOUNTING POLICIES (Continued)
(aa) Derivative financial assets and financial liabilities Derivative financial assets and financial liabilities are financial instruments whose value changes in response to an underlying variable, require little or no initial investment and are settled in the future.These include derivatives embedded in host contracts. Such embedded derivatives need not be accounted for separately if the host contract is already fair valued; if it is not considered as a derivative if it was freestanding; or if it can be demonstrated that it is closely related to the host contract.
There are certain currency exemptions which the Group and Company have applied to these rules which limit the need to account for certain potential embedded foreign exchange derivatives, namely where a contract is denominated in the functional currency of either party or in a currency that is commonly used in contracts to purchase or sell non-financial items in the economic environment in which the transaction takes placeFor derivatives that have not been designated to a hedging relationship, all fair value movements are recognised immediately in profit or loss.
(ab) Derivative financial instruments – hedge accountingFinancial assets and financial liabilities at fair value through profit or loss include all derivative financial instruments. The derivative instruments used by the Group, which are used solely for hedging purposes (i.e. to offset foreign exchange and interest rate risks), comprise interest rate swaps, cross currency swaps, forward foreign exchange contracts and other specific instruments as necessary under the approval of the board. Such derivative instruments are used to alter the risk profile of an existing underlying exposure of the group in line with the group’s risk management policies. The group also has derivatives embedded in other contracts primarily cross border foreign currency supply contracts for raw materials.
Derivatives are initially recorded at fair value on the date a derivative contract is entered into and are subsequently remeasured at their fair value. The method of recognizing the resulting gain or loss depends on whether the derivative is designated as a hedging instrument and, if so, the nature of the hedging relationship.
In order to qualify for hedge accounting, the group is required to document at inception, the relationship between the hedged item and the hedging instrument as well as its risk management objectives and strategy for undertaking hedging transactions. The group is also required to document and demonstrate that the relationship between the hedged item and the hedging instrument will be highly effective. This effectiveness test is reperformed at
each period end to ensure that the hedge has remained and will continue to remain highly effective.
The Group designates certain derivatives as either: hedges of the fair value of recognized assets or liabilities or a firm commitment (fair value hedge); or hedges of highly probable forecast transactions or commitments (cash flow hedge).
Cash flow hedgesCash flow hedges comprise derivative financial instruments designated in a hedging relationship to manage currency and interest rate risk to which the cash flows of certain liabilities are exposed. The effective portion of changes in the fair value of the derivative that is designated and qualifies for hedge accounting is recognized in other comprehensive income. The ineffective portion is recognized immediately in profit or loss. Amounts accumulated in equity are reclassified to profit or loss in the period in which the hedged item affects profit or loss. However, where a forecasted transaction results in a non-financial asset or liability, the accumulated fair value movements previously deferred in equity are included in the initial cost of the asset or liability.
(ac) ComparativesWhere necessary, comparative figures have been adjusted to conform to changes in presentation in the current year.
3. CRITICAL ACCOUNTING ESTIMATES AND JUDGMENTSEstimates and judgments are continually evaluated and are based on historical experience and other factors, including experience of future events that are believed to be reasonable under the circumstances.
The Group and the Company make estimates and assumptions concerning the future. The resulting accounting estimates will, by definition, seldom equal the related actual results. The estimates and assumptions that have a significant risk of causing a material adjustment to the carrying amounts of assets and liabilities within the next financial year are addressed below.
(i) Income taxSignificant judgment is required in determining the Company’s and Group’s overall income tax provision or estimated future recovery of income tax losses. There are many transactions and calculations, for which the ultimate tax determination is uncertain. The Company and Group recognise liabilities for anticipated tax audit issues, based on estimates of whether additional taxes will be due. Where the final outcome of tax matters is different from the amounts that were initially recorded, such differences will have an impact on the current and any deferred income tax provisions in the periods in which the determination is made.
(ii) Impairment of goodwillThe group tests annually whether goodwill has suffered any impairment, in accordance with the accounting policy stated in note 2 (f).
FOR THE YEAR ENDED 31 MARCH 2015
42 43

TASK 5to conserve our environment
Ndovu DefendersOne of TBL’s iconic brands, Ndovu Special Malt, has taken on the responsibility of defending one of Tanzania’s natural icons: the elephant. The plight of the African elephant has reached devastating proportions and it is estimated that there are only 500,000 elephants left on the African continent. A third of the elephants slaughtered to date were in Tanzania. Ndovu provides economic support and inspires its consumers to help secure a brighter future for these magnificent creatures.
Water ConservationA large amount of water goes into producing beer. At TBL, we ensure that we use water as efficiently as possible and are able
to recycle as much as possible. Excess water is used for cleaning and watering our gardens.
Reducing Our Carbon FootprintFrom the shop floor to the plant manager, we have put alot of focus on reducing our carbon footprint. Our ultimate goal is to reduce energy consumption in every plant by 25%. Our heavy machinery has been fitted with devices to measure, analyze and optimize consumption of energy at each brewery. Additionally our plants are fitted with energy saving light bulbs, solar panels and bio gas (for Argo Fuel Boilers). Consequently, our SAB Miller International rankings are impressive when it comes to energy reduction.
THE TASKSOF TBL
Recycling Bottles & Reducing WasteTo protect our environment, the 5R’s are followed to ensure that there are minimum waste and carbon emissions across our entire supply chain. The ‘5Rs’ are pRotect, Reduce, Re-use Recycle and Redistribute. Over 93% of the glass bottles sold by our retailers are returned to the breweries and recycled. Broken glass is melted down and molded into new bottles – there is no limit to how many times this can be done without degradation. Left over seeds from the brewing process are purchased by neighboring communities and used as animal feed. All in all, the waste from our manufacturing process is minimal, and what’s left is disposed of responsibly.
ReforestationEvery year, TBL plants up to 4,000 trees in it’s key areas of operation (Mwanza, Arusha and Mbeya). The surrounding communities are encouraged to foster and protect these trees. Planting more trees also helps with preventing soil erosion and helps to conserve the country’s water.
44 4544 4544 45

NOTES TO THE FINANCIAL STATEMENTS
Notes (continued)4. FINANCIAL RISK MANAGEMENT (Continued)
Credit riskCredit risk is managed by the National Credit Manager. Credit risk
arises from cash at bank and short-term deposits with banks, as
well as trade and other receivables. The Group or Company has
no significant concentrations of credit risk. The National Credit
Manager assesses the credit quality of each customer, taking
into account its financial position, past experience and other
factors. The utilisation of credit limits is regularly monitored.
The counterparties to the transactions relating to the Group’s and Company’s cash and cash equivalents are financial institutions with a strong financial standing. The Group manages the risk by banking with financial institutions assessed as financially strong. Management does not believe there is a significant risk of non-performance by these counterparties.
The credit quality of financial assets that are neither past due nor impaired can be assessed by reference to historical information about counterparty default rates. The Group and Company monitor receivables ensuring that all trade receivables are within their approved credit limits and no receivables have had their terms renegotiated.
Cash security 26,623 22,215 24,486 20,539Bank guarantees 57,204 29,638 54,652 29,638 83,827 51,853 79,138 50,177
None of these assets are either past due or impaired except for the following amounts in trade receivables (which are due within 30 days of the end of the month in which they are invoiced). The
individually impaired receivables mainly relate to trading debt. It was assessed that a portion of the receivables is expected to be recovered. The aging of these receivables is as follows;
Group Company
Trade receivables and other receivables Counterparties without external credit rating: Group 1 – New customers 733 484 478 475Group 2 – Existing customers with no defaults inthe past 103,836 68,384 59,132 54,120Other receivables (excluding advance to suppliersand prepayments) - Not in arrears 48,781 12,413 84,084 45,855 153,350 81,281 143,694 100,450
Cash at bank and short term bank deposits 35,565 10,918 24,181 6,845
2015 2014 2015 2014 TShs ‘M TShs ‘M TShs ‘M TShs ‘M
The credit quality of financial assets that are neither past due nor impaired can be assessed by reference to external credit ratings, if available, or historical information about counterparty default rates.There is no independent credit rating for banks operating in Tanzania. However, the Group and Company’s bankers are reputable local banks and subsidiaries of reputable international banks. The Group banks with the following banks: Stanbic Bank
Tanzania Limited, Standard Chartered Bank Tanzania Limited, Citibank Tanzania Limited, National Bank of Commerce Limited, CRDB Bank Plc and Microfinance Bank PlcAll major credit customers are required to give collateral in the form of cash deposits or bank guarantees. Credit risk is managed by limiting the aggregate amount of exposure to any counterparty. The trade receivable balances are net of these cash deposits and bank guarantee balances.
Group Company
2015 2014 2015 2014 TShs ‘M TShss ‘M TShs ‘M TShs ‘M
Collateral held comprises:
FOR THE YEAR ENDED 31 MARCH 2015NOTES TO THE FINANCIAL STATEMENTS
COMPANY31 March 2015 Financial assets/(liabilities) Cash and cash equivalents 276 3,457 2,772 6,505 Trade and other receivables - 6,576 599 7,175 Borrowings (265) (77) - (342)Trade and other payable (2,537) (6,789) (6,183) (15,509)
Net monetary assets/(liabilities) (2,526) 3,167 (2,812) (2,171)
31 March 2014Financial assets/(liabilities) Cash and cash equivalents 324 1,208 68 1,600Trade and other receivables 252 3,589 306 4,147Borrowings (165) (78) - (243)Trade and other payable (9,086) (12,277) (10,862) (32,225)
Net monetary assets/(liabilities) (8,675) (7,558) (10,488) (26,721)
Exposure Exposure Exposure Total in ZAR in US$ in Euro exposure
Notes (continued)4. FINANCIAL RISK MANAGEMENT (Continued)
financial assets and liabilities held by the group companies in currencies other than their functional currencies and resulting in exchange movements in profit or loss and statement of financial position.
At 31 March 2015, if the Tanzania shilling (TShs) had weakened/
strengthened by 10% (2014: 10%) against the US dollar with
all other variables held constant, Group’s post-tax profit for the
year would have been higher or lower by TShs 185 million (2014:
TShs 424 million) and the Company’s post-tax profit for the year
by TShs 222 million (2014: TShs 529 million), mainly as a result
of foreign exchange gains/losses on translation of US dollar-
denominated cash and cash equivalents and trade and other
payable.
At 31 March 2015, if the Tanzania shilling (TShs) had weakened/
strengthened by 10% (2014: 10%) against the Euro with all other
variables held constant, Group’s post-tax profit for the year
would have been higher/lower by TShs 58 million (2014: TShs
939 million) and Company’s post-tax profit for the year by TShs
197 million (2014: TShs 734 million), mainly as a result of foreign
exchange gains/losses on translation of Euro-denominated cash
and cash equivalents and trade and other payable.
At 31 March 2015, if the Tanzania shilling (TShs) had weakened/
strengthened by 10% (2014: 10%) against the SA Rand with
all other variables held constant, Group’s post-tax profit for
the year would have been higher or lower by TShs 175 million
(2014: TShs 607 million) and Company’s by TShs 179 million
(2014: TShs 658 million), mainly as a result of foreign exchange
losses/gains on translation of SA Rand-denominated cash and
cash equivalents and trade and other payable.
The impact of foreign exchange fluctuation on Group’s and
Company’s equity mainly as result of translation of foreign
currency dominated trade and other payable is considered
insignificant.
(ii) Cash flow and fair value rate risk
The Group’s and Company’s interest bearing financial liabilities
include its bank overdrafts, short-term loans and corporate
bonds, some of which are at a variable rate, and on which it is
therefore exposed to cash-flow interest rate risk. The Group and
Company regularly monitor financing options available to ensure
optimum interest rates are obtained. At 31 March 2015, an
increase/decrease of 100 basis points (2014:100 basis points)
would have resulted in a decrease/increase in post-tax profit of
the Group and Company of TShs 1,580 million (2014: TShs 152
million).
(iii) Price risk
The Group and Company exposure to price risk considered
negligible both to the Group and Company.
FOR THE YEAR ENDED 31 MARCH 2015
TShs ‘M TShs ‘M TShs ‘M TShs ‘M
46 47

NOTES TO THE FINANCIAL STATEMENTS FOR THE YEAR ENDED 31 MARCH 2015
Company Stanbic Bank Tanzania Limited 9,000 - 9,050 -Standard Chartered Bank Tanzania Limited 30,000 343 30,000 19,340Citibank Tanzania Limited 11,190 - 48,750 80National Bank of Commerce Limited 53,000 38,800 11,000 9,592CRDB Bank Plc - - 25,000 3,104National Microfinance Bank Plc 15,000 178 30,000 12,061 118,190 39,321 153,800 44,177
At 31 March 2015 Non derivative financial liabilities Borrowings and interest on borrowings 1,203 1,500 453 -Trade and other payable 109,79 - 90,339 -Provision for other liabilities and charges 739 Derivative financial liabilities - Cash outflows - forward 58,133 - 55,734 -
At 31 March 2014 Non derivative financial liabilities Borrowings and interest on borrowings 3,022 2,250 2,099 -Trade and other payable 92,810 - 81,166 -Provision for other liabilities and charges 829 Derivative financial liabilities - Cash outflows - forward 28,832 - 23,345 -
31 March 2015 31 March 2014
Notes (continued)4. FINANCIAL RISK MANAGEMENT (Continued)Liquidity risk (continued)
Credit limit Utilised Credit limit Utilised TShs ‘M TShs ‘M TShs ‘M TShs ‘M
The table below analyses the group’s non derivative financial liabilities and derivative financial liabilities which will be settled on a net basis into relevant maturity groupings based on the remaining period at the statement of financial position to the
contractual maturity date. The amounts disclosed in the table are the contractual undiscounted cash flows. Balances due within 12 months equal their carrying balances as the impact of discounting is not significant.
Group Company
Between Between Within 1 2 and 5 Within 1 2 and 5 year years year years TShs ‘M TShs ‘M TShs ‘M TShs ‘M
48 4948 49
NOTES TO THE FINANCIAL STATEMENTS
Past due but not impaired: - by up to 30 days 13,820 10,842 5,660 5,574- by 31 to 60 days 8,334 2,435 1,617 1,728- by over 60 days 8,614 5,158 4,510 3,126 Total past due but not impaired 30,768 18,435 11,787 10,428 Trade receivables individually determined to be impaired: Carrying amount before provision for impairment loss 2,065 1,828 1,415 1,338Provision for impairment loss (2,065) (1,828) (1,415) (1,338) Net carrying amount - - - -
Liquidity riskLiquidity risk is the risk that the Group will not be able to meet its financial obligations as they fall due.
Prudent liquidity risk management includes maintaining sufficient cash and cash equivalents, the availability of funding from an adequate amount of committed credit facilities and the ability to close out market positions. Due to the dynamic nature of the underlying businesses, the group maintains flexibility in funding by
maintaining availability under committed credit lines and through inter-Company short term advances. Management monitors rolling forecasts of the group’s liquidity reserve on the basis of expected cash flows.
The table below shows the availability of funding for the Group from banks and their related utilisation at the statement of financial position dates.
Notes (continued)4. FINANCIAL RISK MANAGEMENT (Continued)
(iv) Credit risk (continued)
Group Company
2015 2014 2015 2014 TShs ‘M TShs ‘M TShs ‘M TShs ‘M
Name of the bank
Group Stanbic Bank Tanzania Limited 9,000 - 9,050 -Standard Chartered Bank Tanzania Limited 30,000 15,495 30,000 26,312Citibank Tanzania Limited 11,190 - 48,750 80National Bank of Commerce Limited 61,000 42,004 12,000 9,592CRDB Bank Plc - - 25,000 3,104National Microfinance Bank Plc 15,000 178 30,000 12,774 126,190 57,677 154,800 51,862
Group Company
31 March 2015 31 March 2014
Credit limit Utilised Credit limit Utilised TShs ‘M TShs ‘M TShs ‘M TShs ‘M
FOR THE YEAR ENDED 31 MARCH 2015
48 49

NOTES TO THE FINANCIAL STATEMENTS
Notes (continued)4. FINANCIAL RISK MANAGEMENT (Continued)
FOR THE YEAR ENDED 31 MARCH 2015
4.3. Fair value estimationThe table below analyses financial instruments carried at fair
value, by valuation method. The different levels have been
defined as follows:
• Quoted prices (unadjusted) in active markets for identical
assets or liabilities (Level 1).
• Inputs other than quoted prices included within level 1 that
are observable for the asset or liability, either directly (that is, as
prices) or indirectly (that is, derived from prices) (Level 2).
• Inputs for the asset or liability that are not based on observable
market data (that is, unobservable inputs) (Level 3).
The following table presents the Group’s and Company’s financial
assets and liabilities that are measured at fair value at 31 March
2015.
GROUP
Year ended 31 March 2015
Assets
Embedded derivatives - 599 - 599
Derivatives used for hedging
- Foreign exchange contracts - 214 - 214
- 813 - 813
Liabilities
Derivatives used for hedging
- Foreign exchange contracts - 3,760 - 3,760
Year ended 31 March 2014
Assets
Embedded derivatives - 306 - 306
Derivatives used for hedging
- Foreign exchange contracts - 1,798 - 1,798
- 2,014 - 2,014
Liabilities
Derivatives used for hedging
- Foreign exchange contracts - 311 - 311
Level 1 Level 2 Level 3 Total Balance
TShs ‘M TShs ‘M TShs ‘M TShs ‘M
NOTES TO THE FINANCIAL STATEMENTS
Notes (continued)4. FINANCIAL RISK MANAGEMENT (Continued)
4.2. Capital managementThe Group’s and Company’s objectives when managing capital
are to safeguard the Group’s and Company’s ability to continue
as a going concern in order to provide returns for shareholders
and to maintain an optimal capital structure to reduce the cost
of capital. In order to maintain or adjust the capital structure, the
Group may adjust the amount of dividends paid to shareholders,
issue new capital or sell assets to reduce debt.
Consistent with others in the industry, the Group monitors capital
on the basis of the gearing ratio. The gearing ratio is calculated
as net debt divided by total capital. Net debt is calculated as
total borrowings less cash and cash equivalents. Total capital is
calculated as equity plus net debt.
During the year ended 31 March 2015 the Group’s and
Company’s strategy, which was unchanged from the prior year,
was to maintain a gearing ratio of below 60%. The gearing ratios
at 31 March 2015 and 2014 were as follows:
Group
Total borrowings 25 58,130 56,892Less: cash at bank and in hand 21 (35,767) (11,090) Net debt 22,363 45,802Total equity 612,795 552,603 Total capital 635,158 598,405 Gearing ratio 4% 8%
Company Total borrowings 25 39,774 46,207Less: cash at bank and in hand 21 (24,267) (6,921) Net debt 15,507 39,286Total equity 581,792 533,271 Total capital 597,299 572,557 Gearing ratio 3% 7%
FOR THE YEAR ENDED 31 MARCH 2015
Note 2015 2014
TShs ‘M TShs ‘M
50 51

NOTES TO THE FINANCIAL STATEMENTS FOR THE YEAR ENDED 31 MARCH 2015
Notes (continued)5. BUSINESS SEGMENTS INFORMATION The operating board have determined the operating segments based on reports reviewed by the board of directors that are used to make strategic decisions.
The operating board of directors considers the business from market and product perspectives. Market wise, management
considers the main lines through which the Group derives its revenue. Costs relating to the general group management are shared between the Company and its subsidiaries based on agreed management fees. The Group is currently organised into two main operating divisions; – Beer and Wines and Spirits. The segment information provided by management for the reportable segments for the year ended 31 March 2015 and 31 March 2014 is as follows:
2015Revenue Exports 4,881 8,080 - 12,961Local 857,284 202,879 - 1,060,163Total revenue from external customers 862,165 210,959 - 1,073,124 Operating profit 280,680 46,835 (9,176) 318,339Finance cost (net) (1,007) (8,401) - (9,408)Profit before tax 279,673 38,434 (9,176) 308,931Income tax expense (80,918) (11,458) (92,376)
Profit for the year 198,755 26,976 (9,176) 216,555
Depreciation, amortisation and breakages 44,935 2,139 - 47,074
Beer Wines & Spirits (Eliminations)/ Total Group Consolidation
TShs ‘M TShs ‘M TShs ‘M TShs ‘M
Segmental statement of profit or loss
The elimination relates to dividend income from its subsidiary, Tanzania Distilleries Limited.
NOTES TO THE FINANCIAL STATEMENTS
Notes (continued)4. FINANCIAL RISK MANAGEMENT (Continued)
4.3. Fair value estimation (continued)
FOR THE YEAR ENDED 31 MARCH 2015
The fair value of financial instruments that are not traded in an
active market is determined by using valuation techniques. The
valuation technique maximises the use of observable market data
where it is available and rely as little as possible on the Group and
Company’s specific estimates. If all significant inputs required to
fair value an instrument are observable, the instrument is included
in level 2. If one or more of the significant inputs is not based on
observable market data, the instrument is included in level 3.
The fair value of forward foreign exchange contracts is determined
using forward exchange rates at the statement of financial position
date, with the resulting value discounted back to present value.
COMPANY
Year ended 31 March 2015
Assets
Embedded derivatives - 599 - 599
Derivatives used for hedging
- Foreign exchange contracts - 180 - 180
- 779 - 779
Liabilities
Derivatives used for hedging
- Foreign exchange contracts - 3,419 - 3,419
Year ended 31 March 2014
Assets
Embedded derivatives - 306 - 306
Derivatives used for hedging
- Foreign exchange contracts - 1,532 - 1,532
- 1,838 - 1,838
Liabilities
Derivatives used for hedging
- Foreign exchange contracts - 293 - 293
Level 1 Level 2 Level 3 Total Balance
TShs ‘M TShs ‘M TShs ‘M TShs ‘M
52 53

NOTES TO THE FINANCIAL STATEMENTS FOR THE YEAR ENDED 31 MARCH 2015
2014Revenue Exports 4,273 2,912 - 7,185Local 821,493 151,273 - 972,766Total revenue from external customers 825,766 154,185 - 979,951 Operating profit 278,411 34,864 (15,481) 297,794Finance (cost)/income (net) 370 (5,445) - (5,075)Profit before tax 278,781 29,419 (15,481) 292,719Income tax expense (80,099) (8,913) - (89,012)
Profit for the year 198,682 20,506 (15,481) 203,707
Depreciation, amortisation and breakages 48,194 1,623 - 49,817
Segment assets, liabilities and capital expenditure 2014 Assets Investments 53,942 - (53,854) 88 Other non-current assets 456,658 22,217 44,776 523,651 Current assets 237,636 59,178 (41,440) 255,374 748,236 81,395 (50,518) 779,113 Liabilities and equity Current liabilities 158,030 59,288 (41,512) 175,806 Non-current liabilities 48,716 1,987 1 50,704Owner’s equity 541,490 20,120 (18,652) 542,958 Non-controlling interest - - 9,645 9,645 748,236 81,395 (50,518) 779,113 Capital expenditure 2014 Property, plant and equipment 94,211 3,262 - 97,473Intangible assets 147 - - 147 94,358 3,262 - 97,620
Notes (continued)5. BUSINESS SEGMENTS INFORMATION (Continued)
Beer Wines & Spirits (Eliminations)/ Total Group Consolidation
TShs ‘M TShs ‘M TShs ‘M TShs ‘M
Segmental statement of profit or loss
The elimination relates to dividend income from its subsidiary, Tanzania Distilleries Limited.
NOTES TO THE FINANCIAL STATEMENTS
2015 Assets Investments 53,942 - (53,854) 88Other non-current assets 484,334 23,215 44,896 552,445Current assets 264,266 93,073 (36,831) 320,508 802,542 116,288 (45,789)) 873,041 Liabilities and equity Current liabilities 160,673 81,274 (36,379) 205,568Non-current liabilities 52,304 2,454 (80) 54,678Owner’s equity 589,565 32,560 (22,987) 599,138Non-controlling interest - - 13,657 13,657 802,542 116,288 (45,789) 873,041 Capital expenditure 2015 Property, plant and equipment 82,146 3,236 - 85,382Intangible assets 709 - - 709 82,855 3,236 - 86,091
Segment Cash flows 2015 From operating activities 246,946 17,238 264,184 From investing activities (72,794) (3,236) (9,176) (85,206)From financing activities (149,394) (14,116) 9,176 (154,334)Net decrease in cash and cashequivalents 24,758 (114) - 24,644Cash and cash equivalent at the beginningof the year (37,968) (2,804) - (40,772)Exchange loss on cash and cash equivalents (2,787) (746) - (3,533)Cash and cash equivalents at the endof the year (15,997) (3,664) - (19,661)
FOR THE YEAR ENDED 31 MARCH 2015
Notes (continued)5. BUSINESS SEGMENTS INFORMATION (Continued)
Clear Beer Wines & Spirits (Eliminations)/ Total Group Consolidation
TShs ‘M TShs ‘M TShs ‘M TShs ‘M
Segment assets, liabilities and capital expenditure
54 55

NOTES TO THE FINANCIAL STATEMENTS
Group Company
Group Company
Group Company
Group Company
Group Company
FOR THE YEAR ENDED 31 MARCH 2015
Notes (continued)7. EXPENSES BY NATURE (Continued)
8. EMPLOYEE BENEFITS EXPENSE
9. OTHER INCOME/(EXPENSES)
10. DERIVATIVE INCOME/(LOSS)
Classifiedasfollows:
Cost of sales 544,742 477,113 401,411 372,408
Selling and distribution costs 154,666 142,650 133,580 132,813
Administrative expenses 55,485 61,617 44,921 52,403
754,893 681,380 579,912 557,624
2015 2014 2015 2014 TShs ‘M TShs ‘M TShs ‘M TShs ‘M
2015 2014 2015 2014 TShs ‘M TShs ‘M TShs ‘M TShs ‘M
2015 2014 2015 2014 TShs ‘M TShs ‘M TShs ‘M TShs ‘M
2015 2014 2015 2014 TShs ‘M TShs ‘M TShs ‘M TShs ‘M
2015 2014 2015 2014 TShs ‘M TShs ‘M TShs ‘M TShs ‘M
11. FINANCE INCOME AND COSTS
Finance income Interest income on bank balances - 2,684 - 2,684Interest income on intercompany accounts 209 - 209 -Interest income on current account with a subsidiary - - 6,715 4,964 209 2,684 6,924 7,648Finance costs Interest expense on bank borrowings (5,974) (3,905) (4,658) (3,851)Interest expenses on current account with parent (110) (385) (110) (385)Foreign exchange loss (3,533) (3,469) (2,787) (2,989)
(9,617) (7,759) (7,555) (7,225)
Fair value loss on derivatives 293 (438) 293 (438)
(Loss)/gain on disposal of property, plant and equipment (103) 65 (121) 33
Dividend income - - 9,176 15,558
Management fees - - 3,499 2,148
Foreign exchange gain/(loss) 770 (472) (801) (474)
Sundry (expenses)/income (852) 368 (3,254) 142
(185) (39) 8,499 17,407
The following items are included within
employee benefits expense
- Wages, salaries and other benefits 68,570 64,685 59,451 57,044
- Retirement benefit costs (defined contribution plans) 5,249 3,471 4,563 2,968
73,819 68,156 64,014 60,012
NOTES TO THE FINANCIAL STATEMENTS
Sale of goods - Local 1,060,163 972,466 847,383 814,422
Sale of goods - Export 12,961 7,185 4,881 4,273
1,073,124 979,651 852,264 818,695
Excise duty 243,350 200,789 169,653 153,633
Raw materials used 205,375 182,100 143,562 135,638
Transport and vehicle running costs 36,605 43,283 29,997 38,226
Depreciation and amortisation 47,074 40,432 44,045 38,502
Royalties 26,044 22,164 25,816 21,971
Impairment loss - receivables (Note 20) 295 545 134 482
Employee benefits expense (Note 8) 73,819 68,156 64,014 60,012
Advertising and promotion costs 49,768 49,488 44,021 44,098
Office running expenses 11,554 11,465 10,516 10,330
Operating lease rentals 9,309 7,900 6,980 6,056
Operating costs 12,320 11,114 10,232 9,100
Maintenance 11,172 19,133 8,855 17,318
Managerial, technical and administrative fees 27,697 24,275 21,667 21,822
Auditors remuneration - audit services 399 455 308 355
Auditors remuneration - non audit services 112 81 112 81
754,893 681,380 579,912 557,624
2014
From operating activities 198,481 23,445 - 221,926
From investing activities (80,118) (3,192) (15,558) (98,868)
From financing activities (186,535) (23,935) 15,558 (194,912)
Net decrease in cash and cash equivalents (68,172) (3,682) - (71,854)
Cash and cash equivalent at the beginning
of the year 32,961 1,590 - 34,551
Exchange loss on cash and cash equivalents (2,757) (712) - (3,469)
Cash and cash equivalents at the end
of the year (37,968) (2,804) - (40,772)
There were no revenues deriving from transactions with a single external customer that amounted to 10% or more of the Group’s
and Company’s revenues.
Notes (continued)5. BUSINESS SEGMENTS INFORMATION (Continued)
Beer Wines & Spirits (Eliminations)/ Total Group Consolidation
TShs ‘M TShs ‘M TShs ‘M TShs ‘M
Segment assets, liabilities and capitalexpenditure Segment cash flows
FOR THE YEAR ENDED 31 MARCH 2015
Group Company
Group Company
2015 2014 2015 2014 TShs ‘M TShs ‘M TShs ‘M TShs ‘M
6. REVENUE
7. EXPENSES BY NATURE
2015 2014 2015 2014 TShs ‘M TShs ‘M TShs ‘M TShs ‘M
56 57

THETASKSOF TBLTASK 6
TO VALUE HUMAN RIGHTS
Against Underage MarriageUnderage marriage is a common practice in parts of Tanzania, and is usually associated with Female Gentile Mutilation (FGM). Both of these practices are doing irreversible damage to thousands of young girls both in Tanzania and across the entire continent. TBL has invested just under TShs 8 million in the last three years to support the Graça Machel Trust in fighting this inhumanity in various African countries. Strong alliances have been formed with key partners such as FGM practitioners, traditional leaders and parents, who have all made commitments to end child-marriages and FGM. A record number of 634 girls have attended rescue camps.
Equal Opportunity EmployerWe maintain an equal opportunity employment policy by striving to ensure equal opportunities to all, regardless of their gender, marital status, race, ethnic origin, colour, nationality, religion, age and disability. We have programs in place to encourage female managers and equip them with the training and tools necessary for them to rise to a senior management position. We also have policies in place that ensure we utilise the skills of disabled employees and cater for them to do their jobs effectively by making reasonable adjustments where necessary.
58 59

NOTES TO THE FINANCIAL STATEMENTS
2015 First interim dividend 73,732 2,470 76,202 250 Second interim dividend 73,732 2,471 76,203 250 Total dividend paid 147,464 4,941 152,405 500
2014 First interim dividend 44,240 4,189 48,429 150 Second interim dividend 44,239 4,188 48,427 150 Third interim dividend 44,239 - 44,239 150 Total dividend paid 132,718 8,377 141,095 450
Dividend of TShs 500 per share amounting to TShs 147,464 million was approved by the board of directors of the Company and paid during the year.
FOR THE YEAR ENDED 31 MARCH 2015
Notes (continued)13. EARNINGS PER SHARE (Continued)
14. DIVIDENDS
(b) Diluted earnings per shareDiluted earnings per share is calculated by adjusting the weighted average number of ordinary shares outstanding to assume conver-sion of all dilutive potential ordinary shares. The Company has one category of dilutive potential ordinary shares which is the treasury shares. These are shares held by the Company’s Employees’ Share Ownership Scheme.
Group Net profit attributable to shareholders (TShs’000) 207,436,000 196,450,045Weighted average number of shares for diluted earnings per share (000’s) 294,928 294,928 Diluted earnings per share (TShs per share) 703.3 666.1
2015 2014
Non Controlling Dividend Company interest Group per share
TShs ‘M TShs ‘M TShs ‘M TShs ‘M
NOTES TO THE FINANCIAL STATEMENTS
Group
Net profit attributable to shareholders (TShs’000) 207,436,000 196,450,045
Outstanding shares in issue (000’s) [Note 22] 294,928 294,928
Less: Weighted average number of treasury shares (000’s) (5,899) (5,899)
Weighted average number of share in issue excluding
treasury shares (000’s) 289,029 289,029
Basic earnings per share (TShs per share) 717.7 679.7
Current income tax (Note 29)
- Current tax on profit for the year 84,981 84,300 73,561 75,621
- Adjustments in respect of prior years 1,595 (2,327) 1,666 (1,100)
Deferred income tax (Note 26)
- Current tax on profit for the year 7,651 4,969 8,011 4,682
- Adjustments in respect of prior years (1,852) 2,070 (2,192) 1,246
Income tax expense 92,376 89,012 81,046 80,449
The tax on the profit before tax differs from the theoretical amount that would arise using the basic tax rate as follows:
Profit before income tax 308,931 292,719 280,513 278,463
Tax calculated at a rate of 30% 92,679 87,816 84,154 83,539
Income not subject to tax (331) - (2,753) (4,667)
Expenses not deductible for tax purposes 285 1,036 171 1,014
Adjustment to tax in respect of prior periods (257) (257) (526) 146
Overprovision in the current deferred income tax - 417 - 417
Income tax expense 92,376 89,012 81,046 80,449
(a) Basic earnings per shareBasic earnings per share is calculated by dividing the profit attributable to shareholders by the weighted average number of ordi-
nary shares in issue during the year excluding ordinary shares purchased by the Company and held as treasury shares.
2015 2014
FOR THE YEAR ENDED 31 MARCH 2015
Notes (continued)
12. INCOME TAX EXPENSE
13. EARNINGS PER SHARE
Group Company
2015 2014 2015 2014 TShs ‘M TShs ‘M TShs ‘M TShs ‘M
60 61

NOTES TO THE FINANCIAL STATEMENTS
Year ended 31 March 2014 Opening net book value 47,165 228,988 26,465 46,315 53,757 402,690 Additions - - - - 89,571 89,571Disposals - (21) (61) - - (82)Transfers 3,040 84,929 2,159 20,372 (110,500) -Breakages and other losses - - - (6,496) - (6,496)Container write down - - - (2,569) - (2,569)Depreciation charge for the year (2,947) (21,429) (7,088) (6,537) - (38,001) Closing net book value 47,258 292,467 21,475 51,085 32,828 445,113
FOR THE YEAR ENDED 31 MARCH 2015
Notes (continued)15. PROPERTY, PLANT AND EQUIPMENT GROUP (Continued)
15. PROPERTY, PLANT AND EQUIPMENT COMPANY
Year ended 31 March 2015 Opening net book value 47,258 292,467 21,475 51,085 32,828 445,113Additions - - - - 78,675 78,675Disposals - (195) (30) - - (225)Transfers 14,790 51,814 17,006 4,480 (88,090) -Breakages and other losses - - - (4,387) - (4,387) Container write down - - - (5,291) - (5,291)Depreciation charge for the year (3,519) (25,481) (8,160) (6,240) - (43,400) Closing net book value 58,529 318,605 30,291 39,647 23,413 470,485
At 31 March 2015 Cost 84,783 483,756 80,957 80,361 23,413 753,270Accumulated depreciation (26,254) (165,151) (50,666) (40,714) - (282,785)
Net book value 58,529 318,605 30,291 39,647 23,413 470,485
Furniture Capital Land and Plant and equipment Work in Buildings machinery and vehicles Containers Progress Total
TShs ‘M TShs ‘M TShs ‘M TShs ‘M TShs ‘M TShs ‘M
The Company’s buildings, plant and machinery with a net book value of TShs 377,134 million have been secured against borrowings as set out in Note 25 to the financial statements. The capital work in progress amount mainly relates to the on-going capital projects for expansion of production facilities of the Company and its subsidiaries which are being undertaken in Arusha, Mwanza and Dar es Salaam plants.
The Group’s buildings, plant and machinery with net book value of TShs 339,725 million have been secured against borrowings as set out in Note 25 to the financial statements.
The capital work in progress amount mainly relates to the on-going capital projects for expansion of production facilities of the Company and its subsidiaries which are being undertaken in Arusha, Mwanza and Dar es Salaam plants.
At 1 April 2014 Cost 66,953 349,184 62,250 74,252 53,757 606,396 Accumulated depreciation (19,788) (120,196) (35,785) (27,937) - (203,706) Net book value 47,165 228,988 26,465 46,315 53,757 402,690
62 63
NOTES TO THE FINANCIAL STATEMENTS FOR THE YEAR ENDED 31 MARCH 2015
Notes (continued)15. PROPERTY, PLANT AND EQUIPMENTGROUP
Year ended 31 March 2015 Opening net book value 53,696 302,973 25,319 51,564 41,118 474,670Additions - - - - 85,382 85,382Disposals - (195) (30) - - (225)Transfers 16,530 61,229 18,638 5,213 (101,610) -Breakages and other losses - - - (4,391) - (4,391)Container write-down - - - (5,671) - (5,671)Depreciation charge for the year (3,806) (27,165) (9,234) (6,201) - (46,406) Closing net book value 66,420 336,842 34,693 40,514) 24,890 503,359 At 31 March 2015 Cost 94,288 500,226 89,246 82,811 24,890 791,461Accumulated depreciation (27,868) (163,384) (54,553) (42,297) - (288,102) Net book value 66,420 336,842 34,693 (40,514) 24,890 503,359
The Group’s buildings, plant and machinery with net book value of TShs 377,134 million have been secured against borrowings as set out in Note 25 to the financial statements. The capital work in progress amount mainly relates to the on-going capital projects for expansion of production facilities of the Company and its subsidiaries which are being undertaken in Arusha, Mwanza and Dar es Salaam plants.
Year ended 31 March 2014 Opening net book value 52,875 237,687 29,072 46,614 60,414 426,662 Additions - - - - 97,473 97,473Disposals - (34) (112) - - (146)Transfers 4,016 87,620 4,197 20,936 (116,769) -Breakages and other losses - - - (6,511) - (6,511)Container write-down - - - 2,931) - (2,931)Depreciation charge for the year (3,195) (22,300) (7,838) (6,544) - (39,877) Closing net book value 53,696 302,973 25,319 51,564 41,118 474,670 At 31 March 2014 Cost 77,758 440,679 70,802 87,660 41,118 718,017 Accumulated depreciation (24,062) (137,706) (45,483) (36,096) - (243,347) Net book value 53,696 302,973 25,319 51,564 41,118 474,670
At 1 April 2014 Cost 73,742 353,562 67,105 76,166 60,414 630,989 Accumulated depreciation (20,867) (115,875) (38,033) (29,552) - (204,327) Net book value 52,875 237,687 29,072 46,614 60,414 426,662
Furniture Capital Land and Plant and equipment Work in Buildings machinery and vehicles Containers Progress Total
TShs ‘M TShs ‘M TShs ‘M TShs ‘M TShs ‘M TShs ‘M
62 63

NOTES TO THE FINANCIAL STATEMENTS
Cash flows beyond the third-year period are extrapolated using the estimated growth rates stated below. The growth rate does not exceed the long-term average growth rate for the clear beer business in which the CGU operates.
Key assumptions used for fair value in use calculations are as follows;
Rate (% per annum)
2015 2014Compound annual growth rate (CAGR) 14.54 14.54Long-term growth Rate 7.80 7.80Discount rate (WACC) 7.80 7.80
Notes (continued)16. INTANGIBLE ASSETS (Continued)
FOR THE YEAR ENDED 31 MARCH 2015
Key
CAGR Rate growth of revenue in the initial five years
Long-term growth Rate Weighted average growth rate used to estimate cash flows beyond the five- years.
Discount rate (WACC) Post-tax working cost of capital rate (WACC rate) applied to cash flow projections.
The recoverable amount calculated based on value in use exceeded carrying value by TShs 3,426,094 million. A compound annual
growth rate (CAGR) of (29)%, long term growth rate to 100% or a rise in discount rate to 57% would, all changes taken in isolation,
result in the recoverable amount being equal to the carrying amount.
(a) Investment in subsidiaries
Kibo Breweries Ltd - - 42,414 42,414
Darbrew Limited - - 8,834 8,834
Tanzania Distilleries Ltd - - 2,606 2,606
- - 53,854 53,854
(b) Other equity investments
Mountainside Farms Limited 88 88 88 88
88 88 53,942 53,942
Group Company
17. INVESTMENTS
2015 2014 2015 2014 TShs ‘M TShs ‘M TShs ‘M TShs ‘M
Other investments relate to a 4% shareholding in Mountainside Farms Limited. The unquoted investment is stated at cost as its fair
value cannot be reliably measured. Set out below are the group’s principal subsidiaries at 31 March 2015. Unless otherwise stated,
the subsidiaries as listed below have share capital consisting solely of ordinary shares, which are held directly by the group and the
proportion of ownership interests held equals to the voting rights held by group. The country of incorporation is also their principal
place of business.
Name of undertaking Nature of business Country of % of ownership % of ownership incorporation held by NCI held by group
Tanzania Distilleries Ltd Manufacturer of spirituous liquor Tanzania
Darbrew Ltd Manufacturer of Opaque beer Tanzania
Mountainside Farms Ltd Crop farming Tanzania
Kibo Breweries Ltd Rental of assets to related parties Tanzania
2015 2014 2015 2014
35% 35% 65% 65%
40% 40% 60% 60%
- - 4% 4%
- - 100% 100%
NOTES TO THE FINANCIAL STATEMENTS
The Company’s buildings, plant and machinery with a net book value of TShss 339,725 million have been secured against borrowings as set out in Note 25 to the financial statements. The capital work in progress amount mainly relates to the on-going capital projects for expansion of production facilities of the Company and its subsidiaries which are being undertaken in Arusha, Mwanza and Dar es Salaam plants.
Year ended 31 March 2015 Opening net book value 44,867 838 3,276 48,981 805Additions - 709 - 709 783Amortisation charge - (604) - (604) (646)Closing net book value 44,867 943 3,276 49,086 942At 31 March 2015 Cost 47,576 4,799 3,276 55,651 4,831Accumulated amortisation (2,709) (3,856) - (6,565) (3,889)Net book value 44,867 943 3,276 49,086 942
Year ended 31 March 2014 Opening net book value 44,867 1,200 3,276 49,343 1,158Additions - 147 - 147 147Amortisation charge - (509) - (509) (500)Closing net book value 44,867 838 3,276 48,981 805At 31 March 2014 Cost 47,576 4,090 3,276 54,942 4,048Accumulated amortisation (2,709) (3,252) - (5,961) (3,243)Net book value 44,867 838 3,276 48,981 805
FOR THE YEAR ENDED 31 MARCH 2015
Group Company
16. INTANGIBLE ASSETS
Notes (continued)15. PROPERTY, PLANT AND EQUIPMENT GROUP (Continued)
Goodwill Software Brand Total Software TShs ‘M TShs ‘M TShs ‘M TShs ‘M TShs ‘M
The carrying amounts of the intangible assets approximate to their recoverable amounts. The carrying amount of goodwill is TShs 44,867 million (2014: TShs 44,867 million) out of which TShs 39,630 million arose from the acquisition of Kibo Breweries Limited in 2002 and TShs 5,237 million from acquisition of Darbrew Limited in March 2013. No impairment charge arose during the year (2014: Nil).
The Group has a brand with carrying value of TShs 3,276 million which arose from the acquisition of 60% shareholding in Darbrew
Limited in March 2013. The value of the brand was determined by discounting the expected future cash in-flows relating to the sales activities of the brand. No impairment charge arose during the year in relation to the brand.
The recoverable amount of all CGUs has been determined based on value-in-use calculations. These calculations use post-tax cash flow projections based on financial budgets approved by management covering a three-year period.
At 31 March 2014 Cost 69,993 433,623 64,145 85,559 32,828 686,148Accumulated depreciation (22,735) (141,156) (42,670) (34,474) - (241,035)
Net book value 47,258 292,467 21,475 51,085 32,828 445,113
At 1 April 2014 Cost 47,576 3,943 3,276 54,795 3,901Accumulated amortisation (2,709) (2,743) - (5,452) (2,743)Net book Value 44,867 1,200 3,276 49,343 1,158
Furniture Capital Land and Plant and equipment Work in Buildings machinery and vehicles Containers Progress Total
TShs ‘M TShs ‘M TShs ‘M TShs ‘M TShs ‘M TShs ‘M
64 65

NOTES TO THE FINANCIAL STATEMENTS
Assets Embedded derivatives 599 306 599 306Forward foreign exchange contracts - cashflow hedges 214 1,798 180 1,532Total 813 2,104 779 1,838
Liabilities Forward foreign exchange contracts - cashflow hedges 3,760 311 3,419 293
Current Total current assets 93,073 59,178 4,020 4,466Current liabilities (81,274) (59,288) (8,014) (4,678)Total current net assets 11,799 (110) (3,994) (212)Non-Current Assets 23,215 22,217 7,643 5,468Liabilities (2,454) (1,987) (1,555) (2,419)Total non-current net assets 20,761 20,230 6,088 3,049Net assets 32,560 20,120 2,094 2,837
Summarised statements of profit or loss and other comprehensive income
Revenue 210,959 154,185 10,395 7,071Profit before income tax 38,434 29,419 (934) 314Income tax (expense)/Income (11,458) (8,913) 130 (103)Profit (loss) after tax 26,976 20,506 (804) 211
Other comprehensive income Cash flow hedgesFair value gain transferred to receivables - 34 - -Fair value gain transferred to payables 420 79 - -Total comprehensive income for the year 26,556 20,619 - -Allocated to non-controlling interest 9,442 7,177 (281) 211
FOR THE YEAR ENDED 31 MARCH 2015
Tanzania Distilleries Limited Darbrew Limited
2015 2014 2015 2014 TShs ‘M TShs ‘M TShs ‘M TShs ‘M
2015 2014 2015 2014 TShs ‘M TShs ‘M TShs ‘M TShs ‘M
Notes (continued)17. INVESTMENTS (Continued)
Set out below are the summarised financial information for each of the two subsidiaries, Tanzania Distilleries Limited and DarBrew Limited.
Summarised statement of financial position
Summarised statement of cash flowsNet cash used in operations 16,492 22,733 2,844 193Net cash used in Investing activities (3,236) (3,192) (3,124) (4,096)Net cash generated from financing activities (14,116) (23,935) 50 2,964
Net increase in cash and cash equivalents (860) (4,394) (230) (939)Cash and cash equivalents at start of the year (3,516) 1,590 (712) 227Exchange loss on cash and cash equivalents (746) (712) - -Cash and cash equivalents at end of the year (5,122) (3,516) (942) (712)
18. DERIVATIVE FINANCIAL INSTRUMENTS
Group Company
TASK 7to cREATE WELLNESS
Road Safety WeekAs a manufacturer of alcoholic beverages, we understand how imperative it is for TBL to be at the forefront in providing education and information on the responsible consumption of its products (to consumers of a legal drinking age). Excessive consumption of alcohol is dangerous to one’s health and safety, and the safety of other people. Over the last seven years TBL has invested a total of TShs 350 million towards improving the safety of our roads. In 2008 we ran our first ‘Don’t Drink and Drive’ campaign, in partnership with the Tanzania Police Force (Traffic Division). The campaign now takes place each year during road safety week, it includes a donation of “Don’t Drink and Drive” branded clothing and bumper stickers. In 2013, we expanded on the campaign in bid of reducing incidents of road accidents involving long distance drivers of buses and trucks. We sponsor free basic medical examinations for the drivers, as some of these accidents are caused by the poor health condition of drivers who do not have the financial means or time
to attend regular medical checkups. Since the start of the campaign a total number of 1,892 drivers and conductors have been tested. In addition, to supplement the government’s efforts in making roads safer, we have also introduced the ‘Respect The Road’ campaign. The campaign includes training for TBL drivers, crew members, sales force and contractors that operate the company fleet of motor vehicles. The 5-week course covers topics including vehicle inspection, pedestrian awareness, driver attitude and keys to safe driving.
Health & SafetyCurrently all TBL employees at all plants are registered under a medical scheme. This grants employees and their dependents access to the best health care facilities in the country, 24 hours a day. We also offer an on site dispensaries run by certified doctors. Joining the fight against HIV/AIDS, we offer free testing and counseling each year, on world AIDS day, to the communities surrounding each of our plants.
THE TASKSOF TBL
66 67

NOTES TO THE FINANCIAL STATEMENTS FOR THE YEAR ENDED 31 MARCH 2015
Trade receivables 100,265 70,696 54,516 55,933Less: Provision for impairment losses (2,065) (1,828) (1,415) (1,338) Trade receivables-net 98,200 68,868 53,101 54,595Advances to suppliers 1,950 6,173 1,960 6,109Staff advances and loans 2,465 1,724 1,833 1,374Due from related parties (Note 34 (v)) 6,576 3,841 75,456 43,432Other receivables 39,740 6,848 6,795 1,049Prepayments 8,098 9,531 5,943 8,246 157,029 96,985 145,088 114,805
Movements on the provision for impairment of trade receivables are as follows: At start of year (1,828) (1,511) (1,338) (1,082)Provision in the year (295) (545) (134) (482)Utilised during the year 58 228 57 226
At end of year (2,065) (1,828) (1,415) (1,338)
The carrying amounts of the above receivables approximate their fair values.
Notes (continued)
Group Company
2015 2014 2015 2014 TShs ‘M TShs ‘M TShs ‘M TShs ‘M
2015 2014 2015 2014 TShs ‘M TShs ‘M TShs ‘M TShs ‘M
2015 2014 2015 2014 TShs ‘M TShs ‘M TShs ‘M TShs ‘M
20. TRADE AND OTHER RECEIVABLES
Group Company
Group Company
Cash in hand 202 172 86 76Cash at bank 35,565 10,918 24,181 6,845
Total cash and bank balances 35,767 11,090 24,267 6,921
For the purpose of the statement of cash flows, cash and cash equivalents comprise the following:
Cash and bank balances 35,767 11,090 24,267 6,921Bank overdrafts (Note 25) (55,428) (51,862) (39,321) (44,177)
Net cash and cash equivalents (19,661) (40,772) (15,054) (37,256)
21. BANK AND CASH BALANCES
NOTES TO THE FINANCIAL STATEMENTS FOR THE YEAR ENDED 31 MARCH 2015
Cash flow hedges
The Group and Company hedges anticipated cash flows mainly from purchase of raw materials, settling obligations dominated in foreign currency and capital expenditure.
The hedge accounting reserve represents the effective portion of changes in the fair value of the cash hedge (derivative); the ineffective portion is recognised immediately in profit or loss. All hedges during the year were effective. All cash flow hedge activities are being facilitated centrally by the SABMiller Group Treasury function since the second half of financial year ended 31 March 2013, which has resulted in significant synergies and savings for TBL Group.
The notional principal amount of outstanding forward foreign exchange contracts of the Group and Company as at 31 March 2015 was TShs 63,555 million (2014: TShs 27,542 million) and TShs 59,979 million (2014: TShs 22,196 million) respectively. Cash flow hedges (continued)
The hedged highly probable forecast transactions denominated
in foreign currency are expected to occur at various dates during the next 12 months. Gains and losses recognised in the hedging reserve in equity on forward foreign exchange contracts as of 31 March 2015 are recognised in the profit or loss in the period or periods during which the hedged forecast transaction affects the profit or loss. This is generally within 12 months of the end of the reporting period at which time the respective gain and losses are transferred to property plant and equipment, receivables, payables or to the profit or loss as appropriate.
Embedded derivatives
The embedded derivatives arise from the contracts for supply of raw materials. These are forward foreign exchange contracts that are embedded in the suppliers’ contracts. The notional principal amounts of the outstanding forward foreign exchange contracts at 31 March were TShs 187million (2014: TShs 341 million). The fair value of embedded derivatives represents the present value of the cash flows which would have been occurred if the rights and obligations arising from those derivatives were closed out in an orderly market place transaction at year end.
Notes (continued)18. DERIVATIVE FINANCIAL INSTRUMENTS (Continued)
Raw materials 42,523 55,129 30,086 41,430Consumable stores and spares 46,053 13,480 44,230 13,350Work in progress 11,729 34,158 10,577 14,185Finished goods 25,501 53,562 10,247 51,988 125,806 156,329 95,140 120,953Less: Provision for impairment losses (5,497) (11,134) (4,764) (10,068) 120,309 145,195 90,376 110,885
Group Company
2015 2014 2015 2014 TShs ‘M TShs ‘M TShs ‘M TShs ‘M
19. INVENTORIES
The cost of inventories recognised as an expense and included in ‘cost of sales’ in the Group’s profit or loss amounted to TShs 205,375 million (2014: TShs 182,100 million). Similarly, this amounts to TShs 142,827 million (2014: TShs 135,637 million) in the Company’s statement of profit or loss and other comprehensive income.
Inventories of engineering spares amounting to TShs 45,838 million (2015: TShs 45,085 million) are carried at net realisable
value, this being lower than cost. During 2015, TShs 5,497 million (2014: TShs 9,288 million) was charged to the Group’s statement of profit or loss and other comprehensive income for damaged, obsolete and lost inventories. Similarly, TShs 4,765 million (2014: TShs 8,224 million) were charged to the Company’s statement of profit or loss and other comprehensive income for damages, obsolete and lost inventories.
There is no inventory pledged as security for liabilities (2014: Nil).
68 69

NOTES TO THE FINANCIAL STATEMENTS FOR THE YEAR ENDED 31 MARCH 2015
Notes (continued)23. OTHER RESERVES
Hedging Treasury reserve shares Group
TShs ‘M TShs ‘M TShs ‘M
Year ended 31 March 2015 At start of the year 1,312 (12,200) (10,888)Fair value loss during the year (4,839) - (4,839)Deferred tax on fair value loss 1,047 - 1,047 At end of the year (2,480) (12,200) (14,680)
Year ended 31 March 2014 At start of the year (995) (12,200) (13,195)Fair value gain during the year 2,307 - 2,307 At end of the year 1,312 (12,200) (10,888)
Year ended 31 March 2015 At start of the year 1,239 (12,200) (10,961)Fair value loss during the year (4,478) - (4,478)Deferred tax on fair value loss 996 - 996 At end of the year (2,243) (12,200) (14,443)
Year ended 31 March 2014 At start of the year (916) (12,200) (13,116)Fair value gain during the year 2,155 - 2,155 At end of the year 1,239 (12,200) (10,961)
Treasury sharesIn November 2011, the Company advanced a loan of TShs 12,209 million to the Trust for Tanzania Breweries Employees’ Share Ownership Scheme (“the Trust”). The aim of the loan is to enable the Trust to acquire shares of the Company previously owned by East African Breweries. The Trust purchased 5,898,596 shares, representing 2% of the ordinary fully paid up shares of the Company. The Company expects the purchased shares to be offered as share options to the employees in the future.
The Trust has been consolidated in the financial statements on the basis of significant control and shares acquired have been accounted for as treasury shares.
Hedging reserveRefer to the details on the hedge instruments under note 18.
Hedging Treasury reserve shares Total
TShs ‘M TShs ‘M TShs ‘M
GROUP
COMPANY
NOTES TO THE FINANCIAL STATEMENTS
Authorised, issued and fully paid:294,928,463 ordinary shares of TShs 100 each 29,493 29,493 29,493 29,493 Share premium Share premium at the start and end of year 45,346 45,346 45,346 45,346
There were no movements in the share capital and share premium of the Company during the year. The Company has only one class of ordinary shares which carries no right to fixed income. The ownership structure is as set out in Note 22.2 below.
FOR THE YEAR ENDED 31 MARCH 2015
Group Company
2015 2014 2015 2014 TShs ‘M TShs ‘M TShs ‘M TShs ‘M
Notes (continued)22. SHARE CAPITAL
22.1 Ordinary share capital
Resident shareholders: Ingawa Industries Limited 20,080,797 19,149,165 6.81 6.49The Government of the United Republic of Tanzania 11,797,139 11,797,139 4.00 4.00 Parastatal Pension Fund 14,402,720 14,402,720 4.88 4.88National Health Insurance Fund 4,854,370 1,191,836 1.65 0.40Unit Trust of Tanzania 4,432,620 9,043,337 1.50 3.07Public Service Pension Fund 2,820,581 4,820,581 0.96 1.63National Social Security Fund 1,240,624 1,777,536 0.42 0.60General Public 51,819,923 49,069,010 17.57 16.65
Total resident 111,448,774 111,251,324 37.79 37.72 Non-resident shareholders SABMiller Africa BV 169,708,768 169,708,768 57.54 57.54 Others - East African shareholders 13,770,921 13,968,371 4.67 4.74
Total non-resident 183,479,689 183,677,139 62.21 62.28
Total ordinary shares in issue 294,928,463 294,928,463 100.00 100.00
Ordinary Ordinary % % Shares Shares holding holding
2015 2014 2015 2014
22.2 Ownership structure
70 71

NOTES TO THE FINANCIAL STATEMENTS FOR THE YEAR ENDED 31 MARCH 2015
Overdrafts are made up as follows:
National Microfinance Bank Plc 178 12,774 178 12,061National Bank of Commerce Limited 39,754 9,592 38,800 9,592Citibank Tanzania Limited - 80 - 80CRDB Bank Plc - 3,104 - 3,104Standard Chartered Bank Tanzania Limited 15,495 26,312 343 19,340
55,427 51,862 39,321 44,177
The overdraft facilities are annual facilities subject to review between April 2015 and March 2016.
(iii) Short term Loans
Current portion of NBC term loan 750 750 - - 750 750 - -
The carrying amount of the borrowings approximate to their fair values.
Group Company
Group Company
2015 2014 2015 2014 TShs ‘M TShs ‘M TShs ‘M TShs ‘M
2015 2014 2015 2014 TShs ‘M TShs ‘M TShs ‘M TShs ‘M
Notes (continued)25. BORROWINGS (Continued)
(ii) Bank overdrafts
NOTES TO THE FINANCIAL STATEMENTS
35% of equity of Tanzania Distilleries Limited 11,418 7,042 40% of equity of Darbrew Limited 2,239 2,603
13,657 9,645
35% interest in the profit for the year of Tanzania Distilleries Limited 9,441 7,178 40% interest in the profit for the year of Dar Brew Limited (322) 79 Dividends paid to non-controlling interest (note 14) (4,941) (8,377)35% interest on loss on cash flow hedge (note 23) (166) 82 4,012 (1,038)
FOR THE YEAR ENDED 31 MARCH 2015
2015 2014
TShs ‘M TShs ‘M
24. NON-CONTROLLING INTERESTS
Non-current
NBC Limited Term Loan 1,500 2,250 - - 1,500 2,250 - -Current Bank overdrafts 55,427 51,862 39,321 44,177Short term bank loans 750 2,625 - 1,875Interest payable on borrowings 453 155 453 155 56,630 54,642 39,774 46,207
Total borrowings 58,130 56,892 39,774 46,207
Group Company
2015 2014 2015 2014 TShs ‘M TShs ‘M TShs ‘M TShs ‘M
25. BORROWINGS
(i) National Bank of Commerce (NBC) Term LoanThis is a two years loan issued to the DarBrew Limited, a subsidiary of the Company to facilitate Polyethylene terephthalate (PET) plastic bottles project line. The facility has a limit of TShs 3 billion. It is repayable on a monthly basis and carries a floating interest rate which is an aggregate of benchmark and margin as
determined by the bank. The margin and benchmark amount are 7% p.a and 20% p.a respectively. The effective interest rate during the year was 13%. The non-current portion of the loan amount to TShs 1,500 and current portion of the loan amounting to TShs 750 million is included in the short term bank loans. The loan is guaranteed by the parent (Note 31).
Notes (continued)
72 73

NOTES TO THE FINANCIAL STATEMENTS FOR THE YEAR ENDED 31 MARCH 2015
At 1 April 2014 51,255 (2,801) - 48,454 Charged to profit or loss 6,028 (229) - 5,799Charged to equity - - (1,075) (1,075) At 31 March 2015 57,283 (3,030) (1,075) 53,178 At 1 April 2013 44,079 (3,638) - 41,415 Charged to profit or loss 6,202 837 7,039 At 31 March 2014 50,281 (2,801) - 48,454
COMPANY
At 1 April 2014 50,350 (5,040) - 45,310Charged to profit or loss 6,048 (229 ) - 5,819Charged to equity - - (996) (996)At 31 March 2015 56,398 (5,269) (996) 50,133
At 1 April 2013 44,148 (4,766) - 39,382Charged to profit or loss 6,202 (274) - 5,928
At 31 March 2014 50,350 (5,040) - 45,310
Property, plant and equipment (PPE)
Other temporary differences
Hedge reserve
Total
Notes (continued)26. DEFERRED INCOME TAX LIABILITIES
TShs ‘M TShs ‘M TShs ‘M TShs ‘M
Deferred income taxes are calculated on temporary differences under the liability method using a principal tax rate of 30%. The movement on the deferred income tax account is as follows:
GROUP
Deferred tax liabilities/(assets)
All deferred tax asset is expected to be recovered after more than 12 months.
Capital deductions in dispute relates to tax deduction that was claimed on wear and tear for plant and machinery expenditure incurred in 2001 instead of 100% tax deductions as suggested by Tanzania Revenue Authority.
TASK 8to ENCOURAGE RESPONSIBLE CONSUMPTION
Retail Alcohol TrainingAll leading alcohol manufacturers, including SAB and TBL are committed to reducing the harmful consumption of alcohol:
“We want a sociable world where our beers are developed, marketed, sold, and consumed with high regard for individual and community wellbeing.”
At TBL it is our obligation to ensure our alcoholic beverages are enjoyed responsibly. Each year, we run various ‘Responsible Drinking’ training sessions. This training is mandatory for all our employees, marketing agencies, retailers and distributors. The Retail Alcohol Training program for our retail outlets includes training for owners and staff where they learn about Alcohol & the Law, Alcohol & the Body, Alcohol & Health, Alcohol & Pregnancy, Underage Drinking, Excessive Drinking, Drinking & Driving and Responsible Promotions. Over 2,100 retail outlets countrywide have completed Retail Alcohol Training since June
2013. In the Nipashe newspaper, we also run a weekly newspaper column on Responsible Drinking in an effort to improve the health and social welfare for individuals, families and communities.Self RegulationTBL has several programmes and policies in place to help us self-regulate the selling and consumption of our brands responsibly. For instance, the SABMiller Policy on Commercial Communication (POCC) sets the standard for the marketing and communication of all brands, including all TBL commercial communication. An internal committee called the Sales and Marketing Compliance Committee (SMCC), governed by an independent chairman, is responsible to ensure that all commercial communication complies with the policy. It is also mandatory for all TBL managerial commercial staff and agencies attend Alcohol Intelligence Quotient training workshops to give them an in-depth understanding on the responsible way to communicate the company’s corporate brand and beverages overall.
THE TASKSOF TBL
74 75

77
NOTES TO THE FINANCIAL STATEMENTSNOTES TO THE FINANCIAL STATEMENTS
At 31 March
Loans and receivables
Trade and other receivables (excluding advances to suppliers and prepayments) 137,185 100,450
Cash at hand and bank deposits 24,267 6,921
161,452 107,371
FOR THE YEAR ENDED 31 MARCH 2015
At 31 March
Loans and receivables
Trade and other receivables (excluding advances to suppliers and prepayments) 146,980 81,281
Cash at hand and bank deposits 35,767 11,090
182,747 92,371
Other financial liabilities at amortised costs
Borrowings 58,130 56,892
Trade and other payable (excluding statutory liabilities) 106,829 92,747
Provision for other liabilities and charges 739 829
165,698 150,468
2015 2014
TShs ‘M TShs ‘M
Notes (continued)30. FINANCIAL INSTRUMENTS BY CATEGORY
(b) Company
Approved and contracted for but not recorded 5,949 7,581 5,949 7,577
Approved but not contracted for 1,777 21,156 2,326 21,118
7,726 28,737 8,275 28,695
Other financial liabilities at amortised costs
Borrowings 39,774 46,207
Trade and other payable (excluding statutory liabilities) 87,699 81,166
Provision for other liabilities and charges 739 829
128,212 128,202
31. COMMITMENTS
Capital commitments
As at 31 March 2015, the Group and Company had capital expenditure commitments as follows;
Group Company
2015 2014 2015 2014 TShs ‘M TShs ‘M TShs ‘M TShs ‘M
(a) Group
NOTES TO THE FINANCIAL STATEMENTS
Trade payables 66,013 51,934 27,120 44,712Dividends payable 3,166 2,470 3,054 2,470VAT payable 15,608 8,210 11,615 7,665Excise duty payable 22,002 15,099 14,367 11,050Payable to related parties (Note 34 (v)) 16,785 15,991 42,272 18,114Container liability 4,666 3,715 4,558 3,672Other payables and accrued expenses 15,748 20,430 10,244 13,743Capex accruals 451 - 451 - 144,439 117,849 113,681 101,426
The carrying amounts of the above payables and accrued expenses approximate to their fair values.
At start of the year 829 447 829 447Increase during the year - 382 - 382Provision utilized during the year (90) - (90) -
At end of the year 739 829 739 829
FOR THE YEAR ENDED 31 MARCH 2015
Group Company
Group Company
Group Company
2015 2014 2015 2014 TShs ‘M TShs ‘M TShs ‘M TShs ‘M
2015 2014 2015 2014 TShs ‘M TShs ‘M TShs ‘M TShs ‘M
2015 2014 2015 2014 TShs ‘M TShs ‘M TShs ‘M TShs ‘M
Notes (continued)27. PROVISIONS FOR OTHER LIABILITIES AND CHARGES
28. TRADE AND OTHER PAYABLES
As at 31 March 2015, there was a number of pending legal cases where the Company or its subsidiaries were defendants. The directors have considered it probable that the outcome of these cases will be unfavourable to the Group and could result into an estimated loss of TShs 739 million (2014: TShs 829 million).
According to the nature of such disputes the timing of settlement of these cases is uncertain. Contingent liabilities relating to litigations have been disclosed in note 32.
At start of the year 2,175 5,772 6,973 6,377
Current income tax charge for the year (Note12) 86,576 81,973 75,227 74,521
Tax paid during the year (95,342) (85,570) (85,859) (73,925)
At end of the year (6,591) 2,175 (3,659) 6,973
29. CURRENT INCOME TAX (ASSETS)/LIABILITIES
76 77

79
NOTES TO THE FINANCIAL STATEMENTS FOR THE YEAR ENDED 31 MARCH 2015
Notes (continued)
33. CASH FLOW INFORMATION
(i) Cash generated from operations
Interest payable at 1 April (155) (983) (155) (983)Interest expense (Note 11) (6,084) (4,290) (4,768) (4,236)Interest payable as at 31 March (Note 25) 453 155 453 155 (5,786) (5,118) (4,470) (5,064)
(iii) Income tax paid
Income tax payable at 1 April (2,175) (5,772) (6,973) (6,377)Current income tax expense (Note 12) (86,576) (81,973) (75,227) (74,521)Income tax (recoverable)/payable as at 31March (Note 29) (6,591) 2,175 (3,659) 6,973 (95,342) (85,570) (85,859) (73,925)
(iv) Interest received
Interest receivable at 1 April 103 337 103 337 Interest income (Note 11) 209 2,684 6,924 7,648 Interest receivable as at 31 March - (103) - (103) 312 2,918 7,027 7,882
Profit before income tax 308,931 292,719 280,513 278,463Adjustedfor: Interest expense (Note 11) 6,084 4,290 4,768 4,236Interest income (Note 11) (209) (2,684) (6,924) (7,648)Dividend income (Note 9) - (9,176) (15,558)Depreciation, container write- downamortisation and breakages 57,071 49,817 53,724 47,566Foreign exchange loss (Note 11) 3,533 3,469 2,787 2,989Fair value loss on derivatives (Note 10) (293) 438 (293) 438Loss/(gain) on disposal of property, plant andequipment (Note 9) 103 (65) 121 (33) 375,220 347,984 325,520 310,453Changesinworkingcapital Inventories 24,887 (18,747) 20,509 (8,563)Trade and other receivables (59,280) (10,707) (29,750) (20,348)Trade and other payable 24,485 (5,916) 10,494 (5,951) Cash generated from operations 365,312 312,614 326,773 275,591
Group Company
2015 2014 2015 2014 TShs ‘M TShs ‘M TShs ‘M TShs ‘M
(ii) Interest paid
NOTES TO THE FINANCIAL STATEMENTS FOR THE YEAR ENDED 31 MARCH 2015
Notes (continued)31. COMMITMENTS (Continued)
Not later than 1 year 9,309 6,773 6,972 4,942
The future aggregate minimum lease payments under non-cancellable operating lease are as follows:
GuaranteesAs at 31 March 2015, the Company had provided financial guarantees totalling TShs 3,133 million (2014: 3,575 million), of which TShs 2.3 billion was provided to NBC Bank for loans granted to Darbrew Ltd, a subsidiary of the Company and the remaining for loans issued by CRDB Bank Plc to staff of the Company.
Operating lease commitments – where the Group andCompany is the lessee
The group leases various houses for staffs, offices and motor
vehicles under non cancellable operating lease agreements. The
lease terms are between 1 to 3 years, and the majority of lease
agreements are renewable at the end of the lease period at mar-
ket rate.
32. CONTINGENT LIABILITIESAs at 31 March 2015, the Company was a defendant in several lawsuits. While liability in these lawsuits is not admitted, if defence against the actions is unsuccessful, then claims in these lawsuits could amount to TShs 739 million (2014: TShs 829 million). Similarly for the Company’s subsidiary, Tanzania Distilleries Limited (TDL), the amount claimed in such lawsuits could amount to TShs 409 million (2014: TShs 400 million).
On 21 May 2010, the Fair Competition Commission (FCC) issued a decision upholding a complaint against the Company and imposed a fine of 5% of the Company’s annual turnover for the year ended 31 March 2010. The Company lodged a notice of appeal against this ruling on 27 May 2010. The Fair Competition Tribunal delivered a judgment in favour of TBL on 6th December, 2012. It allowed TBL appeal and quashed and set aside the whole of the FCC decision. The FCC is aggrieved with the decision and lodged an application for revision at the Court of Appeal. The hearing of the FCC’s revision at the Court of Appeal was last called on 10th September, 2013 and it was adjourned due to illness of the FCC’s Lawyer. The hearing will now be on notice.
Tanzania Revenue Authority issued adjusted assessments for 2011 and 2012 years of income on 29 September 2014. The assess-ment resulted into an additional tax liability of TShs 44 billion as a result of various proposed transfer pricing adjustments including treatment of profit bonus, management services, royalties and intercompany purchases. The total tax liability was computed to TShs 44 billion. The Company has objected to the assessment and paid TShs 5 billion to Tanzania Revenue Authority. Amount is included in the income tax recoverable balance.
Based on legal advice, the directors do not expect the outcome of the actions to have material effect on the Company and Group’s financial performance.
Group Company
2015 2014 2015 2014 TShs ‘M TShs ‘M TShs ‘M TShs ‘M
78 79

TASK 9To Invest In Our Country’s Culture& Sports Through Sponsorship
TBL recognizes the invaluable contribution sports & culture make towards uniting Tanzania, shaping it’s identity and placing it on a global map. In light of this we are consistently committed to supporting these industries in every way possible:
Kilimanjaro MarathonThe Kilimanjaro Marathon is the biggest sporting event in Tanzania, Kilimanjaro Premium Lager (TBL) is it’s primary sponsor. When we first began sponsoring the event it was relatively small, now thousands of runners and spectators fill the small town of Moshi each year. The event makes a significant contribution to the economy; tourism, hospitality
and commercial enterprises all benefit greatly from the influx of people. To date, Tanzania Breweries has invested more than TShs 4 billion in sponsoring the marathon, and it is our commitment to continue supporting the only annual big event currently happening in Moshi.
Taifa StarsKilimanjaro Premium Lager is also the sponsor of Tanzania’s national football team, the Taifa Stars. Through this sponsorship, we are able to empower one of Tanzania’s most loved sport teams and provide all its fans with more opportunities to interact with their team.
THE TASKSOF TBL
THETASKSOF TBL
Simba and YangaSimba and Yanga football clubs, sponsored by Kilimanjaro Premium Lager since 2008, are two of the Country’s biggest and most followed football teams. We have empowered the teams through our sponsorship with donations and exposure. In addition, we have run several campaigns to allow the public a more active role in supporting their teams.
Balimi Boat RaceBalimi Extra Lager is one of our brands that is exclusively enjoyed by the people in the Lake Victoria region. To preserve the tribal cultures of the people, Balimi supports traditional sports such as boat races in Lake Victoria and traditional dancers.
Kilimanjaro Tanzania Music AwardsThe Kilimanjaro Tanzanian Music awards, also sponsored by Kilimanjaro Premium Lager, provides a platform for local music artists to showcase their talents. Since it was established in 2002, KTMA has appreciated, rewarded and recognized both upcoming and famous musicians that have been instrumental in creating an identity of Tanzanian music and put it on the global map beyond our borders. We continue to be committed to nurture local musicians’ talents and their important role in society and community.
80 81

NOTES TO THE FINANCIAL STATEMENTS
At start of year (4,875) (57,725) (1,875) (57,725)Additions (Note 25 (ii)) - (3,000) - -At end of year 2,250 4,875 - 1,875 Cash utilised in repayment of bank borrowings (2,625) (55,850) (1,875) (55,850)
34. RELATED PARTY TRANSACTIONS AND BALANCES (i) Sale of goods and services
Sale of goodsFellow subsidiaries 4,374 4,610 4,374 4,610
The Company exports beer to Nile Breweries Limited, Crown Beverage Limited and Zambia Breweries Limited, all subsidiaries of SABMiller Plc.
FOR THE YEAR ENDED 31 MARCH 2015
Notes (continued)
33. CASH FLOW INFORMATION (Continued)
(v) Purchase of property, plant and equipment Group Company
Capex accrual at 1 April (Note 28) - (4,377) - (2,327)Additions during the year (Note 15) (85,382) (97,473) (78,675) (89,571)Capex accrual at 31 March (Note 28) 451 - 451 -Cash utilised in purchase of property, plantand equipment (84,931) (101,850) (78,224) (91,898) (vi) Dividends paid By the Company Dividends payable at 1 April (2,470) (3,437) (2,470) (3,437)Dividend expense (Note 14) (147,464) (132,718) (147,464) (132,718)Dividends payable at 31 March (Note 28) 3,166 2,470 3,054 2,470 (146,768) (133,685) (146,880) (133,685)By subsidiaries Non-controlling interest’s share of dividends paid(Note 14) (4,941) (8,377) - - (151,709) (142,062) (146,880) (133,685)
(vii) Repayment of bank borrowingsThe table below shows the movement of borrowings excluding overdraft and interest payable
2015 2014 2015 2014 TShs ‘M TShs ‘M TShs ‘M TShs ‘M
NOTES TO THE FINANCIAL STATEMENTS
The Company provides management services to its subsidiaries, Tanzania Distilleries Limited and Darbrew Limited.
(ii) Purchase of goods and services
Purchase of goods Subsidiary - - - 443Fellow subsidiaries 58,332 50,528 56,176 48,866
58,332 50,528 56,176 49,309
83
Notes (continued)
34. RELATED PARTY TRANSACTIONS AND BALANCES (Continued)
(i) Sale of goods and services (continued)
FOR THE YEAR ENDED 31 MARCH 2015
Sale of services Subsidiary (Note 9) - - 3,499 3,722
Purchase of servicesSubsidiary - - 226 251Fellow subsidiaries 51,581 44,732 51,581 44,732 51,581 44,732 51,807 44,983
The Company leases certain plant and machinery, motor vehicles and furniture from its subsidiary, Kibo Breweries Limited.
Other related parties include Bevman Services A.G, a subsidiary of SABMiller Plc, the Group’s management company, and SABMiller International BV. The Company produces and distributes SABMiller International BV brands under license and pays royalty fees at a percentage of sales of the brands. The Group pays profit bonus to SABMiller International BV.
Group Company
2015 2014 2015 2014 TShs ‘M TShs ‘M TShs ‘M TShs ‘M
The Company purchases goods from SABEX and Brewex (Pty) Ltd, both companies are divisions of SABMiller Africa & Asia (Pty) Limited. SABEX and Brewex are responsible for procuring and selling goods from South Africa to the Group’s Africa region. MUBEX, a subsidiary of SABMiller Holdings Ltd, procures and sells goods from various locations to the Group’s Africa region.
Tanzania Distilleries Limited, as subsidiary of the Company supplies raw spirits to Tanzania Breweries Limited.
82 83

NOTES TO THE FINANCIAL STATEMENTS
Key management personnel are those persons having authority and responsibility for planning, directing and controlling the activities of the entity, directly or indirectly, including any director (whether executive or otherwise) of the group.
(a) Key management compensation
Salaries 5,307 5,399 4,189 3,936Defined contribution plan 531 520 419 394
5,838 5,919 4,608 4,330
Group Company
Group Company
2015 2014 2015 2014 TShs ‘M TShs ‘M TShs ‘M TShs ‘M
2015 2014 2015 2014 TShs ‘M TShs ‘M TShs ‘M TShs ‘M
FOR THE YEAR ENDED 31 MARCH 2015
A schedule detailing remuneration of each director is annexed to these financial statements for presentation to the annual general meeting.
The Directors of the Company own directly and indirectly 92,403 (2014: 85,403) ordinary shares of the Company as 31 March 2015.
During the year, there were no commitments, provision of guarantees and collateral with related parties. (2014: Nil)
35. ULTIMATE PARENT COMPANYSABMiller Africa BV (incorporated in the Netherlands) owns 57.54% (2014: 57.54%) of the Company’s issued shares. The ultimate parent Company is SABMiller plc, incorporated in the United Kingdom.
36. APPROVAL OF FINANCIAL STATEMENTSThe financial statements were approved and authorised for issue by the Board of Directors on the date shown on page 24.
Notes (continued)
34. RELATED PARTY TRANSACTIONS AND BALANCES (Continued)
(vi) Key management personnel
No terminal or other long term benefits were paid to key management personnel during the year (2014: Nil).
(b) Transactions with key management personnel
There were no transactions with key management personnel during the year.
(c) Balances with key management personnel
As at 31 March 2015, there was a total outstanding loan amount with key management personnel of TShs 37.8 million (2014: TShs 65.8 million). None of the loans made to members of key management has been made to the Directors.
The loan advances to key management personnel is repayable over 5 years and carry an interest rate of 12% per annum calculated on reducing balance. No provision was required in 2015 (2014: nil) for the loans made to key management personnel.
Non-executive Chairman 49 41 40 31Non-executive Directors 79 97 73 90Executive Director (included in key managementcompensation above) 296 267 296 267
424 405 409 388
(d) Directors’ emoluments
NOTES TO THE FINANCIAL STATEMENTS
(v) Year-end balances arising from transactions with related parties:
Receivable from related parties (Note 20)
Subsidiary - - 68,880 39,591
Fellow subsidiaries 6,576 3,841 6,576 3,841
6,576 3,841 75,456 43,432
Payable to related parties (Note 28)
Subsidiary - - 25,929 2,118
Fellow subsidiaries 16,785 15,991 16,343 15,996
16,785 15,991 42,272 18,114
The Company is charged interest by its parent Company SABMiller plc for current accounts balances held. Also the Company charges interest to its subsidiary Tanzania Distilleries Limited on current accounts balances held.
(iv) Dividend income:
Dividend income (Note 9) - - 9,176 15,558
Notes (continued)
34. RELATED PARTY TRANSACTIONS AND BALANCES (Continued)
(iii) Interest on intercompany accounts:
FOR THE YEAR ENDED 31 MARCH 2015
Group Company
Interest income on intercompany accountsParent 209 - 209 -Subsidiary - - 6,715 4,964 209 - 6,924 4,964Interest expense on intercompany accountsParent (110) (385) (110) (385)
The receivables from related parties arise mainly from sale transactions and are due three months after the date of sale. The receivables are unsecured and bear no interest. No provisions are held against receivables from related parties (2014: Nil).
The payables to related parties arise mainly from purchase transactions and are due three months after date of purchase. The payables bear no interest.
2015 2014 2015 2014 TShs ‘M TShs ‘M TShs ‘M TShs ‘M
84 85

THE TASKSOF TBL
the Safari Lager Wezeshwa Programme. Over 100 young entrepreneurs compete to qualify and undergo intensive training, and mentorship from experienced business persons. Qualified candidates from small-to-medium sized enterprises (SME) that are able to successfully put the lessons into practice become recipients of grants. Grants include tools, machinery and production equipment, to name a few. Winners experience significant business growth and are able to create additional jobs for the people in their community. To date, over Tsh 600 million has been invested, benefiting over 102 local SME’s.
Wonder WeldersAt TBL, we produce a large amount of scrap metal. Rather than disrcarding it, we have chosen to recycle it. All scrap metal is provided to Wonder Welders in Dar es Salaam, which is a workshop that employs disabled persons to create art, decorations and accessories out of scrap metal.
No Water No Life (Bila Maji Hakuna Uhai) CampaignThrough the No Water No Life Campaign, TBL has made a significant social investment (Tsh 1,5 billion) to facilitate access to clean and safe water in water-scarce areas through the construction of water wells and boreholes countrywide over the past few years. A significant portion of that budget has been dedicated to providing government healthcare facilities with clean, safe water. The total number of Tanzanian beneficiaries in healthcare facilities & communities to date is currently over 1,000,000. Our contribution
of water has also contributed significantly to the improvement of hygiene and sanitation in the rural communities; reducing incidences of water borne diseases such as diarrhoea, typhoid, dysentery and cholera. This is one of the many reasons the program is diligently expanding focus in investing in the health sector.
Safari Lager WezeshwaSafari Lager is one of our flagship beers. As an extension of its commitment to empower Tanzanians, the brand established
TASK 10to GIVE BACK TO OUR COMMUNITY
86 87

ADMINISTRATION & NOTICE OF MEETING
NOTICE TO SHAREHOLDERSNotice is hereby given that the 42nd Annual General Meeting of the Shareholders of Tanzania Breweries Limited will be held at Julius Nyerere Convention Centre in Dar es Salaam on 8th October, 2015 at 10 am, for the following purposes:
1. Notice of meetingNotice convening the meeting to be taken as read.
2. Approval of minutesTo approve and sign the minutes of the 41st Annual General Meeting held on 25th September, 2014.
3. Matters arising from the minutes of the previous meeting
4. Financial Statements and Directors’ ReportTo receive and consider the Directors’ Report, Auditors’ Report and the audited financial statements for the year ended 31st March, 2015.
5. To ratify dividend paid for the year ended 31st March, 2015
6. Appointment of Statutory AuditorsTo approve PricewaterhouseCoopers as the auditors for the next financial year ending 31st March, 2016.
7. Any other businessAny member entitled to attend and vote, if unable to attend for any reason, is entitled to appoint a proxy or proxies to attend, speak, and, on a poll, vote in his/her stead and such a proxy need not also be a member of the Company.
Proxy forms should be forwarded to reach the registered office of the Company or the office of the Company Secretary at least 48 hours before the time fixed for the holding of the meeting.
Please note that a member wishin g to attend the Annual General Meeting must arrive with a copy of his/her original share certificate or depository receipt (CDR) and his/her Identification Card.
By the order of the Board
Company Secretary
Note:i. Any other business needs to be brought to the attention of the
Secretary by the 24th September, 2015.ii. Shareholders shall meet all the costs for attending the meeting.
FOR THE YEAR ENDED 31 MARCH 2015
ADMINISTRATIONTanzania Breweries Limited(Registration Number 2497)
Company SecretaryHuruma NtahenaPostal Address:P.O. Box 9013, Dar es Salaam,Tanzania.Registered Office:Uhuru StreetPlot No.79, Block “AA”Mchikichini, Ilala Municipal,Dar es Salam, Tanzania.Tel: +255 764 702 905 +255 764 702 906 +255 764 702 907Fax: +255 736 606 369
Transfer Secretaries:CRDB Bank Ltd.,Head Office: Azikiwe Street,P.O. Box 268, Dar es Salaam.
External Auditors:PricewaterhouseCoopers,Pemba House369 Toure DriveOysterbayP.O. Box 45, Dar es SalaamTel : +255 (0) 22 2192200
Shareholders:Financial Year End: 31 MarchAnnual General Meeting: September
Results:Interim announcement - NovemberYear end announcement - JulyAnnual financial statements - August
Dividends:1st Interim: declaration – June, 2014Payment – July, 2014
Final Dividend: declaration – November, 2014payment – December, 2014
88

backcover