Embed Size (px)
Citation preview

24 February 2014
THE HONGKONG AND SHANGHAI BANKING CORPORATION LIMITED 2013 CONSOLIDATED RESULTS – HIGHLIGHTS
Pre-tax profit up 33% to HK$144,756m (HK$108,729m in 2012)
Attributable profit up 43% to HK$119,009m (HK$83,008m in 2012)
Return on average shareholders’ equity of 25.9% (21.9% in 2012)
Assets up 6% to HK$6,439bn (HK$6,065bn at 31 December 2012)
Common equity tier 1 ratio of 14.1%, Total capital ratio of 15.2% (Core capital ratio of 13.7%, Capital adequacy ratio of 14.3% at 31 December 2012)
Cost efficiency ratio of 33.9% (42.4% in 2012) Reported results include a net gain of HK$30,747m on the disposal of our shareholding in Ping An Insurance (Group) Company of China, Limited (‘Ping An’) and an accounting gain on the reclassification of Industrial Bank Co., Limited (‘Industrial Bank’) of HK$8,454m before tax (HK$5,914m attributable profit). Excluding these two gains: Return on average shareholders’ equity of 17.9% for 2013
Cost efficiency ratio of 42.1% for 2013
This document is issued by The Hongkong and Shanghai Banking Corporation Limited (‘the Bank’) and its subsidiaries (together ‘the group’). References to ‘HSBC’, ‘the Group’ or ‘the HSBC Group’ within this document mean HSBC Holdings plc together with its subsidiaries. Within this document the Hong Kong Special Administrative Region of the People’s Republic of China is referred to as ‘Hong Kong’. The abbreviations ‘HK$m’ and ‘HK$bn’ represent millions and billions (thousands of millions) of Hong Kong dollars respectively.

The Hongkong and Shanghai Banking Corporation Limited Results
- 2 -
Comment by Stuart Gulliver, Chairman Asia’s economic growth slowed during the early part of 2013, then stabilised during the second half as activity in mainland China picked up. Growth expectations for the region are now more modest than at this time last year. In mainland China, reforms are likely to take priority and GDP is expected to grow by 7.4%, after 7.7% growth in 2013. Hong Kong’s economy grew modestly in 2013, as robust domestic demand offset weakness in exports. Growth is expected to improve in 2014 to 3.7% as export volumes recover and trade with mainland China remains resilient. Concerns over the potential effects on countries with current account deficits of eventual tightening in monetary conditions in the West affected a number of currencies around the region during the year, and some countries may experience continued exchange rate volatility, leading to pressure on interest rates. After a period in which the ratio of debt to GDP in the region has risen, growth is sensitive to global interest rate movements and structural reforms are needed to generate gains in productivity. The Hongkong and Shanghai Banking Corporation Limited delivered a resilient performance in 2013, as we maintained our focus on deepening customer relationships, increasing collaboration between our businesses, leveraging our global connectivity and re-engineering our business. Reported profit before tax was HK$144,756m, an increase of 33% over 2012. This included the net gain on disposal of our shareholding in Ping An of HK$30,747m and an accounting gain on the reclassification of Industrial Bank as a financial investment of HK$8,454m. During the year we completed the sale of our 18% shareholding in Bao Viet Holdings and our insurance businesses in South Korea and Taiwan and in July we announced plans to wind down our remaining Retail Banking and Wealth Management services in South Korea. In October we announced that we will discontinue retail broking and depository services in India. In November, we acquired the Hong Kong and Singapore branches of HSBC Private Bank (Suisse) SA. In December we announced the sale of our 8% shareholding in Bank of Shanghai. Our priorities going forward in mainland China will emphasise the growth of our own operations and our partnership with Bank of Communications. Customer loans grew by 14% during the year as we continued to support our customers’ financing needs, while deposits increased by 10% and, at the year end, the loans to deposits ratio stood at 62.7%. Lending growth occurred mainly in trade facilities and residential mortgages, with strong increases in mainland China and Singapore. In competitive markets for both loans and deposits, margins reduced. Asset quality continued to be strong and loan impairment charges remained low, broadly unchanged compared with the prior year. We continued to invest in the business in areas such as technology platforms and mobile banking, while absorbing inflation and generating efficiencies and, in total, operating costs were unchanged. In Commercial Banking (‘CMB’) we saw strong growth in lending, although this was offset by narrower asset spreads in competitive markets, albeit margin pressures eased in the second half of the year. We continued to generate higher fee income from collaboration between CMB and Global Banking and Markets through both debt and equity capital markets transactions, including the largest ever IPO in Hong Kong for a mainland Chinese consumer company. We remained vigilant over asset quality and loan impairment charges were broadly unchanged at modest levels. Among several awards, we gained ‘Best Cash Management House in Asia’ from Euromoney and FinanceAsia’s ‘Best Foreign Commercial Bank in China’. Profit before tax in CMB was 5% lower than in 2012, mainly as gains on the disposals of businesses in 2012 were not repeated and the share of profits from associates was lower.

The Hongkong and Shanghai Banking Corporation Limited Results (continued)
- 3 -
In Retail Banking and Wealth Management (‘RBWM’) we grew revenues in Hong Kong due to balance sheet growth and increased fee income from both unit trusts and brokerage income. We also successfully launched our mobile banking application. We continued to invest in our branch network and opened our 150th HSBC outlet in mainland China during the year. By the end of December 2013 we had 162 HSBC outlets, 23 HSBC rural bank outlets and 48 Hang Seng Bank outlets. Revenues were lower in India as we revised our product offerings and also fell in Singapore due to reduced insurance and wealth management income. We maintained our focus on secured lending at low loan to value ratios and loan impairment charges remained low. We were awarded ‘Best Regional Retail Business’ and ‘Best Foreign Retail Bank in China’ by The Asian Banker. Profit before tax reduced by 4% largely as disposal gains in 2012 were not repeated. In Global Banking and Markets (‘GB&M’) we continued to improve the breadth and balance of our business lines and develop our aim to be the leading international bank. We achieved good results and progress from M&A, Equity Capital Markets, Payments and Cash Management and event business alongside our established leading positions in debt markets. During the year we won several major industry awards, including Euromoney’s ‘Best Bank in Hong Kong’ and ‘Best Debt House in Asia’, Asiamoney’s ‘Best provider of offshore renminbi (‘RMB’) products and services’, ‘RMB House of the Year’ from Asia Risk and FinanceAsia’s ‘Best Investment Bank in Hong Kong’. Profit before tax was 5% lower as strong growth in Hong Kong was offset by lower results from Rest of Asia-Pacific, due mainly to lower trading income in a number of countries from reduced bond holdings, and a lower share of profits from associates. We continued to pursue opportunities in the internationalisation of the RMB as regulations developed. We were the first foreign bank in mainland China to implement a customised RMB cross-border centralised settlement solution and were also the first foreign bank to complete a two-way cross-border RMB lending transaction. In Hong Kong we consolidated our position as the leader in offshore RMB bond issuance, including the RMB3bn government bond issue in December by mainland China’s Ministry of Finance. The outlook for Asia’s economies is mixed, with potential for uncertainties over some of the weaker regional players. Overall we expect growth to continue, led by mainland China, but at a reduced pace. Our very strong liquidity and capital position, together with sound asset quality, put us in good shape to meet any challenges, continue to serve our customers and to grow market share as we continue to invest in our priority growth markets. Our primary focus will remain on supporting our customers through the cycle and helping them to grow their businesses and achieve their personal and corporate ambitions.

The Hongkong and Shanghai Banking Corporation Limited Results by Geographic Region
- 4 -
Geographical regions Hong Kong Rest of Asia-
Pacific Intra-segment
elimination Total HK$m HK$m HK$m HK$m Year ended 31 December 2013 Net interest income 45,682 41,729 (46) 87,365 Net fee income 28,794 15,129 (77) 43,846 Net trading income 11,156 5,375 46 16,577 Net income from financial instruments designated at
fair value 2,008 467 – 2,475 Gains less losses from financial investments 323 119 – 442 Dividend income 1,165 10 – 1,175 Net earned insurance premiums 47,173 6,490 – 53,663 Net gain on reclassification of associates – 8,157 – 8,157 Gain on sale of Ping An – 34,070 – 34,070 Other operating income 13,803 2,186 (4,571) 11,418 Total operating income 150,104 113,732 (4,648) 259,188 Net insurance claims incurred and movement in liabilities to
policyholders (50,960) (5,632) – (56,592) Net operating income before loan impairment
charges and other credit risk provisions 99,144 108,100 (4,648) 202,596 Loan impairment charges and other credit risk
provisions (1,032) (2,500) – (3,532) Net operating income 98,112 105,600 (4,648) 199,064 Operating expenses (38,845) (34,531) 4,648 (68,728) Operating profit 59,267 71,069 – 130,336 Share of profit in associates and joint ventures 524 13,896 – 14,420 Profit before tax 59,791 84,965 – 144,756 Share of profit before tax 41.3% 58.7% – 100.0% Cost efficiency ratio 39.2% 31.9% – 33.9% Net loans and advances to customers 1,516,192 1,153,046 – 2,669,238 Customer accounts 2,837,779 1,416,973 – 4,254,752

The Hongkong and Shanghai Banking Corporation Limited
Results by Geographic Region (continued)
- 5 -
Geographical regions Hong Kong Rest of Asia-
Pacific Intra-segment
elimination Total HK$m HK$m HK$m HK$m Year ended 31 December 2012 Net interest income 40,155 42,271 (7) 82,419 Net fee income 24,670 15,220 – 39,890 Net trading income 9,892 9,315 7 19,214 Net income from financial instruments designated at
fair value 3,799 814 – 4,613 Gains less losses from financial investments 2,510 124 – 2,634 Dividend income 489 33 – 522 Net earned insurance premiums 46,304 6,317 – 52,621 Other operating income 14,991 4,632 (4,286) 15,337 Total operating income 142,810 78,726 (4,286) 217,250 Net insurance claims incurred and movement in liabilities to
policyholders (49,401) (5,582) – (54,983) Net operating income before loan impairment
charges and other credit risk provisions 93,409 73,144 (4,286) 162,267 Loan impairment charges and other credit risk
provisions (603) (2,975) – (3,578) Net operating income 92,806 70,169 (4,286) 158,689 Operating expenses (36,947) (36,109) 4,286 (68,770) Operating profit 55,859 34,060 – 89,919 Share of profit in associates and joint ventures 640 18,170 – 18,810 Profit before tax 56,499 52,230 – 108,729 Share of profit before tax 52.0% 48.0% – 100.0% Cost efficiency ratio 39.6% 49.4% – 42.4% Net loans and advances to customers 1,295,479 1,053,564 – 2,349,043 Customer accounts 2,531,624 1,343,260 – 3,874,884

The Hongkong and Shanghai Banking Corporation Limited Results by Geographic Global Business
- 6 -
Hong Kong Retail
Banking and
Wealth Management
Commercial Banking
Global Banking &
Markets
Global Private
Banking
Other
Intra- segment
elimination
Total
HK$m HK$m HK$m HK$m HK$m HK$m HK$m Year ended 31 December 2013 Net interest
income/(expense) 24,687 13,406 10,380 116 (2,690) (217) 45,682 Net fee income 15,749 7,473 5,405 105 62 – 28,794 Net trading income 1,045 1,417 8,334 78 66 216 11,156 Net income/(expense) from
financial instruments designated at fair value 1,965 – 56 – (14) 1 2,008
Gains less losses from financial investments – – 323 – – – 323
Dividend income 1 7 47 – 1,110 – 1,165 Net earned insurance
premiums 43,530 3,659 – – – (16) 47,173 Other operating income 4,799 706 591 – 9,856 (2,149) 13,803 Total operating income 91,776 26,668 25,136 299 8,390 (2,165) 150,104 Net insurance claims
incurred and movement in liabilities to policyholders (46,730) (4,230) – – – – (50,960)
Net operating income before loan impairment charges and other credit risk provisions 45,046 22,438 25,136 299 8,390 (2,165) 99,144
Loan impairment (charges) /releases and other credit risk provisions (1,065) (122) 154 – 1 – (1,032)
Net operating income 43,981 22,316 25,290 299 8,391 (2,165) 98,112 Operating expenses (15,501) (5,955) (10,084) (224) (9,246) 2,165 (38,845) Operating profit/(loss) 28,480 16,361 15,206 75 (855) – 59,267 Share of profit in associates
and joint ventures 518 2 4 – – – 524 Profit/(loss) before tax 28,998 16,363 15,210 75 (855) – 59,791 Share of profit before tax 20.0% 11.3% 10.5% – (0.5)% – 41.3% Net loans and advances
to customers 503,921 574,747 373,086 53,679 10,759 – 1,516,192 Customer accounts 1,655,211 753,600 276,169 150,580 2,219 – 2,837,779

The Hongkong and Shanghai Banking Corporation Limited Results by Geographic Global Business (continued)
- 7 -
Hong Kong Retail
Banking and
Wealth Management
Commercial Banking
Global Banking &
Markets
Other
Intra- segment
elimination
Total
HK$m HK$m HK$m HK$m HK$m HK$m Year ended 31 December 2012 Net interest income/(expense) 22,194 12,636 8,436 (3,744) 633 40,155 Net fee income 13,723 6,594 4,255 98 – 24,670 Net trading income 1,270 1,278 7,822 157 (635) 9,892 Net income/(expense) from
financial instruments designated at fair value 4,098 (412) 177 (66) 2 3,799
Gains less losses from financial investments (8) – 18 2,500 – 2,510
Dividend income 1 7 36 445 – 489 Net earned insurance premiums 41,074 5,132 98 – – 46,304 Other operating income 5,518 1,965 738 8,853 (2,083) 14,991 Total operating income 87,870 27,200 21,580 8,243 (2,083) 142,810 Net insurance claims incurred and
movement in liabilities to policyholders (44,650) (4,676) (75) – – (49,401)
Net operating income before loan impairment charges and other credit risk provisions 43,220 22,524 21,505 8,243 (2,083) 93,409
Loan impairment (charges)/releases and other credit risk provisions (754) 21 129 1 – (603)
Net operating income 42,466 22,545 21,634 8,244 (2,083) 92,806 Operating expenses (14,127) (5,621) (9,952) (9,330) 2,083 (36,947) Operating profit/(loss) 28,339 16,924 11,682 (1,086) – 55,859 Share of profit in associates
and joint ventures 347 49 25 219 – 640 Profit/(loss) before tax 28,686 16,973 11,707 (867) – 56,499 Share of profit before tax 26.4% 15.6% 10.8% (0.8)% – 52.0% Net loans and advances to customers 484,662 487,842 311,743 11,232 – 1,295,479 Customer accounts 1,562,867 698,719 264,844 5,194 – 2,531,624
The Hongkong and Shanghai Banking Corporation Limited Results by Geographic Global Business (continued)
- 8 -
Rest of Asia-Pacific Retail
Banking and
Wealth Management
Commercial Banking
Global Banking &
Markets
Global Private
Banking
Other
Intra- segment
elimination
Total
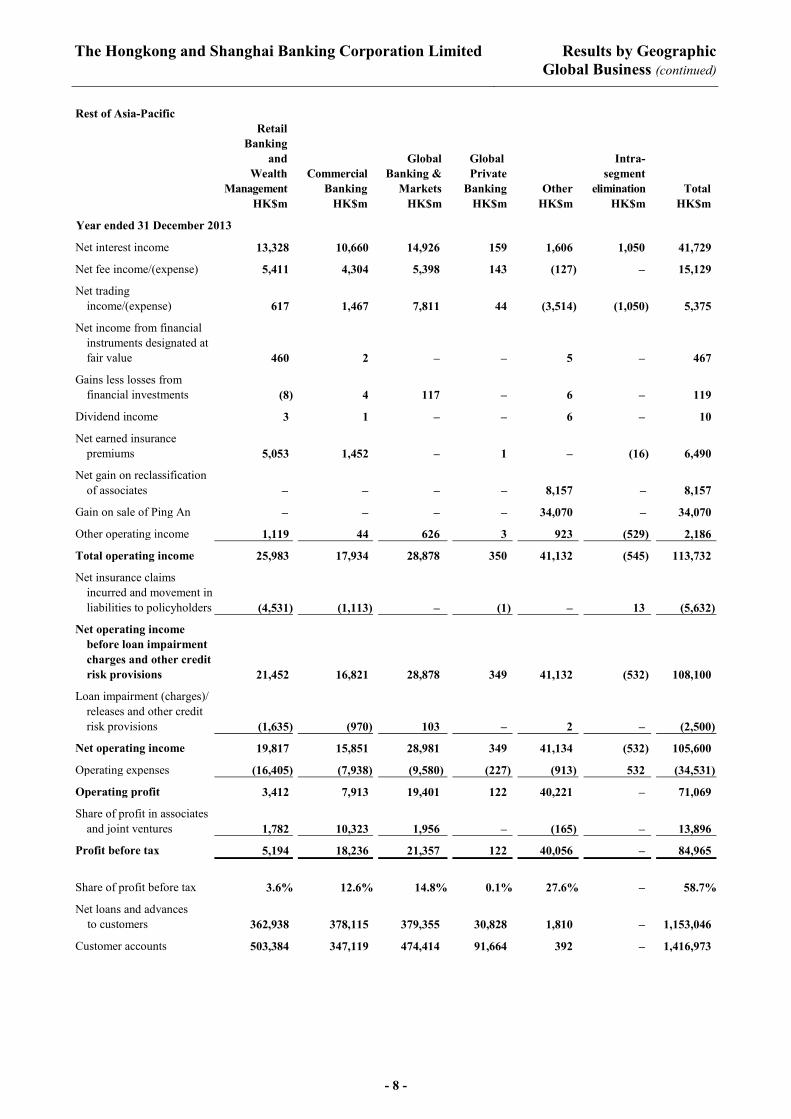
HK$m HK$m HK$m HK$m HK$m HK$m HK$m Year ended 31 December 2013 Net interest income 13,328 10,660 14,926 159 1,606 1,050 41,729 Net fee income/(expense) 5,411 4,304 5,398 143 (127) – 15,129 Net trading
income/(expense) 617 1,467 7,811 44 (3,514) (1,050) 5,375 Net income from financial
instruments designated at fair value 460 2 – – 5 – 467
Gains less losses from financial investments (8) 4 117 – 6 – 119
Dividend income 3 1 – – 6 – 10 Net earned insurance
premiums 5,053 1,452 – 1 – (16) 6,490 Net gain on reclassification
of associates – – – – 8,157 – 8,157 Gain on sale of Ping An – – – – 34,070 – 34,070 Other operating income 1,119 44 626 3 923 (529) 2,186 Total operating income 25,983 17,934 28,878 350 41,132 (545) 113,732 Net insurance claims
incurred and movement in liabilities to policyholders (4,531) (1,113) – (1) – 13 (5,632)
Net operating income before loan impairment charges and other credit risk provisions 21,452 16,821 28,878 349 41,132 (532) 108,100
Loan impairment (charges)/ releases and other credit risk provisions (1,635) (970) 103 – 2 – (2,500)
Net operating income 19,817 15,851 28,981 349 41,134 (532) 105,600 Operating expenses (16,405) (7,938) (9,580) (227) (913) 532 (34,531) Operating profit 3,412 7,913 19,401 122 40,221 – 71,069 Share of profit in associates
and joint ventures 1,782 10,323 1,956 – (165) – 13,896 Profit before tax 5,194 18,236 21,357 122 40,056 – 84,965 Share of profit before tax 3.6% 12.6% 14.8% 0.1% 27.6% – 58.7% Net loans and advances
to customers 362,938 378,115 379,355 30,828 1,810 – 1,153,046 Customer accounts 503,384 347,119 474,414 91,664 392 – 1,416,973

The Hongkong and Shanghai Banking Corporation Limited
Results by Geographic Global Business (continued)
- 9 -
Rest of Asia-Pacific Retail
Banking and
Wealth Management
Commercial Banking
Global Banking &
Markets
Global Private
Banking Other
Intra- segment
elimination Total HK$m HK$m HK$m HK$m HK$m HK$m HK$m Year ended 31 December 2012 Net interest income 13,859 10,822 18,000 137 911 (1,458) 42,271 Net fee income/(expense) 6,379 3,870 4,933 91 (53) – 15,220 Net trading
income/(expense) 699 1,437 8,477 10 (2,766) 1,458 9,315 Net income/(expense) from
financial instruments designated at fair value 844 7 (24) – (13) – 814
Gains less losses from financial investments (6) 9 (74) (1) 196 – 124
Dividend income 3 – – – 30 – 33 Net earned insurance
premiums 4,411 1,905 – 1 – – 6,317 Other operating income 1,630 500 580 499 1,985 (562) 4,632 Total operating income 27,819 18,550 31,892 737 290 (562) 78,726 Net insurance claims
incurred and movement in liabilities to policyholders (4,057) (1,524) – (1) – – (5,582)
Net operating income before loan impairment charges and other credit risk provisions 23,762 17,026 31,892 736 290 (562) 73,144
Loan impairment (charges)/ releases and other credit risk provisions (1,815) (1,133) (24) 1 (4) – (2,975)
Net operating income 21,947 15,893 31,868 737 286 (562) 70,169 Operating expenses (17,133) (7,702) (9,695) (256) (1,885) 562 (36,109) Operating profit/(loss) 4,814 8,191 22,173 481 (1,599) – 34,060 Share of profit in associates
and joint ventures 2,110 11,416 4,638 – 6 – 18,170 Profit/(loss) before tax 6,924 19,607 26,811 481 (1,593) – 52,230 Share of profit before tax 6.4% 18.0% 24.7% 0.4% (1.5)% – 48.0% Net loans and advances to
customers 356,729 340,839 351,905 2,811 1,280 – 1,053,564 Customer accounts 490,059 347,729 499,705 4,905 862 – 1,343,260

The Hongkong and Shanghai Banking Corporation Limited Results by Global Business
- 10 -
Retail Banking
and Wealth
Management
Commercial Banking
Global Banking &
Markets
Global Private
Banking
Other
Intra- segment
elimination
Total
HK$m HK$m HK$m HK$m HK$m HK$m HK$m Year ended 31 December 2013 Net interest
income/(expense) 38,015 24,066 25,278 275 (1,056) 787 87,365 Net fee income/(expense) 21,160 11,777 10,807 248 (146) – 43,846 Net trading
income/(expense) 1,662 2,884 16,145 122 (3,448) (788) 16,577 Net income/(expense) from
financial instruments designated at fair value 2,425 2 56 – (9) 1 2,475
Gains less losses from financial investments (8) 4 440 – 6 – 442
Dividend income 4 8 47 – 1,116 – 1,175 Net earned insurance
premiums 48,583 5,111 – 1 – (32) 53,663 Net gain on reclassification
of associates – – – – 8,157 – 8,157 Gain on sale of Ping An – – – – 34,070 – 34,070 Other operating income 5,918 750 1,073 3 10,769 (7,095) 11,418 Total operating income 117,759 44,602 53,846 649 49,459 (7,127) 259,188 Net insurance claims
incurred and movement in liabilities to policyholders (51,261) (5,343) – (1) – 13 (56,592)
Net operating income before loan impairment charges and other credit risk provisions 66,498 39,259 53,846 648 49,459 (7,114) 202,596
Loan impairment (charges)/ releases and other credit risk provisions (2,700) (1,092) 257 – 3 – (3,532)
Net operating income 63,798 38,167 54,103 648 49,462 (7,114) 199,064 Operating expenses (31,906) (13,893) (19,520) (451) (10,072) 7,114 (68,728) Operating profit 31,892 24,274 34,583 197 39,390 – 130,336 Share of profit in associates
and joint ventures 2,300 10,325 1,960 – (165) – 14,420 Profit before tax 34,192 34,599 36,543 197 39,225 – 144,756 Share of profit before tax 23.6% 23.9% 25.3% 0.1% 27.1% – 100.0% Net loans and advances to
customers 866,859 952,862 752,441 84,507 12,569 – 2,669,238 Customer accounts 2,158,595 1,100,719 750,583 242,244 2,611 – 4,254,752

The Hongkong and Shanghai Banking Corporation Limited Results by Global Business (continued)
- 11 -
Retail Banking
and Wealth
Management
Commercial Banking
Global Banking &
Markets
Global Private
Banking
Other
Intra- segment
elimination
Total
HK$m HK$m HK$m HK$m HK$m HK$m HK$m Year ended 31 December 2012 Net interest
income/(expense) 36,053 23,458 26,436 137 (2,833) (832) 82,419 Net fee income 20,102 10,464 9,188 91 45 – 39,890 Net trading
income/(expense) 1,969 2,715 16,299 10 (2,609) 830 19,214 Net income/(expense) from
financial instruments designated at fair value 4,942 (405) 153 – (79) 2 4,613
Gains less losses from
financial investments (14) 9 (56) (1) 2,696 – 2,634 Dividend income 4 7 36 – 475 – 522 Net earned insurance
premiums 45,485 7,037 98 1 – – 52,621 Other operating income 7,148 2,465 1,163 499 10,760 (6,698) 15,337 Total operating income 115,689 45,750 53,317 737 8,455 (6,698) 217,250 Net insurance claims
incurred and movement in liabilities to policyholders (48,707) (6,200) (75) (1) – – (54,983)
Net operating income before loan impairment charges and other credit risk provisions 66,982 39,550 53,242 736 8,455 (6,698) 162,267
Loan impairment (charges)/
releases and other credit risk provisions (2,569) (1,112) 105 1 (3) – (3,578)
Net operating income 64,413 38,438 53,347 737 8,452 (6,698) 158,689 Operating expenses (31,260) (13,323) (19,488) (256) (11,141) 6,698 (68,770) Operating profit/ (loss) 33,153 25,115 33,859 481 (2,689) – 89,919 Share of profit in associates
and joint ventures 2,457 11,465 4,663 – 225 – 18,810 Profit/(loss) before tax 35,610 36,580 38,522 481 (2,464) – 108,729 Share of profit before tax 32.8% 33.6% 35.5% 0.4% (2.3)% – 100% Net loans and advances to
customers 841,391 828,681 663,648 2,811 12,512 – 2,349,043 Customer accounts 2,052,926 1,046,448 764,549 4,905 6,056 – 3,874,884

The Hongkong and Shanghai Banking Corporation Limited Results by Geographic Region (continued)
- 12 -
Hong Kong reported pre-tax profits of HK$59,791m compared with HK$56,499m in 2012, an increase of 6%. This reflected higher revenue, driven by balance sheet growth, and increased net fees from unit trusts and debt issuance.
In RBWM, we grew our average mortgage balances by 8% with average loan-to-value ratios of 44% on new mortgage drawdowns and an estimated 32% on the portfolio as a whole. We continued to develop our digital capabilities and launched our mobile banking application. We also developed our wealth management capabilities, growing revenue by more than 10%. In addition, we enhanced our wealth management systems, simplified the product range and implemented the Global Wealth Incentive Plan to better align customer and business interests.
In CMB, we further strengthened the collaboration with GB&M, raising financing for our clients of over US$14bn from the debt capital markets (‘DCM’) and nearly US$4bn from the equity capital markets (‘ECM’), including the largest IPO in Hong Kong for a mainland Chinese consumer company. In addition, we were awarded ‘Best Trade Finance Bank in Hong Kong’ by Global Finance.
In GB&M, we continued to lead the market in Hong Kong dollar bond issuance and are now one of the top five houses for both ECM and mergers and acquisitions. We were voted ‘Best Debt House in Hong Kong’ in the Euromoney 2013 Awards for Excellence and were involved in seven of the ten largest IPOs in Hong Kong this year.
We led the market in offshore renminbi (‘RMB’) bond issuance, including the RMB3bn government bond issue in December 2013 by mainland China’s Ministry of Finance, and were voted ‘Best provider of offshore renminbi products and services’ for the second year running by Asiamoney. We also won the award for ‘RMB House of the Year’ from Asia Risk.
In November 2013, we acquired the Private Banking (‘GPB’) business of HSBC Private Bank (Suisse) SA, Hong Kong branch. We announced the sale of our shareholding in Bank of Shanghai in 2013, a transaction which is expected to complete in the first half of 2014.
Net interest income rose by HK$5,527m compared with 2012, led by RBWM and supported by GB&M and CMB. The increase was mainly due to higher average lending and deposit balances, wider spreads on mortgages in RBWM reflecting lower funding costs, and growth in the insurance debt securities portfolio.
There was strong loan growth in both CMB and GB&M, driven by trade-related lending in the first half of 2013 and an increase in commercial real estate and other property-related lending in the second half of the year, though the benefit of this growth was partly offset by spread compression reflecting competition and increased liquidity in the markets. Mortgage lending in RBWM also increased, although the rate of growth began to slow during 2013 as transaction volumes in the property market reduced.
Average deposit balances increased, in part reflecting new Premier customers in RBWM and increased Payments and Cash Management balances in CMB, though the benefit of this growth was more than offset by narrower deposit spreads due to a fall in short-term interbank interest rates.
Net fee income rose by HK$4,124m in 2013, primarily in RBWM. Strong customer demand and favourable market sentiment led to higher fees from unit trusts and increased brokerage income. Fee income increased due to a rise in debt and equity underwriting and corporate finance activity compared with 2012, in part reflecting collaboration between GB&M and CMB. Fee income also rose in CMB as trade and Payments and Cash Management volumes increased.

The Hongkong and Shanghai Banking Corporation Limited Results by Geographic Region (continued)
- 13 -
Net trading income rose by HK$1,264m in 2013. Rates revenue rose due to greater client activity, increased holdings of debt securities and a net favourable movement in respect of the valuation adjustments on derivatives compared with a net charge in 2012. Equities revenues rose from warrant market making as volumes increased, while Foreign Exchange revenue grew due to improved margins and higher customer trading volumes.
Net income from financial instruments designated at fair value was HK$2,008m compared with HK$3,799m in 2012, primarily due to lower net investment returns on assets held by the insurance business reflecting weaker equity markets and falling bond prices. To the extent that these investment returns were attributed to policyholders holding unit-linked insurance policies and insurance contracts with discretionary participation features, there was a corresponding movement in Net insurance claims incurred and movement in liabilities to policyholders.
Gains less losses from financial investments were HK$323m in 2013 compared with HK$2,510m in 2012, largely due to the non-recurrence of the gain on sale of our shares in four Indian banks in 2012.
Dividend income was HK$1,165m compared with HK$489m in 2012, mainly due to the dividend from Industrial Bank following its reclassification as a financial investment during the year.
Net earned insurance premiums grew by 2% due to increased renewals of deferred annuity and unit-linked insurance contracts, partly offset by the absence of non-life insurance premiums following the disposal of the HSBC and Hang Seng Bank general insurance businesses in 2012 and lower new business premiums. The growth in premiums resulted in a corresponding increase in Net insurance claims incurred and movement in liabilities to policyholders.
Other operating income was HK$1,188m lower than in 2012 due to the non-recurrence of the gains on sale of Global Payments Asia-Pacific Limited and the non-life insurance businesses in 2012, totalling HK$2,906m. This more than offset higher revaluation and disposal gains on investment properties, which in part reflected the strong commercial property market, and a larger increase in the PVIF asset. The latter arose in 2013 due to favourable interest rate assumption updates, although this was more than offset in Net insurance claims incurred and movement in liabilities to policyholders.
Loan impairment charges were HK$429m higher due to a revision to the assumptions used in our collective assessment models in RBWM and a rise in individual impairment charges in CMB, although these remained low. This was partly offset by collective provision releases in CMB from lower historical loss rates and individual impairment releases in GB&M.
Operating expenses rose by HK$1,898m in 2013, reflecting higher marketing spend, costs relating to the introduction of updated payment cards and information technology platforms, as well as increased property rental and maintenance costs. In addition, staff costs increased from changes to the measurement of pension costs.
Share of profit in associates and joint ventures was HK$116m lower, primarily due to the effect of the disposal of our interest in Global Payments Asia-Pacific Ltd in 2012.

The Hongkong and Shanghai Banking Corporation Limited Results by Geographic Region (continued)
- 14 -
Rest of Asia-Pacific reported pre-tax profits of HK$84,965m compared with HK$52,230m in 2012.
The increase in profits was mainly due to the net gain on disposal of our shareholding in Ping An of HK$30,747m and an accounting gain of HK$8,454m on the reclassification of Industrial Bank as a financial investment following its issue of additional share capital to third parties.
Excluding these gains, profit before tax reduced from lower revenues and lower income from associates, partly offset by reduced operating expenses and loan impairment charges. The implementation of our strategy to reduce fragmentation across the region continued, leading to the disposal of non-core insurance businesses in Vietnam, South Korea, Taiwan and Singapore. We announced the closure of a retail brokerage in India and our retail banking operations in South Korea. We also completed the sale of our investment in Ping An. In November 2013, we acquired the GPB business of HSBC Private Bank (Suisse) SA, Singapore branch.
In mainland China, where we continued to expand our branch network, we had 162 HSBC outlets, 23 HSBC rural bank outlets and 48 Hang Seng Bank outlets at the end of the year. We expanded our wealth management capabilities and were one of the first foreign banks to be approved to distribute domestic funds to retail investors. We were the market leader in mainland China’s state-owned enterprise bond issuances and we were awarded ‘Best Foreign Commercial Bank in China’ by FinanceAsia.
We continued to promote the internationalisation of the RMB as regulations developed. We were the first foreign bank in mainland China to implement a customised RMB cross-border centralised settlement solution and were also the first foreign bank to complete a two-way cross-border RMB lending transaction.
In India, we revised our wealth management product offering to ensure customers’ needs were being met and to improve customer satisfaction levels. In Payments and Cash Management, we were awarded the ‘Best Domestic Cash Management Bank’ in 2013 by Euromoney. Our strength in DCM continued, acting as a joint lead manager and bookrunner for the largest US dollar-denominated single tranche bond issuance by an Indian corporate in 2013.
In Singapore, we led the market in foreign currency DCM issuance, continuing to demonstrate our ability to structure DCM transactions. In CMB, we began to offer a RMB settlement service.
We continued to develop our Payments and Cash Management product offering across the region and were awarded the ‘Best Cash Management House in Asia’ by Euromoney. We also strengthened our Project and Export Finance capabilities and were named the ‘Best Project Finance House in Asia’ by Euromoney for the third consecutive year. Our strength in DCM continued and we were the No.1 bookrunner in Asia ex-Japan bonds. We were awarded the ‘Domestic Bond House of the Year’ by IFR Asia.
Net interest income reduced by HK$542m as balance sheet growth was more than offset by spread compression in many countries from competition and increased liquidity.
Average residential mortgage balances grew, primarily in mainland China and Australia, as we focused on secured lending, and in Singapore reflecting lending growth in 2012. Term and trade-related lending in CMB rose, notably in mainland China, Singapore and Indonesia, from continued client demand. Increased average loan balances were broadly offset by lending spread compression, notably on trade finance lending, reflecting competitive pressures and increased liquidity in the market.

The Hongkong and Shanghai Banking Corporation Limited Results by Geographic Region (continued)
- 15 -
We grew average deposit balances in both Payments and Cash Management and RBWM, though the benefit of this growth was partly offset by narrower liability spreads in many countries following central bank interest rate cuts and increased liquidity.
Net fee income fell by HK$91m, primarily in RBWM, notably in India, from lower wealth management sales as we revised our product offerings. This was partly offset in GB&M from increased activity in bond sales in Singapore and in CMB from increased credit facilities, notably in mainland China.
Net trading income was HK$3,940m lower, in part from further adverse fair value movements on the Ping An contingent forward sale contract of HK$3,323m, compared with HK$2,694m in 2012. Rates revenues decreased largely from reduced bond holdings in a number of countries and revaluation losses as bond yields rose, notably in mainland China. Foreign Exchange revenues also fell as 2012 market conditions were not repeated.
Net income from financial instruments designated at fair value was HK$467m compared with HK$814m in 2012 from lower gains on assets held by the insurance business in Singapore driven by rising bond yields. To the extent that these investment returns were attributed to policyholders holding unit-linked insurance policies and insurance contracts with discretionary participation features, there was a corresponding movement in Net insurance claims incurred and movement in liabilities to policyholders.
We recorded an accounting gain of HK$8,454m on the reclassification of Industrial Bank as a financial investment following its issue of additional share capital to third parties. This was partly offset by a loss of HK$297m on the reclassification of Yantai Bank as a financial investment.
There was a gross gain of HK$34,070m on the disposal of our investment in Ping An, which was partly offset by the adverse fair value movement of HK$3,323m on the contingent forward sale contract included in ‘Net trading income’ noted above.
Other operating income fell by HK$2,446m in 2013. There was a gain on the disposal of our investment in Bao Viet Holdings of HK$810m and losses on the disposal of our Taiwan life insurance business and Singapore group term life and group medical insurance businesses totalling HK$339m. We recorded a gain on the disposal of Hana HSBC Life Insurance Company Limited of HK$214m, though this was after a write-down of HK$558m recorded in ‘Operating expenses’. In 2012, we reported gains totalling HK$2,340m on the sale of our RBWM business in Thailand, our GPB business in Japan and our interest in a property company in the Philippines.
Loan impairment charges decreased by HK$475m as a result of the non-recurrence of a large individually assessed impairment of a corporate exposure in Australia in 2012, as well as an impairment release in GB&M in Bahrain in 2013. This was partly offset by an increase in individually assessed impairments in GB&M and CMB in a number of countries across the region.
Operating expenses decreased by HK$1,578m. There was a partial write back of a litigation provision in Singapore and Australia compared with a charge in 2012. In addition, there were lower restructuring and other related costs, including termination benefits, than in 2012, and the non-recurrence of costs following the sale or closure of operations. These decreases were partly offset by a rise in mainland China from wage inflation, higher staff numbers and branch expansion.
Share of profit in associates and joint ventures reduced by HK$4,274m following the reclassification of Industrial Bank as a financial investment and an impairment charge of HK$819m on our banking associate in Vietnam. Excluding these factors, income from associates rose, primarily in Bank of Communications as a result of balance sheet growth and increased fee income, partly offset by higher operating expenses and a rise in loan impairment charges.

The Hongkong and Shanghai Banking Corporation Limited Consolidated Income Statement
- 16 -
Year ended 31 December
2013
Year ended 31 December
2012
HK$m HK$m Interest income 117,039 115,511 Interest expense (29,674) (33,092)
Net interest income 87,365 82,419
Fee income 50,187 46,221 Fee expense (6,341) (6,331)
Net fee income 43,846 39,890 Net trading income 16,577 19,214 Net income from financial instruments designated at fair value 2,475 4,613 Gains less losses from financial investments 442 2,634 Dividend income 1,175 522 Net earned insurance premiums 53,663 52,621 Net gain on reclassification of associates 8,157 – Gain on sale of Ping An 34,070 – Other operating income 11,418 15,337
Total operating income 259,188 217,250
Net insurance claims incurred and movement in liabilities to policyholders (56,592) (54,983)
Net operating income before loan impairment charges and other credit risk provisions 202,596 162,267
Loan impairment charges and other credit risk provisions (3,532) (3,578)
Net operating income 199,064 158,689
Employee compensation and benefits (36,938) (37,021)
General and administrative expenses (26,127) (26,011) Depreciation of property, plant and equipment (3,988) (4,014) Amortisation and impairment of intangible assets (1,675) (1,724)
Total operating expenses (68,728) (68,770)
Operating profit 130,336 89,919
Share of profit in associates and joint ventures 14,420 18,810
Profit before tax 144,756 108,729
Tax expense (15,701) (18,010)
Profit for the year 129,055 90,719
Profit attributable to shareholders of the parent company 119,009 83,008 Profit attributable to non-controlling interests 10,046 7,711

The Hongkong and Shanghai Banking Corporation Limited Consolidated Statement of Comprehensive Income
- 17 -
Year ended 31 December
2013
Year ended 31 December
2012
HK$m HK$m Profit for the year 129,055 90,719 Other comprehensive income/(expense) Items that will subsequently be reclassified to the income statement when specific
conditions are met:
Available-for-sale investments: – fair value changes taken to equity (6,456) 14,153 – fair value changes transferred to the income statement on disposal (34,643) (2,753) – amounts transferred to the income statement on impairment – 5 – fair value changes transferred to the income statement on hedged items 2,179 (287) – income taxes 1,097 (768) Cash flow hedges: – fair value changes taken to equity 5,778 3,858 – fair value changes transferred to the income statement (5,789) (3,662) – income taxes (6) (33) Share of changes in equity of associates and joint ventures (698) 638 Exchange differences (5,981) 925 Items that will not subsequently be reclassified to the income statement: Property revaluation: – fair value changes taken to equity 5,687 7,221 – income taxes (949) (1,161) Remeasurement of defined benefit: – before income taxes 2,281 1,080 – income taxes (374) (198)
Other comprehensive income/(expense) for the year, net of tax (37,874) 19,018 Total comprehensive income for the year, net of tax 91,181 109,737 Total comprehensive income for the year attributable to: – shareholders of the parent company 81,689 100,814 – non-controlling interests 9,492 8,923
91,181 109,737

The Hongkong and Shanghai Banking Corporation Limited Consolidated Balance Sheet
- 18 -
At 31 December
2013
At 31 December
2012 HK$m HK$m ASSETS Cash and short-term funds 1,132,719 1,111,199 Items in the course of collection from other banks 16,346 23,079 Placings with banks maturing after one month 216,970 184,711 Certificates of deposit 88,207 93,085 Hong Kong Government certificates of indebtedness 195,554 176,264 Trading assets 311,400 419,697 Financial assets designated at fair value 90,146 69,479 Derivatives 388,727 398,956 Loans and advances to customers 2,669,238 2,349,043 Financial investments 765,866 626,042 Amounts due from Group companies 161,975 176,004 Interests in associates and joint ventures 107,852 119,273 Goodwill and intangible assets 41,882 38,634 Property, plant and equipment 101,240 90,179 Deferred tax assets 2,294 2,629 Other assets 148,939 187,053 Total assets 6,439,355 6,065,327 LIABILITIES Hong Kong currency notes in circulation 195,554 176,264 Items in the course of transmission to other banks 34,240 35,525 Deposits by banks 236,616 244,135 Customer accounts 4,254,752 3,874,884 Trading liabilities 195,032 183,340 Financial liabilities designated at fair value 41,715 44,270 Derivatives 365,052 397,151 Debt securities in issue 52,334 74,647 Retirement benefit liabilities 4,856 6,725 Amounts due to Group companies 91,797 97,618 Other liabilities and provisions 88,809 94,791 Liabilities under insurance contracts issued 276,180 244,921 Current tax liabilities 3,722 3,842 Deferred tax liabilities 16,051 16,923 Subordinated liabilities 13,107 13,867 Preference shares 47,314 83,346 Total liabilities 5,917,131 5,592,249 EQUITY Share capital 85,319 58,969 Other reserves 89,564 133,790 Retained profits 290,926 224,640 Proposed dividend 15,000 20,000 Total shareholders’ equity 480,809 437,399 Non-controlling interests 41,415 35,679 Total equity 522,224 473,078 Total equity and liabilities 6,439,355 6,065,327

The Hongkong and Shanghai Banking Corporation Limited Consolidated Statement of Changes in Equity
- 19 -
At 31 December
2013
At 31 December
2012
HK$m HK$m Share capital
At beginning of year 58,969 30,190 Issued during the year 26,350 28,779
85,319 58,969 Retained profits and proposed dividend
At beginning of year 244,640 198,416 Dividends paid (47,000) (32,500) Movement in respect of share-based payment arrangements (355) (246) Other movements 7 (3) Transfers (11,826) (4,554) Comprehensive income for the year 120,460 83,527
305,926 244,640 Other reserves Property revaluation reserve
At beginning of year 43,451 38,939 Transfers (1,387) (1,010) Comprehensive income for the year 4,272 5,522
46,336 43,451 Available-for-sale investment reserve
At beginning of year 40,580 29,786 Other movements (7) 8 Transfers – (2) Comprehensive income/(expense) for the year (37,293) 10,788
3,280 40,580 Cash flow hedging reserve
At beginning of year 210 51 Comprehensive income/(expense) for the year (13) 159
197 210 Foreign exchange reserve
At beginning of year 15,193 14,265 Comprehensive income/(expense) for the year (5,574) 928
9,619 15,193 Other reserves
At beginning of year 34,356 29,177 Movement in respect of share-based payment arrangements 240 (277) Other movements (17,514) – Transfers 13,213 5,566 Comprehensive expense for the year (163) (110)
30,132 34,356
The Hongkong and Shanghai Banking Corporation Limited Consolidated Statement of Changes in Equity (continued)
- 20 -
At 31 December
2013
At 31 December
2012
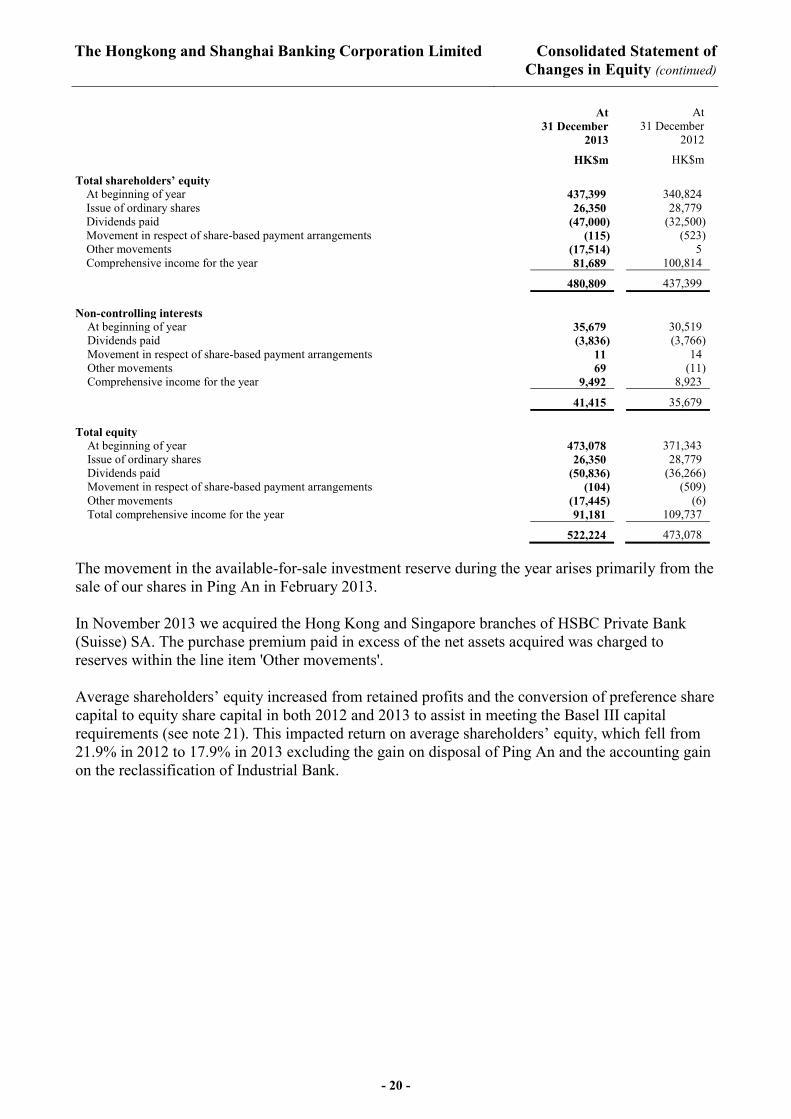
HK$m HK$m Total shareholders’ equity
At beginning of year 437,399 340,824 Issue of ordinary shares 26,350 28,779 Dividends paid (47,000) (32,500) Movement in respect of share-based payment arrangements (115) (523) Other movements (17,514) 5 Comprehensive income for the year 81,689 100,814 480,809 437,399
Non-controlling interests
At beginning of year 35,679 30,519 Dividends paid (3,836) (3,766) Movement in respect of share-based payment arrangements 11 14 Other movements 69 (11) Comprehensive income for the year 9,492 8,923
41,415 35,679 Total equity
At beginning of year 473,078 371,343 Issue of ordinary shares 26,350 28,779 Dividends paid (50,836) (36,266) Movement in respect of share-based payment arrangements (104) (509) Other movements (17,445) (6) Total comprehensive income for the year 91,181 109,737
522,224 473,078 The movement in the available-for-sale investment reserve during the year arises primarily from the sale of our shares in Ping An in February 2013. In November 2013 we acquired the Hong Kong and Singapore branches of HSBC Private Bank (Suisse) SA. The purchase premium paid in excess of the net assets acquired was charged to reserves within the line item 'Other movements'. Average shareholders’ equity increased from retained profits and the conversion of preference share capital to equity share capital in both 2012 and 2013 to assist in meeting the Basel III capital requirements (see note 21). This impacted return on average shareholders’ equity, which fell from 21.9% in 2012 to 17.9% in 2013 excluding the gain on disposal of Ping An and the accounting gain on the reclassification of Industrial Bank.

The Hongkong and Shanghai Banking Corporation Limited Consolidated Cash Flow Statement
- 21 -
Year ended 31 December
2013
Year ended 31 December
2012
HK$m HK$m Operating activities Cash generated from/(used in) operations 158,886 (20,651) Interest received on financial investments 13,222 14,349 Dividends received on financial investments 1,087 464 Dividends received from associates 4,468 2,297 Taxation paid (16,182) (17,423) Net cash inflow/(outflow) from operating activities 161,481 (20,964) Investing activities Purchase of financial investments (350,187) (262,280) Proceeds from sale or redemption of financial investments 267,382 350,945 Purchase of property, plant and equipment (8,419) (1,990) Proceeds from sale of property, plant and equipment and assets held for sale 1,003 35 Purchase of other intangible assets (1,502) (1,303) Net cash inflow in respect of the sale of subsidiaries – 1,416 Net cash outflow in respect of the purchase of interests in business portfolios (1,792) – Net cash outflow in respect of the purchase of interests in associates and joint ventures – (13,521) Net cash outflow in respect of the sale of interests in business portfolios (2,670) (12,242) Proceeds from the sale of interests in associates 2,840 3,970 Net cash (outflow)/ inflow from investing activities (93,345) 65,030 Net cash inflow before financing 68,136 44,066 Financing Issue of ordinary share capital 26,350 28,779 Issue of preference shares – 29 Redemption of preference shares (36,042) (13,566) Repayment of subordinated liabilities (338) (2,326) Issue of subordinated liabilities – 2,328 Ordinary dividends paid (47,000) (32,500) Dividends paid to non-controlling interests (3,836) (3,766) Interest paid on preference shares (2,294) (2,301) Interest paid on subordinated liabilities (829) (884) Net cash outflow from financing (63,989) (24,207) Increase in cash and cash equivalents 4,147 19,859
The Hongkong and Shanghai Banking Corporation Limited
Additional Information
- 22 -
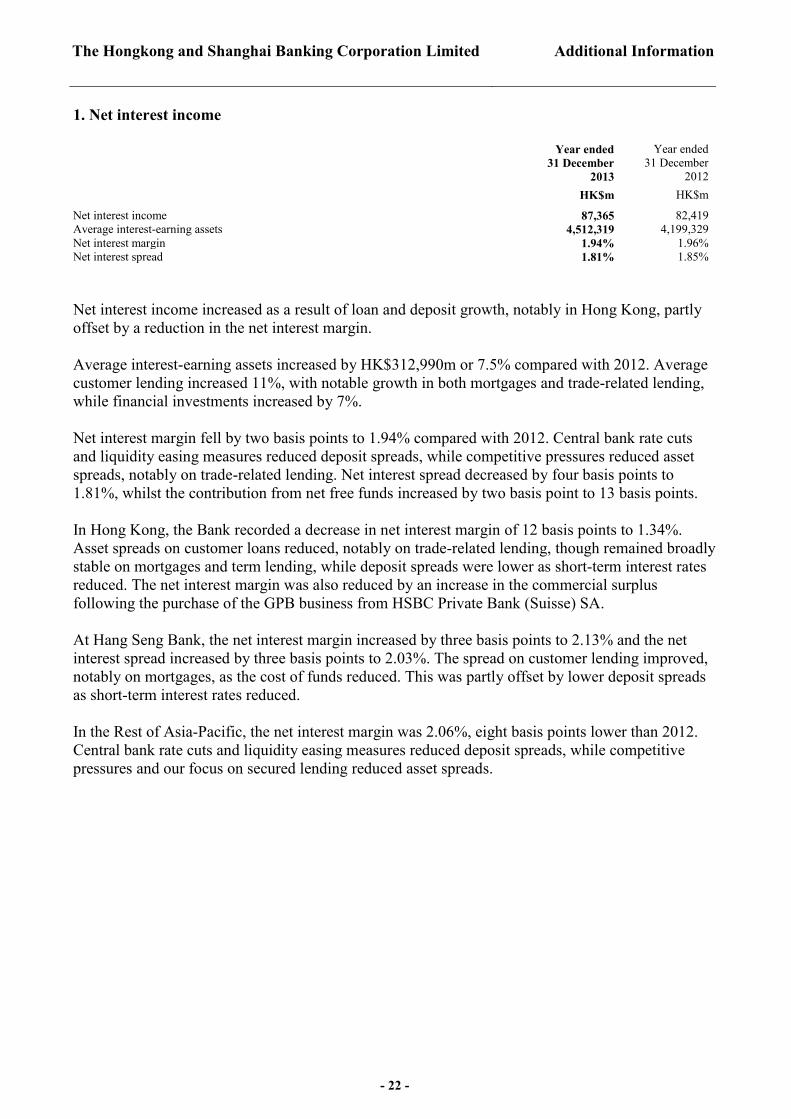
1. Net interest income
Year ended 31 December
2013
Year ended 31 December
2012 HK$m HK$m Net interest income 87,365 82,419 Average interest-earning assets 4,512,319 4,199,329 Net interest margin 1.94% 1.96% Net interest spread 1.81% 1.85% Net interest income increased as a result of loan and deposit growth, notably in Hong Kong, partly offset by a reduction in the net interest margin. Average interest-earning assets increased by HK$312,990m or 7.5% compared with 2012. Average customer lending increased 11%, with notable growth in both mortgages and trade-related lending, while financial investments increased by 7%. Net interest margin fell by two basis points to 1.94% compared with 2012. Central bank rate cuts and liquidity easing measures reduced deposit spreads, while competitive pressures reduced asset spreads, notably on trade-related lending. Net interest spread decreased by four basis points to 1.81%, whilst the contribution from net free funds increased by two basis point to 13 basis points. In Hong Kong, the Bank recorded a decrease in net interest margin of 12 basis points to 1.34%. Asset spreads on customer loans reduced, notably on trade-related lending, though remained broadly stable on mortgages and term lending, while deposit spreads were lower as short-term interest rates reduced. The net interest margin was also reduced by an increase in the commercial surplus following the purchase of the GPB business from HSBC Private Bank (Suisse) SA. At Hang Seng Bank, the net interest margin increased by three basis points to 2.13% and the net interest spread increased by three basis points to 2.03%. The spread on customer lending improved, notably on mortgages, as the cost of funds reduced. This was partly offset by lower deposit spreads as short-term interest rates reduced. In the Rest of Asia-Pacific, the net interest margin was 2.06%, eight basis points lower than 2012. Central bank rate cuts and liquidity easing measures reduced deposit spreads, while competitive pressures and our focus on secured lending reduced asset spreads.

The Hongkong and Shanghai Banking Corporation Limited
Additional Information (continued)
- 23 -
2. Net fee income
Year ended 31 December
2013
Year ended 31 December
2012 HK$m HK$m Brokerage 7,344 6,824 Cards 7,146 6,858 Unit trusts 5,672 4,523 Import/export 4,986 5,115 Funds under management 4,114 4,089 Remittances 3,364 3,066 Credit facilities 3,176 2,797 Account services 2,782 2,772 Underwriting 1,908 1,689 Insurance 1,401 1,042 Other 8,294 7,446 Fee income 50,187 46,221 Fee expense (6,341) (6,331) 43,846 39,890 Net fee income increased by HK$3,956m, or 10% compared with 2012. Fees from unit trusts and brokerage rose due to strong customer demand and favourable investment sentiment, notably in Hong Kong. This was partly offset by lower wealth management sales in India as we revised our product offerings. Card fees also rose from higher spending in Hong Kong, partly offset by Thailand following the sale of the business in 2012 and balance reductions in the Philippines, India and Indonesia. Fee income from remittances was higher from increased business volumes in Hong Kong. Credit facility fees increased in 2013 from more mandates arranged during the year, notably in Hong Kong and Singapore. Underwriting fees increased due to our participation in many debt and equity market transactions, primarily in Hong Kong. Fees from insurance increased from distribution agreements following the sale of our general insurance business, though this corresponds with a reduction in net earned general insurance premiums. Other fee income rose compared with 2012, in part due to growth in the mandatory provident funds business in Hong Kong, as well as increased participation in corporate and project finance advisory activity in Hong Kong.

The Hongkong and Shanghai Banking Corporation Limited
Additional Information (continued)
- 24 -
3. Net trading income
Year ended 31 December
2013
Year ended 31 December
2012 HK$m HK$m Dealing profits 15,104 16,633 Net loss from hedging activities (37) (31) Net interest income on trading assets and liabilities 3,859 4,520 Dividend income from trading securities 974 786 Ping An contingent forward sale contract (3,323) (2,694) 16,577 19,214
Net trading income decreased by HK$2,637m, or 14% compared with 2012. Included within trading income were further adverse fair value movements on the Ping An contingent forward sale contract of HK$3,323m, compared with HK$2,694m in 2012. Dealing profits were lower in a number of countries in Asia Pacific, with a decline in Rates revenues from revaluation losses on trading bonds as yields rose. Foreign Exchange revenues also decreased as market conditions in 2012 were not repeated. Dealing profits in Hong Kong rose from higher Equities revenues as volumes increased from market making in warrants, as well as higher Foreign Exchange income due to improved margins and higher customer trading volumes. Rates trading income also benefited from more volume and a net favourable movement in respect of the valuation adjustments on derivatives compared with a net charge in 2012. Net interest income on trading assets and liabilities decreased in 2013 from reduced bond holdings in a number of countries, partly offset by an increase in Hong Kong. 4. Gains less losses from financial investments
Year ended 31 December
2013
Year ended 31 December
2012 HK$m HK$m Gain on sale of Ping An 34,070 – Gains on disposal of available-for-sale securities 470 2,809 Impairment of available-for-sale equity investments (28) (175) 442 2,634 We recorded a gross gain on the sale of our shareholding in Ping An of HK$34,070m, which was partly offset by the adverse fair value movement of HK$3,323m on the contingent forward sale contract included in ‘Net trading income’, leading to a net gain of HK$30,747m. Gains on disposal of financial investments in 2012 included the gain of HK$2,441m on the sale of our shares in four Indian banks.
The Hongkong and Shanghai Banking Corporation Limited
Additional Information (continued)
- 25 -
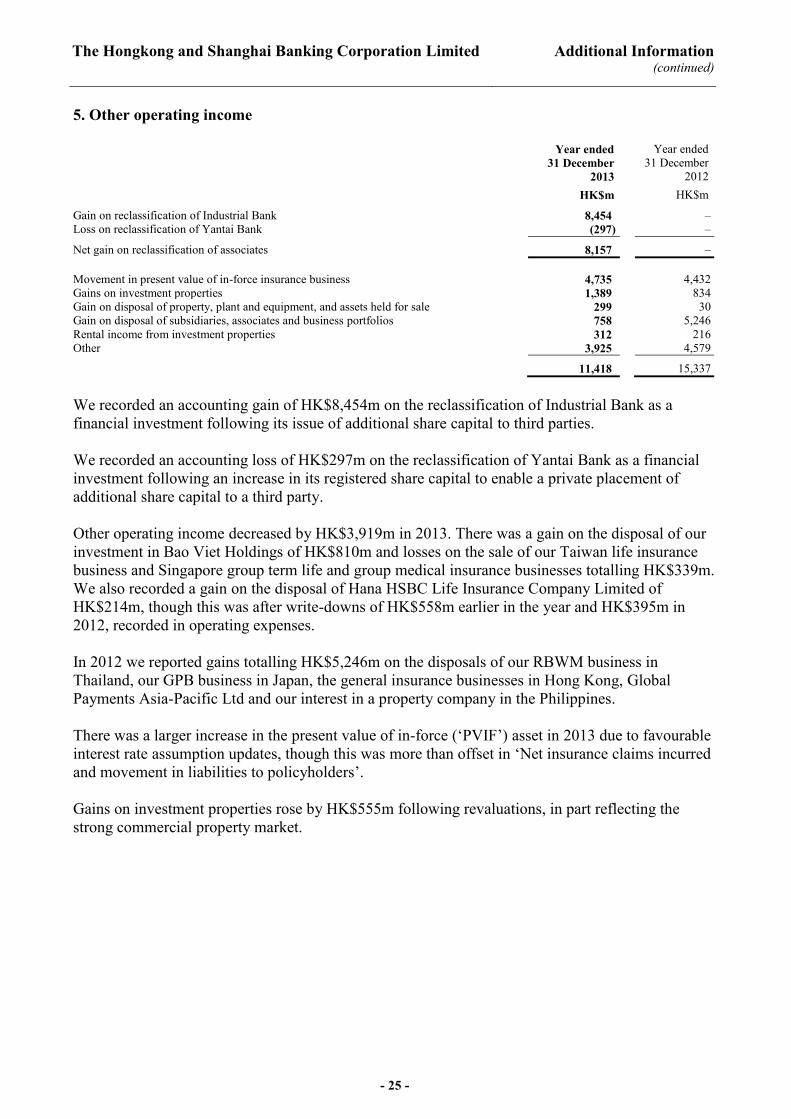
5. Other operating income
Year ended 31 December
2013
Year ended 31 December
2012 HK$m HK$m Gain on reclassification of Industrial Bank 8,454 – Loss on reclassification of Yantai Bank (297) – Net gain on reclassification of associates 8,157 – Movement in present value of in-force insurance business 4,735 4,432 Gains on investment properties 1,389 834 Gain on disposal of property, plant and equipment, and assets held for sale 299 30 Gain on disposal of subsidiaries, associates and business portfolios 758 5,246 Rental income from investment properties 312 216 Other 3,925 4,579 11,418 15,337 We recorded an accounting gain of HK$8,454m on the reclassification of Industrial Bank as a financial investment following its issue of additional share capital to third parties. We recorded an accounting loss of HK$297m on the reclassification of Yantai Bank as a financial investment following an increase in its registered share capital to enable a private placement of additional share capital to a third party. Other operating income decreased by HK$3,919m in 2013. There was a gain on the disposal of our investment in Bao Viet Holdings of HK$810m and losses on the sale of our Taiwan life insurance business and Singapore group term life and group medical insurance businesses totalling HK$339m. We also recorded a gain on the disposal of Hana HSBC Life Insurance Company Limited of HK$214m, though this was after write-downs of HK$558m earlier in the year and HK$395m in 2012, recorded in operating expenses. In 2012 we reported gains totalling HK$5,246m on the disposals of our RBWM business in Thailand, our GPB business in Japan, the general insurance businesses in Hong Kong, Global Payments Asia-Pacific Ltd and our interest in a property company in the Philippines. There was a larger increase in the present value of in-force (‘PVIF’) asset in 2013 due to favourable interest rate assumption updates, though this was more than offset in ‘Net insurance claims incurred and movement in liabilities to policyholders’. Gains on investment properties rose by HK$555m following revaluations, in part reflecting the strong commercial property market.

The Hongkong and Shanghai Banking Corporation Limited
Additional Information (continued)
- 26 -
6. Insurance income Included in the consolidated income statement are the following revenues earned by the insurance business:
Year ended 31 December
2013
Year ended 31 December
2012 HK$m HK$m Net interest income 8,702 7,864 Net fee income 1,864 1,216 Net trading income/(loss) (349) 56 Net income from financial instruments designated at fair value 2,426 4,538 Net earned insurance premiums 53,663 52,621 Movement in present value of in-force business 4,735 4,432 Other operating income 1,052 1,308 72,093 72,035 Net insurance claims incurred and movement in liabilities to policyholders (56,592) (54,983) Net operating income 15,501 17,052 Net interest income increased by 11% as funds under management grew, reflecting net inflows from new and renewal insurance business. Net income from financial instruments designated at fair value was HK$2,426m compared with HK$4,538m in 2012, reflecting weaker equity markets and falling bond prices. To the extent that revaluation is attributed to policyholders, there is an offsetting movement reported under ‘Net insurance claims incurred and movement in liabilities to policyholders’. Net insurance premiums rose by 2% as a result of increased renewals of existing deferred annuity and unit-linked policies, partly offset by the absence of general insurance premiums following the disposal of these businesses in 2012 and lower new business premiums. The growth in premiums resulted in a corresponding increase in ‘Net insurance claims incurred and movement in liabilities to policyholders’. The movement in PVIF increased by HK$303m, largely due to favourable interest rate assumption updates in Hong Kong, though this was more than offset in ‘Net insurance claims incurred and movement in liabilities to policyholders’. The PVIF increase was partly offset by a lower value of new business compared with 2012, reflecting lower new business premiums. Other operating income includes the gains on sale of our interests in Bao Viet Holdings and Hana HSBC Life Insurance Company Limited of HK$810m and HK$214m respectively, offset by losses on the sale of our Taiwan life insurance business and Singapore group term life and group medical insurance businesses totalling HK$339m.

The Hongkong and Shanghai Banking Corporation Limited
Additional Information (continued)
- 27 -
7. Loan impairment charges and other credit risk provisions
Year ended 31 December
2013
Year ended 31 December
2012 HK$m HK$m Individually assessed impairment charges: New charges 2,433 2,201 Releases (1,426) (1,230) Recoveries (198) (237) 809 734 Collectively assessed impairment charges 2,602 2,596 Other credit risk provisions 121 248 Loan impairment charges and other credit risk provisions 3,532 3,578 Loan impairment charges and other credit risk provisions decreased by HK$46m in 2013. The charge for individually assessed impairments rose due to charges against a number of CMB customers in Hong Kong and a number of countries across Asia Pacific. These were partly offset by the non-recurrence of an impairment charge on a corporate exposure in Australia, as well as individually assessed impairment charges in India, both in 2012. There were higher releases in 2013, notably in Hong Kong and Bahrain. The charge for collectively assessed impairments was broadly unchanged compared with 2012, with an increase in RBWM reflecting a revision to the assumptions used in our collective assessment model, largely offset by higher collective provision releases in CMB from lower historical loss rates. The charge for other credit risk provisions decreased by HK$127m due to the non-recurrence of a charge in 2012 against a corporate exposure in Australia as noted above.
The Hongkong and Shanghai Banking Corporation Limited
Additional Information (continued)
- 28 -
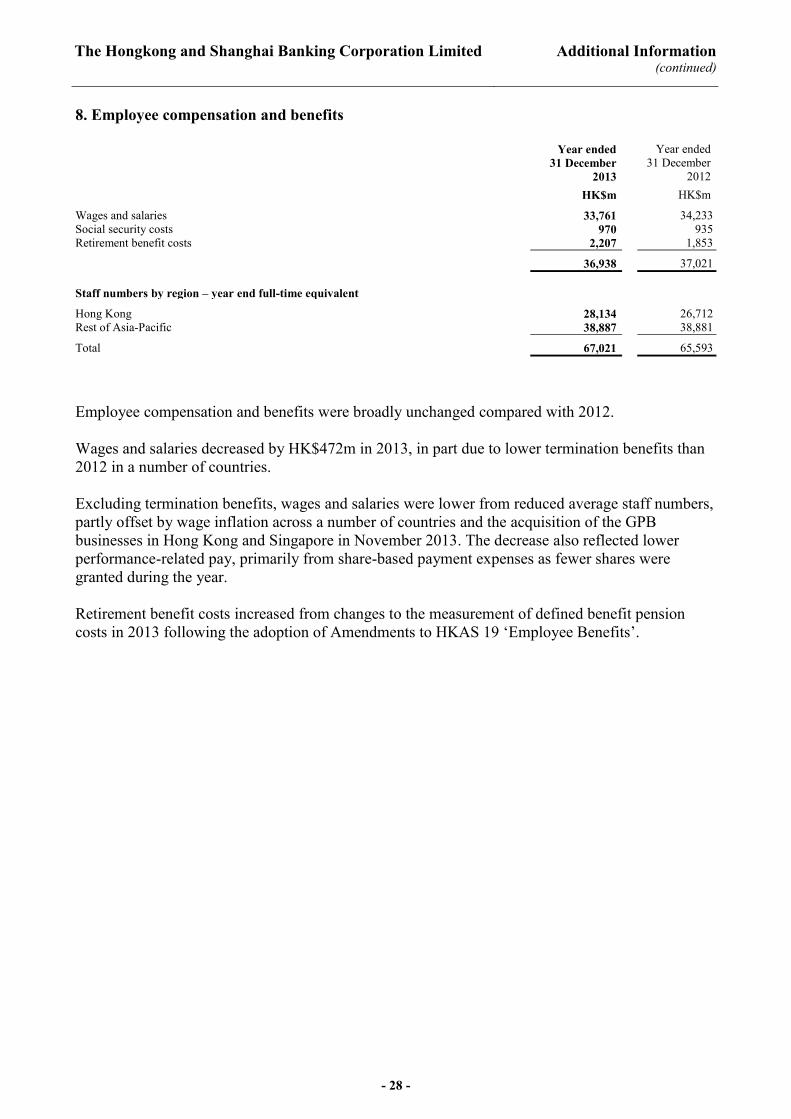
8. Employee compensation and benefits
Year ended 31 December
2013
Year ended 31 December
2012 HK$m HK$m Wages and salaries 33,761 34,233 Social security costs 970 935 Retirement benefit costs 2,207 1,853 36,938 37,021 Staff numbers by region – year end full-time equivalent Hong Kong 28,134 26,712 Rest of Asia-Pacific 38,887 38,881 Total 67,021 65,593 Employee compensation and benefits were broadly unchanged compared with 2012. Wages and salaries decreased by HK$472m in 2013, in part due to lower termination benefits than 2012 in a number of countries. Excluding termination benefits, wages and salaries were lower from reduced average staff numbers, partly offset by wage inflation across a number of countries and the acquisition of the GPB businesses in Hong Kong and Singapore in November 2013. The decrease also reflected lower performance-related pay, primarily from share-based payment expenses as fewer shares were granted during the year. Retirement benefit costs increased from changes to the measurement of defined benefit pension costs in 2013 following the adoption of Amendments to HKAS 19 ‘Employee Benefits’.

The Hongkong and Shanghai Banking Corporation Limited
Additional Information (continued)
- 29 -
9. General and administrative expenses Year ended
31 December 2013
Year ended 31 December
2012 HK$m HK$m Premises and equipment – Rental expenses 3,428 3,292 – Amortisation of prepaid operating lease payments 18 18 – Other premises and equipment 3,953 3,941 7,399 7,251 Marketing and advertising expenses 3,565 3,578 Other administrative expenses 15,163 15,182 26,127 26,011 General and administrative expenses increased by HK$116m in 2013. Rental expenses rose in 2013, primarily in Hong Kong from higher property rental prices and in mainland China from branch expansion. Other premises and equipment expenses rose marginally, reflecting higher property maintenance charges in Hong Kong. This was partly offset by the non-recurrence of restructuring costs in 2012 relating to the sale of our RBWM business in Thailand and our GPB business in Japan. Marketing and advertising expenses decreased, from reduced activity in a few countries across Rest of Asia-Pacific, partly offset by higher card awards and increased promotions in Hong Kong. Other administrative expenses were broadly unchanged. Expenses reduced from the partial write back of a litigation provision in Singapore and Australia compared with a charge in 2012 and lower restructuring and other related costs, as well as the non-recurrence of costs following the sale or closure of operations. These reductions were offset by increases in Hong Kong, reflecting growth in professional, legal and data processing costs and costs relating to the introduction of updated payment cards and information technology platforms. In addition, we recorded a write-down of Hana HSBC Life Insurance Company Limited of HK$558m in 2013 compared with HK$395m in 2012.
The Hongkong and Shanghai Banking Corporation Limited
Additional Information (continued)
- 30 -
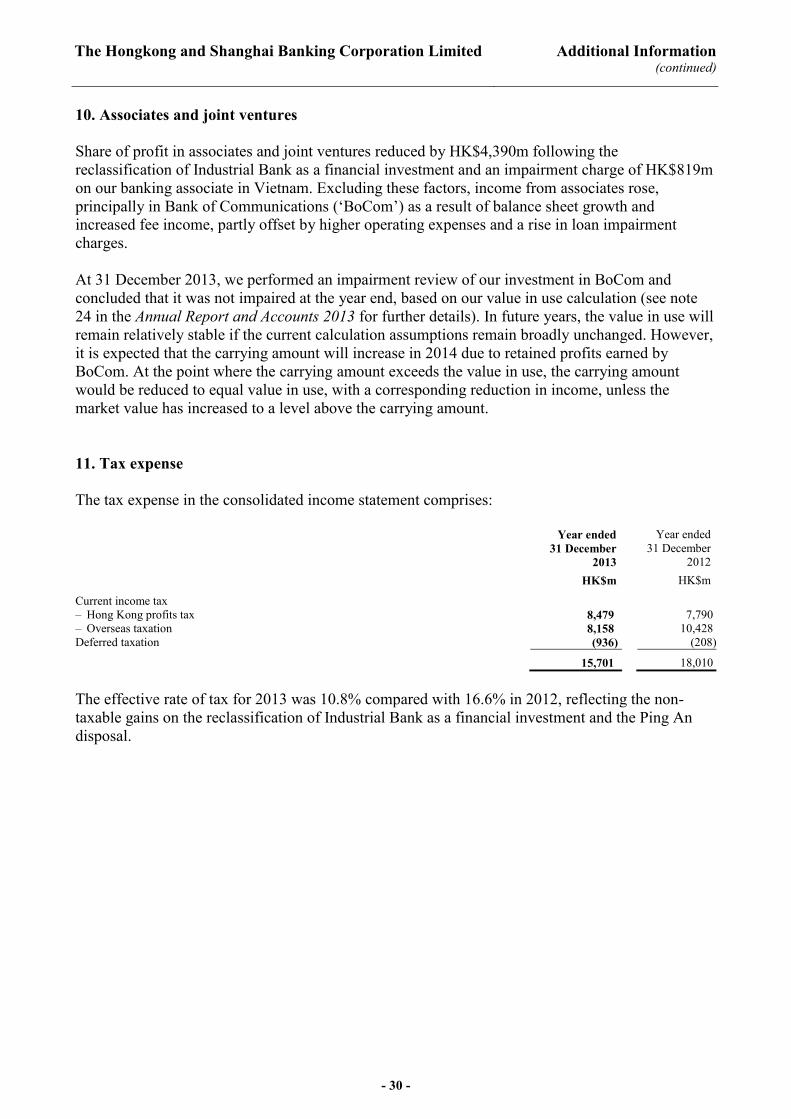
10. Associates and joint ventures Share of profit in associates and joint ventures reduced by HK$4,390m following the reclassification of Industrial Bank as a financial investment and an impairment charge of HK$819m on our banking associate in Vietnam. Excluding these factors, income from associates rose, principally in Bank of Communications (‘BoCom’) as a result of balance sheet growth and increased fee income, partly offset by higher operating expenses and a rise in loan impairment charges. At 31 December 2013, we performed an impairment review of our investment in BoCom and concluded that it was not impaired at the year end, based on our value in use calculation (see note 24 in the Annual Report and Accounts 2013 for further details). In future years, the value in use will remain relatively stable if the current calculation assumptions remain broadly unchanged. However, it is expected that the carrying amount will increase in 2014 due to retained profits earned by BoCom. At the point where the carrying amount exceeds the value in use, the carrying amount would be reduced to equal value in use, with a corresponding reduction in income, unless the market value has increased to a level above the carrying amount. 11. Tax expense The tax expense in the consolidated income statement comprises:
Year ended 31 December
2013
Year ended 31 December
2012 HK$m HK$m Current income tax – Hong Kong profits tax 8,479 7,790 – Overseas taxation 8,158 10,428 Deferred taxation (936) (208)
15,701 18,010 The effective rate of tax for 2013 was 10.8% compared with 16.6% in 2012, reflecting the non-taxable gains on the reclassification of Industrial Bank as a financial investment and the Ping An disposal.

The Hongkong and Shanghai Banking Corporation Limited
Additional Information (continued)
- 31 -
12. Dividends
Year ended 31 December 2013
Year ended 31 December 2012
HK$ HK$ per share HK$m per share HK$m
Ordinary dividends paid – fourth interim dividend in respect of the previous
financial year, approved and paid during the year 0.85 20,000 0.83 10,000 – first interim dividend paid 0.38 9,000 0.58 7,500 – second interim dividend paid 0.38 9,000 0.41 7,500 – third interim dividend paid 0.38 9,000 0.40 7,500
1.99 47,000 2.22 32,500 The Directors have declared a fourth interim dividend in respect of the financial year ended 31 December 2013 of HK$15,000m (HK$0.44 per ordinary share). 13. Loans and advances to customers At
31 December 2013
At 31 December
2012 HK$m HK$m Gross loans and advances to customers 2,678,739 2,358,814 Impairment allowances: – Individually assessed (5,007) (5,245) – Collectively assessed (4,494) (4,526) (9,501) (9,771) Net loans and advances to customers 2,669,238 2,349,043 Allowances as a percentage of gross loans and advances to customers: – Individually assessed 0.19% 0.22% – Collectively assessed 0.17% 0.19% Total allowances 0.36% 0.41% 14. Impairment allowances against loans and advances to customers Individually
assessed allowances
Collectively assessed
allowances Total HK$m HK$m HK$m At 1 January 2013 5,245 4,526 9,771 Amounts written off (856) (3,495) (4,351) Recoveries of loans and advances written off in previous years 198 1,089 1,287 Net charge to income statement 809 2,602 3,411 Unwinding of discount of loan impairment (51) (77) (128) Exchange and other adjustments (338) (151) (489) At 31 December 2013 5,007 4,494 9,501

The Hongkong and Shanghai Banking Corporation Limited
Additional Information (continued)
- 32 -
15. Overdue and rescheduled loans and advances to customers The geographical information shown below has been classified by the location of the principal operations of the subsidiary or, in the case of the Bank, by the location of the branch responsible for advancing the funds. Hong Kong Rest of Asia-Pacific Total HK$m %1 HK$m %1 HK$m %1 At 31 December 2013 Gross amounts which have been overdue with
respect to either principal or interest for periods of
– more than three months but less than six months 402 0.0 1,836 0.2 2,238 0.1
– more than six months but less than one year 223 0.0 1,300 0.1 1,523 0.1
– more than one year 1,956 0.1 2,449 0.3 4,405 0.2 2,581 0.1 5,585 0.6 8,166 0.4
Individually assessed impairment allowances made in respect of amounts overdue (1,132) (2,698) (3,830)
Rescheduled loans and advances to customers 464 0.0 1,928 0.2 2,392 0.1 At 31 December 2012
Gross amounts which have been overdue with respect to either principal or interest for periods of
– more than three months but less than six months 288 0.0 1,733 0.2 2,021 0.1
– more than six months but less than one year 166 0.0 1,283 0.1 1,449 0.1
– more than one year 1,856 0.1 2,828 0.3 4,684 0.2 2,310 0.1 5,844 0.6 8,154 0.4 Individually assessed impairment allowances
made in respect of amounts overdue (895) (3,008) (3,903) Rescheduled loans and advances to customers 565 0.0 2,781 0.3 3,346 0.1 1. Percentages shown as a proportion of gross loans and advances to customers
The Hongkong and Shanghai Banking Corporation Limited
Additional Information (continued)
- 33 -
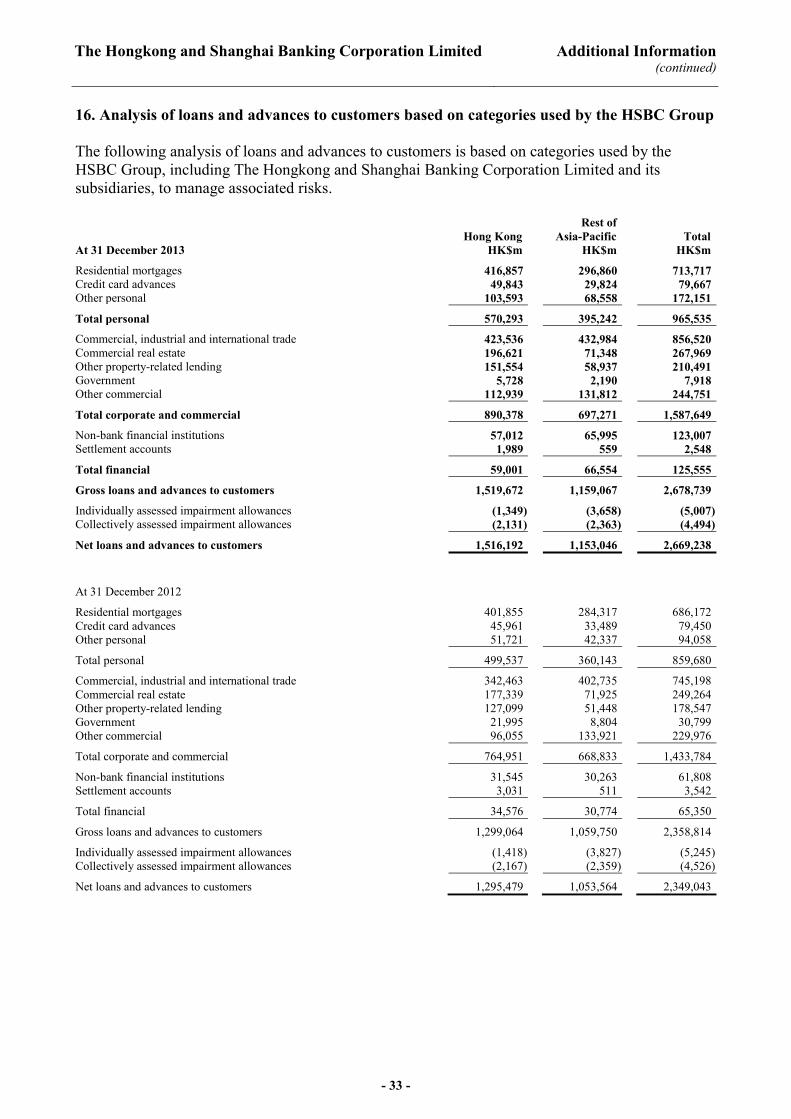
16. Analysis of loans and advances to customers based on categories used by the HSBC Group The following analysis of loans and advances to customers is based on categories used by the HSBC Group, including The Hongkong and Shanghai Banking Corporation Limited and its subsidiaries, to manage associated risks. Rest of Hong Kong Asia-Pacific Total At 31 December 2013 HK$m HK$m HK$m Residential mortgages 416,857 296,860 713,717 Credit card advances 49,843 29,824 79,667 Other personal 103,593 68,558 172,151 Total personal 570,293 395,242 965,535 Commercial, industrial and international trade 423,536 432,984 856,520 Commercial real estate 196,621 71,348 267,969 Other property-related lending 151,554 58,937 210,491 Government 5,728 2,190 7,918 Other commercial 112,939 131,812 244,751 Total corporate and commercial 890,378 697,271 1,587,649 Non-bank financial institutions 57,012 65,995 123,007 Settlement accounts 1,989 559 2,548 Total financial 59,001 66,554 125,555 Gross loans and advances to customers 1,519,672 1,159,067 2,678,739 Individually assessed impairment allowances (1,349) (3,658) (5,007) Collectively assessed impairment allowances (2,131) (2,363) (4,494) Net loans and advances to customers 1,516,192 1,153,046 2,669,238
At 31 December 2012 Residential mortgages 401,855 284,317 686,172 Credit card advances 45,961 33,489 79,450 Other personal 51,721 42,337 94,058 Total personal 499,537 360,143 859,680 Commercial, industrial and international trade 342,463 402,735 745,198 Commercial real estate 177,339 71,925 249,264 Other property-related lending 127,099 51,448 178,547 Government 21,995 8,804 30,799 Other commercial 96,055 133,921 229,976 Total corporate and commercial 764,951 668,833 1,433,784 Non-bank financial institutions 31,545 30,263 61,808 Settlement accounts 3,031 511 3,542 Total financial 34,576 30,774 65,350 Gross loans and advances to customers 1,299,064 1,059,750 2,358,814 Individually assessed impairment allowances (1,418) (3,827) (5,245) Collectively assessed impairment allowances (2,167) (2,359) (4,526) Net loans and advances to customers 1,295,479 1,053,564 2,349,043

The Hongkong and Shanghai Banking Corporation Limited
Additional Information (continued)
- 34 -
16. Analysis of loans and advances to customers based on categories used by the HSBC Group (continued) In November 2013 we acquired the Hong Kong and Singapore branches of HSBC Private Bank (Suisse) SA, including customer loans of HK$54bn and HK$28bn respectively, largely in other personal lending. Excluding this, loans and advances to customers in Hong Kong and Rest of Asia-Pacific increased by HK$167bn, or 13%, and HK$71bn, or 7%, respectively. The increase in Hong Kong was largely attributable to growth in corporate and commercial lending of HK$122bn, reflecting higher demand primarily in international trade and other property-related lending. In the Rest of Asia-Pacific, growth was offset by foreign exchange translation effects of HK$52bn. The underlying increase of HK$123bn was mainly from growth in corporate and commercial lending of HK$57bn, notably in Singapore and mainland China. Residential mortgage lending increased by HK$27bn, notably in mainland China and Australia. Total financial lending increased by HK$38bn following a change in the way GB&M manages repo and reverse repo activities, which were previously being managed in a trading environment. During the year, these activities were organised into trading and non-trading portfolios, which resulted in an increase in the amount of reverse repos classified as ‘Loans and advances to customers’ and a decline in the amount classified as ‘Trading assets’ at 31 December 2013, compared with previous reporting periods. 17. Other assets At At 31 December 31 December 2013 2012 HK$m HK$m Current taxation recoverable 2,034 1,029 Assets held for sale 4,476 48,280 Prepayments and accrued income 3,578 3,823 Accrued interest receivable 15,898 14,992 Acceptances and endorsements 34,239 31,965 Other 88,714 86,964 148,939 187,053 Assets held for sale at 31 December 2012 included our investment in Ping An of HK$39,813m.

The Hongkong and Shanghai Banking Corporation Limited
Additional Information (continued)
- 35 -
18. Customer accounts
At 31 December
2013
At 31 December
2012 HK$m HK$m Current accounts 862,138 831,256 Savings accounts 2,246,618 2,063,565 Other deposit accounts 1,145,996 980,063 4,254,752 3,874,884 Customer accounts increased by HK$380bn, or 10%, during 2013, of which HK$151bn and HK$77bn respectively were attributable to the acquisition of the Hong Kong and Singapore branches of HSBC Private Bank (Suisse) SA. Excluding this, customer accounts in Hong Kong increased by HK$155bn, or 6%. In the Rest of Asia-Pacific, customer accounts decreased by HK$3bn due to the depreciation of many Asian currencies against the Hong Kong dollar, offset by growth notably in mainland China, Australia and India. The group’s advances-to-deposits ratio increased to 62.7% at 31 December 2013, from 60.6% at 31 December 2012, as more of the commercial surplus was deployed to customer lending. 19. Other liabilities and provisions
At 31 December
2013
At 31 December
2012 HK$m HK$m Accruals and deferred income 26,021 24,705 Liabilities held for sale – 4,811 Provisions for liabilities and charges 1,723 2,144 Acceptances and endorsements 34,239 31,965 Share-based payment liability to HSBC Holdings plc 2,303 2,560 Other liabilities 24,523 28,606 88,809 94,791 20. Contingent liabilities and commitments
At 31 December
2013
At 31 December
2012 HK$m HK$m Contract amount: Contingent liabilities 254,799 225,828 Commitments 1,701,733 1,604,179 1,956,532 1,830,007

The Hongkong and Shanghai Banking Corporation Limited
Additional Information (continued)
- 36 -
21. Capital adequacy The following tables show the capital ratios, risk weighted assets and capital base as contained in the ‘Capital Adequacy Ratio’ return required to be submitted to the Hong Kong Monetary Authority (‘HKMA’) by The Hongkong and Shanghai Banking Corporation Limited on a consolidated basis that is specified by the HKMA under the requirements of section 3C(1) of the Banking (Capital) Rules. On 1 January 2013, the HKMA implemented the first phase of the Basel III capital framework in Hong Kong. The capital disclosures for December 2013 under Basel III are, therefore, not directly comparable with the disclosures for December 2012 prepared under the Basel II basis. The Bank and its banking subsidiaries maintain a regulatory reserve to satisfy the provisions of the Banking Ordinance and local regulatory requirements for prudential supervision purposes. At 31 December 2013, the effect of this requirement is to restrict the amount of reserves which can be distributed to shareholders by HK$22,563m (31 December 2012: HK$19,426m). There are no relevant capital shortfalls in any of the group’s subsidiaries at 31 December 2013 (31 December 2012: Nil) which are not included in its consolidation group for regulatory purposes.
2013 2012 % % Capital ratios Common Equity Tier 1 (CET1) ratio 14.1 – Tier 1 ratio 14.1 – Total ratio 15.2 – Core ratio – 13.7 Capital adequacy ratio – 14.3 Risk weighted assets by risk type HK$m HK$m Credit risk 1,978,266 1,455,675 Counterparty credit risk 95,603 81,409 Market risk 134,035 116,911 Operational risk 274,450 250,139 2,482,354 1,904,134 Risk-weighted assets for credit risk increased during 2013, mainly from changes introduced by Basel III, including the risk weighting of a portion of certain exposures that were previously deducted in full from capital. Risk-weighted assets also increased from loan growth, adverse internal rating changes for both corporate and sovereign exposures and external methodology changes on sovereign exposures. The following table sets out the composition of the group's capital base under Basel III at 31 December 2013. The position at 31 December 2013 benefits from transitional arrangements which will be phased out. The table also shows the pro-forma Basel III end point basis position once all transitional arrangements have been phased out based on the Transition Disclosures Template. It should be noted that the pro-forma Basel III end point basis position takes no account of, for example, any future profits or management actions. In addition, the current regulations or their application may change before full implementation. Given this, the final impact on the group's capital ratios may differ from the pro-forma position, which is a mechanical application of the current rules to the balance sheet at 31 December 2013; it is not a projection. On this pro-forma basis, the group's CET1 ratio is 10.4%, which is above the Basel III minimum requirement, including the capital conservation buffer.

The Hongkong and Shanghai Banking Corporation Limited
Additional Information (continued)
- 37 -
21. Capital adequacy (continued) At 31 December Basel III end 2013 point basis HK$m HK$m Common Equity Tier 1 (‘CET1’) capital Shareholders’ equity 436,529 436,529
Shareholders’ equity per balance sheet 480,809 480,809 Revaluation reserve capitalisation issue (1,454) (1,454) Unconsolidated subsidiaries (42,826) (42,826)
Non-controlling interests 24,464 24,464 Non-controlling interests per balance sheet 41,415 41,415 Non-controlling interests in unconsolidated subsidiaries (4,237) (4,237) Portion not eligible for inclusion in CET1 capital (12,714) (12,714)
Regulatory deductions to CET1 capital (109,888) (201,807) Valuation adjustments (2,473) (2,473) Goodwill and intangible assets (15,943) (15,943) Deferred tax assets net of deferred tax liabilities (2,350) (2,350) Cash flow hedging reserve (197) (197) Changes in own credit risk on fair valued liabilities (1,117) (1,117) Defined benefit pension fund assets (110) (110) Significant capital investments in unconsolidated financial sector entities (875) (106,981) Property revaluation reserves (50,073) (50,073) Regulatory reserve (22,563) (22,563) Excess AT1 deductions (14,187) –
Total CET1 capital 351,105 259,186 Additional Tier 1 (‘AT1’) capital Total AT1 capital before regulatory deductions 38,866 2,331
Perpetual non-cumulative preference shares 30,651 – Non-controlling interests eligible for inclusion in AT1 capital 8,215 2,331
Regulatory deductions to AT1 capital (38,866) – Significant capital investments in unconsolidated financial sector entities (53,053) – Excess AT1 deductions 14,187 – Total AT1 capital – 2,331
Total Tier 1 capital 351,105 261,517
Tier 2 capital Total Tier 2 capital before regulatory deductions 82,915 43,755
Perpetual cumulative preference shares 8,413 – Cumulative term preferences shares 8,141 – Perpetual subordinated debt 9,346 – Term subordinated debt 19,463 6,203 Property revaluation reserves 23,187 23,187 Impairment allowances and regulatory reserve eligible for inclusion in Tier 2 capital 13,519 13,519 Non-controlling interests eligible for inclusion in Tier 2 capital 846 846 Regulatory deductions to Tier 2 capital (55,910) (2,857) Significant capital investments in unconsolidated financial sector entities (55,910) (2,857) Total Tier 2 capital 27,005 40,898
Total capital 378,110 302,415 A more detailed breakdown of the capital position on these bases will be available in the Regulatory Disclosures section of our website www.hsbc.com.hk . A press release will be issued to announce the availability of this information.

The Hongkong and Shanghai Banking Corporation Limited
Additional Information (continued)
- 38 -
21. Capital adequacy (continued) At 31 December 2012 Core capital: HK$m Share capital per balance sheet 58,969
Revaluation reserve capitalisation issue (1,454) Paid-up ordinary share capital 57,515 Paid-up irredeemable non-cumulative preference shares 51,570 Reserves per balance sheet 378,430
Proposed dividend (20,000) Unconsolidated subsidiaries (40,088) Cash flow hedging reserve (210) Regulatory reserve (19,426) Reserves arising from revaluation of property and unrealised gains on available-for-sale equities and debt securities
(86,111)
Unrealised gains on equities and debt securities designated at fair value (20) Own credit spread (218)
Total reserves included in core capital 212,357 Non-controlling interests per balance sheet 35,679
Non-controlling interests in unconsolidated subsidiaries (3,478) Regulatory adjustments to non-controlling interests (3,291)
Non-controlling interests 28,910 Goodwill, intangible assets and valuation adjustments (21,191)
50% of unconsolidated investments (67,692) 50% of securitisation positions and other deductions (16)
Deductions (88,899) Total core capital 261,453 Supplementary capital:
Paid-up irredeemable cumulative preference shares 16,510 Perpetual subordinated debt 9,355 Paid-up term preference shares 15,115 Term subordinated debt 16,418 Property revaluation reserves 7,977 Unrealised gains on available-for-sale equities and debt securities 2,534 Unrealised gains on equities and debt securities designated at fair value 9 Regulatory reserve 2,333 Collective impairment allowances 496 Excess impairment allowances over expected losses 8,400
Supplementary capital before deductions 79,147 50% of unconsolidated investments (67,692)
50% of securitisation positions and other deductions (16) Deductions (67,708) Total supplementary capital 11,439 Capital base 272,892

The Hongkong and Shanghai Banking Corporation Limited
Additional Information (continued)
- 39 -
22. Accounting policies The accounting policies and methods of computation adopted by the group for this document are consistent with those described on pages 45 to 62 of the 2012 Annual Report and Accounts. A number of new and revised Hong Kong Financial Reporting Standards have become effective in 2013. None has a material impact on the group. 23. Events after the balance sheet date There have been no events after the balance sheet date that would require disclosure in this document. 24. Statutory accounts The information in this document is not audited and does not constitute statutory accounts. Certain financial information in this document is extracted from the financial statements for the year ended 31 December 2013, which were approved by the Board of Directors on 24 February 2014 and will be delivered to the Registrar of Companies and the HKMA. The Auditors expressed an unqualified opinion on those financial statements in their report dated 24 February 2014. The Annual Report and Accounts for the year ended 31 December 2013, which include the financial statements, can be obtained on request from Communications (Asia), The Hongkong and Shanghai Banking Corporation Limited, 1 Queen’s Road Central, Hong Kong, and will be made available on our website: www.hsbc.com.hk . A press release will be issued to announce the availability of this information. 25. Ultimate holding company The Hongkong and Shanghai Banking Corporation Limited is an indirectly-held, wholly-owned subsidiary of HSBC Holdings plc. Media enquiries to: Malcolm Wallis Telephone no: + 852 2822 1268 Gareth Hewett Telephone no: + 852 2822 4929