Embed Size (px)
Citation preview

THE HOURS OF WORK RESPONSE OF MARRIED COUPLES:TAXES AND THE EARNED INCOME TAX CREDIT
Nada Eissa Public Policy Institute and Department of Economics
Georgetown University and NBER
Hilary Hoynes Department of Economics
University of California, Davis and NBER
April 2004
We are grateful to Alan Auerbach, Ken Chay, David Card, Steve Davis, Stacy Dickert-Conlin, Andrew Hildreth,Tom MaCurdy, Bruce Meyer, Steve Rivkin; to participants at various seminars, conferences and the CESifo SummerInstitute; and to an anonymous referee for comments and suggestions. Darren Lubotsky and Doug Schwalmprovided excellent research assistance. Hoynes received financial support from National Institute for Child Healthand Human Development, and the Department of Health and Human Services. Eissa received financial supportfrom the Institute for Industrial Relations at U.C. Berkeley. Computing support was provided by the EconometricsLaboratory at U.C. Berkeley.
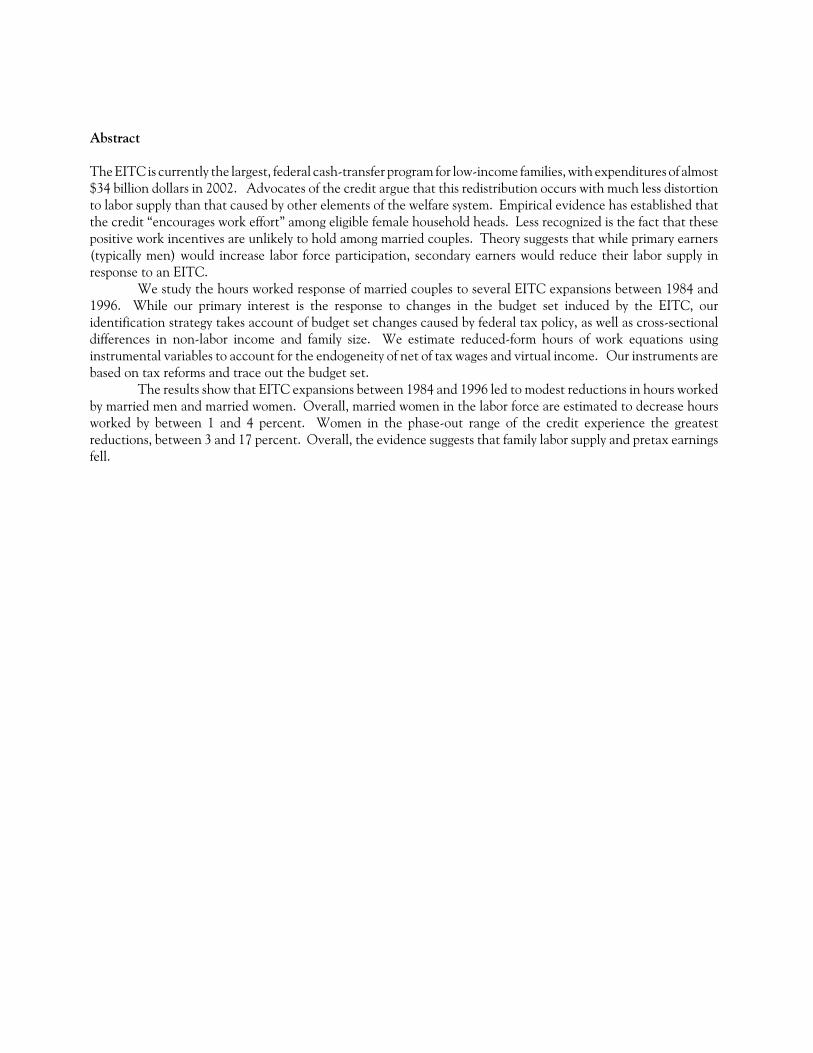
Abstract
The EITC is currently the largest, federal cash-transfer program for low-income families, with expenditures of almost$34 billion dollars in 2002. Advocates of the credit argue that this redistribution occurs with much less distortionto labor supply than that caused by other elements of the welfare system. Empirical evidence has established thatthe credit “encourages work effort” among eligible female household heads. Less recognized is the fact that thesepositive work incentives are unlikely to hold among married couples. Theory suggests that while primary earners(typically men) would increase labor force participation, secondary earners would reduce their labor supply inresponse to an EITC.
We study the hours worked response of married couples to several EITC expansions between 1984 and1996. While our primary interest is the response to changes in the budget set induced by the EITC, ouridentification strategy takes account of budget set changes caused by federal tax policy, as well as cross-sectionaldifferences in non-labor income and family size. We estimate reduced-form hours of work equations usinginstrumental variables to account for the endogeneity of net of tax wages and virtual income. Our instruments arebased on tax reforms and trace out the budget set.
The results show that EITC expansions between 1984 and 1996 led to modest reductions in hours workedby married men and married women. Overall, married women in the labor force are estimated to decrease hoursworked by between 1 and 4 percent. Women in the phase-out range of the credit experience the greatestreductions, between 3 and 17 percent. Overall, the evidence suggests that family labor supply and pretax earningsfell.

1 Federal spending on Temporary Assistance to Needy Families (TANF), which block grants Aid to Families with DependentChildren (AFDC), is fixed at about 16 billion dollars per year through the year 2001 (U.S. House of Representatives 1996).2This feature of the transfer has implications for the interpretation of the labor supply responses. We discuss this later in thepaper.
-1-
1. Introduction
Low-income transfer policy in the United States has undergone a radical transformation in the past 15 years.
Assistance to the needy (traditional welfare) is no longer an entitlement without conditions, but is instead temporary
assistance with work requirements. More generally, the changes can be characterized as a shift from out-of-work
benefits to in-work benefits. This shift to "Making-Work-Pay" is not limited to the United States, however. A
number of countries have adopted policies to enable work by lower-income families, including the United Kingdom,
Canada, Finland and New Zealand (Blundell and Hoynes, forthcoming; Duncan, 2003). A number of other
countries yet are considering making-work-pay policies (Denmark, Australia).
In the U.S., in-work benefits for low-income families are provided largely through the Earned Income Tax
Credit (EITC). In a relatively short period of time, the EITC has been transformed from a very small program to
become the largest cash-transfer program for lower-income families with children. About 20 million families are
projected to have benefitted from the EITC in 2002, at a total cost to the federal government of nearly 34 billion
dollars (Internal Revenue Service, 2003).1 By contrast, only 7 million families received the EITC in 1986, at a total
cost of 2 billion dollars.
The design of the EITC is unusual and includes 3 regions: phase-in, flat and phase-out. The credit is a pure
earnings subsidy in the phase-in region. Workers continue to receive the maximum credit over some range of
earnings, after which the credit is gradually phased-out. In 2002, a family with two children would have received
a 40 percent subsidy rate per dollar earned, and a 21 percent phase-out rate on income up to $30,000. Families with
one child had a less generous credit schedule. Although the credit may be received as part of a worker’s regular
paycheck, only a very small share of taxpayers avail themselves of that option, choosing instead to receive the
transfer in the form of a lump sum payment when annual taxes are filed.2
Advocates of the credit argue that redistribution occurs with much less distortion to labor supply than that
caused by other elements of the welfare system. In particular, the credit is said to encourage labor force
participation. Critics, however, point to the marginal tax rates in the phase-out of the credit to argue that the credit
(when combined with federal, state and payroll taxes) can impose very high marginal tax rates that may substantially
reduce hours worked.
In this paper, we examine the impact of the EITC on the labor supply of married couples. This group is

-2-
particularly interesting for several reasons. First, the popular view that the credit “encourages work effort” is unlikely
to hold among married couples. Primary earners (typically men) may slightly increase labor force participation, but
most secondary earners in recipient families are expected to reduce their labor supply. In fact, the EITC causes the
budget constraint faced by many secondary earners to look strikingly similar to that faced by welfare (AFDC/TANF)
recipients. In addition, empirical research suggests that the reduction in labor supply may be substantial for affected
groups. That work finds that labor supply of secondary earners, typically married women, is particularly sensitive
to taxes [Triest 1992]. Finally, these incentives affect a significant portion of the EITC population: in 1994 one-
third of all recipients and about 40 percent of the phase-out population are married couples [General Accounting
Office (GAO) 1996].
In earlier work, we found that EITC expansions over the past decade increased the likelihood of married
men’s labor participation only slightly but reduced the likelihood of married women’s labor force participation by over
a full percentage point (Eissa and Hoynes 2004). In this paper, we extend that work and examine the impact of the
EITC on the hours worked of married couples. We use Current Population Survey data from 1984-1996 which
allows us to examine the expansions in the EITC in 1986, 1990, and 1993. Whereas our primary interest is in the
response to changes in the budget set induced by the EITC, our estimation strategy takes account of budget set
changes caused by federal tax policy, and cross-sectional variation in income and family size.
The problems of estimating the impact of taxes on labor supply are well known in the literature, and include
the joint determination of hours worked and tax rates. We estimate instrumental variables models to address the
endogeneity of the net-of-tax wage to labor supply. Our instruments trace the budget set and take advantage of both
time (tax reform) variation and cross-sectional (non-labor income and family size) variation in the tax schedule.
As a preliminary analysis, we evaluate the impact of the EITC expansion using quasi-experimental methods where
we compare changes in labor supply among EITC eligible and ineligible groups.
This paper makes two important contributions. First, while a number of papers have evaluated the EITC’s
effect on the labor supply of single women, few have examined the labor supply decisions of married couples using
tax reform variation (see the review in Hotz and Scholz 2003). Second, the paper also contributes to the empirical
labor supply literature by using a new instrument based on tax reforms that capture (changes to) the individual’s
entire budget.
Our main estimates are based on a sample of married couples with less than 12 years of schooling, chosen
because they are most likely to be affected by the EITC. In 1996, almost 60 percent of less-educated married couples

3Children must be under age 19-or 24 if a full-time student-, or permanently disabled and must reside with the taxpayer for morethan half the year.
-3-
with children were eligible for the EITC. By comparison, only 20 (10) percent of couples with 12 (more than 12)
years of schooling were eligible for the EITC. Our findings are consistent with existing evidence showing that
married men’s labor supply is not responsive to taxes whereas their spouses’ labor supply is moderately responsive
to taxes. For married women, the estimated elasticity of hours worked with respect to the net-of-tax wage is
between 0.1 and 0.4.
Our simulations show that EITC expansions between 1984 and 1996 led to modest reductions in hours
worked by married men and married women. Overall, married women in the labor force are estimated to decrease
work by between 1 and 4 percent. Women in the phase-out range of the credit experience the greatest reductions,
between 3 and 17 percent. Overall, the evidence suggests that family labor supply and pretax earnings fell.
The remainder of the paper is as follows. Section 2 describes relevant features of the EITC, reviews the
existing literature and discusses the expected effects of the credit on family labor supply. Section 3 outlines our
empirical methodology. Our data are summarized in Section 4. Results are presented in Sections 5 and 6. We
conclude in section 7.
2. Background
2.1 The EITC and the Federal Income Tax
The EITC provides transfers primarily to working families with children. Eligibility and the amount of the
credit received depend on total family earnings and, since 1990, the number of children in the family3. The design
of the EITC includes 3 regions: phase-in, flat and phase-out. The credit is a pure earnings subsidy in the phase-in
region. Workers continue to receive the maximum credit over some range of earnings, after which the credit is
gradually phased-out. In 2002, a family with one (two) children would have received a 34 (40) percent subsidy rate
per dollar earned up to a maximum credit of $2,547 ($4,204), and a 16 (21) percent phase-out rate on income up
to $30,200 ($33,150).
The credit is refundable so that a taxpayer with no federal tax liability, for example, would receive a tax
refund from the government for the full amount of the credit. Taxpayers may also receive the credit throughout
the year with their paychecks; but in 1989, less than one-half of 1 percent of all EITC recipients availed themselves
of this early payment option [GAO 1992]. Consequently, most recipients receive the credit as a single lump sum
payment when annual taxes are filed.

4The EITC was first indexed to inflation in 1987.
-4-
The EITC began in 1975 as a modest program aimed at offsetting the social security payroll tax for
low-income families with children. Since its introduction the credit was little changed, increasing from $400 to $500
(nominal dollars) by 1985 at its maximum level. Following the 1986 and subsequently the 1993 expansion, the
EITC has become the largest cash transfer program for low-income families with children at the federal level. By
2000, total EITC expenditures (tax expenditures and direct outlays) amounted to about 30 billion dollars.
Our data cover the period 1984-1996 and our estimation strategy exploits changes to the budget sets of
lower-income families with children due to the 1986, 1990 and the 1993 tax acts. To outline the major features
of the tax changes, Table 1 presents the parameters of the EITC and other federal income tax parameters from 1984
to 1997. The table highlights the dramatic changes to the federal income tax schedule over the period. In 1984,
the federal (non EITC) tax schedule consisted of 15 brackets, with marginal rates ranging from 0 to 50 percent. It
now stands at 5 rates, ranging from 15 percent to nearly 40 percent. The table also highlights the central role of
the EITC in altering the shape of the tax schedule.
The real value of the EITC increased only modestly in the early years and was mostly due to inflation4. The
1987 expansion of the EITC, passed as part of the Tax Reform Act of 1986 (TRA86), represents the first major
expansion of the EITC. TRA86 increased the subsidy rate for the phase-in of the credit from 11 percent to 14
percent and increased the maximum income to which the subsidy rate was applied from $5,000 to $6,080. This
resulted in an increase in the maximum credit from $550 to $851 ($788 in 1986 dollars). The phase-out rate was
reduced from 12.22 percent to 10 percent. The higher maximum credit and the lower phase-out rate combined to
expand the phase-out region from $11,000 in 1986 to $18,576 by 1988.
The positive impact of the EITC expansion on the tax liability of eligible taxpayers was reinforced by other
elements of TRA86. TRA86 increased the standard deduction for taxpayers filing jointly from $3670 in 1986
(included in the zero bracket) to $5000 in 1988. TRA86 further reduced the tax liability of taxpayers with children
by increasing the deduction per dependent exemption from $1080 in 1986 to $1950 in 1988. Finally, the tax
schedules were changed, which led to increases in marginal tax rates for some married couples and reductions for
others.
The Omnibus Budget Reconciliation Act of 1990 (OBRA90) further expanded the EITC for all eligible
families, and introduced a different EITC schedule for families with two or more children. The phase-in rate of the
EITC was increased from 14 percent to 18.5 for taxpayers with one-child and 19.5 percent for taxpayers with more
children. OBRA90 also generated a larger (nominal and real) increase in the maximum benefit, phased in over 3

-5-
years.
The largest single expansion over this period was contained in the Omnibus Reconciliation Act of 1993
(OBRA93) legislation. The 1993 expansion of the EITC, phased in between 1994 and 1996, led to an increase in
the subsidy rate from 19.5 percent to 40 percent (18.5 to 34 percent) and an increase in the maximum credit from
$1,511 to $3,556 ($1,434 to $2,152) for taxpayers with two or more children (taxpayers with one child). This
expansion was substantially larger for those with two or more children. The phase-out rate was also raised, from 14
percent to 21 percent (13 to 16 percent) for taxpayers with two or more children (taxpayers with one child).
Overall, the range of the phase-out was expanded dramatically, such that by 1996 a couple with two children would
still be eligible with income levels of almost $30,000.
Figure 1 illustrates the shape of the EITC budget constraint and the effect of these three expansions, by
plotting the value of the EITC (in 1996 dollars) against real family earnings for eligible taxpayers with one child
(Panel A) and two or more children (Panel B). These figures show that the expansion in 1996 (TRA86) increased
the eligible range substantially, while the 1993 expansion (OBRA93) primarily expanded the maximum credit,
through and increase in the subsidy rate. This 1993 expansion was particularly large for families with two or more
children (Panel B). Overall, the subsidy rate increased from 10 percent in 1984 to 34 percent (40 percent) in 1996
for families with one (two or more) children and the real value of the maximum credit increased 185 percent (370
percent) for families with one child (two or more children).
Figure 2 plots the 1996 EITC against annual earnings for three different hourly wage levels. Again, Panel
A presents the schedule for families with 1 child and Panel B presents the schedule for families with two or more
children. The vertical line indicates full time full year hours of work (2080 hours). Families earnings minimum wage
($4.75 per hour in 1996) could remain eligible for the credit even with both parents working full time. At an hourly
wage of $10, a family with one earner would be in the phase-out range. The secondary worker, therefore, would
experience first-hour marginal tax rates that include this phase-out rate. At an hourly wage of $20 , the primary
earner in a family with one (two or more) children is eligible until 1200 (1400) hours per year. This result illustrates
the often cited feature of the EITC– it is transferring income to low earnings families which are not necessarily low
wage families.
2.2 Family Labor Supply and the EITC
To evaluate the impact of the EITC on married couples’ labor supply, it is instructive to begin with the impact of

5The hours of work effects are exactly the same as those for single parents.
-6-
the EITC on an unmarried taxpayer. Because the EITC is available only to taxpayers with earned income, standard
labor supply theory predicts that the EITC will encourage labor force participation among single parents. Figure 3
shows how the introduction of an EITC shifts the budget constraint of an otherwise untaxed individual from ADE
to ABCDE. The well-being of a taxpayer who does not work has not changed because the EITC is not available to
a taxpayer with zero earnings. Thus any taxpayer who preferred working before will still prefer working, and some
taxpayers may find that the additional after-tax income from the EITC makes it worth entering the labor force. The
impact of the EITC on the labor force participation of unmarried taxpayers is therefore unambiguously positive.
But theory also predicts that the credit will reduce the number of hours worked by most eligible taxpayers
already in the labor force. While the credit initially increases with income, producing offsetting income and
substitution effects on hours worked, over 70 percent of recipients have incomes in regions in which the credit is
constant (and therefore produces only a negative income effect on labor supply) or is being phased out (producing
negative income and substitution effects). Moreover, the phase-out of the credit alters the budget set in such a way
that some taxpayers with incomes beyond the phase-out region may choose to reduce their hours of work and take
advantage of the credit. Therefore, the EITC’s only unambiguous positive effect on labor supply occurs on the
participation margin.
Among married couples, the effects of the EITC on labor supply are more complicated because even the
labor force participation effect is ambiguous.5 This occurs also because the credit is based on family earnings and
income. The simplest way to show how this effect operates is to consider sequential family labor supply decisions,
with the husband as the primary mover and the wife as the secondary mover. In this model, the effect of the credit
on the labor supply of primary earners is the same as that of single taxpayers. Labor force participation increases
unambiguously. The impact on hours worked is again ambiguous, but for the reasons argued above, will most likely
decline.
Secondary earners, however, receive the EITC even if they remain out of the labor force because of the
husband’s earnings. Suppose, for example, that the husband earns $12,700 (in 2000), thus placing the family at the
beginning of the phase-out region of the credit. If the wife remains out of the labor force, her family receives the
maximum credit of $3,888 if the couple has two children ($2,352 if one child). For each dollar of income she earns,
however, the family’s credit is reduced by 21 cents (about 18 cents if one child). Additionally, she pays the social
security payroll and, possibly, state tax. With marginal tax rates approaching 50 percent, the incentive not to

-7-
participate in the labor force can be quite strong. For these women, the EITC creates a budget set similar to that
faced traditional welfare programs (with a guarantee and high benefit reduction rate), which have been criticized
for generating adverse work incentives. Of course, it is also possible for the wife’s work effort to increase the family’s
credit if the husband’s earnings are in the subsidy region ($6,800 to $9,500 depending on family income), but very
few married couples can be found with such low incomes.
To summarize, secondary earners whose spouses have incomes in the flat to phase-out regions should be
less likely to work and should work fewer hours, while those whose spouses have income in the phase-in region
should be more likely to work with ambiguous effects on hours worked. The net effect on the hours worked of
married mothers is expected to be negative, and the magnitude will depend on the distribution of family income.
Table 2 presents the distribution of families in different regions of the EITC, based on IRS data (top panel), and
Current Population Survey (CPS) data (bottom panel). IRS data show that 73 percent of married EITC recipients
have income in the phase-out range of the credit (compared to 53 percent of single recipients), where they face the
highest marginal tax rates. CPS data show in addition that a substantial share of less-educated couples are eligible
for the EITC (almost 60 percent), and affected by the high marginal tax rates (74 percent of eligible and 43 percent
of all married couples have incomes in the phase-out range of the credit).
Overall, this analysis suggests it is unlikely the EITC will have any positive effect on the labor supply of
secondary earners. In fact, it is unlikely that the EITC will have any positive effect on the labor supply of married
couples because, in addition to the impact on secondary earners, evidence suggests that married men’s participation
and hours worked are not affected by taxes (Heckman 1992,Triest 1992).
2.3 Previous EITC Work
Several literatures are relevant to this study. A substantial amount of work has examined the effects of
federal income taxes and transfer programs on labor market outcomes. Relevant to our work is the empirical
literature on tax and labor supply, as well as the negative income tax (NIT) experiments of the 1970's (see the
surveys by Moffitt 1992, and Moffitt and Kehrer 1981).
Because the EITC changes the budget set in a straightforward manner, its impact on labor supply can be
imputed using static labor supply elasticities from the literature. Several studies taken that approach and used
standard elasticity estimates from the literature [Browning 1995] and the negative income tax experiments [GAO
1993, Hoffman and Seidman 1990, and Holtzblatt et al. 1994] to predict the impact of the credit. Browning

6 One exception is Hoynes (1996) who estimates the effect of AFDC benefits, respectively, on the labor supply of married couples. This work suggests that low-income couples may have higher wage and income elasticities than the overall population of marriedcouples.
-8-
estimates that about half of the taxpayers in the phase-out region of the credit will reduce hours of work by enough
so that their total disposable income declines.
These simulations may be biased if labor supply responsiveness to taxes varies by income or over time.
While no direct evidence supporting this hypothesis exist6, the large increase in participation by married women over
the past 3 decades likely renders the early NIT estimates less applicable to the EITC population. Also, because of
the short duration and limited sites in which the NIT experiments were implemented, extrapolating the NIT results
to the more widely implemented EITC is difficult [see Moffitt and Kehrer 1981].
The most directly relevant work for this study comes from prior studies that have examined the impact of
the EITC. In practice, there is little empirical evidence on the magnitude of the EITC effects for married couples
with children. Several recent studies have examined the labor supply effects of the EITC on single parents [Dickert,
Hauser and Scholz [DHS] 1995, Eissa and Liebman [EL] 1996, Meyer and Rosenbaum [MR] 2000, 2001, Keane
and Moffitt 1998, Ellwood 2000, Hotz, Mullin and Scholz [HMS] 2002 and Grogger (forthcoming)]. As summarized
in the recent review by Hotz and Scholz (2003), these papers consistently find that the EITC increased the labor
force participation of single mothers. Dickert, Hauser and Scholz (1995), Eissa and Hoynes (2004), and Ellwood
(2000) examine the impact on the labor force participation of married couples with children and all find that the
EITC reduces the labor force participation of married women with children. None of these studies examine the
impact of the EITC on the hours worked of married couples.
The literature evaluating expansions to the EITC has generally employed quasi-experimental
(difference-in-differences) methods. Typically, the approach compares the outcomes of an affected group (female
household heads) to the outcomes of a comparison group that is unaffected by the program (childless females/males).
The comparison group generates the counterfactual necessary to evaluate the effects of policy reform by removing
any non-program shocks affecting the outcomes of interest. The validity of the experiment rests on the quality of
the comparison group, which requires the possibly restrictive assumptions that it mimics the behavior of the affected
group.
This method was applied to examine the labor force participation effects of the TRA86 on the labor supply
of female heads (EL), of the 1993 EITC expansion on the labor force participation rates of married women (Eissa
and Hoynes, 2004), and on the EITC expansions in the 1990's on welfare recipients in California (HMS). In

-9-
addition, Meyer and Rosenbaum (2000) use this approach to examine the impacts of many EITC expansions on
female heads.
EL use Current Population Survey (CPS) data to estimate the impact of TRA86. They compare the change
in labor force participation and hours worked by single mothers to that of single women without children, and find
a sizeable labor force participation response of 2.8 percentage points (out of a base of 74.2) but no discernible hours
of work response. In addition, EL report larger responses for women more likely to be eligible for the EITC (i.e. with
less than a high school degree). EH use a similar method to examine the impact of the EITC on married women.
Unlike the incentives for single parents to enter the labor market, the EITC is expected to reduce the labor force
participation of married women because of the additional income it provides to the primary earner (typically the
husband). Their evidence suggests that the EITC does in fact reduce the participation rate of married women.
While the overall effect is modest, there exists substantial heterogeneity in the effect-with the largest reduction
observed among women whose tax rates are highest. Both the EL and EH use policy changes enacted at the federal
level.
Hotz and Scholz (2003) note that a concern arises in isolating the effects of the EITC from other reforms
that occurred at the state level. Beginning in the late 1980's, states began implementing increasing numbers of
demonstration projects that altered the work incentive of welfare eligible families. HMS exploit this source of
variation by examining welfare recipients in four counties participating in welfare demonstration project in
California. In contrast to other work based on survey data, they use administrative data from welfare,
unemployment insurance and tax authorities. HMS also identify the EITC effect somewhat differently. They
exploit the very large increase in credit for families with at least two children relative to families with one child and
compare labor force participation of parents with at least two children to that to parents with one child. Their
findings are dramatic and show an increase in the employment rate of larger families between 6 and 8 percentage
points relative to families with one child. These findings imply a labor force participation elasticity with respect to
net income as high as 1.7.
Overall the evidence based on the difference-in-differences model is consistent and suggests fairly strong
participation effects, especially for female household heads. One limitation of the reduced-form labor force
participation methods (as applied in these papers) is the use of group-level variation in taxes and transfers. This
approach assumes that all relevant wage and income changes are captured by group level variation in family type
and size (presence and number of children) and time. The EITC effect is the relative (to childless) participation

-10-
response of couples with children after the EITC expansion.
Tax reforms typically have heterogenous effects with groups, however. DHS and MR exploit individual
level variation in after tax wages and incomes to estimate the effect of EITC expansions on labor force participation.
DHS use cross-sectional data from the 1990 Survey of Income and Program Participation (SIPP) and estimate a joint
program and labor force participation model, identified by variations in the returns to part-time (or full-time)
employment in different states. They estimate a labor force participation elasticity of 0.35. The major limitation
in their study is the use of cross-sectional data and the potential biases that arise from correlations between
unobserved state characteristics and labor supply incentives or behavior. MR overcome this problem by using time
variation in both federal and state tax and welfare policies. They estimate an econometric model of participation
based on comparisons of utility in and out of the labor market. MR carefully model the set of welfare and tax
systems at the federal and state level, and incorporate the information into their utility model. Using data from the
1985 to 1997 CPS, they estimate that the EITC accounts for about 60 percent of the increase in the employment
of single mothers over the period. Their implied labor force participation elasticities are more moderate than those
of HMS and the lowest educated group in EL but still large (about 0.7).
3. Methods
3.1 "Traditional" Model of Family Labor Supply
In this section, we outline the model of family labor supply used to generate our estimating equations. We
adopt the more common approach to analyzing household labor supply which is based on the unitary model. It is
a simple extension of the standard consumption-leisure choice, and considers the work decisions of two (or more)
household members that maximize joint utility over consumption and individual leisure times.
Our empirical work is based on a simpler version of this framework. We assume a sequential, two-earner
model in which the primary earner (generally the husband) makes his work decision independent of the secondary
earner. The second mover then makes her labor supply decision by maximizing utility, taking account of the primary
earner’s earnings and other- household income. This model introduces asymmetry and drops the interdependence
of the spouses’ utilities: the wife’s labor supply has no effect on the husband’s decision while the husband’s work
affects the wife’s decision, but only through family income. These restrictions lead to the following pair of labor
supply equations:
H1= h1 (w1, Y , X) and H2= h2 (w2, Y + w1H1 , X) (1)

7CPS data show that less-educated women are predominantly secondary earners when measured by the share of family earningsthey contribute. Overall, about 90 percent earn less than their husbands, while among working couples, that figure is 85 percent
-11-
where H1 and H2 represent hours worked by the husband and wife at wages w1 and w2 respectively; Y is family non-
labor income and X family characteristics. This model, which has been widely used in the empirical literature,
implies the husband does not share in the wife’s earnings (although they share her unearned income).
The framework allows for consideration of non-participation (in the labor force) and as well as taxes. It
is especially useful in empirical tax analysis because the assumption that husband’s work decision is independent
of the wife’s decision identifies exogenous variation in tax rates for secondary earners (wives)7. We discuss the
methods used to estimate the labor supply equations (1) in the next two sections.
3.2 Empirical Framework
Estimating labor supply models faces several difficulties. In the context of taxation, these include the joint
determination of labor supply and taxes with non-proportional income tax schedules, unobserved tastes for work
that affect the observed wage, and measurement error in both the marginal tax rate and the wage. Labor supply
estimates based on Ordinary Least Squares can therefore be severely biased.
Several methods have been used to address these problems. The most complete method to estimating labor
supply responses is driven by the presence of several features of labor supply and taxes. The nonlinear budget set
approach addresses several challenges noted extensively in the literature, including the presence of kink points and
unobserved heterogeneity in work preferences. We should point out that while constraints imposed to make
nonlinear budget set models tractable appear to be binding and to heavily influence the results (Heckman 1982,
MaCurdy et al. 1990), the expansions of the EITC and other tax policy reforms may actually allow us to relax some
of the binding restrictions.
Because identification is tenuous, we do not estimate a nonlinear budget set model. Instead, in this paper
we estimate reduced form hours equations which depend on net of tax wages and virtual income. We estimate
instrumental variables models to correct for the joint determination of hours worked and tax rates. Our instruments
trace out the budget set and take advantage of tax reforms, and also variation in the tax schedule families face given
their non-labor income and number of children. As a preliminary analysis, we evaluate the impact of the EITC
expansion using quasi-experimental methods where we compare changes in labor supply among EITC eligible and
ineligible groups.

-12-
3.2.1 Tax Reforms as Quasi Experiments
To describe the overall changes, we begin by examining the impact of the 1993 EITC expansion using a difference-
in-differences method. We compare an affected group (low-income couples with children) to the outcomes of a
comparison group (low income couples without children) that is unaffected by the program. The comparison group
is assumed to purge any non-program shocks affecting the outcomes of interest. This approach represents a natural
starting point for married couples since it has been widely used to evaluate the effect of the EITC on single women.
It can be summarized by the following formulation:
y it = (*gt + 0g +0t + X'it 2 + ,it (2)
where y refers to some measure of labor supply (participation or annual hours worked); 0 g is a fixed (group) effect;
0 t is a common time effect; *gt is the interaction between fixed group and time effect; X represents observable
characteristics; and e an error term. The program effect is measured by ( , the coefficient on the interaction term
*gt . An unbiased estimates of ( requires that that 0 t be common across groups (ensuring that the comparison group
mimics the underlying behavior of the affected group), and that 0 g be fixed over time. In this setup, the impact of
the policy reform is estimated as the relative change in outcomes of the affected group (EITC eligible parents).
In practice, we compare the change in labor supply of married couples with children to the labor supply of
childless married couples following the OBRA93 expansion of the EITC. The identifying assumptions require that
the labor supply of married couples without children are trending similarly to married couples with children; and
that the composition of the two groups remains the same. The composition of the two groups could change in a
number of ways, such as through marriage and childbearing. While EITC expansions altered the incentives to
marry and to have children, empirical evidence suggests relatively small responses on these margins (Dickert and
Houser 2002, Eissa and Hoynes 2000a, Elwood 2000).
The difference between the change in labor supply of eligible husbands (wives) with children and husbands
(wives) with no children is the basic estimate of the EITC effect on participation. Also, by widening the gap
between the first and second child credit, the 1993 expansion created different incentives for families of different
sizes thus allowing an additional degree of variation to identify the EITC effect. Clearly, the validity of the
experiment rests on the quality of the comparison group, which requires the possibly restrictive assumption that its
behavior exactly mimics the non-EITC behavior of couples with children.

8Virtual income is the vertical intercept (e.g. after-tax-income) from the worker’s current budget segment at zero hours of work.
-13-
3.3 Parameterizing EITC and Other Tax Changes
Once in the labor force, we assume the hours worked decision is continuous and therefore depends on the log of
net-of-marginal-tax wage (wnit) and virtual income (yv
it ).8 In particular, our annual hours of work equation is:
Hit = "+Xit$+(1ln(wnit)+(2y
vit+,it (3)
We maintain the secondary earner assumption throughout this analysis. Therefore, the net of tax wages and virtual
income for the married women, are calculated taking into account the actual earnings of the husband. The X
vector includes demographic variables, state labor market variables, and state and time fixed effects.
We use instrumental variables (IV) methods to address the endogeneity of the net wage and income to
hours worked. Instrument sets used previously in the literature include the gross wage and taxable unearned income
(Triest 1987), demographic characteristics such as education, age, home-ownership and region (Flood and MaCurdy,
1993), and tax parameters and demographics (Blundell et al, 1998). Some of these instruments are not convincing.
It is difficult to argue, for example, that transformations of observable characteristics (education or age) are not
correlated with the error in the hours-worked equation. In addition, demographic variables have been rejected as
valid instruments for wages and virtual income because the R2s on the first stage are low (Blomquist 1995).
We propose a new instrument for the net-of-tax wage and income based on the individual’s entire budget
set. Essentially our instrument traces out the income tax schedule that a person faces–given their family size and
nonlabor income. In particular, we calculate the marginal tax rate at $5,000 earnings intervals up to $100,000. The
marginal tax rates are calculated using current year tax law and observed non-labor income and family size. Again,
we maintain the secondary earner assumption and consequently the nonlabor income of the married women
includes the husband’s earnings. These methods essentially trace out the different seqments of the nonlinear budget
set.
In addition, we use a second IV based on statutory income tax parameters, including the EITC tax
parameters, the first federal income tax bracket, and EITC tax parameters interacted with cohort dummies. This
instrument set is motivated by the Blundell et. al. (1998) approach used to evaluate tax reforms in the United
Kingdom. To be valid, these instruments must be correlated with the endogenous variables (net wage and virtual
income), but uncorrelated with the error in the hours-worked equation. The instruments vary by year, family size
(number of children) and the amount of non-labor income. In addition, they are exogenous under the maintained
assumptions in the paper. Nonetheless, to assess their validity, we construct all relevant test statistics in the paper.

9 Saez also finds that the EITC generates substantial bunching for self-employed recipients, but these are excluded from oursample.10We also exclude families with taxable unearned income in excess of 30,000 (in 1995 dollars). This group would not be eligiblefor the EITC in any year during this period. We drop couples where either the husband or wife has hourly earnings less than $2or over $100 per hour (in 1995 dollars) or who derives more than half of their earned income from self-employment.
-14-
IV methods can lead to biased estimates of the wage and income effects if individuals bunch at or near kink
points along the convex budget set. In their evaluation of the effect of tax reforms in the United Kindgom, Blundell
et. al. (2000) address this potential bias by dropping workers near kink points. Empirical evidence from the United
States finds weak evidence bunching by taxpayers along the tax schedule (Liebman 1997, Saez 2000). More
relevant to our study is the finding that "the large jumps in marginal tax rates created by the Earned Income Tax
Credit generate no bunching by wage-earner recipients... "(Saez 2002)9. One potential explanation is that the US
tax schedule is relatively more complicated, making it difficult for taxpayers to locate such points. Consequently,
we do not drop any observations from our sample.
4. Data
The data we use come from the 1985 to 1997 March Current Population Surveys. The March CPS is an annual
demographic file of between 50,000 and 62,000 households. It includes labor market and income information for
the previous year, so the data we have are for tax years 1984 to 1996, a time period covering the three EITC
expansions outlined in Table 1. We choose to begin our analysis just before the TRA86 expansion because it
represents the first major expansion since the EITC was introduced in 1975.
The relevant unit of analysis for this study is the tax-filing unit. The CPS has information on households,
families and individuals, however. We use CPS families to construct tax-filing units; therefore, subfamilies (both
related and unrelated) are allocated to separate tax-filing units from the primary family. We consider any member
of the tax-filing unit who is under the age of 19 (or under 24 and a full-time student) to be a dependent child for
tax purposes. We do not impose the support test for dependents because we do not have enough information to
impose the EITC six-month residency test.
The sample includes married couples residing in the same household, who are between 25 and 54 years old.
We exclude those couples where one spouse was ill or disabled, in the military, or in school full time during the
previous year. We also exclude any couple with negative earned income (due to negative self-employment income),
negative unearned income, or with positive earned income but zero hours of work.10 The resulting sample size, after
pooling all twelve years and including all education groups, is 182,958 observations.

11Married female’s education is highly correlated with their spouse’s education (0.67 in our sample). We experimented withclassifying groups based on the husband’s education and the qualitative results were unchanged
-15-
The main estimates in the paper are based on a sample of couples with less than a high school education,
where the selection is based on the wife’s education. We use this criteria to better select couples that are most likely
to receive the EITC.11 As shown in Table 2, over 60 percent of married couples with less than a high school
education are eligible for the EITC compared to only 20 percent of those with exactly a high school degree.
Restricting the sample to less educated couples reduces the sample size to 22,671 observations.
Table 3 presents summary statistics of the low educated sample of married couples separately by gender and
by family size. The demographic variables used in the analysis are fairly standard and include age, race, education,
number and ages of children, and the state unemployment rate. Summary statistics show that married men with
children are younger, less educated, more likely to be white, and earn lower wages and have less non-labor income
than childless married men without children.
To generate net of tax wages and virtual income, and to construct the instrumental variables, we construct
a tax calculator that simulates federal income and social security payroll taxes. The tax calculator is discussed more
comprehensively in Section 6 below and in Appendix A.
5. Comparison Group Results
To begin, we describe the changes over this period using a quasi-experimental approach. In particular, we
examine the expansion in 1993 (OBRA93) and compare the hours of work of married couples with children to
married couples without children. The CPS sample for this preliminary analysis includes tax years 1989 to 1996,
with 1989-1993 as the pre-OBRA93 period and 1994-1996 as the post-OBRA93 period. Because the majority of
married couples are beyond the phase-in range, we expect that hours should fall for working women with children
relative to those with no children, and that hours should fall more for taxpayers with more than one child. The net
effect on total hours worked depends on the relative size of the responses of participation and hours worked by
workers.
In the case of the EITC, the DD approach is unsuitable for the analysis of hours for several reasons. First,
the EITC schedule generates very different incentives for hours worked depending on family income. Married
women in the phase-in are predicted work more hours, while married women beyond the phase-in are predicted to
work fewer hours. Aggregating these populations therefore conflates the hours effect across different groups.
Moreover, without panel data, we would not be able to distinguish whether responses are shifts across budget

12In addition, we note that the response of working couples requires correcting for any self-selection bias, which in this context, islikely to be exacerbated by the EITC’s effect on the labor force participation decision. Because the differencing approach is notvalid for hours worked, we do not correct for self-selection.13We correct for self-selection into the labor force by standard methods (mills ratio) but find that the correction does not havesubstantive effects on the estimated wage and income elasticities. The selection equation is estimated using full interactionsbetween education, tax year, and birth cohort. As an alternative, we used estimates of the reduced form labor forceparticipation model in Eissa and Hoynes (2004) to generate the Mills ratio. In theory, that model is attractive because it modelsthe EITC’s effect on participation. In practice, identification is tenuous at best since there are no valid exclusion restrictions.
-16-
segments or responses within segments. For these reasons, we only summarize the results of the quasi-experimental
estimation. The results are available on request12.
Controlling for demographics, business cycles and state fixed effects, when we examine unconditional hours
(including workers and nonworkers), we find that women with one child worked 25 additional hours, while women
with at least two children worked 54 fewer hours per year after the 1993 EITC expansion. Overall, family labor
supply (hours worked by husband and wife) rose by about 60 annual hours.
Although the EITC can raise total family labor supply if its effect on the participation decision is stronger
than that on hours worked by workers, the family labor supply results are surprising for a number of reasons. First,
they suggest stronger labor supply responses by men than by women. Second, in Eissa and Hoynes (2004) we find
that only men increased their participation rates and not by enough to dominate the lower participation rates by
women.
The results for the sample of working individuals are even more implausible: they suggest that men worked
up to 100 more hours, while women worked 67 more hours after the EITC expansion. Our explanation for these
results is that childless married couples represent a poor comparison group for couples with children for this exercise.
Figure 4 shows the age distributions of the two groups, and highlights one reason why childless women (and men)
may be poor comparison groups when evaluating the labor supply of married couples.
6. Using Variation in Taxes, Wages and Income
6.1. Annual Hours Worked-Instrumental Variables
In this section, we report IV estimates of the relationship between hours worked, and their after-tax wages
and income. We limit the sample to workers and estimate equation (3) above. The net-of-marginal-tax wage (wn)
and virtual income (yv) are evaluated at observed hours of work13.
Figures 5a and 5b show marginal tax rates in 1984, 1990 and 1996 for the sample of working women and
men, respectively, and illustrate the extensive variation in tax rates. In each figure, we present minimum, mean and
maximum tax rates by (own) gross annual earnings. At a particular earnings point for any given year, marginal tax

14The 10 year birth cohorts are defined as 1930-1939, 1940-1949, 1950-1959 and 1960-1969. Because of the controls for timeand cohort, we do not include any controls for age. The results are not sensitive to alternative specifications of age, time andcohort.15We also estimated models with instruments used in the literature. We found demographic variables (education, education*age)to be substantially weaker in the first stage relative to IV1. The estimates of the wage and income effects were quite unstable inthese specifications, reflecting the weak first stage. We also used gross wages and non-labor income as instruments. These werevery strong in the first stage and were relatively stable and similar to those based on IV1.
-17-
rates vary by family size and non-labor income. For married women, non-labor includes husband’s earnings. We note
two interesting observations in our data. First, tax schedules broadly mimic the combined federal income and payroll
tax schedules in any given year and therefore reflect the changes over time in tax law. By 1996, we observe
substantial changes in marginal tax rates at the bottom of the income distribution. It is this variation that identifies
our labor supply responses. Second, married women’s tax schedules are relatively flat, and their marginal tax rates
are everywhere higher and more dispersed than those of their spouses’ (see Eissa and Hoynes 2000b). This occurs
because we assume that couples file married-joint tax returns and that the wife is the secondary earner in the
household. As a result, married women’s earnings are taxed further up the schedule.
Our main results are presented in Tables 4a and 4b. Table 4a (4b) presents OLS and IV results for the
annual hours worked equation for women (men). We present results for two sets of instruments (IV1 an IV2). IV-
1 includes a vector of marginal tax rates evaluated at $5,000 earnings increments from $0 to $100,000 (column 2).
IV-2 includes EITC parameters and interactions of those tax parameters with birth cohort, and a variable for the
location of the first non-EITC kink in the budget constraint (column 3). All specifications control for the number
of children and preschool children, race, birth cohort (defined over 10 years), state unemployment rate, and time
and state dummies.14 All demographics show the expected signs so we do not refer to them here15.
Consistent with existing empirical labor supply work, our estimated wage and income effects for married
women are greater and more sensitive to specification than those of men. For women, the uncompensated wage
elasticity is between 0.07 (IV-1) and 0.44 (IV-2). The estimated income elasticity is between -0.04 (IV1) and -0.36
(IV2). This range of estimates is relatively tight given the wide range of estimated elasticities for married women
present in the literature. For men, the range of estimates is quite tight and consistent with the existing literature.
The net-wage elasticity is in the range of 0.05 to 0.09.
Tables 4a and 4b also present the F statistic testing the joint significance of the set of instruments from the
first stage regression. For women’s hours worked, IV-1 is more highly correlated with the endogenous variables.
This result is not surprising since IV-1 and IV-2 differ in two important ways. First, IV-2 uses statutory EITC and
tax parameters up to the maximum EITC earnings limit ($30,000 in 1996$) while IV-1 uses marginal tax rates

-18-
evaluated up through earnings of $100,000. Second, IV-2 uses tax parameters and varies only by family size and year
while IV-1 includes husband earnings in the wife’s nonlabor income.
To reconcile the somewhat different magnitudes for the estimates in IV-1 and IV-2 for married women, we
consider each of these differences in turn. To see the first point, consider that the instruments used affect workers
at different points in the distribution. So, if labor supply elasticities of working women vary across the earnings
distribution, we would expect different wage and income estimates.
To explore this, we re-estimate the hours equation by limiting the instrument to lower points in the earnings
distribution (e.g. $60,000, $40,000, $25,000). The results are presented in the top o f Table 5. These results show
that the estimated wage effect progressively increases as we limit IV-1 to lower-earning workers. We refer to these
estimates as local average treatment effects-LATE- (Imbens and Angrist 1994). The wage elasticity (in brackets)
rises to 0.11 while the income effect remains fairly constant at -0.05. Note also that the estimated standard errors
do not change very much across specifications. One explanation for this modest change is that the marginal tax
schedule is fairly proportional at the upper-end of the income distribution. We observe a similar pattern for men’s
hours worked: limiting the instruments to the lower end of the earnings distribution increases the estimated
elasticities (see Appendix Table 1).
Limiting the marginal tax rates to $25,000 in earnings begins to marginally close the gap between the
estimates using IV-1 and IV-2 in the women’s hours worked equations, but a substantial difference remains. Next,
we exclude husband’s earnings when calculating IV-2. These results are shown in the bottom of Table 5. The results
show that excluding husband earnings explains much of the divergence between the two instrument sets. The
estimated wage and income responses become much larger and statistically not different than IV-2 estimates.
While the evidence presented explains the divergence between the estimated hours worked responses under IV-1
and IV-2, we do not conclude from it that one instrument set dominates another. Each set has its advantages and
drawbacks, and we choose to present these results as bounds on the responsiveness of married women’s hours of
work.
6.2. Simulations
To evaluate the effect of the EITC on hours worked we perform simulations of our estimated equations.
Our simulations are based on the 1996 sample of less-educated married couples. We compare predicted hours
worked using the 1996 tax law, to hours worked under different EITC schedules. In particular, we consider two

-19-
alternative simulations. We consider how labor supply would change if the household faces (1) the 1984 EITC
schedule and (2) the 1993 EITC schedule. In each case, we assume that all other parameters remain fixed, including
gross wages, non-labor income, family structure, spouse’s earnings (for the wife), and income taxes. The simulations
are discussed more completely in Appendix B.
Using the tax calculator, we generate after-tax wages and incomes under 1996 law and then under each
alternative scenario. These values are used to predict hours worked, presented in Table 6 for the full sample, and
for two different groupings of married couples: by deciles of the husband’s gross hourly wage distribution and regions
of the 1996 EITC schedule (phase-in, flat, phase-out, above phase-out). The regions of the EITC are assigned using
the 1996 EITC schedule, and are based on actual family earnings and adjusted gross income.
Table 6 (7) presents the simulated hours worked response to the 1984-1996 (1993-1996) EITC expansion,
based on the wage and income responses from IV-1 and IV-2. Because the sample includes working men and
working women, the husband and wife samples are different.
Table 6 shows that the 1993 expansion in the EITC led to declines in hours worked for married men and
women. Men decreased work by between 10 and 32 hours (0.5-1.5 percent) and women decreased work by between
7 and 49 hours (0.4-2 percent). Taking into account the three EITC expansions over the period 1984-1996, Table
7 shows that married men decreased hours by between 1 and 3 percent (15-54 hours) and women decreased hours
by between 1 and 4 percent (11-81 hours).
These rather modest overall effects mask some more substantial responses in subsets of the population.
Tables 6 and 7 also present the simulated change in hours worked by deciles of the husband’s wage distribution and
by location in the 1996 EITC schedule. Table 7 shows that men in the phase-in region worked more hours, while
men in the phase-out worked 87 fewer hours (4.7 percent). Men in the middle of the wage distribution face the
strongest disincentive effects (from the phase-out). Women married to low-wage men reduced their work hours
substantially more than women married to high-wage men. Further, women in the phase-in range worked more
hours while those in the phase-out worked 34-241 fewer hours (3-17 percent) per year.

-20-
7. Conclusions
This paper examines the hours worked response of married couples to the expansions of the earned income tax
credit using Current Population Survey data from 1984-1996, using both a quasi-experimental approach and
instrumental variables estimates of reduced form labor supply methods.
Our main estimates are based on a sample of married couples with less than 12 years of schooling, chosen
because they are most likely to be affected by the EITC. Our results suggest that hours worked by both married men
and women are moderately affected by taxes. The elasticity of hours worked with respect to the net-of-tax wage
is between 0.1 and 0.44 for married women and less than 0.1 for married men. We present evidence that shows the
hours worked elasticities for men and women are larger for lower-earnings individuals.
A large literature has pointed out the strong labor supply disincentives faced by low- income women from
traditional welfare, and recent work has shown that the EITC offsets these distortions. This paper points out that
traditional welfare-type disincentives exist for EITC-eligible married women. In the aggregate, these distortions
are modest. In previous work (Eissa and Hoynes 2004) we estimated that the EITC expansions between 1984 and
1996 reduced the likelihood of married women’s labor force participation by more than a full percentage point.
Here, the results show that EITC expansions between 1984 and 1996 led to modest reductions in hours worked by
married men and married women. Overall, married women in the labor force are estimated to decrease work 11-81
hours (1-4 percent), while married men in the labor force are estimated to work 15-54 fewer hours (1-3 percent).
These modest overall effects, however, mask substantial heterogeneity across the population of married EITC-
eligible families. Women in the phase-out range of the credit experience the greatest reductions, between 3 and
17 percent. Overall, the evidence suggests that family labor supply and pretax earnings fell.
Our results imply that the EITC is effectively subsidizing married mothers to stay at home, and therefore
have implications for the design of the program. We make no value judgement about this feature of the credit. In
fact, empirical evidence in the United States has generated little consensus on the effects of maternal employment
on child outcomes (such as health and education). We note, however, that the EITC incentives for single mothers
are exactly the opposite-i.e. to encourage work.
Advocates in the United States and other countries point to the positive labor supply incentives of work-
subsidy programs. This paper, along with other work in the United States and in the United Kingdom, show that
the employment effects of work subsidies are in fact more complicated, and "uneven across demographic groups"
(Duncan 2003).

-21-
In the United States, differing labor supply incentives can be traced to the joint (as opposed to individual)
income basis of the EITC and the federal income tax system. If the main objective of the EITC is to encourage
work, however, an EITC based on individual earnings is preferred to one based on family earnings.
A system of individual-based transfers raises, however, two serious concerns. The first concern is about its
distributional implications of such a system, as benefits reach higher into the income distribution. The second
concern is cost. An individual-based EITC is estimated to cost at least $11 billion more per year, according to the
Congressional Budget Office. These additional dollars allocated to the EITC will themselves have efficiency costs
and/or distributional implications. Policymakers therefore face a tradeoff between implementing positive labor
supply incentives for two-earner households, and targeting the credit to lower-income families.
A second option to address secondary-earner labor supply distortions is to make the credit a wage (as
opposed to earnings) subsidy, possibly implemented as an earnings subsidy with minimum hours requirement.
Implementation of such a wage subsidy for married couples would be complicated by the need to take into account
the spouse’s hours and earnings. It is worth noting that the UK Working Families Tax Credit (more recently
disentangled into the Working Tax Credit and Child Tax Credit) includes a minimum-hours requirement imposed
on the family. Not surprisingly, similar secondary-earner labor supply effects have been documented for married
women in the UK (Blundell et. al. 2000).
Evaluating these and other alternatives to the current setup of "Making Work Pay" policies should be of
high priority for economists interested in tax-transfer program design.

-22-
References
Blomquist, Soren (1995). “Estimation Methods For Male Labor Supply functions: How to Take Account of Non-Linear Taxes.” Journal of Econometrics, 70, 383-405.
Blundell, Richard, Alan Duncan and Costas Meghir (1998). “Estimating Labor Supply Responses Using TaxReforms,” Econometrica, 66, 827-861.
––––––––––––––, Alan Duncan, Julian McCrae, and Costas Meghir (2000) "The Labour Market Impact of theWorking Families Tax Credit." Fiscal Studies, 21, 75-104.
Blundell Richard and Hilary Hoynes (forthcoming). “Has ‘In-Work’ Benefit Reform Helped the Labour Market?”forthcoming, in Seeking a Premier League Economy, Richard Blundell, David Card and Richard Freeman,editors. University of Chicago Press.
Browning, Edgar (1995). “Effects of the Earned Income Tax Credit on Income and Welfare,” National Tax Journal,XLVIII, 23-43.
Dickert, Stacy, Scott Houser and John Karl Scholz (1995). "The Earned Income Tax Credit and Transfer Programs:A Study of Labor Market and Program Participation." In Tax Policy and the Economy. James Poterba, ed.Cambridge: MIT Press.
Dickert, Stacy and Scott Houser (1998). "Taxes and Transfers: A New Look at the Marriage Penalty.” National TaxJournal.
Dickert, Stacy and Scott Houser (2002). “EITC and Marriage,” National Tax Journal, 55(1): 25-40.Duncan, Alan. "Making Work Pay Policies and Employment Incentives." Invited Lecture, CESifo Summer Institute,July 2003.Eissa, Nada and Jeffrey Liebman (1996). "Labor Supply Response to the Earned Income Tax Credit." QuarterlyJournal of Economics, CXI, 605-637. Eissa, Nada and Hilary Hoynes (2000a), "Good News for Low Income Parents: Tax-Transfer Schemes and
Marriage"mimeo, University of California, Berkeley. Eissa, Nada and Hilary Hoynes (2000b). "Explaining the Fall and Rise in the Tax Cost of Marriage: The Effect of
Tax Laws and Demographic Trends, 1984-1997," National Tax Journal, Volume 53, Number 3, Part 2,683-711.
Eissa, Nada and Hilary Hoynes (2004). “Taxes and the Labor Market Participation of Married Couples: the EarnedIncome Tax Credit.” Journal of Public Economics Volume 88, pp. 1931-1958.
Ellwood, David (2000). “The Impact of the Earned Income Tax Credit and Social Policy Reforms on Work,Marriage and Living Arrangements,” National Tax Journal 53(4) Part 2 (December).
Flood, Lennart and Thomas MaCurdy (1991). "Work Disincentive Effects of Taxes: An Empirical Analysis ofSwedish Men", mimeo, Stanford University.
Grogger, Jeffrey (Forthcoming). “The Effects of Time Limits and Other Policy Changes on Welfare Use, Work, andIncome Among Female-Headed Families,” Review of Economics and Statistics.
Heckman, James (1992). "Comment," in Feldstein, Martin, ed. Behavioral Simulations in Tax Policy Analysis.Chicago: University of Chicago Press.
Hoffman, Saul and Laurence Seidman (1990). The Earned Income Tax Credit: Antipoverty Effectiveness and LaborMarket Effects. Kalamazoo MI: Upjohn Institute for Employment Research.
Holtzblatt, Janet, Janet McCubbin and Robert Gilette (1994). "Promoting Work Through the EITC," mimeo, USDepartment of the Treasury, June 4, 1994.
Hotz, V. Joseph, Charles Mullin and John Karl Scholz (2002). “The Earned Income Tax Credit and the LaborMarket Participation of Families on Welfare,” Mimeo, UCLA.
Hotz, V. Joseph and John Karl Scholz (2003). “The Earned Income Tax Credit” in Robert Moffitt, ed., Means-Tested Transfer Programs in the United States. Chicago: University of Chicago Press.
Hoynes, Hilary Williamson (1996). "Welfare Transfers in Two-Parent Families: Labor Supply and WelfareParticipation Under the AFDC-UP Program", Econometrica 64(2), 295-332.
Imbens Guido and Joshua Angrist (1994). "Identification and Estimation of Local Average Treatment Effects,"

-23-
Econometrica 62(2), 467-475. Liebman, Jeffrey. "The Impact of the EITC on Incentives and Income Distribution." Tax Policy and the Economy, ed.
James Poterba, 83-119. Cambridge: MIT Press.Keane, Michael and Robert Moffitt (1998). “A Structural Model of Multiple Welfare Program Participation and
Labor Supply,” International Economic Review 39(3):553-589.MaCurdy, Thomas, David Green and Harry Paarsch (1990). "Accessing Empirical Approaches for Analyzing Taxes
and Labor Supply." Journal of Human Resources 25(3), 415-490.Meyer, Bruce and Daniel Rosenbaum (2000). “Making Single Mothers Work: Recent Tax and Welfare Policy and
its Effects.” National Tax Journal 53(4) Part 2 (December).Meyer, Bruce and Daniel Rosenbaum (2001). “Welfare, the Earned Income Tax Credit, and the Labor Supply of
Single Mothers.” Quarterly Journal of Economics, Vol. 116, Issue 3 (August).Moffitt, Robert (1992). "Incentive Effects of the U.S. Welfare System: A Review," Journal of Economic Literature 30,
1-61.Moffitt, Robert and Kenneth Kehrer (1981). "The Effect of Tax and Transfer Programs on Labor Supply: The
Evidence from the Income Maintenance Experiments." In R.G. Ehrenberg, ed., Research in LaborEconomics, Volume 4:103-150. Greenwich, Connecticut: JAI Press.
Saez, Emmanuel(2002). "Do Taxpayers Bunch at Kink Points?" NBER Working Paper No. 7366.Triest, Robert K. (1987). "A Monte Carlo Test of the Robustness of Alternative Estimators if Labor Supply
Functions," Working Paper 198, (Department of Economics, Johns Hopkins University).Triest, Robert K. (1992). "The Effect of Income Taxation on Labor Supply in the United States," The Journal of
Human Resources, XXV, 491-516.U.S. General Accounting Office (1996). Earned Income Tax Credit: Profile of Tax Year 1994 Credit Recipients.
Washington DC:GAO._____, (1992). Earned Income Tax Credit: Design and Administration Could Be Improved, (Washington, DC: GAO,
1992)._____, (1993). Earned Income Tax Credit: Design and Administration Could be Improved. Washington DC:
GAO.U.S. House of Representatives. (1996). Background Materials and Data on Programs Within the Jurisdiction of the
Committee on Ways and Means. Washington D.C.: Government Printing Office._____, (2000). Background Materials and Data on Programs Within the Jurisdiction of the Committee on Ways and
Means. Washington D.C.: Government Printing Office.

-24-
Appendix ATax Calculator
Our tax model calculates federal taxes and payroll taxes and covers tax years 1984-1996. We assume thatall married couples file jointly and take the standard deduction. Our tax calculator does not include state incometaxes. Therefore we do not model the presence of the state supplements to the EITC, now available in many states.These are growing in importance, but were small relative to the federal credit during most of our sample. While inprinciple these simplifications could lead to measurement problems, in practice our estimated tax rates are veryhighly correlated with those produced by NBER’s TAXSIM model (which includes state taxes and models itemizers).
There are two tax variables that are used in the estimation of the reduced form hours equation: net of taxwages and virtual income. The net wage is the slope of the budget set at the observed level of hours of work andis equal to the gross wage times one minus the marginal tax rate (MTR). Virtual income is the vertical intercept(e.g. after tax income) at zero hours of work if the budget set is linearized through the person's observed budgetsegment.
All of the tax calculations assume a secondary-earner model. Accordingly, the primary earner’s (husband’s)taxes are computed without taking account of the spouse’s labor supply choice. For example, the husband’s net non-labor income is the family’s after tax non-labor income. All of the wife’s calculations, on the other hand, use actualhusband’s earnings. Her marginal tax rate will therefore depend on which EITC region her husband’s earnings placethe family.
Appendix BEITC Simulations
The goal of our simulations is to obtain estimates of the effect of the EITC on the labor supply of marriedcouples. The simulations are based on our sample of low education married couples in 1996. We compare predictedlabor supply based on tax laws in 1996, to what their labor supply would be if they faced a different EITC schedule.In particular, we consider two alternative simulations. We consider how labor supply would change if the householdfaces (1) the 1984 schedule for the EITC, or (2) the 1993 schedule for the EITC. In each case, we assume that allother values remain fixed. In particular, there is no change in gross wages, non-labor income, family structure,spouse’s earnings (for the wife), and no other changes in taxes. That is, we do not apply all tax laws in 1984, butjust the EITC schedule for 1984.
We use our tax calculator to generate values for the after tax wage and income variables under 1996 lawand the alternative simulation. Labor supply is predicted in each case, and the simulation tables present the changein labor supply. We present the results of the simulations for the full sample, and for two different groupings ofmarried couples: by deciles of the husband’s gross hourly wage distribution and regions of the 1996 EITC schedule(phase-in, flat, phase-out, above phase-out). The regions of the EITC are assigned using the 1996 EITC schedule,and are based on actual family earnings and adjusted gross income.

-25-
Figure 1Stylized EITC Budget Constraint

-26-
(A) Schedule for Family with 1 Child
$0
$1,000
$2,000
$3,000
$4,000
$0 $5,000 $10,000 $15,000 $20,000 $25,000 $30,000
Earnings (1996 $)
EITC
Cre
dit (
1996
$) 1996 EITC
1993 EITC
1990 EITC
1984 EITC
Figure 2
EITC Benefit for Selected Tax Years, By Real Earnings (1996 dollars)
(B) Schedule for Family with 2+ Children
$0
$500
$1,000
$1,500
$2,000
$2,500
$3,000
$3,500
$4,000
$0 $5,000 $10,000 $15,000 $20,000 $25,000 $30,000
Earnings (1996 $)
EITC
Cre
dit (
1996
$)
1996 EITC
1993 EITC
1990 EITC
1984 EITC

-27-
Figure 3
EITC Benefit for Selected Hourly Wage Levels, By Annual Hours Worked (1996 Tax year)
(A) Schedule for Family with 1 Child
$0
$500
$1,000
$1,500
$2,000
$2,500
$3,000
0 750 1500 2250 3000 3750 4500
Annual Hours Worked
EITC
Cre
dit (
1996
$)
$10/hour
Minimum Wage ($4.75)
$20/hour
Full Time, Full Year Work(1 worker)
(B) Schedule for Family with 2+ Children
$0
$500
$1,000
$1,500
$2,000
$2,500
$3,000
$3,500
$4,000
$4,500
$5,000
0 750 1500 2250 3000 3750 4500
Annual Hours Worked
EITC
Cre
dit (
1996
$)
$10/hour
Minimum Wage ($4.75/hour)
$20/hour
Full Time, Full Year Work(1 worker)

-28-
(B) Married Men
0%
1%
2%
3%
4%
5%
6%
7%
8%
9%
26 30 34 38 42 46 50 54
Age
Perc
ent
No Children
Children
(A) Married Women
0%
1%
2%
3%
4%
5%
6%
7%
8%
26 30 34 38 42 46 50 54
Age
Perc
ent
No Children
Children
Figure 4Age Distributions for Married Couples by Presence of Children
Note:Author
s’ calculations of the 1985-1997 March Current Population Survey.

-29-
Wife's marginal tax rates, actual hoursBy wife's earnings ($1000s)
(min) wsmtr (max) wsmtr (mean) wsmtr
taxyear==1984
-.5
0
.5
taxyear==1990
0 50 100taxyear==1996
0 50 100-.5
0
.5
Figure 5aMarginal Tax Rates by Own Actual Earnings, Married Women
(Earnings in 1000s of 1996 dollars)

-30-
Husband's marginal tax rates, actual hoursBy husband's earnings ($1000s)
(min) mpmtr (max) mpmtr (mean) mpmtr
taxyear==1984
-.5
0
.5
taxyear==1990
0 50 100taxyear==1996
0 50 100-.5
0
.5
Figure 5bMarginal Tax Rates by Own Actual Earnings, Married Men
(Earnings in 1000s of 1996 dollars)

-31-
Table 1Federal Income Tax and EITC Parameters, 1984-1997
Year
Federal Income Tax Parameters EITC Parameters (family with one child; family two or more children)
[lowest, highestmarginal tax rate)]
(number ofbrackets)
PersonalExemption,Standard
Deduction a/, b/
Phase-In Rate Maximum Credit Phase-Out Rate MaximumEarnings
1984 [0.000; 0.500] (15) $1,000 ; $0 0.100 $500 0.125 $10,0001985 [0.000; 0.500] (15) $1,040 ; $0 0.110 $550 0.122 $11,0001986 [0.000; 0.500] $1,080 ; $0 0.110 $550 0.122 $11,000
TRA861987 [0.110; 0.390] (5) $1,900 ; $2,540 0.140 $851 0.100 $15,4321988 [0.150; 0.330] (2) $1,950 ; $4,400 0.140 $874 0.100 $18,5761989 [0.150; 0.330] (2) $2,000 ; $4,550 0.140 $910 0.100 $19,3401990 [0.150; 0.330] (2) $2,050 ; $4,750 0.140 $953 0.100 $20,264
OBRA901991 [0.150; 0.310] (3) $2,150 ; $5,000 0.167; 0.173 $1,192; $1,235 0.119; 0.124 $21,2501992 [0.150; 0.310] (3) $2,300 ; $5,250 0.176; 0.184 $1,324; $1,384 0.126; 0.130 $22,3701993 [0.150; 0.396] (5) $2,350 ; $5,450 0.185; 0.195 $1,434; $1,511 0.132; 0.139 $23,050
OBRA931994 [0.150; 0.396] (5) $2,450 ; $5,600 0.263; 0.300 $2,038; $2,526 0.160; 0.177 $23,755; $25,2961995 [0.150; 0.396] (5) $2,500 ; $5,750 0.340; 0.360 $2,094; $3,110 0.160; 0.202 $24,396; $26,6731996 [0.150; 0.396] (5) $2,550 ; $5,900 0.340; 0.400 $2,152; $3,556 0.160; 0.202 $25,078; $28, 4951997 [0.150; 0.396] (5) $2,650 ; $6,050 0.340; 0.400 $2,210; $3,656 0.160; 0.211 $25,750; $29,290
a/ The standard deductions are given for head of household tax return.b/ In 1984-1986, there were no standard deductions because of the zero bracket. The 15 brackets include the zero bracket.c/ Basic EITC only. Does not include supplemental young child credit or health insurance credit.d/ Introduced a small benefit for taxpayers with no qualifying children, phased-in at 0.0765 up to a maximum credit of $306.Source: The Green Book and authors' calculations from OBRA93.

-32-
Table 2Distribution of Families by EITC Credit Range
Married Couples Single Parents
Percent Distribution of EITC Recipients with Children, Tax Year 1994 1
Phase-in or flat 27% 47%Phase-out 73% 53%Total 100% 100%
Percent Distribution of Married Couple Families with Children, Tax Year 1996 2
Less than 12 years of schooling Including Women’s Earnings
ExcludingWomen’s Earnings
Phase-in 7% 10% -Flat 6% 8% -Phase-out 43% 52% -Above phase-out 42% 26% -Zero countable income 2% 4%Total 100% 100% -
12 years of schooling
Phase-in 1% 4% -Flat 2% 3% -Phase-out 16% 31% -Above phase-out 81% 61% -Zero countable income 0% 1% Total 100% 100% -1 General Accounting Office (1996).2 Author’s calculations of March 1997 Current Population Survey.

-33-
Table 3Summary Statistics for Married Couples with and without Children
Married CouplesAll No Children 1 Child 2 or More Children
State unemp rate 6.6 (1.7) 6.5 (1.7) 6.5 (1.7) 6.7 (1.7)# children 1.81 (1.51) 0 1 2.9 (1.1)# preschool children 0.44 (0.74) 0 0.20 (0.40) 0.72 (0.87)
Husband:age 40.4 (7.8) 45.4 (7.4) 41.6 (7.7) 37.8 (6.7)non-white 0.13 0.14 0.11 0.13education 9.7 (3.2) 10.2 (2.9) 10.1 (3.1) 9.4 (3.4)annual hours 1922 (718) 1937 (739) 1976 (674) 1897 (725)labor force participation 0.959 0.955 0.969 0.958unearned income $1,669 (3,767) $2,046 (4,452) $1,658 (3,897) $1,513 (3,364)net non-labor income -- -- $1,535 (3,600) $1,518 (3,335)gross hourly wage a/ -- -- $12.7 (7.3) $11.39 (6.72)ln(net wage) a/ -- -- 2.11 (0.50)) 2.05 (0.48)
Wife:non-white 0.13 0.15 0.12 0.13age 38.0 (7.6) 43.8 (7.2) 39.1 ( 7.5) 35.1 (6.1)education 8.5 (2.5) 8.9 (2.2) 8.8 (2.2) 8.2 (2.6)annual hours 873 (932) 1040 (968) 987 (938) 753 (896)labor force participation 0.577 0.644 0.632 0.524unearned income $24,928 (16,310) $27,312 (17,925) $26,726 (17028) $23,206 (15047)net non-labor income -- -- $23,233 (12236) $21,279 (11,091)gross hourly wagea/ -- -- $7.63 (4.9) $7.36 (5.2)ln(net wage) a/ -- -- 1.58 (0.46) 1.57 (0.48)
Observations 22,671 5,493 4,890 12,288a/Wage is defined for workers only.
Source: Authors’ tabulations of March CPS for years 1985-1997. Sample includes married couples where thewife has less than a high school education. See text for further sample selection. Standard errors are inparentheses. All dollar amounts are in 1995 dollars.

-34-
Table 4aParameter Estimates for Annual Hours of Work Equation
Married Couples with Children, 1984-1996Sample: Wife Education<12
Married Women, Hours>0
Variable OLS IV-1a/ IV-2 b/
constant 1942.89 (192.2) 1836.38 (240.7) 1454.6 (629.9)
# of children -50.91 (7.07) -50.32 (7.10) -55.75 (10.33)
# preschool children -89.55 (12.61) -91.06 (12.94) -132.39 (25.27)
black 82.22 (29.81) 81.40 (29.98) 4.88 (55.52)
other race 192.07 (31.82) 192.49 (31.86) 149.36 (45.83)
cohort2 109.85 (44.94) 108.92 (45.00) 120.75 (52.04)
cohort3 57.90 (45.63) 58.32 (45.68) 61.18 (51.41)
cohort4 56.90 (44.56) 60.89 (44.91) 66.87 (55.76)
state unemp rate -22.89 (7.44) -22.94 (7.46) -28.53 (9.01)
mills ratio -309.54 (190.0) -308.22 (190.25) -214.20 (220.43)
net wage (ln) 31.4 (15.8) 99.1 (100.3) 662.5(360)
virtual income -3.2 (0.7) -3.0 (0.74) -25.3 (14.8)
Test Statistics1st Stage F stat, ln(w) – 12.3 (p=0) 1.2 (p=.2)
1st Stage F stat, y -- 300 (p=0) 1.2 (p=.2)
Mean of Dep Var 1,477
Observations 9,532
Behavioral Elasticities
Wage 0.02 0.07 0.44
Income -0.05 -0.04 -0.36
a/Instrument set 1 includes the marginal tax rate the individual faces at 5,000 earnings increments from zero upto $100,000 (0, 5000, 10000,... 95000, 100000). The tax calculations account for the EITC, other federal taxes,and payroll taxes and condition on the person’s level of unearned income.
b/Instrument set 2 includes EITC tax parameters (phase-in rate, phaseout rate, kink points), kink point wherefederal taxes begin, and tax parameters interacted with education and birth cohort dummies.
Source: Authors’ tabulations of 1985-1997 March CPS. Sample includes married couples with children. Seetext for details.

-35-
Table 4bParameter Estimates for Annual Hours of Work Equation
Married Couples with Children, 1984-1996Sample: Wife Education<12
Married Men
Variable OLS IV-1 a/ IV-2 b/
constant 2557.56 (73.94) 2119.08 (287.9) 1899.2 (393.4)
# of children -22.85 (4.18) -19.23 (4.57) -19.01 (4.87)
# preschool children -24.78 (7.23) -21.27 (7.91) -17.87 (8.62)
black -117.62 (20.26) -107.00 (23.08) -92.49 (26.89)
other race -66.25 (21.75) -51.83 (24.20) -43.02 (26.19)
cohort2 -10.20 (17.08) -13.62 (17.47) -7.25 (18.68)
cohort3 -5.98 (17.49) 2.46 (19.25) 11.86 (23.36)
cohort4 -41.71 (22.22) -45.77 (27.42) -27.21 (32.92)
state unemp rate -24.93 (4.69) -23.74 (4.80) -24.51 (4.92)
net wage (ln) -136.7 (10.1) 100.8 (130.9) 174.5 (176.2)
income (virtual) +4.0 (1.39) -16.8 (3.40) -10 (19.4)Test Statistics1st Stage F stat, ln(w) n/a 8.6 (p=0) 2.8 (p=0)
1st Stage F stat, y n/a 350 (p=0) 4.6 (p=0)
Mean of Dep Var 1,997
Observations 16,510
Behavioral Elasticities
Wage -0.07 0.05 0.09Income +0.01 -0.04 -0.02
a/ Instrument set 1 includes the marginal tax rate the individual faces at 5,000 earnings increments from zero upto $100,000 (0, 5000, 10000,... 95000, 100000). The tax calculations account for the EITC, other federal taxes,and payroll taxes and condition on the person’s level of unearned income.
b/Instrument set 2 includes EITC tax parameters (phase-in rate, phase-out rate, kink points), kink point wherefederal taxes begin, and tax parameters interacted with education and birth cohort dummies.
Source: Authors’ tabulations of 1985-1997 March CPS. Sample includes married couples with children. Seetext for details.
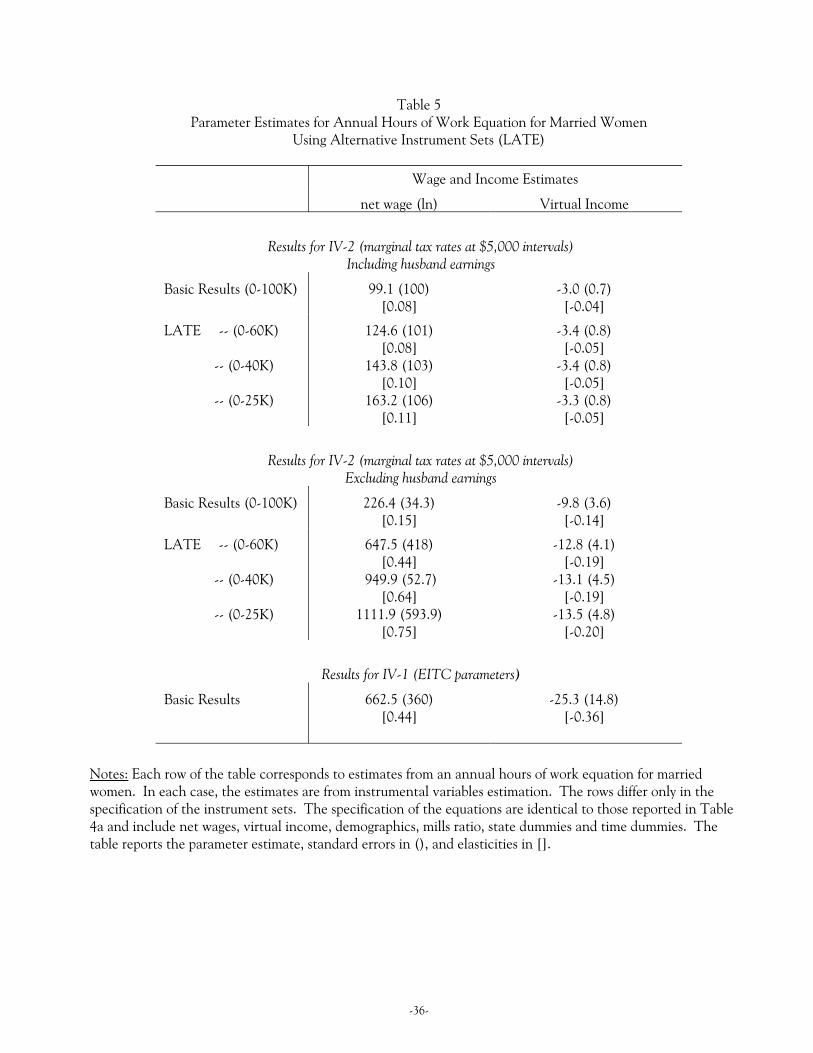
-36-
Table 5Parameter Estimates for Annual Hours of Work Equation for Married Women
Using Alternative Instrument Sets (LATE)
Wage and Income Estimates
net wage (ln) Virtual Income
Results for IV-2 (marginal tax rates at $5,000 intervals)Including husband earnings
Basic Results (0-100K) 99.1 (100)[0.08]
-3.0 (0.7)[-0.04]
LATE -- (0-60K)
-- (0-40K)
-- (0-25K)
124.6 (101)[0.08]
143.8 (103)[0.10]
163.2 (106)[0.11]
-3.4 (0.8)[-0.05]
-3.4 (0.8)[-0.05]
-3.3 (0.8)[-0.05]
Results for IV-2 (marginal tax rates at $5,000 intervals)Excluding husband earnings
Basic Results (0-100K) 226.4 (34.3)[0.15]
-9.8 (3.6)[-0.14]
LATE -- (0-60K)
-- (0-40K)
-- (0-25K)
647.5 (418)[0.44]
949.9 (52.7)[0.64]
1111.9 (593.9)[0.75]
-12.8 (4.1)[-0.19]
-13.1 (4.5)[-0.19]
-13.5 (4.8)[-0.20]
Results for IV-1 (EITC parameters)
Basic Results 662.5 (360)[0.44]
-25.3 (14.8)[-0.36]
Notes: Each row of the table corresponds to estimates from an annual hours of work equation for marriedwomen. In each case, the estimates are from instrumental variables estimation. The rows differ only in thespecification of the instrument sets. The specification of the equations are identical to those reported in Table4a and include net wages, virtual income, demographics, mills ratio, state dummies and time dummies. Thetable reports the parameter estimate, standard errors in (), and elasticities in [].

-37-
Table 6Simulated Change in Annual Hours, EITC Expansion 1984-1996
Married Men: Change in Annual Hours
Married Women: Change in Annual Hours
IV-1(MTR 0-100K) IV-2 (EITC, Tax Parameters) IV-1 (MTR 0-100K) IV-2 (EITC, Tax Parameters)
Level Percent (%) Level Percent (%) Level Percent (%) Level Percent (%)
Overall -54 -2.6% -15 -0.7% -11 -0.7% -81 -3.9%Grouping by Husband’s Actual WageDecile 1 -2 -0.10% 27 1.29% -19 -1.15% -141 -8.57%Decile 2 -41 -1.84% 0 0.00% -28 -1.77% -197 -12.45%Decile 3 -61 -3.15% -12 -0.62% -19 -1.12% -132 -7.77%Decile 4 -92 -4.23% -31 -1.43% -19 -1.24% -134 -8.74%Decile 5 -100 -4.60% -39 -1.80% -11 -0.66% -74 -4.43%Decile 6 -101 -4.71% -41 -1.91% -11 -0.67% -80 -4.90%Decile 7 -89 -4.40% -37 -1.83% -6 -0.43% -39 -2.79%Decile 8 -40 -1.87% -16 -0.75% -3 -0.19% -19 -1.23%Decile 9 -12 -0.55% -4 -0.18% -1 -0.07% -9 -0.60%Decile 10 -8 -0.41% -2 -0.10% -3 -0.19% -19 -1.22%Husband notworking
- - - - -10 -0.59% -80 -4.69%
Grouping by Location in 1996 EITC Schedule
Phase-in 29 6.55% 46 10.38% 26 5.99% 172 39.63%Flat -9 -0.86% 22 2.11% 5 0.45% 24 2.15%Phase-out -87 -4.67% –28 -1.50% -34 -2.45% -241 -17.41%Above Phase-out -40 -1.81% -16 -0.72% 0 0.00% 0 0.00%
Notes: The simulations are based on estimates of the annual hours of work equations reported in tables 4a and 4b. The equations control for the log of net wages, virtual income,demographics, state dummies, and time dummies. The simulations are based on predictions of the hours worked using 1993 EITC tax parameters compared to 1996 EITC tax parameters. All other taxes and regression variables are held constant in the simulations. The percent change in hours is calculated using the cell specific average hours.

-38-
Table 7Simulated Change in Annual Hours, EITC Expansion 1993-1996
Married Men: Change in Annual Hours
Married Women: Change in Annual Hours
IV-1(MTR 0-100K) IV-2(EITC ,Tax Parameters) IV-1 (MTR 0-100K) IV-2 (EITC, Tax Parameters)
Level Percent (%) Level Percent (%) Level Percent (%) Level Percent (%)
Overall -32 -1.52% -10 -0.5% -7 -0.4% -49 -2.4%Grouping by Husband’s Actual WageDecile 1 -10 0.48% 10 0.48% -12 -0.73% -86 -5.22%Decile 2 -44 -1.98% -15 -0.67% -14 -0.88% -13 -0.82%Decile 3 -44 -2.28% -15 -0.78% -13 -0.77% -93 -5.48%Decile 4 -42 -1.93% -14 -0.64% -9 -0.59% -67 -4.37%Decile 5 -42 -1.93% -15 -0.69% -8 -0.48% -55 -3.29%Decile 6 -42 -1.96% -16 -0.75% -7 -0.43% -49 -3.00%Decile 7 -49 -2.42% -19 -0.94% -3 -0.21% -23 -1.64%Decile 8 -30 -1.40% -12 -0.56% -2 -0.13% -16 -1.03%Decile 9 -9 -0.41% -3 -0.14% -1 -0.07% -5 -0.33%Decile 10 -6 -0.31% -2 -0.10% -1 -0.06% -9 -0.58%Husband not working - - - - -8 -0.47% -63 -3.69%
Grouping by Location in 1996 EITC SchedulePhase-in 20 4.51% 31 7.00% 16 3.69% 98 22.58%Flat -24 -2.30% 0 0.00% -6 -0.54% -46 4.11%Phase-out -52 -2.79% –19 -1.02% -20 -1.45% -142 -10.26%Above Phase-out -20 -0.90% -8 -0.36% 0 0.00% 0 0.00%
Notes: The simulations are based on estimates of the annual hours of work equations reported in tables 4a and 4b. The equations control for the log of net wages, virtual income,demographics, state dummies, and time dummies. The simulations are based on predictions of the hours worked using 1993 EITC tax parameters compared to 1996 EITC tax parameters. All other taxes and regression variables are held constant in the simulations. The percent change in hours is calculated using the cell specific average hours.

-39-
Appendix Table 1Parameter Estimates for Annual Hours of Work Equation for Married Men
Using Alternative Instrument Sets (LATE)
Wage and Income Estimates
ln(net wage) Virtual Income/100
Results for IV-1 (marginal tax rates at $5,000 intervals)
Basic Results (0-100K) 100.8 (130.9)[0.07]
-16.8 (3.4)[-0.03]
LATE -- (0-60K)
-- (0-40K)
-- (0-25K)
236.5 (135.8)[0.12]
451.2 (182.6)[0.23]
396.9 (200.8)[0.20]
-14.1 (3.5)[-0.03]-17.0 (3.9)[-0.04]-13.9 (4.1)[-0.03]
Notes: Each row of the table corresponds to estimates from an annual hours of work equation for married men. In eachcase, the estimates are from instrumental variables estimation. The rows differ only in the specification of theinstrument sets. The specification of the equations are identical to those reported in Table 4 and include net wages,virtual income, demographics, state dummies and time dummies. The table reports the parameter estimate, standarderrors in (), and elasticities in [].


![REGISTRATION FORM Married Couples Retreat … their own experience of married life as well as their ex- ... REGISTRATION FORM [MARRIED COUPLES RETREAT-2017] ... “Pick up” Supper](https://img.pdfslide.net/doc/110x75/5b09d2e17f8b9ac7678b6821/registration-form-married-couples-retreat-their-own-experience-of-married-life-as.jpg)