Embed Size (px)
Citation preview

Report 364
Texas Water Development Board
byPeter George, Ph.D.,Robert E. Mace, Ph.D., P.G., andWilliam F. Mullican, III, P.G.
P.O. Box 13231, Capitol StationAustin, Texas 78711-3231
August 2005
The Hydrogeology of Hudspeth County, TexasR
eport 364 The H
ydrogeology of Hudspeth C
ounty, Texas August 2005

Texas Water Development Board Report 364 The Hydrogeology of Hudspeth County, Texas
by Peter George, Ph.D., Robert E. Mace, Ph.D., P.G., and William F. Mullican, III, P.G.
August 2005

Geoscientist Seal
The contents of this report (including figures and tables) document the work of theFollowing Licensed Texas Geoscientists:
Peter George, P.G. No. 10344
Peter George was the primary author for the report, andwas responsible for its content.
The seal appearing on this document was authorized onMay 19, 2009 by
P;;e;:;(i~Peter George
Robert E. Mace, P.G. No. 469
Robert Mace assisted in the analysis and interpretationof data.
The seal appearing on this document was authorized on
~200~~.M~'"Report 364 - The Hydrogeology of Hudspeth County, Texas, 2005

iii
Texas Water Development Board
E. G. Rod Pittman, Chairman, Lufkin Thomas Weir Labatt, III, Member, San Antonio
Jack Hunt, Vice Chairman, Houston James E. Herring, Member, Amarillo
Dario Vidal Guerra, Jr., Member, Edinburg William W. Meadows, Member, Fort Worth
J. Kevin Ward, Executive Administrator
Authorization for use or reproduction of any original material contained in this publication, i.e., not obtained from other sources, is freely granted. The Board would appreciate acknowledgment. The use of brand names in this publication does not indicate an endorsement by the Texas Water Development Board or the State of Texas.
Published and distributed by the
Texas Water Development Board P.O. Box 13231, Capitol Station
Austin, Texas 78711-3231
August 2005 Report 364
(Printed on recycled paper)

iv
This page is intentionally blank.

v
Table of Contents
List of figures.................................................................................................................... vii List of tables....................................................................................................................... ix Acronyms and abbreviations................................................................................................x 1.0 Executive summary.....................................................................................................1 2.0 Introduction.................................................................................................................3 3.0 Study area....................................................................................................................3
3.1 Regional physiography .........................................................................................4 3.2 Climate and vegetation .........................................................................................5 3.3 Geologic history....................................................................................................6
4.0 Water management ...................................................................................................17 4.1 Hudspeth County Underground Water Conservation District No. 1 ..................17 4.2 Hudspeth County Conservation and Reclamation District No. 1 .......................17
5.0 Previous hydrologic studies ......................................................................................18 6.0 Hydrogeology of Hudspeth County ..........................................................................18
6.1 Bone Spring–Victorio Peak aquifer ....................................................................19 6.1.1 A proposed new boundary .........................................................................19 6.1.2 Geology and hydrostratigraphy..................................................................20 6.1.3 Water levels and groundwater flow ...........................................................23 6.1.4 Recharge ....................................................................................................23 6.1.5 Hydraulic properties...................................................................................28 6.1.6 Discharge ...................................................................................................28 6.1.7 Water quality..............................................................................................29
6.2 Diablo Plateau aquifer.........................................................................................38 6.2.1 Geology and hydrostratigraphy..................................................................38 6.2.2 Water levels and groundwater flow ...........................................................39 6.2.3 Recharge ....................................................................................................39 6.2.4 Hydraulic properties...................................................................................40 6.2.5 Discharge ...................................................................................................40 6.2.6 Water quality..............................................................................................40
6.3 Hueco Bolson aquifer .........................................................................................41 6.3.1 Geology and hydrostratigraphy..................................................................41 6.3.2 Water levels and groundwater flow ...........................................................42 6.3.3 Recharge ....................................................................................................42 6.3.4 Hydraulic properties...................................................................................47 6.3.5 Discharge ...................................................................................................47 6.3.6 Water quality..............................................................................................48
6.4 West Texas Bolsons aquifer................................................................................52 6.4.1 Geology and hydrostratigraphy..................................................................52 6.4.2 Water levels and groundwater flow ...........................................................52 6.4.3 Recharge ....................................................................................................55 6.4.4 Hydraulic properties...................................................................................57 6.4.5 Discharge ...................................................................................................58

vi
6.4.6 Water quality..............................................................................................58 6.5 Capitan Reef Complex aquifer............................................................................66
6.5.1 Geology and hydrostratigraphy..................................................................66 6.5.2 Water levels and groundwater flow ...........................................................67 6.5.3 Recharge ....................................................................................................67 6.5.4 Hydraulic properties...................................................................................67 6.5.5 Discharge ...................................................................................................68 6.5.6 Water quality..............................................................................................68
7.0 Water demands..........................................................................................................68 7.1 Population ...........................................................................................................69 7.2 Historical water use.............................................................................................70 7.3 Projected water demands ....................................................................................74 7.4 Water export........................................................................................................74
8.0 Water availability and supply ...................................................................................77 8.1 Groundwater availability ....................................................................................77 8.2 Groundwater supply............................................................................................80 8.3 Surface-water availability and supply.................................................................80 8.4 Recommended water management strategies .....................................................82
9.0 Supplies and strategies versus demands ...................................................................82 10.0 Conclusions...............................................................................................................85 11.0 Acknowledgements...................................................................................................87 12.0 References.................................................................................................................87

vii
List of Figures
3-1 Major physiographic features of Hudspeth County .................................................4 3-2 Precipitation and evaporation in Far West Texas ....................................................6 3-3 Maximum and minimum temperatures in selected areas of Hudspeth County .......7 3-4 Vegetative cover for Hudspeth County and surrounding areas ...............................8 3-5 Regional structure map, northwestern Trans-Pecos Texas ......................................9 3-6 Geologic map of Hudspeth County........................................................................11 3-7 Stratigraphic columns for selected areas in Hudspeth County ..............................13 3-8 Cenozoic basins, northwestern Trans-Pecos Texas ...............................................15 3-9 Quaternary faults, northwestern Trans-Pecos Texas .............................................16 6-1 Proposed new boundary for the Bone Spring–Victorio Peak aquifer....................21 6-2 Generalized geologic cross-section for northeastern Hudspeth County ................22 6-3 Locations of three study areas with well locations and surface-water drainage....24 6-4 Water-level map of northeastern Hudspeth County...............................................25 6-5 Hydrographs from selected wells in northeastern Hudspeth County.....................26 6-6 Hydrographs for well 48-07-516 in the Bone Spring–Victorio Peak aquifer ........27 6-7 Total dissolved solids in Hudspeth County groundwater, 1939 to present............30 6-8 Major ion concentrations for groundwater in Hudspeth County ...........................31 6-9 Piper plot of major ion compositions for the aquifers in northeastern
Hudspeth County ...................................................................................................32 6-10 Piper plot and selected Stiff diagrams of groundwater from Cretaceous rocks,
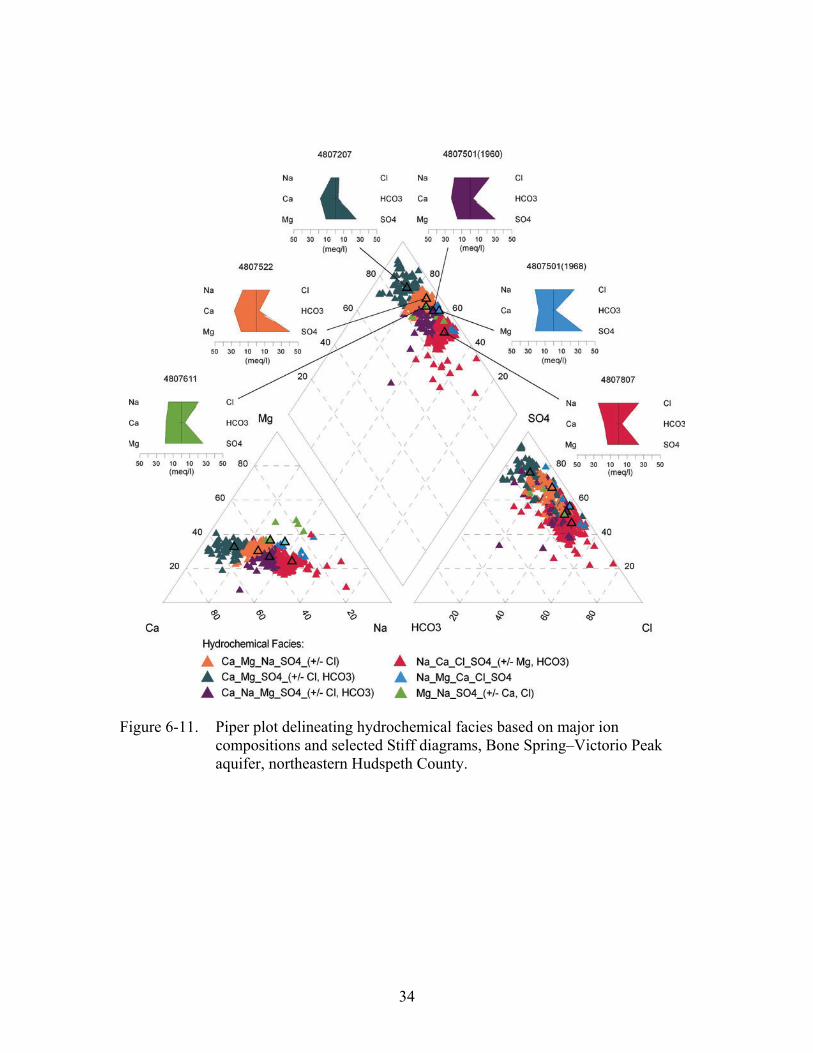
northeastern Hudspeth County...............................................................................33 6-11 Piper plot delineating hydrochemical facies based on major ion compositions
and selected Stiff diagrams, Bone Spring–Victorio Peak aquifer, northeastern Hudspeth County ...................................................................................................34
6-12 Map displaying the distribution of hydrochemical facies using Stiff diagrams, along with individual hydrochemical facies and respective Stiff diagrams of the Bone Spring–Victorio Peak aquifer, northeastern Hudspeth County ..............35
6-13 Piper plot of major ions from pre- and post-1950 water samples of the Bone Spring-Victorio Peak aquifer, northeastern Hudspeth County ..............................36
6-14 A plot of major ion concentrations of water samples from two wells taken over the time period 1948 to 2001 ...............................................................37
6-15 Water-level map of southwestern Hudspeth County .............................................43 6-16 A generalized hydrogeologic cross-section, southwest Hudspeth County ............44 6-17 Water-level maps of the Rio Grande Alluvium aquifer over time,
southwestern Hudspeth County, Texas..................................................................45 6-18 Hydrographs from selected wells in southwestern Hudspeth County ...................46 6-19 Total dissolved solids in groundwater in southwestern Hudspeth County ............49 6-20 Piper plot delineating hydrochemical facies for southwestern
Hudspeth County ...................................................................................................50 6-21 Stiff diagrams showing the distribution of hydrochemical facies
in southwestern Hudspeth County .........................................................................51 6-22 Water-level map of southeastern Hudspeth County with groundwater divides ....53

viii
6-23 Comparison between water-level elevation and land-surface elevation for wells measured in southeastern Hudspeth County...........................................54
6-24 Conceptual hydrogeologic cross-sections in southeastern Hudspeth County........56 6-25 Piper plot of major ion compositions in groundwater in southeastern
Hudspeth County ...................................................................................................60 6-26 Piper plot and selected Stiff diagrams of Type 1 groundwater, southeastern
Hudspeth County ...................................................................................................61 6-27 Piper plot and selected Stiff diagrams of Type 2 groundwater, southeastern
Hudspeth County ...................................................................................................62 6-28 Piper plot and selected Stiff diagrams of Type 3 groundwater, southeastern
Hudspeth County ...................................................................................................63 6-29 Piper plot and selected Stiff diagrams of Type 4 groundwater, southeastern
Hudspeth County ...................................................................................................64 6-30 Distribution of hydrochemical facies, southeastern Hudspeth County..................65 6-31 Piper plot and selected Stiff diagrams of groundwater from the Capitan Reef
Complex aquifer and associated limestones, northeastern Hudspeth County .......69
ix
List of Tables
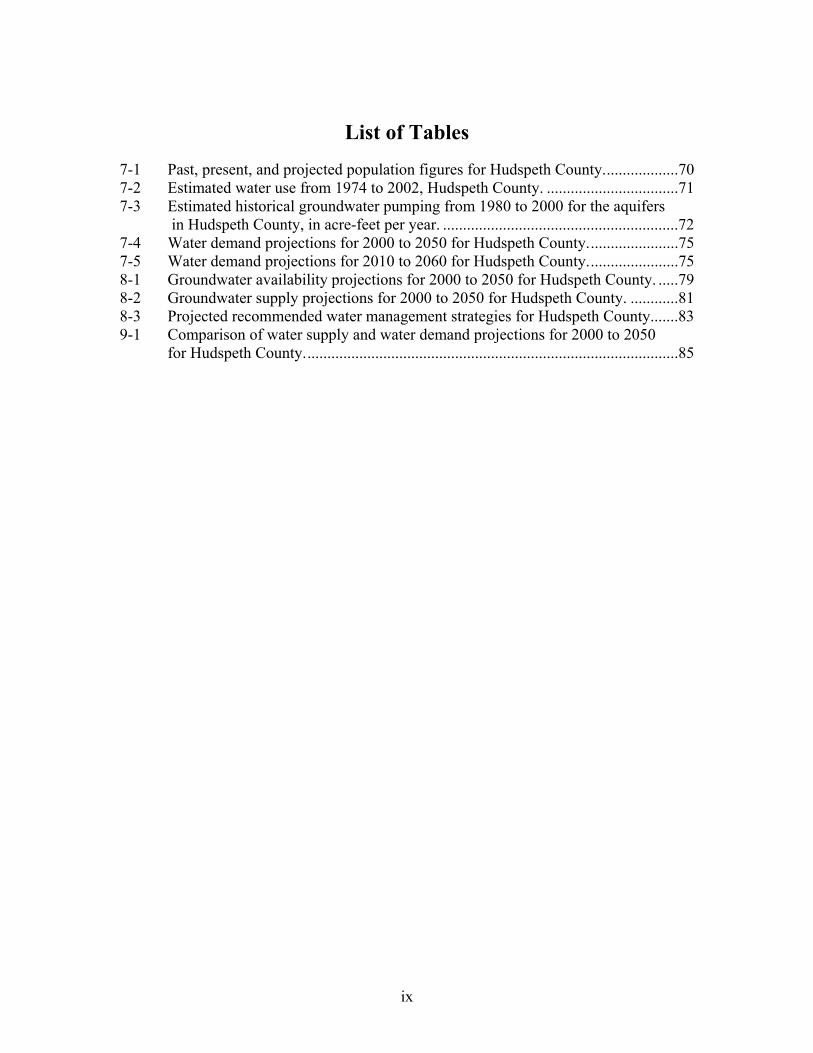
7-1 Past, present, and projected population figures for Hudspeth County...................70 7-2 Estimated water use from 1974 to 2002, Hudspeth County. .................................71 7-3 Estimated historical groundwater pumping from 1980 to 2000 for the aquifers
in Hudspeth County, in acre-feet per year. ...........................................................72 7-4 Water demand projections for 2000 to 2050 for Hudspeth County.......................75 7-5 Water demand projections for 2010 to 2060 for Hudspeth County.......................75 8-1 Groundwater availability projections for 2000 to 2050 for Hudspeth County. .....79 8-2 Groundwater supply projections for 2000 to 2050 for Hudspeth County. ............81 8-3 Projected recommended water management strategies for Hudspeth County.......83 9-1 Comparison of water supply and water demand projections for 2000 to 2050
for Hudspeth County..............................................................................................85
x
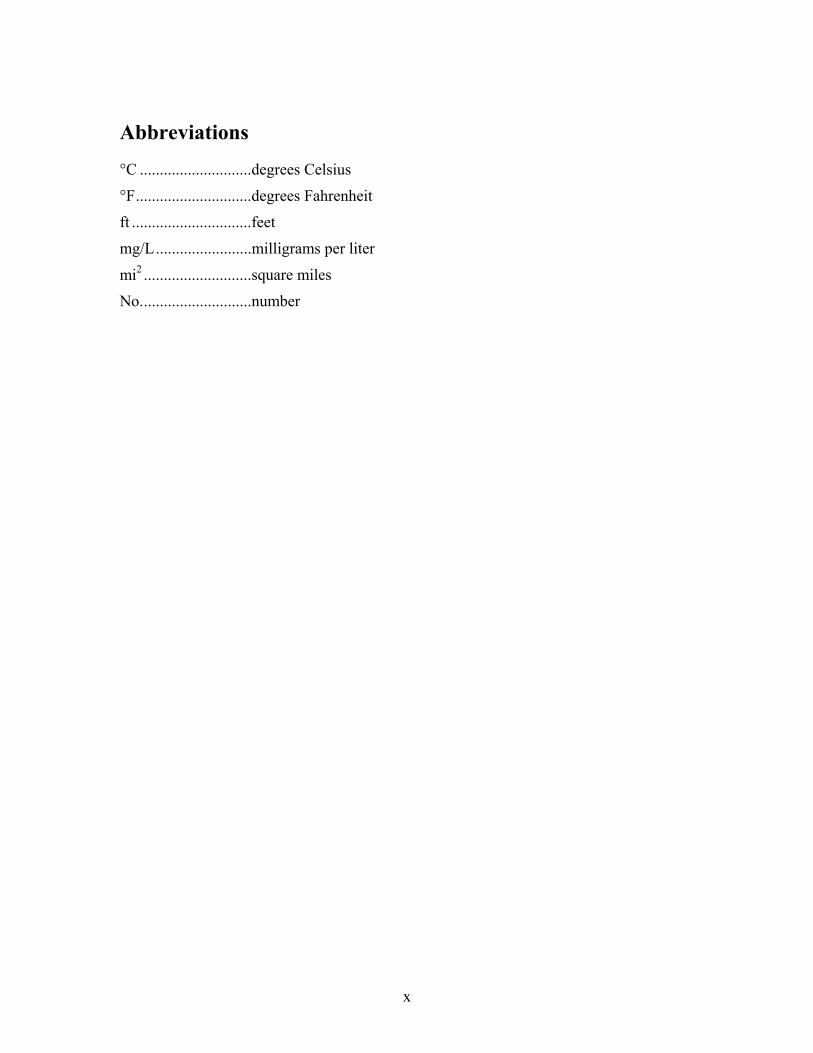
Abbreviations
°C ............................degrees Celsius
°F.............................degrees Fahrenheit
ft ..............................feet
mg/L........................milligrams per liter
mi2 ...........................square miles
No............................number

1
1.0 Executive summary
Hudspeth County in Far West Texas is a sparsely-populated area located in the northern part of the Chihuahuan desert. Several proposed water export projects there have engendered concerns about its groundwater resources. These concerns prompted the Executive Director of the Texas Commission on Environmental Quality (Commission) and the Executive Administrator of the Texas Water Development Board (Board) to add Hudspeth County to a list of proposed Priority Groundwater Management Area studies. The Executive Director of the Commission asked the Executive Administrator of the Board to conduct a study on the area’s hydrogeology and immediate, short-term, and long-term water supplies and needs. We completed the study and sent it to the Commission in January 2005. This report provides results from the study conducted for the Commission.
Hudspeth County contains all or parts of the Bone Spring–Victorio Peak, Capitan Reef Complex, Diablo Plateau, Hueco Bolson, and West Texas Bolsons aquifers. The Bone Spring–Victorio Peak aquifer in northeast Hudspeth County is the primary groundwater resource in the county producing about 100,000 acre-feet per year of brackish groundwater for irrigation in recent years. The Capitan Reef Complex aquifer extends slightly into the northeast part of the county and is reportedly capable of producing substantial amounts of fresh water. Hudspeth County overlies the southeastern-most extent of the Hueco Bolson aquifer, which is capable of producing moderate amounts of brackish water. The Red Light Draw, Eagle Flat, and Green River Valley parts of the West Texas Bolsons aquifer lie in the southeastern part of the county and can produce limited amounts of fresh to brackish water. Little information is currently available on the Diablo Plateau aquifer, but it may be able to produce moderate amounts of fresh water.
The 2001 Far West Texas Regional Water Plan projects that the population of Hudspeth County will not exceed 4,000 people by 2030 and that the in-county demand for surface water and groundwater will be about 118,000 acre-feet per year by that time. However, current planning activities for the preparation of the 2006 Far West Texas Regional Water Plan suggest that the in-county demand for surface water and groundwater will be greater than previously thought, about 176,000 acre-feet per year by 2030. More than 99 percent of this water demand is for irrigation. There may also be a future demand for water in Hudspeth County from users outside the county. The 2001 Far West Texas Regional Water Plan includes a water management strategy to export as much as 30,000 acre-feet of water per year by 2030 from the Bone Spring-Victorio Peak aquifer to El Paso. El Paso Water Utilities recently purchased land that straddles Hudspeth and Culberson counties and overlies the Capitan Reef Complex aquifer. El Paso Water Utilities may produce as much as 25,000 acre-feet per year from this aquifer by 2060. Another possible export project involves State lands in southern Hudspeth County, but no specific plans for locations, volumes, and destinations are currently publicly available. There are also several proposed export projects for the Bone Spring–Victorio Peak aquifer in New Mexico north of the Dell Valley area.

2
According to the 2001 Far West Texas Regional Water Plan, total groundwater availability for Hudspeth County in times of drought is 1,988,500 acre-feet. There is no surface water available for use during a repeat of the drought-of-record. Groundwater supplies, which are limited by infrastructure and other factors, are about 150,000 acre-feet per year through 2060 with 93 percent of those supplies from the Bone Spring–Victorio Peak aquifer. By implementing the water management strategies in the 2001 Far West Texas Regional Water Plan, all groundwater needs for the county as a whole are met, including the export of water to El Paso. Hudspeth County does have unmet agricultural needs along the Rio Grande, but that is due to the absence of available surface water from the Rio Grande during a repeat of the drought-of-record. Because of a lack of information, we were not able to assess the effects of additional groundwater exports (outside of those planned by El Paso Water Utilities) on groundwater resources in Hudspeth County within the context of the 2001 Far West Texas Regional Water Plan. Additional information will be needed before this analysis can be attempted.

3
2.0 Introduction
Although sparsely populated and located in the Chihuahuan desert, Hudspeth County has been the focus of several groundwater issues over the last several years. These groundwater issues include the potential transport of groundwater from the Bone Spring–Victorio Peak and Capitan Reef Complex aquifers to El Paso and the possible leasing of groundwater rights beneath State lands to private interests. The groundwater acquired through these leased rights would, presumably, be pumped at some point, although whether the water would be used locally or transported elsewhere is unknown. These issues, along with the concerns of local citizens, prompted the Executive Director of the Texas Commission on Environmental Quality (Commission) and the Executive Administrator of the Texas Water Development Board (Board) to add Hudspeth County to a list of proposed Priority Groundwater Management Area studies. In a letter dated July 2nd, 2004, the Executive Director asked the Executive Administrator to prepare a study on the area’s hydrogeology and immediate, short-term, and long-term water supplies and needs. We completed the report and delivered it to the Commission in January 2005. This report provides results from the study conducted for the Commission.
A Priority Groundwater Management Area is defined as an area designated or delineated by the Commission that is experiencing or expected to experience critical groundwater problems in the next 25 years. The ultimate purpose of a Priority Groundwater Management Area is to create a groundwater conservation district(s), either through local initiative or by the Commission. The requirements and implications of a Priority Groundwater Management Area designation are explained in Chapter 35 of the Texas Water Code. The Commission writes a Priority Groundwater Management Area report based on studies by the Board and the Texas Parks and Wildlife Department and makes a final decision on designation based on these reports, their own analysis, and public comment.
To respond to the Commission’s request, we (1) reviewed existing hydrogeologic information for the county from Board, Bureau of Economic Geology, and U.S. Geological Survey reports and (2) reviewed water demand, supply, and availability information from the 2001 Far West Texas Regional Water Plan. In this report, we first introduce the study area, summarize the status of its water management, and briefly review existing studies. We then discuss the aquifers of the county in detail. Finally, we discuss the water demands, availability, and supply for the county. Most of the information in this report is based on previously published studies. However, we provide new or updated analyses on water levels and water quality and propose a new boundary for the Bone Spring–Victorio Peak aquifer.
3.0 Study area
The study area is located in Hudspeth County, Texas, which is in the Far West Texas Regional Water Planning Area (Figure 3-1; Region E). The Hudspeth County Underground Water Conservation District No.1 occupies the northeastern part of the

4
Figure 3-1. Major physiographic features of Hudspeth County, Texas.
county. Although a Priority Groundwater Management Area study generally excludes areas that already have groundwater conservation districts the Commission requested that this study include the existing underground water conservation district. Our description of the study area includes a discussion on the regional physiography, climate and vegetation, and geologic history.
3.1 Regional physiography
Hudspeth County lies within the Trans-Pecos region and the larger Basin and Range Province of western North America (Stewart, 1978). The county includes part of the Rio Grande Rift (Chapin, 1971), which extends from central Colorado to Far West Texas and the state of Chihuahua, Mexico. As such, much of the county’s physiography is typical of other continental rift zones and areas of extensional tectonism. Rugged, northwest-southeast-trending, fault-bounded mountains are separated by broad, internally drained bolsons, or basins, underlain by aquifers (Figure 3-1). This is especially evident in the southeastern part of the county where the Quitman and Eagle mountains alternate with the Red Light, Eagle Flat, and Hueco bolsons (Langford, 1993). Elevations in the

5
mountains in this part of the county are between 7,500 and 4,500 feet (ft), with elevations for the intervening valleys ranging from 4,500 to 3,200 ft.
Red Light Bolson is about 55 miles long and four to six miles wide, with surface drainage that is to the southeast into the Rio Grande (Langford and others, 1999). Darling (1997) subdivided Eagle Flat Basin into two sub-basins, one to the northwest and the other to the southeast. Northwest Eagle Flat Basin drains internally by ephemeral streams to a desert playa lake. Coalesced alluvial fans separate the sub-basin from its southeastern counterpart, which drains to the east-southeast along Eagle Flat Draw (Darling, 1997; Langford, 1993). Green River Valley is the southward extension of Eagle Flat Basin, separated from it by a broad surface water divide approximately 14 miles north of the Rio Grande. The valley drains the Green River, which is an ephemeral tributary to the Rio Grande. Northwest of Red Light Bolson is the much larger Hueco Bolson, considered to be the southern continuation of the Rio Grande Rift. It extends some 115 miles from the Quitman Mountains to north of the Texas-New Mexico border where it merges with the Tularosa Basin of south-central New Mexico (Collins and Raney, 1991). Elevations in the Hueco Bolson in Hudspeth County are approximately 4,300 to 3,400 ft.
Northeast of the Hueco Bolson is the Diablo Plateau. It is a broad area of low-relief hills of limestone and windblown sand that drains to the northeast along wide shallow valleys. Elevations on the plateau decrease from about 5,000 to 4,200 ft where it merges into the Dell Valley. The Dell Valley is an alluvial outwash plain that slopes eastward to an elevation of about 3,600 ft where it meets the northern Salt Basin. The Salt Basin is a closed basin draining much of the Sacramento Mountains of New Mexico to the north, the western flank of the Guadalupe Mountains, and parts of the Diablo Plateau. Natural discharge and evaporation of groundwater flowing to and within the basin occurs in dry salt flats located there (Ashworth, 1995). The Guadalupe Mountains to the east rise to an elevation of 8,749 ft at Guadalupe Peak, which is the highest point in Texas.
3.2 Climate and vegetation
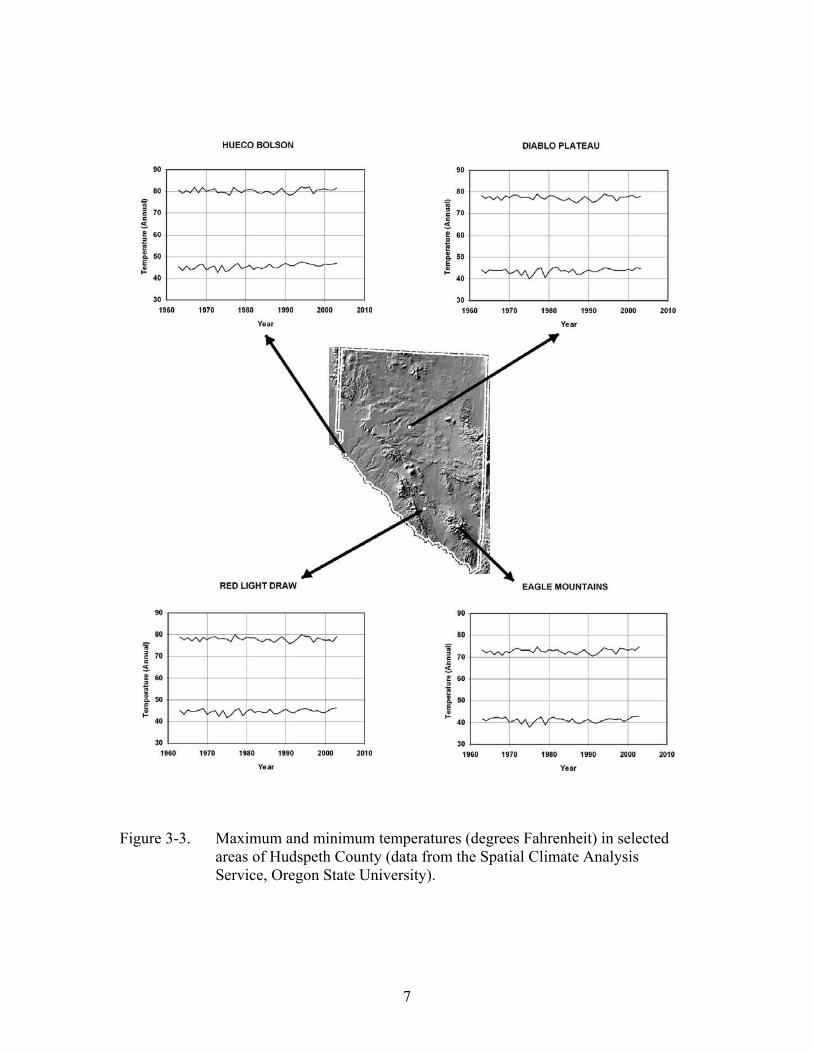
Hudspeth County lies in the northern Chihuahuan desert, an area of relatively high elevations and extreme temperatures (Schmidt, 1979). Larkin and Bomar (1983) classify its climate as subtropical arid with low rainfall and high evaporation creating drought conditions for all or parts of most years. Most rain in Hudspeth County falls from May to October during widely scattered thunderstorms. These thunderstorms, due to their convective nature, produce greater precipitation with increasing elevation (Gile and others, 1981). Precipitation averages 15.64 for quadrangle 602 (which covers the central part of the county) and 16.95 inches for quadrangle 702 (which covers the southern part of the county) over a period from 1940 to 2002 (Figure 3-2). Evaporation rates average 70.95 inches in quadrangle 602 and 62.90 in quadrangle 702 based on monthly and annual gross lake surface evaporation data from 1954 through 2002. Maximum and minimum temperatures, averaged over forty years, are 80°F and 45°F in the Hueco Bolson, 72°F and 41°F in the Eagle Mountains, 78°F and 45°F at Red Light Draw, and 77°F and 44°F on the Diablo Plateau (Figure 3-3).

6
Figure 3-2. Precipitation and evaporation in Far West Texas (contour map based on
data from the Spatial Climate Analysis Service, Oregon State University; data for graphs from monitoring sites operated by the National Weather Service and the Texas Water Development Board).
The extreme climatic conditions, including some hard freezes, have resulted in a distribution of plants dominated by shrubs and grasslands (Figure 3-4). At higher elevations in the Eagle Mountains and Sierra Diablo, there are relatively small areas of oak, pine, and juniper.
3.3 Geologic history
Numerous periods of tectonism over more than a billion years have affected Trans-Pecos Texas, including Hudspeth County. Structural deformation produced during these periods of tectonic activity are superimposed upon one another and likely involved reactivation of major structural trends (Muehlberger and Dickerson, 1989). Muehlberger and Dickerson (1989) believe that Precambrian rifting about 1,450 million years ago (Sears and Price,
1978) along the southwestern margin of the North American plate produced a northwest-striking structural grain that oriented later deformation (Figure 3-5).
7
Figure 3-3. Maximum and minimum temperatures (degrees Fahrenheit) in selected areas of Hudspeth County (data from the Spatial Climate Analysis Service, Oregon State University).

8
Figure 3-4. Vegetative cover for Hudspeth County and surrounding areas (modified
from map by Texas Parks and Wildlife).

9
JEFF
DAV
IS
Van
Hor
n
PR
ES
IDIO
BR
EW
STE
R
ALP
INE
DIA
BLO
PLA
TEA
U
N0
1
0
20
30
4
0 m
iles
Nor
mal
faul
tTh
rust
faul
t-Oro
geni
c fro
ntTh
rust
faul
t-Oth
er
Cal
dera
MA
RFA
BA
SIN
Faul
t, na
ture
und
eter
min
edIn
ferr
ed fa
ult,
natu
re u
ndet
erm
ined
Cha
nge
of c
onto
ur h
oriz
onSt
ruct
ure
cont
our,
-200
0 ft,
Elle
nber
ger
Ant
iclin
e an
d sy
nclin
e, o
vertu
rned
Plu
ngin
g an
ticlin
e
Fi
gure
3-5
. R
egio
nal s
truct
ure
map
, nor
thw
este
rn T
rans
-Pec
os T
exas
(mod
ified
199
0 Te
cton
ic M
ap o
f Tex
as, 1
:750
,000
scal
e).

10
During the early and middle Paleozoic, the region was part of a passive continental margin characterized by broad epeirogenic uplift and subsidence (Ross, 1978; Horak, 1985). From Cambrian to Mississippian time, repeated marine transgression and regression deposited carbonates and siliciclastics on a shallow platform (Kottlowski, 1963). In the late Paleozoic, from Mississippian to Early Permian time, the collision of North and South America produced a variety of deformational structures in the study area (Figure 3-5). A proto-Chihuahua Trough, including the Hueco Basin, began developing during Late Mississippian time (Muehlberger and Dickerson, 1989), as did segmentation of the Tobosa Basin to form the Diablo Plateau (Kluth and Coney, 1981).
In Late Pennsylvanian to Early Permian time the northwest-advancing Ouachita-Marathon tectonic front began to significantly deform the region, both along the fold and thrust belt and in the foreland as well (Muehlberger, 1980; Ross and Ross, 1985; Muehlberger and Dickerson, 1989). Foreland deformation, which involved episodic uplift and syntectonic sedimentation, affected the Diablo Plateau. Dickerson (1980) invokes wrench faulting, in addition to vertical uplift, to explain the northwest-southeast-trending Babb and Victorio flexures of the Diablo Plateau (Figure 3-5). Both structures are north-side-down monoclines that formed in post-Early Pennsylvanian/pre-Hueco Limestone (Wolfcampian) time. Lower Permian (Wolfcampian) limestones, represented by the Hueco Formation in the study area, indicate a return to passive margin conditions and a shallow marine depositional environment (Figures 3-6 and 3-7).
The Chihuahua tectonic belt of DeFord (1958) is a northwest-trending fold and thrust belt that borders the Diablo Plateau to the southwest (Figure 3-5). It likely formed under extensional or transtensional conditions associated with the opening of the Gulf of Mexico (Dickerson, 1980; Salvador, 1987). Siliciclastic and carbonate rocks exposed along the belt were deposited in a rapidly subsiding Chihuahua Trough during Jurassic and Cretaceous time (DeFord and Haenggi, 1971). From Late Jurassic through Middle Cretaceous time some 12,000 to 21,000 ft of sediments accumulated in the trough. Towards the east and northeast, onto the relatively stable Diablo Plateau, thicknesses of Cretaceous rocks decrease significantly (Figures 3-6 and 3-7). Overall marine transgression continued on the plateau during Albian and Cenomanian time, depositing carbonate and siliciclastic sediments in a tectonically stable setting.
Tectonic stability in Trans-Pecos Texas came to an end with the onset of the Laramide Orogeny in Late Cretaceous time. Laramide deformation in the region involved thrust faulting, folding, and monoclinal warping of Cretaceous and older rocks (Figure 3-5). From Late Cretaceous to early Eocene time, east-to-northeast-directed compression produced crustal shortening. Imbricate thrust slices of sedimentary rock from the Chihuahua Trough were transported eastward and stacked up against the southwestern edge of the Diablo Plateau (Hennings and others, 1989).
Laramide thrust faulting and folding ended about 50 million years ago, but a weakened state of compression existed in the Trans-Pecos region until about 31 million years ago (Price and Henry, 1984, 1985). During the intervening period, from middle Eocene to early Oligocene time, widespread volcanism occurred throughout the region (Figures 3-6

11
Figure 3-6a. Geologic map of Hudspeth County (based on digital data from the U.S.
Geological Survey, Austin, Texas, and Barnes, 1979, 1983).

12
Figure 3-6b. Legend for geologic map of Hudspeth County (based on digital data from
the U.S. Geological Survey, Austin, Texas, and Barnes, 1979, 1983).

13
Figure 3-7. Stratigraphic columns for selected areas in Hudspeth County.

14
and 3-7; McDowell, 1979). At about 31 million years ago, regional stress orientations changed from compression to extension, which set the stage for Basin and Range faulting. Early extension was oriented east-northeast but changed to west-northwest, possibly around 10 million years ago (Price and Henry, 1984, 1985). From 24 million years ago to the present, normal faulting and related sedimentation have dominated the geologic and physiographic setting of the region.
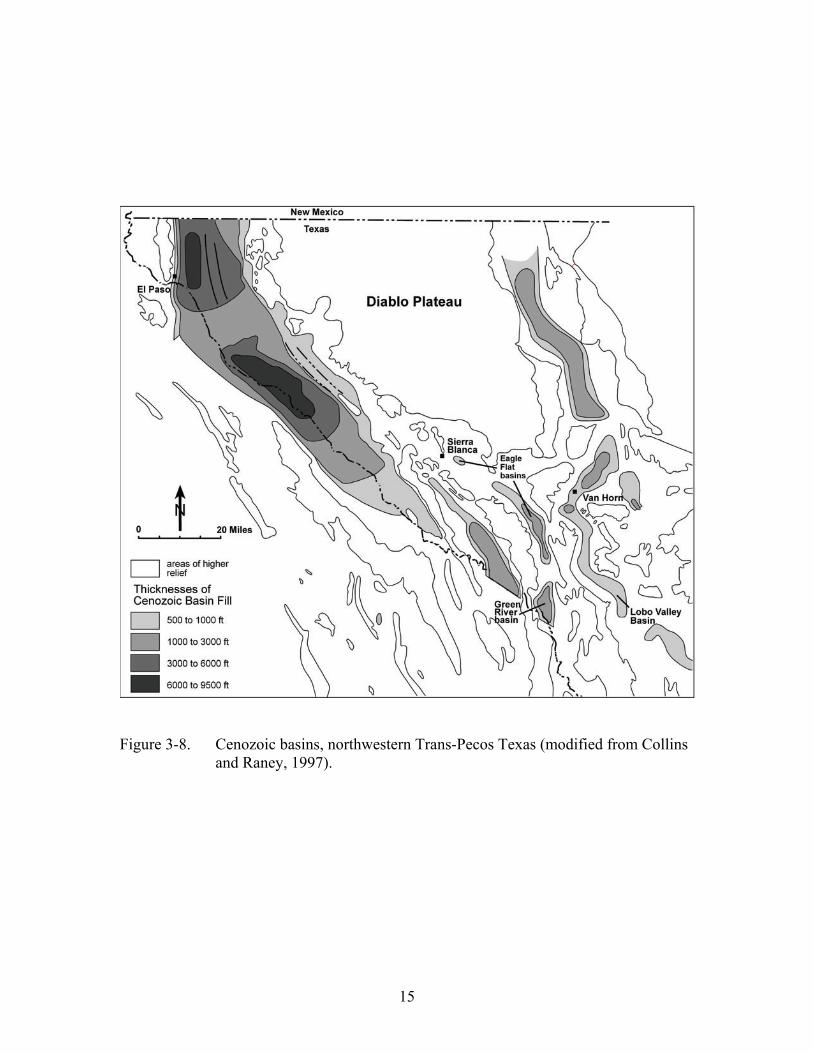
Since early Miocene time, sediments have been eroded from uplifted horst blocks in the region and deposited into adjacent grabens (Stevens and Stevens, 1985). Large amounts of sediment accumulated in these intermontane basins partly filling them and constructing broad alluvial slopes, alluvial fans, and bajadas (Figure 3-8; Collins and Raney, 1997). In the study area, these basins include southeast Hueco Bolson, Red Light Bolson, northwest Eagle Flat Basin, southeast Eagle Flat Basin, and Green River Basin. The thickness of accumulated sediment varies considerably both within and between these basins.
Miocene to early Pleistocene basin fill defines the extent of many of the aquifers in the study area (Figure 3-6). For Red Light Draw, basin-fill deposits are well exposed only in the south where they have been subdivided into the Bramblett and Love formations (Figure 3-7; Akersten, 1967). To the northwest in the Hueco Bolson, basin fill has been subdivided into lower and upper units based on the distribution of a distinct seismic reflector, which may also be a regional unconformity (Collins and Raney, 1991). Only about 100 ft of the youngest upper basin fill are exposed and have been studied in detail (Gustavson, 1991). These sediments have been subdivided into the Fort Hancock and Camp Rice formations and are correlated to the Bramblett and Love formations of Red Light Draw (Akersten, 1967; Gustavson, 1991). Middle and upper Pleistocene deposits overlie the Fort Hancock and Camp Rice formations in the southeast Hueco Basin and include the Miser, Madden, Gills, Ramey, and Balluco gravels (Figure 3-7; Albritton and Smith, 1965).
Quaternary faults in the region have movement and associated deposition occurring along range fronts and within the basins (Figure 3-9; Collins and Raney, 1991, 1997). The lengths of most individual faults in the region are between 11 and 25 miles, although there are larger fault zones between 43 and 65 miles long (Collins and Raney, 1991, 1997). Fault zones strike northwestward or northward, and individual faults dip between 60° to 88° near the surface and from 50° to 80° in the subsurface. The most active basins include the Hueco Bolson and southern Red Light Draw, with Eagle Flat and Green River basins being tectonically less active. Quaternary faults of southeast Hueco Bolson consist of two main zones, one along the northeast margin of the graben and the other along its southwest margin (Collins and Raney, 1991, 1997). There also are several shorter faults within the graben itself. Red Light Bolson has several down-to-the-west faults along its eastern margin that are part of a larger 54-mile-long fault zone extending into Mexico.
15
Figure 3-8. Cenozoic basins, northwestern Trans-Pecos Texas (modified from Collins
and Raney, 1997).

16
Figure 3-9. Quaternary faults, northwestern Trans-Pecos Texas (modified from Collins and Raney, 1997).

17
4.0 Water management
There are, at present, two water management entities in the county. They are the Hudspeth County Underground Water Conservation District No.1 (Underground Water Conservation District) and the Hudspeth County Conservation and Reclamation District No. 1 (Conservation and Reclamation District). Both entities are located in areas of irrigated croplands.
4.1 Hudspeth County Underground Water Conservation District No. 1
The Hudspeth Underground Water Conservation District was created in 1956 and is located in the Dell Valley irrigation area of northeast Hudspeth County, with Dell City lying approximately in the center of the district (Figure 3-1). District activities primarily include monitoring water levels in the aquifer and permitting groundwater use. The Underground Water Conservation District revised its groundwater management plan in May 2002 (HCUWCD, 2002a) to include these goals: provide for the most efficient use of groundwater, control and prevent the waste of groundwater, address natural resource issues, and manage the aquifer in a sustainable manner.
Groundwater production in the district is managed on an acre-ft per acre basis, with preference given to existing and historic users. The Underground Water Conservation District issues two categories of production permits: “validation permits” issued to existing and historic users and “operating permits” issued to new users. Under both permit types the authorized annual production amount increases or decreases as aquifer levels rise or fall. Depending upon aquifer level, validation permit holders may pump between three and four acre-ft per acre per year and operating permit holders may pump between zero and four acre-ft per acre per year.
4.2 Hudspeth County Conservation and Reclamation District No. 1
The Conservation and Reclamation District occupies approximately 18,300 acres of Rio Grande bottomlands from the El Paso-Hudspeth county line downstream to Fort Quitman. Organized in 1924, the district was created to provide adequate irrigation to those bottomlands and to consolidate water diversions from the Rio Grande. It does not supply potable water, and its operations are primarily recycling and reuse of water in the Rio Grande Basin. Under a Warren Act contract, the District has been making a diversion of tailwater, returns, and excess flows from the Rio Grande Project since 1925. A board of directors governs the District, headquartered in Fort Hancock, Texas.
In November 1991, the Conservation and Reclamation District developed an irrigation district plan to conserve Rio Grande waters to the maximum extent possible. These waters include untreated water obtained from permitted Rio Grande diversions, drainage waters, return flows from farming operations, operational waste associated with the U.S. Bureau of Reclamation’s Rio Grande Project, and return flows from El Paso water and sewage treatment plants. Because the water supply to the Conservation and Reclamation District is completely dependent on the El Paso County Water Improvement District No.

18
1, the supply is erratic, and the optimal use of available water is difficult. When supply is erratic, the Conservation and Reclamation District provides drought contingency planning. If a mild or moderate predicted shortage occurs, the District notifies its users of the amount of the expected shortage. For a severe shortage, in which the water supply provides less than 50 percent of the expected demand, the District asks agricultural producers to prioritize their water requests based upon crop needs.
5.0 Previous hydrogeologic studies
Previous hydrogeologic studies in Hudspeth County have been concentrated in three regions: the southeastern Hueco Bolson and Diablo Plateau area, the Red Light Draw-Eagle Flat-Green River basins, and the Dell Valley area in the northeastern part of the county. The U.S. Geological Survey, the Bureau of Economic Geology at The University of Texas at Austin, the Texas Water Development Board, and the Department of Geological Sciences at The University of Texas at Austin have been the primary institutions involved in basic hydrogeologic research in the area. A great deal of the research done in the Hueco Bolson and on the Diablo Plateau was to characterize possible low-level radioactive waste repository sites.
There have been no Groundwater Availability Models developed within Hudspeth County. However, several numerical groundwater flow models have been developed. Mullican and Senger (1992) constructed a numerical groundwater flow model to help determine controlling factors of regional flow in southwest Hudspeth County. Darling and others (1994) and Hibbs (1996) developed an interpretive cross-sectional numerical groundwater flow model of the formations beneath Red Light Draw and Eagle Flat. The Texas Water Development Board and the New Mexico Water Resources Research Institute developed a cross-sectional model for the southwest part of the county (TWDB and NMWRRI, 1997). The Bureau of Economic Geology developed an unpublished three-dimensional numerical groundwater flow model of West Texas Bolsons aquifers in Hudspeth County (Robert Mace, personal communication, 2004). The U.S. Geological Survey developed a model of the Hueco Bolson aquifer in El Paso County (Heywood and Yager, 2003) with an emphasis on the hydrogeology in the northwestern part of the basin near the city of El Paso (Figure 3-1). Mayer (1995) and Mayer and Sharp (1998) used a two dimensional steady-state finite-element model to test potential configurations of regional transmissivity in rocks including the Bone Springs-Victorio Peak aquifer in northeastern Hudspeth County. El Paso Water Utilities is currently working on a groundwater model in the same general area. (Bill Hutchison, El Paso Water Utilities, 2004, personal communication).
6.0 Hydrogeology of Hudspeth County
Hudspeth County contains parts of the Bone Spring–Victorio Peak, Capitan Reef Complex, Hueco Bolson, and West Texas Bolsons aquifers. Although not recognized as a named minor aquifer by the Texas Water Development Board (it would fall under the ‘other’ category), the Diablo Plateau aquifer is also present in the county. We describe
19
each of these aquifers below and present information on water levels, recharge, hydraulic properties, discharge, and water quality.
6.1 Bone Spring–Victorio Peak aquifer
The Texas Water Development Board recognizes the Bone Spring–Victorio Peak aquifer as a minor aquifer of Texas. Its current boundaries, as defined by the Texas Water Development Board, are in the Dell Valley irrigation area in northeastern Hudspeth County (Figure 3-1; Ashworth and Hopkins, 1995; TWDB, 2002). The delineated extent of the aquifer is based on the occurrence of irrigable land that overlies the Bone Spring and Victorio Peak limestones, the location of a dominant fault to the south, and the edge of the Salt Basin to the east (Ashworth and Flores, 1991). The Bone Spring–Victorio Peak aquifer extends north into Crow Flats in New Mexico.
6.1.1 A proposed new boundary
There have been a number of studies on the Bone Spring–Victorio Peak aquifer since the Texas Water Development Board delineated its boundary. These studies, as well as geologic and hydrogeologic evidence, suggest that the boundary of the aquifer should be expanded.
The same formations that make up the current delineation of the Bone Spring–Victorio Peak aquifer extend over a much broader area (Figure 6-1). The Bone Spring and Victorio Peak limestones extend to the south beneath the Salt Basin, to the west and southwest beneath the Diablo Plateau, and to the northwest into New Mexico (Mullican and Mace, 2001).
Recent studies have shown that the currently defined aquifer has a broader hydrologic connection to the surrounding area. Mayer (1995) and Mayer and Sharp (1998) showed through water-level mapping and a groundwater flow model that the Dell Valley area receives groundwater flow not only from the north, but also from the west. A numerical groundwater flow model of the Bone Spring–Victorio Peak aquifer in the Dell City area being developed by El Paso Water Utilities also includes a larger area to capture the full hydrologic system (Bill Hutchison, El Paso Water Utilities, 2004, personal communication).
Given that the formations making up the Bone Spring–Victorio Peak aquifer (the Bone Spring and Victorio Peak limestones) extend over a large area, where should the limits of the aquifer be? An argument can be made that the aquifer should contain the entire extent of Bone Spring and Victorio Peak limestones. In other words, the Bone Spring–Victorio Peak aquifer should include all of the Diablo Plateau. However, an argument can also be made to not include all of the Diablo Plateau in the aquifer delineation. Cretaceous rocks appear in the southern part of the Diablo Plateau on top of the Permian Bone Spring and Victorio Peak limestones creating a separate hydrostratigraphic unit or aquifer (Figure 6-1; Kreitler and others, 1986, 1987, 1990; Mullican and Mace, 2001). The Bone Spring and Victorio Peak limestones in the northern part of the county, especially in the

20
northeast, are heavily fractured and karstified. This does not appear to be the case elsewhere in the area.
Based on the above information, we propose a new boundary for the Bone Spring–Victorio Peak aquifer in Texas that is focused on containing all of the groundwater flowing into the Dell Valley and is based on geologic and hydrogeologic information instead of the extent of irrigable lands. This boundary is defined on the east by the center line of the Salt Basin, which is the original, pre-development discharge area for the groundwater flow system (A to B, Figure 6-1). The southern boundary follows the Bitterwell Break (B to C, Figure 6-1; Goetz, 1977; Boyd and Kreitler, 1986) out of the Salt Basin, a feature that reportedly corresponds to a groundwater divide (Nielson and Sharp, 1985; Boyd and Kreitler, 1986). Bitterwell Break is a Tertiary normal fault that deforms the sediments of the Salt Basin. Moving westward, the southern boundary transfers from the Bitterwell Break to the Babb Flexure, a structural hinge or bend in the rocks (C to D, Figure 6-1; King, 1965; Goetz, 1977; Boyd and Kreitler, 1986). The southern boundary follows the Babb Flexure, which coincides with a groundwater flow line, to the northwest. The mapped extent of the Babb Flexure does not reach the state line. Therefore, we followed a flow line based on the potentiometric surface of Mayer (1995) and Mayer and Sharp (1998) that extends from the Babb Flexure to the state line (D to E, Figure 6-1). The northern extent of the aquifer in Texas is then defined by the state line with New Mexico (see Mayer [1995] and Mayer and Sharp [1998] for information and extent of the aquifer in New Mexico). We plan to present this new, proposed boundary to the Texas Water Development Board for approval as part of the 2007 State Water Plan.
6.1.2 Geology and hydrostratigraphy
The Diablo Plateau, the Salt Basin, and the Guadalupe Mountains are the three primary structural features in northern Hudspeth County (Figure 6-2). Permian limestones and dolomites of the Diablo Plateau dip to the east-northeast (Figure 3-6). Superimposed onto the general homoclinal structure of the plateau are two northwest-southeast-trending, north-side-down monoclines, the Babb and Victorio flexures (Figure 3-5). Both of these structures formed in post-Early Pennsylvanian/pre-Hueco Limestone (Wolfcampian) time (King, 1965; Dickerson, 1980). The Salt Basin is an approximately 260-mile-long north-to-northwest-trending graben (Goetz, 1977, 1985; Angle, 2001). The basin has a structural floor that dips to the southwest and is overlain by as much as 2,460 ft of Tertiary basin fill and Quaternary alluvium (Veldhuis and Keller, 1980).
Numerous high-angle faults and fractures occur between an area just north of Dell City and the southern Sacramento Mountains in New Mexico (Mayer, 1995; Mayer and Sharp, 1998). This area, named the Otero Break, is characterized by a series of down-to-the-west normal faults and a zone of intense fracturing. The fractures provide pathways for groundwater flow between the Sacramento Mountains to the north and the Dell valley area to the south (Mayer, 1995; Mayer and Sharp, 1998).

21
Figure 6-1. Proposed new boundary for the Bone Spring–Victorio Peak aquifer.

22
Figure 6-2. Generalized geologic cross-section for northeastern Hudspeth County (modified from Ashworth, 1995).
The principal water-bearing units of the Bone Spring-Victorio Peak aquifer are carbonate rocks of Permian age. This includes the Bone Spring Limestone, which consists mainly of black to dark gray cherty limestone with thin interbedded black or brown shale (Figures 3-6 and 6-2). It has a reported thickness of at least 500 ft in the study area and thicknesses of 900 to 1,700 ft to the south near Sierra Diablo (Peckham, 1963; Dietrich and others, 1968). The Bone Spring Limestone grades upwards and southwestward into the Victorio Peak Limestone. The Victorio Peak Limestone is a light gray, thick-bedded, mainly calcitic, but slightly dolomitic, limestone. It has a maximum thickness of 800 ft in the study area and a thickness of 900 to 1,500 ft at Sierra Diablo (Peckham, 1963; Dietrich and others, 1968). Both formations have developed significant solution cavities along joints and fracture planes (Ashworth, 1995).
23
6.1.3 Water levels and groundwater flow
The water-level map, or potentiometric surface, for northern Hudspeth County indicates that groundwater flows regionally towards the east-northeast from the Diablo Plateau to the Salt Basin (Figures 6-3 and 6-4; Ashworth, 1995). Within the Salt Basin groundwater is drawn upwards towards the surface by evaporation through the capillary fringe in the salt flats (Boyd and Kreitler, 1990). Significant amounts of groundwater also flow into the Dell Valley area from the Sacramento Mountains in New Mexico through a set of northwest-southeast trending fractures (Mayer, 1995). Kreitler and others (1990) have postulated there may be some southeasterly subsurface flow through Permian carbonate rocks below the Salt Basin. Farther south in Culberson County, groundwater flow within the Salt Basin is to the southeast (Angle, 2001). In Dell Valley, groundwater flow is probably controlled by the orientation and concentration of solution cavities developed along prominent fractures and bedding planes (Ashworth, 1995). In the irrigation season, groundwater flows toward pumping centers.
Water levels in the Bone Spring–Victorio Peak aquifer show declines over a period of about 55 years (Figure 6-5). The declines range from 5 to 60 ft with a mean of about 30 ft and are likely due to irrigation pumping. The latter 30 years of this period, however, display essentially constant groundwater levels, except for the last few years due to drought. Because it was measured more frequently, one well, well 48-07-516, also shows seasonal fluctuations, probably due to pumping (Figure 6-6).
6.1.4 Recharge
Recharge to the Bone Spring–Victorio Peak aquifer is sourced from the Sacramento River, the Diablo Plateau–Otero Mesa, and irrigation return flow. The primary source of recharge to the aquifer occurs through the Sacramento River in New Mexico where the river leaves higher elevations in the Sacramento Mountains of New Mexico and encounters flatter surfaces on the mesa to the south (Scalapino, 1950; Ashworth, 1995). A broad regional fracture zone, extending from the Sacramento Mountains to the Salt Basin near Dell City, is a major conduit for groundwater to flow into Texas (Mayer, 1995).
Most of the recharge in the Diablo Plateau occurs through fractures along arroyos, which allow relatively rapid recharge to the aquifer. Recharge in the Diablo Plateau, which is similar to recharge in the Otero Mesa in New Mexico, is discussed in Section 6.2.3.
In the Dell Valley area, recharge occurs through irrigation return flow. Logan (1984) estimated that 35 percent of groundwater pumped returns to the aquifer. Davis and Gordon (1970), however, estimated a return-flow as high as 50 percent, while the Hudspeth County Underground Water Conservation District (2002b) estimated a leaching fraction, or return flow, of 30 percent.
On the western side of Dell Valley, flood control structures have the capability of providing as much as 3,300 acre-ft of recharge annually through seepage (EP-HSWCD and others, 1969). In addition, the Natural Resources Conservation Service of the U.S. Department of Agriculture drilled 11 wells to use captured water from the dams to

24
SE
SW
NE
well location
N0 5 10 20 Miles
Figure 6.3. Locations of study areas for the Hueco, Bone Spring–Victorio Peak, and West Texas Bolsons aquifers with well locations and surface-water drainage.

25
0 5 10 Miles
Contour Interval: 20 feet
3620
3680
3600
N
Figure 6-4. Water-level map of northeastern Hudspeth County

26
Fi
gure
6-5
. H
ydro
grap
hs fo
r sel
ecte
d w
ells
in n
orth
east
ern
Hud
spet
h C
ount
y.

27
3400
3450
3500
3550
3600
3650
12/20/1962 6/11/1968 12/2/1973 5/25/1979 11/14/1984 5/7/1990 10/28/1995 4/19/2001 10/10/2006Year
Wat
er-L
evel
Ele
vatio
n(fe
et a
bove
mea
n se
a le
vel)
3400
3450
3500
3550
3600
3650
12/10/02 1/29/03 3/20/03 5/9/03 6/28/03 8/17/03 10/6/03 11/25/03 1/14/04
Year 2003
Wat
er-L
evel
Ele
vatio
n (fe
et a
bove
mea
n se
a le
vel)
Figure 6-6. Hydrographs for well 48-07-516, completed in the Bone Spring–Victorio
Peak aquifer at the Dell City Community Center.
recharge the Bone Spring–Victorio Peak aquifer at a rate of at least 2,000 gallons per minute (Logan, 1984).
Ashworth (1995) estimated 90,000 to 100,000 acre-ft for total annual recharge to the Bone Spring-Victorio Peak aquifer, based on values of annual pumpage in the Dell Valley area. This figure includes both lateral inflow and irrigation return flow.

28
6.1.5 Hydraulic properties
The hydraulic properties of the carbonate aquifers of Dell Valley and the surrounding Diablo Plateau area are highly variable on a small scale. In many parts of the Dell Valley area, one well produces at a rate of more than 2,000 gallons per minute while another well 100 ft away produces less than 100 gallons per minute (Scalapino, 1950). This variability is due to numerous fractures that were produced by faulting and subsequently enlarged by dissolution (Kreitler and others, 1987, 1990; Ashworth, 1995; Mayer, 1995; Mayer and Sharp, 1998; Mullican and Mace, 2001). On a relatively larger scale, the limestones and dolomites of the aquifers are extremely transmissive. Wells in the Bone Spring-Victorio Peak aquifer in the Dell City area have produced approximately 98,500 acre-ft per year for 30 years with only 33 ft of drawdown (Kreitler and others, 1990). Individual wells, sited using lineament analysis and aerial photographs, can produce 2,000 to 3,000 gallons per minute.
Several pumping tests from wells on the Diablo Plateau showed no measurable drawdown during extended periods of production (pumping tests with discharges of less than 20 gallons per minute typically lasting 48 hours or longer; Kreitler and others, 1990). The Far West Texas Regional Water Planning Group encountered similar results on the plateau in northwest Hudspeth County, where wells produced 40 to 300 gallons per minute for 48 hours with no drawdown (FWTRWPG, 2001). In the Dell City area, Peckham (1963) reported a range in specific-capacity values of 5 to 64 gallons per minute per foot in the Bone Spring–Victorio Peak aquifer. Using the Thomasson and others (1960, C equals 1.2) method of estimating transmissivity from specific capacity, Mullican and Mace (2001) calculated transmissivity values of 1,200 to 15,000 ft2/day.
6.1.6 Discharge
Groundwater discharges from the Bone Springs–Victorio Peak aquifer through evaporation, interbasin flow, and pumping. Groundwater from the Diablo Plateau to the west and the Sacramento Mountains and Otero Mesa to the north in New Mexico flows into the northern Salt Basin where it evaporates (Chapman, 1984; Boyd and Kreitler, 1986; Kreitler and others, 1990; Mayer, 1995; Mayer and Sharp, 1998). Evaporation produces gypsum, halite, and carbonates in the salt flats of the basin. Precipitation of gypsum also appears to be occurring within much of the Quaternary fill of the basin, which reduces the permeability of these sediments (Kreitler and others, 1990). Evaporation rates on the salt flats could theoretically range from 15.7 to 78.7 inches per year (Boyd and Kreitler, 1986), which equates to about 49,000 to 243,000 acre-ft of water evaporating annually (Ashworth, 1995).
Groundwater from the Diablo Plateau may also be discharging by interbasin flow beneath the salt flats through Permian carbonates and eventually discharge to the Balmorhea area or the Cenozoic Pecos Alluvium aquifer in Pecos County (Nielson and Sharp, 1985; Kreitler and others, 1990). Kreitler and others (1990) suggest that groundwater flow is forced beneath low permeability evaporites and Quaternary sediments in the Salt Basin to Permian strata. This could explain the lack of springs along the western edge of the salt

29
flats, provide an outlet for the thick fresh-water section of the Diablo Plateau, and account for the calcium-sulfate composition of Balmorhea area spring water (Kreitler and others, 1990).
Significant amounts of groundwater have been pumped and are being pumped from the Bone Spring–Victorio Peak aquifer in the Dell Valley irrigation district. Since the late 1940s, pumping has been the principal means of discharge for the aquifer (see Section 7.2; Ashworth, 1995). Pumping on the Diablo Plateau is limited to scattered wells used for livestock or domestic purposes (TWDB, 2005).
6.1.7 Water quality
Water quality on the Diablo Plateau is generally slightly saline with total dissolved solids values of 1,000 to 3,000 milligrams per liter (mg/L; Figure 6-7). In the Dell Valley area, salinity increases to moderately saline in the 3,000 to 10,000 mg/L range. Chloride, sulfate, magnesium, and sodium concentrations are higher in the Dell Valley area than on the Diablo Plateau (Figure 6-8). Fluoride, however, shows the opposite pattern, with higher concentrations on the plateau than in Dell Valley.
Significant differences in major ion compositions exist between the Bone-Spring–Victorio Peak and other aquifers in the area (Figure 6-9). Samples from Cretaceous carbonates on the Diablo Plateau have relatively higher sodium concentrations compared to Permian carbonates but fairly equal concentrations of bicarbonate, sulfate, and chloride (Figure 6-10). The Bone Spring–Victorio Peak aquifer is characterized by low bicarbonate, high sulfate, and a wide range of calcium and sodium values (Figure 6-11). Major ions from the Bone Spring–Victorio Peak aquifer define four major and two minor hydrochemical facies.
Water quality in this area of Hudspeth County appears to be controlled by two mechanisms: (1) groundwater flowing through the aquifer system and dissolving minerals along its flow path, and (2) irrigation water percolating down through the soil zone (Ashworth, 1995; Mayer, 1995). The first mechanism is the main geochemical process acting in aquifers of the Diablo Plateau and involves the dissolution of gypsum (Mayer, 1995). As groundwater flows to the northeast towards Dell Valley, calcium replaces sodium as the dominant cation and anion composition changes from mixed-facies to sulfate facies (Figures 6-11 and 6-12).
In the Dell Valley area, since the beginning of agricultural development in the late 1940s, irrigation has affected natural geochemical processes involving mineral dissolution and reprecipitation. Groundwater in the area has shifted from a calcium-sulfate water type before 1950 to a mixed calcium-sodium-sulfate-chloride type after 1950 (Figure 6-13). Salinity has increased over time due to irrigation. Major ions in wells 48-07-502 and 48-07-205 display increases in concentration, with some ions showing larger increases than others (Figure 6-14). One exception to this is a slight decrease in bicarbonate values.
These changes in water chemistry suggest that gypsum dissolution and dedolomitization (Back and others, 1983) are the dominant chemical reaction affecting the area (Mayer,

30
Figure 6-7. Total dissolved solids in Hudspeth County groundwater, 1939 to present.

31
Figure 6-8. Major ion concentrations for groundwater in Hudspeth County.

32
Figure 6-9. Piper plot of major ion compositions for the aquifers in northeastern
Hudspeth County.

33
Figure 6-10. Piper plot and selected Stiff diagrams of groundwater from Cretaceous
rocks, northeastern Hudspeth County.
34
Figure 6-11. Piper plot delineating hydrochemical facies based on major ion compositions and selected Stiff diagrams, Bone Spring–Victorio Peak aquifer, northeastern Hudspeth County.

35
Figure 6-12. Map displaying the distribution of hydrochemical facies using Stiff diagrams, along with individual hydrochemical facies and respective Stiff diagrams of the Bone Spring–Victorio Peak aquifer, northeastern Hudspeth County.

36
Figure 6-13. Piper plot of major ions from pre- and post-1950 water samples of the
Bone Spring-Victorio Peak aquifer, northeastern Hudspeth County.

37
Well 48-07-502
0
500
1000
1500
2000
2500
3000
3500
1940 1950 1960 1970 1980 1990 2000 2010
year
mg/
l
NaClSO4CaMgHCO3
Well 48-07-205
0
500
1000
1500
2000
2500
3000
1940 1950 1960 1970 1980 1990 2000 2010
year
mg/
l
NaClSO4CaMgHCO3
Figure 6-14. A plot of major ion concentrations for water samples from two wells
taken over the time period 1948 to 2001.

38
1995). With the dissolution of gypsum, calcium concentrations increase, causing the precipitation of calcium carbonate. This removes carbonate ions from solution, which produces an undersaturation with respect to dolomite. Together, the reactions can account for the increases in calcium, magnesium, and sulfate and the slight decrease in bicarbonate concentration (Mayer, 1995). The increases in sodium and chloride concentrations are likely due to some combination of the following: (1) irrigation return flow dissolving salts in the vadose zone and flushing them into the aquifer; (2) concentration of return flow by evaporation during the hot, dry growing season; and (3) cross-formational flow from a perched aquifer with high total dissolved solids values to the main Bone Spring–Victorio Peak aquifer (Mayer, 1995).
Water quality in the Dell Valley area is also strongly influenced by groundwater flow from New Mexico to the north (Mayer, 1995; Mayer and Sharp, 1998). A large plume of relatively fresh water enters the Dell Valley area from the north, lowering total dissolved solids values and increasing the potential for dissolution.
6.2 Diablo Plateau aquifer
The Diablo Plateau aquifer is not one of the named minor aquifers of Texas but falls under the ‘other’ category (see Ashworth and Hopkins, 1995; TWDB, 2002). Its boundaries coincide with the Diablo Plateau in the central part of Hudspeth County (Figures 3-1 and 3-5), but this section of the report does not discuss the part of the plateau already described in Section 6.1 on the Bone Spring–Victorio Peak aquifer.
6.2.1 Geology and hydrostratigraphy
The Diablo Plateau is an uplifted, east-northeast-dipping homoclinal structure (Figure 3-5; King, 1965; Barnes 1983). It is bounded by Tertiary and Quaternary normal faults to the south, east, and west and extends into New Mexico where it is called the Otero Mesa (Henry and Price, 1985; Collins and Raney, 1991, 1997; Mayer, 1995). The plateau consists of Permian and Cretaceous limestones interbedded with sandstones and shales (Figure 3-6). Rocks exposed at the surface include the Cretaceous Finley Limestone and Cox Sandstone and the Permian Victorio Peak and Bone Spring limestones. Miocene to Holocene and Quaternary alluvium overlies the older rock in drainage areas. Superimposed onto the general structure of the plateau are two northwest-southeast-trending monoclines, the Babb and Victorio flexures (Figure 3-5). Both of these structures are north-side-down monoclines formed in post-Early Pennsylvanian/pre-Hueco Limestone (Wolfcampian) time (King, 1965; Dickerson, 1980).
The Diablo Plateau aquifer can be subdivided into two aquifers based on water-level information (Kreitler and others, 1986, 1990; Mullican and Mace, 2001). The first aquifer is located in the Cretaceous limestones in the southwestern part of the plateau, and the second aquifer is located in the Permian limestones underlying the Cretaceous rocks in the north-central part of the plateau (Figure 3-6). Although both aquifers are primarily unconfined, the Cretaceous aquifer is locally perched and confined to semiconfined (Kreitler and others, 1990), while the Permian aquifer is most likely confined beneath the

39
Cretaceous rocks. The Permian rocks are the lateral equivalents to limestones of the Bone Spring-Victorio Peak aquifer to the northeast (Mullican and Mace, 2001).
6.2.2 Water levels and groundwater flow
Water levels show that there is a mound of water in the south-central part of the Diablo Plateau corresponding to a local topographic high (Mullican and others, 1987; Kreitler and others, 1990). Groundwater flows outward from this high to the southwest toward the Hueco Bolson, to the northeast toward the Salt Basin, and to the southeast toward the Finlay Mountains and northwest Eagle Flats. Limited information also suggests that a component of groundwater flows north. Most of the water flows down the structural dip of the monocline toward the northeast, with only a minor amount of water flowing into the Hueco Bolson (Mullican and others, 1987; Kreitler and others, 1990). Hydraulic gradients are lower in the central Cretaceous part of the plateau and much higher along the Hueco Bolson and southern and eastern edges of the plateau.
As mentioned in Section 6.2.1, there are two aquifers on the plateau. The Cretaceous aquifer has water level elevations significantly higher than those in the Permian aquifer to the northeast. Water level elevations range from about 4,000 to 4,600 ft in Cretaceous rocks and about 3,400 to 3,600 ft in Permian rocks (Kreitler and others, 1987, 1990; TWDB, 2005). Hydraulic gradients are lower in the Permian aquifer and much higher for the Cretaceous aquifer.
The Permian and Cretaceous parts of the Diablo Plateau aquifer are vertically connected to one another and are laterally connected to a number of other aquifers in the area. The Cretaceous aquifer is hydraulically connected to the Hueco Bolson aquifer to the west (Mullican and Senger, 1990, 1992), to the Salt Basin to the east, and to the Bone Spring–Victorio Peak aquifer in the Dell Valley area to the northeast (Peckham, 1963; Young, 1975; Kreitler and others, 1990; Mayer, 1995; Mullican and Mace, 2001). Rocks of the Permian aquifer are likely hydraulically connected to rocks of the Bone Spring–Victorio Peak aquifer.
6.2.3 Recharge
Most recharge on the Diablo Plateau occurs through fractures along arroyos during storm rainfall and flooding, which allows relatively rapid recharge to the aquifer. Recharge occurs over the entire catchment area of approximately 2,900 mi2. Recharge is recent, within about the last 50 years, based on tritium values in wells sampled on the plateau (Mullican and others, 1987; Kreitler and others, 1990). Estimates of annual recharge for the region range from 0.008 to 0.276 inches per year (Mayer, 1995).
Chloride concentrations on the plateau are significantly lower in arroyo soils compared with those between the arroyos, suggesting flushing of chloride by precipitation recharge (Mullican and others, 1987; Kreitler and others, 1987, 1990; Scanlon and others, 1991). Water flux estimates based on chloride concentrations are as low as 0.0009 to 0.0022

40
inches per year between the arroyos and 0.0028 to 0.0688 inches per year within arroyos (Scanlon and others, 2001).
6.2.4 Hydraulic properties
Due to fractures caused by faulting and subsequent dissolution, the limestones of the Diablo Plateau may have the ability to transmit large volumes of water (Mullican and Mace, 2001). Aquifer tests in wells on the plateau support this notion of fracture flow (Mullican and others, 1987; Kreitler and others, 1987, 1990). Kreitler and others (1987) calculated transmissivity for both the Cretaceous aquifer in the southwest and the Permian aquifer in the northeast. The Permian rocks had values ranging from 0.3 to 230 ft2/day. The Cretaceous aquifer, however, had significantly higher transmissivity values ranging from about 5,000 to 6,700 ft2/day. In northwestern Hudspeth County, several wells produced 40 to 300 gallons per minute with no drawdown (LBG-Guyton Associates, 2001).
6.2.5 Discharge
Groundwater discharges from the Diablo Plateau aquifer by cross-formational flow, evaporation at salt flats, and pumping. Groundwater that flows to the southwest across the Hueco Bolson discharges to the Rio Grande through the Hueco Bolson aquifer (Mullican and Mace, 2001). Groundwater flowing northeast through Dell Valley discharges and evaporates in the Salt Basin. Evaporation precipitates minerals such as gypsum, halite, and other carbonates, which has the effect of reducing the permeability of sediments in the salt basin (Chapman, 1984; Boyd and Kreitler, 1986; Kreitler and others, 1990). Groundwater may also be discharging by interbasin flow beneath the Salt Basin through Permian carbonates (Nielson and Sharp, 1985; Kreitler and others, 1990). This groundwater is thought to discharge eventually to the Balmorhea area in Reeves County or the Cenozoic Pecos Alluvium in Pecos County. Windmills and low-capacity pumps also discharge limited amounts of water from the aquifer.
6.2.6 Water quality
Water quality is generally slightly saline with total dissolved solids values of 1,000 to 3,000 mg/L (Figure 6-7). Chloride, sulfate, magnesium, and sodium concentrations on the Diablo Plateau are lower than they are in the Dell Valley area (Figure 6-8), while fluoride concentrations are higher. Water quality samples from Cretaceous carbonates on the plateau have relatively higher sodium compositions compared to Permian carbonates and fairly equal concentrations of bicarbonate, sulfate, and chloride (Figure 6-9).

41
6.3 Hueco Bolson aquifer
The Texas Water Development Board recognizes the Hueco-Mesilla Bolson aquifer as a major aquifer of Texas (Ashworth and Hopkins, 1995; TWDB, 2002). In Texas, the aquifer is made up of two bolsons: the Mesilla Bolson and the Hueco Bolson. Only the Hueco Bolson part of the aquifer appears in Hudspeth County. Therefore, for this report, we refer to the aquifer as the Hueco Bolson aquifer. Its boundaries in Hudspeth County are based on the lateral extent of sediments in the Hueco Bolson (Figure 3-8). The aquifer extends out of the county to the northwest into El Paso County and across the Rio Grande to the southwest into Mexico.
The uppermost part of the Hueco Bolson aquifer includes the Rio Grande Alluvium, which some consider as a separate aquifer. In this document, we consider the Rio Grande Alluvium aquifer to be part of the Hueco Bolson aquifer. However, where appropriate, we discuss groundwater in the Rio Grande Alluvium separately.
6.3.1 Geology and hydrostratigraphy
The southeastern part of the Hueco Bolson is bounded to the north and south by rugged horst blocks of Cretaceous carbonates and siliciclastics. Deep Tertiary sediments of the southeastern Hueco Bolson are separated from those in the northwestern part of the bolson, creating two structural sub-basins (Collins and Raney, 1991). The nature of the basin divide is not known, but it coincides with a change from north-south trending structures to northwest-southeast-trending structures (Figure 3-5). The southeastern part of the Hueco Bolson has a total surface area of 829 mi2, of which 61 percent lies in the United States (TWDB and NMWRRI, 1997). The floor of the bolson slopes southwest from elevations of 3,600 to 4,600 feet at the Diablo Plateau escarpment and Quitman Mountains to 3,300 to 3,550 ft along the Rio Grande. It slopes to the northeast from mountain fronts in Mexico from 4,100 to 4,450 ft to the Rio Grande.
The Hueco Bolson aquifer consists of Cenozoic basin-fill sediments that occur as minor sand lenses interstratified with clays and silty clays (Mullican and Senger, 1992). These sediments were deposited in environments ranging from alluvial fans to ephemeral lakes and saline playas (Gustavson, 1991). The sediments are characterized by significant internal discontinuities due to Basin and Range extensional faulting and the tabular and lenticular nature of the deposits (Fisher and Mullican, 1990a, 1990b). The thickness of Cenozoic basin fill increases from 500 to 650 ft along the eastern margin of the basin to 9,350 ft in its central and western parts (Collins and Raney, 1991). Saturated basin fill is principally in the Fort Hancock Formation in sediments that are mostly lacustrine (lake-deposited) clays; bedded gypsum; and sand, silt, and clay from alluvial fans and fluvial deposits.
The Rio Grande Alluvium formed in Late Quaternary time from incision by the Rio Grande into the Hueco Bolson (Figure 3-6, Qalr). The alluvium consists of reworked basin-fill sediments, eroded bedrock from nearby mountains, and sediments transported from New Mexico and Colorado. Braided and meandering fluvial sediments were

42
deposited during alternating periods of scour and fill. They form lenses and beds of gravel, sand, silt, and clay that are highly irregular in thickness and lateral extent (USBR, 1973; Alvarez and Buckner, 1980; TWDB and NMWRRI, 1997). The total thickness of fill averages 210 ft in the United States and 170 ft in Mexico (IBWC, 1989). Windblown sand and silt deposits with dunes of 15 ft or less overlie the alluvial fill (Figure 3-6, Qws, Qwsd; IBWC, 1989) and act as surfaces for infiltration and recharge, because they are well sorted and have very little vegetation.
Cretaceous carbonate and siliciclastic rocks exposed in the highlands of the Diablo Plateau lie unconformably beneath Cenozoic basin-fill sediments of the Hueco Bolson (Mullican and others, 1989; Fisher and Mullican, 1990a, 1990b). These units are likely interconnected by fractures, although data are insufficient to determine if they are acting as a single hydrostratigraphic unit or a series of discontinuous and poorly interconnected strata (Fisher and Mullican, 1990a, 1990b).
6.3.2 Water levels and groundwater flow
Water levels show that groundwater in the Hueco Bolson aquifer in Hudspeth County generally flows south and southwest from the Diablo Plateau and discharges along the Rio Grande (Figures 6-3 and 6-15; Mullican and Senger, 1992). Water level elevations are highest near the mountains and Diablo Plateau escarpment and decrease toward the southwest from 3,720 to 3,480 ft (Figures 6-15 and 6-16). South of the Rio Grande the potentiometric surface also slopes to the river from mountains in Mexico (TWDB and NMWRRI, 1997). The peak elevations of the mountains in Mexico likely represent the locations of groundwater divides.
We constructed maps of water levels in the Rio Grande Alluvium for the years 1962, 1973 and 1974, 1982 and 1983, 1994 and 1995, and 2002 to 2004. Water levels have not changed significantly in the Rio Grande Alluvium in Hudspeth County since 1973 (Figure 6-17 and 6-18).
6.3.3 Recharge
Very little recharge occurs within the Hueco Bolson. Field studies and numerical modeling in the Tertiary basin fill indicate that moisture penetration after rainfall is restricted to the upper few feet of the unsaturated zone because of the low degree of saturation in surficial sediments (Scanlon and others, 1991). Interdrainage areas in the bolson have upward water-potential gradients, high chloride concentrations, evaporative enrichment of stable isotopes of oxygen and hydrogen, shallow penetration of bomb-pulse tracers during the past 40 to 50 years, and radioactive decay of 14C. Together, this information indicates an absence of recharge (Scanlon and others, 1991, 2001). Water potential profiles suggest upward water movement and long-term drying of sediments during the past several thousand years. Chloride profiles indicate that during Pleistocene times (more than 10,000 years ago) water fluxes were higher (Scanlon and others, 1991, 2001). Some minor recharge does appear to occur in areas of fissured sediments

43
0 5 10 Miles
Contour Interval: 20 feet
N
Figure 6-15. Water-level map of southwestern Hudspeth County.

44
Figure 6-16. A generalized hydrogeologic cross-section, southwest Hudspeth County (modified from TWDB and NMWRRI, 1997).
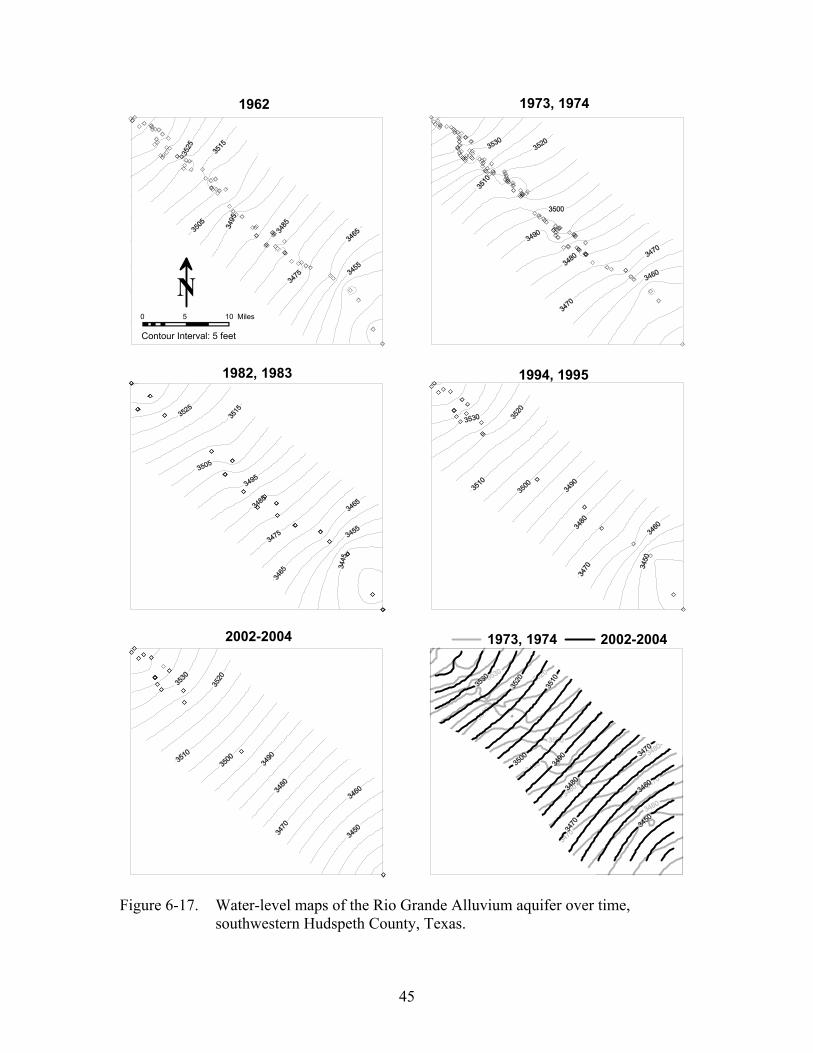
45
1962 1973, 1974
1982, 1983 1994, 1995
2002-2004 1973, 1974 2002-2004
Contour Interval: 5 feet
0 5 10 Miles
N
Figure 6-17. Water-level maps of the Rio Grande Alluvium aquifer over time, southwestern Hudspeth County, Texas.

46
Figu
re 6
-18.
H
ydro
grap
hs fr
om se
lect
ed w
ells
in so
uthw
este
rn H
udsp
eth
Cou
nty,
Tex
as.

47
underlain by fractures (Scanlon, 1992) as well as in areas of exposed Cretaceous rocks along Quaternary normal faults (Mullican and Senger, 1992). The Hueco Bolson receives only a minor amount of cross-formational flow from the Diablo Plateau (Kreitler and others, 1987, 1990).
6.3.4 Hydraulic properties
Hydraulic properties of the Hueco Bolson aquifer vary because of its differing amounts of gravel, sand, and clay. Mullican and Senger (1992) analyzed aquifer tests from 12 wells in the area of the Hueco Bolson in Hudspeth County and determined that transmissivity values range from 0.19 to 290 ft2/day and that hydraulic conductivity values range from 0.0015 to 2.82 ft/day (the wells tested included basin fill and underlying Cretaceous rocks). Their results showed that basin-fill deposits are highly nonuniform with respect to their aquifer properties. Kreitler and others (1987) measured the hydraulic conductivity of two sequences of gravels, clays, and sand in basin fill in the Fort Hancock area. They found that the hydraulic conductivity for the gravels was 0.02 ft/day, and the hydraulic conductivity for the clays and silty sand was 0.01 ft/day.
Mullican and Senger (1992) constructed a numerical groundwater flow model to help determine controlling factors of regional flow across the Hueco Bolson and found that (1) bolson deposits along a Quaternary normal fault (Campo Grande fault) had relatively high permeability, (2) bolson deposits along a subbasin axis located between the Diablo Plateau and the Campo Grande fault had relatively high permeability, and (3) the displacement of permeable Cretaceous strata at the normal fault against bolson deposits to the south produced a low-permeability zone for groundwater flow toward the Rio Grande.
The Texas Water Development Board and the New Mexico Water Resources Research Institute (1997) constructed a two-dimensional, cross-sectional groundwater flow model in the southwestern part of Hudspeth County across the Hueco Bolson (Figure 6-16, line A-A’). They achieved their best match of measured and simulated heads using hydraulic conductivity values of 0.2 to 1.0 ft/day with effective porosities from 0.18 to 0.25 for basin fill. They used hydraulic conductivity values for Cretaceous rocks that ranged from 0.007 to 0.1 ft/day with effective porosities of 0.02 to 0.08. They assigned hydraulic conductivity values of 10.0 ft/day and an effective porosity of 0.20 for the Rio Grande Alluvium.
6.3.5 Discharge
Groundwater discharges from the Hueco Bolson aquifer through pumping, seepage to the Rio Grande, spring discharge, evaporation, and consumption by phreatophytes such as salt cedar (Mullican and Senger, 1992; TWDB and NMWRRI, 1997). Current well water withdrawal from the southeastern Hueco Bolson is limited to pumpage from smaller wells for municipal and livestock purposes (see Section 7.2). Groundwater from the

48
Hueco Bolson aquifer discharges to the Rio Grande Alluvium (Mullican and Senger, 1992), which in turn seeps into the Rio Grande or is pumped from wells in the alluvium.
Hot springs are located near the southwestern end of the Quitman Mountains, where discharge rates range from 2 to as high as 300 to 350 gallons per minute (1973 measurements; TWDB, 2005). The source of the water from the hot springs is likely from rocks below the Hueco Bolson (Henry, 1979) but may include some groundwater from the aquifer.
Significant groundwater is lost to the uptake of water by deep-rooted plants (phreatophytes) such as salt cedar. A study conducted in the Mojave Desert of southern Nevada (Sala and others, 1996) indicates evapotranspiration rates for salt cedar of 85 (minimum) to 234 (maximum) inches per year, or about 17,000 gallons per day per acre (maximum). Salt cedar is common along the Rio Grande alluvium, especially below Fort Quitman.
6.3.6 Water quality
The Hueco Bolson aquifer generally displays a northeast to southwest increase in total dissolved solids values from 1,000 to 3,000 mg/L near the Diablo Plateau to 3,000 to 10,000 mg/L along the Rio Grande (Figures 6-7 and 6-19). Superimposed on this pattern is a northeast-southwest-trending area of high total dissolved solids values (Fisher and Mullican, 1990a, 1990b). Chloride displays similar patterns, increasing from less than 250 mg/L to greater than 2,000 mg/L (Figure 6-8). Sulfate increases from 250 to 750 mg/L to 750 to 2,000 mg/L and magnesium increases from less than 25 mg/L to greater than 150 mg/L. Fluoride, however, displays an opposite pattern, decreasing towards the southwest from 2 to 5 mg/L to less than 1 mg/L. Nitrate concentrations are generally low at less than 10 mg/L, although some values fall within the 44 to 100 mg/L range along the Rio Grande. Fisher and Mullican (1990a, 1990b) reported mean, minimum, and maximum total dissolved solids values of 1,730; 960; and 4,420 mg/L, respectively, from the southeastern Hueco Bolson aquifer.
Based on previous work by Fisher and Mullican (1990a, 1990b, 1997), we describe four hydrochemical facies types for water in the Hueco Bolson aquifer in Hudspeth County: sodium-chloride, sodium-sulfate, calcium-sulfate, and sodium bicarbonate (Figure 6-20). Sodium-chloride facies are located near the river, sodium-sulfate facies are located between the river and the Diablo Plateau, and one sample, on the edge of the plateau, has a calcium-sulfate facies (Figure 6-21). Groundwater in the Diablo Plateau aquifer bordering the Hueco Bolson aquifer has a hydrochemical facies type of sodium-bicarbonate (Fisher and Mullican, 1990a, 1990b, 1997).
An analysis of soils, soil leachates, bolson-fill sediments, water from the unsaturated zone, and groundwater from southwestern Hudspeth County suggests that a simple set of processes is responsible for the hydrochemical evolution of groundwater flowing between the Diablo Plateau and the Rio Grande Alluvium aquifer through the Hueco Bolson (Fisher and Mullican, 1990a, 1990b, 1997). Ionic relations, mineral saturation states, and geochemical modeling indicate that groundwater compositions are controlled by

49
Figure 6-19. Total dissolved solids in groundwater in southwestern Hudspeth County.

50
Figure 6-20. Piper plot delineating hydrochemical facies (as defined in Fischer and Mullican, 1990) for southwestern Hudspeth County.

51
Figure 6-21. Stiff diagrams showing the distribution of hydrochemical facies (as defined in Fischer and Mullican, 1990) in southwestern Hudspeth County.
reactions in the unsaturated zone, the mineralogy of unsaturated sediments and aquifers, location in the groundwater flow system, and extensive irrigation. Recharge on the Diablo Plateau leaches carbonate soil salts and produces calcium-bicarbonate groundwater that moves downward through soil- and sediment-filled fractures. With continued flow and mineral-water interaction, saturation of calcite and dolomite is maintained: gypsum is dissolved: and aqueous calcium and magnesium are exchanged for adsorbed sodium. Groundwater evolves to a sodium-bicarbonate hydrochemical facies type in unsaturated bolson sediments and then to a sodium-sulfate type in both bolson sediments and underlying Cretaceous rocks. The sodium-chloride type groundwater from the Rio Grande Alluvium aquifer is a product of the composition of irrigation water, salinity increases caused by evapotranspiration, dissolution of soil salts, and possibly the application of agricultural chemicals (Fisher and Mullican, 1997).

52
6.4 West Texas Bolsons aquifer
As defined by the Texas Water Development Board, the West Texas Bolsons aquifer is a minor aquifer. It is a complex of smaller aquifers located in Culberson, Hudspeth, Jeff Davis, and Presidio counties. The degree to which these smaller aquifers are connected hydrologically in Hudspeth County is not well known since there has been little research on the subject (Darling and Hibbs, 2001). For each bolson aquifer, however, there is a significant amount of hydrogeologic information available.
6.4.1 Geology and hydrostratigraphy
The West Texas Bolsons aquifer in Hudspeth County can be subdivided, based on physiography, into the Red Light Draw, Green River Valley, and Eagle Flat aquifers (Figure 3-1; Ashworth and Hopkins, 1995). These aquifers may include sediments in the bolsons and the underlying bedrock. Wells in Red Light Draw produce from Cretaceous limestones and sandstones in the northwest and from Tertiary and Quaternary volcanic gravels and basin fill towards the south (Figures 3-6, and 3-7). The Red Light Draw aquifer has a combined section of Tertiary and Quaternary volcanic gravels and basin fill that thickens southward from 500 ft to as much as 3,600 ft (Gates and others, 1980). Thicknesses of Cretaceous rocks are highly variable in the area, as are their lithologies. Wells located within the Rio Grande floodplain produce from alluvium consisting of coarse- to fine-grained sand and silt (Darling and Hibbs, 2001).
The Green River Valley aquifer consists of Cretaceous limestone, sandstone, conglomerate, siltstone, and Tertiary volcanic rocks. Maximum basin-fill thickness ranges from 1,700 to more than 2,000 ft and includes thick sequences of coarse-grained volcanic debris eroded from the surrounding mountains. Basin fill is more than 2,000 ft thick near the Rio Grande and is composed predominately of fine-grained clay, silt, and possibly altered tuff (Gates and others, 1980).
The Eagle Flat aquifer is more variable in terms of host rock. In northwest Eagle Flat the aquifer consists of Cretaceous-age limestones and sandstones. The rocks appear to be highly fractured in places based on single-well aquifer tests (Darling and others, 1994; Darling, 1997). Some 500 to 700 ft of overlying Tertiary basin fill is not a source for groundwater (Gates and others, 1980; Darling, 1997). However, interbedded Tertiary gravel, sand, and silt contain groundwater to the southeast (Darling, 1997; Langford and others, 1999). Thicknesses of the basin fill there are on the order of those to the south in the Green River Valley. The aquifer is composed of Precambrian metamorphic rocks in the vicinity of the Carrizo Mountains (Gates and others, 1980).
6.4.2 Water levels and groundwater flow
The water level map for the West Texas Bolsons aquifer and surrounding area of Hudspeth County is based on water-level information from Texas Water Development Board files (Figures 6-3 and 6-22). Water levels were taken over a time period of about 1940 to the present. We used the most recent measurement for each well. Because this

53
SierraBlanca
City of Sierra Blanca
EagleMountains
Eagle Flat
Scott's Crossing
Green
River
Valley
Indio Mtns.
CarrizoMtns.
Diablo Plateau Groundwater divide
0 5 10 Miles
Contour Interval: 200 feet
N
Figure 6-22. Water-level map of southeastern Hudspeth County with groundwater
divides according to Darling (1997).
area has not had significant groundwater withdrawals, selecting data from this extended period should not adversely affect the resulting potentiometric surface.
Generally, water level elevations in the study area mimic topography (Figure 6-22). They are highest in the mountains and shallowest in the intervening basins. A plot of land-surface elevation versus static water levels displays a reasonably high degree of positive correlation for most of the data (group 1; Figure 6-23; Darling, 1997). However, some of the data (group 2) show a less pronounced correlation between topography and water levels. This suggests two different hydrogeologic regimes (Darling,

54
Figure 6-23. Comparison between water-level elevation and land-surface elevation for
wells measured in southeastern Hudspeth County (modified from Darling, 1997).
1997). Wells with water levels correlating strongly to land surface draw from shallow to relatively shallow groundwater, and wells with water levels that do not correlate as strongly to land surface draw from deeper groundwater unaffected by local topography.
On the basis of water level data, Gates and others (1980), Darling and others (1994), and Darling (1997) located groundwater divides in this part of Hudspeth County (Figure 6-22). Differences in contouring procedures between Darling (1997) and our study account for the crossing of some contour lines with the divides. The divides form hydraulic barriers to groundwater flow between parts of the West Texas Bolsons aquifer.
In the Red Light Draw and the Green River Valley aquifers, south of the groundwater divides, groundwater flows southward and discharges into Rio Grande alluvium (Figure

55
6-22; Darling, 1997). Water flows through Cretaceous rocks in northern Red Light Draw and through Tertiary basin fill and Quaternary alluvium to the south (Albritton and Smith, 1965; White and others, 1980). Quaternary alluvium and Tertiary volcanics are the main water-bearing units in the Green River Valley (White and others, 1980). Groundwater flows south from the Precambrian rocks of the Carrizo Mountains and east from the Cretaceous limestones of the eastern Eagle Mountains (Figure 3-6). Groundwater passes through Precambrian rocks and Tertiary basin fill as it flows eastward under Scott’s Crossing towards Lobo Flat (Darling, 1997).
Darling (1997) suggests that the northeast-southwest-trending groundwater divide between the Carrizo and Eagle mountains limits flow between the Eagle Flat and Green River Valley aquifers. Northwest of the divide is an area of closed water level contours surrounded by three groundwater divides. There are several closed water level contours, as low as 3,600 ft in elevation, in this area (Figure 6-22). This enclosure by groundwater divides, as well as the topographic enclosure of the area, suggests a closed hydrogeologic system where groundwater discharges into a central playa. However, evidence suggests that groundwater flows south beneath the groundwater divide that borders Red Light Draw (Devil Ridge groundwater divide; Darling, 1997).
Wells north of the city of Sierra Blanca in northwest Eagle Flat produce from relatively deep Cretaceous rocks and have water level elevations that correlate poorly to land-surface elevation (Figures 6-22 and 6-23, group 2; Darling, 1997). An analysis of single-well aquifer tests in the Eagle Flat Basin indicate that the Cretaceous bedrock aquifer is confined to leaky confined (Darling, 1997). This confinement necessitates an outlet for groundwater flow in order for water to enter the area. Darling (1997) proposed vertical flow beneath recharge areas to more porous and permeable rocks below the Cretaceous bedrock aquifer. Differences in the elevations of the potentiometric surface in the Eagle Flat and Red Light Draw aquifers would allow vertical flow to merge with an intermediate to regional flow system permitting groundwater to move south beneath Devil Ridge groundwater divide (Figure 6-24, cross-section A-A’).
6.4.3 Recharge
In their initial estimates of the recharge, Gates and others (1980) assumed that 1 percent of the area’s annual precipitation of 12 inches, distributed uniformly across the basins, recharged the aquifer. This assumption translated into 2,000 acre-ft of annual recharge for the Red Light Draw aquifer, 1,000 acre-ft for the Green River Valley aquifer, and 3,000 acre-ft for the Eagle Flat aquifer.
More recent information on the isotopic composition of the groundwater in the area significantly decreases those early estimates (Darling, 1997). Carbon-14 and tritium concentrations indicate that major recharge areas are limited to mountains and uplands, such as the Diablo Plateau and the Eagle Mountains (Figure 6-24). In these areas fractures allow rapid infiltration of meteoric water down to a point where flow is directed laterally, due to a decrease in fracture permeability, beneath alluvial fans. Precipitation recharges directly into the alluvial fans but is thought to be inhibited by the presence of well-developed, low-permeable soils that divert runoff to topographically lower areas

56
Fi
gure
6-2
4.
Con
cept
ual h
ydro
geol
ogic
cro
ss-s
ectio
ns fo
r sou
thea
ster
n H
udsp
eth
Cou
nty
(mod
ified
from
Dar
ling,
199
7).

57
(Darling, 1997). This diverted water is subsequently evaporated and does not recharge the aquifer. This is supported by isotopic values of deuterium and oxygen-18 in shallow soils from the floors of the flats and draws, indicating significant evaporative enrichment. Darling (1997) estimated, based on these isotopic data and a cross-sectional numerical flow model (Hibbs and Darling, 1995), that recharge in the West Texas Bolsons aquifer may be as little as 14 percent of the earlier annual estimates by Gates and others (1980). This equates to annual recharge estimates of 280 acre-ft for the Red Light Draw aquifer, 430 acre-ft for the Eagle Flat aquifer, and 120 acre-ft for the Green River Valley aquifer.
The most recent estimates for recharge in the West Texas Bolsons assume that the margins of the basins and the channels of ephemeral streams draining the mountains are the primary recharge areas (FWTRWPG, 2001). Like those of Gates and others (1980), they are based on the assumption that one percent of average annual precipitation is converted to recharge. The estimates of recharge are about 700 acre-ft per year in the Red Light Draw aquifer, about 700 acre-ft per year in the Green River Valley aquifer, and about 1,000 acre-ft per year for the Eagle Flat aquifer.
The basins are primarily areas of evaporation and transpiration. Scanlon and others (2000) found that interdrainage areas have low water potentials and high chloride concentrations indicating low water fluxes (0.0008 to 0.002 inches per year). Drainage areas had low water potentials and low-to-moderate chloride concentrations attributed to higher water fluxes in the past. Localized topographic depressions such as fissures, gullies, and borrow pits had high water potentials and low chloride concentrations, which indicated high water fluxes (3.94 inches per year). However, the topographic depressions make up less than one percent of the basin area, so their effect on recharge is minimal.
6.4.4 Hydraulic properties
Hydraulic properties for the West Texas Bolsons aquifer in Hudspeth County are controlled by the distribution of fractures from Laramide and Basin and Range tectonism and lithologic variability of the basin fill and underlying Cretaceous rocks.
In the Eagle Flat aquifer, single-well aquifer tests and specific-capacity analyses from the Cretaceous bedrock aquifer indicate that the hydraulic properties of the carbonate and siliciclastic formations are variable. Estimates of hydraulic conductivity varied from 0.00094 ft/day to 539 ft/day, based on specific-capacity data, and storativity was estimated to be 0.0005 (Darling, 1997). Corresponding transmissivity estimates varied from 0.40 to 25,000 ft2/day. Darling (1997) thought that inconsistent lithologies, along with the distribution of fractures, were responsible for the variability of the hydraulic properties.
Between the Eagle Mountains and the Rio Grande across Red Light Draw, Hibbs and Darling (1995) used a two-dimensional finite difference model to simulate groundwater flow using assumed hydraulic properties (Figure 6-24, cross-section C-C’). They based their hydraulic conductivities on previously published values and described lithologies (Underwood, 1962; Gates and others, 1980; Bedinger and others, 1986; Mullican and

58
Senger, 1992). They used hydraulic conductivity values of 0.0009 ft/day for fine basin fill, 1.0 ft/day for coarse basin fill, 30 ft/day for alluvium, and 0.0007 to 0.01 ft/day for bedrock. The results of the modeling produce a close match between measured and simulated heads (Hibbs and Darling, 1995). Modeled flow path trajectories support the notion that groundwater flow is controlled by decreasing fracture porosity as water moves down through bedrock to beneath alluvial fan deposits.
6.4.5 Discharge
Discharge of groundwater from the West Texas Bolsons aquifer in Hudspeth County occurs by spring flow, interbasin flow, evaporation, consumptive use by salt cedar, and pumping (see Figure 6-3 for well locations). There is very little information on spring discharge in Hudspeth County. In fact, only one area in the extreme southeast corner of the county has discharge data. At Mesquite Spring discharge has declined from 12 to 15 gallons per minute in 1974 to 0.3 gallons per minute in 1993. There is evidence that indicates groundwater is discharging by interbasin flow to the east towards Lobo Flat and south towards the Rio Grande (Gates and others, 1980; Darling, 1997). Darling (1997) suggests regional discharge through Cretaceous rocks from north of Devil Ridge to the Rio Grande (Figure 6-24). Shallower groundwater flow within the Red Light Draw and Green River Valley aquifers discharges to low-lying areas along the Rio Grande. An analysis of stream-gauge data suggests no discernible discharge of groundwater to the river and that water in the Rio Grande alluvium is removed by evapotranspiration (Darling, 1997). Geochemical and isotopic studies indicate evaporation of surface runoff in the area within the West Texas bolsons (Darling, 1997; Scanlon and others, 2000), as discussed in the previous section on recharge. Significant groundwater consumption by phreatophytes, such as salt cedar, occurs along the Rio Grande below Fort Quitman (TWDB and NMWRRI, 1997).
Water production in Red Light Draw is for either domestic use or livestock and wild game (Gates and others, 1980; Darling and Hibbs, 2001). Irrigation wells in the Rio Grande alluvium irrigated cotton fields during the 1950s and 1960s but are no longer in use. In Green River Valley, water production is solely for the watering of livestock and wild game. Well yields there vary widely, from only 25 gallons per minute to more than 100 gallons per minute from abandoned irrigation wells along the Rio Grande. To the north in the Eagle Flat aquifer, wells are also used for domestic or livestock and wild game purposes. At one time, however, Cretaceous formations were the sole source of drinking water for the village of Sierra Blanca. Sierra Blanca now receives water from Culberson County 35 miles to the east. Pumping rates from Eagle Flat aquifer vary widely from 10 to 15 gallons per minute in many cases to substantially larger yields for a smaller number of wells (Gates and others, 1980; Darling and others, 1994; Darling, 1997).
6.4.6 Water quality
Southeast Hudspeth County generally has fresh water with total dissolved solids values of less than 1,000 mg/L (Figure 6-7). Exceptions occur east and southeast of Sierra Blanca

59
and along the Rio Grande where values range from 1,000 to 10,000 mg/L. This pattern holds true over time, although the number of wells sampled over the periods of 1939 to 1960 and 1980 to 1990 is small.
The distribution of chloride in the area mimics the pattern seen for total dissolved solids, with the majority of wells having chloride values less than the Environmental Protection Agency’s maximum contaminant level secondary standard of 250 mg/L (Figure 6-8). In a more detailed analysis of chloride distribution, Darling (1997) found that levels increase towards the center of Eagle Flat and southwards from the Eagle Mountains to the Rio Grande. Sulfate concentrations are higher and more variable but are generally less than 300 mg/L (the maximum contaminant level for SO4 is 250 mg/L). Again, like chloride levels, sulfate concentrations display higher levels, in the 750 to 2,000 mg/L range, east of Sierra Blanca and along the Rio Grande. Nitrate concentrations are generally less than 10 mg/L, although there are a number of wells in the 10 to 44.27 mg/L range (44.27 mg/L is the Environmental Protection Agency’s maximum contaminant level value for nitrate). These wells are located southeast of Sierra Blanca, northwest of the Carrizo Mountains in Eagle Flat, along the Green River Valley, and at the south end of Red Light Draw. Fluoride levels are generally less than 3 mg/L (the maximum contaminant level for fluoride is 2 mg/L), but a group of wells southeast of Sierra Blanca has values of more than 4 mg/L. Magnesium concentrations are mostly less than 100 mg/L, but some are greater along the Rio Grande.
Darling (1997) defined four hydrochemical facies types for groundwater in southeast Hudspeth County: Type 1 consists of calcium-bicarbonate to mixed-cation-bicarbonate; Type 2 consists of sodium-mixed-anion to mixed-cation-mixed-anion; Type 3 consists of sodium-bicarbonate; and Type 4 consists of sodium-chloride to sodium-sulfate and mixed-cation-sulfate. More recent data collection from the Texas Water Development Board database confirms these facies types (Figures 6-25, 6-26, 6-27, 6-28, and, 6-29).
Compositions of major ions in this area can be in large part attributed to relatively common reactions (Darling, 1997). Type 1 to Type 3 facies likely developed through dissolution of calcite and dolomite as well as weathering of silicates such as albite, pyroxene, or amphibole. Cation exchange appears to be an important process in developing the Type 1 to Type 3 facies. Type 4 facies are dominated by the dissolution of gypsum and halite. The release of calcium during dissolution of the gypsum and halite drives exchange reactions that release sodium (Darling, 1997). With the continued dissolution of gypsum, cation exchange becomes more significant.
Another mechanism is likely responsible for Type 4 facies groundwater from shallow wells along the Rio Grande. Evaporative concentration of irrigation water builds up salt concentrations in soil, which are subsequently flushed by return flow into local groundwater. Darling (1997) has proposed this mechanism to account for the

60
Figure 6-25. Piper plot of major ion compositions in groundwater in southeastern Hudspeth County (Type 1 is calcium-bicarbonate to mixed-cation-bicarbonate; Type 2 is sodium-mixed-anion to mixed-cation-mixed-anion; Type 3 is sodium bicarbonate; Type 4 is sodium-chloride to sodium-sulfate and mixed-cation-sulfate).

61
Figure 6-26. Piper plot and selected Stiff diagrams of Type 1 (calcium-bicarbonate)
groundwater, southeastern Hudspeth County.

62
Figure 6-27. Piper plot and selected Stiff diagrams of Type 2 (sodium-mixed-anion to mixed-cation-mixed-anion) groundwater, southeastern Hudspeth County.

63
Figure 6-28. Piper plot and selected Stiff diagrams of Type 3 (sodium-bicarbonate)
groundwater, southeastern Hudspeth County.

64
Figure 6-29. Piper plot and selected Stiff diagrams of Type 4 (sodium-chloride to
sodium-sulfate and mixed-cation-sulfate) groundwater, southeastern Hudspeth County.
anomalously high sodium and chloride concentrations from certain wells along the river (Figure 6-30).
The distribution of compositions displays a pattern characteristic of cation exchange whereby calcium and magnesium in solution are replaced by sodium (Figure 6-25; Hounslow, 1995). This pattern may represent the progressive evolution of groundwater from Type 1 through Type 4. In Red Light Draw, Type 1 groundwater at the northwest end of the valley generally changes to Type 2, 3, and 4 facies farther south (Figure 6-30; see also Plate 5 of Darling, 1997). This may also represent the evolution of groundwater from a calcium-bicarbonate Type 1 facies to a sodium-sulfate Type 4 facies. Fisher and Mullican (1997) describe a similar scenario just to the northwest in the area of the southwestern Diablo Plateau and the southeastern Hueco Bolson. In the Carrizo Mountains and Eagle Flat area, Type 1 groundwater changes to Type 2 and finally

65
Figure 6-30. Distribution of hydrochemical facies, southeastern Hudspeth County.

66
changes to Type 3 in the area of Scott’s Crossing. This would show a similar progression in Red Light Draw were it not for the potentiometric map and location of the groundwater divide between the Eagle and Carrizo mountains (Figure 6-22).
Whether or not progressive groundwater evolution is taking place, we can make some general observations by mapping hydrochemical facies. For example, Type 1 groundwater is found in association with fractured Cretaceous rocks in the Eagle Mountains and northwest Red Light Draw as well as in the Precambrian metamorphic rocks in the Carrizo Mountains. Type 2 and 3 facies are located at lower elevations within the basins, and Type 4 groundwater is common in wells along the Rio Grande. One exception to this is the grouping of water samples with Type 4 facies southeast of Sierra Blanca (Figure 6-30). In this area, concentrations of chloride, sulfate, and fluoride are high compared to the surrounding areas (Figure 6-8). One possible explanation for this is the dissolution of halite and gypsum from Jurassic evaporates by geothermal fluids associated with volcanic rocks. Groundwater temperatures southeast of Sierra Blanca are about 30°C, which are relatively high. Volcanic rocks also outcrop just to the west (Figure 3-6). Jurassic evaporates are present in the Malone Mountains to the northwest and are thought to occur at depth (DeFord and Haenggi, 1971). This scenario has also been proposed for the occurrence of Type 4 groundwater along the Rio Grande (Henry, 1979; Darling, 1997).
6.5 Capitan Reef Complex aquifer
The Texas Water Development Board recognizes the Capitan Reef Complex aquifer as a minor aquifer. The majority of the aquifer is located outside of Hudspeth County in Culberson, Jeff Davis, Pecos, Reeves, Ward, and Winkler counties. Only a small part of the aquifer is in the county, located to the east of Dell Valley and the Salt Basin (Figure 3-1). Information on the aquifer in this area is limited relative to the other aquifers in the county.
6.5.1 Geology and hydrostratigraphy
The Guadalupe Mountains border the Salt Basin along its eastern edge and consist of Permian carbonate rocks of the Capitan Reef Complex (Figure 3-1; King, 1948). Middle to late Tertiary Basin and Range block faulting uplifted the Permian rocks, creating an approximately 5 to 10 degree regional eastward dip (Grauten, 1965). Uplift and erosional exhumation of the original Permian topography resulted in the widespread influx of meteoric waters with renewal of deep groundwater circulation, dissolution, and/or replacement of Permian evaporites and widespread cavern formation in limestones of the Guadalupe Mountains. It also produced numerous high-angle faults and fractures of the Permian rocks of the Guadalupe Mountains, especially along the western escarpment (King, 1948).
The Permian rocks exposed along the western flank of the Guadalupe Mountains include the Capitan and Goat Seep formations (Figure 3-6). Both of those formations, in addition to the Carlsbad Formation, comprise the Capitan Reef Complex aquifer (Hiss, 1975;
67
Uliana, 2001). The Capitan Formation consists of reef limestone with thicknesses of 1,000 to 2,000 ft. It grades upwards and to the north into back-reef facies of the Carlsbad Group, which includes the Tansill, Yates, and Seven Rivers formations (King, 1948). The Goat Seep Formation is mostly limestone, but in part dolomitic, and has thicknesses of 200 to 1,200 ft. Like the younger Capitan Formation, the Goat Seep Formation represents a fossil reef system (King, 1948; Newell and others, 1953; Crow and Bell, 2004).
6.5.2 Water levels and groundwater flow
Regional groundwater flow in the aquifer is to the east and northeast and is concentrated in the rocks of the Capitan Reef Complex (Hiss, 1975, 1980). Flow in the Capitan Reef Complex aquifer has been affected by the incision of the Pecos River and by development of petroleum and groundwater resources over the last 70 years (Hiss, 1975, 1980; Uliana, 2001).
Kreitler and others (1990) suggest that groundwater from the Diablo Plateau may be flowing southeast through reef facies rocks buried beneath the Salt Basin. Water levels from northeastern-most Hudspeth County support this notion of southeast flow in the Capitan Reed Complex aquifer into the Salt Basin (Figure 6-4).
6.5.3 Recharge
The Capitan Reef Complex aquifer is recharged primarily by rainfall (ranging from about 14 to 24 inches annually) over the Guadalupe, Glass, and Apache mountains (Figure 3-2; Ashworth and Hopkins, 1995). Reef rocks are exposed in these areas, and it is likely that water enters the aquifers through fractures and karst features. Muller and Price (1979) estimated that effective annual recharge of the Capitan Reef Complex aquifer is 12,500 acre-ft. Of this amount, they attributed 2,500 acre-ft to infiltration of precipitation in the Diablo Farms area of Culberson County and 10,000 acre-feet to the Apache Mountains. About 2,100 acre-ft of recharge can be added to this total if 110 mi2 of Capitan Reef, exposed in the Glass Mountains in Brewster County, is included in the estimate. Estimates of natural recharge for the aquifer in the Guadalupe Mountains of New Mexico are 10,000 to 20,000 acre-ft per year (OSE/ISC, 2003).
6.5.4 Hydraulic properties
In reef rocks the aquifer is characterized by high primary porosities and permeabilities, extensive karstification, and regional fracture trends (Uliana, 2001). Measured transmissivities average 5,390 ft2/day (Gates and others, 1980) and reach 16,200 ft2/day (Reed, 1965). In New Mexico the aquifer is capable of providing large quantities of fresh water and is a significant water source for the City of Carlsbad (Ashworth and Hopkins, 1995).
Wells located behind the reef rocks in the Permian shelf facies, geographically located in New Mexico, have highly variable yields suggesting that permeability is a function of fracture and karst porosity (Nielson and Sharp, 1985; Mayer and Sharp, 1998).

68
Transmissivities, measured in wells from cavernous zones in shelf facies rocks, average 21,300 ft2/day (Davis and Leggat, 1965) and 33,400 ft2/day (Scalapino, 1950).
6.5.5 Discharge
Groundwater discharges from the Capitan Reef Complex aquifer by flow to the Pecos River, cross-formational flow, and pumping in the aquifer and in oil fields. Discharge of groundwater to the Pecos River occurs where the river has incised into the aquifer near Carlsbad, New Mexico (Hiss, 1975, 1980). In addition, some groundwater is thought to flow into the San Andres Limestone towards the east. Also, the numerous producing oil fields in the region are areas of discharge and have significantly affected groundwater flow in the aquifer (Hiss, 1975, 1980). Hydrochemical analyses from the San Solomon spring system indicates discharge there of groundwater that originated in rocks of the Capitan Reef Complex aquifer in the Apache Mountains and west of the Delaware Mountains (Chowdhury and others, 2004).
In many areas of Culberson and Hudspeth Counties, the yields of wells are commonly more than 1,000 gallons per minute. Further to the south, in the Apache Mountains of Culberson County, well yields appear to be in the range of 400 gallons per minute. There is no reported production data for the Glass Mountains portion of the Capitan Reef (FWTRWPG, 2001).
6.5.6 Water quality
The quality of water from the Capitan Reef Complex aquifer is generally poor, having an average total dissolved solids value of about 3,000 mg/L and an average chloride concentration of about 900 mg/L (Brown, 1997). However, there are some exceptions. Several wells in Culberson and Hudspeth counties and a spring in Culberson County have water that is good enough to be used for domestic purposes. These sites are close to recharge areas where the time available for the water to dissolve minerals from the formation is limited (Brown, 1997). Generally, fresher water is located near areas of recharge where reef rocks are exposed, such as in the Guadalupe and Apache mountains, and where evaporites are absent (Ashworth and Hopkins, 1995).
Samples from wells in the Reef Complex located in Hudspeth County have relatively high levels of calcium and sulfate (Figure 6-31). Total dissolved solids values for this same area are generally in the slightly saline water range (1,000 to 3,000 mg/L; Figure 6-7).
7.0 Water demands
Water demands describe how much water is needed for the various uses in an area. Based on population projections and historical use, water demands are projected into the future by the Texas Water Development Board and the Far West Texas Regional Water Planning Group.

69
Figure 6-31. Piper plot and selected Stiff diagrams of groundwater from the Capitan
Reef Complex aquifer and associated limestones, northeastern Hudspeth County.
7.1 Population
Hudspeth County has the 32nd lowest population of the 254 counties in Texas. According to the U.S. Census Bureau, the population of Hudspeth County in 2000 was 3,344, a 23 percent increase from its 1980 population of 2,728 (Table 7-1). Since 1930, the population of the county has ranged from about 2,400 to 4,300 people (Table 7-1). The 2002 State Water Plan projects that the population in Hudspeth County will increase to 3,995 by 2030 and 4,060 by 2050.

70
Table 7-1. Past, present, and projected population figures for Hudspeth County. Water User Group 2010 2020 2030 2040 2050 County-other 2,197 2,403 2,503 2,570 2,585 Dell City 781 809 827 834 840 Sierra Blanca 653 672 665 650 635 Total: 3,631 3,884 3,995 4,054 4,060 Source: 2002 State Water Plan County-other refers to rural population U.S. Bureau of the Census population for Hudspeth County: 1920 1930 1940 1950 1960 1970 1980 1990 2000 962 3,728 3,149 4,298 3,343 2,392 2,728 2,915 3,344
7.2 Historical water use
According to Texas Water Development Board estimates, the total annual amount of water used (groundwater and surface water) between the years of 1974 and 2002 ranged from 113,000 acre-ft in 1992 to about 300,000 acre-ft in 1999 (Table 7-2). The majority of water (more than 99 percent) was used for irrigation during this period. Average annual water use during this period was about 124,000 acre-ft from groundwater and 67,000 acre-ft from surface water. The majority of groundwater was pumped from the Bone Spring–Victorio Peak aquifer for irrigation (Table 7-3). Water-use values have changed considerably due to changes in irrigated acreage. For instance, groundwater withdrawal from the Hueco Bolson aquifer in Hudspeth County has declined significantly since 1992 from more than 2,400 acre-ft per year to less than 200 acre-ft per year in 2000. Groundwater withdrawal from the Capitan Reef Complex aquifer has increased from less than 50 acre-ft per year in 1992 to more than 3,500 acre-ft per year in 2000.
A recent study suggests that water use for irrigation in Hudspeth County is not as great as indicated by Texas Water Development Board published estimates. The Underground Water Conservation District and the Conservation and Reclamation District funded a study by Blair (2003) to revise projected irrigation demands for Hudspeth County. Blair (2003) used detailed local data to estimate use, rather than the broader information used by the Natural Resources Conservation Service, who conducted irrigation surveys for the Texas Water Development Board at the time. Blair’s (2003) and the Natural Resources Conservation Service’s estimates for surface water irrigation were similar, but they differed significantly in estimates of groundwater irrigation. Local records showed irrigated acreage of 23,380 acres whereas the Natural Resources Conservation Service had estimated 49,127 acres. Blair (2003) estimated groundwater use in 2000 at about 103,000 acre-ft, while the Natural Resources Conservation Service estimated water use at about 222,000 acre-ft. Much of this difference is explained by a significantly lower estimate of alfalfa acreage by Blair (2003) (Dan Hardin, TWDB, personal communication, 2005).

71
Tabl
e 7-
2.
Estim
ated
wat
er u
se fr
om 1
974
to 2
002,
Hud
spet
h C
ount
y, in
acr
e-fe
et p
er y
ear.
Wat
er u
se c
ateg
ory
1974
19
77
1980
19
84
1985
19
86
1987
19
88
1989
19
90
1991
G
W M
unic
ipal
: Cou
nty
othe
r 25
2 3,
025
897
840
288
278
338
254
305
326
289
SW M
unic
ipal
: Cou
nty
othe
r 0
27
0 0
0 0
0 0
0 0
0 G
W M
anuf
actu
ring
31
27
1 5
3 5
2 2
2 2
3 SW
Man
ufac
turin
g 0
0 0
0 0
0 0
0 0
0 0
GW
Pow
er
0 0
0 0
0 0
0 0
0 0
0 SW
Pow
er
0 0
0 0
0 0
0 0
0 0
0 G
W Ir
rigat
ion
137,
735
123,
500
140,
000
105,
898
97,1
02
45,2
73
48,9
93
55,8
00
97,7
49
50,8
63
52,5
93
SW Ir
rigat
ion
35,0
06
24,0
00
38,5
00
57,3
72
52,6
10
76,3
03
82,5
73
94,0
46
69,0
31
89,7
59
75,6
24
GW
Min
ing
852
0 0
26
26
0 0
0 0
0 0
SW M
inin
g 0
0 0
0 0
0 0
0 0
0 0
GW
Liv
esto
ck
473
474
751
589
338
197
311
345
339
335
344
SW L
ives
tock
0
24
20
31
17
10
16
18
17
17
18
Tot
al:
174,
349
151,
077
180,
169
164,
761
150,
384
122,
066
132,
233
150,
465
167,
443
141,
302
128,
871
Wat
er u
se c
ateg
ory
1992
19
93
1994
19
95
1996
19
97
1998
19
99
2000
20
01
2002
G
W M
unic
ipal
: Cou
nty
othe
r 32
2 28
0 34
6 40
0 40
8 36
6 34
2 38
5 37
6 44
5 41
7 SW
Mun
icip
al: C
ount
y ot
her
0 0
0 0
0 0
0 0
0 0
0 G
W M
anuf
actu
ring
4 10
10
0
10
3 2
0 2
3 1
SW M
anuf
actu
ring
0 0
0 0
0 0
0 0
0 0
0 G
W P
ower
0
0 0
0 0
0 0
0 0
0 0
SW P
ower
0
0 0
0 0
0 0
0 0
0 0
GW
Irrig
atio
n 40
,655
119
,638
175
,776
139
,790
130
,981
131
,625
153
,132
232
,640
222
,023
217
,152
192
,718
SW
Irrig
atio
n 71
,744
89
,988
80
,873
105
,146
98
,520
66
,366
77
,209
66
,366
41
,863
40
,944
36
,338
G
W M
inin
g 0
0 0
2 2
2 1
1 1
4 1
SW M
inin
g 0
0 0
0 0
0 0
0 0
0 0
GW
Liv
esto
ck
401
383
518
388
341
331
579
626
583
554
510
SW L
ives
tock
21
20
27
20
18
17
30
33
31
29
27
T
otal
: 11
3,14
7 21
0,31
9 25
7,55
0 24
5,74
6 23
0,28
0 19
8,71
0 23
1,29
5 30
0,05
1 26
4,87
9 25
9,13
1 23
0,01
2
So
urce
: Tex
as W
ater
Dev
elop
men
t Boa
rd W
ater
Use
s Sec
tion;
GW
-Gro
undw
ater
; SW
-Sur
face
Wat
er; C
ount
y ot
her r
efer
s to
rura
l dom
estic
use
.

72
Tabl
e 7-
3.
Estim
ated
his
toric
al g
roun
dwat
er p
umpi
ng fr
om 1
980
to 2
000,
repo
rted
at tw
o ye
ar in
crem
ents
, for
the
aqui
fers
in
Hud
spet
h C
ount
y, in
acr
e-fe
et p
er y
ear.
H
ueco
Bol
son
aqui
fer
Wat
er u
se c
ateg
ory
1980
19
84
1986
19
88
1990
19
92
1994
19
96
1998
20
00
Mun
icip
al
79
70
103
93
138
147
159
196
201
90
Man
ufac
turin
g 0
0 0
0 0
0 0
0 0
0 Po
wer
0
0 0
0 0
0 0
0 0
0 M
inin
g 0
0 0
0 0
0 0
0 0
0 Ir
rigat
ion
1,50
0 5,
800
2,48
0 3,
057
2,78
7 2,
228
0 0
0 0
Live
stoc
k 11
3 88
29
52
50
58
75
49
84
84
T
otal
: 1,
692
5,95
8 2,
612
3,20
2 2,
975
2,43
3 23
4 24
5 28
5 17
4 W
est T
exas
Bol
sons
aqu
ifer
Wat
er u
se c
ateg
ory
1980
19
84
1986
19
88
1990
19
92
1994
19
96
1998
20
00
Mun
icip
al
2 1
1 1
1 1
1 1
1 1
Man
ufac
turin
g 1
1 0
1 1
0 0
0 0
0 Po
wer
0
0 0
0 0
0 0
0 0
0 M
inin
g 0
8 0
0 0
0 0
2 0
0 Ir
rigat
ion
3,50
0 0
0 0
0 0
0 0
0 0
Live
stoc
k 68
53
18
31
30
35
45
30
51
51
T
otal
: 3,
571
63
19
33
32
36
46
33
52
52
Bon
e Sp
ring
–Vic
tori
o Pe
ak a
quife
r W
ater
use
cat
egor
y 19
80
1984
19
86
1988
19
90
1992
19
94
1996
19
98
2000
M
unic
ipal
65
3 63
7 38
35
40
38
41
50
43
41
M
anuf
actu
ring
0 0
0 0
0 0
0 0
0 0
Pow
er
0 0
0 0
0 0
0 0
0 0
Min
ing
0 0
0 0
0 0
0 0
0 0
Irrig
atio
n 13
2,20
0 10
0,00
0 42
,755
52
,697
48
,034
38
,394
17
2,97
9 12
8,89
7 15
0,69
6 21
8,49
1 Li
vest
ock
38
30
10
17
17
20
26
17
30
29
Tot
al:
132,
891
100,
667
42,8
03
52,7
49
48,0
91
38,4
52
173,
046
128,
964
150,
769
218,
561

73
Tabl
e 7-
3.
Con
tinue
d.
Cap
itan
Ree
f Com
plex
aqu
ifer
Wat
er u
se C
ateg
ory
1980
19
84
1986
19
88
1990
19
92
1994
19
96
1998
20
00
Mun
icip
al
2 1
1 1
1 1
1 1
1 1
Man
ufac
turin
g 1
0 0
0 0
0 0
0 0
0 Po
wer
0
0 0
0 0
0 0
0 0
0 M
inin
g 0
18
0 0
0 0
0 0
0 0
Irrig
atio
n 2,
800
98
37
46
42
33
2,79
7 2,
084
2,43
6 3,
532
Live
stoc
k 11
9
3 5
5 6
8 5
9 8
Tot
al:
2,81
4 12
6 41
52
48
40
2,
806
2,09
0 2,
446
3,54
1 O
ther
-aqu
ifers
W
ater
use
cat
egor
y 19
80
1984
19
86
1988
19
90
1992
19
94
1996
19
98
2000
M
unic
ipal
19
1 32
43
39
54
44
41
51
42
30
M
anuf
actu
ring
0 0
0 0
0 0
0 0
0 0
Pow
er
0 0
0 0
0 0
0 0
0 0
Min
ing
0 0
0 0
0 0
0 0
0 0
Irrig
atio
n 0
0 0
0 0
0 0
0 0
0 Li
vest
ock
521
409
137
240
232
282
365
240
406
411
Tot
al:
712
441
180
279
286
326
406
291
448
441
Tot
al o
f all
aqui
fers
: 14
1,68
0 10
7,25
5 45
,655
56
,315
51
,432
41
,287
17
6,53
8 13
1,62
3 15
4,00
0 22
2,76
9 So
urce
: Tex
as W
ater
Dev
elop
men
t Boa
rd W
ater
Use
s Sec
tion;
irrig
atio
n an
d liv
esto
ck d
ata
from
Nat
ural
Res
ourc
es C
onse
rvat
ion
Serv
ice
(Dep
artm
ent o
f A
gric
ultu
re) a
nd T
exas
Agr
icul
ture
Sta
tistic
s 200
2 (T
exas
Dep
artm
ent o
f Agr
icul
ture
); re
cent
est
imat
es o
f wat
er u
se m
ay b
e ov
eres
timat
ed (s
ee d
iscu
ssio
n in
Se
ctio
n 7.
2).

74
Therefore, Texas Water Development Board estimates of historical groundwater use for irrigation may have been overestimated.
7.3 Projected water demands
Water demands are projected as part of the regional water planning process and provide information on the amount of water that cities and counties will need for municipal, manufacturing, mining, power generation, livestock, and irrigation purposes. The Texas Water Development Board bases the estimates on population growth and past use. Specifics of the methodology used to determine these projections are described in detail in the 2002 State Water Plan (TWDB, 2002). Based on the 2001 Far West Texas Regional Water Plan, projected water demands decrease or remain constant in Hudspeth County for all categories except manufacturing, which increases slightly (Table 7-4). Overall demands decrease from about 123,000 acre-ft per year in 2010 to about 118,000 acre-ft per year in 2030 and about 113,000 acre-ft per year in 2050. More than 99 percent of this water demand is for irrigation. Irrigation use decreases from about 122,000 acre-ft per year in 2010 to about 117,000 acre-ft per year in 2030 and about 113,000 acre-ft per year in 2050.
Regional and state water planning is on a five-year cycle that systematically revisits various projections, including demand projections. The Texas Water Development Board has approved new water demand projections for Hudspeth County submitted by the Far West Texas Regional Water Planning Group for inclusion in their 2006 Far West Texas Regional Water Plan and the 2007 State Water Plan. These water demand numbers are projected out to 2060 and, in total, are about 50,000 acre-ft per year greater than the numbers in the 2002 State Water Plan (Table 7-5). The projected numbers in the 2001 Far West Texas Regional Water Plan were based on historical demands from around 1990, while the newer demand numbers are based on more recent, and higher, pumping figures. Overall demands decrease from about 184,000 acre-ft per year in 2010 to about 165,000 acre-ft per year in 2060, primarily due to an expected decrease in irrigation use. Blair’s (2003) work, described in the previous section, is considered in these new demands.
7.4 Water export
In addition to the demand for water by users in Hudspeth County, there is a demand for Hudspeth County water by users outside of the county. We are aware of three potential groundwater export projects in the county: (1) the export of groundwater from the Bone Spring–Victorio Peak aquifer in the Dell City area to the City of El Paso, (2) the export of groundwater from the Capitan Reef Complex aquifer to the City of El Paso, and (3) the possible export of groundwater from the Hueco Bolson and West Texas Bolsons aquifers in southern Hudspeth County to users yet to be determined.
The 2001 Far West Texas Regional Water Plan includes a water management strategy to export water from the Bone Spring-Victorio Peak aquifer in the Dell Valley area to the City of El Paso (FWTRWPG, 2001, strategy 71-6B). This strategy calls for the export of

75
Table 7-4. Water demand projections for 2000 to 2050, reported at 10 year increments, Hudspeth County, Texas, in acre-feet per year.
Water use category 2000 2010 2020 2030 2040 2050 Municipal: County other 207 214 215 216 214 213 Municipal: Sierra Blanca 113 114 111 107 103 100 Municipal: Dell City 38 36 33 30 26 25 Manufacturing 2 3 4 4 5 6 Livestock 422 422 422 422 422 422 Irrigation 124,521 121,939 119,411 116,935 114,510 112,136 Total: 125,303 122,728 120,196 117,714 115,280 112,902 Source: 2001 Far West Texas Regional Water Plan, 2002 State Water Plan; County other refers to rural domestic use. Table 7-5. Water demand projections for 2010 to 2060, reported at 10 year
increments, Hudspeth County, in acre-feet per year. Water use category 2010 2020 2030 2040 2050 2060 Municipal: County other 287 297 301 288 284 284 Municipal: Sierra Blanca 123 130 134 132 131 131 Manufacturing 2 2 2 2 2 2 Mining 1 1 1 1 1 1 Steam Electric 0 0 0 0 0 0 Livestock 613 613 613 613 613 613 Irrigation 182,627 178,840 175,132 171,501 167,945 164,463 Total: 183,653 179,883 176,183 172,537 168,976 165,494 Source: Far West Texas Regional Water Planning Group for inclusion in their 2006 regional water plan; County other refers to rural domestic use.

76
as much as 30,000 acre-ft per year in 2030 and 45,000 acre-ft per year in 2050. The strategy suggests that any water produced for export will need to be balanced with a commensurate reduction in net agricultural production (FWTRWPG, 2001). According to the regional water plan, this reduction is needed to maintain the sustainability of pumping from the aquifer and to prevent the migration of poorer quality water from the Salt Basin into the production area.
In 2003 and 2004, El Paso Water Utilities purchased about 28,000 acres of land that overlies the Capitan Reef Complex aquifer straddling the Hudspeth and Culberson County lines in an area adjacent to the Salt Basin southeast of Dell City. Possible export of water from this location is not in the current regional and state water plans. Long range planning by El Paso Water Utilities includes the transfer of 10,000 acre-ft per year of groundwater from the Capitan Reef Complex by 2031 through 2060 (Bill Hutchison, El Paso Water Utilities, 2005, personal communication). This project is not listed as a water management strategy in the existing regional or state water plans, but will be added to the next version of the plans.
Current plans by El Paso Water Utilities call for producing 50,000 acre-ft per year of groundwater from the Bone Spring-Victorio Peak aquifer (to be completed in three increments of 16,600 acre-ft per year between about 2030 and 2060) (Bill Hutchison, El Paso Water Utilities, 2005, personal communication). These numbers are slightly different than those presented in the 2001 Far West Texas Regional Water Plan, and will be added to the next version of the plan in 2006.
The State of Texas owns land in Hudspeth County. The General Land Office, which manages this land, is considering leasing groundwater rights in southern Hudspeth County to a private interest. Most of this land overlies the Hueco Bolson and West Texas Bolsons aquifers. It is unclear at this time how much and when this water might be produced or if production of this water will be included as a water management strategy in the regional and state water plans.
Other water export ventures that could affect Hudspeth County are originating in New Mexico. Various groups have filed applications with that state’s Office of the State Engineer to transport groundwater from the Bone Spring-Victorio Peak aquifer north of the Dell Valley area. These include an application by Cimarron Agricultural, Ltd. of El Paso, Texas (File ST-123 of the New Mexico State Engineer Office) to withdraw 76,000 acre feet of water per year from the Bone Spring–Victorio Peak aquifer. If permitted, this group intends to transport the water across the New Mexico-Texas state boundary, treat the water to meet drinking standards of the State of Texas, and provide it to users in West Texas, Southern New Mexico, and the Republic of Mexico for municipal and industrial use. In 1997, a group of ranchers formed the Last Chance Water Company, LLC, intending to sell water to both in- and out-of-state users. In 2002, the group applied to withdraw 100,000 acre-feet of water per year, which they would market for municipal, industrial, commercial, domestic, agricultural, livestock, recreational, environmental, or public use purposes (File ST-179). Both applications are currently the subject of protests. The final application is by the New Mexico Interstate Stream Commission filed in 2002 (Files ST-176, ST-177, ST-178). The purpose of the application is to provide water to the

77
Pecos River for delivery to Texas under interstate stream compacts. It proposes drilling about 110 wells in three separate well fields and diverting 30,000 acre-feet per year from each of the fields (Calvin Chavez, District IV Manager, New Mexico Office of the State Engineer, to the New Mexico Interstate Stream Commission, written communication, February 28, 2002).
8.0 Water availability and supply
Water availability is the amount of water that could be used if the infrastructure existed to transport the water to users, and it may be limited by management philosophy or legal restrictions. Water supply, however, is the amount of water that can be used if water rights, water quality, infrastructure limitations, and contract restrictions are taken into account (TWDB, 2002).
8.1 Groundwater availability
The Far West Texas Regional Water Planning Group and the Underground Water Conservation District include estimates of groundwater availability in their water plans. The Far West Texas Regional Water Planning Group’s estimates reflect drought-of-record conditions.
Regional water planning groups across the state estimated groundwater availability in different ways in their regional water plans (Mace and others, 2002). The Far West Texas Regional Water Planning Group defined groundwater availability for its aquifers using one of two methods: drainable volume of water or sustainable annual production. The drainable volume of water refers to the total volume of water that can be economically produced from the aquifer. It is essentially a total volume of water in an aquifer multiplied by a recovery factor. Sustainable annual production, however, is the amount of groundwater that can be pumped from the aquifer each year without inducing undesired effects. Note that groundwater availability defined as the drainable volume of water has units of volume (acre-ft) and that groundwater availability defined as sustainable annual production has units of volume per time (acre-ft per year).
Regional water planning groups develop regional water plans every five years, allowing them an opportunity to consider new information, reconsider previous decisions, account for changed conditions, and revise their numbers accordingly. For their 2006 plan, the Far West Texas Regional Water Planning Group is considering using different groundwater availability numbers from those in their 2001 plan that may be considerably lower for many aquifers. Instead of using drainable volume to calculate their numbers as they did previously, the group may determine availability by historical use and acceptable levels of potential water level decline based on groundwater availability modeling results. (John Ashworth, LBG-Guyton Associates, personal communication, 2005).
The 2001 Far West Texas Regional Water Plan defined groundwater availability for the Capitan Reef Complex, Hueco Bolson, Rio Grande Alluvium, and West Texas Bolsons aquifers as the drainable volume of water (FWTRWPG, 2001). It defined groundwater

78
availability for the Bone Spring–Victorio Peak aquifer on a temporary increase of pumping during times of drought from a sustainable annual production that minimizes the risk of saline water intrusion from the Salt Flats.
The 2001 Far West Texas Regional Water Plan shows groundwater availability for Hudspeth County remaining constant through 2050 with an annual production during times of drought of 141,000 acre-ft per year for the Bone Spring–Victorio Peak aquifer and a total drainable volume of 1,847,500 acre-ft for all of the other aquifers (Table 8-1). This suggests that projected groundwater production, at least the groundwater production considered at the time of the plan, will be sustainable because drainable volumes do not decrease over time.
The 2001 Far West Texas Regional Water Plan suggests that there is about 708,000 acre-ft of recoverable water from the West Texas Bolson aquifer beneath Red Light Draw (Table 8-1). Because only scattered ranch wells produce groundwater in Red Light Draw, the aquifer is not expected to show any depletion over the period 2000 to 2050. The bolson aquifers beneath Green River Valley and Eagle Flat, based on similar assumptions, have groundwater availability estimates of 89,000 and 409,000 acre-ft, respectively, from 2000 to 2050. The Rio Grande Alluvium aquifer in Hudspeth County is another significant potential source of water with an estimated 626,000 acre-ft of available groundwater (Table 8-1; FWTRWPG, 2001). The 2001 Far West Texas Regional Water Plan indicates a volume of 500 acre-ft of fresh groundwater in the Hueco Bolson aquifer in Hudspeth County. The amount of brackish groundwater in the Hueco Bolson aquifer in Hudspeth County would be much greater.
Ashworth (1995) concluded that annual withdrawals of 90,000 to 100,000 acre-ft could be maintained in the Bone Springs–Victorio Peak aquifer without lowering the water table so much it induced the flow of saline water from the Salt Flats. The Far West Texas Regional Water Planning Group decided that producing as much as 141,000 acre-ft could be maintained for one season during times of drought (FWTRWPG, 2001). The Underground Water District includes an estimate of groundwater availability (indicated as the total amount of usable groundwater) for the Bone-Springs-Victorio Peak aquifer in its groundwater management plan. They estimate that the usable amount of groundwater (groundwater availability) in the district for the Bone-Springs–Victorio Peak aquifer is 63,000 acre-ft per year and state that this value is the long-term average amount of groundwater available for consumptive use or transfer (HCUWCD, 2002a). They also note that the aquifer is recharged by about 27,000 acre-ft per year of irrigation return flow.
We could not find an estimate of groundwater availability for the Diablo Plateau aquifer. The 2001 Far West Texas Regional Water Plan lists an estimate of 10,000 acre-ft for the groundwater availability of other aquifers in the county. Additional research is required to develop a specific estimate.

79
Tabl
e 8-
1.
Gro
undw
ater
ava
ilabi
lity
proj
ectio
ns fo
r 200
0 to
205
0, re
porte
d at
10
year
incr
emen
ts, H
udsp
eth
Cou
nty,
in a
cre-
feet
an
d ac
re-f
eet p
er y
ear.
Wat
er su
pply
sour
ce
Typ
e of
wat
er so
urce
20
00
2010
20
20
2030
20
40
2050
W
est T
exas
Bol
sons
, Red
Lig
ht D
raw
G
roun
dwat
er
708,
000
708,
000
708,
000
708,
000
708,
000
708,
000
Rio
Gra
nde
Allu
vium
G
roun
dwat
er
626,
000
626,
000
626,
000
626,
000
626,
000
626,
000
Wes
t Tex
as B
olso
ns, E
agle
Fla
t G
roun
dwat
er
409,
000
409,
000
409,
000
409,
000
409,
000
409,
000
Bon
e Sp
ring–
Vic
torio
Pea
k G
roun
dwat
er
141,
000
141,
000
141,
000
141,
000
141,
000
141,
000
Wes
t Tex
as B
olso
ns, G
reen
Riv
er V
alle
y G
roun
dwat
er
89,0
00
89,0
00
89,0
00
89,0
00
89,0
00
89,0
00
Oth
er a
quife
rs
Gro
undw
ater
10
,000
10
,000
10
,000
10
,000
10
,000
10
,000
C
apita
n R
eef C
ompl
ex
Gro
undw
ater
5,
000
5,00
0 5,
000
5,00
0 5,
000
5,00
0 H
ueco
Bol
son
Gro
undw
ater
50
0 50
0 50
0 50
0 50
0 50
0 U
pper
Rio
Gra
nde
Surf
ace
wat
er
0 0
0 0
0 0
Tot
al:
1,
988,
500
1,98
8,50
0 1,
988,
500
1,98
8,50
0 1,
988,
500
1,98
8,50
0 A
ll va
lues
in a
cre-
feet
exc
ept f
or th
e B
one
Sprin
g–V
icto
rio P
eak
aqui
fer a
nd th
e U
pper
Rio
Gra
nde,
whi
ch a
re in
acr
e-fe
et p
er y
ear;
Sour
ce: 2
001
Far W
est
Texa
s Reg
iona
l Wat
er P
lan.

80
8.2 Groundwater supply
Groundwater supply projections represent the volume of groundwater that a specific user or group of users may reasonably expect to pump from an aquifer based on limitations imposed by factors such as the depth to water, existing infrastructure, cost of pumping, and water quality (Table 8-2; FWTRWPG, 2001).
Given current infrastructure, the groundwater supply in Hudspeth County is projected to be about 151,000 acre-ft per year through 2050 (Table 8-2). The Bone Spring–Victorio Peak aquifer, capable of providing 93 percent of current groundwater supplies, is the most important source of water in the area. The 2001 Far West Texas Regional Water Plan projects that the aquifer can supply as much as 140,000 acre-ft of water per year for irrigation through 2050. The aquifer also currently supplies the city of Dell City, although the water has to be desalinated. All other water sources in the county are small in comparison.
Fort Hancock and McNary, located in southwest Hudspeth County above the Hueco Bolson aquifer, have relied on groundwater from one well owned by the Fort Hancock Water Control and Improvement District No. 1 and 11 wells owned by the Esperanza Water Service Company (FWTRWPG, 2001). The 2001 Far West Texas Regional Water Plan indicates that the Fort Hancock Water Control and Improvement District No. 1 well is completed in the Rio Grande Alluvium aquifer, but Texas Water Development Board records suggest that it is actually completed in the Hueco Bolson aquifer. Water quality is an issue in these wells, with total dissolved solids values ranging from about 1,000 mg/L to as much as 2,500 mg/L and fluoride and manganese levels exceeding drinking water standards. The Fort Hancock Water Control and Improvement District No. 1 has plans to drill an additional well (probably in the Hueco Bolson aquifer) and to install a reverse osmosis plant to desalinate produced groundwater to comply with Texas Commission on Environmental Quality drinking water standards. The Esperanza Water Service Company has installed a reverse-osmosis desalination plant to treat its water (FWTRWPG, 2001).
The community of Sierra Blanca is supplied water from production wells located in Wild Horse Flat in Culberson County. Water levels in the Wild Horse Flat well field have remained constant, and water quality has not been reported to be a problem for the community. The Wild Horse Flat well field has substantial room for expansion if an additional well is needed to meet demand (FWTRWPG, 2001).
8.3 Surface-water availability and supply
The Rio Grande has historically provided significant water for irrigation in southwestern Hudspeth County where the river overlies the Hueco Bolson (Table 7-2). However, the stretch of river from below Fort Quitman to Presidio is often a dry riverbed. The amount of water that flows into Hudspeth County from upriver depends on the climate in Colorado and northern New Mexico and releases from dams located in Texas and New Mexico. According to the 2001 Far West Texas Regional Water Plan, there is no surface

81
Tabl
e 8-
2.
Gro
undw
ater
supp
ly p
roje
ctio
ns fo
r 200
0 to
205
0, re
porte
d at
10
year
incr
emen
ts, H
udsp
eth
Cou
nty,
in a
cre-
feet
per
ye
ar.
Wat
er u
ser
Sour
ce
grou
p co
unty
So
urce
nam
e 20
00
2010
20
20
2030
20
40
2050
D
ell C
ity
Hud
spet
h B
one
Sprin
g–V
icto
rio P
eak
aqui
fer
50
50
50
50
50
50
Sier
ra B
lanc
a C
ulbe
rson
W
est T
exas
Bol
sons
aqu
ifer
351
351
351
351
351
351
Cou
nty-
othe
r H
udsp
eth
Bon
e Sp
ring–
Vic
torio
Pea
k aq
uife
r 1
1 1
1 1
1 C
ount
y-ot
her
Hud
spet
h H
ueco
–Mes
illa
Bol
son
aqui
fer
196
196
196
196
196
196
Cou
nty-
othe
r H
udsp
eth
Oth
er a
quife
r 51
51
51
51
51
51
Ir
rigat
ion
Hud
spet
h U
pper
Rio
Gra
nde
0 0
0 0
0 0
Irrig
atio
n H
udsp
eth
Bon
e Sp
ring–
Vic
torio
Pea
k aq
uife
r 14
0,00
0 14
0,00
0 14
0,00
0 14
0,00
0 14
0,00
0 14
0,00
0 Ir
rigat
ion
Hud
spet
h C
apita
n R
eef C
ompl
ex a
quife
r 2,
797
2,79
7 2,
797
2,79
7 2,
797
2,79
7 Ir
rigat
ion
Hud
spet
h O
ther
aqu
ifer
6,55
6 6,
556
6,55
6 6,
556
6,55
6 6,
556
Live
stoc
k H
udsp
eth
Bon
e Sp
ring-
Vic
torio
Pea
k aq
uife
r 26
26
26
26
26
26
Li
vest
ock
Hud
spet
h C
apita
n R
eef C
ompl
ex a
quife
r 8
8 8
8 8
8 Li
vest
ock
Hud
spet
h H
ueco
–Mes
illa
Bol
son
aqui
fer
75
75
75
75
75
75
Live
stoc
k H
udsp
eth
Oth
er a
quife
r 36
5 36
5 36
5 36
5 36
5 36
5 Li
vest
ock
Hud
spet
h W
est T
exas
Bol
sons
aqu
ifer
45
45
45
45
45
45
Man
ufac
turin
g H
udsp
eth
Oth
er a
quife
r 6
6 6
6 6
6 M
inin
g H
udsp
eth
Oth
er a
quife
r 2
2 2
2 2
2
Tot
al:
150,
529
150,
529
150,
529
150,
529
150,
529
150,
529
Sour
ce: 2
001
Far W
est T
exas
Reg
iona
l Wat
er P
lan

82
water available for use, and, therefore, no surface water supply, during a repeat of the drought-of-record (Tables 8-1 and 8-2).
8.4 Recommended water management strategies
One way to increase water supply is to implement water management strategies identified by the regional water planning groups in their regional water plans. Water management strategies are plans, projects, and practices used to develop more water, such as drilling wells, building pipelines, constructing dams, and conserving water. The Far West Texas Regional Water Planning Group identified several water management strategies for meeting needs in Hudspeth County in their 2001 regional water plan (Table 8-3; FWTRWPG, 2001; TWDB, 2002). They recommended adding wells or expanding the use of existing wells as the preferred strategy to provide more water for irrigation. Due to the high salinity of wells along the Rio Grande, the planning group also proposed using effluent from the City of El Paso for irrigation during extended drought periods (FWTRWPG, 2001). They proposed that growers cease operations until river water becomes available. In rural areas of Hudspeth County a number of private domestic wells have gone dry as a result of drought induced water level declines. The Far West Texas Regional Water Planning Group recommended that well owners deepen their wells to produce deeper groundwater (FWTRWPG, 2001). They also proposed a water management strategy to export groundwater from the Bone Spring–Victorio Peak aquifer in Hudspeth County to the City of El Paso (Table 8-3; see discussion in Section 7.4). Projected amounts for groundwater transfer range from 15,000 acre-ft per year to 45,000 acre-ft per year between 2010 and 2050.
9.0 Supplies and strategies versus demand
The difference between water supply (Table 8-2) and water demand (Table 7-4) projections from the 2001 Far West Texas Regional Water Plan and the 2002 State Water Plan indicates a countywide surplus of water after meeting in-county demands in Hudspeth County through 2050 (Table 9-1). The largest contributor to this surplus is groundwater from the Dell Valley area. The amounts of projected surpluses range from about 72,000 acre-ft per year to 79,000 acre-ft per year between 2000 and 2050. However, there are projected unmet needs within the county. In southern Hudspeth County, the Rio Grande is not expected to produce any water during a repeat of the drought-of-record, and groundwater from the Rio Grande Alluvium aquifer is limited due to poor quality. During drought-of-record conditions, irrigated agriculture in the Conservation and Reclamation District will be severely impacted and shortages ranging from about 42,000 to 47,000 acre-ft per year are expected (Table 9-1; FWTRWPG, 2001).
According to the 2001 Far West Texas Regional Water Plan, there are no unmet needs related to groundwater supply in Hudspeth County as a whole. When we consider the water management strategy to export water from the Dell Valley area to El Paso, there are still no unmet needs related to groundwater supply.

83
Tabl
e 8-
3.
Proj
ecte
d re
com
men
ded
wat
er m
anag
emen
t stra
tegi
es, H
udsp
eth
Cou
nty,
in a
cre-
feet
per
yea
r. N
o.
Wat
er u
ser
grou
p C
ount
y W
ater
man
agem
ent s
trat
egy
Sour
ce n
ame
1 El
Pas
o El
Pas
o G
roun
dwat
er tr
ansf
er
Bon
e Sp
ring–
Vic
torio
Pea
k aq
uife
r 2
Stea
m e
lect
ric p
ower
El
Pas
o A
dditi
onal
wel
ls
Oth
er a
quife
r 3
Cou
nty-
othe
r H
udsp
eth
Add
ition
al w
ells
H
ueco
Bol
son
aqui
fer
4 C
ount
y-ot
her
Hud
spet
h D
esal
inat
ion
Hue
co B
olso
n aq
uife
r (br
acki
sh)
5 C
ount
y-ot
her
Hud
spet
h D
istri
butio
n sy
stem
mai
nten
ance
C
onse
rvat
ion
6 C
ount
y-ot
her
Hud
spet
h Ex
pand
ed u
se o
f exi
stin
g w
ells
H
ueco
–Mes
illa
Bol
son
aqui
fer
7 C
ount
y-ot
her
Hud
spet
h G
roun
dwat
er tr
ansf
er
Wes
t Tex
as B
olso
n aq
uife
r (1)
8
Cou
nty-
othe
r H
udsp
eth
Gro
undw
ater
tran
sfer
W
est T
exas
Bol
son
aqui
fer (
2)
9 C
ount
y-ot
her
Hud
spet
h R
ainf
all h
arve
stin
g R
ainf
all
10
Cou
nty-
othe
r H
udsp
eth
Con
vers
ion
of ri
ghts
to u
se w
ater
U
pper
Rio
Gra
nde
11
Irrig
atio
n H
udsp
eth
Add
ition
al w
ells
R
io G
rand
e A
lluvi
um
12
Ir
rigat
ion
Hud
spet
h C
onse
rvat
ion
tech
nolo
gy
Con
serv
atio
n 13
Ir
rigat
ion
Hud
spet
h Ex
pand
ed u
se o
f exi
stin
g w
ells
R
io G
rand
e A
lluvi
um
14
Ir
rigat
ion
Hud
spet
h R
eser
voir
stor
age
expa
nsio
n U
pper
Rio
Gra
nde

84
Tabl
e 8-
3.
Con
tinue
d.
No.
So
urce
nam
e 20
00
2010
20
20
2030
20
40
2050
1
Bon
e Sp
ring–
Vic
torio
Pea
k aq
uife
r ni
15
,000
20
,000
30
,000
45
,000
45
,000
2
Oth
er a
quife
r ni
ni
4,
000
4,00
0 4,
000
4,00
0 3
Hue
co B
olso
n aq
uife
r 18
0 18
0 18
0 18
0 18
0 18
0 4
Hue
co B
olso
n aq
uife
r (br
acki
sh)
ni
216
216
216
216
216
5 C
onse
rvat
ion
na
na
na
na
na
na
6 H
ueco
–Mes
illa
Bol
son
aqui
fer
27
27
27
27
27
27
7 W
est T
exas
Bol
son
aqui
fer (
1)
ni
220
220
220
220
220
8 W
est T
exas
Bol
son
aqui
fer (
2)
ni
220
220
220
220
220
9 R
ainf
all
na
na
na
na
na
na
10
Upp
er R
io G
rand
e (3
) ni
0
0 0
0 0
11
Rio
Gra
nde
Allu
vium
0
5,89
2 5,
892
5,89
2 5,
892
5,89
2 12
C
onse
rvat
ion
na
na
na
na
na
na
13
Rio
Gra
nde
Allu
vium
ni
61
8 61
8 61
8 61
8 61
8 14
U
pper
Rio
Gra
nde
ni
0 0
0 0
0
Tot
al:
207
24,3
65
33,3
65
43,3
65
58,3
65
58,3
65
Sour
ce: 2
001
Far W
est T
exas
Reg
iona
l Wat
er P
lann
ing
Gro
up; n
i ind
icat
es st
rate
gy n
ot im
plem
ente
d at
this
tim
e; n
a in
dica
tes s
trate
gy
has n
o sp
ecifi
c vo
lum
e es
timat
e (n
ot a
pplic
able
); (1
) Red
Lig
ht D
raw
, Hud
spet
h C
ount
y; (2
) Wild
Hor
se M
ichi
gan
Flat
s, C
ulbe
rson
C
ount
y; (3
) sup
ply
sour
ce is
not
ava
ilabl
e du
ring
drou
ght-o
f-re
cord
con
ditio
ns.

85
Table 9-1. Comparison of water supply and water demand projections for 2000 to
2050 reported at 10 year increments, Hudspeth County, in acre-feet per year. Positive values indicate surpluses and negative values indicate shortages.
Water user group 2000 2010 2020 2030 2040 2050 Municipal: Dell City 12 14 17 20 24 25 Municipal: Sierra Blanca 238 237 240 244 248 251 Municipal: County-other 41 34 33 32 34 35 Manufacturing 4 3 2 2 1 0 Mining 2 2 2 2 2 2 Irrigation (Dell Valley) 71,820 73,292 74,733 76,144 77,526 78,879 Irrigation (Rio Grande) -46,988 -45,878 -44,791 -43,726 -42,683 -41,662 Livestock 97 97 97 97 97 97 Surplus: 25,129 27,704 30,236 32,718 35,152 37,530 Source: 2001 Far West Texas Regional Water Planning Group
Although not included in the regional water plans, groundwater may be exported from properties that overlie the Capitan Reef Complex aquifer to the City of El Paso. According to the 2001 Far West Texas Regional Water Plan, groundwater availability for the Capitan Reef Complex aquifer in Hudspeth County is 5,000 acre-ft, which would not be enough to support the expected 10,000 acre-ft per year of pumping. However, the properties collectively extend into Culberson County where, according to the 2001 Far West Texas Regional Water Plan, a volume of 383,000 acre-ft of groundwater is available. Therefore, depending on where wells are located, how water flows within the aquifer, and when pumping of the aquifer starts, there may be enough groundwater available for this export according to the regional water plan.
We are not able to assess the effect of pumping from State lands in Hudspeth County because we do not have any details on how much water will be pumped and where it will be pumped from. As discussed in the groundwater export section, groundwater pumping in New Mexico north of the Dell Valley area could affect groundwater availability and water supplies in the Bone Spring–Victorio Peak aquifer of Hudspeth County.
10.0 Conclusions
Hudspeth County contains all or parts of the Bone Spring–Victorio Peak, Capitan Reef Complex, Diablo Plateau, Hueco Bolson, and West Texas Bolsons aquifers. The Bone Spring–Victorio Peak aquifer is the primary groundwater resource in the county producing about 100,000 acre-ft per year of brackish groundwater for irrigation in recent years. The Capitan Reef Complex aquifer extends slightly into the northeast part of the county and is reportedly capable of producing substantial amounts of fresh water. Hudspeth County also overlies the southeastern-most extent of the Hueco Bolson aquifer,

86
which is capable of producing moderate amounts of brackish water. The Red Light Draw, Eagle Flat, and Green River Valley parts of the West Texas Bolsons aquifer lie in the southeastern part of the county and can produce limited amounts of fresh to brackish water. Limited information is currently available on the Diablo Plateau aquifer, but it may be able to produce moderate amounts of fresh water.
The 2001 Far West Texas Regional Water Plan projects that the population of Hudspeth County will not exceed 4,000 people by 2030 and that the in-county demand for surface water and groundwater will be about 118,000 acre-ft per year by 2030. Current planning activities for preparing the 2006 Far West Texas Regional Water Plan suggest, however, that the in-county demand for surface water and groundwater will be about 176,000 acre-ft per year by 2030. More than 99 percent of these water demands are for irrigation.
There may also be a demand for water in Hudspeth County from users outside Hudspeth County. The 2001 Far West Texas Regional Water Plan includes a water management strategy to export as much as 50,000 acre-ft of water per year by 2060 from the Bone Spring-Victorio Peak aquifer to El Paso. El Paso Water Utilities recently purchased land that straddles Hudspeth and Culberson counties and overlies the Capitan Reef Complex aquifer. El Paso Water Utilities may produce 10,000 acre-ft per year from this aquifer between 2030 and 2060. Another possible export project involves State lands in southern Hudspeth County, but no specific plans for locations, volumes, and destinations are currently publicly available. Three permit applications for groundwater in New Mexico north of the Dell Valley area could affect groundwater availability and water supplies in the Bone Spring–Victorio Peak aquifer of Hudspeth County.
According to the 2001 Far West Texas Regional Water Plan, total groundwater availability for Hudspeth County in times of drought is 141,000 acre-ft per year for the Bone-Spring–Victorio Peak aquifer and a total drainable volume of 1,847,500 acre-ft for all of the other aquifers. There is no surface water available for use during a repeat of the drought-of-record. Groundwater supplies, which are limited by infrastructure and other factors, are about 150,000 acre-ft per year through 2060 with 93 percent of groundwater supplied from the Bone Spring–Victorio Peak aquifer. By implementing the water management strategies in the 2001 Far West Texas Regional Water Plan, all groundwater needs are met. Hudspeth County does have unmet agricultural needs along the Rio Grande, but that is due to the lack of water available from the Rio Grande during a repeat of the drought-of-record.
Because of a lack of information, we were not able to assess the effects of additional groundwater exports (outside of those planned by El Paso Water Utilities) on groundwater resources in Hudspeth County within the context of the 2001 Far West Texas Regional Water Plan. Additional information is needed before this analysis can be attempted.

87
11.0 Acknowledgments
We thank Robert Bradley and Rima Petrossian for their help in getting this report started. Craig Caldwell, Yun-Jeong Cho, and Angela Masloff provided the information for tables on water availability, supply, and demand. Radu Boghici and Janie Hopkins helped with specifics concerning groundwater quality, and Dan Hardin and Mark Michon helped clarify water use. Robert Flores provided much needed information concerning the water resources of Far West Texas and export from New Mexico. Brent Christian helped create the map defining the proposed boundary of the Bone Spring–Victorio Peak aquifer and researched a water supply issue. Robert Bradley, Sanjeev Kalaswad, Ian Jones, and Doug Coker reviewed initial drafts. Jay Raney and Edward Collins from the Bureau of Economic Geology also provided comments as did Bill Hutchinson from El Paso Water Utilities and Al Blair of Axiom-Blair Engineering. Merry Klonower and Sarah Davidson reviewed the final draft. Mike Parcher helped with the final formatting and printing of the report.
12.0 References
Albritton, C. C., Jr., and Smith, J. F., Jr., 1965, Geology of the Sierra Blanca area, Hudspeth County, Texas: U.S. Geological Survey Professional Paper 479, 131 p.
Alvarez, H. J., and Buckner, A. W., 1980, Ground water development in the El Paso Region, Texas, with emphasis on the resources of the lower El Paso Valley: Texas Department of Water Resources Report 246, 346 p.
Angle, E. S., 2001, Hydrogeology of the Salt Basin, in Mace, R. E., Mullican, W. F., III, and Angle, E. S., eds., Aquifers of West Texas: Texas Water Development Board Report No. 356, p. 26-40.
Ashworth, J. B., 1995, Ground-water resources of the Bone Spring-Victorio Peak aquifer in the Dell Valley Area, Texas: Texas Water Development Board Report 344, 42 p.
Ashworth, J. B., and Flores, R. R., 1991, Delineation criteria for the major and minor aquifer maps of Texas: Texas Water Development Board LP212, 27 p.
Ashworth, J. B., and Hopkins, J., 1995, Aquifers of West Texas: Texas Water Development Board Report 345, 69 p.
Akersten, W. A., 1967, Red light local fauna (Blancan) of the Love Formation, southeastern Hudspeth County, Texas: The University of Texas at Austin, unpublished M.A. thesis, 169 p.
Back, W., Hanshaw, B. B., Plummer, L. N., Rahn, P. H., Rightmire, C. T., and Rubin, M., 1983, Process and rate of dedolomitization-mass transfer and 14C dating in a regional carbonate aquifer: Geological Society of America Bulletin, v. 94, no. 12, p. 1,415-1,429.
Barnes, V. E., 1979, Geologic atlas of Texas, Marfa Sheet: The University of Texas at Austin, Bureau of Economic Geology Geologic Atlas of Texas, scale 1:250,000.

88
Barnes, V. E., 1983. Geologic atlas of Texas, Van Horn-El Paso Sheet: The University of Texas at Austin, Bureau of Economic Geology Geologic Atlas of Texas, scale 1:250,000.
Bedinger, M. S., Langer, W. H., and Reed, J. E., 1986, Synthesis of hydraulic properties of rocks with reference to the basin and range province, southwestern United States, in Selected papers in the hydrologic sciences: U.S. Geological Survey Water-Supply Paper 2310, 142 p.
Blair, A. W., 2003, Determination of acres of irrigated land and irrigation water use for the year 2000 in Hudspeth County, Texas: draft report by the Hudspeth County Underground Water Conservation District No. 1 and the Hudspeth County Conservation and Reclamation District No. 1 submitted to the Far West Texas Regional Water Planning Group and Texas Water Development Board, April 27, 2003, Axiom Blair Engineering, L.P., Austin, Texas, 13 p.
Boyd, F. M., and Kreitler, C. W., 1986, Hydrogeology of a gypsum playa, northern Salt Basin, Texas: El Paso Geological Society Guidebook 18, p. 170-183.
Boyd, F. M., and Kreitler, C. W., 1990, Hydrogeology of a gypsum playa, northern Salt Basin, Texas, in Kreitler, C. W., and Sharp, J. M., eds., Hydrogeology of Trans-Pecos Texas: The University of Texas at Austin, Bureau of Economic Geology Guidebook 25, p. 67-80.
Brown, E., 1997, Water quality in the Capitan Reef aquifer: Texas Water Development Board Hydrologic Atlas No 8.
Chapin, C. E., 1971, The Rio Grande Rift, Part 1: Modifications and additions: New Mexico Geological Society 22nd Field Conference Guidebook, p. 191-202.
Chapman, J. B., 1984, Hydrogeochemistry of the unsaturated zone of a salt flat in Hudspeth County, Texas: The University of Texas at Austin, unpublished Master’s thesis, 132 p.
Chowdury, A. H., Ridgeway, C., and Mace, R. E., 2004, Origin of the waters in the San Solomon Spring system, Trans-Pecos Texas, in Mace. R. E., Angle, E. S., and Mullican, W. F., III, eds., Aquifers of the Edwards Plateau: Texas Water Development Board Report 360, p. 315-344.
Collins, E. W., and Raney, J. A. 1991, Tertiary and Quaternary structure and paleotectonics of the Hueco basin, Trans-Pecos Texas and Chihuahua, Mexico: The University of Texas at Austin, Bureau of Economic Geology Geological Circular 91-2, 44 p.
Collins, E. W., and Raney, J. A., 1997, Quaternary faults within intermontane basins of northwest Trans-Pecos Texas and Chihuahua, Mexico: The University of Texas at Austin, Bureau of Economic Geology Report of Investigations 245, 59 p.
Crow, C. J., and Bell, G. L., Jr., 2004, Reevaluation of the depositional setting of the Permian (Guadalupian) Goat Seep limestone reef, Guadalupe Mountains National Park, Texas: Geological Society of America, Abstracts with Programs, v. 36, no. 5, p. 369.

89
Darling, B. K., 1997, Delineation of the ground-water flow systems of the Eagle Flat and Red Light basins of Trans-Pecos Texas: unpublished Ph.D. dissertation, The University of Texas at Austin, 179 p.
Darling, B. K., and Hibbs, B. J., 2001, The aquifers of Red Light Draw, Green River Valley, and Eagle Flat, in Mace, R. E., Mullican, W. F., III, and Angle, E. S., eds., Aquifers of West Texas: Texas Water Development Board, Report 356, p.226-240.
Darling, B. K., Hibbs, B. J., and Dutton, A. R., 1994, Ground-water hydrology and hydrogeochemistry of Eagle Flat and surrounding area: The University of Texas at Austin, Bureau of Economic Geology, contract report prepared for the Texas Low-Level Radioactive Waste Disposal Authority, 137 p.
Davis, M. E., and Gordon, J. D., 1970, Records of water levels and chemical analyses from selected wells in parts of the Trans-Pecos region, Texas, 1965-1968: Texas Water Development Board Report 114, 51 p.
Davis, M. E., and Leggat, E. R., 1965, Reconnaissance investigation of the ground-water resources of the upper Rio Grande basin, Texas, in Reconnaissance investigation of the ground-water resources of the Rio Grande basin, Texas: Texas Water Commission Bulletin 6502, p. U1-U199.
DeFord, R. K., 1958, Cretaceous platform and geosyncline, Culbertson and Hudspeth counties, Texas, in 1958 Field Trip Guidebook: Society of Economic Paleontologists and Mineralogists, Permian Section.
DeFord, R. K., and Haenggi, W. T., 1971, Stratigraphic nomenclature of Cretaceous rocks in northeastern Chihuahua, in The geologic framework of the Chihuahua tectonic belt: West Texas Geological Society, p. 175-196.
Dickerson, P. W., 1980, Structural zones transecting the southern Rio Grande Rift-preliminary observations, in Dickerson, P. W., Hoffer, J. M., and Callender, I. F., eds., Trans-Pecos Region, Southeastern New Mexico and West Texas: New Mexico Geological Society, 31st Field Conference Guidebook, p. 63-70.
Dietrich, J. W., Owen, D. E, Shelby, C. A., and Barnes, V. E., 1968 (revised 1983), Van Horn-El Paso Sheet: The University of Texas at Austin, Bureau of Economic Geology Geologic Atlas of Texas, 1 map, scale 1:250,000.
EP-HSWCD and others, 1969, Work plan for watershed protection, flood prevention, and agricultural water management – Hitson, C&L, and Washburn draws watershed, Hudspeth County, Texas: report by El Paso-Hudspeth Soil and Water Conservation District, Hudspeth County Commissioners Court, Hudspeth County Underground Water Conservation District No. 1, City of Dell City, and assisted by the USDA Soil Conservation Service.
FWTRWPG, 2001, Far West Texas regional water plan: Contract report prepared for the Texas Water Development Board by LBG-Guyton Associates, Freese & Nichols Engineering, MCI Consulting Engineers, and M3H Consulting, variously paginated.
Fisher, R. S., and Mullican, W. F., 1990a, Origin of solutes in ground waters from the Diablo Plateau, Hueco Bolson, and Rio Grande aquifers, Trans-Pecos Texas, in

90
Kreitler, C. W., and Sharp, J. M., eds., Hydrogeology of Trans-Pecos Texas: The University of Texas at Austin, Bureau of Economic Geology Guidebook 25, p. 43-48.
Fisher, R. S., and Mullican, W. F., 1990b, Integration of ground-water and vadose-zone geochemistry to investigate hydrochemical evolution–A case study in and lands of the northern Chihuahuan Desert, Trans-Pecos Texas: The University of Texas at Austin, Bureau of Economic Geology Geological Circular 90-5, 36 p.
Fisher, R. S., and Mullican, W. F., 1997, Hydrochemical evolution of sodium-sulfate and sodium-chloride groundwater beneath the northern Chihuahuan Desert, Trans-Pecos Texas, USA: Hydrology Journal, v. 5, no. 2, p. 4-16.
Gates, J. S., White, D. E., Stanley, W. D., and Ackerman, H. D., 1980. Availability of fresh and slightly saline ground water in the basins of westernmost Texas: Texas Department of Water Resources Report 256, 108 p.
Gile, L. H., Hawley, J. W., and Grossman, R. B., 1981, Soils and geomorphology in the southern Basin and Range area of southern New Mexico–Guidebook to the Desert Project: New Mexico Bureau of Mines and Mineral Resources Memoir 39, 222 p.
Goetz, L. K., 1977. Quaternary faulting in Salt Basin grabens, West Texas: unpublished M.A. thesis, The University of Texas at Austin, 136 p.
Goetz, L. K., 1985, Salt Basin graben–A Basin and Range right-lateral transtensional fault zone–Some speculations, in Dickerson, P. W., and Muehlberger, W. R., eds., Structure and tectonics of Trans-Pecos Texas: West Texas Geological Society Field Conference Publication 85-81, p.165-168.
Grauten, W. F., 1965, Fluid relationships in Delaware Mountain sandstone, in Young, A., and Galley, J. E., eds., Fluids in subsurface environments: American Association of Petroleum Geologists Memoir 4, p. 294-307.
Gustavson, T. C., 1991, Arid basin depositional systems and paleosols: Fort Hancock and Camp Rice Formations (Pliocene-Pleistocene), Hueco Bolson, West Texas and adjacent Mexico: The University of Texas at Austin, Bureau of Economic Geology Report of Investigations 198, 49 p.
HCUWCD, 2002a, Hudspeth County Underground Water Conservation District No. 1 Management Plan – March 19, 2002.
HCUWCD, 2002b, Rules of the Hudspeth County Underground Water Conservation District No. 1, 65 p.
Hennings, P. H., Dyer, R., and Muehlberger, W. R., 1989, Laramide development of the eastern Chihuahua tectonic belt, West Texas and northeast Chihuahua, Mexico, in Muehlberger, W. R. and Dickerson, P. W., eds., Structure and stratigraphy of Trans-Pecos Texas: American Geophysical Union Field Trip Guidebook T 315, p. 71-84.
Henry, C. D., 1979, Geologic setting and geochemistry of thermal water and geothermal assessment, Trans-Pecos Texas: The University of Texas at Austin, Bureau of Economic Geology Report of Investigations 96, 48 p.

91
Henry, C. D., and Price, J.G., 1985, Summary of the tectonic development of Trans-Pecos Texas: The University of Texas at Austin, Bureau of Economic Geology Miscellaneous Map 36, 7 p.
Heywood, C. E., and Yager, R. M., 2003, Simulated groundwater flow in the Hueco Bolson, an alluvial-basin aquifer system near El Paso, Texas: U.S. Geological Survey Water-Resources Investigations Report 02-4108, 73 p.
Hibbs, B. J., 1996, Cross-sectional modeling of ground-water flow on a transboundary flowline in Trans-Pecos, Texas and Chihuahua, Mexico: Geological Society of America, Abstracts with Programs, v. 28, no. 1, p. 18-19.
Hibbs, B. J., and Darling, B. K., 1995, Environmental isotopes and numerical models for understanding aquifer dynamics in southwestern basins, in Advances in the development and use of models in water resources: American Water Resources Association, p. 195-200.
Hiss, W. L., 1975, Stratigraphy and ground water hydrology of the Capitan aquifer, southeastern New Mexico and western Texas: unpublished Ph.D. dissertation, University of Colorado, Boulder, 396 p.
Hiss, W. L., 1980, Movement of ground water in Permian Guadalupian aquifer systems, southeastern New Mexico and western states, in Dickerson, P. W., Hoffer, J. M., and Callender, I. F., eds., Trans-Pecos Region, Southeastern New Mexico and West Texas: New Mexico Geological Society, 31st Field Conference Guidebook, p. 285-287.
Horak, R. L., 1985, Trans-Pecos tectonism and its effect on the Permian Basin, in Dickerson, P. W., and Muehlberger, W. R., eds., Structure and tectonics of Trans-Pecos Texas: West Texas Geological Society, Publication 85-81, p.81-87.
Hounslow, A. W., 1995, Water quality data–Analysis and interpretation: CRC Press, 416 p.
IBWC (International Boundary and Water Commission), 1989, Ground water conditions in the El Paso/Juarez valley: Hydraulics Branch, Planning Division, 43 p.
King, P. B., 1948, Geology of the southern Guadalupe Mountains, Texas: U.S. Geological Survey Professional Paper 215, 183 p.
King, P. B., 1965, Geology of the Sierra Diablo region, Texas: U.S. Geological Survey Professional Paper 480, 185 p.
Kluth, C. F., and Coney, P. J., 1981, Plate tectonics of the ancestral Rocky Mountains: Geology, v. 9, p. 10-15.
Kottlowski, F. E., 1963, Paleozoic and Mesozoic strata of southwestern and south-central New Mexico: New Mexico Bureau of Mines and Mineral Resources Bulletin 79, 100 p.
Kreitler, C. W., Raney, J. A., Mullican, W. F., III, Collins, E. W., and Nativ, R., 1986, Preliminary geologic and hydrologic studies of sites HU1A and HU1B in Hudspeth County, Texas: The University of Texas at Austin, Bureau of Economic Geology,

92
final report for the Texas Low-Level Radioactive Waste Disposal Authority under contract no. IAC (86-87)-1061, 104 p.
Kreitler, C. W., Raney, J. A., Nativ, R., Collins, E. W., Mullican, W. F., Gustavson, T. C., and Henry, C. D., 1987, Siting a low-level radioactive waste disposal facility in Texas, volume four-geologic and hydrologic investigations of State of Texas and University Lands: The University of Texas at Austin, Bureau of Economic Geology, report prepared for the Texas Low-Level Radioactive Waste Disposal Authority under Interagency Contract No. IAC(86-87)1790, 330 p.
Kreitler, C. W., Mullican, W. F., and Nativ, R., 1990, Hydrogeology of the Diablo Plateau, Trans-Pecos Texas, in Kreitler, C. W., and Sharp, J. M., eds., Hydrogeology of Trans-Pecos Texas: The University of Texas at Austin, Bureau of Economic Geology Guidebook 25, p. 49-58.
LBG-Guyton Associates, 2001, Availability of ground water for the Cerro Alto land development, Hudspeth County, Texas: report prepared for Cerro Alto Land Development Company by LBG-Guyton Associates, Austin, Texas, 11 p.
Langford, R. P., 1993, Landscape evolution of Eagle Flat and Red Light basins, Chihuahuan Desert, South-Central Trans-Pecos Texas: The University of Texas at Austin, Bureau of Economic Geology, contract report, prepared for Texas Low-Level Radioactive Waste Disposal Authority under interagency Contract IAC (92-93)-0910.
Langford, R. P., Jackson, M. L. W., and Whitelaw, M. J., 1999, The Miocene to Pleistocene filling of a mature extensional basin in Trans-Pecos Texas–Geomorphic and hydrologic controls on deposition: Sedimentary Geology, v. 128, p. 131-153.
Larkin, T. J., and Bomar, G. W., 1983, Climatic atlas of Texas: Texas Department of Water Resources Publication LP-192, 151 p.
Logan, H. H., 1984, A ground-water recharge project associated with a flood protection plan in Hudspeth County, Texas–Supportive geologic application: Texas Christian University, unpublished M.A. thesis, 110 p.
Mace, R. E., Mullican, W. F., and Williams, C., 2002, Groundwater supplies and availability in Texas: Results from regional water planning, in Dutton, S. P., Ruppel, S. C., and Hentz, T. F., eds., Transactions of the Gulf Coast Association of Geological Societies and Gulf Coast Section of the Society of Economic Paleontologists and Mineralogists, Volume LII, p. 681-694.
Mayer, J. R., 1995, The role of fractures in regional groundwater flow-field evidence and model results from the Basin and Range of Texas and New Mexico: The University of Texas at Austin, unpublished Ph.D. dissertation, 221 p.
Mayer, J. M., and Sharp, J. M., Jr., 1998, Fracture control of regional ground-water flow in a carbonate aquifer in a semi-arid region: Geological Society of America Bulletin, v. 110, p. 269-283.
McDowell, F. W., 1979, Potassium Argon dating in the Trans-Pecos Texas volcanic field, in Walton, A. W., and Henry, C. D., eds., Cenozoic geology of the Trans-Pecos volcanic field in Texas: The University of Texas at Austin, Bureau of Economic Geology Guidebook 19, p. 10-18.

93
Muehlberger, W. R., 1980, Texas Lineament revisited, in Dickerson, P. W., Hoffer, J. M., and Callender, I. F., eds., Trans-Pecos Region, Southeastern New Mexico and West Texas: New Mexico Geological Society 31st Field Conference Guidebook, p. 113-122.
Muehlberger, W. R., and Dickerson, P. W., 1989, Structure and stratigraphy of Trans-Pecos Texas: American Geophysical Union Field Trip Guidebook T317, 197 p.
Muller, D. A., and Price, R. D., 1979, Ground-Water Availability in Texas, estimates and projections through 2030: Texas Department of Water Resources Report 238, 77 p.
Mullican, W. F., III, and Mace, R. E., 2001, The Diablo Plateau aquifer, in Mace, R. E., Mullican, W. F., III, and Angle, E. A., eds., Aquifers of West Texas: Texas Water Development Board Report 356, p. 257-267.
Mullican, W. F., III, and Senger, R. K., 1990, Saturated-zone hydrology of south-central Hudspeth County, Texas, in Kreitler, C. W., and Sharp, J. M., Jr., eds., Hydrogeology 258 of Trans-Pecos Texas: The University of Texas at Austin, Bureau of Economic Geology Guidebook 25, p. 37-42.
Mullican, W. F., III, and Senger, R. K., 1992, Hydrogeologic investigations of deep ground-water flow in the Chihuahuan Desert, Texas: The University of Texas at Austin, Bureau of Economic Geology Report of Investigations 205, 60 p.
Mullican, W. F., III, Kreitler, C. W., and Nativ, R., 1987, Hydrology of the Diablo Plateau/Salt Basin Region, Trans-Pecos Texas–A coupled recharge/discharge system: Geological Society of America, Abstracts with Programs, v. 19, no. 7, p. 781.
Mullican, W. F., III, Kreitler, C. W., Senger, R. K., and Fisher, R. S., 1989, Truly deep saturated zone investigations at the proposed low-level radioactive waste disposal site for Texas, in National Outdoor Action Conference on Aquifer Restoration, 3rd, Ground Water Monitoring and Geophysical Methods, Proceedings: National Water Well Association, p. 447-461.
Newell, N. D., Rigby, J. K., Fischer, A. G., Whiteman, A. J., Hickox, J. E., and Bradley, J. S., 1953, The Permian Reef Complex of the Guadalupe Mountains Region, Texas and New Mexico: W.H. Freeman and Co., San Francisco, CA, 236 p.
Nielson, P. D., and Sharp, J. M., 1985, Tectonic controls on the hydrogeology of the Salt Basin, Trans-Pecos Texas, in Dickerson, P. W., and Muehlberger, W. R., eds., Structure and Tectonics of Trans-Pecos Texas: West Texas Geological Society Publication 85-81, p. 231-234.
OSE/ISC (New Mexico Office of the State Engineer/Interstate Stream Commission), 2003, New Mexico State Water Plan, 78 p.
Peckham, R. C., 1963, Summary of ground-water aquifers in the Rio Grande Basin: Texas Water Commission Circular 63-05, 16 p.
Price, J. G., and Henry, C. D., 1984, Stress orientations during Oligocene volcanism in Trans-Pecos Texas–Timing the transition from Laramide compression to Basin and Range extension: Geology, v. 12, p. 238-241.

94
Price, J. G., and Henry, C. D., 1985, Summary of Tertiary stress orientations and tectonic history of Trans-Pecos Texas, in Dickerson, P. W., and Muehlberger, W. R., eds., Structure and Tectonics of Trans-Pecos Texas: West Texas Geological Society Field ConferencePublication 85-81, p. 149-151.
Reed, E. L., 1965, A study of groundwater reserves: Capitan Reef Reservoir, Hudspeth and Culberson Counties, Texas: unpublished report (as referenced by Uliana, 2001).
Ross, C. A., 1978, Pennsylvanian and Early Permian depositional framework, southeastern Arizona: New Mexico Geological Society 29th Field Conference Guidebook, p. 193-200.
Ross, C. A., and Ross, J. R. P., 1985, Paleozoic tectonics and sedimentation in West Texas, southern New Mexico, and southern Arizona, in Dickerson, P. W., and Muehlberger, W. R., eds., Structure and Tectonics of Trans-Pecos Texas: West Texas Geological Society Field Conference Publication 85-81, p.81-87.
Sala A., Smith, S. D., and Devitt, D. A., 1996, Water use by Tamarix ramosissima and associated phreatophytes in a Mojave Desert floodplain: Ecological Applications, v. 6, p. 888-898.
Salvador, A., 1987, Late Triassic-Jurassic paleogeography and origin of Gulf of Mexico basin: Association of American Petroleum Geologists Bulletin, v. 71, p. 419-451.
Scalapino, R. A., 1950, Development of ground water for irrigation in the Dell City area, Hudspeth County, Texas: Texas Board of Water Engineers Bulletin 5004, 41 p.
Scanlon, B. R., 1992, Environmental and applied tracers as indicators of liquid and vapor transport in the Chihuahuan Desert, Texas: The University of Texas at Austin, Bureau of Economic Geology Report of Investigations 207, 51 p.
Scanlon, B. R., Wang, F. P., and Richter, B. C., 1991, Field studies and numerical modeling of unsaturated flow in the Chihuahuan Desert: The University of Texas at Austin, Bureau of Economic Geology Report of Investigations 199, 56 p.
Scanlon, B. R., Goldsmith, R. S., and Langford, R. P., 2000, Relationship between arid geomorphic settings and unsaturated zone flow: Case study, Chihuahuan Desert, Texas: The University of Texas at Austin, Bureau of Economic Geology Report of Investigations 261, 133 p.
Scanlon, B. R., Darling, B. K., and Mullican, W. F., III, 2001, Evaluation of groundwater recharge in basins in Trans-Pecos Texas, in Mace, R. E., Mullican, W. F., III, and Angle, E. S., eds., Aquifers of West Texas: Texas Water Development Board Report 356, p. 26-40.
Schmidt, R. H., Jr., 1979, A climatic delineation of the "real" Chihuahuan Desert: Journal of Arid Environments, p. 243-250.
Sears, J. W., and Price, R. A., 1978, The Siberian connection–A case for Precambrian separation of the North American and Siberian cratons: Geology, v. 6, p. 267-270.
Stevens, J. B., and Stevens, M. S., 1985, Basin and Range deformation and depositional timing, Trans-Pecos Texas, in Dickerson, P. W., and Muehlberger, W. R., eds.,

95
Structure and tectonics of Trans-Pecos Texas: West Texas Geological Society Field Conference Publication 85-81, p. 157-163.
Stewart, J. H., 1978, Basin-range structure in western North America, a review, in Smith, R. B., and Eaton, G. P., eds., Cenozoic tectonics and regional geophysics of the western Cordillera: Geological Society of America Memoir 152, p. 1-13.
Strain, W. S., 1966, Blancan mammalian fauna and Pleistocene formations, Hudspeth County, Texas: Texas Memorial Museum, Bulletin 10, Austin, p. 1-55.
Thomasson, H. J., Olmstad, F. H., and LeRoux, E. R., 1960, Geology, water resources, and usable ground water storage capacity of part of Solano County, CA: U.S. Geological Survey Water Supply Paper 1464, 693 p.
TWDB (Texas Water Development Board), 2002, Water for Texas-2002: Texas Water Development Board Document GP-7-1, 155 p.
TWDB (Texas Water Development Board), 2005, Groundwater database.
TWDB (Texas Water Development Board) and NMWRRI (New Mexico Water Resources Research Institute), 1997, Transboundary aquifers of the El Paso/Ciudad Juarez/Las Cruces Region: report prepared for the U.S. Environmental Protection Agency, Region VI, 148 p.
USBR (U.S. Bureau of Reclamation), 1973, Water resources of El Paso County, Texas: Rio Grande Project, New Mexico-Texas Project Office, El Paso, Texas, 97 p.
Uliana, M. M., 2001, The geology and hydrogeology of the Capitan aquifer–A brief overview, in Mace, R. E., Mullican, W. F., III, and Angle, E. S., eds., Aquifers of West Texas: Texas Water Development Board Report 356, p. 153-166.
Underwood, J. R., Jr., 1962, Geology of the Eagle Mountains and vicinity, Trans- Pecos, Texas: The University of Texas at Austin, unpublished Ph.D. dissertation, 560 p.
Veldhuis, J. H., and Keller, G. R., 1980, An integrated geological and geophysical study of the Salt Basin graben, West Texas, in Dickerson, P. W., Hoffer, J. M., and Callender, I. F., eds., Trans-Pecos Region, Southeastern New Mexico and West Texas: New Mexico Geological Society 31st Field Conference Guidebook, p. 141-150.
White, D. E., Gates, J. S., Smith, J. T., and Fry, B. J., 1980, Ground-water data for the Salt Basin, Eagle Flat, Red Light Draw, Green River Valley, and Presidio Bolson in westernmost Texas: Texas Department of Water Resources Report 259, 97 p.
Young, P. W., 1975, Feasibility study of the Dell City water system: Prepared for the City of Dell City, Texas, and the U.S. Department of Commerce Economic Development Administration, 98 p.