Embed Size (px)
Citation preview

THE ICSID CASELOAD –
STATISTICS
Pub
lic D
iscl
osur
e A
utho
rized
Pub
lic D
iscl
osur
e A
utho
rized
Pub
lic D
iscl
osur
e A
utho
rized
Pub
lic D
iscl
osur
e A
utho
rized

© 2010 by International Centre for Settlement of Investment Disputes.
Content may be reproduced for educational use with acknowledgement. Page | 2
The ICSID Caseload – Statistics
(Issue 2010-2)
This document is intended to provide an updated profile of the ICSID caseload, historically and for the Centre’s Fiscal Year 2010, covering the period from July 1, 2009 to June 30, 2010. It is based on cases registered or administered by ICSID as of June 30, 2010. The ICSID Secretariat will continue to update this information on a bi-annual basis.
Akin to the inaugural issue (2010-1), the analysis examines: (1) the number of cases registered under the ICSID Convention and Additional Facility Rules; (2) the number of other cases administered by ICSID; (3) the basis of consent to ICSID jurisdiction invoked in registered arbitration and conciliation cases; (4) the geographic distribution of ICSID cases by the State party to the dispute; (5) the economic sectors involved in ICSID disputes; (6) the outcomes in ICSID arbitration and conciliation proceedings; and (7) the nationality and geographic origins of arbitrators, conciliators and ad hoc committee members appointed in ICSID proceedings.
The Secretariat would like to take this opportunity to thank government officials, practitioners, arbitrators and academics for their feedback following the first issue of this publication.
The Secretariat continues to welcome any comments or suggestions, which should be addressed to the Secretariat by email to [email protected].

© 2010 by International Centre for Settlement of Investment Disputes.
Content may be reproduced for educational use with acknowledgement. Page | 3
TABLE OF CONTENTS1
PART I - ALL CASES REGISTERED AND ADMINISTERED BY ICSID
1. Map of the ICSID Contracting States and Other Signatories to the ICSID Convention as of June 30, 2010 6
2. Cases Registered by ICSID 7 Chart 1: Total Number of ICSID Cases Registered by Year 7 Chart 2: Number of Cases Registered by Year under the ICSID Convention and Additional Facility Rules 8 Chart 3: Type of Proceeding Registered under the ICSID Convention and Additional Facility Rules 8
3. Non-ICSID Cases Administered by the ICSID Secretariat 9 Chart 4: Number of Non-ICSID Cases Administered by the ICSID Secretariat over the Past Ten Fiscal Years2 9
4. Basis of Consent Invoked to Establish ICSID Jurisdiction in Registered ICSID Cases 10 Chart 5: Basis of Consent Invoked to Establish ICSID Jurisdiction in Registered ICSID Cases 10
5. Geographic Distribution of All ICSID Cases by State Party Involved 11 Chart 6: Geographic Distribution of All ICSID Cases by State Party Involved 11
6. Distribution of All ICSID Cases by Economic Sector 12 Chart 7: Distribution of All ICSID Cases by Economic Sector 12
7. ICSID Arbitration and Conciliation Proceedings – Outcomes 13 Chart 8: Arbitration Proceedings under the ICSID Convention and Additional Facility Rules – Outcomes 13 Chart 9: Arbitration Proceedings under the ICSID Convention and Additional Facility Rules – Awards 13 Chart 10: Conciliation Proceedings under the ICSID Convention – Outcomes 14 Chart 11: Conciliation Proceedings under the ICSID Convention – Commission Reports 14
8. Arbitrators, Conciliators and ad hoc Committee Members Appointed in ICSID Cases 15 Chart 12: Arbitrators, Conciliators and ad hoc Committee Members Appointed in ICSID Cases – Distribution of Appointments by Geographic Region 15 Chart 13: Arbitrators, Conciliators and ad hoc Committee Members Appointed in ICSID Cases – Distribution of Appointments by ICSID and by the Parties (or Party-appointed Arbitrators) by Geographic Region 16 Chart 14: Nationality of Arbitrators, Conciliators and ad hoc Committee Members Appointed in ICSID Cases 17
1 The data is based on ICSID statistics as of June 30, 2010. 2 The ICSID Fiscal Year covers the period July 1 to June 30.
© 2010 by International Centre for Settlement of Investment Disputes.
Content may be reproduced for educational use with acknowledgement. Page | 4
PART II - CASES REGISTERED AND ADMINISTERED BY ICSID IN FISCAL YEAR 2010 (FY2010)3
1. Cases Registered by ICSID in FY2010 19
Chart 1: Number of Cases Registered under the ICSID Convention and Additional Facility Rules in FY2010 19
2. Non-ICSID Cases Administered by the ICSID Secretariat in FY2010 19 Chart 2: Number of Non-ICSID Cases Administered by the ICSID Secretariat in FY2010 19
3. Basis of Consent Invoked to Establish ICSID Jurisdiction in Cases Registered in FY2010 20 Chart 3: Basis of Consent Invoked to Establish ICSID Jurisdiction in Cases Registered in FY2010 20
4. Geographic Distribution of ICSID Cases Registered in FY2010 by State Party Involved 21 Chart 4: Geographic Distribution of ICSID Cases Registered in FY2010 by State Party Involved 21
5. Distribution of ICSID Cases Registered in FY2010 by Economic Sector 22 Chart 5: Distribution of ICSID Cases Registered in FY2010 by Economic Sector 22
6. ICSID Arbitration Proceedings Concluded in FY2010 – Outcomes 23 Chart 6: Arbitration Proceedings under the ICSID Convention and Additional Facility Rules concluded in FY2010 – Outcomes 23 Chart 7: Arbitration Proceedings under the ICSID Convention and Additional Facility Rules concluded in FY2010 – Awards 23
7. Arbitrators and ad hoc Committee Members Appointed in ICSID Cases in FY2010 24 Chart 8: Arbitrators and ad hoc Committee Members Appointed in ICSID Cases in FY2010 – Distribution of Appointments by Geographic Region 24 Chart 9: Arbitrators and ad hoc Committee Members Appointed in ICSID Cases in FY2010 – Distribution of Appointments by ICSID and by the Parties (or Party-appointed Arbitrators) by Geographic Region 25 Chart 10: Nationality of Arbitrators and ad hoc Committee Members Appointed in ICSID Cases in FY2010 26
3 The ICSID Fiscal Year covers the period July 1 to June 30.

© 2010 by International Centre for Settlement of Investment Disputes.
Content may be reproduced for educational use with acknowledgement. Page | 5
PART I
ALL CASES REGISTERED AND ADMINISTERED BY ICSID

© 2010 by International Centre for Settlement of Investment Disputes.
Content may be reproduced for educational use with acknowledgement. Page | 6
1. Map of the ICSID Contracting States and Other Signatories to the ICSID Convention as of June 30, 2010

© 2010 by International Centre for Settlement of Investment Disputes.
Content may be reproduced for educational use with acknowledgement. Page | 7
2. Cases Registered by ICSID
Chart 1: Total Number of ICSID Cases Registered by Year:
As of June 30, 2010, ICSID had registered 319 cases under the ICSID Convention and Additional Facility Rules.
1
4
12
12 2
34
1
4
12
13 3 3
1011
1012
14
19
31
27 27
23
37
21
25
14
0
5
10
15
20
25
30
35
40
1972
1973
1974
1975
1976
1977
1978
1979
1980
1981
1982
1983
1984
1985
1986
1987
1988
1989
1990
1991
1992
1993
1994
1995
1996
1997
1998
1999
2000
2001
2002
2003
2004
2005
2006
2007
2008
2009
up to
June
30,
201
0
Cases Registered under the ICSID Convention and Additional Facility Rules

© 2010 by International Centre for Settlement of Investment Disputes.
Content may be reproduced for educational use with acknowledgement. Page | 8
Chart 2: Number of Cases Registered by Year under the ICSID Convention and Additional Facility Rules:
Chart 3: Type of Proceeding Registered under the ICSID Convention and Additional Facility Rules:
14
1 2 1 2 1 2 41
41 2 1 2 3 3
8 8 8 914
18
30
2124
21
32
2023
14
1 1 1
1
1
1
2 3 2 3
1
6
2
2
4
1
2
0
5
10
15
20
25
30
35
40
1972
1973
1974
1975
1976
1977
1978
1979
1980
1981
1982
1983
1984
1985
1986
1987
1988
1989
1990
1991
1992
1993
1994
1995
1996
1997
1998
1999
2000
2001
2002
2003
2004
2005
2006
2007
2008
2009
up to
June
30,
201
0
ICSID Convention Arbitration Cases ICSID Convention Conciliation Cases ICSID Additional Facility Arbitration Cases
ICSID Convention Arbitration Cases
285(89%)
ICSID Convention Conciliation Cases
6(2%)
ICSID Additional Facility Arbitration Cases
28 (9%)
© 2010 by International Centre for Settlement of Investment Disputes.
Content may be reproduced for educational use with acknowledgement. Page | 9
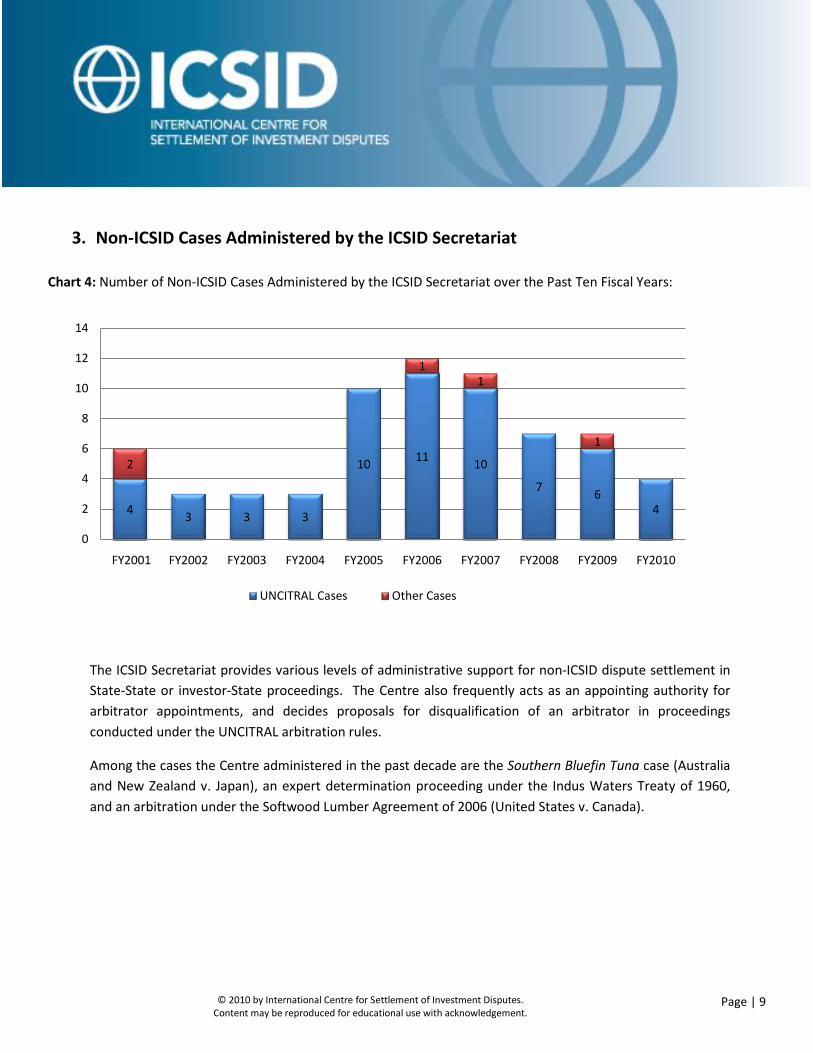
3. Non-ICSID Cases Administered by the ICSID Secretariat
Chart 4: Number of Non-ICSID Cases Administered by the ICSID Secretariat over the Past Ten Fiscal Years:
The ICSID Secretariat provides various levels of administrative support for non-ICSID dispute settlement in State-State or investor-State proceedings. The Centre also frequently acts as an appointing authority for arbitrator appointments, and decides proposals for disqualification of an arbitrator in proceedings conducted under the UNCITRAL arbitration rules.
Among the cases the Centre administered in the past decade are the Southern Bluefin Tuna case (Australia and New Zealand v. Japan), an expert determination proceeding under the Indus Waters Treaty of 1960, and an arbitration under the Softwood Lumber Agreement of 2006 (United States v. Canada).
4 3 3 3
10 11 10
7 64
2
11
1
0
2
4
6
8
10
12
14
FY2001 FY2002 FY2003 FY2004 FY2005 FY2006 FY2007 FY2008 FY2009 FY2010
UNCITRAL Cases Other Cases
© 2010 by International Centre for Settlement of Investment Disputes.
Content may be reproduced for educational use with acknowledgement. Page | 10
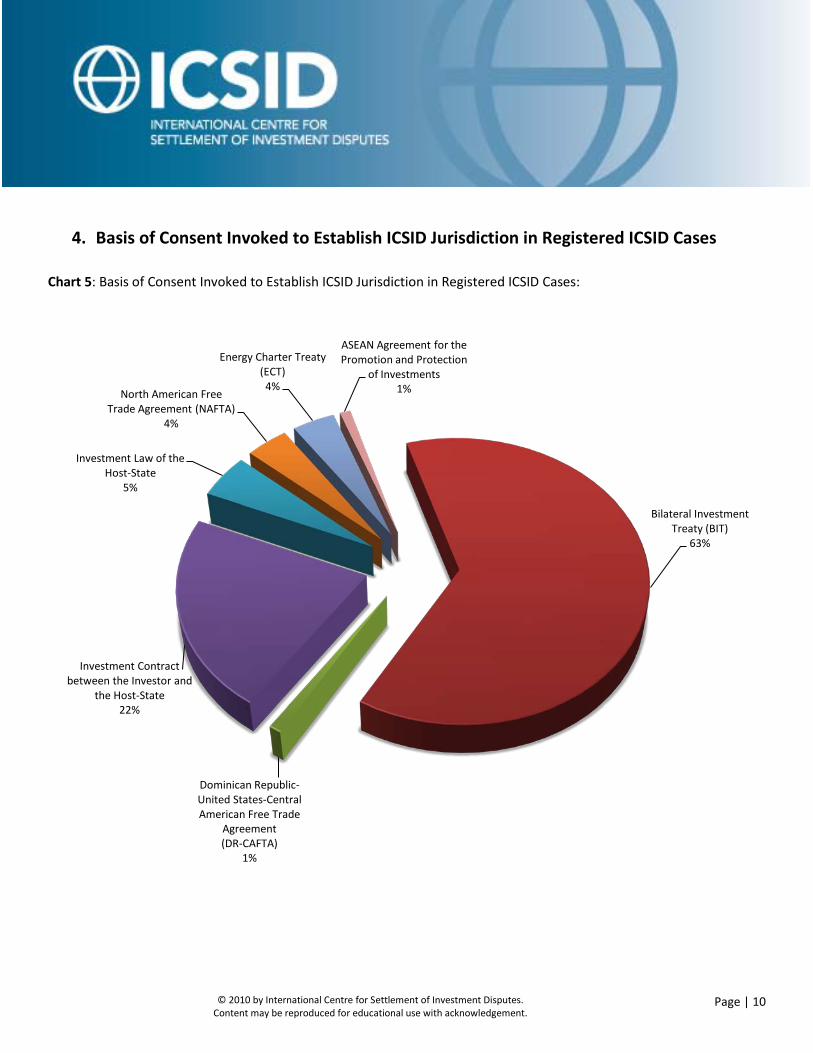
4. Basis of Consent Invoked to Establish ICSID Jurisdiction in Registered ICSID Cases Chart 5: Basis of Consent Invoked to Establish ICSID Jurisdiction in Registered ICSID Cases:
ASEAN Agreement for the Promotion and Protection
of Investments1%
Bilateral Investment Treaty (BIT)
63%
Dominican Republic-United States-Central American Free Trade
Agreement (DR-CAFTA)
1%
Investment Contract between the Investor and
the Host-State22%
Investment Law of the Host-State
5%
North American Free Trade Agreement (NAFTA)
4%
Energy Charter Treaty (ECT)
4%

© 2010 by International Centre for Settlement of Investment Disputes.
Content may be reproduced for educational use with acknowledgement. Page | 11
5. Geographic Distribution of All ICSID Cases by State Party Involved
Chart 6: Geographic Distribution of All ICSID Cases by State Party Involved*:
* The classification of the geographic regions above is based on the World Bank’s regional system, available at http://web.worldbank.org/WBSITE/EXTERNAL/COUNTRIES/0,,pagePK:180619~theSitePK:136917,00.html, and also includes World Bank donor countries.
South America30%
Central America & the Carribean
7%
North America (Canada, Mexico & U.S.)
6%
Eastern Europe & Central Asia
22%
Western Europe1%
Sub-Saharan Africa16%
Middle East & North Africa10%
South & East Asia & the Pacific
8%

© 2010 by International Centre for Settlement of Investment Disputes.
Content may be reproduced for educational use with acknowledgement. Page | 12
6. Distribution of All ICSID Cases by Economic Sector
Chart 7: Distribution of All ICSID Cases by Economic Sector*:
* This sector classification is based on the World Bank’s sector codes, which are available at http://siteresources.worldbank.org/PROJECTS/Resources/SectorCodesLists.pdf.
Finance7%
Information & Communication
6%
Agriculture, Fishing & Forestry
4%Oil, Gas & Mining
26%
Electric Power & Other Energy
13%
Water, Sanitation & Flood Protection
7%
Construction7%Tourism
5%
Other Industry10%
Transportation11%
Services & Trade
4%
© 2010 by International Centre for Settlement of Investment Disputes.
Content may be reproduced for educational use with acknowledgement. Page | 13
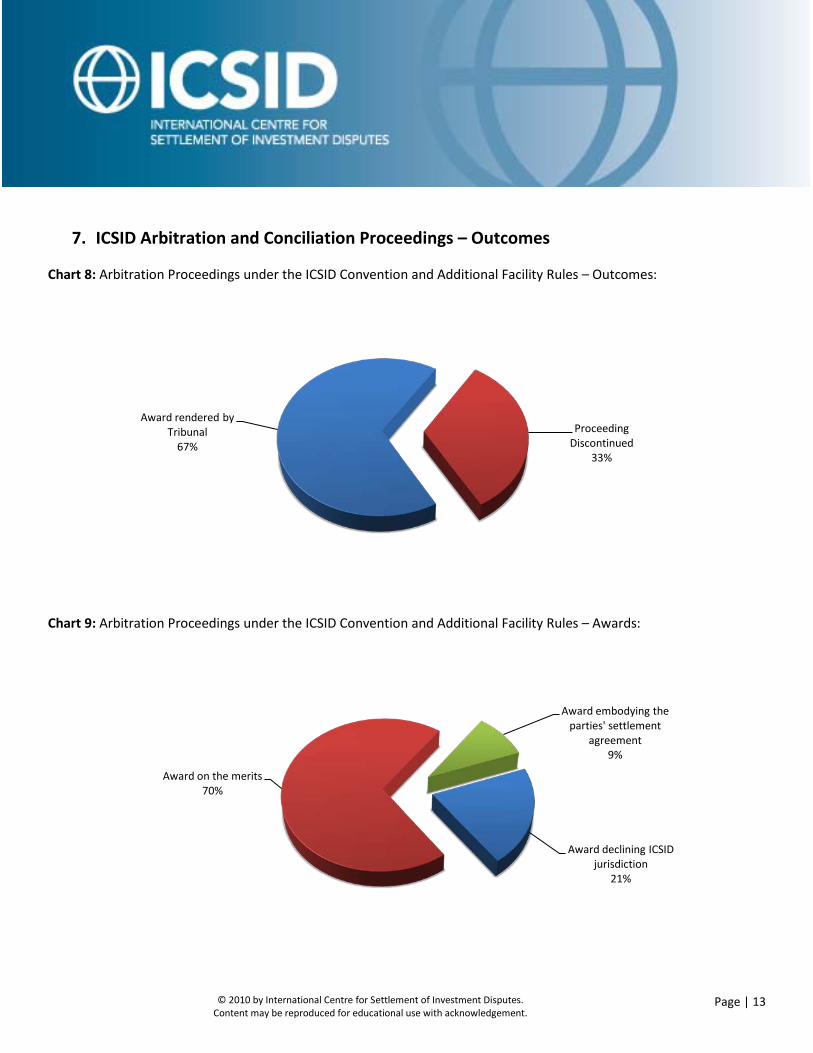
7. ICSID Arbitration and Conciliation Proceedings – Outcomes
Chart 8: Arbitration Proceedings under the ICSID Convention and Additional Facility Rules – Outcomes:
Chart 9: Arbitration Proceedings under the ICSID Convention and Additional Facility Rules – Awards:
Award rendered by Tribunal
67%Proceeding
Discontinued33%
Award declining ICSID jurisdiction
21%
Award on the merits70%
Award embodying the parties' settlement
agreement9%

© 2010 by International Centre for Settlement of Investment Disputes.
Content may be reproduced for educational use with acknowledgement. Page | 14
Chart 10: Conciliation Proceedings under the ICSID Convention – Outcomes:
Chart 11: Conciliation Proceedings under the ICSID Convention – Commission Reports:
Conciliation Commission Report
issued67%
Proceeding Discontinued
33%
Report recording failure of the parties to
reach agreement75%
Report recording agreement of the
parties25%

© 2010 by International Centre for Settlement of Investment Disputes.
Content may be reproduced for educational use with acknowledgement. Page | 15
8. Arbitrators, Conciliators and ad hoc Committee Members Appointed in ICSID Cases
Chart 12: Arbitrators, Conciliators and ad hoc Committee Members Appointed in ICSID Cases – Distribution of Appointments by Geographic Region*:
* The classification of the geographic regions above is based on the World Bank’s regional system, available at http://web.worldbank.org/WBSITE/EXTERNAL/COUNTRIES/0,,pagePK:180619~theSitePK:136917,00.html, and also includes World Bank donor countries.
North America (Canada, Mexico & U.S.)
23%
South America9%
Central America & the Caribbean
2%
Middle East & North Africa
6%
Sub-Saharan Africa2%
South & East Asia & the Pacific
8% Eastern Europe & Central Asia
2%
Western Europe48%
© 2010 by International Centre for Settlement of Investment Disputes.
Content may be reproduced for educational use with acknowledgement. Page | 16
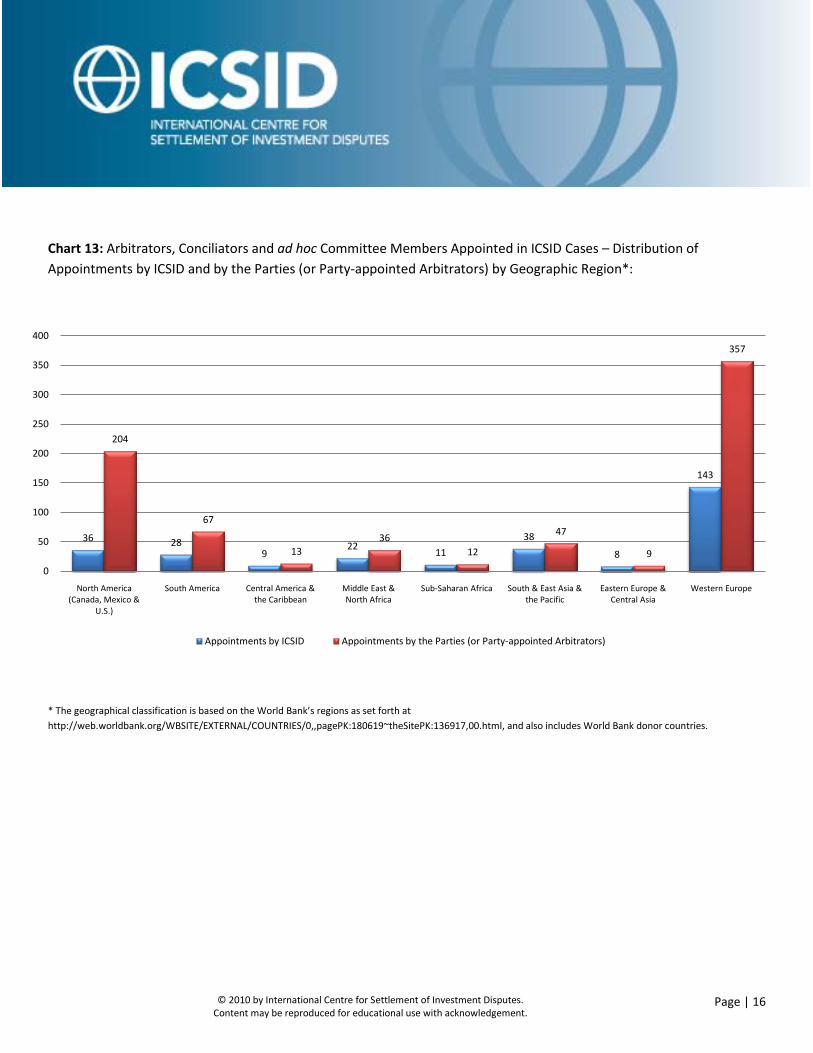
Chart 13: Arbitrators, Conciliators and ad hoc Committee Members Appointed in ICSID Cases – Distribution of Appointments by ICSID and by the Parties (or Party-appointed Arbitrators) by Geographic Region*:
* The geographical classification is based on the World Bank’s regions as set forth at http://web.worldbank.org/WBSITE/EXTERNAL/COUNTRIES/0,,pagePK:180619~theSitePK:136917,00.html, and also includes World Bank donor countries.
36 289
22 1138
8
143
204
67
1336
12
47
9
357
0
50
100
150
200
250
300
350
400
North America (Canada, Mexico &
U.S.)
South America Central America & the Caribbean
Middle East & North Africa
Sub-Saharan Africa South & East Asia & the Pacific
Eastern Europe & Central Asia
Western Europe
Appointments by ICSID Appointments by the Parties (or Party-appointed Arbitrators)

© 2010 by International Centre for Settlement of Investment Disputes.
Content may be reproduced for educational use with acknowledgement. Page | 17
Chart 14: Nationality of Arbitrators, Conciliators and ad hoc Committee Members Appointed in ICSID Cases:
127110
10077
7347
3633
3230
282525
2416
1515
1211
109
8888
77777
666
55555
44444
3333333
222222222222
1111111111
0 20 40 60 80 100 120 140
U.S.FrenchBritish
CanadianSwiss
SpanishMexican
AustralianItalian
GermanEgyptian
ChileanDutch
BelgianNew Zealand
ArgentineSwedish
Costa RicanColombian
BrazilianDanishGreek
Lebanese/FrenchUruguayan
VenezuelanEcuadorian
PhilippineSenegalese
SlovakThai
BangladeshiPeruvian
SingaporeanAustrian
British/FrenchBulgarianGuyanese
IndianAlgerianCypriotIranian
MoroccanSwiss/Brazilian
FinnishHonduran
IsraeliJamaicanNigerianPakistaniTogolese
BarbadianBeninese
CzechGaboneseGhanaian
Iranian/FrenchJordanianLebaneseMalagasy
PortugueseSerbian
Swiss/IrishCentral African
CroatianDominica
GuatemalanLuxembourg
MalaysianNorwegian
South AfricanSri LankanSudanese
Number of Appointments
Nat
iona
lity
of A
ppoi
ntee

© 2010 by International Centre for Settlement of Investment Disputes.
Content may be reproduced for educational use with acknowledgement. Page | 18
PART II
CASES REGISTERED AND ADMINISTERED BY ICSID IN FISCAL YEAR 2010 (FY2010)
© 2010 by International Centre for Settlement of Investment Disputes.
Content may be reproduced for educational use with acknowledgement. Page | 19
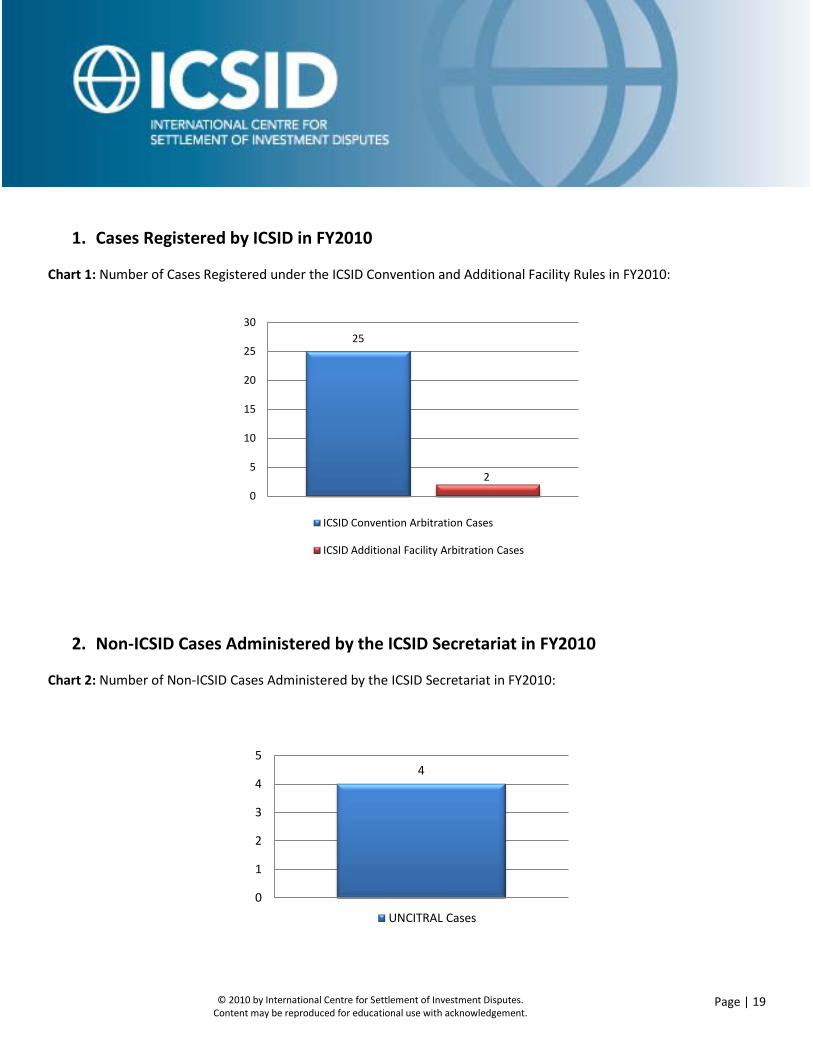
1. Cases Registered by ICSID in FY2010
Chart 1: Number of Cases Registered under the ICSID Convention and Additional Facility Rules in FY2010:
2. Non-ICSID Cases Administered by the ICSID Secretariat in FY2010
Chart 2: Number of Non-ICSID Cases Administered by the ICSID Secretariat in FY2010:
25
20
5
10
15
20
25
30
ICSID Convention Arbitration Cases
ICSID Additional Facility Arbitration Cases
4
0
1
2
3
4
5
UNCITRAL Cases

© 2010 by International Centre for Settlement of Investment Disputes.
Content may be reproduced for educational use with acknowledgement. Page | 20
3. Basis of Consent Invoked to Establish ICSID Jurisdiction in Cases Registered in FY2010
Chart 3: Basis of Consent Invoked to Establish ICSID Jurisdiction in Cases Registered in FY2010:
Bilateral Investment Treaty (BIT)
66%
Dominican Republic-United States-Central American Free Trade
Agreement (DR-CAFTA)
3%
Investment Contract between the Investor and
the Host-State21%
Investment Law of the Host-State
10%

© 2010 by International Centre for Settlement of Investment Disputes.
Content may be reproduced for educational use with acknowledgement. Page | 21
4. Geographic Distribution of ICSID Cases Registered in FY2010 by State Party Involved
Chart 4: Geographic Distribution of ICSID Cases Registered in FY2010 by State Party Involved*:
* The classification of the geographic regions above is based on the World Bank’s regional system, available at http://web.worldbank.org/WBSITE/EXTERNAL/COUNTRIES/0,,pagePK:180619~theSitePK:136917,00.html, and also includes World Bank donor countries.
South America30%
Central America & the Carribean
11%
North America (Canada, Mexico, U.S.)
4%
Eastern Europe & Central Asia
22%
Sub-Saharan Africa15%
Middle East & North Africa
11%South & East Asia &
the Pacific7%

© 2010 by International Centre for Settlement of Investment Disputes.
Content may be reproduced for educational use with acknowledgement. Page | 22
5. Distribution of ICSID Cases Registered in FY2010 by Economic Sector
Chart 5: Distribution of ICSID Cases Registered in FY2010 by Economic Sector*:
* The sector classification is based on the World Bank’s sector codes, which are available at http://siteresources.worldbank.org/PROJECTS/Resources/SectorCodesLists.pdf.
Information & Communication
4%
Agriculture, Fishing & Forestry
4%
Oil, Gas & Mining37%
Electric Power & Other Energy
7%
Water, Sanitation & Flood Protection
4%Construction
4%
Tourism7%
Other Industry15%
Transportation11%
Services & Trade7%

© 2010 by International Centre for Settlement of Investment Disputes.
Content may be reproduced for educational use with acknowledgement. Page | 23
6. ICSID Arbitration Proceedings Concluded in FY2010 – Outcomes
Chart 6: Arbitration Proceedings under the ICSID Convention and Additional Facility Rules concluded in FY2010 – Outcomes:
Chart 7: Arbitration Proceedings under the ICSID Convention and Additional Facility Rules concluded in FY2010 – Awards:
Award rendered by Tribunal
87% Proceeding Discontinued
13%
Award declining ICSID jurisdiction
24%
Award on the merits67%
Award embodying the parties' settlement
agreement9%
© 2010 by International Centre for Settlement of Investment Disputes.
Content may be reproduced for educational use with acknowledgement. Page | 24
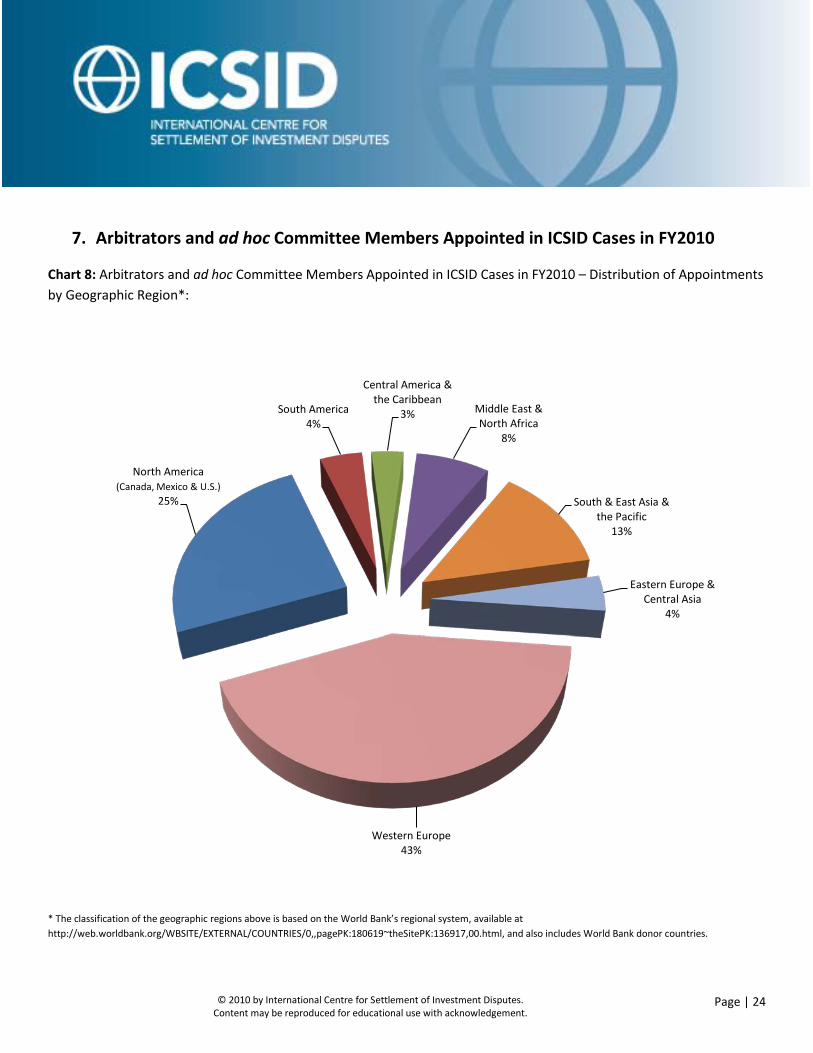
7. Arbitrators and ad hoc Committee Members Appointed in ICSID Cases in FY2010
Chart 8: Arbitrators and ad hoc Committee Members Appointed in ICSID Cases in FY2010 – Distribution of Appointments by Geographic Region*:
* The classification of the geographic regions above is based on the World Bank’s regional system, available at http://web.worldbank.org/WBSITE/EXTERNAL/COUNTRIES/0,,pagePK:180619~theSitePK:136917,00.html, and also includes World Bank donor countries.
North America (Canada, Mexico & U.S.)
25%
South America4%
Central America & the Caribbean
3% Middle East & North Africa
8%
South & East Asia & the Pacific
13%
Eastern Europe & Central Asia
4%
Western Europe43%

© 2010 by International Centre for Settlement of Investment Disputes.
Content may be reproduced for educational use with acknowledgement. Page | 25
Chart 9: Arbitrators and ad hoc Committee Members Appointed in ICSID Cases in FY2010 – Distribution of Appointments by ICSID and by the Parties (or Party-appointed Arbitrators) by Geographic Region*:
* The classification of the geographic regions above is based on the World Bank’s regional system, available at http://web.worldbank.org/WBSITE/EXTERNAL/COUNTRIES/0,,pagePK:180619~theSitePK:136917,00.html, and also includes World Bank donor countries.
5
02 2
31
10
18
4
1
5
9
3
30
0
5
10
15
20
25
30
35
North America (Canada, Mexico & U.S.)
South America Central America & the Caribbean
Middle East & North Africa
South & East Asia & the Pacific
Eastern Europe & Central Asia
Western Europe
Appointments by ICSID Appointments by the Parties (or Party-appointed Arbitrators)
© 2010 by International Centre for Settlement of Investment Disputes.
Content may be reproduced for educational use with acknowledgement. Page | 26
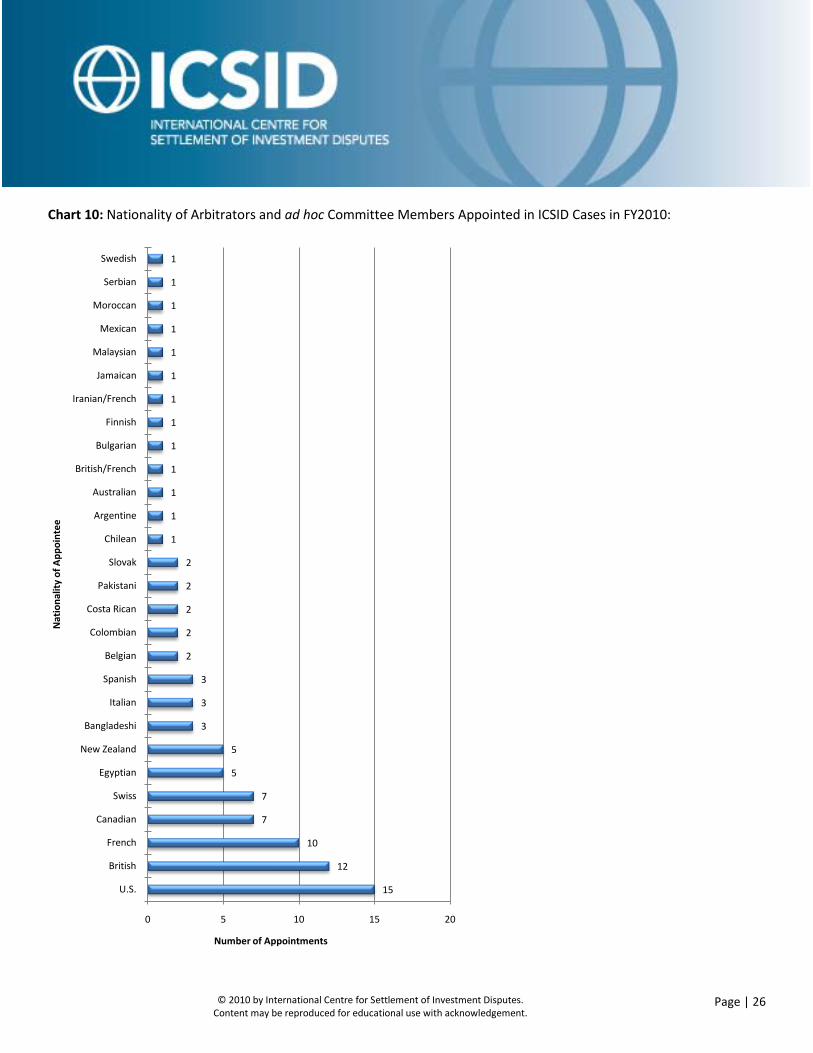
Chart 10: Nationality of Arbitrators and ad hoc Committee Members Appointed in ICSID Cases in FY2010:
15
12
10
7
7
5
5
3
3
3
2
2
2
2
2
1
1
1
1
1
1
1
1
1
1
1
1
1
0 5 10 15 20
U.S.
British
French
Canadian
Swiss
Egyptian
New Zealand
Bangladeshi
Italian
Spanish
Belgian
Colombian
Costa Rican
Pakistani
Slovak
Chilean
Argentine
Australian
British/French
Bulgarian
Finnish
Iranian/French
Jamaican
Malaysian
Mexican
Moroccan
Serbian
Swedish
Number of Appointments
Nat
iona
lity
of A
ppoi
ntee