Embed Size (px)
Citation preview
This journal is©The Royal Society of Chemistry 2016 Soft Matter, 2016, 12, 3271--3282 | 3271
Cite this: SoftMatter, 2016,
12, 3271
The impact and bounce of air bubbles at a flatfluid interface†
Rogerio Manica,a Evert Klaseboera and Derek Y. C. Chan*bc
The rise and impact of bubbles at an initially flat but deformable liquid–air interface in ultraclean liquid
systems are modelled by taking into account the buoyancy force, hydrodynamic drag, inertial added
mass effect and drainage of the thin film between the bubble and the interface. The bubble–surface
interaction is analyzed using lubrication theory that allows for both bubble and surface deformation
under a balance of normal stresses and surface tension as well as the long-range nature of deformation
along the interface. The quantitative result for collision and bounce is sensitive to the impact velocity of
the rising bubble. This velocity is controlled by the combined effects of interfacial tension via the
Young–Laplace equation and hydrodynamic stress on the surface, which determine the deformation
of the bubble. The drag force that arises from the hydrodynamic stress in turn depends on the hydro-
dynamic boundary conditions on the bubble surface and its shape. These interrelated factors are
accounted for in a consistent manner. The model can predict the rise velocity and shape of millimeter-
size bubbles in ultra-clean water, in two silicone oils of different densities and viscosities and in ethanol
without any adjustable parameters. The collision and bounce of such bubbles with a flat water/air, silicone
oil/air and ethanol/air interface can then be predicted with excellent agreement when compared to
experimental observations.
Introduction
When a bubble approaches an initially flat free surface with alarge enough velocity, a film of liquid is trapped, creating apressure build-up between the bubble and the free surface.Lubrication and deformation forces can cause a rebound of thebubble prior to film rupture. Advances in high-speed photo-graphy allow for very precise measurements of the rise velocity,impact and bounce of bubbles against solid surfaces,1,2 softdeformable surfaces3–6 and also from compound films.7,8 Theliquid film eventually breaks and the bubble bursts throughthe free surface causing small droplets of the liquid phase tobe propelled into the air and smaller bubbles can also form inthe liquid phase.9 This bursting phenomenon occurs on amilliseconds timescale whereas the bounce and drainage pro-cesses usually take place over much longer time scales of up toseconds. Thus the rebound and drainage of the film between
the bubble and the free surface are the important rate deter-mining steps in the dynamics of a bubble-interface encounter.
Modelling the impact of bubbles against deformable surfacesis challenging because it requires tracking the deformation ofthe bubble and the deformable surface simultaneously. It alsorequires modelling the detailed thin film drainage that occurs atseparations on micron scale as well as the motion of the bubbleof millimetre size to over say a centimetre length scale.
The velocity of the bubble rising in a straight path ispredicted using a force balance method where drag, buoyancy,added mass and film forces are taken into account. This approachis an extension of a theory that has been applied to model theexperimental data10,11 on the collision between bubbles andsolid surfaces in ultraclean12 and contaminated13,14 systems.Advantages of this model include its efficiency and ease ofimplementation. In contrast, numerical solutions of the fullNavier–Stokes equations using, for example, the volume offluid method15 require refined grids and are more expensivecomputationally, even though such approaches can providemore details about the complete flow field.
We use lubrication theory to treat the small length scale filmdrainage stage in which the interaction between the collidinginterfaces cause them to deform. Such an approach was provento be accurate when the separation between the interfacesbecame much smaller than the interaction region as is the casefor interactions involving bubbles and drops16,17 approaching at
a Institute of High Performance Computing, 1 Fusionopolis Way, 138632, Singaporeb Particulate Fluids Processing Center, School of Mathematics and Statistics,
The University of Melbourne, Parkville 3052, Australia.
E-mail: [email protected] Department of Chemistry and Biotechnology, Swinburne University of Technology,
Hawthorn 3122, Australia
† Electronic supplementary information (ESI) available: Video highlightingnumerical calculations of a bubble (R = 0.74 mm) impacting a fluid interfacecorresponding to the data of Fig. 4a. See DOI: 10.1039/c5sm03151f
Received 31st December 2015,Accepted 16th February 2016
DOI: 10.1039/c5sm03151f
www.rsc.org/softmatter
Soft Matter
PAPER
Publ
ishe
d on
18
Febr
uary
201
6. D
ownl
oade
d by
The
Uni
vers
ity o
f M
elbo
urne
Lib
rari
es o
n 23
/07/
2016
01:
45:4
5.
View Article OnlineView Journal | View Issue
3272 | Soft Matter, 2016, 12, 3271--3282 This journal is©The Royal Society of Chemistry 2016
low speeds (low Reynolds numbers) and also bubbles approach-ing a solid surface at high speeds.18–20
A quantitative account of the impact and bounce of a bubbleat an initially flat but deformable interface requires preciseknowledge of the shape and velocity of the bubble as it rises inbulk as an initial condition. In itself, the topic of terminalvelocity and shape of rising bubbles in clean liquid systems hasbeen an important area of research both experimentally21–23
and theoretically.24–26 Recently, research is focused on the onsetof instabilities, when the bubble rise trajectory changes from arectilinear to a zig-zag or spiral path.27,28 In this article, we willonly be concerned with rectilinear trajectory regimes that areaxisymmetric during bubble rise and its subsequent impact withthe surface. We consider clean systems in which the boundarycondition at the bubble surface is mobile, that is, the tangentialstress on the bubble vanishes.
However, it has been observed experimentally that the initialfew bounces of a rising bubble in water at a solid hydrophilic(water-wet) surface such as a smooth glass plate,1 at a solidhydrophobic (non-water-wet) surface such as a slightly roughTeflon plate2 or at a deformable water/air interface, are all verysimilar3,4 even though the final states of the bubble areobviously quite different. This leads to the conclusion thatthe hydrodynamic boundary conditions at all three surfacesmust be very similar, if not identical. For our modelling wetherefore consider the fluid boundary condition of the freesurface to be tangentially immobile, that is, the fluid velocity atthe free air/water interface follows the velocity of the movingand deforming interface rather than obeying the condition ofzero tangential stress.
The manuscript is organized as follows. A prerequisite for aquantitative description of a bubble bouncing at a solid ordeformable surface is the correct prediction of the approachvelocity. If this velocity is too low or too high, the extent of therebound is under- or over-estimated. Therefore we will firstpresent a model to predict this approach velocity. This modelalso needs to be able to predict the correct deformation of theshape of the rising bubble in a self-consistent way. Such pre-liminary considerations form the starting point for constructinga predictive model of the interaction between a bubble and afree surface. We then make detailed comparisons with resultsof bubble bounce experiments in water, in ethanol and intwo silicone oils of different densities and viscosities at thefree air/liquid interface for a range of bubble radii. We also useour model to predict characteristic physical quantities that areyet to be measured experimentally.
Stokes–Reynolds–Young–Laplaceequations
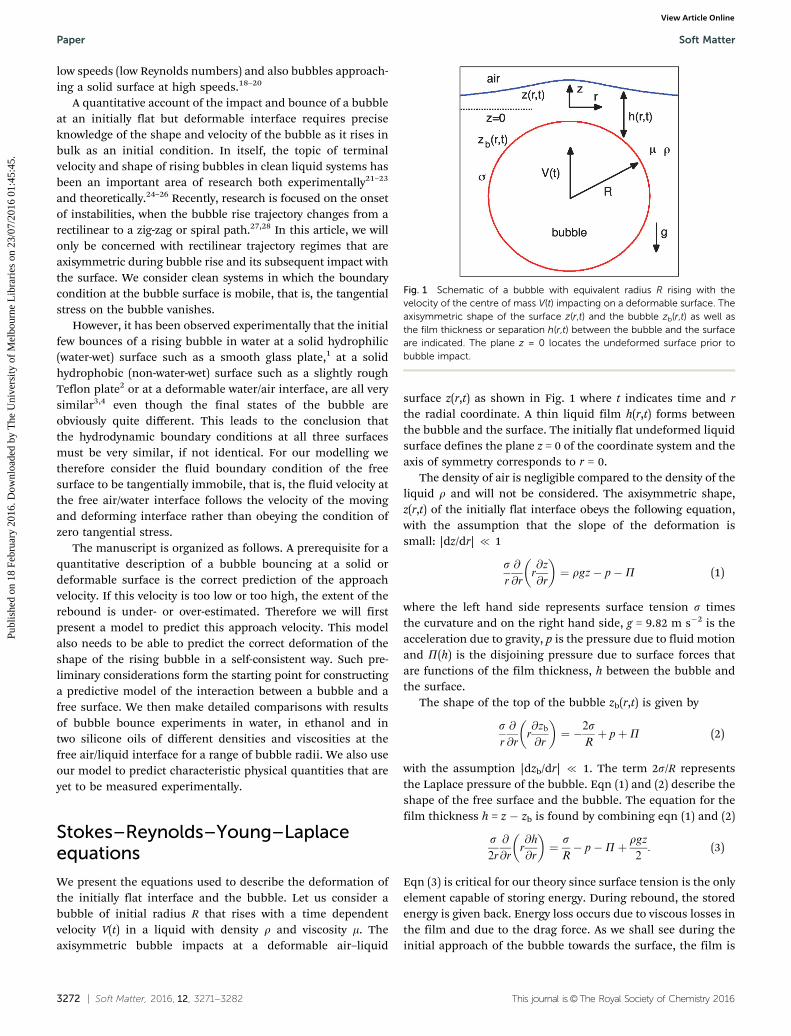
We present the equations used to describe the deformation ofthe initially flat interface and the bubble. Let us consider abubble of initial radius R that rises with a time dependentvelocity V(t) in a liquid with density r and viscosity m. Theaxisymmetric bubble impacts at a deformable air–liquid
surface z(r,t) as shown in Fig. 1 where t indicates time and rthe radial coordinate. A thin liquid film h(r,t) forms betweenthe bubble and the surface. The initially flat undeformed liquidsurface defines the plane z = 0 of the coordinate system and theaxis of symmetry corresponds to r = 0.
The density of air is negligible compared to the density of theliquid r and will not be considered. The axisymmetric shape,z(r,t) of the initially flat interface obeys the following equation,with the assumption that the slope of the deformation issmall: |dz/dr| { 1
sr
@
@rr@z
@r
� �¼ rgz� p�P (1)
where the left hand side represents surface tension s timesthe curvature and on the right hand side, g = 9.82 m s�2 is theacceleration due to gravity, p is the pressure due to fluid motionand P(h) is the disjoining pressure due to surface forces thatare functions of the film thickness, h between the bubble andthe surface.
The shape of the top of the bubble zb(r,t) is given by
sr
@
@rr@zb@r
� �¼ �2s
Rþ pþP (2)
with the assumption |dzb/dr| { 1. The term 2s/R representsthe Laplace pressure of the bubble. Eqn (1) and (2) describe theshape of the free surface and the bubble. The equation for thefilm thickness h = z � zb is found by combining eqn (1) and (2)
s2r
@
@rr@h
@r
� �¼ s
R� p�Pþ rgz
2: (3)
Eqn (3) is critical for our theory since surface tension is the onlyelement capable of storing energy. During rebound, the storedenergy is given back. Energy loss occurs due to viscous losses inthe film and due to the drag force. As we shall see during theinitial approach of the bubble towards the surface, the film is
Fig. 1 Schematic of a bubble with equivalent radius R rising with thevelocity of the centre of mass V(t) impacting on a deformable surface. Theaxisymmetric shape of the surface z(r,t) and the bubble zb(r,t) as well asthe film thickness or separation h(r,t) between the bubble and the surfaceare indicated. The plane z = 0 locates the undeformed surface prior tobubble impact.
Paper Soft Matter
Publ
ishe
d on
18
Febr
uary
201
6. D
ownl
oade
d by
The
Uni
vers
ity o
f M
elbo
urne
Lib
rari
es o
n 23
/07/
2016
01:
45:4
5.
View Article Online
This journal is©The Royal Society of Chemistry 2016 Soft Matter, 2016, 12, 3271--3282 | 3273
relatively thick so the disjoining pressure P is small and can beneglected during the initial approach.
The Reynolds number within the film is small and thedrainage therefore obeys Stokes flow. The velocity profile inthis thin film region is parabolic and the drainage processis calculated from the classical Stokes–Reynolds equation.Assuming that the immobile boundary condition holds at thedeformable flat surface whereas the bubble surface has amobile boundary condition we have the following film thinningequation12,17
@h
@t¼ 1
3mr@
@rrh3@p
@r
� �: (4)
If both surfaces are immobile factor 3 should be replaced by 12.When both surfaces are mobile, the flow in the film is no longerparabolic, but instead becomes a plug flow. In that case wecannot use lubrication theory because the flow in the film isinertia controlled. Chesters and Hofman29 proposed a modelto deal with this situation. Their model has the disadvantagethat the pressure does not decay fast enough, resulting in anon-converging film force.17
Analytical shape of the surface underan applied force
To obtain a scale of the deformation of the free surface, we firstconsider the equilibrium deformation of the air–liquid inter-face due to the presence of a bubble of radius R pushing thesurface upward from below as shown in Fig. 1. The equilibriumstate is established by the balance between the buoyancy forceand the surface force due to deformation of the free surface.A repulsive disjoining pressure between the free surface and thebubble mediates this interaction. For the purpose of the followingderivation, the detailed form of the disjoining pressure, P(h),is unimportant as long as it is repulsive. At equilibrium thehydrodynamic pressure vanishes, p = 0. The analysis is basedon matching the deformation of the initially flat surface in theouter region far from the bubble (r c R), with the solution inthe interaction region (r r R).
Outer region of the free surface
In the outer region r c R, h is large, so P(h) can be neglectedand eqn (1) becomes a Bessel equation
1
r
@
@rr@z
@r
� �� z
l2¼ @
2z
@r2þ 1
r
@z
@r� z
l2¼ 0 (5)
which has an analytical solution, in terms of the modifiedBessel function of the second kind of order zero30
zðrÞ ¼ AK0r
l
� �(6)
where the capillary length, l, is defined as
l ¼ffiffiffiffiffiffisrg
r: (7)
The constant A will be found by matching with the innersolution. To do so, we note that the asymptotic form of eqn (6)when r { l is
zðrÞ ¼ AK0r
l
� �� �A ln
r
2l
� �� gE
h i(8)
where gE = 0.57721566 is the Euler constant. More details on theasymptotic behaviour of K0 are given in the Appendix.
To obtain the constant A in eqn (6), the outer solution has tobe matched with the inner solution for the film where thedisjoining pressure, P is important but the term rgz can beneglected whereby eqn (1) becomes
sr
@
@rr@z
@r
� �¼ �P: (9)
The first integration of eqn (9) yields
rdz
dr¼ �1
s
ðr0
rPdr (10)
since axial symmetry requires dz/dr = 0 at r = 0. The secondintegration yields in the limit r - N
zðrÞ ! � F
2pslnðr=2lÞ þ zð0Þ þ 1
s
ð10
r lnðr=2lÞPdr (11)
where
F ¼ð10
2prPdr (12)
is the force between the bubble and the deformed surface.Matching the coefficients of the logarithmic terms in eqn (8)and (11) gives A = F/(2ps) so that the shape of the deformable
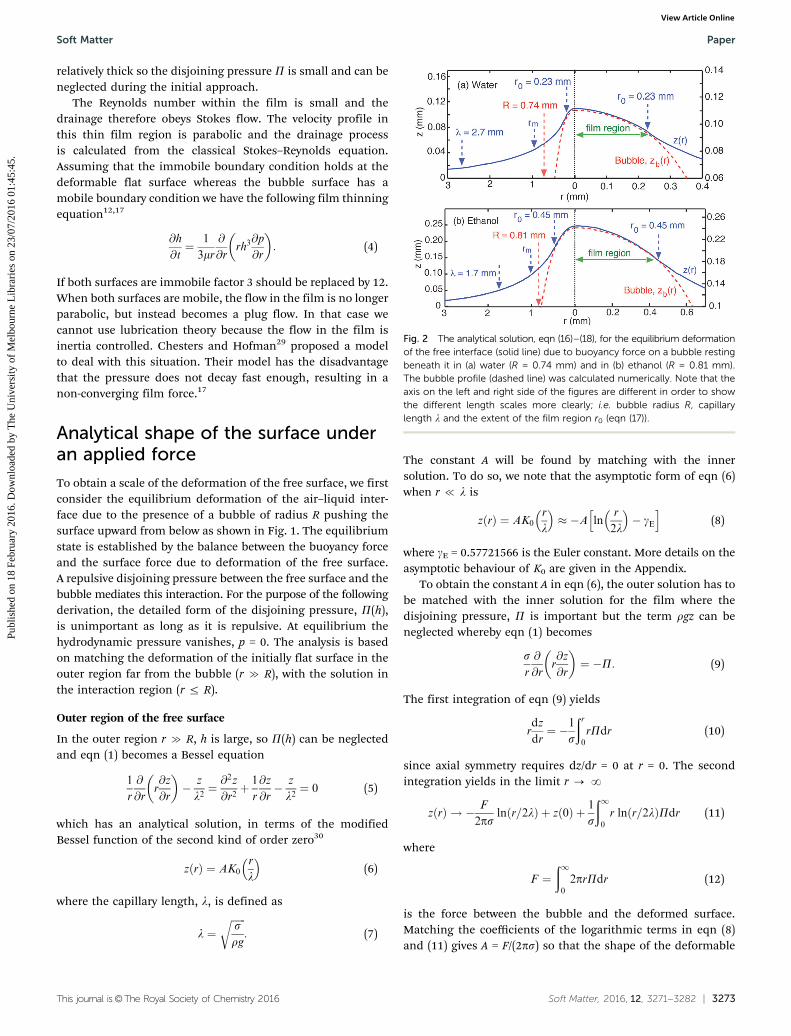
Fig. 2 The analytical solution, eqn (16)–(18), for the equilibrium deformationof the free interface (solid line) due to buoyancy force on a bubble restingbeneath it in (a) water (R = 0.74 mm) and in (b) ethanol (R = 0.81 mm).The bubble profile (dashed line) was calculated numerically. Note that theaxis on the left and right side of the figures are different in order to showthe different length scales more clearly; i.e. bubble radius R, capillarylength l and the extent of the film region r0 (eqn (17)).
Soft Matter Paper
Publ
ishe
d on
18
Febr
uary
201
6. D
ownl
oade
d by
The
Uni
vers
ity o
f M
elbo
urne
Lib
rari
es o
n 23
/07/
2016
01:
45:4
5.
View Article Online

3274 | Soft Matter, 2016, 12, 3271--3282 This journal is©The Royal Society of Chemistry 2016
surface outside the interaction zone between the bubble andthe surface is given by
zðrÞ ¼ F
2psK0
r
l
� �: (13)
This is the result that will be used as a boundary condition for thenumerical calculations in which the shape of the horizontal sur-face is calculated using eqn (1) and (4) with boundary conditionsdz/dr = 0 at r = 0 and z(rm) = (F/2ps)K0(rm/l), with rm being some largeradial value at which the disjoining pressure has become negligiblysmall, but still satisfies rm o l, as illustrated in Fig. 2.
Inner region of the surface
We can obtain a complete approximate analytical solution byderiving an expression for the inner region where the bubbleand the surface interact. We assume that a repulsive disjoiningpressure maintains a thin equilibrium film between the bubbleand the deformed free surface that has a near uniform thickness,(h B constant). Then from eqn (3), we can make the approxi-mation: P B s/R when rgz is small, so that eqn (1) becomes
sr
@
@rr@z
@r
� �¼ �s
R: (14)
Integrating this twice together with the axisymmetric conditiondz/dr = 0 at r = 0 yields the inner solution
zðrÞ ¼ z0 �r2
4R(15)
where z0 = z(r = 0).Finally, the complete approximate analytical solution for the
equilibrium shape of the interface is the combination ofeqn (13) and (15)
zðrÞ ¼
F
2psK0
r
l
� �r4 r0
z0 �r2
4Rro r0
8>>><>>>:
: (16)
To find the constant r0 where the two functional forms changeover, we equate the absolute value of the force F with the forcedue to the approximate disjoining pressure that has the form,P = s/R, 0 o r o r0, and P = 0, r 4 r0, acting over the film ofarea pr0
2. This gives
r0 ¼ffiffiffiffiffiffiffiRF
ps
r: (17)
The constant z0 can be found by equating the two forms of thesolution in eqn (16) at r0 to give
z0 ¼r02
4Rþ F
2psK0
r0
l
� �
¼ F
4ps1þ 2K0
r0
l
� �h i
� F
4ps1� 2gE � 2 ln
r0
2l
� �h i:
(18)
This is just the maximum equilibrium central deformation ofthe free surface due to the presence of the bubble beneath it
being pushed up by buoyancy. Furthermore, it can be shownthat the derivative of z(r) is also continuous at r0.
In Fig. 2a and b, we show the approximate analytic solutiongiven by eqn (16)–(18) for bubbles of radius R = 0.74 mm in waterand R = 0.81 mm in ethanol. These two radii correspond to thesize of bouncing bubbles that will be investigated later. We takeF = 4pR3rg/3 as the absolute value of the buoyancy force on aspherical bubble of radius R. It is assumed that a stable film ismaintained between the bubble and the free surface by a repulsivedisjoining pressure and a final equilibrium configuration isreached when the surface tension force of the deformation ofthe free surface and the buoyancy force of the bubble balance eachother. The radius of curvature at the apex of the free surface, seeeqn (15), is exactly twice the original radius the bubble.
In this approximate analysis for each liquid, the disjoiningpressure in the film is taken to be P E s/R for 0 o r o r0 andit is zero for r 4 r0.
Fig. 3 Comparison between experiments of Zawala et al.,3,5 Sunol et al.,6
Duineveld21 and Wu and Gharib23 (symbols) with the theoretical prediction(lines) using Moore’s theory, eqn (19)–(24), for (a) terminal velocity, VT
of bubbles rising in silicone oil, ethanol and ultrapure water. The dashedline is the variation for water assuming the bubble remained spherical.(b) Vertical-to-horizontal aspect ratio of bubbles in water and ethanol as afunction of the Weber number, We = 2RrVT
2/s according to eqn (24). Theinset shows definitions of vertical and horizontal radii.
Paper Soft Matter
Publ
ishe
d on
18
Febr
uary
201
6. D
ownl
oade
d by
The
Uni
vers
ity o
f M
elbo
urne
Lib
rari
es o
n 23
/07/
2016
01:
45:4
5.
View Article Online
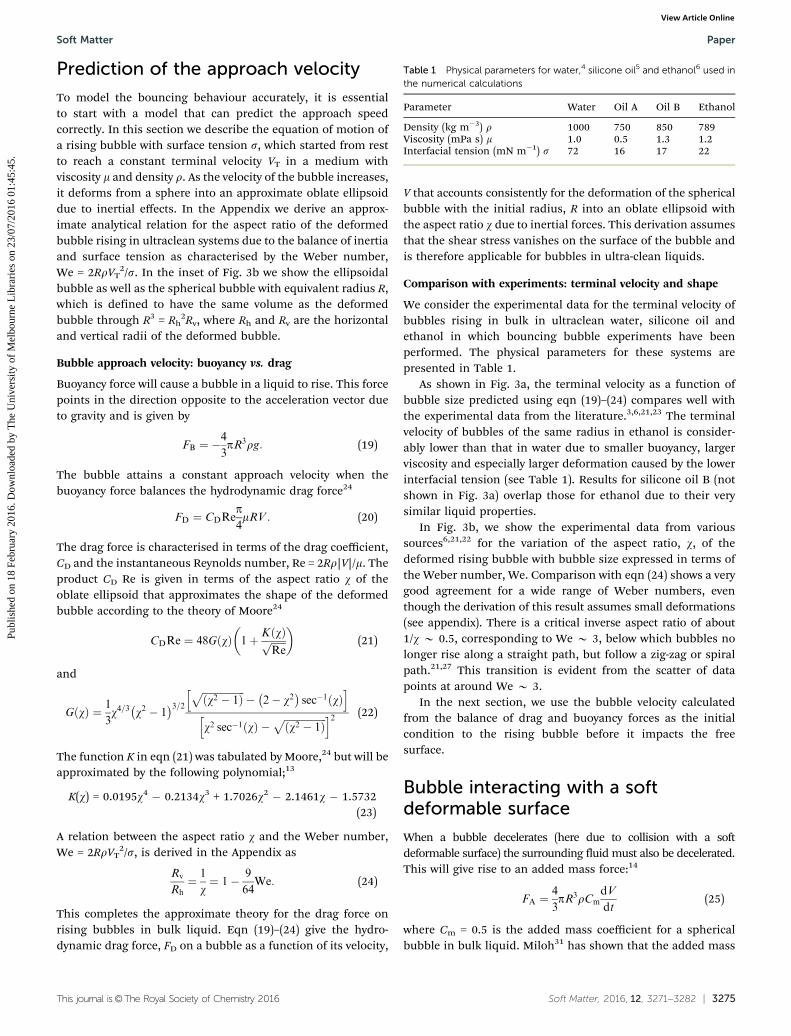
This journal is©The Royal Society of Chemistry 2016 Soft Matter, 2016, 12, 3271--3282 | 3275
Prediction of the approach velocity
To model the bouncing behaviour accurately, it is essentialto start with a model that can predict the approach speedcorrectly. In this section we describe the equation of motion ofa rising bubble with surface tension s, which started from restto reach a constant terminal velocity VT in a medium withviscosity m and density r. As the velocity of the bubble increases,it deforms from a sphere into an approximate oblate ellipsoiddue to inertial effects. In the Appendix we derive an approx-imate analytical relation for the aspect ratio of the deformedbubble rising in ultraclean systems due to the balance of inertiaand surface tension as characterised by the Weber number,We = 2RrVT
2/s. In the inset of Fig. 3b we show the ellipsoidalbubble as well as the spherical bubble with equivalent radius R,which is defined to have the same volume as the deformedbubble through R3 = Rh
2Rv, where Rh and Rv are the horizontaland vertical radii of the deformed bubble.
Bubble approach velocity: buoyancy vs. drag
Buoyancy force will cause a bubble in a liquid to rise. This forcepoints in the direction opposite to the acceleration vector dueto gravity and is given by
FB ¼ �4
3pR3rg: (19)
The bubble attains a constant approach velocity when thebuoyancy force balances the hydrodynamic drag force24
FD ¼ CDRep4mRV : (20)
The drag force is characterised in terms of the drag coefficient,CD and the instantaneous Reynolds number, Re = 2Rr|V|/m. Theproduct CD Re is given in terms of the aspect ratio w of theoblate ellipsoid that approximates the shape of the deformedbubble according to the theory of Moore24
CDRe ¼ 48GðwÞ 1þ KðwÞffiffiffiffiffiffiRep
� �(21)
and
GðwÞ ¼ 1
3w4=3 w2 � 1
� �3=2ffiffiffiffiffiffiffiffiffiffiffiffiffiffiffiffiffiw2 � 1ð Þ
p� 2� w2� �
sec�1ðwÞh i
w2 sec�1ðwÞ �ffiffiffiffiffiffiffiffiffiffiffiffiffiffiffiffiffiw2 � 1ð Þ
ph i2 (22)
The function K in eqn (21) was tabulated by Moore,24 but will beapproximated by the following polynomial;13
K(w) = 0.0195w4 � 0.2134w3 + 1.7026w2 � 2.1461w � 1.5732(23)
A relation between the aspect ratio w and the Weber number,We = 2RrVT
2/s, is derived in the Appendix as
Rv
Rh¼ 1
w¼ 1� 9
64We: (24)
This completes the approximate theory for the drag force onrising bubbles in bulk liquid. Eqn (19)–(24) give the hydro-dynamic drag force, FD on a bubble as a function of its velocity,
V that accounts consistently for the deformation of the sphericalbubble with the initial radius, R into an oblate ellipsoid withthe aspect ratio w due to inertial forces. This derivation assumesthat the shear stress vanishes on the surface of the bubble andis therefore applicable for bubbles in ultra-clean liquids.
Comparison with experiments: terminal velocity and shape
We consider the experimental data for the terminal velocity ofbubbles rising in bulk in ultraclean water, silicone oil andethanol in which bouncing bubble experiments have beenperformed. The physical parameters for these systems arepresented in Table 1.
As shown in Fig. 3a, the terminal velocity as a function ofbubble size predicted using eqn (19)–(24) compares well withthe experimental data from the literature.3,6,21,23 The terminalvelocity of bubbles of the same radius in ethanol is consider-ably lower than that in water due to smaller buoyancy, largerviscosity and especially larger deformation caused by the lowerinterfacial tension (see Table 1). Results for silicone oil B (notshown in Fig. 3a) overlap those for ethanol due to their verysimilar liquid properties.
In Fig. 3b, we show the experimental data from varioussources6,21,22 for the variation of the aspect ratio, w, of thedeformed rising bubble with bubble size expressed in terms ofthe Weber number, We. Comparison with eqn (24) shows a verygood agreement for a wide range of Weber numbers, eventhough the derivation of this result assumes small deformations(see appendix). There is a critical inverse aspect ratio of about1/w B 0.5, corresponding to We B 3, below which bubbles nolonger rise along a straight path, but follow a zig-zag or spiralpath.21,27 This transition is evident from the scatter of datapoints at around We B 3.
In the next section, we use the bubble velocity calculatedfrom the balance of drag and buoyancy forces as the initialcondition to the rising bubble before it impacts the freesurface.
Bubble interacting with a softdeformable surface
When a bubble decelerates (here due to collision with a softdeformable surface) the surrounding fluid must also be decelerated.This will give rise to an added mass force:14
FA ¼4
3pR3rCm
dV
dt(25)
where Cm = 0.5 is the added mass coefficient for a sphericalbubble in bulk liquid. Miloh31 has shown that the added mass
Table 1 Physical parameters for water,4 silicone oil5 and ethanol6 used inthe numerical calculations
Parameter Water Oil A Oil B Ethanol
Density (kg m�3) r 1000 750 850 789Viscosity (mPa s) m 1.0 0.5 1.3 1.2Interfacial tension (mN m�1) s 72 16 17 22
Soft Matter Paper
Publ
ishe
d on
18
Febr
uary
201
6. D
ownl
oade
d by
The
Uni
vers
ity o
f M
elbo
urne
Lib
rari
es o
n 23
/07/
2016
01:
45:4
5.
View Article Online
3276 | Soft Matter, 2016, 12, 3271--3282 This journal is©The Royal Society of Chemistry 2016
coefficient for a spherical bubble touching a flat free surface is0.4198. However, in the current situation, the free surface alsomoves upwards and it seems to be justified to assume that theadded mass coefficient has a value very close to Cm = 0.5.
When the bubble approaches the surface, lubrication theoryprovides a relationship between the pressure, p in between thetwo surfaces and the separation h according to eqn (4). Thelubrication pressure, p, in the thin liquid film builds up andgenerates a film force that can be found by integrating p overthe axisymmetric film region:
FF ¼ð10
2prpdr �ðrm0
2prpdr (26)
where rm is the domain size for the numerical computation atwhich p has essentially decreased to zero.
The velocity V of the centre of mass is obtained by equatingall forces acting on the bubble, which results in the followingequation of motion for the bubble as it rises and impacts thesurface
FA + FB + FD + FF = 0. (27)
Using eqn (19), (20), (25) and (26) we obtain a point force modelfor the centre of mass of the bubble
4
3pR3rCm
dV
dt¼ 4
3pR3rg� CDRe
p4mRV �
ðrm0
2prpdr: (28)
Eqn (3) (with P = 0) and (4) constitute the partial differentialsystem to be solved numerically for the film thickness h(r,t).Apart from using the terminal velocity as the initial velocity, theinitial film thickness is given by
hðr; 0Þ ¼ �zbðr; 0Þ ¼ H00 þr2
2R(29)
where H00 is the initial distance between the top of the bubbleand the z = 0 plane that defines the undeformed free surface.
To complete the formulation we need to provide fourboundary conditions. The outer solution for the free surfacegiven by eqn (6): z(r) = AK0(r/l) provides an analytical expressionz(r,t) that is valid for large r. The numerical solution for theinner solution of the shape of the deformable surface will bematched to this analytical solution. To derive a boundarycondition at the large radial position rm, we use eqn (13) and(29) to write the separation h at rm
h rmð Þ ¼ z rm; tð Þ � zb rm; tð Þ ¼ FF
2psK0
rm
l
� ��H0 �
r2
2R(30)
where the force acting on the surface is now the film force, thatis F = FF, given by eqn (26). Taking the time derivative ofeqn (30) and assuming dH0/dt = �V, the boundary conditionat the outside border rm is given by
dh rmð Þdt
¼ V þ 1
2psK0
rm
l
� �dFF
dt: (31)
Furthermore, we take p = 0 at r = rm. At the axis of symmetry(r = 0), dp/dr = 0 and dh/dr = 0. The force FF on the bubble iscomputed from eqn (26) using Simpson’s rule. It is essential toapply this correct boundary condition at rm to obtain results
that are independent of the domain size. However, the computa-tional domain must be large enough to be able to describe thedrainage process completely. Here we take rm = 1.2R. The systemof equations with the above boundary conditions is solved usinga standard differential algebraic solver in Matlab. Note that theconstructed model is free of any fitting parameters.
Comparison with bouncingexperiments
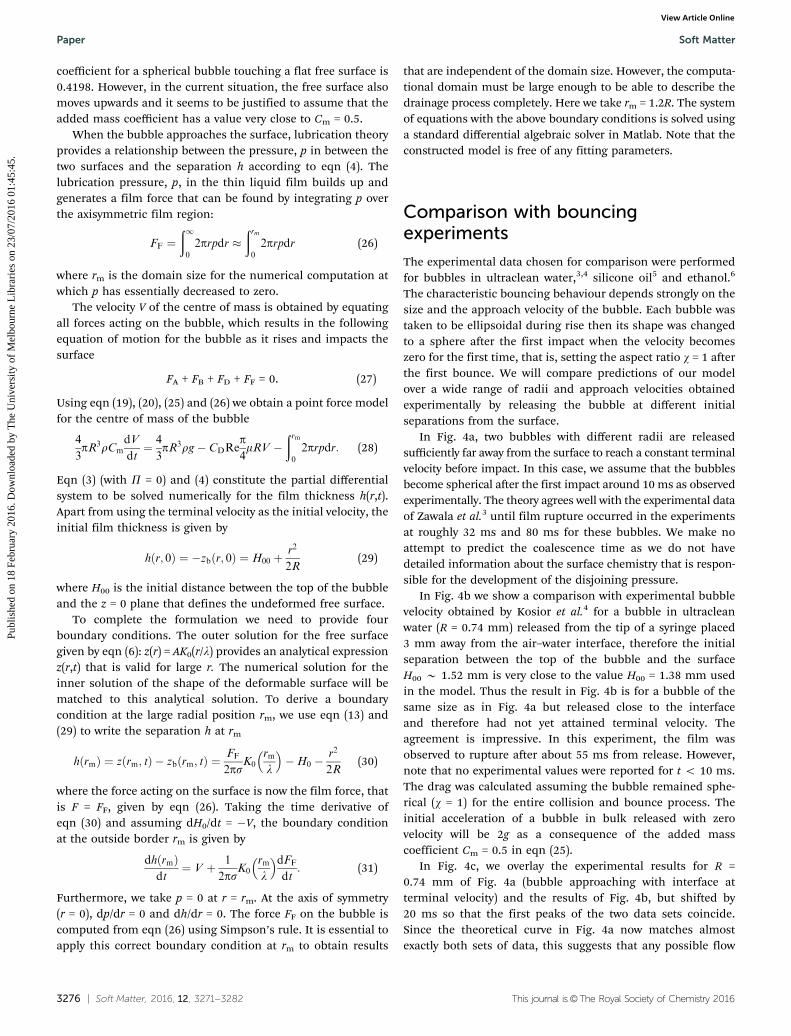
The experimental data chosen for comparison were performedfor bubbles in ultraclean water,3,4 silicone oil5 and ethanol.6
The characteristic bouncing behaviour depends strongly on thesize and the approach velocity of the bubble. Each bubble wastaken to be ellipsoidal during rise then its shape was changedto a sphere after the first impact when the velocity becomeszero for the first time, that is, setting the aspect ratio w = 1 afterthe first bounce. We will compare predictions of our modelover a wide range of radii and approach velocities obtainedexperimentally by releasing the bubble at different initialseparations from the surface.
In Fig. 4a, two bubbles with different radii are releasedsufficiently far away from the surface to reach a constant terminalvelocity before impact. In this case, we assume that the bubblesbecome spherical after the first impact around 10 ms as observedexperimentally. The theory agrees well with the experimental dataof Zawala et al.3 until film rupture occurred in the experimentsat roughly 32 ms and 80 ms for these bubbles. We make noattempt to predict the coalescence time as we do not havedetailed information about the surface chemistry that is respon-sible for the development of the disjoining pressure.
In Fig. 4b we show a comparison with experimental bubblevelocity obtained by Kosior et al.4 for a bubble in ultracleanwater (R = 0.74 mm) released from the tip of a syringe placed3 mm away from the air–water interface, therefore the initialseparation between the top of the bubble and the surfaceH00 B 1.52 mm is very close to the value H00 = 1.38 mm usedin the model. Thus the result in Fig. 4b is for a bubble of thesame size as in Fig. 4a but released close to the interfaceand therefore had not yet attained terminal velocity. Theagreement is impressive. In this experiment, the film wasobserved to rupture after about 55 ms from release. However,note that no experimental values were reported for t o 10 ms.The drag was calculated assuming the bubble remained sphe-rical (w = 1) for the entire collision and bounce process. Theinitial acceleration of a bubble in bulk released with zerovelocity will be 2g as a consequence of the added masscoefficient Cm = 0.5 in eqn (25).
In Fig. 4c, we overlay the experimental results for R =0.74 mm of Fig. 4a (bubble approaching with interface atterminal velocity) and the results of Fig. 4b, but shifted by20 ms so that the first peaks of the two data sets coincide.Since the theoretical curve in Fig. 4a now matches almostexactly both sets of data, this suggests that any possible flow
Paper Soft Matter
Publ
ishe
d on
18
Febr
uary
201
6. D
ownl
oade
d by
The
Uni
vers
ity o
f M
elbo
urne
Lib
rari
es o
n 23
/07/
2016
01:
45:4
5.
View Article Online
This journal is©The Royal Society of Chemistry 2016 Soft Matter, 2016, 12, 3271--3282 | 3277
disturbance caused by the first bounce has little influence onsubsequent bounces.
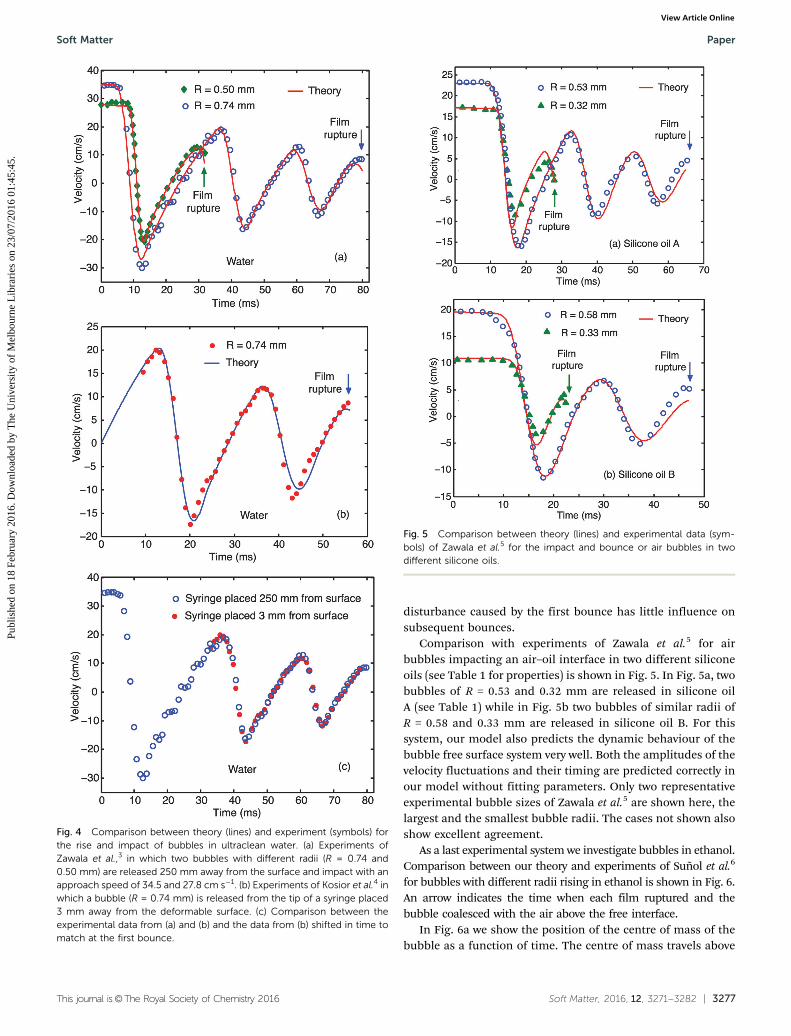
Comparison with experiments of Zawala et al.5 for airbubbles impacting an air–oil interface in two different siliconeoils (see Table 1 for properties) is shown in Fig. 5. In Fig. 5a, twobubbles of R = 0.53 and 0.32 mm are released in silicone oilA (see Table 1) while in Fig. 5b two bubbles of similar radii ofR = 0.58 and 0.33 mm are released in silicone oil B. For thissystem, our model also predicts the dynamic behaviour of thebubble free surface system very well. Both the amplitudes of thevelocity fluctuations and their timing are predicted correctly inour model without fitting parameters. Only two representativeexperimental bubble sizes of Zawala et al.5 are shown here, thelargest and the smallest bubble radii. The cases not shown alsoshow excellent agreement.
As a last experimental system we investigate bubbles in ethanol.Comparison between our theory and experiments of Sunol et al.6
for bubbles with different radii rising in ethanol is shown in Fig. 6.An arrow indicates the time when each film ruptured and thebubble coalesced with the air above the free interface.
In Fig. 6a we show the position of the centre of mass of thebubble as a function of time. The centre of mass travels above
Fig. 5 Comparison between theory (lines) and experimental data (sym-bols) of Zawala et al.5 for the impact and bounce or air bubbles in twodifferent silicone oils.
Fig. 4 Comparison between theory (lines) and experiment (symbols) forthe rise and impact of bubbles in ultraclean water. (a) Experiments ofZawala et al.,3 in which two bubbles with different radii (R = 0.74 and0.50 mm) are released 250 mm away from the surface and impact with anapproach speed of 34.5 and 27.8 cm s�1. (b) Experiments of Kosior et al.4 inwhich a bubble (R = 0.74 mm) is released from the tip of a syringe placed3 mm away from the deformable surface. (c) Comparison between theexperimental data from (a) and (b) and the data from (b) shifted in time tomatch at the first bounce.
Soft Matter Paper
Publ
ishe
d on
18
Febr
uary
201
6. D
ownl
oade
d by
The
Uni
vers
ity o
f M
elbo
urne
Lib
rari
es o
n 23
/07/
2016
01:
45:4
5.
View Article Online
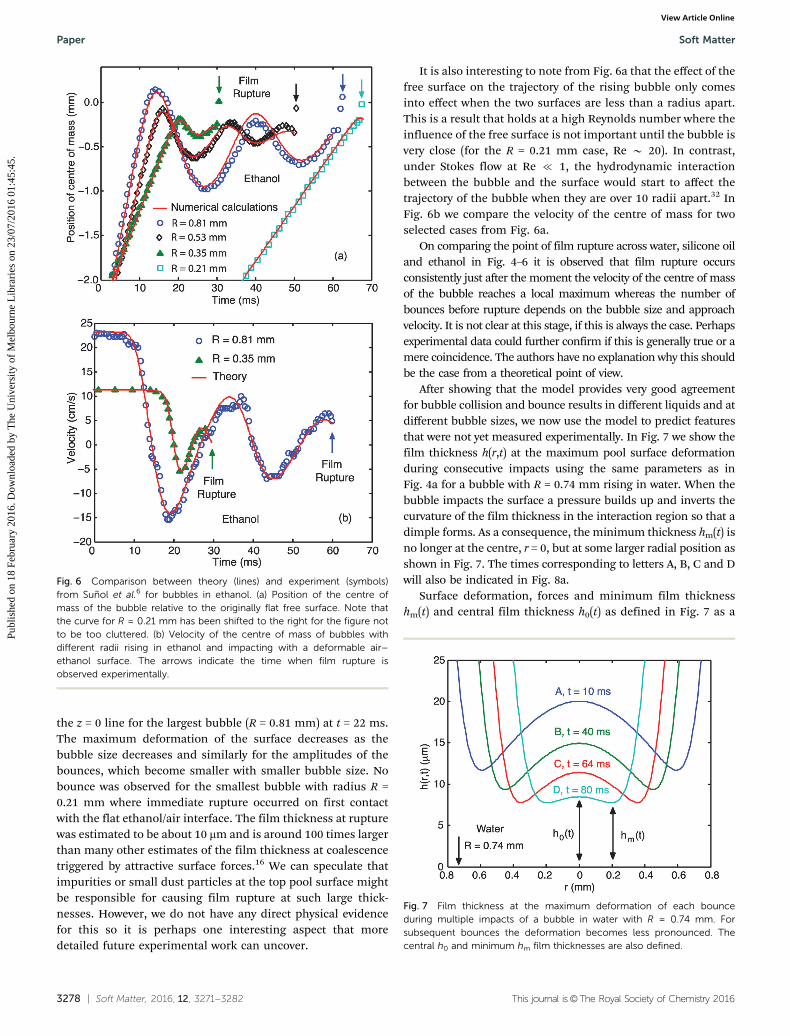
3278 | Soft Matter, 2016, 12, 3271--3282 This journal is©The Royal Society of Chemistry 2016
the z = 0 line for the largest bubble (R = 0.81 mm) at t = 22 ms.The maximum deformation of the surface decreases as thebubble size decreases and similarly for the amplitudes of thebounces, which become smaller with smaller bubble size. Nobounce was observed for the smallest bubble with radius R =0.21 mm where immediate rupture occurred on first contactwith the flat ethanol/air interface. The film thickness at rupturewas estimated to be about 10 mm and is around 100 times largerthan many other estimates of the film thickness at coalescencetriggered by attractive surface forces.16 We can speculate thatimpurities or small dust particles at the top pool surface mightbe responsible for causing film rupture at such large thick-nesses. However, we do not have any direct physical evidencefor this so it is perhaps one interesting aspect that moredetailed future experimental work can uncover.
It is also interesting to note from Fig. 6a that the effect of thefree surface on the trajectory of the rising bubble only comesinto effect when the two surfaces are less than a radius apart.This is a result that holds at a high Reynolds number where theinfluence of the free surface is not important until the bubble isvery close (for the R = 0.21 mm case, Re B 20). In contrast,under Stokes flow at Re { 1, the hydrodynamic interactionbetween the bubble and the surface would start to affect thetrajectory of the bubble when they are over 10 radii apart.32 InFig. 6b we compare the velocity of the centre of mass for twoselected cases from Fig. 6a.
On comparing the point of film rupture across water, silicone oiland ethanol in Fig. 4–6 it is observed that film rupture occursconsistently just after the moment the velocity of the centre of massof the bubble reaches a local maximum whereas the number ofbounces before rupture depends on the bubble size and approachvelocity. It is not clear at this stage, if this is always the case. Perhapsexperimental data could further confirm if this is generally true or amere coincidence. The authors have no explanation why this shouldbe the case from a theoretical point of view.
After showing that the model provides very good agreementfor bubble collision and bounce results in different liquids and atdifferent bubble sizes, we now use the model to predict featuresthat were not yet measured experimentally. In Fig. 7 we show thefilm thickness h(r,t) at the maximum pool surface deformationduring consecutive impacts using the same parameters as inFig. 4a for a bubble with R = 0.74 mm rising in water. When thebubble impacts the surface a pressure builds up and inverts thecurvature of the film thickness in the interaction region so that adimple forms. As a consequence, the minimum thickness hm(t) isno longer at the centre, r = 0, but at some larger radial position asshown in Fig. 7. The times corresponding to letters A, B, C and Dwill also be indicated in Fig. 8a.
Surface deformation, forces and minimum film thicknesshm(t) and central film thickness h0(t) as defined in Fig. 7 as a
Fig. 6 Comparison between theory (lines) and experiment (symbols)from Sunol et al.6 for bubbles in ethanol. (a) Position of the centre ofmass of the bubble relative to the originally flat free surface. Note thatthe curve for R = 0.21 mm has been shifted to the right for the figure notto be too cluttered. (b) Velocity of the centre of mass of bubbles withdifferent radii rising in ethanol and impacting with a deformable air–ethanol surface. The arrows indicate the time when film rupture isobserved experimentally.
Fig. 7 Film thickness at the maximum deformation of each bounceduring multiple impacts of a bubble in water with R = 0.74 mm. Forsubsequent bounces the deformation becomes less pronounced. Thecentral h0 and minimum hm film thicknesses are also defined.
Paper Soft Matter
Publ
ishe
d on
18
Febr
uary
201
6. D
ownl
oade
d by
The
Uni
vers
ity o
f M
elbo
urne
Lib
rari
es o
n 23
/07/
2016
01:
45:4
5.
View Article Online
This journal is©The Royal Society of Chemistry 2016 Soft Matter, 2016, 12, 3271--3282 | 3279
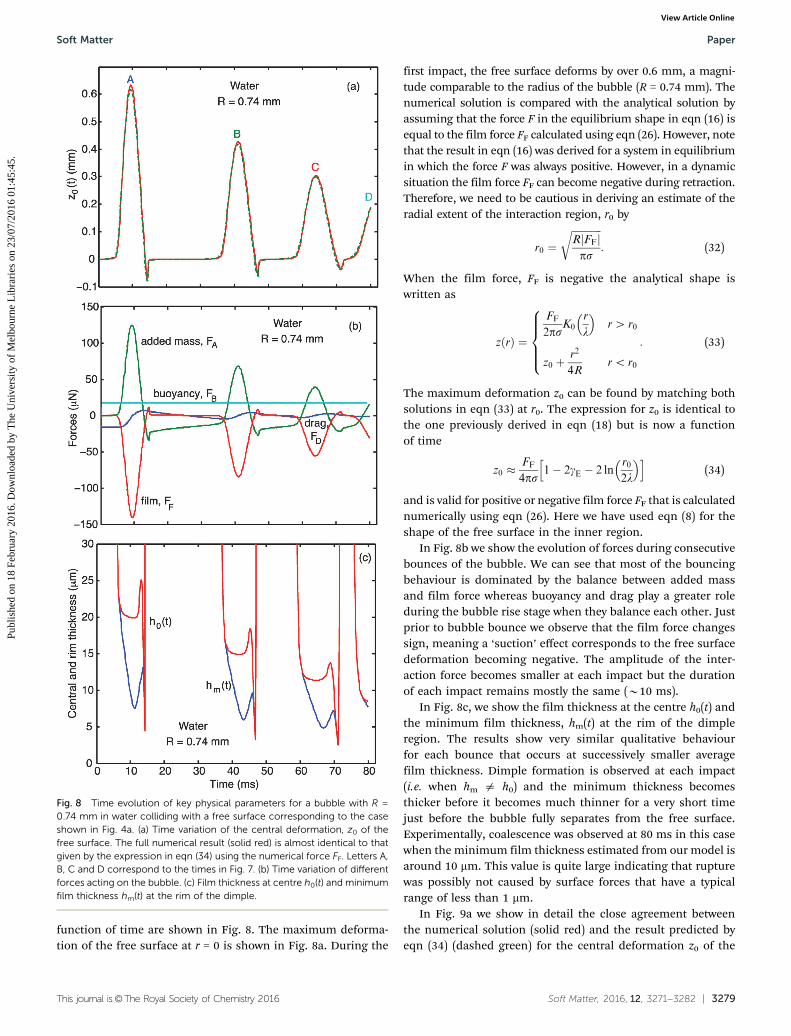
function of time are shown in Fig. 8. The maximum deforma-tion of the free surface at r = 0 is shown in Fig. 8a. During the
first impact, the free surface deforms by over 0.6 mm, a magni-tude comparable to the radius of the bubble (R = 0.74 mm). Thenumerical solution is compared with the analytical solution byassuming that the force F in the equilibrium shape in eqn (16) isequal to the film force FF calculated using eqn (26). However, notethat the result in eqn (16) was derived for a system in equilibriumin which the force F was always positive. However, in a dynamicsituation the film force FF can become negative during retraction.Therefore, we need to be cautious in deriving an estimate of theradial extent of the interaction region, r0 by
r0 ¼ffiffiffiffiffiffiffiffiffiffiffiffiR FFj jps
r: (32)
When the film force, FF is negative the analytical shape iswritten as
zðrÞ ¼
FF
2psK0
r
l
� �r4 r0
z0 þr2
4Rro r0
8>>><>>>:
: (33)
The maximum deformation z0 can be found by matching bothsolutions in eqn (33) at r0. The expression for z0 is identical tothe one previously derived in eqn (18) but is now a functionof time
z0 �FF
4ps1� 2gE � 2 ln
r0
2l
� �h i(34)
and is valid for positive or negative film force FF that is calculatednumerically using eqn (26). Here we have used eqn (8) for theshape of the free surface in the inner region.
In Fig. 8b we show the evolution of forces during consecutivebounces of the bubble. We can see that most of the bouncingbehaviour is dominated by the balance between added massand film force whereas buoyancy and drag play a greater roleduring the bubble rise stage when they balance each other. Justprior to bubble bounce we observe that the film force changessign, meaning a ‘suction’ effect corresponds to the free surfacedeformation becoming negative. The amplitude of the inter-action force becomes smaller at each impact but the durationof each impact remains mostly the same (B10 ms).
In Fig. 8c, we show the film thickness at the centre h0(t) andthe minimum film thickness, hm(t) at the rim of the dimpleregion. The results show very similar qualitative behaviourfor each bounce that occurs at successively smaller averagefilm thickness. Dimple formation is observed at each impact(i.e. when hm a h0) and the minimum thickness becomesthicker before it becomes much thinner for a very short timejust before the bubble fully separates from the free surface.Experimentally, coalescence was observed at 80 ms in this casewhen the minimum film thickness estimated from our model isaround 10 mm. This value is quite large indicating that rupturewas possibly not caused by surface forces that have a typicalrange of less than 1 mm.
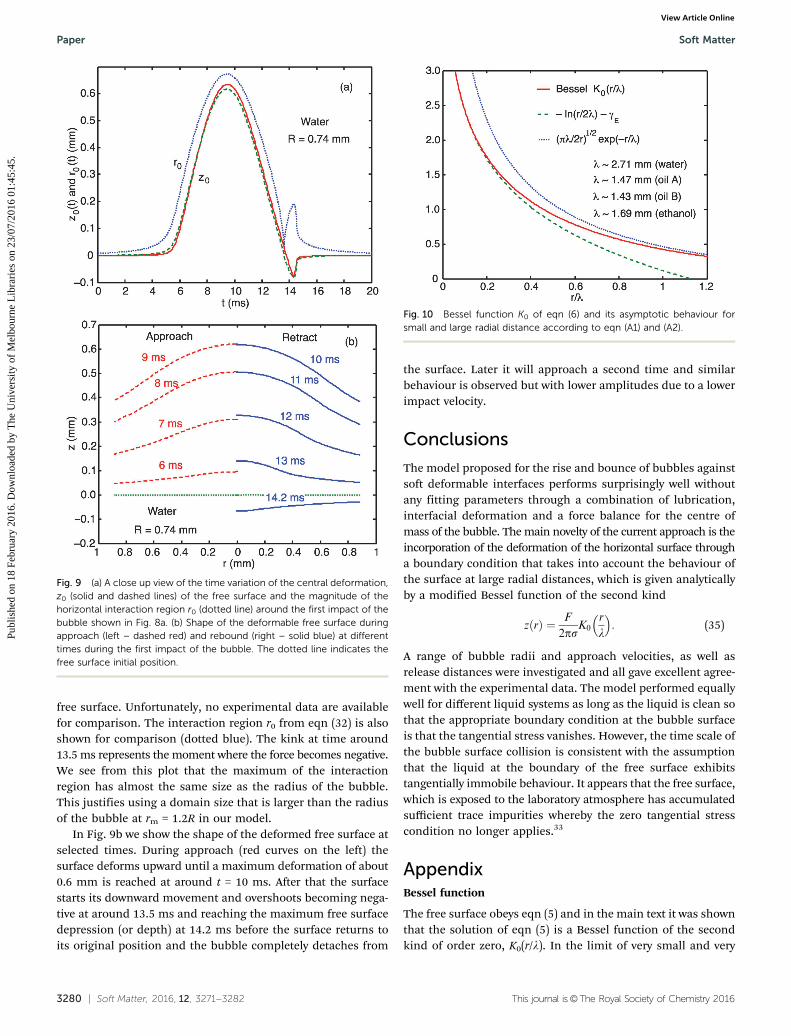
In Fig. 9a we show in detail the close agreement betweenthe numerical solution (solid red) and the result predicted byeqn (34) (dashed green) for the central deformation z0 of the
Fig. 8 Time evolution of key physical parameters for a bubble with R =0.74 mm in water colliding with a free surface corresponding to the caseshown in Fig. 4a. (a) Time variation of the central deformation, z0 of thefree surface. The full numerical result (solid red) is almost identical to thatgiven by the expression in eqn (34) using the numerical force FF. Letters A,B, C and D correspond to the times in Fig. 7. (b) Time variation of differentforces acting on the bubble. (c) Film thickness at centre h0(t) and minimumfilm thickness hm(t) at the rim of the dimple.
Soft Matter Paper
Publ
ishe
d on
18
Febr
uary
201
6. D
ownl
oade
d by
The
Uni
vers
ity o
f M
elbo
urne
Lib
rari
es o
n 23
/07/
2016
01:
45:4
5.
View Article Online
3280 | Soft Matter, 2016, 12, 3271--3282 This journal is©The Royal Society of Chemistry 2016
free surface. Unfortunately, no experimental data are availablefor comparison. The interaction region r0 from eqn (32) is alsoshown for comparison (dotted blue). The kink at time around13.5 ms represents the moment where the force becomes negative.We see from this plot that the maximum of the interactionregion has almost the same size as the radius of the bubble.This justifies using a domain size that is larger than the radiusof the bubble at rm = 1.2R in our model.
In Fig. 9b we show the shape of the deformed free surface atselected times. During approach (red curves on the left) thesurface deforms upward until a maximum deformation of about0.6 mm is reached at around t = 10 ms. After that the surfacestarts its downward movement and overshoots becoming nega-tive at around 13.5 ms and reaching the maximum free surfacedepression (or depth) at 14.2 ms before the surface returns toits original position and the bubble completely detaches from
the surface. Later it will approach a second time and similarbehaviour is observed but with lower amplitudes due to a lowerimpact velocity.
Conclusions
The model proposed for the rise and bounce of bubbles againstsoft deformable interfaces performs surprisingly well withoutany fitting parameters through a combination of lubrication,interfacial deformation and a force balance for the centre ofmass of the bubble. The main novelty of the current approach is theincorporation of the deformation of the horizontal surface througha boundary condition that takes into account the behaviour ofthe surface at large radial distances, which is given analyticallyby a modified Bessel function of the second kind
zðrÞ ¼ F
2psK0
r
l
� �: (35)
A range of bubble radii and approach velocities, as well asrelease distances were investigated and all gave excellent agree-ment with the experimental data. The model performed equallywell for different liquid systems as long as the liquid is clean sothat the appropriate boundary condition at the bubble surfaceis that the tangential stress vanishes. However, the time scale ofthe bubble surface collision is consistent with the assumptionthat the liquid at the boundary of the free surface exhibitstangentially immobile behaviour. It appears that the free surface,which is exposed to the laboratory atmosphere has accumulatedsufficient trace impurities whereby the zero tangential stresscondition no longer applies.33
AppendixBessel function
The free surface obeys eqn (5) and in the main text it was shownthat the solution of eqn (5) is a Bessel function of the secondkind of order zero, K0(r/l). In the limit of very small and very
Fig. 9 (a) A close up view of the time variation of the central deformation,z0 (solid and dashed lines) of the free surface and the magnitude of thehorizontal interaction region r0 (dotted line) around the first impact of thebubble shown in Fig. 8a. (b) Shape of the deformable free surface duringapproach (left – dashed red) and rebound (right – solid blue) at differenttimes during the first impact of the bubble. The dotted line indicates thefree surface initial position.
Fig. 10 Bessel function K0 of eqn (6) and its asymptotic behaviour forsmall and large radial distance according to eqn (A1) and (A2).
Paper Soft Matter
Publ
ishe
d on
18
Febr
uary
201
6. D
ownl
oade
d by
The
Uni
vers
ity o
f M
elbo
urne
Lib
rari
es o
n 23
/07/
2016
01:
45:4
5.
View Article Online
This journal is©The Royal Society of Chemistry 2016 Soft Matter, 2016, 12, 3271--3282 | 3281
large r/l, K0 can be approximated by a logarithmic and anexponential function respectively. When r { l
K0r
l
� �� � ln
r
2l
� �� gE
h i(A1)
where the Euler constant gE = 0.57721566. On the other hand,when r c l
K0r
l
� ��
ffiffiffiffiffiffipl2r
re�r=l (A2)
The function K0 and its asymptotic forms in eqn (A1) and (A2)are shown in Fig. 10. This justifies using the logarithmicapproximation in the inner region for the theory.
Vertical-to-horizontal aspect ratio vs. Weber number
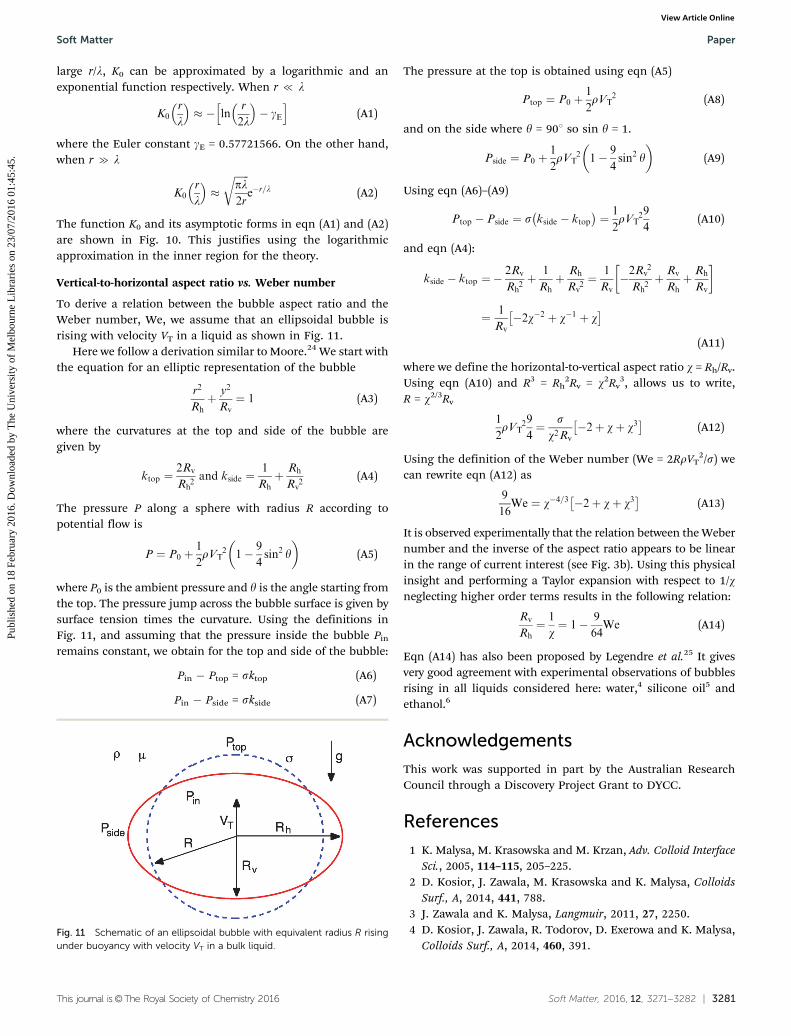
To derive a relation between the bubble aspect ratio and theWeber number, We, we assume that an ellipsoidal bubble isrising with velocity VT in a liquid as shown in Fig. 11.
Here we follow a derivation similar to Moore.24 We start withthe equation for an elliptic representation of the bubble
r2
Rhþ y2
Rv¼ 1 (A3)
where the curvatures at the top and side of the bubble aregiven by
ktop ¼2Rv
Rh2and kside ¼
1
Rhþ Rh
Rv2
(A4)
The pressure P along a sphere with radius R according topotential flow is
P ¼ P0 þ1
2rVT
2 1� 9
4sin2 y
� �(A5)
where P0 is the ambient pressure and y is the angle starting fromthe top. The pressure jump across the bubble surface is given bysurface tension times the curvature. Using the definitions inFig. 11, and assuming that the pressure inside the bubble Pin
remains constant, we obtain for the top and side of the bubble:
Pin � Ptop = sktop (A6)
Pin � Pside = skside (A7)
The pressure at the top is obtained using eqn (A5)
Ptop ¼ P0 þ1
2rVT
2 (A8)
and on the side where y = 901 so sin y = 1.
Pside ¼ P0 þ1
2rVT
2 1� 9
4sin2 y
� �(A9)
Using eqn (A6)–(A9)
Ptop � Pside ¼ s kside � ktop� �
¼ 1
2rVT
29
4(A10)
and eqn (A4):
kside � ktop ¼�2Rv
Rh2þ 1
Rhþ Rh
Rv2¼ 1
Rv�2Rv
2
Rh2þ Rv
Rhþ Rh
Rv
¼ 1
Rv�2w�2 þ w�1 þ w� �
(A11)
where we define the horizontal-to-vertical aspect ratio w = Rh/Rv.Using eqn (A10) and R3 = Rh
2Rv = w2Rv3, allows us to write,
R = w2/3Rv
1
2rVT
29
4¼ s
w2Rv�2þ wþ w3� �
(A12)
Using the definition of the Weber number (We = 2RrVT2/s) we
can rewrite eqn (A12) as
9
16We ¼ w�4=3 �2þ wþ w3
� �(A13)
It is observed experimentally that the relation between the Webernumber and the inverse of the aspect ratio appears to be linearin the range of current interest (see Fig. 3b). Using this physicalinsight and performing a Taylor expansion with respect to 1/wneglecting higher order terms results in the following relation:
Rv
Rh¼ 1
w¼ 1� 9
64We (A14)
Eqn (A14) has also been proposed by Legendre et al.25 It givesvery good agreement with experimental observations of bubblesrising in all liquids considered here: water,4 silicone oil5 andethanol.6
Acknowledgements
This work was supported in part by the Australian ResearchCouncil through a Discovery Project Grant to DYCC.
References
1 K. Malysa, M. Krasowska and M. Krzan, Adv. Colloid InterfaceSci., 2005, 114–115, 205–225.
2 D. Kosior, J. Zawala, M. Krasowska and K. Malysa, ColloidsSurf., A, 2014, 441, 788.
3 J. Zawala and K. Malysa, Langmuir, 2011, 27, 2250.4 D. Kosior, J. Zawala, R. Todorov, D. Exerowa and K. Malysa,
Colloids Surf., A, 2014, 460, 391.Fig. 11 Schematic of an ellipsoidal bubble with equivalent radius R risingunder buoyancy with velocity VT in a bulk liquid.
Soft Matter Paper
Publ
ishe
d on
18
Febr
uary
201
6. D
ownl
oade
d by
The
Uni
vers
ity o
f M
elbo
urne
Lib
rari
es o
n 23
/07/
2016
01:
45:4
5.
View Article Online

3282 | Soft Matter, 2016, 12, 3271--3282 This journal is©The Royal Society of Chemistry 2016
5 J. Zawala, S. Dorbolo, D. Terwagne, N. Vandewalle andK. Malysa, Soft Matter, 2011, 7, 6719.
6 F. Sunol and R. Gonzalez-Cinca, Colloids Surf., A, 2010, 365, 36.7 J. Feng, M. Roche, D. Vigolo, L. N. Arnaudov, S. D. Stoyanov,
T. D. Gurkov, G. G. Tsutsumanova and H. A. Stone, Nat.Phys., 2014, 10, 606.
8 P. S. Stewart, J. Feng, L. S. Kimpton, I. M. Griffiths andH. A. Stone, J. Fluid Mech., 2015, 777, 27.
9 J. C. Bird, R. de Ruiter, L. Courbin and H. A. Stone, Nature,2010, 465, 759.
10 H.-K. Tsao and D. L. Koch, Phys. Fluids, 1997, 9, 44.11 M. Fujasova-Zednıkova, L. Vobecka and J. Vejrazka, Can.
J. Chem. Eng., 2010, 88, 473.12 R. Manica, E. Klaseboer and D. Y. C. Chan, Langmuir, 2015,
31, 6763.13 E. Klaseboer, J.-Ph. Chevaillier, A. Mate, O. Masbernat and
C. Gourdon, Phys. Fluids, 2001, 13, 45.14 E. Klaseboer, R. Manica, M. H. W. Hendrix, C.-D. Ohl and
D. Y. C. Chan, Phys. Fluids, 2014, 26, 092101.15 A. Albadawi, D. B. Donoghue, A. J. Robinson, D. B. Murray
and Y. M. C. Delaure, Int. J. Multiphase Flow, 2014, 65, 82.16 D. Y. C. Chan, E. Klaseboer and R. Manica, Soft Matter, 2011,
7, 2235.17 D. Y. C. Chan, E. Klaseboer and R. Manica, Adv. Colloid
Interface Sci., 2011, 165, 70.
18 R. Manica, M. H. W. Hendrix, R. Gupta, E. Klaseboer,C.-D. Ohl and D. Y. C. Chan, Soft Matter, 2013, 9, 9755.
19 R. Manica, M. H. W. Hendrix, R. Gupta, E. Klaseboer,C.-D. Ohl and D. Y. C. Chan, Appl. Math. Model., 2014,38, 4249.
20 M. H. W. Hendrix, R. Manica, E. Klaseboer, D. Y. C. Chanand C.-D. Ohl, Phys. Rev. Lett., 2012, 108, 247803.
21 P. C. Duineveld, J. Fluid Mech., 1995, 292, 325.22 F. Raymond and J.-M. Rosant, Chem. Eng. Sci., 2000, 55, 943.23 M. Wu and M. Gharib, Phys. Fluids, 2002, 14, 49.24 D. W. Moore, J. Fluid Mech., 1965, 23, 749.25 D. Legendre, R. Zenit and J. R. Velez-Cordero, Phys. Fluids,
2012, 24, 043303.26 J. Magnaudet and I. Eames, Annu. Rev. Fluid Mech., 2000,
32, 659.27 G. Mougin and J. Magnaudet, Phys. Rev. Lett., 2002, 88, 014502.28 R. Zenit and J. Magnaudet, Phys. Fluids, 2008, 20, 061702.29 A. K. Chesters and G. Hofman, Appl. Sci. Res., 1982, 38, 353.30 M. Abramowitz and I. A. Stegun, Handbook of Mathematical
Functions, 1972.31 T. Miloh, J. Eng. Math., 1977, 11, 349.32 R. Manica, L. Parkinson, J. Ralston and D. Y. C. Chan,
J. Phys. Chem. C, 2010, 114, 1942.33 G. H. Kelsall, S. Tang, A. L. Smith and S. Yurdakul, Faraday
Trans., 1996, 92, 3879.
Paper Soft Matter
Publ
ishe
d on
18
Febr
uary
201
6. D
ownl
oade
d by
The
Uni
vers
ity o
f M
elbo
urne
Lib
rari
es o
n 23
/07/
2016
01:
45:4
5.
View Article Online


![Studio Air Algorithmic Sketch Book [Unimelb Yr3Sem1]](https://img.pdfslide.net/doc/110x75/579056f81a28ab900c9b6d4c/studio-air-algorithmic-sketch-book-unimelb-yr3sem1.jpg)