Embed Size (px)
Citation preview
The IMPaCT InvesTIng landsCaPe In laTIn aMerICa
October 2018
TRENDS 2016 & 2017
22
aspen network of development entrepreneurs (ande)
The aspen network of development entrepreneurs (ande) is a global
network of 290+ organizations that propel entrepreneurship in emerging
markets. ANDE members provide critical fi nancial, educational, and
business support services to small and growing businesses (SGBs)
based on the conviction that SGBs will create jobs, stimulate long-term
economic growth, and produce environmental and social benefi ts. Visit
www.andeglobal.org for more information.
lavCa - The association for Private Capital Investment in latin america
lavCa is the The association for Private Capital Investment in latin america,
a not-for-profi t membership organization dedicated to supporting the
growth of private capital in Latin America and the Caribbean. LAVCA’s
membership is comprised of over 190 fi rms, from leading global investment
fi rms active in the region and local fund managers to family o� ces, global
sovereign wealth funds, corporate investors, and international pension plans.
Member fi rms control assets in excess of US$65b, directed at capitalizing
and growing Latin American businesses. LAVCA’s mission – to spur regional
economic growth by advancing private capital investment – is accomplished
through programs of research, networking forums, education and advocacy
of sound public policy. Visit www.lavca.org for more information.
lead organizations & sponsors Producing a report of this breadth and depth
would not have been possible without the kind
support of the following organizations:
diamond sponsor
silver sponsors
research Partners
3
acknowledgements
We would like to thank the organizations that took the time
to submit data. Without their participation, this report would
not have been possible.
We would also like to recognize the vital contribution of
the research advisory committee, which gave invaluable
feedback and suggestions at all stages of the project, made
up of the following individuals:
Beto scretas, ICE-Instituto de Cidadania Empresarial
daniel Izzo, VOX Capital
erik Wallsten, Adobe Capital
Fernando campos de oliveira, Fundação Grupo Boticário
Fréderic de mariz, UBS
humberto matsuda, Performa Investimentos
Julian vargas, Fundacion IES
rodolfo dieck, Promotora Social Mexico
Special thanks to Genevieve Edens, ANDE’s former Director
of Research & Impact, for your support in defining the scope
of the study and designing the questionnaire, and to Marquis
Williams, formerly of the ANDE Brazil Chapter.
research Team
lead researchers
abigayle davidson, ANDE
rebeca rocha, ANDE
natalia valencia, LAVCA
eduardo roman, LAVCA
survey desIgn and data collectIon
rob Parkinson, ANDE
lina rossi, ANDE
rodolfo sagahon, ANDE
victoria hume, ANDE
assIstant researchers
3
Ta
bl
e o
f C
on
Te
nT
s1 IntroductIon 05. . . . . . . . . . . . . . . . . . . . . . . . . . .
2 Key FIndIngs 08. . . . . . . . . . . . . . . . . . . . . . . . . . . . . . . .
2.1 Key data for 2016 and 2017 09. . . . . . . . . .
2.2 Prospects for the coming years 10. . .
5conclusIons & recommendatIons 32. . . . . . . . . . . . . . . . . .
6 PartIcIPatIng Investors 35. . . . . . . .
Sources of capitalFund structure
13
14
181819
4 data analysIs
4.2 Fundraising
4.1 Overview of Investors
. . . . . . . . . . . . . . . . . . . . . . . . . . . . . .
. . . . . . . . . . . . . . . . . . . . . . . . . . . . . . . . . .
. . . . . . . . . . . . . . . . . .
. . . . . . . . . . . . . . . . . . . . . . .
. . . . . . . . . . . . . . . . . . . . . . . . . . . .
25. . . . . . . . . . . . . . . . . . . . . . . . . . . . . . . . . . .
30
26
284.5 Impact Measurement
4.4 Exits
4.6 Challenges & Expectations . . . . . . . . . . . . . . . . . . . . . . . . .
. . . . . . . . . . . . . . . . . . . . . . . . . . . . . . . . .
. . . . . . . . . . . . . . . . . . . . . . . . . . . . . . . . . . . . . . . . . . . . . . . . . . . . . . . . . . .
Investments by countryInvestments by sectorInvestments by business stage and ticket size
202124
4.3 Capital Deployed. . . . . . . . . . . . . . . . . . . . . . . . . . . . . .
. . . . . . . . . . . . . . . . . . . . . . . . . . . . . . . .
. . . . . . . . . . . . . . . . . . . . . . . . . . . . . . . . . . . . . . .
3 methodology 11. . . . . . . . . . . . . . . . . . . . . . . . . . . .
InTroduCTIon
1
6
Introduction
We are excited to share with you the 2018 edition of The Impact
Investing Landscape in Latin America, the second time that ANDE
and LAVCA have joined forces to produce a comprehensive report
on the state of impact investing across Latin America.
In the two years since the publication of the previous edition,
much has changed both in impact investing globally and in private
equity and venture capital in the Latin American region. Recent
research suggests that the global market for impact investing has
continued to expand and mature, with increases in the value of
assets under management, number of deals, and total amount
invested each year.i
After two years of contraction, total GDP for the Latin America
& Caribbean region returned to growth in 2017, but only
by a modest 0.9%ii. The regional headline fi gure also masks
signifi cant diff erences between countries. While this challenging
macroeconomic environment, in addition to currency volatility,
has infl uenced fundraising for private equity and venture capital
(PE/VC) funds in Latin America, international investors are still
investing in the region. The VC industry in particular has continued
to mature, with the emergence of unicorn companies in the region
and some bright spots in the IT sector.
The need and opportunity for impact investing in Latin America
remains clear; eight of the world’s 20 countries with highest
income inequality are from the regioniii. Public health expenditure
as a proportion of GDP is less than half of the OECD averageiv.
Rapid and unplanned urbanization has created chronic challenges
in terms of connectivity, mobility, access to housing, and sanitation
and waste management, among othersv. Countries in the region
must tackle these and other development challenges while
protecting some of the most important and biologically diverse
ecosystems on the planet.
Given the importance of having reliable data, and in light of the
changes outlined above, ANDE and LAVCA have joined forces
again in 2018 with the aim of providing an updated picture of the
scope and evolution of the market. This new report provides data
on impact investors active in the region, on impact investment
activity during 2016 and 2017, and on investors’ expectations for
2018 and 2019.
Introduction
7
Randall Kempner
executive director
ANDE
Cate Ambrose
President and executive director
LAVCA
We are pleased to see that Latin American investors continue to play
a leading role in driving the industry forward in the region. We also
see increased interest and involvement from individual investors,
foundations, family offi ces, traditional PE/VC fund managers and
institutional investors as cause for optimism. We anticipate that
impact investing will continue to grow in the region and are excited
to be able to follow its progress, as more and more fi nancial capital
is leveraged to help solve the region’s most pressing development
challenges.
Sincerely,
7
8
2.1 Key data for 2016 and 2017
2.2 Prospects for the coming years
Key fIndIngs
2
9
2.1 Key data for 2016 and 2017
Key findings
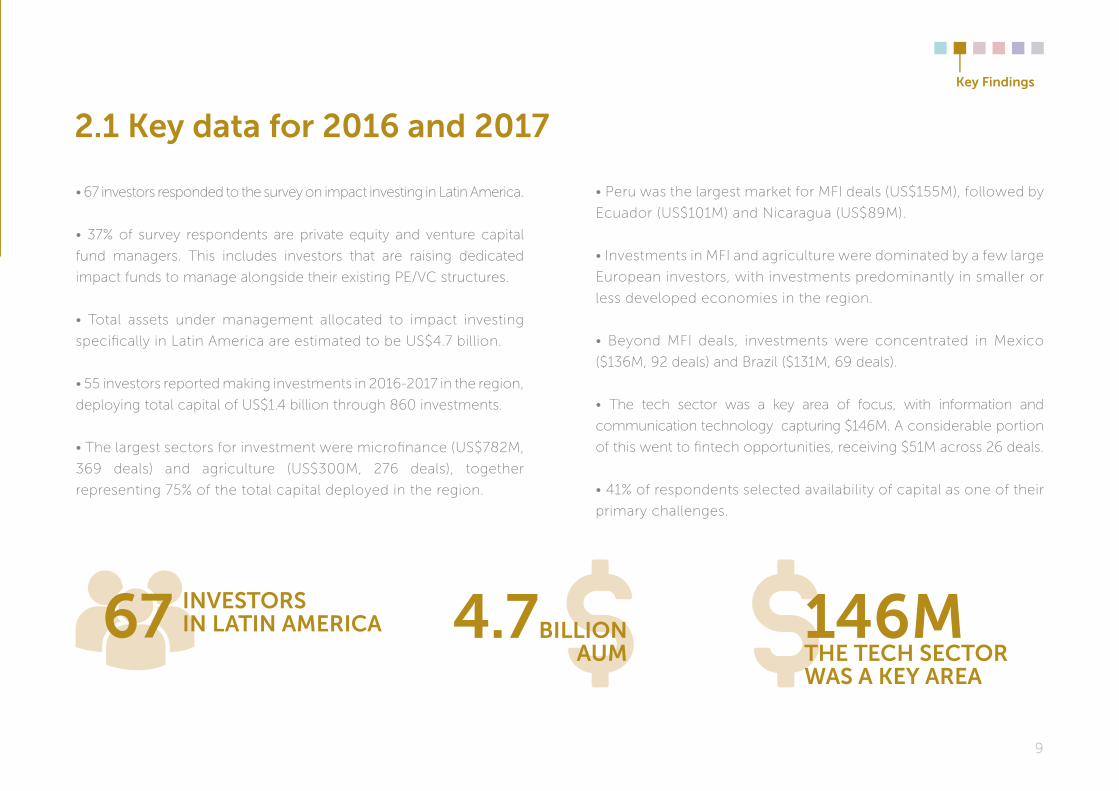
• 67 investors responded to the survey on impact investing in Latin America.
• 37% of survey respondents are private equity and venture capital
fund managers. This includes investors that are raising dedicated
impact funds to manage alongside their existing PE/VC structures.
• Total assets under management allocated to impact investing
specifi cally in Latin America are estimated to be US$4.7 billion.
• 55 investors reported making investments in 2016-2017 in the region,
deploying total capital of US$1.4 billion through 860 investments.
• The largest sectors for investment were microfi nance (US$782M,
369 deals) and agriculture (US$300M, 276 deals), together
representing 75% of the total capital deployed in the region.
• Peru was the largest market for MFI deals (US$155M), followed by
Ecuador (US$101M) and Nicaragua (US$89M).
• Investments in MFI and agriculture were dominated by a few large
European investors, with investments predominantly in smaller or
less developed economies in the region.
• Beyond MFI deals, investments were concentrated in Mexico
($136M, 92 deals) and Brazil ($131M, 69 deals).
• The tech sector was a key area of focus, with information and
communication technology capturing $146M. A considerable portion
of this went to fi ntech opportunities, receiving $51M across 26 deals.
• 41% of respondents selected availability of capital as one of their
primary challenges.
67 InvesTorsIn laTIn aMerICa 4.7bIllIon
auM146MThe TeCh seCTor Was a Key area
10
2.2 Prospects for the coming years
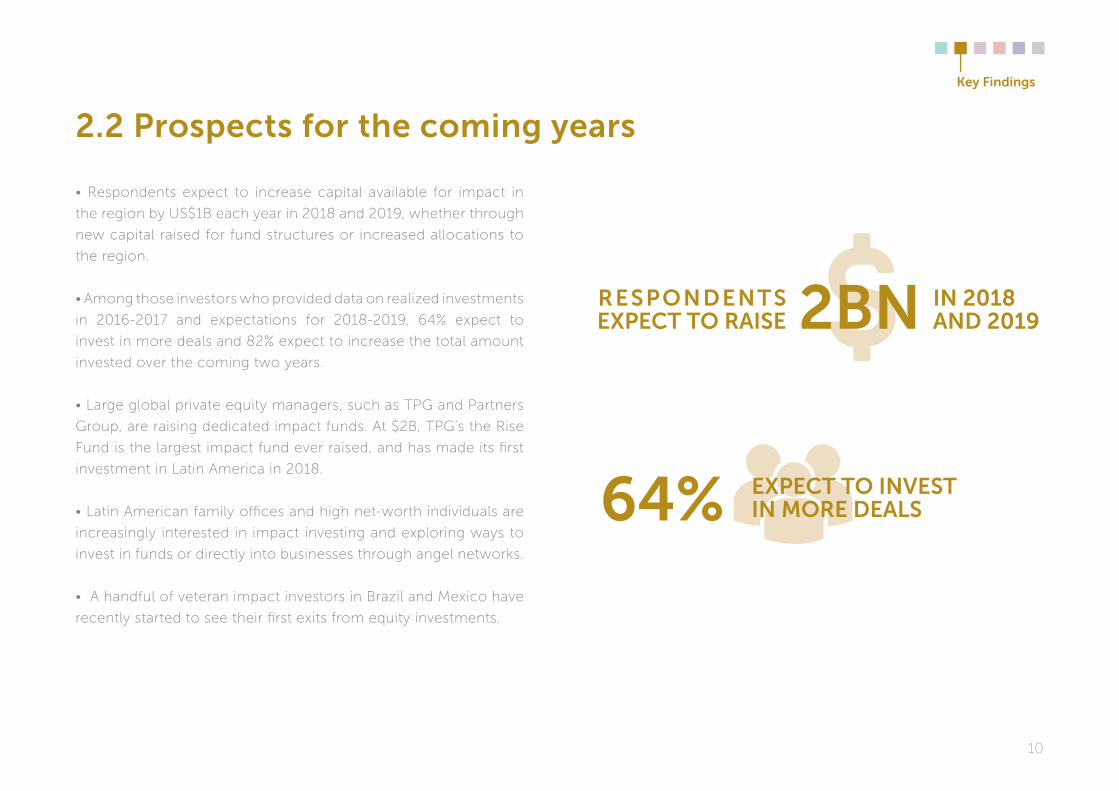
• Respondents expect to increase capital available for impact in
the region by US$1B each year in 2018 and 2019, whether through
new capital raised for fund structures or increased allocations to
the region.
• Among those investors who provided data on realized investments
in 2016-2017 and expectations for 2018-2019, 64% expect to
invest in more deals and 82% expect to increase the total amount
invested over the coming two years.
• Large global private equity managers, such as TPG and Partners
Group, are raising dedicated impact funds. At $2B, TPG’s the Rise
Fund is the largest impact fund ever raised, and has made its fi rst
investment in Latin America in 2018.
• Latin American family offi ces and high net-worth individuals are
increasingly interested in impact investing and exploring ways to
invest in funds or directly into businesses through angel networks.
• A handful of veteran impact investors in Brazil and Mexico have
recently started to see their fi rst exits from equity investments.
64% eXPeCT To InvesT In More deals
Key findings
2bn resPondenTs eXPeCT To raIse
In 2018and 2019
3
MeThodology
12
The data used in this study was collected through a survey,
designed by ANDE and LAVCA and distributed by LAVCA, between
February and May 2018. The survey targeted impact investors
active in Latin America1, including investors based in the region
and global investors. The survey focused on general investing
practices, as well as transactions that took place specifi cally in
2016 and 2017.
for the purposes of this report, impact investors are defined as
those who:
• Make direct investments in companies and/or projects.
• Have positive social or environmental impact as an explicit objective.
• Have an expectation of a financial return.
• Invest using any instrument, including debt, equity, quasi-equity, guarantees, or other.
The criteria applied in this report deliberately exclude certain
investments, narrowing the focus on specific segments of
the impact investing industry. Project finance such as green
bonds and direct investments made by Development Finance
Institutions (DFIs) were excluded from this study. DFIs play a
critical role in impact investing in the region, primarily through
investments into funds, but the relatively large size of their
direct deals would make it difficult to understand the segments
that are the focus of this report.2
The investors who participated in the survey are nonetheless
diverse, and include PE/VC fund managers, family offi ces,
foundations, and non-profi t organizations. While microfi nance
institutions (MFIs) themselves are excluded from the sample, fund
managers who invest in MFIs are included.
In addition to the full sample data, we analyzed a subsample
of 28 investors who provided investment data for both 2014-
15 and 2016-17. Where used in this report, the subsample
analysis is clearly marked.
Methodology
Methodology
1. In our outreach to impact investors, we excluded the Caribbean as a primary area of focus. However a few survey respondents provided data on investments in the Dominican Republic and Haiti, which is included.
2. This defi nition matches the defi nition that was used in the 2016 study, with one change: the removal of the minimum investment amount (previously $25,000), so as to fully capture the diversity
of ticket sizes present in impact investing activity in the region (for data on this see section 9b).
d aTa a n a ly s I s
4
Sources of capitalFund structure
4.2 Fundraising
4.1 Overview of Investors 4.4 Exits
Investments by country
Investments by sector
Investments by business stage and ticket size
4.3 Capital Deployed
4.5 Impact Measurement
4.6 Challenges & Expectations
14
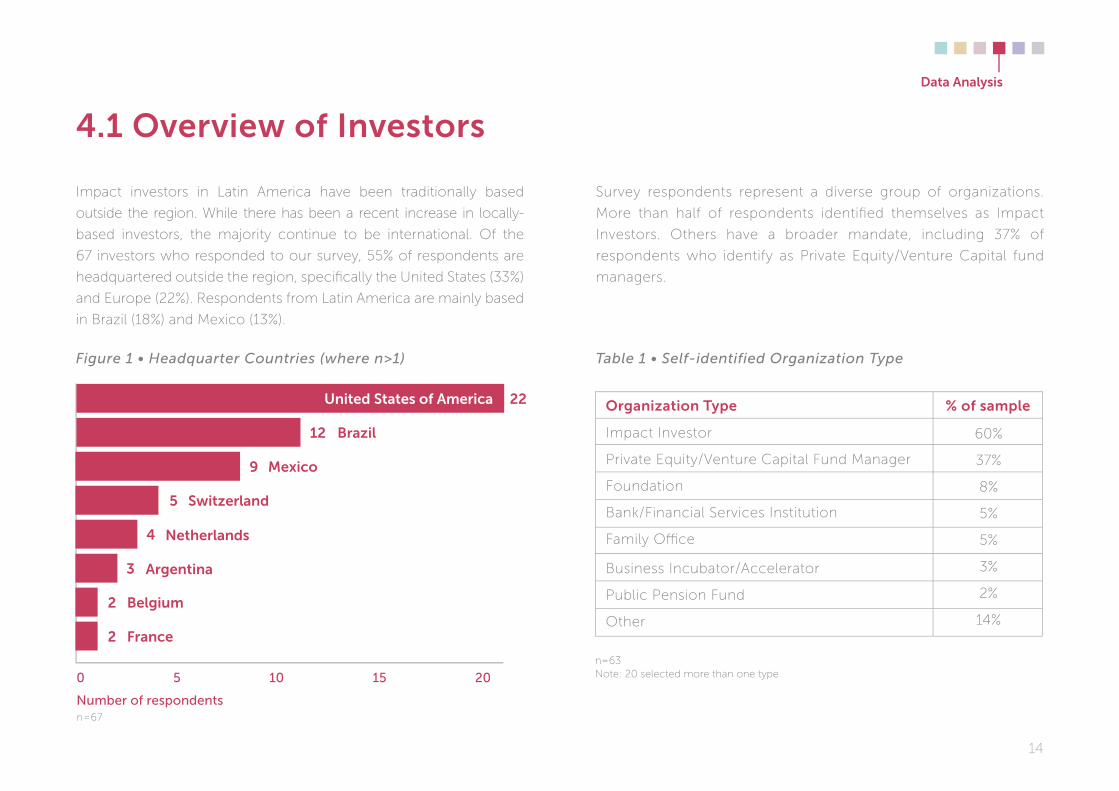
4.1 overview of Investors
Impact investors in Latin America have been traditionally based
outside the region. While there has been a recent increase in locally-
based investors, the majority continue to be international. Of the
67 investors who responded to our survey, 55% of respondents are
headquartered outside the region, specifi cally the United States (33%)
and Europe (22%). Respondents from Latin America are mainly based
in Brazil (18%) and Mexico (13%).
Survey respondents represent a diverse group of organizations.
More than half of respondents identifi ed themselves as Impact
Investors. Others have a broader mandate, including 37% of
respondents who identify as Private Equity/Venture Capital fund
managers.
0 5 10 15 20
Figure 1 • Headquarter Countries (where n>1) Table 1 • Self-identified Organization Type
france2
netherlands4
argentina3
belgium2
switzerland5
Mexico9
brazil12
united states of america 22
Impact Investor
Private Equity/Venture Capital Fund Manager
Foundation
Bank/Financial Services Institution
Family Offi ce
Business Incubator/Accelerator
Public Pension Fund
Other
organization Type % of sample
60%
37%
8%
5%
5%
3%
2%
14%
n=63Note: 20 selected more than one type
data analysis
number of respondentsn=67
15
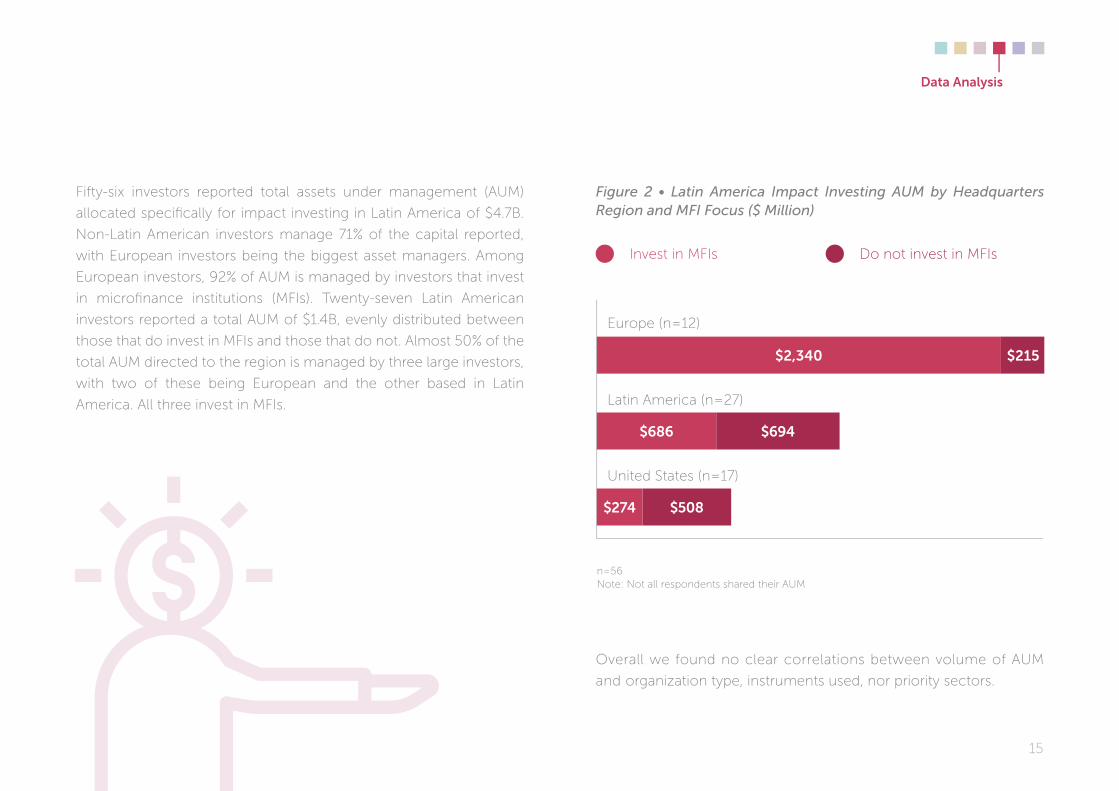
Fifty-six investors reported total assets under management (AUM)
allocated specifi cally for impact investing in Latin America of $4.7B.
Non-Latin American investors manage 71% of the capital reported,
with European investors being the biggest asset managers. Among
European investors, 92% of AUM is managed by investors that invest
in microfi nance institutions (MFIs). Twenty-seven Latin American
investors reported a total AUM of $1.4B, evenly distributed between
those that do invest in MFIs and those that do not. Almost 50% of the
total AUM directed to the region is managed by three large investors,
with two of these being European and the other based in Latin
America. All three invest in MFIs.
Figure 2 • Latin America Impact Investing AUM by Headquarters Region and MFI Focus ($ Million)
n=56 Note: Not all respondents shared their AUM
Do not invest in MFIsInvest in MFIs
Europe (n=12)
$2,340 $215
Latin America (n=27)
$686 $694
United States (n=17)
$508$274
Overall we found no clear correlations between volume of AUM
and organization type, instruments used, nor priority sectors.
data analysis
16
Investments in MfIs
Impact investors who focus on microfi nance institutions
(MFIs) manage more capital and invest with bigger ticket
sizes - including some deals larger than $100M - than
investors that do not focus on MFIs. The microfi nance
industry took off globally in the 1990s, long before the
terms impact investing and impact enterprises emerged,
and has since matured to the point that some large MFIs
have reached an IPO or have been acquired by large banks.
For this reason, in some parts of this report we have
separated the data for non-MFI investments, in looking at
both AUM and investment deals, allowing us to get a clearer
picture of what is happening in other sectors. While some
MFI investors are also open to investing in other sectors,
the MFI investors in this study focused close to 90% of
their capital deployed in 2016-2017 on microfi nance.
Microfi nance, as a mature sector within impact investing,
can serve as a reference point for the rest of the industry.
Investors can learn from its path to scale as an industry, the
possible backlash that can come after negative impacts are
revealed, and safeguards to protect both fi nancial returns
and strong social performance.
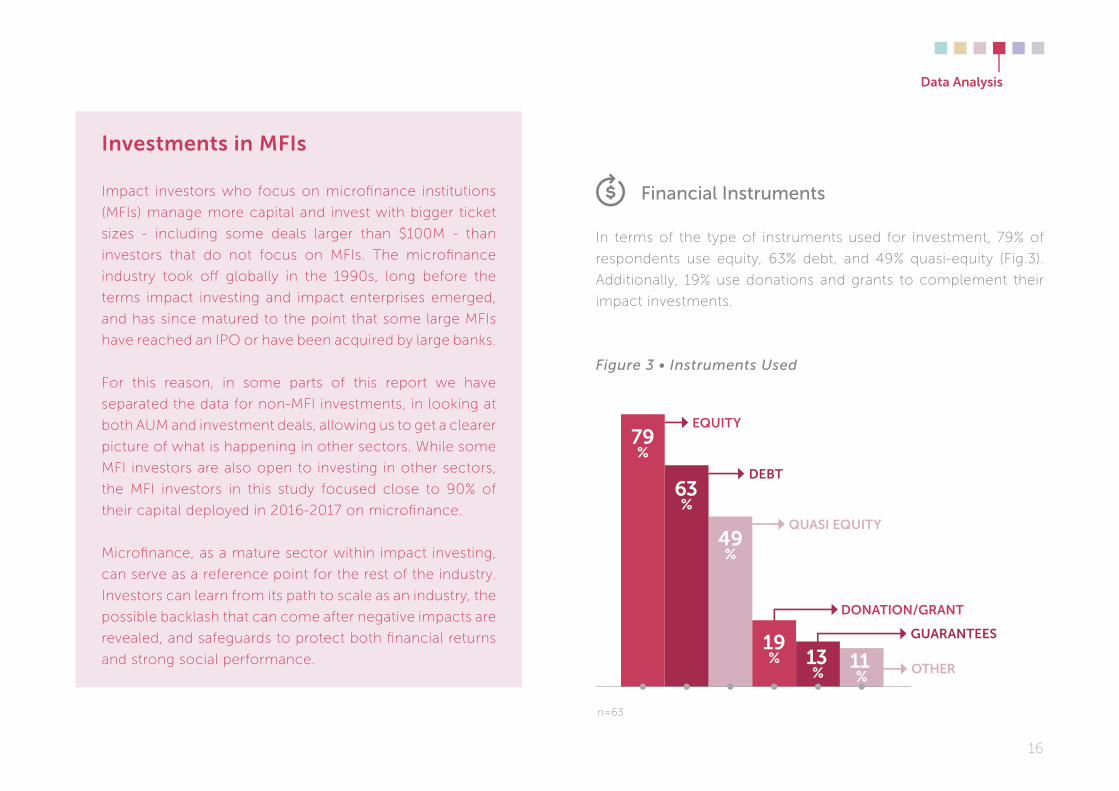
Financial Instruments
In terms of the type of instruments used for investment, 79% of
respondents use equity, 63% debt, and 49% quasi-equity (Fig.3).
Additionally, 19% use donations and grants to complement their
impact investments.
11%
oTher
79%
63%
49%
19%
eQuITy
QuasI eQuITy
guaranTees
debT
donaTIon/granT
13%
Figure 3 • Instruments Used
n=63
data analysis
17
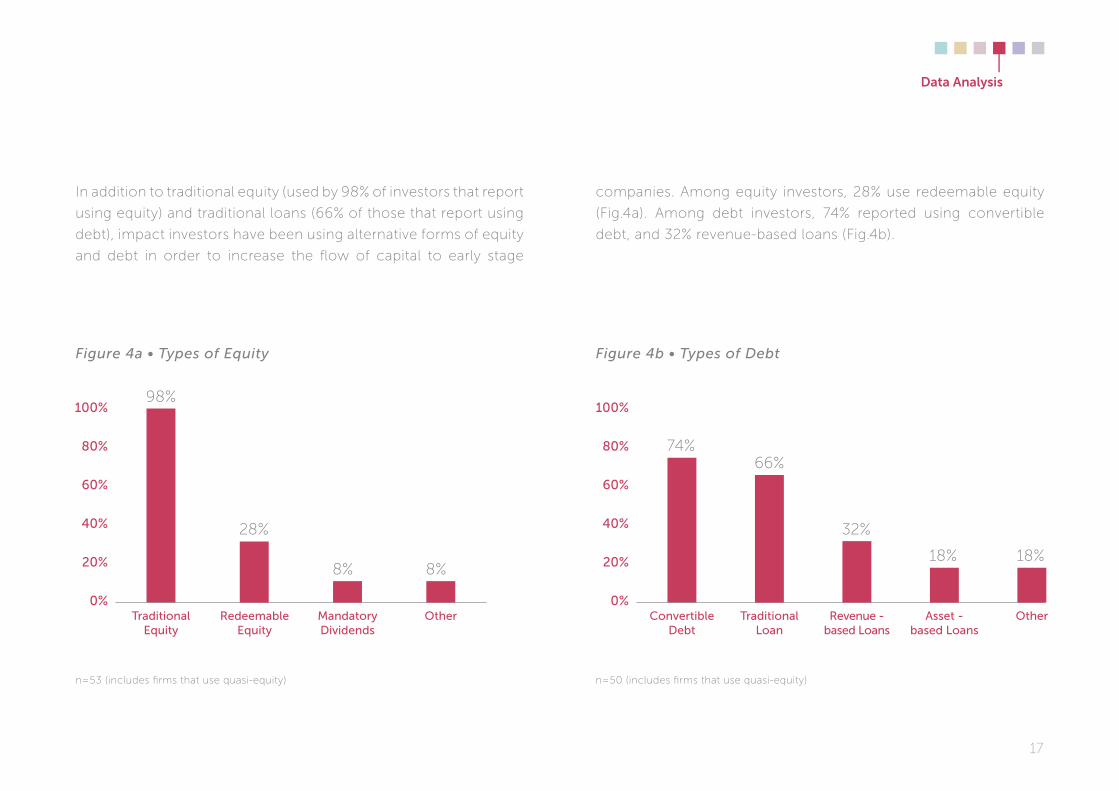
traditional equity
In addition to traditional equity (used by 98% of investors that report
using equity) and traditional loans (66% of those that report using
debt), impact investors have been using alternative forms of equity
and debt in order to increase the fl ow of capital to early stage
Figure 4a • Types of Equity
mandatorydividends
other0%
20%
80%
100%
60%
40%
redeemableequity
n=53 (includes fi rms that use quasi-equity) n=50 (includes fi rms that use quasi-equity)
98%
28%
8% 8%
Figure 4b • Types of Debt
convertibledebt
revenue -based loans
asset -based loans
other0%
20%
80%
100%
60%
40%
traditional loan
74%66%
32%
18% 18%
companies. Among equity investors, 28% use redeemable equity
(Fig.4a). Among debt investors, 74% reported using convertible
debt, and 32% revenue-based loans (Fig.4b).
data analysis
18
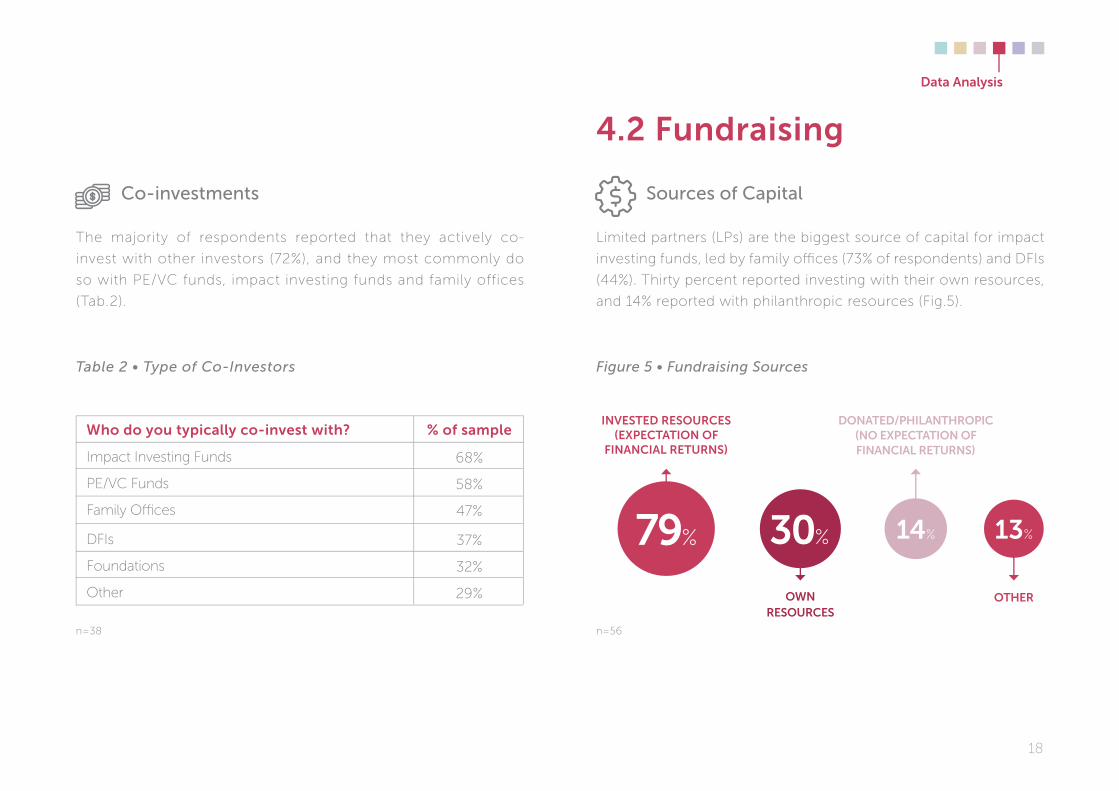
co-investments
The majority of respondents reported that they actively co-
invest with other investors (72%), and they most commonly do
so with PE/VC funds, impact investing funds and family offices
(Tab.2).
Table 2 • Type of Co-Investors
Impact Investing Funds
PE/VC Funds
Family Offi ces
DFIs
Foundations
Other
Who do you typically co-invest with? % of sample
68%
58%
47%
37%
32%
29%
n=38 n=56
sources of capital
Limited partners (LPs) are the biggest source of capital for impact
investing funds, led by family offi ces (73% of respondents) and DFIs
(44%). Thirty percent reported investing with their own resources,
and 14% reported with philanthropic resources (Fig.5).
4.2 fundraising
Figure 5 • Fundraising Sources
InvesTed resourCes (eXPeCTaTIon of
fInanCIal reTurns)
donaTed/PhIlanThroPIC(no eXPeCTaTIon of fInanCIal reTurns)
79%
oWnresourCes
30% 14%
oTher
13%
data analysis
19
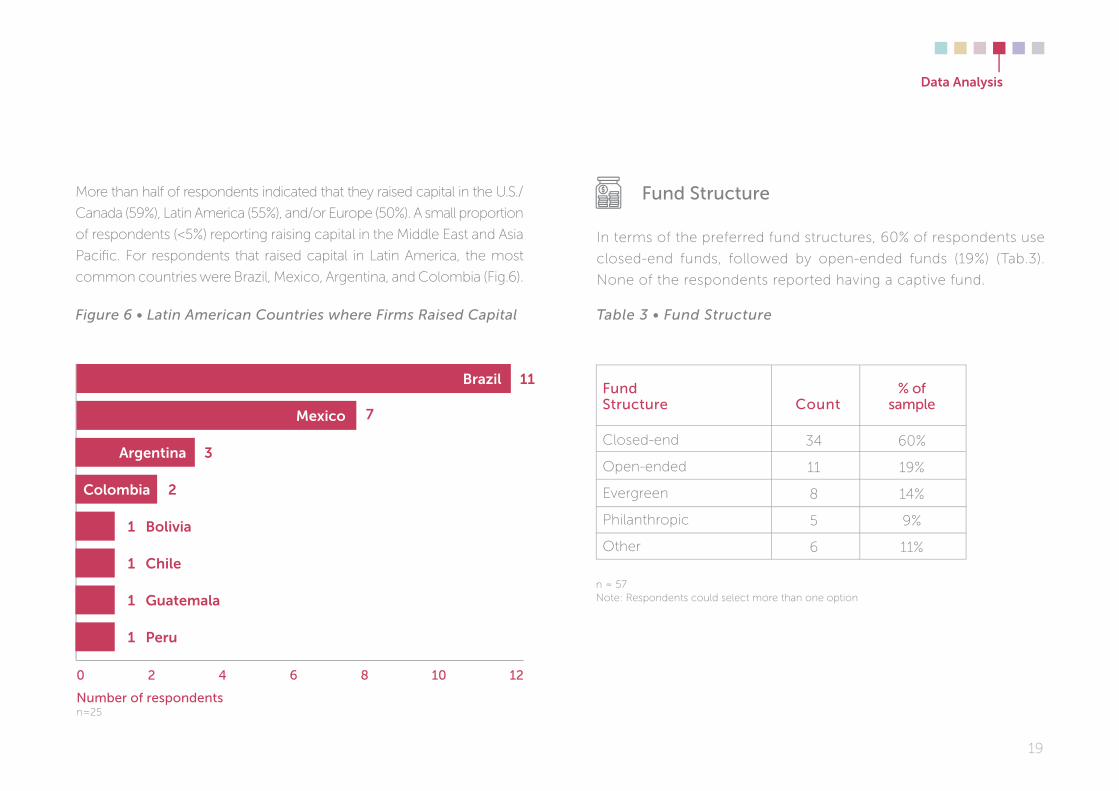
Table 3 • Fund Structure
Fund structure
In terms of the preferred fund structures, 60% of respondents use
closed-end funds, followed by open-ended funds (19%) (Tab.3).
None of the respondents reported having a captive fund.
Figure 6 • Latin American Countries where Firms Raised Capital
0 2 4 6 8 10 12
Colombia 2
argentina 3
Mexico 7
brazil 11
number of respondentsn=25
1 bolivia
1 Chile
1 guatemala
1 Peru
More than half of respondents indicated that they raised capital in the U.S./
Canada (59%), Latin America (55%), and/or Europe (50%). A small proportion
of respondents (<5%) reporting raising capital in the Middle East and Asia
Pacifi c. For respondents that raised capital in Latin America, the most
common countries were Brazil, Mexico, Argentina, and Colombia (Fig.6).
Closed-end
Open-ended
Evergreen
Philanthropic
Other
60%
19%
14%
9%
11%
34
11
8
5
6
% of samplecount
n = 57 Note: Respondents could select more than one option
Fund structure
data analysis
20
Table 4 •Deal Volume & Capital Deployed
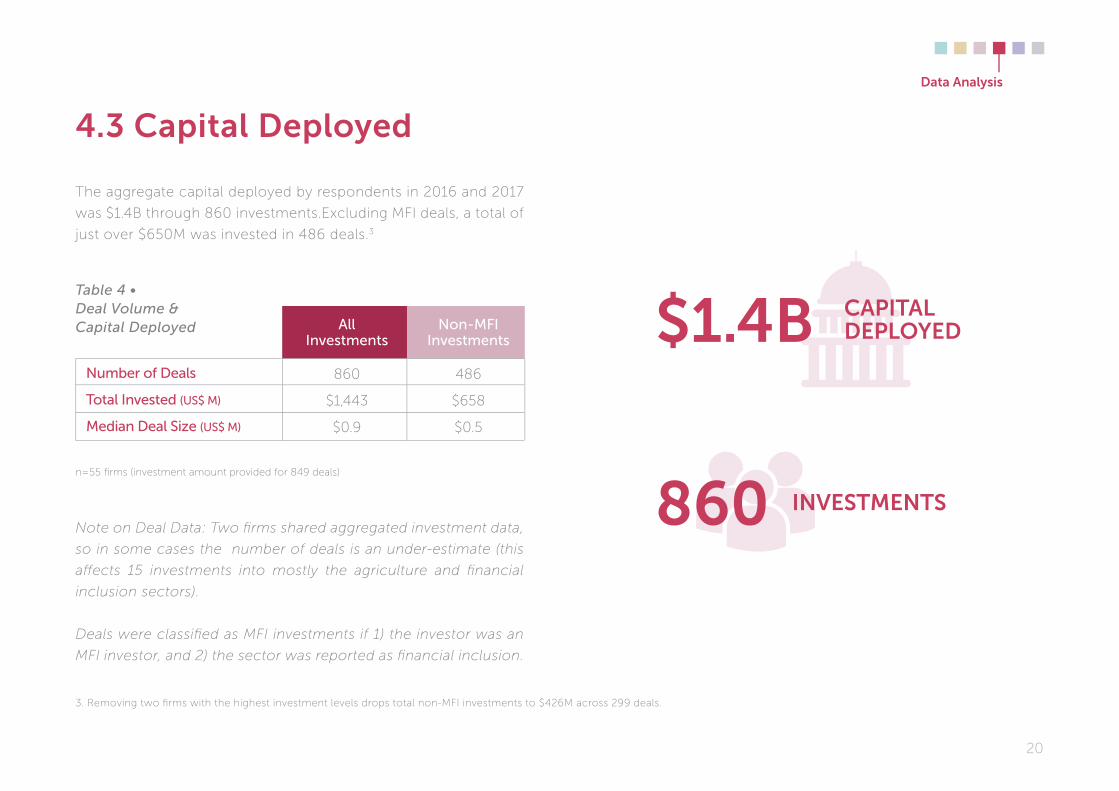
The aggregate capital deployed by respondents in 2016 and 2017
was $1.4B through 860 investments.Excluding MFI deals, a total of
just over $650M was invested in 486 deals.3
Note on Deal Data: Two fi rms shared aggregated investment data,
so in some cases the number of deals is an under-estimate (this
a� ects 15 investments into mostly the agriculture and fi nancial
inclusion sectors).
Deals were classifi ed as MFI investments if 1) the investor was an
MFI investor, and 2) the sector was reported as fi nancial inclusion.
n=55 fi rms (investment amount provided for 849 deals)
4.3 Capital deployed
$1.4b CaPITal dePloyed
InvesTMenTs860
all Investments
non-mFI Investments
number of deals
total Invested (us$ m)
median deal size (us$ m)
860
$1,443
$0.9
486
$658
$0.5
3. Removing two fi rms with the highest investment levels drops total non-MFI investments to $426M across 299 deals.
data analysis
21
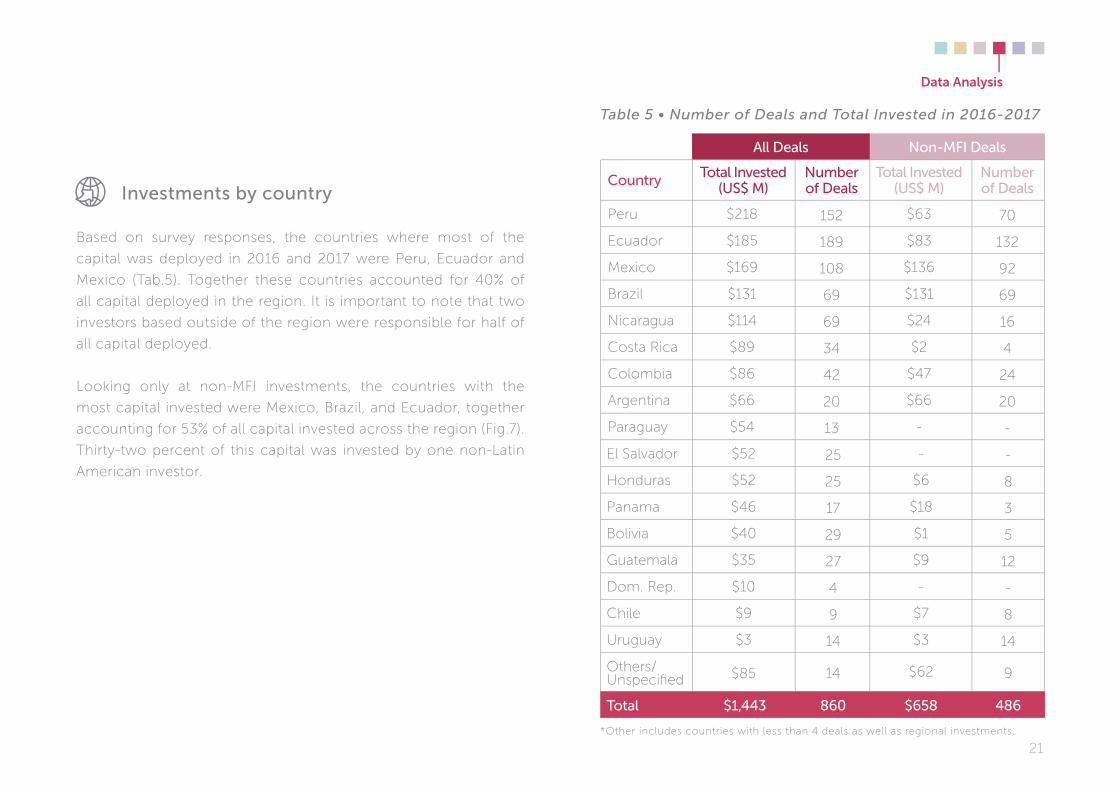
Investments by country
Based on survey responses, the countries where most of the
capital was deployed in 2016 and 2017 were Peru, Ecuador and
Mexico (Tab.5). Together these countries accounted for 40% of
all capital deployed in the region. It is important to note that two
investors based outside of the region were responsible for half of
all capital deployed.
Looking only at non-MFI investments, the countries with the
most capital invested were Mexico, Brazil, and Ecuador, together
accounting for 53% of all capital invested across the region (Fig.7).
Thirty-two percent of this capital was invested by one non-Latin
American investor.
*Other includes countries with less than 4 deals as well as regional investments.
Peru
Ecuador
Mexico
Brazil
Nicaragua
Costa Rica
Colombia
Argentina
Paraguay
$218
$185
$169
$131
$114
$89
$86
$66
$54
total Invested (us$ m)
$63
$83
$136
$131
$24
$2
$47
$66
-
total Invested(us$ m)country
152
189
108
69
69
34
42
20
13
number of deals
70
132
92
69
16
4
24
20
-
number of deals
all deals non-mFI deals
El Salvador
Honduras
Panama
Bolivia
Guatemala
Dom. Rep.
Chile
Uruguay
Others/Unspecifi ed
$52
$52
$46
$40
$35
$10
$9
$3
$85
-
$6
$18
$1
$9
-
$7
$3
$62
25
25
17
29
27
4
9
14
14
-
8
3
5
12
-
8
14
9
total $1,443 860 $658 486
Table 5 • Number of Deals and Total Invested in 2016-2017
data analysis
22
data analysis
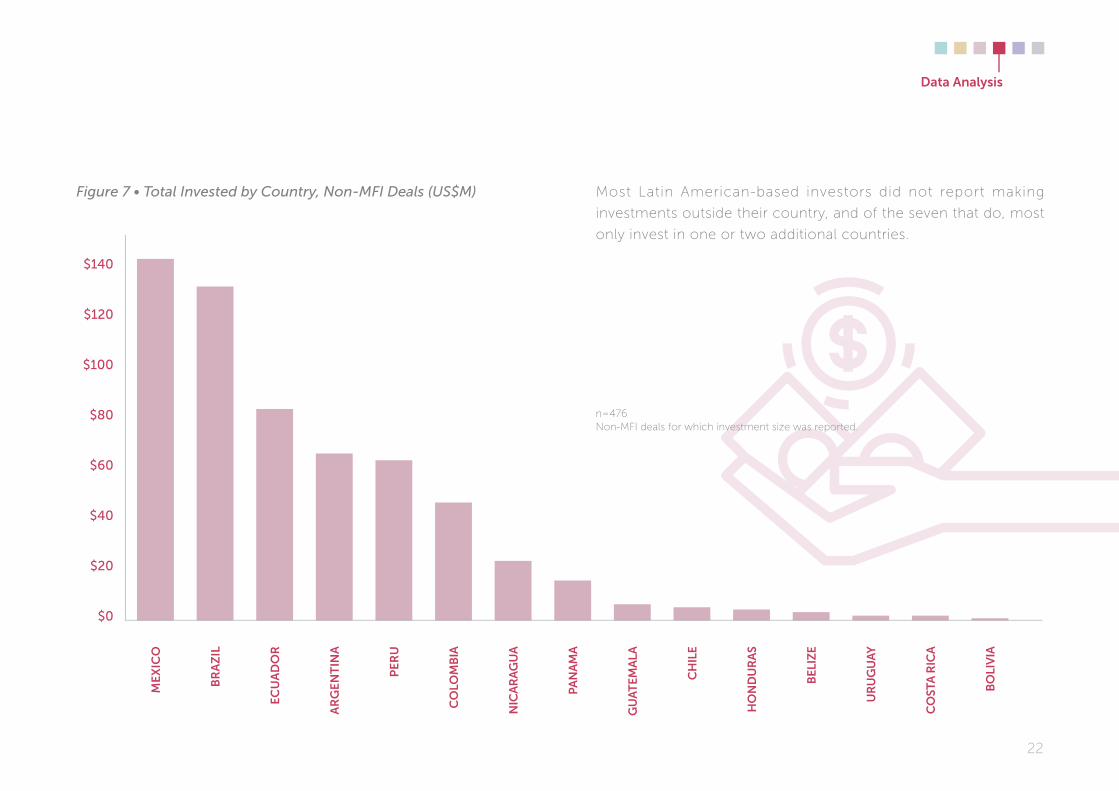
Figure 7 • Total Invested by Country, Non-MFI Deals (US$M)
$0
$20
$40
$60
$80
$100
$120
$140
Me
XIC
o
br
aZ
Il
eC
ua
do
r
ar
ge
nT
Ina
Pe
ru
Co
loM
bIa
nIC
ar
ag
ua
Pa
na
Ma
gu
aT
eMa
la
Ch
Ile
ho
nd
ur
as
bel
IZe
ur
ug
ua
y
Co
sTa
rIC
a
bo
lIv
Ia
Most Latin American-based investors did not report making
investments outside their country, and of the seven that do, most
only invest in one or two additional countries.
n=476Non-MFI deals for which investment size was reported.
23
data analysisdata analysis
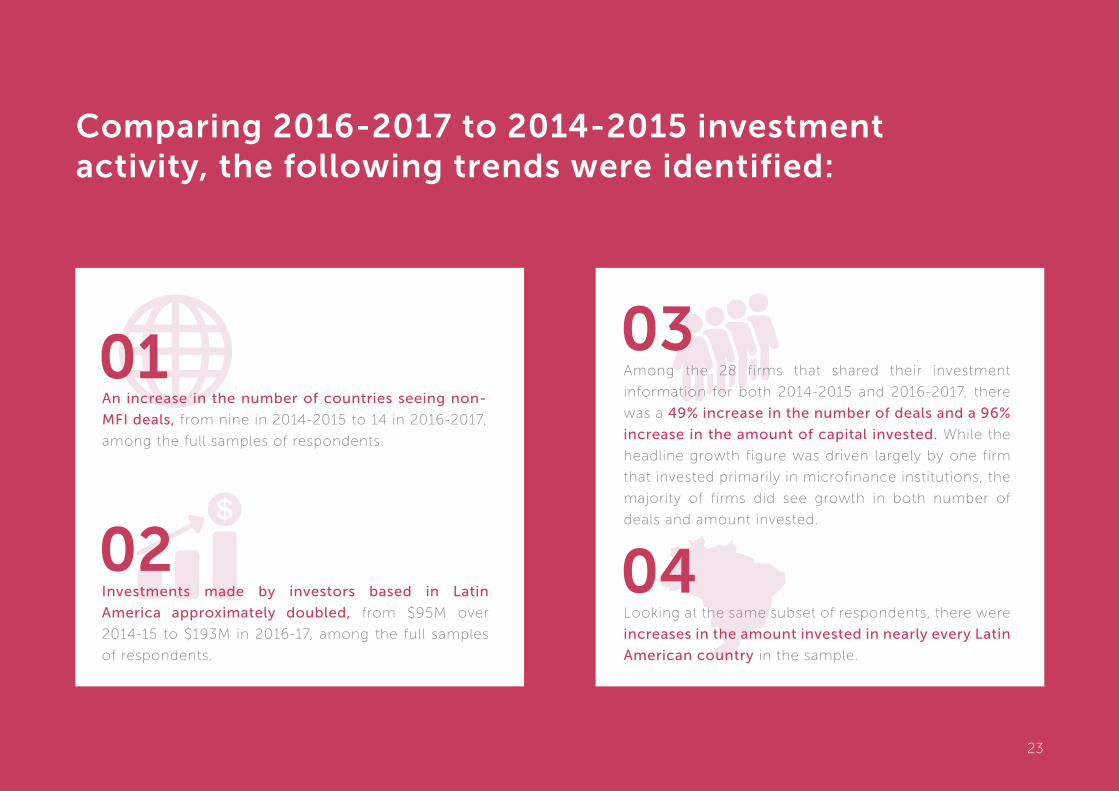
Comparing 2016-2017 to 2014-2015 investment activity, the following trends were identified:
an increase in the number of countries seeing non-
mFI deals, from nine in 2014-2015 to 14 in 2016-2017,
among the full samples of respondents.
01
02Investments made by investors based in latin
america approximately doubled, from $95M over
2014-15 to $193M in 2016-17, among the full samples
of respondents.
03Among the 28 firms that shared their investment
information for both 2014-2015 and 2016-2017, there
was a 49% increase in the number of deals and a 96%
increase in the amount of capital invested. While the
headline growth figure was driven largely by one firm
that invested primarily in microfinance institutions, the
majority of firms did see growth in both number of
deals and amount invested.
04Looking at the same subset of respondents, there were
increases in the amount invested in nearly every latin
american country in the sample.
23
24
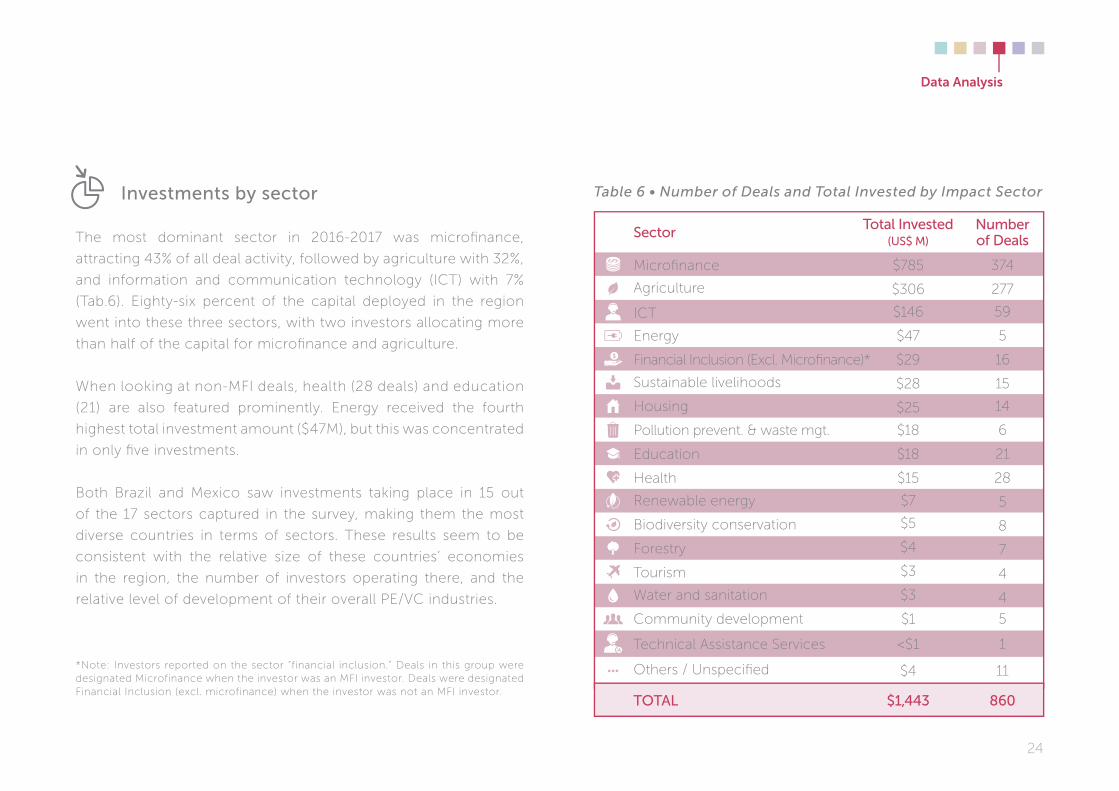
Investments by sector
The most dominant sector in 2016-2017 was microfi nance,
attracting 43% of all deal activity, followed by agriculture with 32%,
and information and communication technology (ICT) with 7%
(Tab.6). Eighty-six percent of the capital deployed in the region
went into these three sectors, with two investors allocating more
than half of the capital for microfi nance and agriculture.
When looking at non-MFI deals, health (28 deals) and education
(21) are also featured prominently. Energy received the fourth
highest total investment amount ($47M), but this was concentrated
in only fi ve investments.
Both Brazil and Mexico saw investments taking place in 15 out
of the 17 sectors captured in the survey, making them the most
diverse countries in terms of sectors. These results seem to be
consistent with the relative size of these countries’ economies
in the region, the number of investors operating there, and the
relative level of development of their overall PE/VC industries.
Table 6 • Number of Deals and Total Invested by Impact Sector
*Note: Investors reported on the sector “financial inclusion.” Deals in this group were designated Microfinance when the investor was an MFI investor. Deals were designated Financial Inclusion (excl. microfinance) when the investor was not an MFI investor.
$785
$306
$146
$47
$29
$28
$25
$18
$18
$15
$7
$5
$4
$3
$3
$1
<$1
$4
374
277
59
5
16
15
14
6
21
28
5
8
7
4
4
5
1
11
total Invested(us$ m)
numberof dealssector
$1,443 860total
Microfi nance
Agriculture
ICT
Energy
Financial Inclusion (Excl. Microfi nance)*
Sustainable livelihoods
Housing
Pollution prevent. & waste mgt.
Education
Health
Renewable energy
Biodiversity conservation
Forestry
Tourism
Water and sanitation
Community development
Technical Assistance Services
Others / Unspecifi ed
data analysis
25
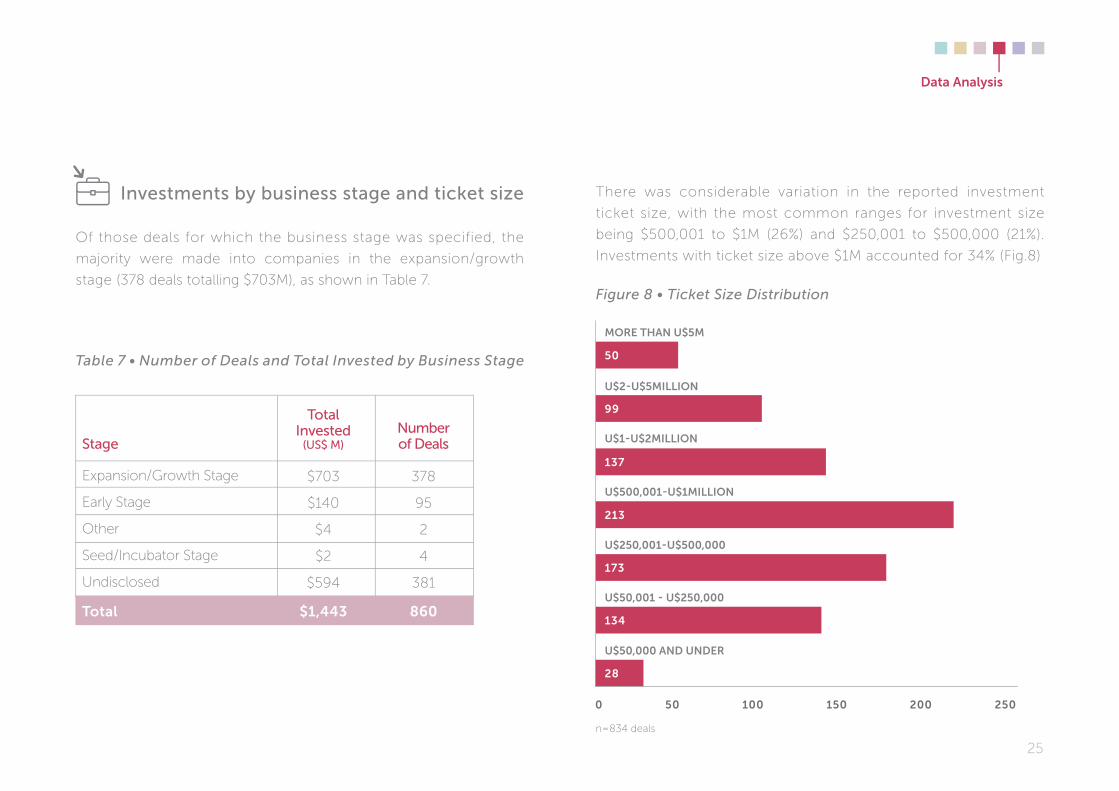
Figure 8 • Ticket Size Distribution
There was considerable variation in the reported investment
ticket size, with the most common ranges for investment size
being $500,001 to $1M (26%) and $250,001 to $500,000 (21%).
Investments with ticket size above $1M accounted for 34% (Fig.8)
More Than u$5M
u$500,001-u$1MIllIon
u$250,001-u$500,000
u$50,001 - u$250,000
u$50,000 and under
0
28
134
173
213
u$1-u$2MIllIon
137
u$2-u$5MIllIon
99
50
50 100 200 250150
Investments by business stage and ticket size
Of those deals for which the business stage was specified, the
majority were made into companies in the expansion/growth
stage (378 deals totalling $703M), as shown in Table 7.
Table 7 • Number of Deals and Total Invested by Business Stage
Expansion/Growth Stage
Early Stage
Other
Seed/Incubator Stage
Undisclosed
378
95
2
4
381
$703
$140
$4
$2
$594
number of dealsstage
total Invested
(us$ m)
Total $1,443 860
n=834 deals
data analysis
26
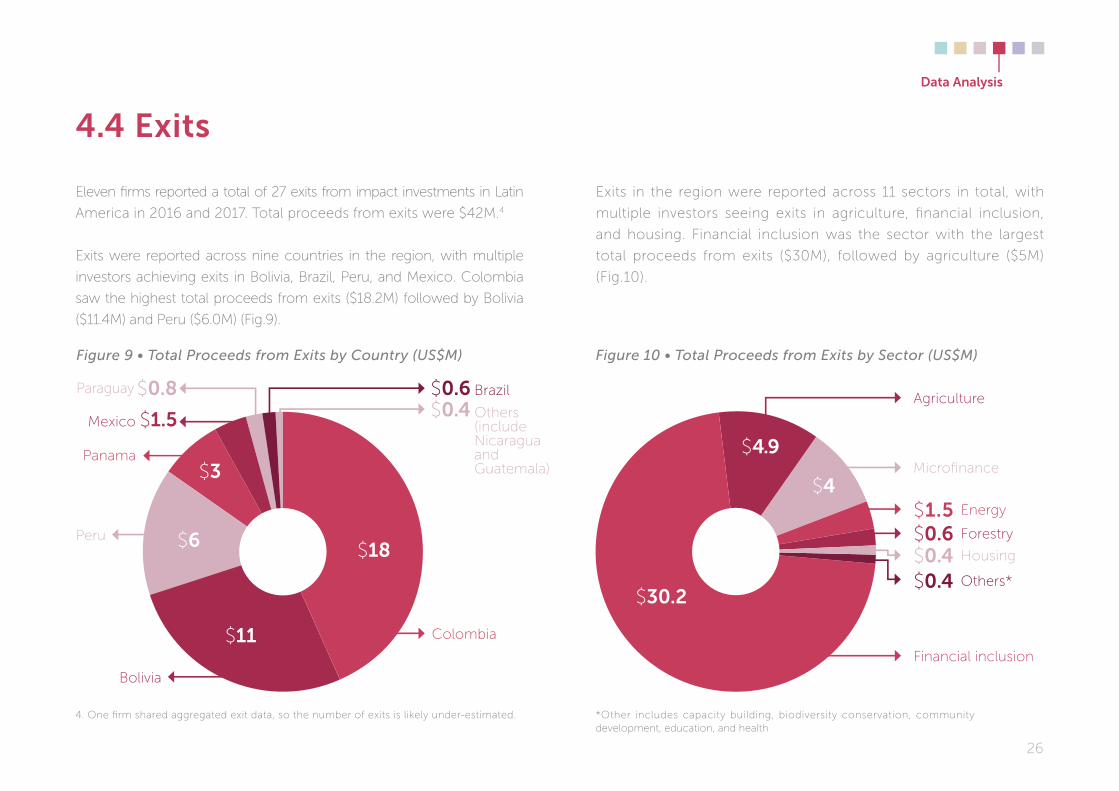
Eleven fi rms reported a total of 27 exits from impact investments in Latin
America in 2016 and 2017. Total proceeds from exits were $42M.4
Exits were reported across nine countries in the region, with multiple
investors achieving exits in Bolivia, Brazil, Peru, and Mexico. Colombia
saw the highest total proceeds from exits ($18.2M) followed by Bolivia
($11.4M) and Peru ($6.0M) (Fig.9).
Exits in the region were reported across 11 sectors in total, with
multiple investors seeing exits in agriculture, fi nancial inclusion,
and housing. Financial inclusion was the sector with the largest
total proceeds from exits ($30M), followed by agriculture ($5M)
(Fig.10).
4.4 exits
Peru
Colombia
Financial inclusion
Agriculture
Microfi nance
Energy
Forestry
Housing
Others*
Others(include Nicaragua and Guatemala)
Brazil
Bolivia
Panama
Mexico
Paraguay
$18
$30.2
$11
$3
$1.5
$0.8$0.4$0.6
$6
$4.9
$4
Figure 9 • Total Proceeds from Exits by Country (US$M)
$1.5$0.6$0.4$0.4
Figure 10 • Total Proceeds from Exits by Sector (US$M)
*Other includes capacity building, biodiversity conservation, community development, education, and health
4. One fi rm shared aggregated exit data, so the number of exits is likely under-estimated.
data analysis
27
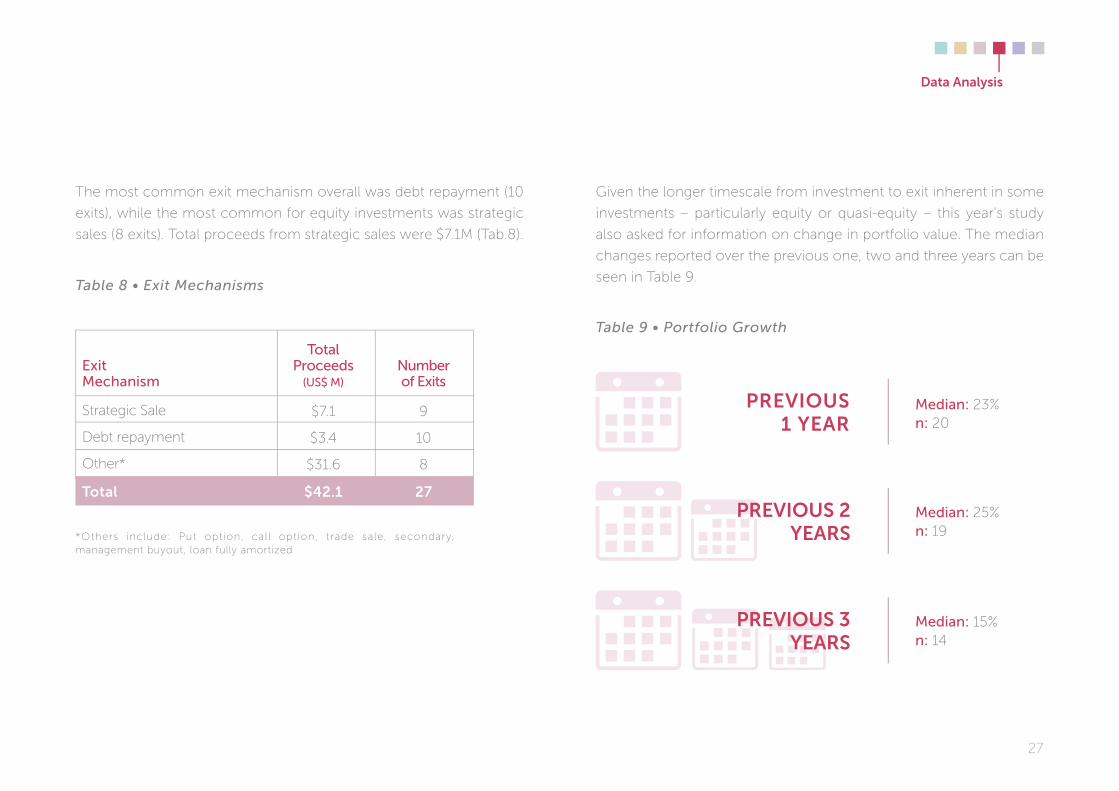
The most common exit mechanism overall was debt repayment (10
exits), while the most common for equity investments was strategic
sales (8 exits). Total proceeds from strategic sales were $7.1M (Tab.8).
Given the longer timescale from investment to exit inherent in some
investments – particularly equity or quasi-equity – this year’s study
also asked for information on change in portfolio value. The median
changes reported over the previous one, two and three years can be
seen in Table 9.Table 8 • Exit Mechanisms
Table 9 • Portfolio Growth
*Others include: Put option, call option, trade sale, secondary, management buyout, loan fully amortized
Strategic Sale
Debt repayment
Other*
9
10
8
$7.1
$3.4
$31.6
number of exits
exit mechanism
median: 23% n: 20
median: 25% n: 19
median: 15% n: 14
total Proceeds
(us$ m)
Total $42.1 27
PrevIous 1 year
PrevIous 2 years
PrevIous 3 years
data analysis
28
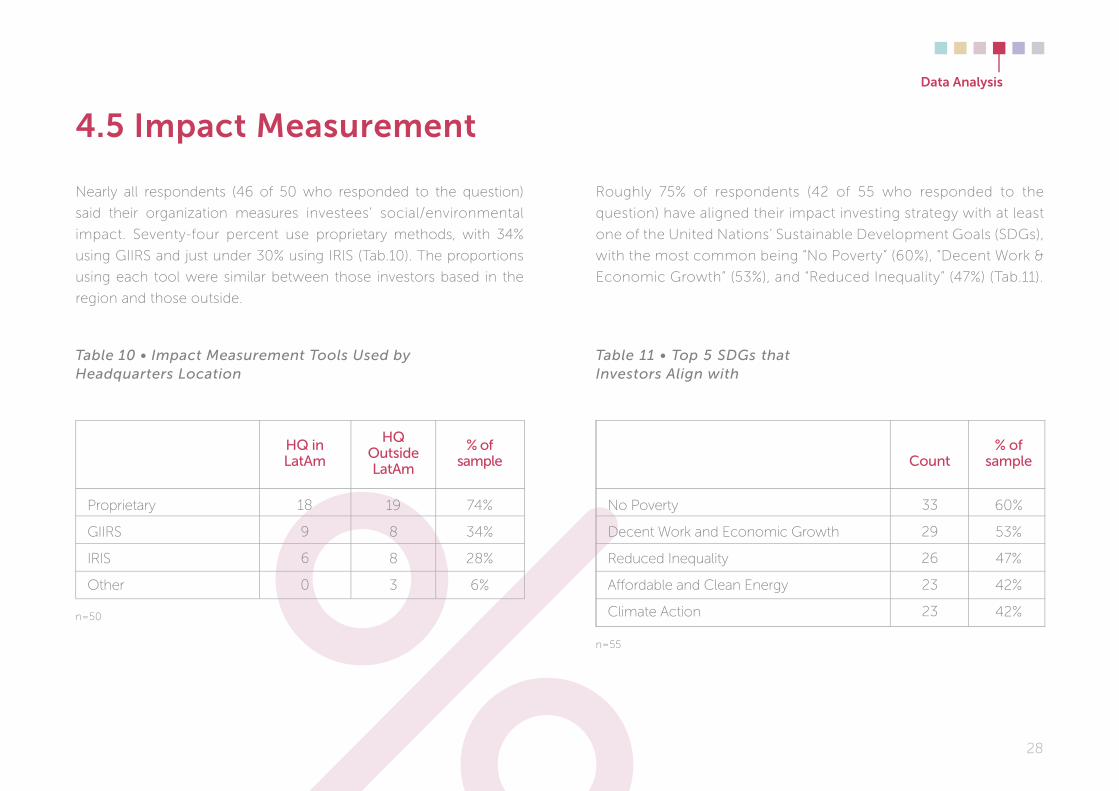
Nearly all respondents (46 of 50 who responded to the question)
said their organization measures investees’ social/environmental
impact. Seventy-four percent use proprietary methods, with 34%
using GIIRS and just under 30% using IRIS (Tab.10). The proportions
using each tool were similar between those investors based in the
region and those outside.
Roughly 75% of respondents (42 of 55 who responded to the
question) have aligned their impact investing strategy with at least
one of the United Nations’ Sustainable Development Goals (SDGs),
with the most common being “No Poverty” (60%), “Decent Work &
Economic Growth” (53%), and “Reduced Inequality” (47%) (Tab.11).
4.5 Impact Measurement
Table 10 • Impact Measurement Tools Used by Headquarters Location
Table 11 • Top 5 SDGs that Investors Align with
No Poverty
Decent Work and Economic Growth
Reduced Inequality
Aff ordable and Clean Energy
Climate Action
33
29
26
23
23
60%
53%
47%
42%
42%
count% of
sample
n=50
n=55
Proprietary
GIIRS
IRIS
Other
18
9
6
0
hQ in latam
19
8
8
3
hQ outside latam
74%
34%
28%
6%
% ofsample
data analysis
29
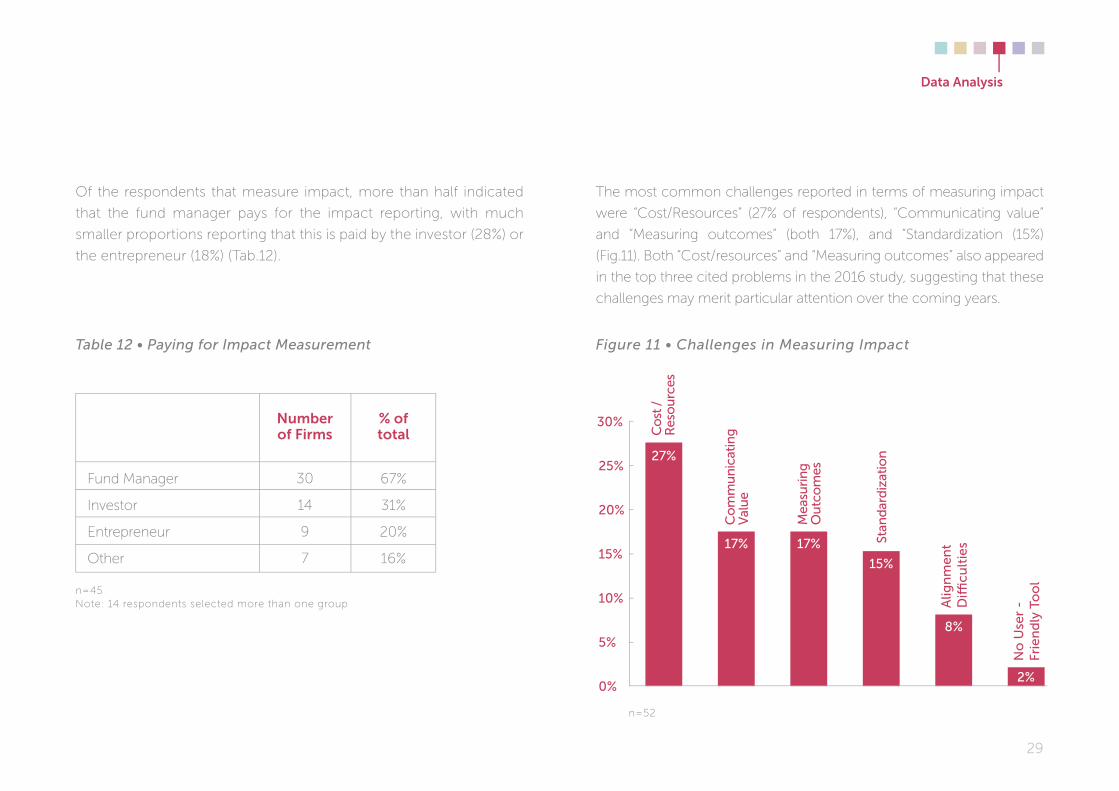
Of the respondents that measure impact, more than half indicated
that the fund manager pays for the impact reporting, with much
smaller proportions reporting that this is paid by the investor (28%) or
the entrepreneur (18%) (Tab.12).
The most common challenges reported in terms of measuring impact
were “Cost/Resources” (27% of respondents), “Communicating value”
and “Measuring outcomes” (both 17%), and “Standardization (15%)
(Fig.11). Both “Cost/resources” and “Measuring outcomes” also appeared
in the top three cited problems in the 2016 study, suggesting that these
challenges may merit particular attention over the coming years.
Table 12 • Paying for Impact Measurement Figure 11 • Challenges in Measuring Impact
0%
15%
20%
10%
5%
25%
co
st /
res
ou
rces
co
mm
un
icat
ing
v
alu
e
mea
suri
ng
ou
tco
mes
stan
dar
diz
atio
n
alig
nm
en
td
iffi
cult
ies
no
use
r -
Frie
nd
ly t
oo
l
30%
27%
17% 17%
15%
8%
2%
n=45Note: 14 respondents selected more than one group
Fund Manager
Investor
Entrepreneur
Other
30
14
9
7
number of firms
67%
31%
20%
16%
% of total
n=52
data analysis
30
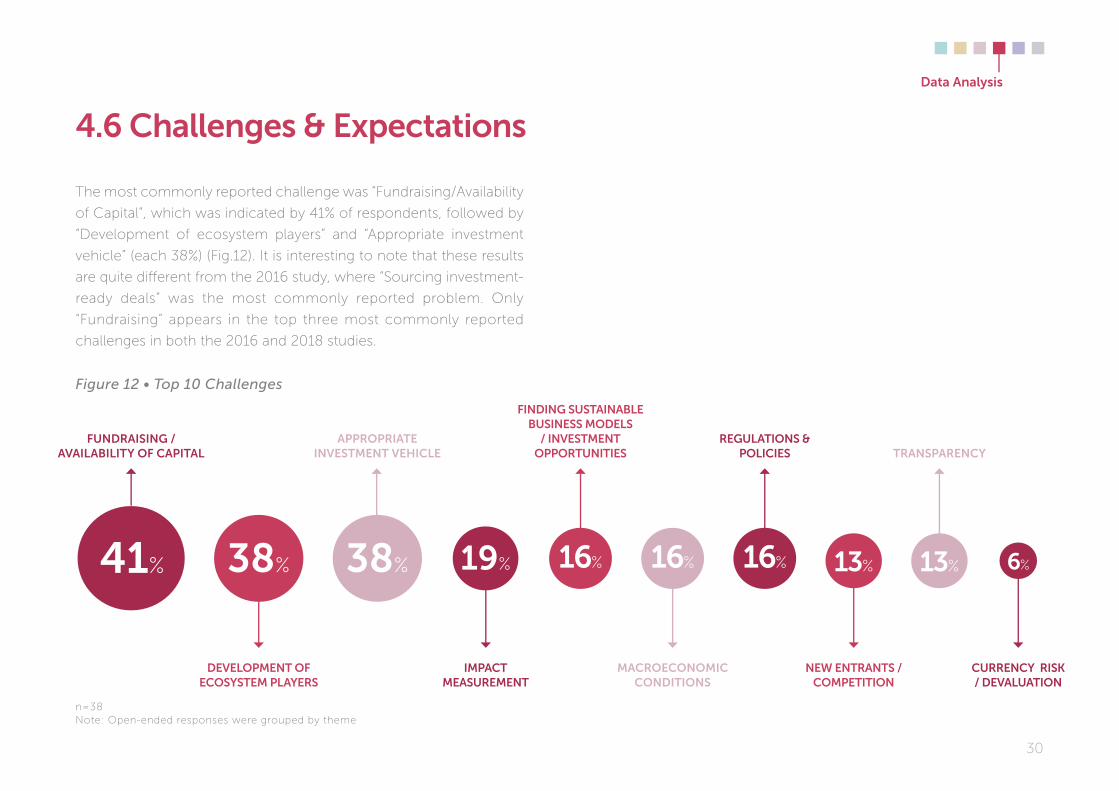
The most commonly reported challenge was “Fundraising/Availability
of Capital”, which was indicated by 41% of respondents, followed by
“Development of ecosystem players” and “Appropriate investment
vehicle” (each 38%) (Fig.12). It is interesting to note that these results
are quite diff erent from the 2016 study, where “Sourcing investment-
ready deals” was the most commonly reported problem. Only
“Fundraising” appears in the top three most commonly reported
challenges in both the 2016 and 2018 studies.
4.6 Challenges & expectations
fundraIsIng / avaIlabIlITy of CaPITal
IMPaCT MeasureMenT
regulaTIons & PolICIes
CurrenCy rIsK / devaluaTIon
develoPMenT of eCosysTeM Players
fIndIng susTaInable busIness Models
/ InvesTMenT oPPorTunITIes
neW enTranTs / CoMPeTITIon
aPProPrIaTeInvesTMenT vehICle
MaCroeConoMIC CondITIons
TransParenCy
41% 19% 16%38% 16% 13%16%38% 13% 6%
Figure 12 • Top 10 Challenges
n=38Note: Open-ended responses were grouped by theme
data analysis
31
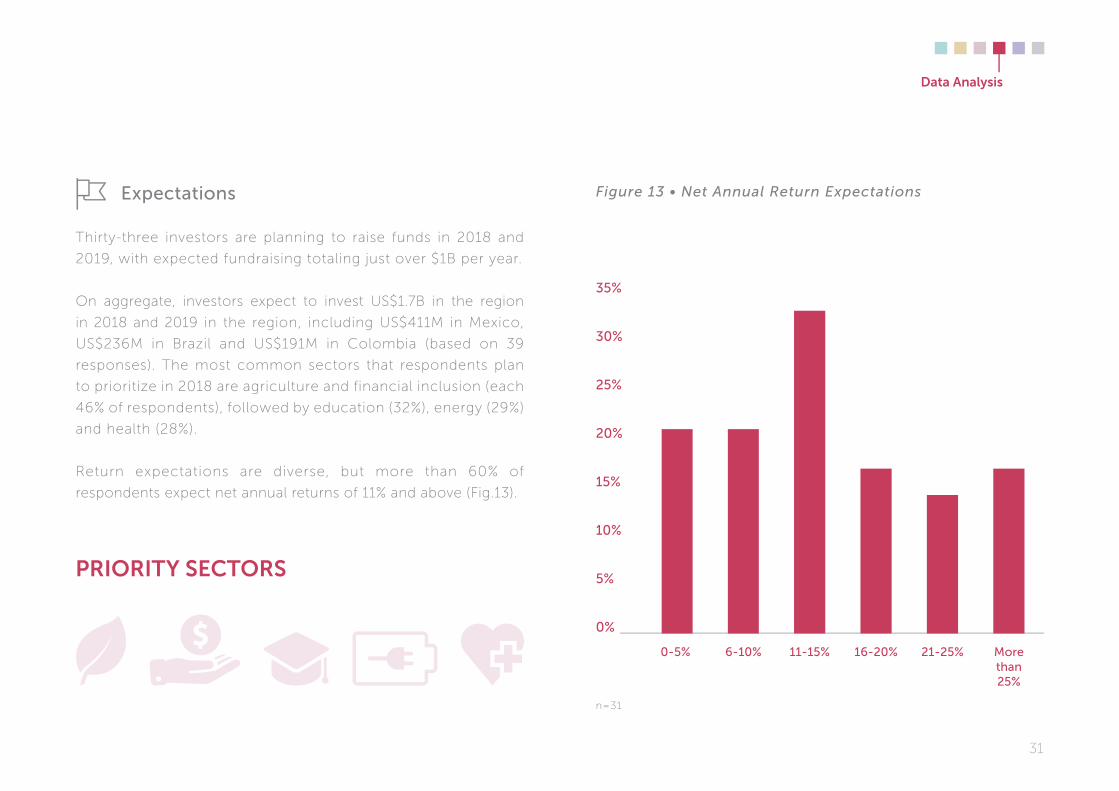
Figure 13 • Net Annual Return Expectations
0-5% 6-10% 11-15% 21-25%16-20% more than 25%
0%
5%
25%
20%
15%
10%
35%
30%
n=31
data analysis
PrIorITy seCTors
expectations
Thirty-three investors are planning to raise funds in 2018 and
2019, with expected fundraising totaling just over $1B per year.
On aggregate, investors expect to invest US$1.7B in the region
in 2018 and 2019 in the region, including US$411M in Mexico,
US$236M in Brazil and US$191M in Colombia (based on 39
responses). The most common sectors that respondents plan
to prioritize in 2018 are agriculture and financial inclusion (each
46% of respondents), followed by education (32%), energy (29%)
and health (28%).
Return expectations are diverse, but more than 60% of
respondents expect net annual returns of 11% and above (Fig.13).
32
ConClusIons &
reCoMMendaTIons
5
33
despite a challenging scenario for latin america in 2016 and 2017,
both in a macroeconomic sense and more specifi cally for Pe/vC
fundraising, impact investing in the region seems to have been
relatively resilient, based on the following observations:
• A total of 55 investors reported making investments during the
period.
• Investors who responded to both our 2016 and 2018 surveys
reported increases in number of deals and total volume of
capital deployed.
• Non-MFI investment deals were reported across more countries
in the 2018 study than the 2016 study.
Expectations for 2018 and 2019 also seem generally positive,
with investors expecting to raise more than US$2 billion over the
two years. Aggregate expectations for capital deployment would
represent considerable growth compared to 2016 and 2017, both for
the region as a whole and for the three specifi c countries that were
highlighted (Brazil, Colombia and Mexico). Additionally, more than
60% of respondents expect net annual returns of 11% and above.
The persistent perception of challenges in fundraising would be
consistent with the overall challenging scenario for PE/VC across the
region. Survey respondents did however cite more specifi c factors,
such as a lack of availability of philanthropic capital for impact
investing compared to other regions, and a reduction in availability
of capital from DFIs, with a perception that other regions are being
prioritized from a development point of view.
Conclusions &recommendations
Conclusions & recommendations
34
Conclusions &recommendations
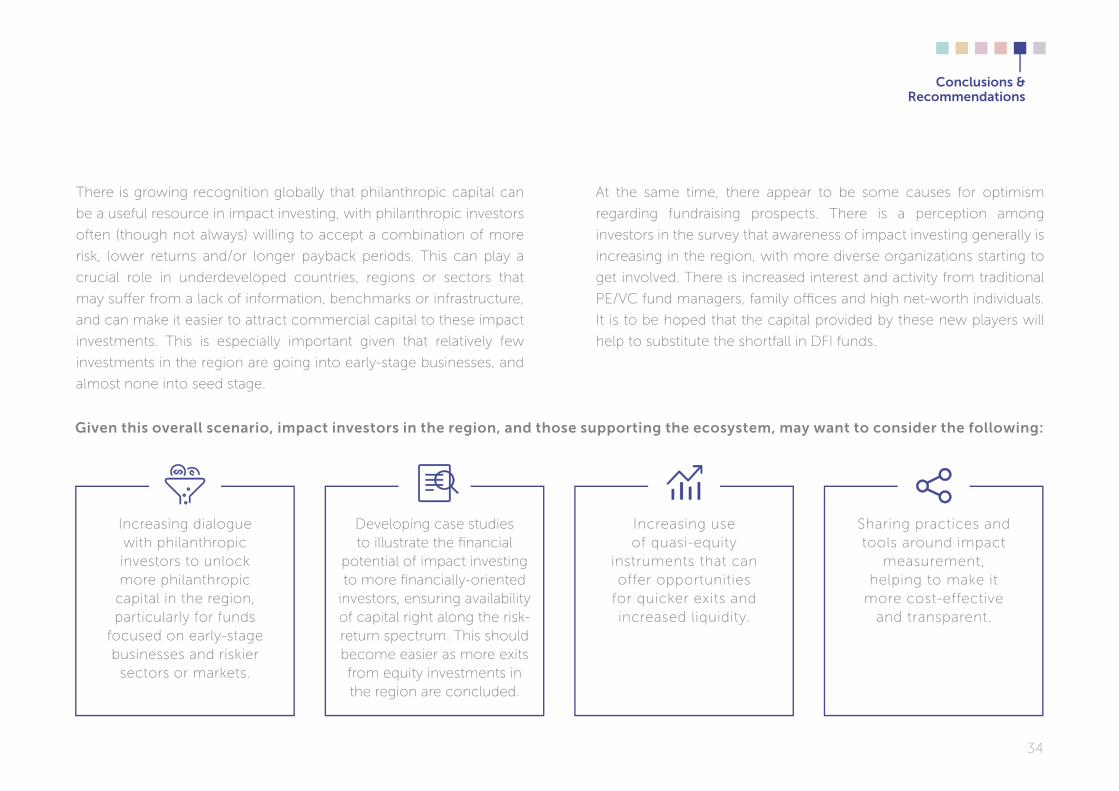
Increasing use of quasi-equity
instruments that can offer opportunities
for quicker exits and increased liquidity.
There is growing recognition globally that philanthropic capital can
be a useful resource in impact investing, with philanthropic investors
often (though not always) willing to accept a combination of more
risk, lower returns and/or longer payback periods. This can play a
crucial role in underdeveloped countries, regions or sectors that
may suff er from a lack of information, benchmarks or infrastructure,
and can make it easier to attract commercial capital to these impact
investments. This is especially important given that relatively few
investments in the region are going into early-stage businesses, and
almost none into seed stage.
At the same time, there appear to be some causes for optimism
regarding fundraising prospects. There is a perception among
investors in the survey that awareness of impact investing generally is
increasing in the region, with more diverse organizations starting to
get involved. There is increased interest and activity from traditional
PE/VC fund managers, family offi ces and high net-worth individuals.
It is to be hoped that the capital provided by these new players will
help to substitute the shortfall in DFI funds.
given this overall scenario, impact investors in the region, and those supporting the ecosystem, may want to consider the following:
Increasing dialogue with philanthropic investors to unlock more philanthropic
capital in the region, particularly for funds
focused on early-stage businesses and riskier
sectors or markets.
Sharing practices and tools around impact
measurement, helping to make it
more cost-effective and transparent.
Developing case studies to illustrate the fi nancial
potential of impact investing to more fi nancially-oriented
investors, ensuring availability of capital right along the risk-return spectrum. This should become easier as more exits from equity investments in the region are concluded.
ParTICIPaTIng
InvesTors
6
3636
accion venture lab
acumen
adobe capital
alphamundi group
ameris
angelnest
annona sustainable Investments
avina
Bamboo Finance
Bemtevi Investimento social
creation Investments capital management, llc
dev equity
developing World markets
din4mo
ecoenterprises Fund
ejido verde
elevar equity
engIe rassembleurs d’energies
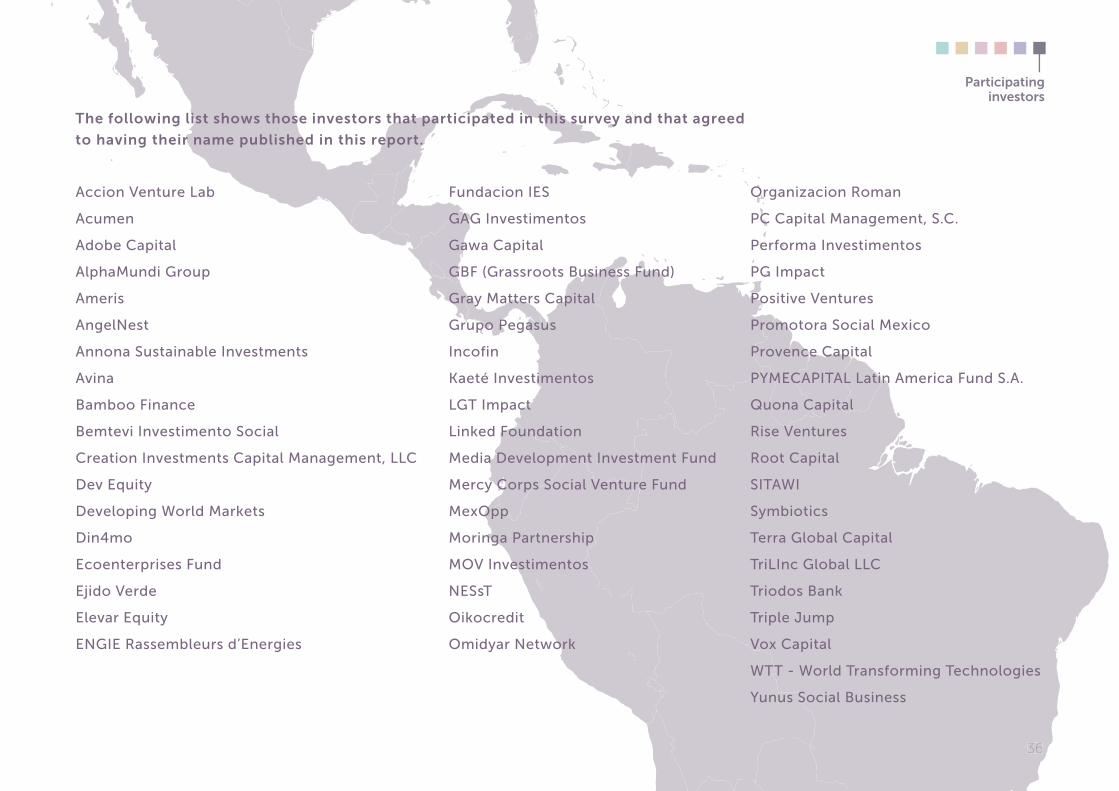
The following list shows those investors that participated in this survey and that agreed
to having their name published in this report.
Participating investors
Fundacion Ies
gag Investimentos
gawa capital
gBF (grassroots Business Fund)
gray matters capital
grupo Pegasus
Incofin
Kaeté Investimentos
lgt Impact
linked Foundation
media development Investment Fund
mercy corps social venture Fund
mexopp
moringa Partnership
mov Investimentos
nesst
oikocredit
omidyar network
organizacion roman
Pc capital management, s.c.
Performa Investimentos
Pg Impact
Positive ventures
Promotora social mexico
Provence capital
PymecaPItal latin america Fund s.a.
Quona capital
rise ventures
root capital
sItaWI
symbiotics
terra global capital
trilInc global llc
triodos Bank
triple Jump
vox capital
Wtt - World transforming technologies
yunus social Business
37
referenCes
(i) https://thegiin.org/assets/2018_GIIN_Annual_Impact_Investor_
Survey_webfi le.pdf
(ii) https://www.worldbank.org/en/region/lac/brief/global-economic-
prospects-latin-america-and-the-caribbean
(iii) https://www.as-coa.org/articles/weekly-chart-income-inequality-
latin-america
(iv) https://www.weforum.org/agenda/2016/06/these-are-the-5-health-
challenges-facing-latin-america/
(v) https://www.weforum.org/agenda/2018/06/latin-america-cities-
urbanization-infrastructure-failing-robert-muggah/
38
Produced by aspen network of development entrepreneurs (ande) and
the association for Private capital Investment in latin america (lavca)
2018
designed by tropicodesign.com