Embed Size (px)
Citation preview
1
The Impact of an Unexpected Wage Cut on Corruption:
Evidence from a “Xeroxed” Exam
Oana Borcan Mikael Lindahl Andreea Mitrut
University of Gothenburg Uppsala University, Uppsala University, UCLS,
CESifo, IFAU, IZA, UCLS University of Gothenburg
First version: 2012-05-15
This draft: 2014-06-27
Abstract
This paper aims to understand how corruption responds to an income loss. We exploit an unexpected 25% wage cut
incurred in 2010 by all Romanian public sector employees, including the public education staff. We investigate a
corruptible high-stake exam taking place shortly after the wage announcement. To measure corruption we compare
changes in exam outcomes from 2007 to 2010 between public and private schools, as the latter were not affected
by the policy. We find that the wage loss induced better exam outcomes in public than in private schools and we
attribute this difference to increased corruption by public educators.
Keywords: Austerity measures; Bribes; Public School Principals; High-Stakes Exam
JEL-codes: H4, I2, J3
‡E-mail: [email protected], [email protected] and [email protected] (corresponding author),
respectively. All errors are our own. Andreea Mitrut gratefully acknowledges support from Jan Wallanders and Tom Hedelius Fond. Mikael
Lindahl is a Royal Swedish Academy of Sciences Research Fellow supported by a grant from the Torsten and Ragnar Söderberg Foundation,
and also acknowledges financial support from the Scientific Council of Sweden and the European Research Council [ERC starting grant
241161].
*We are grateful to our editor Brian Knight, two anonymous referees and to Per-Anders Edin, David Figlio, Peter Fredriksson, Rita Ginja,
Per Johansson, Scott Imberman, Olof Johansson-Stenman, Edwin Leuven, Martin Ljunge, Eva Mörk, Ola Olsson, Sonja Opper, Amrish Patel,
Maria Perrotta, as well as seminar participants at SOFI, Uppsala University, the 2013 DIAL conference, the 2012 NCDE conference, the
2012 CESifo Economics of Education conference in Munich, the Swedish 2012 National Conference in Stockholm, 11th EUDN Workshop
in Toulouse and the HECER Economics of Education 2012 Summer Meeting in Helsinki for helpful discussions and suggestions. We also
thank Diana Coman and SIVECO Romania for excellent help with the data.
2
1. Introduction
The last decades have witnessed fast growing political and academic efforts to break down the
phenomenon of corruption into causes and effects. To date, many puzzles still remain regarding the key
causes and determinants of corruption (see Olken and Pande, 2012 for a recent review of developments in
this area). Among these, the degree to which corruption responds to a wage change is an underexplored
topic of particular interest to policy makers. This paper attempts to shed light on the effects of wages on
corruption in the public sector, exploring a quasi-natural experiment generated by an unexpected 25%
wage cut incurred by the public sector employees in Romania in 2010. Understanding the consequences
of a wage loss, especially for corruption, is particularly relevant in the context of the recent waves of
austerity measures that have swept over most of the EU countries.1 To our knowledge, this is the first
paper that identifies a causal relationship between a wage cut in the public sector and corruption activities.
The idea that financial compensation is a crucial factor in the decision of whether to engage in fraudulent
action was first formalised in 1974 with Becker and Stigler’s seminal work. The key prediction from their
model was that increasing the remuneration of public servants above the market-clearing wage can reduce
bribery, and thus reduce the prevalence of corruption. Subsequently, this hypothesis has been empirically
tested, initially using macro-level data. For example, exploring a cross-section of developing countries,
Van Rijkenghem and Weder (2001) show a negative, but rather small, association between civil service
compensation and corruption measured by the ICRG index, while Rauch and Evans (2000) find no
significant relationship between bureaucrats’ wages and corruption, but show that salaries correlate
negatively with the bureaucratic delay. To date, few studies have used micro-level data to identify the
deterrent effect that wages have on corruption. Di Tella and Schargrodsky (2003) exploit a crackdown on
corruption in the procurement departments of Buenos Aires hospitals. They find that at higher levels of
the staff’s wages the crackdown is more effective in reducing the prices of hospital inputs when there is
an intermediate level of monitoring. However, they also show that higher wages have no statistically
significant effect when there is no monitoring or when monitoring is at a very high level. These results are
consistent with the predictions of the Becker-Stigler model. Niehaus and Sukhtankar (2010) also find
empirical support for the capacity of projected gains to reduce fraud. In this setting, however, the
1 Similar measures regarding cuts in public sector wages have been proposed in other EU countries, e.g., Greece in 2011, Spain in 2012.
3
prospective rents are obtained from future opportunities to collect bribes that rely strictly on keeping the
job, which leads to an inter-temporal substitution of fraud today for rent-extraction in the future.2
While these studies are centered on the effect of an increase in remuneration on dishonesty, it is not
obvious that a decrease in wages would have a symmetric impact on corruption.3 Gorodnichenko and
Sabirianova Peter (2007), to our knowledge, is the only study that has analyzed corruption in direct relation
to low wages. Using micro data from Ukraine, these authors show that the wage differential between the
private and (the much lower-paid) public sector does not translate into a difference in consumption, and
they conclude that bribery must account for the observed wage gap. In doing so, they document the role
of corruption in explaining the prevalence of low-paid public jobs, rather than the reverse. Thus, the impact
of a decrease in wages on the prevalence of corruption, the object of our study, remains an open empirical
question.
In the spirit of the shirking model proposed by Shapiro and Stiglitz (1984), lower wages could trigger a
switchover to rents from corrupt activities, as the civil servant attempts to compensate for his lost income.
At the same time, a different mechanism, working in the opposite direction, holds the prospect of
unemployment as a deterrent for shirking or, as applied to our case, corruption (Shapiro and Stiglitz, 1984).
Thus, particularly in a depressed economic time, as in 2010, an income loss may potentially prompt more
risk-averse public employees to refrain from corruption because they fear losing their job and their only
source of income when the market cannot accommodate them. The latter mechanism is also supported by
an argument à la Niehaus and Sukhtankar (2010) that the need to keep the public job with future bribe
opportunities (relatively more lucrative than the diminished wage), may drive a temporary drop in
corruption. Overall, these mechanisms convey an ambiguous effect of lower wages on corruption, and
identifying their impact is essentially an empirical exercise.
2Armantier and Boly (2011) carry out a controlled field experiment on the receptiveness of exam graders to bribe-offering. The effect of
higher wages on corruption tested in their experiment is ambiguous. This paper belongs to a growing experimental literature on corruption
using controlled field experiments (see Olken, 2007, Bertrand et al., 2006), as well as lab experiments (see Frank and Schulze, 2000; Abbink,
2002; Schulze and Frank, 2003; Barr et al., 2009; Barr and Serra, 2009). The latter category also yields mixed evidence on the impact of a
wage increase on corruption. 3According to the prospect theory, agents perceive differently equivalent losses and gains. This is sustained by empirical evidence. For
example, Armantier and Boly (2013) show in a field experiment that teachers performed better in a marking task when incentivized with a
penalty, rather than with a bonus. If this applies to corruption, it is not clear whether reduced wages would increase corruption. Also, Niehaus
and Sukhtankar (2010) argue that a significant wage decrease could increase the reliance on future bribe, and hence on keeping the public
sector job with bribe opportunities, thus possibly discouraging an increase in fraud in the present. From the stand point of the wage-corruption
relationship, our study is akin to the theoretical underpinnings of Becker and Stigler (1974). However, whereas the bribe in their model is
exogenous, our analysis inquiries into how wages can alter corruption intensity. In this respect, our findings relate more closely to Shleifer
and Vishny (1993) who take bribes to be endogenous and analyze how they respond to the market structure of corruption.
4
In this paper we show that a large reduction in the wages of civil servants—in this case public school
principals, together with teachers, and/or the administration personnel—can increase the incidence of
corruption. Specifically, our study attempts to measure the effect of an exogenous 25% reduction in wages
on corruption in the education sector in Romania. As part of an austerity plan, the Romanian public sector
was hit by an unexpected wage cut announced on May 7th 2010, scheduled to take effect starting July 1st
2010. In June 2010, just between the announcement of the cut and its actual implementation, the annual
national high school-leaving exam—the Baccalaureate—took place in the usual manner, testing
approximately 200,000 students. The prevalence of corruption at the Baccalaureate exams was notorious
and was attributed to the high-stakes character of the exam (it accounts for up to 100% of the
university/college admission score) and the poor remuneration of teachers in general. As it happened, the
2010 exam signaled an unprecedentedly high number of allegations of fraud and bribery by school
principals connected with the Baccalaureate. The 2010 spike in court investigations by the Romanian
National Anticorruption Directorate (DNA), revealed how batches of identical answers had been
distributed to students (by public educators), earning the 2010 exam a special title: "The Xeroxed exam".4
Additional survey data on education corruption in Romania confirms that there was an increase in the
incidence of bribery in public education in 2010 compared to 2006.5
Since we do not observe bribery and fraud directly, our strategy for understanding the impact of the wage
cut on corruption is to compare the change in the Baccalaureate exam outcomes – mainly the school-level
average grades and passing rates of the standardised Romanian language exam - from 2007 to 2010
between public and private schools, as the latter category was not affected by the policy.6 The arguments
in favor of interpreting the resulting change in exam scores as being due to changes in corruption are the
following: 1) the timing between the announcement of the wage cut and the exam is far too short for other
responses (for example, a change in the students’ or in-class teachers’ effort); 2) using county specific
variation in corruption we find that our effects are indeed driven by the most corrupted counties, whereas
we find no impact of the wage cut in counties with little or no corruption. If we believe that exogenous
4 This title given by the media refers to the fact that many students were found to have identical test answers (including in essay type exams),
which is unlikely to happen without special interventions, given the complexity of the subjects. We will return to the mechanisms of
corruption later in the paper. 5 We use Life in Transition Surveys I and II and rely on the question “In your opinion, how often do people like you have to make unofficial
payments or gifts in these situations?” and we focus on public education. The answers range from 1 (never) to 5 (always). A t-test shows that
the average score in 2010 is significantly larger than in 2006 (1.76 as opposed to 1.62) and the regression counterpart of this difference
remains significant after we control for the usage of public education services. 6 Because corruption is notoriously difficult to measure, many researchers resort to some indirect assessments, such as evaluating corruption
through changes in the outcome of interest when moving into a treatment where corruption is more likely. A similar strategy has been, for
example, employed in Olken (2007) or Bertrand et al. (2006).
5
shocks to private schools or responses in form of effort are likely to have a similar impact in the most and
least corrupted counties, we can conclude that these confounders are unlikely to bias our baseline
estimates. However, in section 5.2 we discuss extensively alternative explanations and possible
confounders to our interpretation of the main results.
Our results show a positive and significant change in the exam outcomes between public and private
schools, which we attribute to an increase in incentives to engage in corrupt activities in 2010 relative to
previous years. In particular, our results for the standardised Romanian written exam, a test which
remained similar across years and is taken by all students, regardless of their track, indicate a wage cut-
driven effect equivalent to a 0.26 SD increase in exam scores and an increase in school-level Romanian
exam pass rates by 3.3 percentage points. The estimated effects are equivalent to a nearly 4% increase in
both exam outcomes. We employ different falsification tests and sensitivity analysis to lend further
credibility to our results.
While this study adds to the developing pool of knowledge about corruption in the education sector (see,
for example, Ferraz et al., 2012; Duflo et al., 2010; Reinikka and Svensson, 2004, 2005; Muralidharan
and Sundaraman, 2011; Glewwe et al., 2010), it also complements the findings in a related literature
investigating incentives for teachers cheating and the dangers of high-stakes evaluation systems (Jacob
and Levitt, 2003; Nichols and Berliner, 2007).
The paper is structured as follows: Section 2 presents an overview of the Romanian context, explaining
the wage cut policy, the educational system and the implications for corruption. Section 3 provides the
details of our data, while section 4 outlines our empirical strategy and our main empirical findings. Section
5 provides some tests as to whether changes in exam scores following the wage cut can be interpreted as
changes in corruption caused by the wage cut, while our conclusions are presented in Section 6.
2. Background
2.1 The 2010 Unexpected Public Sector Wage Cut
The threat of recession posed by the unfolding international financial crisis in the fall of 2008 was largely
overlooked by Romanian politicians, who confidently conveyed a disjunction between Romania and the
world economy. The autumn 2008 Euro-barometer showed that more than 70% of Romanian respondents
anticipated no change or even an improvement in the general economic situation of Romania.7 Despite the
7 http://ec.europa.eu/public_opinion/cf/:“What are your expectations for the year to come with respect to the economic situation of your
country (Romania).”
6
IMF’s prompting for moderation, upon preparing his 2009 electoral campaign and especially after winning
the elections, the incumbent president promoted greatly optimistic prospects: "(…) we expect significant
growth in the first part of 2010".8
In this context, the austerity measure announced by the President on May 7th, 2010 involving a 25% cut
in wages for all public sector employees, the elimination of some of their financial and in-kind incentives
(which were accounting for an additional up to 15% of the monthly remuneration), and a 15% reduction
in pensions and unemployment benefits was unexpected, generating social instability and political
divergence. The austerity measure was introduced in an attempt to reach the 6.8% budget deficit target
agreed upon with the IMF (for more details about the unexpected announcement and the political situation
in Romania in 2010, see also Bejenariu and Mitrut, 2012). Soon after, the Finance Minister publicly
admitted that the governments’ previous optimism had been deceptive. 9 Thus, following the May 7th
announcement, on June 30th, the President promulgated the austerity law, which came in effect July 1st,
with an initial duration of 6 months, until December 31st, 2010. To date, the public sector wages have not
been restored to their initial level.
2.2 The Structure of education and the high school exam in Romania
The standard design of the educational system in Romania is based on a division of three cycles, each
containing four years: primary school (grades 1 to 4), middle school or gymnasium (grades 5 to 8),
followed by a national exam which insures the admission into high schools on a: i) theoretical (or general)
track, ii) technological track, iii) vocational track (see NASFA Romanian Educational System, 2011).
Upon completion of high school, students take the school-leaving exam - the Baccalaureate exam (akin to
the French Baccalauréat) - which is a nationwide standardised test mandatory for obtaining the certificate
of graduation from secondary school. Importantly, passing the Baccalaureate exam is a strict requirement
for pursuing further professional training or for enrolling in tertiary education, 10 as the student’s average
grade on this exam accounts for up to 100% of the university admission score, and is the main criterion
for being granted exemption from tuition fees (in public universities). Thus, passing this national
examination (with high grades) is very important.
8http://www.evz.ro/detalii/stiri/basescu-romania-nu-va-fi-afectata-de-criza-837030.html (in Romanian). 9http://www.hotnews.ro/stiri-politic-7350294-sebastian-vladescu-era-foarte-usor-mintim-continuare-mai-imprumutam-vreo-sase-luni.htm
(in Romanian) 10 At the very least, the degree obtained by passing this exam offers a basic qualification with the potential to earn the student a better
placement in the labor market.
7
The Baccalaureate consists of several standardised tests taken in oral (testing knowledge of Romanian and
a foreign language) and written form (containing multiple choice, elaborate answers and essays in
different subjects, depending on track). These are graded on a scale from 1 to 10, and to pass the exam, a
student should obtain a minimum score of 5 on each test and a minimum overall average score of 6, while
scores of 7 and above are usually regarded as competitive for admission in higher education, The tests
are held in examination centers, to which more high schools from the same locality are randomly assigned.
The organization of the exam in every center is the responsibility of the exam committee, which consists
of a chairman (typically a university professor), one or two deputy-chairmen (typically public high school
principals), a person specialised in IT management (for technical support), and a number of public school
teachers whose duty is to monitor the exam.11
The format of the Baccalaureate has been standard for the last ten years with two oral exams and four
written tests, which take place over the course of two weeks toward the end of June every year. A few
changes to the exam format in 2010 make the overall pass rate less comparable to earlier years.12 The most
important changes were the exclusion of oral tests from the overall score and the elimination of the fourth
written test, all with abnormal score distributions highly concentrated at the top marks.13 The tests are
standardised for all students ascribed to each education profile and track. The one test that is unique to all
students regardless of profile and track is the written Romanian language exam. This, together with the
fact that the conditions for this test have remained very similar across years makes it an ideal basis for
comparison of student outcomes on the exam.14
As stated before, in 2010, the wage cut news arrived on May 7th, three weeks before the end of the school
year, during which the graduation ceremonies take place. Since the exam is sat in June, this close timing
between the unexpected news and the exam reduces the possibility that the wage cut would have changed
the test outcomes via increased effort by students, parents or teachers. Still, in Section 5, we will perform
some sensitivity analyses to rule out this channel.
11 These teachers are unrelated to the subject under evaluation or to the students, and are randomly assigned in pairs of two in each classroom
by the exam committee. 12 No other changes in the educational system took place in the period 2007-2010. 13 The oral exams were pushed ahead of the written ones, to February, and they were rendered irrelevant to the overall exam grade. Also, a
new examination of digital competencies was added to the oral section of the exam, and one track-specific written test was eliminated. The
assessment became qualitative, categorizing the students into: experienced, advanced or average users. Also, in 2007, 2008 and 2009, in
preparation for the exam, the students had access to 100-300 published written exam models with full answers for each discipline, some of
which would have become the actual tests. In 2010 the test would resemble, but not perfectly match the models. All in all, we expect these
changes, if anything, to decrease the test scores. 14 We also claim that for the Romanian written exam it is more difficult to cheat in class (as one possible confounder to corruption), since
students need to develop ideas and write essay-like questions as part of the examination.
8
2.3 The corruption environment
The endemic post-communist corruption in the public sector has become proverbial among Romanians: a
2003 World Bank Report about corruption in Romania reveals that more than 67% of the respondents
alleged that all or almost all public officials in Romania are corrupt, while more than 50% of the
respondents believed that bribery is part of the everyday life in Romania.15 This is particularly true in the
education and health systems, where up to 66% of the respondents confirmed that they were paying the
so-called atentie (unofficial payments or bribes).16 More than a quarter of the students interviewed in the
2003 World Bank Diagnostic Survey of Corruption in Romania admitted to have provided some unofficial
payments during the previous year.
Thus, one notable feature of the Romanian public schools that favors the propagation of corruption is the
existence of a habitualised system of informal payments. These range from more innocuous forms such
as the imposition of funds collected for covering school and classroom material expenses (fondul
scolii/clasei) all the way to gifts demanded by teachers in exchange for favors such as not failing the
students or inflating their grades.17 Overall, the frequency of such exchanges over the entire course of
school years sustains a dense clientelistic network. Among the most commonly invoked causes for
dysfunctions in the public education system are: i) the poor remuneration of teachers in the public sector18
and ii) the high-stakes of the high-school exit exam, particularly starting with the year 2002 when
increasing numbers of universities included the Baccalaureate exam score as part of the admission process.
There is an overall consensus among the Romanian public that the Baccalaureate passing rates (anchored
around 80%) and the underlying grades are artificially inflated through corruption. This “performance” is
in complete opposition to international tests (PISA), where Romanian students earn among the lowest
15A 2010 study on corruption in Romania shows about 80% of the respondents to agree that the Government and Central Institutions are
corrupted to a large and very large extent, a finding that is in line with the idea that corruption has increased during the last years.
www.agenda21.org.ro/download/%20Studiu%20perceptia%20cetatenilor%20asupra%20coruptiei%20din%20institutiile%20publice.pdf (in Romanian) 16 Paying the so-called atentie is very common. The 2003 World Bank Diagnostic Survey of Corruption in Romania confirms that up to 66%
of the respondents have paid an atentie during a hospital stay, while 27% of the respondents have given atentii to vocational school (teachers),
25% to the primary school (teachers), 21% in the high-school system and 17% in the University. Foe education these are lower bounds: first,
people do not like to admit they are bribing teachers, as may signal insufficient ability; second, these numbers are from survey questions to
all households, regardless of the age of the household members and whether or not they have kids in school. A recent survey among university
students reveals that about 72% of the students and 68% of the university teachers were involved in corrupted activities in relation to school
(our calculations using the 2007 PEIS data, Gallup Romania). 17Center for Education (CEDU, 2006), “Administration and practices lacking integrity in schools”. http://www.cedu.ro/files/research/Administrare%20si%20practici%20lipsite%20de%20integritate%20in%20scoala%20-
%20raport%20de%20cercetare.pdf (In Romanian). 18 In Romania, similar to other transition countries, wages of the educational staff in the public sector are highly centralised and there is little
variation across teachers. While there are no official statistics, it is the case that public teachers earn, on average, up to two times less than
their private counterparts.
9
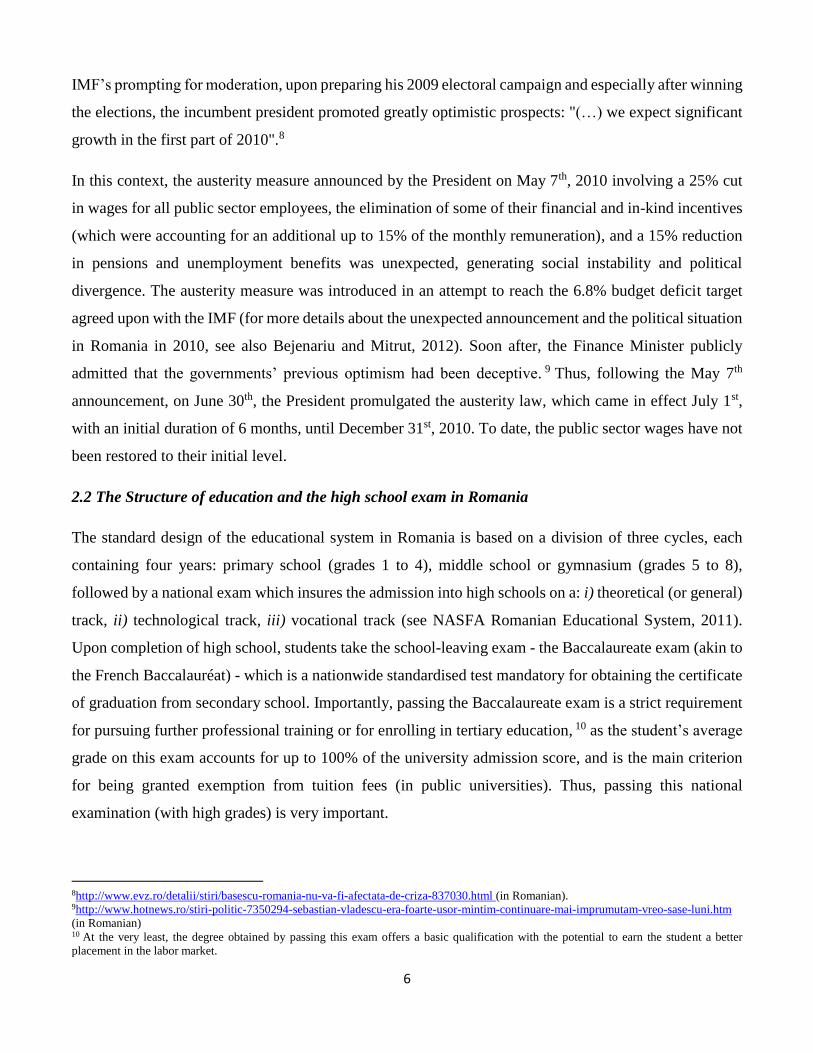
scores.19 This inconsistency is shown in Figure 1 where we show the 2009 upper secondary graduation
rates and the PISA tests scores for 16 European countries. Interestingly, Romania lies in the first part of
the distribution of the upper secondary graduation rates (Figure 1A), while, at the same time, is the
European country with the lowest PISA scores (in Figure 1B we show the reading test, but similar ranking
is obtained for the mathematics and the science tests). Moreover, the introduction of video surveillance in
2011 coincided with a drop in average pass rates to a staggering 44%, further confirming that the exam
had for years been corrupt.
The 2010 exam earned a special reputation and the suggestive title “The Xeroxed Baccalaureate” after a
large number of cases of corruption at the exam (150 defendants compared to essentially none previously)
caused a media storm.20 Without precedent, many teachers and school principals were investigated by the
Romanian National Anticorruption Directorate (DNA), in connection with the 2010 Baccalaureate exam
for having taken large amounts of money from students to help them pass or to raise their grades.21 In
particular, the school personnel was accused of arranging with committee members for selected papers of
these students to be graded higher, partly changed or entirely replaced (Xeroxed) with correct answers.
Some of these cases went to court and were finalised in 2011 and 2012 with prison sentences.22 This
evidence suggests that the exam in 2010 was characterised by an unusually high level of corrupt activity,
which we explain through the additional incentives for fraud borne by the unexpected wage cut.
2.3.1 Possible mechanisms of corruption
As explained above, in Romania gift-giving and informal payments are very common, particularly in
public institutions (see CEDU Report, 2006; Corruption in Public Institutions, 2010). 2324 At the
Baccalaureate, the unofficial payments resulting in grade inflation can be, broadly, summarised as follows:
19 See, for example, the 2009 PISA Executive Report: http://www.oecd.org/dataoecd/34/60/46619703.pdf and the 2009 OECD report Education
at a Glance http://www.oecd.org/dataoecd/41/25/43636332.pdf. 20http://www.pna.ro/faces/index.xhtml. 21http://www.ziare.com/stiri/arestare/directori-de-liceu-arestati-pentru-fraude-la-bacalaureat-1029179;
http://www.adevarul.ro/scoala_educatie/liceu/150-000_de_lei-fraudarecord_la_Bacalaureat_0_292771226.
http://www.ziare.com/scoala/bacalaureat/zeci-de-profesori-din-botosani-sunt-cercetati-pentru-frauda-la-bac-1031591 (in Romanian) 22 www.desteptarea.ro/zeci-de-condamnari-in-dosarul-spaga-la-bac.html (in Romanian) 23 Center for Education (CEDU, 2006), “Administration and practices lacking integrity in schools”, see footnote 17.
The National Agency for Public Workers (2010), “Perceptions about corruption in public institutions”,
http://www.anfp.gov.ro/DocumenteEditor/Upload/proiecte%20in%20derulare/Studiu%20perceptie%20coruptie%20sept%202010.pdf 24 Hallak and Poisson (2007) provide a comprehensive taxonomy of corruption in education. The forms of fraud tackled in this paper are not
restricted to the Romanian educational system. In Russia, Ukraine and Uzbekistan (Silova and Bray, 2006) the sale of grades is common,
while in India the high school exam annual pass rates dropped from 61% to 17% in 1992, when police were stationed at the examinations
centers (Kingdon and Muzammil, 2009). For more such illustrations see Lewis and Pettersson (2009: 45).
10
a) Collective bribes - the so-called “protocols”- are informal but commonly accepted funds (money)
collected on various occasions, among which is graduation.25 The graduating students, shortly before
the end of the school year, collect these contributions to “organise” the Baccalaureate exam, which are
in fact used to “grease the wheels” such that the invigillators and other committee members turn a
blind eye to cheating in the exam rooms (copy aids, talk among students, etc.). However, in-class
cheating and thus, implicitly the protocol, is feasible for both public and private students, who are
randomly and anonymously mixed in exam rooms, under the same surveillance. We will rule out
differential in-class cheating in Section 5.
b) Individual bribes - some students (individually or in small groups) may give extra bribes for extra
favors. These favors come in many forms: distributing of correct solutions during the exam for the
contributing students, bribing the evaluators to score selected papers higher, cooperating with the exam
committee to single out the marked papers and improve them or completely replace (Xerox) them with
correct ones before sending them to the evaluation centers.26 In particular, using the already developed
informal network at the high-school level, students use the teachers/school principals’ channel to send
their bribes to the exam committee members and/or the evaluators for higher grades. Although the
composition of the exam committees is made public only 48 hours before the exam, the chairman and
the IT staff are known months in advance. Note that the school principals typically have a very dense
web of connections, having been randomly allocated to be part of the exam committees formed around
the Baccalaureate in different years.
The individual bribes are somewhat more relaxed for the public students given the well-established
informal networks in public schools.27 However, the existence of corruption in private high schools cannot
be ruled out but, as private school principals are not in exam committees, the chain of events necessary
for a bribe from a student to result in higher exam scores is less likely to be fulfilled for private school
25 See also Center for Education CEDU, 2006 (footnote 17). 26 It was actually this form of bribe that led to the court cases in 2010 mentioned above. The 2010 Report of Activity of the National
Anticorruption Court enumerates the investigated crimes at the 2010 Baccalaureate: bribe giving and taking; influence peddling; stealing,
destruction and falsification of official documents, all involving large amounts of money. Individual bribes amounted to 350 Euro for passing
one written test and 500 Euro for passing the overall exam. The total prejudice was at least 150,000 Euro. We do not have information about
the number of high school students involved in individual bribing, but in the PEIS –Gallup 2006 data, 55% of the university students admitted
to have been paid “gifts” to get higher exam grades (admittedly, these are low stake-exams). 27 Note that there is a cost associated with engaging in corrupt activities for educators – the risk of getting caught and losing future earnings.
Although no official sources detail on the monitoring and detection process, the 2010 Report of Activity of the National Anticorruption Court
reveals that most cases of corruption at the exam have been detected as a consequence of reporting of the crime by some party involved in
the corrupt deal (usually students). This gives a good indication that the larger the portfolio of clients a public educator serves, the larger is
the private benefit, but also the higher is his risk of getting caught.
11
students. Thus, we ground our identification strategy in the conjunction of this form of corruption with
this differentiation between public and private schools’ access to a corrupted network.28
3. Data and descriptive statistics
3.1 The data set
In our empirical exercise we use three main sources of data. Firstly, we use administrative data from 2007
to 2010, essentially covering the universe of students enrolled in the Baccalaureate exam, with individual
information about their gender, school, their personal specialization track (theoretical/general,
technological or vocational), whether the student passed the exam and the scores on each exam. From
these scores we will construct our outcomes of interest. We also know whether the student was present at
the exam or expelled from the exam room due to in-class cheating.29 Secondly, we complement the data
above with a measure on the students’ poverty status, using individual information on the students eligible
for the Money for High School (MHS) program of financial assistance for high school students with a
monthly income per family member below 180RON (about 53 USD). The 2007-2010 data provided by
the Ministry of Education covers information on all the eligible students’ school in every year of
application.30
Finally, our third source of data is the 2010 Study Performance in High School (SPHS) data, collected by
Statistics Romania. The SPHS records information on a broad set of high school characteristics for all
high schools in the country: the high school name and a unique identification code; the address of the
school (locality and county); the type of school (whether private or public); and detailed information about
the number of students by gender and ethnicity, the number of teachers and school principals by gender,
type of employment contract, and their age structure. We can thus match these data with the administrative
students’ records at the final exam by the school’s unique identification code to construct our working
sample. The key information for our empirical strategy is whether the student comes from a private or a
public school. We only consider counties that have both private and public schools (19 out of a total of 42
counties). Thus, for the main analysis we rely on an unbalanced panel of between 824 and 850 schools for
28In our sensitivity analysis we attempt to isolate the collective bribe channel from the individual bribes by controlling for exam center. 29 With our data, we only observe students that have been registered for the Baccalaureate. 30 In particular, an applicant was eligible if he had a gross monthly income per family member not larger than 180RON in the previous three
months before applying. For the years 2007-2010 all students that were eligible and applied have received the scholarship. For more
information about this program see Borcan, Lindahl and Mitrut (2014).
12
each academic year (127,500 students on average per academic year); among these approximately 6% are
private schools (up to 5,000 students per academic year).31
3.2 Descriptive statistics
Summary statistics for our main variables of interest, separately for 2007 through 2010 are found in Table
1. For our working sample, about 26.5% are theoretical or general schools, around 8% are vocational
schools, and the rest of around 66% are technological or mixed schools.
We show descriptive statistics for exam scores and pass rates for the Romanian written exam at the school
level, where we have weighted each school by the number of students taking the tests in the exam. Table
1 shows an increase in the average grade at the written Romanian test in 2010 relative to previous years,
particularly 2009 and 2007. This test is directly comparable across years as its format has remain similar
relative to previous years and all students, regardless of their profile, track or ethnicity, need to pass this
standardised exam. This makes it an ideal basis for comparison of student outcomes across years. Thus
the school-level average grades for the written Romanian exam and the share of students (at the school
level) passing the written Romanian exam are our main outcomes of interest.
Finally, it is important to note that private and public schools differ in the levels of our key outcomes.
Private schools consistently exhibit average passing rates and average Romanian grades below those of
public schools. This indicates an overall lower performance of private schools, related to the selection of
lower achieving students into private high schools in the 9th grade, a common occurrence in Romania.32
This is why later in the paper we: 1) estimate the impact on exam scores between public and private school
students in 2010, relative to previous years, controlling for pre-treatment differences in exam scores for
previous years, county fixed effects and county-specific time trends, and school fixed effects, and 2)
conduct estimation on a matched sample of public and private schools, with similar levels and trends in
exam scores, and on type of track (and on other characteristics), prior to the wage cut in 2010.
4. Estimation strategy and baseline results
4.1 Identification strategy
31 Our main results when using the entire sample are overall similar to those in the main analysis but less precisely estimated. Additionally,
we will show some results at the examination center for all centers with at least one private school and where the share of private students is
about 25%. 32 This is true on average, as a small number of private high schools select and train top students. For a description of the selection of
Romanian students into the 9th grade see Pop-Eleches and Urquiola , 2011.
13
We attempt to understand whether an income loss led to changes in corruption behavior, measured through
a change in exam outcomes. Specifically, the policy we evaluate is the May 7th, 2010 unexpected wage
cut for all public sector employees, affecting more than 90% of the Romanian education staff. The intuition
is as follows. Before the 2010 exam, we assume exam outcomes to be inflated, for both public and private
schools.33 Additionally, it is probably reasonable to assume that the incentives and level of corruption
intensity for private schools should stay constant.34 As we have argued before, a substantial wage loss for
the public school staff has, ex-ante, unclear implications for corruption: on the one hand, teachers may
attempt to compensate for their forgone income by increasing the prevalence of bribing and corruption; at
the same time, an income loss may prompt teachers to refrain from corruption because the need to keep
their job along with future bribe opportunities becomes more salient.
Our main empirical strategy to assess the impact of a change in corruption incentives caused by an
unexpected wage cut is a simple difference-in-difference (DD) specification. In particular, we will
compare school-level exam outcomes for the public and private schools in 2010 relative to earlier years.
Because private and public students are alphabetically mixed in exams rooms and subject to the same
examinations, the private school students constitute a natural control group. If the wage cut has caused an
increase in corrupt behavior of the educators in the public schools (through bribes, as discussed in Section
2), we expect to see an increase in exam scores in public school, relative to private schools.
Our baseline specification is the following equation:
𝑦𝑠𝑐𝑡 = 𝛼 + 𝛽𝑃𝑢𝑏𝑙𝑖𝑐𝑠 ∙ 𝑦𝑟2010𝑡 + 𝛿′𝑋𝑠𝑐𝑡 + 𝜑𝑡 + 𝜃𝑠 + 𝜃𝑐 ∙ 𝑡 + 휀𝑠𝑐𝑡 (1)
where s indexes a school in county c at year t. 𝑦𝑠𝑐𝑡 is one of our two main outcomes of interest: 1) the
school-level average grade for the standardised written Romanian language exam and 2) the school-level
share of students passing the standardised written Romanian language exam; 𝑃𝑢𝑏𝑙𝑖𝑐𝑠 is an indicator that
equals 1 if school s is public and 0 if it is private; 𝑦𝑟2010𝑡 is an indicator that equals 1 if it is for the 2010
final exam and 0 if it is for any other year; 𝑋𝑠𝑐𝑡 includes the share of poor students and the share of male
students in school s in year t; 𝜑𝑡 represent 3 year indicators; 𝜃𝑠 includes schools indicators and 𝜃𝑐 ∙ 𝑡 are
33 A natural test of the validity of this assumption is actually the Baccalaureate exam in 2011. Following different anti-cheating initiatives
and threats (for example, installing video cameras in schools during the exam, threatening the staff with dismissal), over half of the students
taking the exam failed (see Borcan, Lindahl and Mitrut, 2014). 34 While we assume that corruption in private schools did not change after the 2010 wage cut announcement, one may argue that this policy
impacted indirectly the private teachers’ labor market, making them potentially less inclined to take bribes for fear of getting fired. Thus, this
could have generated lower exam scores in private schools, due to less corruptible private school teachers. We hereby work under the
assumption that corruption (if any) in private schools stays constant between 2010 and previous years, or that the alternative labor market
situations equally affected for private and public school teachers. We will also run several sensitivity analyses in Section 5.
14
county-specific yearly trends. Our main coefficient of interest is 𝛽, the DD-estimand, which measures the
change in outcomes in 2010, after the abrupt wage cut, relative to previous years, for public relative to
private schools. We weight all regressions with the number of (per school) students taking the exam.35 In
the regressions we cluster the standard errors at the municipality level, since an important part of schools’
financing is decided by the municipal administrations (resulting in 254 clusters).
By including school fixed effects, we are able to control for unobservable time-invariant school
characteristics. In alternative specifications, we replace 𝜃𝑠 with 𝜃𝑐, which includes 19 county indicators.
36 In this case we expand the list of controls to include a separate 𝑃𝑢𝑏𝑙𝑖𝑐𝑠 indicator and an additional vector
𝑋𝑠𝑐 containing two indicators for the track of the school: theoretical and technological (the base is
vocational).37 We account for possible changes in the composition of students at the school level by
including controls for the students gender and poverty status, which, if correlated with the events in 2010,
may otherwise alter estimates of the 𝛽 coefficient.
A necessary condition for an estimate of 𝛽 to capture the effect of a sizable wage cut on corrupted exam
scores is that the interaction term 𝑃𝑢𝑏𝑙𝑖𝑐𝑠 × 𝑦𝑟2010𝑡 is uncorrelated with the error term in equation (1).
Our key assumption in order to get consistent estimates of 𝛽 in (1) is therefore that, in the absence of the
wage cut, we would not observe any difference in the change in the exam scores between public and
private schools in 2010 relative to earlier years (the parallel trend assumption). To investigate the
plausibility of this assumption we will estimate a less restrictive version of (1) and add two interaction
terms, the public and yearly indicators for 2008 and 2009, to the baseline model.
We also try to address concerns related to other changes that may have affected private and public schools
differently in 2010 relative to previous years and that could confound the estimated effect 𝛽. Firstly,
35 The estimates are very similar if we estimate un-weighted regressions. 36 The difficulty in estimating correct standard errors in DD models where a policy changes only for a small number of groups is discussed
in Conley & Taber (2011). Their argument is that unless the number of treated groups is large, standard methods for inference are
inappropriate. In this study we have treated and control units (public and private schools) represented in all the 19 counties. Hence, if we see
geographical clusters (for instance counties) as units of treatment, their critique is not relevant for this study. Of course, one can also think of
their critique as being relevant for non-geographical dimensions (such as all public schools being one unit of treatment and all private schools
being one unit of control). However, although we discuss this issue more in detail in section 5.2., we think it is unlikely that there are important
specific shocks (unrelated to the wage cut) that affect public schools but not private schools. This assertion gets additional support from the
facts that a) we get similar sized standard errors whether or not we cluster the standard errors at the school, the locality or at the county level,
something which can be reconciled with the Conley & Taber argument being valid here only in the unlikely case of shocks hitting public and
private schools differently between but not within counties, and b) we do not find that exam scores evolve differently in public and private
school prior to the wage cut, hence supporting the claim that observed differences in outcomes between public and private schools are not
due to group-specific shocks. 37 We do not include other school related characteristics since we only have this information for the year 2010. We will perform some tests
using this information and show these results in Appendix B.
15
because private schools are, on average, different than public schools along other dimensions, we conduct
additional estimations where, for a subsample of schools, we are able to control for student performance
measured prior to high-school admittance and we also use matched samples of private and public schools
to check our main results. Secondly, because a differential change in exam scores between public and
private school students might occur for reasons unrelated to corruption we, in section 5.2, discuss and
investigate a number of additional potential threats to the interpretation of our results.
4.2 Results from baseline estimations
In this section, we present the basic findings from estimating equation (1). Table 2 displays the DD
estimation results from our chosen baseline specification featuring the average grade (Panel A) and the
pass rate on the written Romanian exam (Panel B) as our main outcomes of interest. Columns (1) and (2)
present the DD estimates unconditional on pre-treatment dynamics, while columns (3)-(4) display the
estimated coefficients from the fully-interacted model. Columns (1)-(3) include school indicators, whereas
column (4) presents the estimates from the model with county fixed effects.38 All columns include year-
indicators and county indicators interacted with a time trend.
We note already in column (1) that for both outcomes, the DD estimate of the wage cut is positive and
statistically significant. When we add controls for school student composition, the DD-estimate increases
slightly. Focusing on the DD-estimates reported in column (2), we find that the average grade score has
increased with 0.27 points and the average pass rate has increased with 3.3 percentage points (a 3.7 percent
increase) for students in public schools relative to private schools, in 2010 compared to previous years.
Interpreting the estimate for the average grade score in terms of effect sizes, the size of the estimated effect
is equivalent to a 0.26 S.D. increase in scores on the Romanian exam (amounting to a 3.9 percent
increase).39
Identifying a causal effect of the wage cut on corruption through the DD estimate hinges crucially on the
parallel trend assumption. If exam scores would have increased more in public schools than in private
schools, even in the absence of the wage cut, our DD estimates would be too high. Column (3) in Table 2
presents estimates from regressions which allow for a flexible form of pre-treatment dynamics by
38 In all columns we use the same unbalanced panel. Estimates for the sample of schools with data in all years (balanced panel) are available
upon request. They are similar in magnitude to the results from the specifications with school fixed effects, but slightly less precisely
estimated. 39 The calculation of the effect size is based on the school-level distribution in exam outcomes reported in Table 1. If we instead use the
student-level distribution for the Romanian written exam (where the standard deviation is 1.674 in 2010s) we get the estimated effect to be
equivalent to a 0.16 S.D. increase in scores on the Romanian exam.
16
including the public-year interactions for 2008 and 2009 (the omitted year is 2007). For neither outcome
are the estimates for the 2009 and 2008 year-specific public indicators significantly different from zero.40
This suggests that public and private schools do not differ significantly in their evolution of exam scores
during the pre-treatment years, validating the parallel trend assumption.41 These results therefore lend
support to our hypothesis that the change in grades in public schools relative to private schools in 2010
relative to previous years not driven by different trends in the performance of the two types of schools,
but rather plausibly related to the wage cut through the increased incidence of corruption.42
Lastly, we note that the estimates in column (4) where we have replaced the school indicators with county
indicators generate larger estimates and similar standard errors relative to the first three columns.
5. Sensitivity analysis and alternative explanations
Because our identification strategy is based on observational data, it deviates from the ideal setting of a
randomized experiment. To consolidate the credibility of our findings, we perform some additional
analyses where we attempt to gauge the sensitivity of our results to using private schools as the control
group, and to eliminate some confounding factors and to build a compelling case against alternative
behavioral responses to the wage-cut news.
5.1 Are the treatment and control groups similar enough?
One could object that private schools are not an ideal control group to public schools and there is always
a possibility that the controls included in the specifications underlying the results above are insufficient to
adjust for such differences. Most importantly, the average exam scores and pass rates differ significantly
between public and private schools. Additionally, although probably of less importance, the control group
40 When we add more structure to the pre-treatment dynamics and replace 𝑃𝑢𝑏𝑙𝑖𝑐𝑠 ∙ 𝑦𝑟2009𝑡 and 𝑃𝑢𝑏𝑙𝑖𝑐𝑠 ∙ 𝑦𝑟2008𝑡 by the interaction of
𝑃𝑢𝑏𝑙𝑖𝑐𝑠 with a linear time trend, the estimate for 𝑃𝑢𝑏𝑙𝑖𝑐𝑠 ∙ 𝑦𝑟2010𝑡 decreases somewhat (to 0.251) and is statistically insignificant, but still
shows a large 2010 jump from what would be expected from the estimated trend which indicates an increase by 0.008 (for public relative to
private schools) for each year. 41 Note that the estimates for the 𝑃𝑢𝑏𝑙𝑖𝑐𝑠 ∙ 𝑦𝑟2008𝑡 interaction are large relative to 2007 and 2009 for both outcomes. However: (i) the 2010
DD estimate is significant and is the largest in magnitude, whereas the estimates for the pre-treatment interaction terms are always
insignificant; (ii) the estimates for the 𝑃𝑢𝑏𝑙𝑖𝑐𝑠 ∙ 𝑦𝑟2010𝑡 interaction term, are similar in models with and without pre-treatment dynamics. 42 The results shown in Table 2 are based on students in all high-school tracks. The theoretical tracks are generally the first choice for skilled
students in the admission to secondary education. In order to investigate the potentially differential impact across school tracks, we also
performed estimations separately, for theoretical and non-theoretical schools and we find a similar-sized contribution to the wage cut effect,
even though the effects for theoretical schools are imprecisely estimated. Finally, as already explained, we only focus on the written Romanian
exam because this is a standard exam for all children, regardless of the track and sub-track. Other exams, more specific for each track and
sub-track (e.g., some theoretical track students would take Mathematics difficulty 1 while others Mathematics difficulty 2; some would
choose between Physics and Chemistry), are more difficult to analyze.
17
(6% of the sample) is notably smaller than the treated group. To check if these issues are likely to bias our
baseline estimates we perform different sensitivity checks.
5.1.1. Estimations controlling for student performance prior to high-school admission
Our first exercise attempts to rule out the possibility that the DD estimate is driven by differential student
intake in the public and private schools in the 2010 cohort, and to tease out the effect of student
composition from the general public-private score gap. To do this, we make use of additional data
available from the Ministry of Education covering the high-school students’ gymnasium (5th-8th grade)
average graduation grade (i.e., the average of all scores from the grades 5 to 8) , which we refer to as
student ”ability” below.43 Unfortunately, this information is only available for the students that completed
gymnasium in 2004-2006 and were admitted to high schools, with standard admission procedures, in
2008-2010.44 Hence we rely on a smaller (and potentially slightly different) sample than for the baseline
estimates.
In Table 3 we show results for the average grade (Panel A) and the pass rate on the written Romanian
exam (Panel B) from estimating equation (1) for the years 2008-2010. We start in column (1) by
replicating the baseline estimates from Table 2 (the second specification), in column (2) we include
controls for the average initial ability of the students in each high-school and for the share of students per
school for whom we have information on ability, while in column (3) we add interactions with the 2010
year indicator.
First we note that, despite some potential change in the composition of schools for the years 2008-2010,
our results in column (1) are comparable with those in our main Table 2. Next, we learn that controlling
for student ability has little effect on the size of the DD estimate using the pass rate as the outcome, but
that the DD estimate using the average grade as an outcome which now becomes smaller and insignificant.
However, the specification underlying the estimates in column (2) is quite restrictive as it assumes that
student ability has the same impact on Baccalaureate outcomes in all years. This is especially problematic
43 This proxy should capture students’ true ability reasonably well. Firstly, because this measure captures all grades in all subjects during the
four years of middle school (gymnasium). Secondly, there are less incentives to inflate this grade through corruption as all students in
Romania are admitted into high-school, so this is not a high-stake grade as compared to e.g., the Baccalaureate (for more details about the
centralized transition between middle and high school, eighth to ninth grade, in Romania see Pop-Eleches and Urquiola, 2011). Furthermore,
as shown before, following the 2011 anti-cheating initiatives and threats (installing video cameras in schools during the exam, threatening
the staff with dismissal), the passing rate for the Baccalaureate failed with more than 45% in 2011 relative to before (see Borcan, Lindahl
and Mitrut, 2014),whereas the drop was much smaller (about 17%) for the 8th grade standardized evaluation. 44 Moreover, we do not have this information for around 60 schools, because the gymnasium performance is only made public by high schools
that organize a standard admission process, whereas some vocational and private schools have independent admission procedures.
18
since there are reasons to expect that the importance of ability for later outcomes differs depending on
how corrupt these outcomes are. Therefore, in column (3) we also interact student ability with the 2010
indicator. The result is then that the DD estimate is statistically significant and similar in size as in column
(1). This reassures us that the wage cut effect is independent of the initial ability and of the interaction of
the ability level with the exam structural changes in 2010 (i.e., a potentially more favorable response of
higher-ability students to the increase in exam difficulty).45 This means that we are able to pin down what
typically distinguishes public and private schools and to ensure that the DD estimate is not driven by any
difference in student composition. Finally, we note that the coefficient of the interaction between average
school ability and the 2010 indicator is negative and significant, while ability itself has a large positive
coefficient. This means that in 2010, ability has a lower impact on exam outcomes, while being in a public
school in the same year, conditional on ability, has a larger impact on exam outcomes than in previous
years. Results in Panel B for the pass rate outcome have a similar pattern as those shown above for the
average written Romanian. Overall, these findings seem to support our hypothesis that the DD estimate
captures an increase in corruption in public relative to private schools.
5.1.2 Evidence from matched public and private schools
With our next exercise we addresses the potential concerns that the public schools included in the
treatment group might not have comparable private schools. Because we do not have enough pre-treatment
school level information we attempt to match public to private schools using exam scores in 2007-2009
(to capture both the levels and the trend), student composition in terms of share of poor students and the
gender split, track, and county.46 As we match on pre-treatment outcomes, our strategy here is to simply
compare the matched public and private school outcomes for the year 2010. Results are reported in Table
4. In column (1) we show the resulting matching estimates without any controls, while in columns (2) and
(3) we add the student composition controls and the theoretical track indicator. The estimates in the first
two columns are somewhat bigger than our baseline DD-estimates reported in Table 2. When we add
controls for the exam scores prior to 2010 (in column 3) and also county fixed effects (in column 4), we
learn that the matching estimates decrease quite a lot. However, since the precision also increases, we still
obtain statistically significant positive estimates for both outcomes when including the full set of controls.
45 Additionally, from county fixed effects estimations not reported here we see that controlling for average ability seems to reduce the
public-private gap before 2010. 46 We use nearest neighborhood and 1-to-1 matching (without replacement) to match a public to each private school. Our matching is done
using the psmatch2 command in STATA (Leuven and Sianesi, 2003)
19
The magnitude of the estimates is also quite similar to our baseline DD-estimates, thus matching
techniques are reassuring in what concerns our baseline parametric estimates.
5.1.3 Examination centers with both private and public schools
Finally, we also limit the sample to schools in examination centers where there was at least one private
school and estimate regressions similar to our baseline.47 These results are reported in the Appendix (Table
A1) and are in line with our main results in Table 2. We also include examination center indicators to
control for unobservables at the center level (location, size – related to the number of schools and,
implicitly, to the collective bribe). This could potentially rule out collective bribe for schools, some of
which are assigned to the same exam center. That estimates do not change with the inclusion of
examination fixed effects, suggests that individual bribes are the main mechanism for why we find the
wage cut to increase the corrupted exam scores.
5.2 Alternative Explanations
Because, like most of the previous work, we do not have a direct measure of bribes, in this section we
discuss some potential confounding explanations that could bias our main estimates. In particular,
students, parents, teachers, proctors and/or exam committee members may respond to the wage cut
announcement in ways that are actually unrelated to corruption, but that can nevertheless impact scores
on the exam taken in June. Another concern is related to other possible exogenous macro-level shocks
incurred in 2010 (or before) that may differentially affect public and private schools students or teachers,
and that, in turn, would impact differently the exam scores. In addition, the Baccalaureate exam changed
in 2010. Although we cannot provide fully conclusive evidence, in what follows we attempt to discuss all
these alternative explanations that may bias / confound our main results.
5.2.1 Exploring the regional variation in corruption
One ideal setting to test these concerns would be to estimate equation (1), for the same time period, in a
setting where there is no corruption in education, but where circumstances are otherwise identical. While
the nature of the policy we analyze precludes us from finding and using such a setting, we can still use
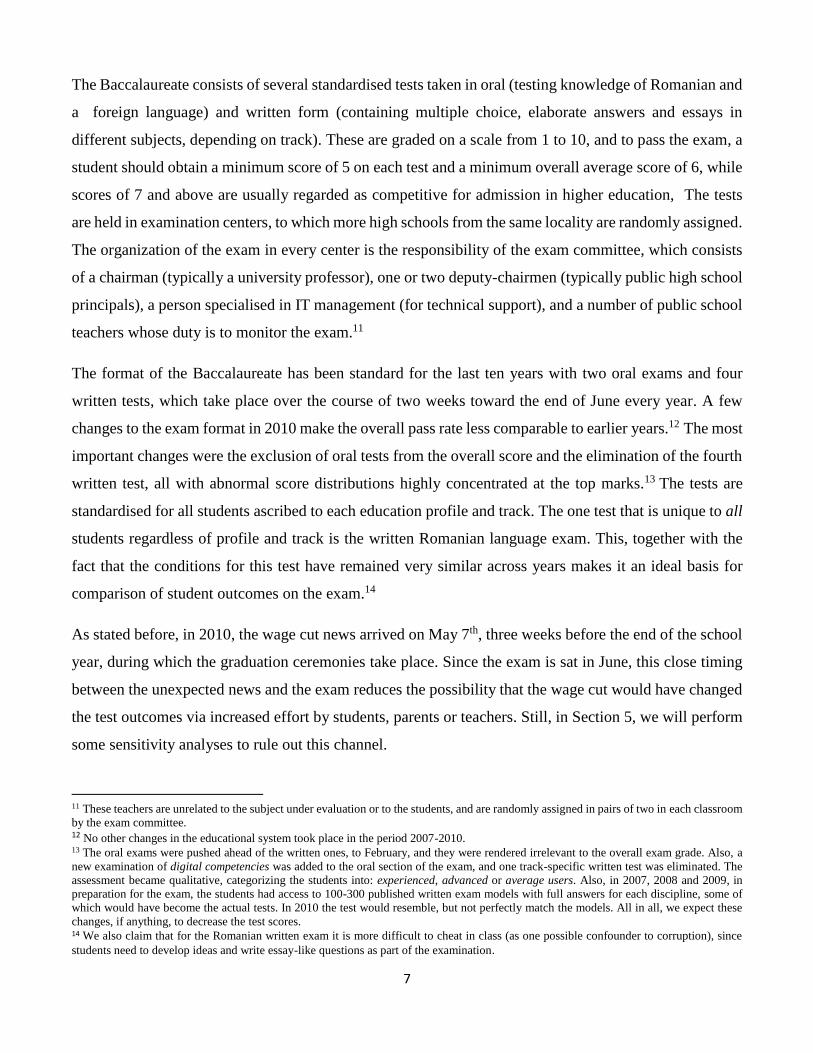
the variation in corruption at the county level in Romania. In Figure 2 we show the county-level variation
in corruption as proxied by the frequency of payment of bribes and gifts in the public education system.
47 For this exercise, we have identified on a case-by-case basis the school composition of centers to which at least one private school was
assigned each year. The percentage of private school students in this sample is about 25%.
20
In particular, we use the Life in Transition Survey (2010) and aggregate the scores assigned to responses
to the question “In your opinion, how often do people like you have to make unofficial payments or gifts
in these situations?”, considering only the situations regarding the receipt of public education.48 Using
these aggregate scores, we divide counties into more and less corrupt if they situate above/below the
median corruption. Next, we estimate our model separately for most and the least corrupted counties in an
attempt to check whether the wage cut impact is differential across counties. If other exogenous shocks
(e.g., macro-level shocks) or other responses (e.g., change of effort or cheating not related to corruption)
had a similar impact across all counties, significant estimates exclusively in the more corrupted counties
would support the corruption channel.
In Table 5, Panel A for the average grade at the written Romanian exam and Panel B for the share of
students passing the written Romanian exam, we find that our positive interaction effects are driven by
effects in the most corrupted counties, while the estimates in the least corrupted counties are much smaller
and never statistically significant.49 The challenge with this exercise is that corruption may be correlated
with factors that may have also affected the performance of the students differently. Indeed, , investigating
other county level characteristics reveals that richer counties (higher GDP, less poverty, less
unemployment) tend to be more corrupt, but also that less trust in justice and people is associated with
more corruption. These other factors could lie behind the difference in performance across counties, so
this split by corruption level cannot fully dismiss alternative explanations. We discuss these confounding
stories in more detail below.
5.2.2. Some Alternative Explanations
We have discussed the overall economic context in 2010 (see section 2) and particularly the fact that the
international financial crisis was taken lightly in Romania. Indeed, the autumn 2008 and 2009 Euro-
barometer showed that more than half of the Romanian respondents anticipated no change and some even
expected an improvement in the general economic situation of the country.50 As such, we believe it is
48 The “Life in Transition survey, After the Crisis” (LiTS II, 2010), was the second public attitudes survey conducted jointly by the European
Bank for Reconstruction and Development and the World Bank. It surveyed 39,000 households in 34 countries, including Romania. The goal
was to assess “public attitudes, well-being and the impacts of economic and political change” (www.ebrd.com), particularly those brought
by the financial crisis. The survey is nationally representative, conducted face-to-face on samples of randomly chosen 1000 households from
each country. 49 These results are robust when using alternative measures of county-level corruption. In particular, we constructed a proxy based on the
share of people having an informal network, at the county level, based on a question from the 2007 Romanian Barometer of Public Opinion:
“Is there anyone (i.e., informal network) that could “help” you solve (i.e., informally): issues in court/trials, medical problems, city hall,
police, or issues related to the local authorities.” The results, available in the online appendix B (Table B2) are similar to those in Table 5. 50 http://ec.europa.eu/public_opinion/cf/:“What are your expectations for the year to come with respect to the economic situation of your
country (Romania).”
21
reasonable to assume that the austerity measures were not anticipated, neither in their unprecedented scope
and magnitude, nor their timing. However, below we discuss how the overall macroeconomic situation
or other mechanisms, like the changes in the exam structure, can affect proctors, evaluators, educators
and/or students efforts’ and which, in turn, can confound our main results.
i) Proctors’ effort is a potential confounding story, particularly if the proctors decreased their effort
following the wage cut or the overall economic situation, resulting in more students cheating during the
2010 exam compared to previous years. This may have a stronger effect, on average, on the public
students, if they are more predisposed to cheating. To shed light on this issue, we employ our main strategy
on a measure of the share of students caught cheating (in class) and expelled from the exam, from the total
number of students taking the exam (at the school level). The interaction term between the public and the
year indicators is never significant in Table 6, which seems to support that, indeed, what we measure is
not a change in in-class cheating.
ii) Evaluators’ effort may have also changed (as a result of the wage shock and/or the macro conditions),
in that they may have potentially decreased effort when evaluating the exams. If this was the case, we
expect this to be particularly relevant for the students who were on the verge of passing.51 The minimum
requirements for passing each test and the overall exam are 5 and 6, respectively. Therefore, if there were
proportionally more public than private students with scores 5-6, a less stringent assessment in 2010 could
favor the public students, conducing to the observed average difference in outcomes. Then, in 2010, we
would expect, on average, more public than private students passing the written Romanian exam with
scores 5-6. To check this channel we consider in Table 7 a new outcome - the share of students, at the
school level, that passed the written Romanian exam with scores above 5 and below 7. Indeed, the
interaction term between the public and the year indicators is only significant in the first two columns, and
if anything, it is negative (Panel A), dismissing the story about marginal improvement of public students’
scores due to a change in evaluators’ assessment effort. Interestingly, in Panel B of the same table we
show that the only positive significant increase for the public students relative to their private peers, in
2010 relative to the previous years, is found at the upper tail of the scores distribution, for scores of 7 and
above (within this range of scores, students would be competitive enough for admission into higher
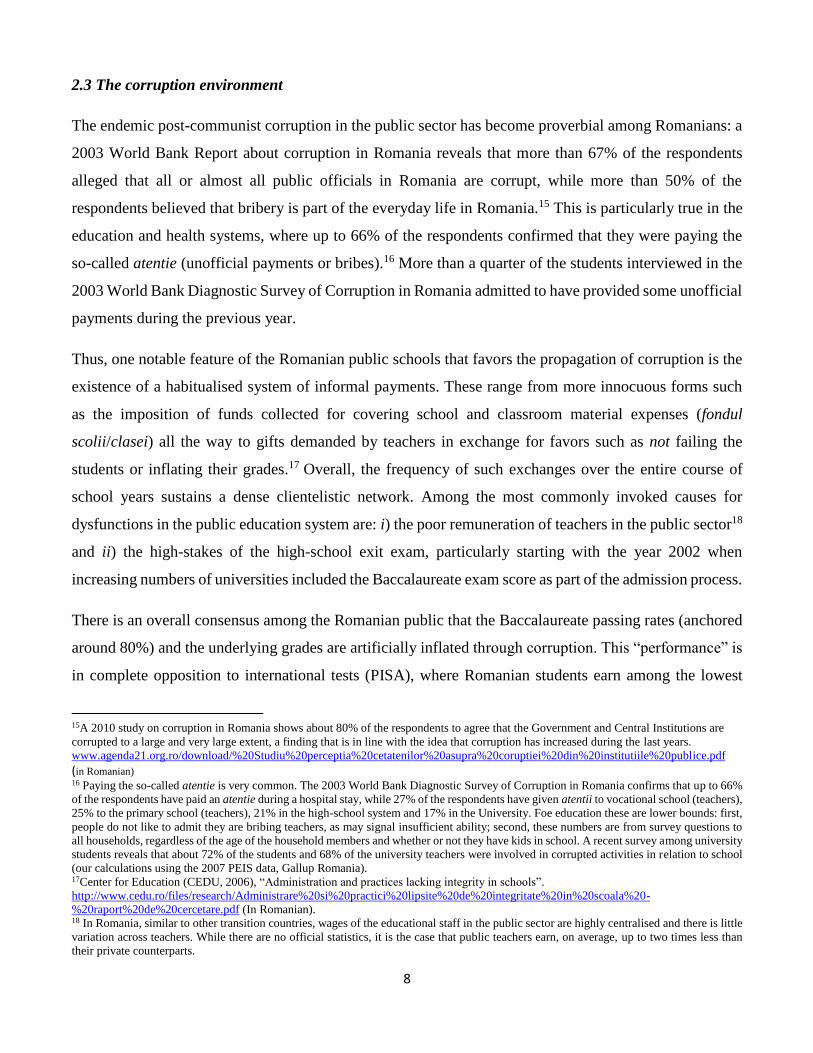
education, so there are higher stakes from achieving these scores). In Figure 3 we show, separately by
year, the average school shares of students attaining scores in each one of six categories: below 5, 5-5.99,
51 The implicit assumption here is that students who fail to pass a test (with score 5) or the overall Baccalaureate (with score 6) are more
likely to appeal and/or re-take the exam in August, implying more effort.
22
6-6.99, 7-7.99, 8-8.99 and 9-10, for public and private schools, respectively. Public and private schools
differ at competitive scores (7 and above) in 2010 relative to before (particularly 2009 and 2007): while
for private schools there is a slight decrease in the average student share in this range, for public schools
the average shares in segments 7-7.99 and 8-8.99 are larger. For the scores 5-6.99, the average shares in
private schools are quite stable across years, while they are somewhat lower for public schools in 2010.
Overall both a decrease in the scores for the private schools and an increase in the scores for the public
schools have contributed to the main differences observed in 2010. The figure therefore corroborates the
results in Table 7. This is also partly supported by anecdotal evidence that the Xeroxed exams helped
students to achieve competitive scores of 7 and above.52 Finally, we note that the average school shares
of students below 5 is lowest in public and highest in private schools in 2010.
iii) Educators’ effort in teaching activities could be affected by the substantial wage cut and/or by the
overall economic context. We dismiss the former channel because the courses were already finished at the
time of the wage cut announcement. Moreover, if anything, a lower teacher wage would likely lead to
lower student achievement, which would mean that we would underestimate our main effect estimates.
However, the overall economic context may have changed the educators’ effort. Particularly worrisome
for our interpretation is whether the educators have increased effort during in-class teaching in the months
before the wage cut, differentially in public and private schools. 53 Moreover, because our main effect
seem to come from the upper part of the grade distribution, this would mean that only competitive students
were affected by the possible change in educators’ effort. Overall, this remains a channel that we cannot
completely dismiss.
iv) Students’ effort may have also been affected by the changes in 2010 not directly related to the wage
cut policy. For instance, the marginal benefits of going to college may have changed as a result of the
2010 macroeconomic context which, in turn, may have changed the incentives of students to study for
the Baccalaureate. If the returns of going to college increased relatively more for the public than for the
private students, the former may have put additional effort in passing the exam.54 Below we outline some
52 In the wake of corruption trials, student testimonies confirm that bribes were paid to ensure a score of 7 and above.
Source: http://adevarul.ro/news/eveniment/dimitrie-bolintineanu-1_51d31f61c7b855ff56f42753/index.html (In Romanian) 53 Alternatively, teachers may have reacted to the unstable economic situation by increasing the supply of private tutoring which would result
in better outcomes for students. We have looked into the 2008-2010 Romanian Household Budget Survey and, albeit a very small sample,
we find no change in the share of students taking private tutoring in 2010 vs. 2009 and 2008. 54 Another reason for the students’ effort to evolve differently between the public and private school students is if their parents are affected
differently by the wage cut (if e.g., the public school students are more likely to have parents employed in the public sector ). Even if this is
the case, it is not obvious in what direction this would affect our estimates: parents affected by the wage cut might be more willing to pay
bribes in order to avoid future university fees for their children or, lower incomes means there are less available resources to be spent on
bribes. Because we are lacking data on the occupations of the parents, we are not able to investigate this issue. In addition to the issue about
23
conceivable “symptoms” of the change in students’ incentives, which may confound our interpretation of
the results:
a) Changes in student selection (either with respect to the share of exam takers or the students’
background) related to changes in students’ incentives: One concern is the differential evolution
in the share of public and private students taking the Baccalaureate. Lack of data about the number
of graduates prevents us from constructing an accurate measure of the dropout rates over time.
Using a rather restrictive proxy, we see that the share of 12th graders enrolled in the final exam
sustained a larger increase in private than in public schools.55 Even if this were accurate, this would
be unlikely to have happened on grounds of the wage cut (announced on May 7th 2010), since the
exam registration period was December 2009. However, the dropout rates may be affected by the
overall economic conditions. This would be a problem for our estimates if marginal students were
of lower ability: we might suspect exam scores could decrease more in private than in public
schools in 2010 relative to before, partly because of changed composition of students. For lack of
accurate dropout rates before 2010, we cannot control for the share of exam takers in the
regressions, which would account for a variety of unobserved factors to do with motivation. Still,
we can at least include in our regressions a proxy for family income as an additional control, as a
way to partially control for students’ selection. For instance parent’s income may determine a
change in the motivation on whether to invest in education and exert effort, particularly during an
economic downturn. If, for instance, fewer low- income students take the exam, discouraged by
the economic turmoil, then this would affect only the public schools, potentially generating the
results we see. And similar arguments in the opposite direction could be made. Our strategy to deal
with this issue is to control in all our regressions for the share of poor students among the students
student effort, if, for example, students fear that the evaluators will be more demanding in 2010 as a behavioral reaction to the wage cut
because both public and private students are graded by public teachers, their level of awareness should be the same. Thus, their incentives to
invest in marginally more preparation, either individual or through potential private tutoring, should not differ. We have looked into the 2008-
2010 Romanian Household Budget Survey and, albeit a very small sample, we find no change in the share of students taking private tuition
in 2010 vs. 2009 and 2008. 55 Our preferred proxy suggests that the share of exam takers has increased from 2007 to 2010: the shares are 0.85, 0.90, 0.89 and 0.91 in
public schools and 0.68, 0.60, 0.68 and 0.81 in private schools, for the years 2007, 2008, 2009 and 2010, respectively. These numbers are
calculated in the following way: We know how many students took the Baccalaureate exam, but do not know how many students are enrolled
in high school and decide not to take the exam. Also, we know how many students in each school graduated from high school (graduation
is based on course work during the four years of high school and is decided about one month before the Bac exam) in 2010, but not for earlier
years (since we only have HS graduation data for 2010). The best we can do is to assume that high school graduation is constant over time,
and use the number of graduates per school in 2010 as the denominator. This makes it possible to approximate the fraction taking the
Baccalaureate (out of the total number of graduates) in each year for each school. Note that we are getting that the share of exam takers is
above 100% for about 10 percent of the schools (we have then restricted these schools to have a share equal to one). Also note that, by
construction, this preferred proxy is of lower quality in the years before 2010.
24
who take the exam in each school, a variable which we have yearly data for. Thus, we ensure that
our results are not explained by the income composition.
b) Changes in students’ effort resulting from macroeconomic conditions. As described above,
survey evidence indicates that in December 2009 Romanians anticipated no change or even
expected an improvement in the general economic situation of the country. Despite this, we cannot
exclude that the worsening of the macroeconomic climate may have affected the students’
marginal benefits of going to college. If students in public and private schools differ along
characteristics like ability and income, the marginal cost of effort may differ across schools.
Students with a lower marginal cost of effort are likely to respond more to changes in the returns
to education. The variation in the marginal cost of effort that comes from variation in income can,
at least partially, be dealt with by controlling for the school share of poor students, our proxy for
income. Another part of this variation can be explained by students’ ability . Using the students’
ability proxy, in Table 3 we control for differences in ability and their interaction with the year
2010 indicator (containing all general changes) which should capture partially the interaction
between ability and the 2010 marginal costs of effort. The effect of being a public student in 2010
is very similar in regressions with and without ability controls (columns 1 and 3). However, this
test cannot fully dismiss the interaction between the macroeconomic changes and other unobserved
characteristics in public and private school students.
c) Changes in students’ effort (and teachers’ reactions) resulting from the 2010 changes in the
Baccalaureate exam. As some subject tests were no longer included in the Baccalaureate exam in
2010, the Romanian written test became relatively more important. As a result, students may have
put additional effort in studying for the Romanian written test. While we do control for students’
ability and a family income proxy, this may still be a valid argument that may potentially confound
our results. 56 However, without more detailed individual level data it remains difficult to show
conclusive evidence to dismiss this channel.
v) Finally, we acknowledge that the deterioration of the country’s economic situation may have generated
an increase in corruption directly, not necessarily via the wage cut. This possibility cannot be dismissed,
56 In an attempt to dismiss the wage cut anticipation effects on students’, parent’ or teachers’ efforts due to changes in the exam structure, we
consider the no-stake oral Romanian exam held only in February 2010. For this year we compare public and private students’ scores and we
find that the significant positive gap between them disappears when we control for previous performance (scores 5-8th grades). Despite this,
the possibility remains that students simply reacted differently to the overall changes in exam format in 2010.
25
despite survey evidence indicating that most Romanians were optimistic about the overall economic
situation of Romania prior to the austerity measures in May 2010. In particular, if public teachers
perceived and resented the general economic deterioration more acutely than the private teachers, they
may have been more tempted to resort to illicit incomes regardless of the pay cut. In this case, the estimates
here still reflect a story of economic adversity and corruption, but causality runs from the general economic
depression rather than reduced bureaucrats’ compensation per se.
6. Conclusion
This study responds to the imperative call for diagnosing the causes of corruption, particularly those
stemming from the financial incentives of civil servants. We exploit an unexpected wage cut of 25%
incurred by the entire public sector in 2010, to investigate the causal relationship between wage loss and
the intensity of corruption. We base our analysis in the educational system, which was largely affected by
the reduction in wages. Using data from the national Romanian Baccalaureate exam, we employ
Difference-in-differences strategies and estimate the effect of the wage cut on exam outcomes in the public
schools, in comparison with private schools which did not experience any wage shock. Our estimates
show that the wage cut caused a disproportionate change in average grades and passing rates in public
high schools relative to private ones between 2010 and previous years. We attribute the estimated
increased difference in exam outcomes between public and private schools to an intensification of corrupt
activity by public school staff that is related to the wage loss. Our conclusion is also supported by the fact
that we find no significant effects of the public school indicator for the pre-treatment years, and a series
of tests which rule out some confounding stories. However, we need to be cautious when interpreting the
main results because, as emphasized in the previous section, there are several channels that may confound
the interpretation of our main mechanism.
Our results provide a snapshot of the undesired impact the policies of budget contraction had on the illicit
behavior of affected agents, which is of particular relevance in the context of the recent adoption of
austerity measures by post-crisis financially distressed EU members. Such drastic types of reductions in
public spending are particularly dangerous in vulnerable environments that are already predisposed to
corruption.
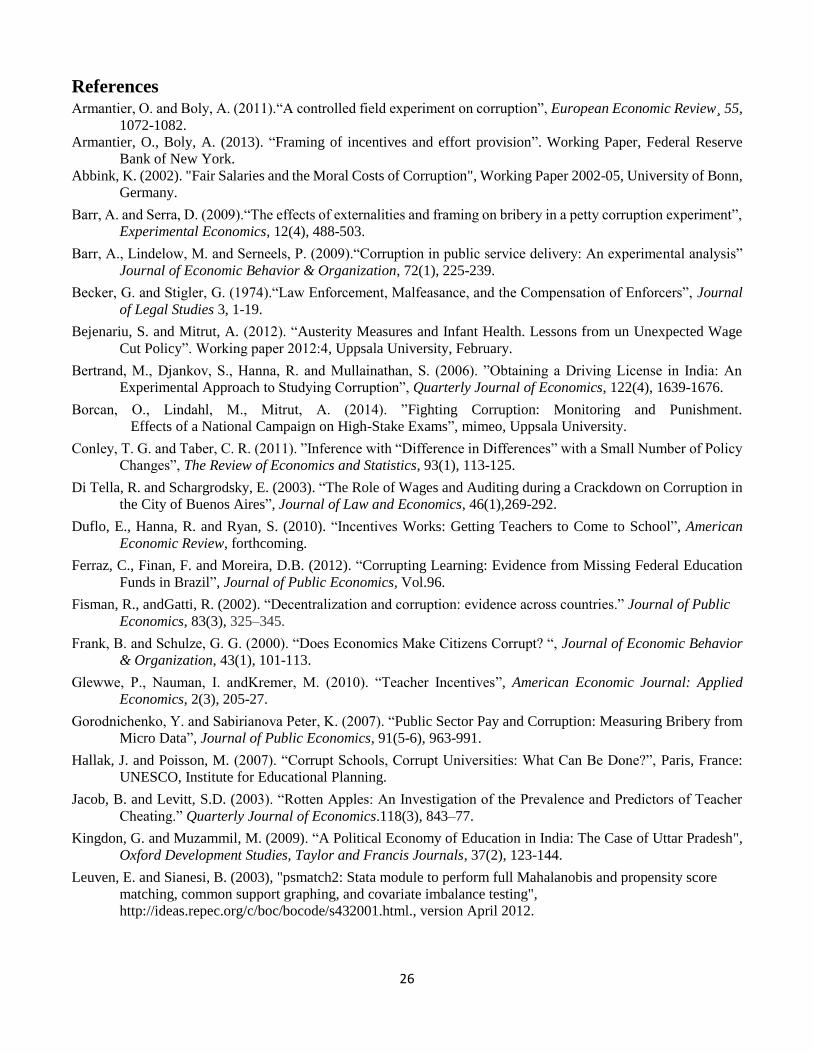
26
References Armantier, O. and Boly, A. (2011).“A controlled field experiment on corruption”, European Economic Review¸ 55,
1072-1082.
Armantier, O., Boly, A. (2013). “Framing of incentives and effort provision”. Working Paper, Federal Reserve
Bank of New York.
Abbink, K. (2002). "Fair Salaries and the Moral Costs of Corruption", Working Paper 2002-05, University of Bonn,
Germany.
Barr, A. and Serra, D. (2009).“The effects of externalities and framing on bribery in a petty corruption experiment”,
Experimental Economics, 12(4), 488-503.
Barr, A., Lindelow, M. and Serneels, P. (2009).“Corruption in public service delivery: An experimental analysis”
Journal of Economic Behavior & Organization, 72(1), 225-239.
Becker, G. and Stigler, G. (1974).“Law Enforcement, Malfeasance, and the Compensation of Enforcers”, Journal
of Legal Studies 3, 1-19.
Bejenariu, S. and Mitrut, A. (2012). “Austerity Measures and Infant Health. Lessons from un Unexpected Wage
Cut Policy”. Working paper 2012:4, Uppsala University, February.
Bertrand, M., Djankov, S., Hanna, R. and Mullainathan, S. (2006). ”Obtaining a Driving License in India: An
Experimental Approach to Studying Corruption”, Quarterly Journal of Economics, 122(4), 1639-1676.
Borcan, O., Lindahl, M., Mitrut, A. (2014). ”Fighting Corruption: Monitoring and Punishment.
Effects of a National Campaign on High-Stake Exams”, mimeo, Uppsala University.
Conley, T. G. and Taber, C. R. (2011). ”Inference with “Difference in Differences” with a Small Number of Policy
Changes”, The Review of Economics and Statistics, 93(1), 113-125.
Di Tella, R. and Schargrodsky, E. (2003). “The Role of Wages and Auditing during a Crackdown on Corruption in
the City of Buenos Aires”, Journal of Law and Economics, 46(1),269-292.
Duflo, E., Hanna, R. and Ryan, S. (2010). “Incentives Works: Getting Teachers to Come to School”, American
Economic Review, forthcoming.
Ferraz, C., Finan, F. and Moreira, D.B. (2012). “Corrupting Learning: Evidence from Missing Federal Education
Funds in Brazil”, Journal of Public Economics, Vol.96.
Fisman, R., andGatti, R. (2002). “Decentralization and corruption: evidence across countries.” Journal of Public
Economics, 83(3), 325–345.
Frank, B. and Schulze, G. G. (2000). “Does Economics Make Citizens Corrupt? “, Journal of Economic Behavior
& Organization, 43(1), 101-113.
Glewwe, P., Nauman, I. andKremer, M. (2010). “Teacher Incentives”, American Economic Journal: Applied
Economics, 2(3), 205-27.
Gorodnichenko, Y. and Sabirianova Peter, K. (2007). “Public Sector Pay and Corruption: Measuring Bribery from
Micro Data”, Journal of Public Economics, 91(5-6), 963-991.
Hallak, J. and Poisson, M. (2007). “Corrupt Schools, Corrupt Universities: What Can Be Done?”, Paris, France:
UNESCO, Institute for Educational Planning.
Jacob, B. and Levitt, S.D. (2003). “Rotten Apples: An Investigation of the Prevalence and Predictors of Teacher
Cheating.” Quarterly Journal of Economics.118(3), 843–77.
Kingdon, G. and Muzammil, M. (2009). “A Political Economy of Education in India: The Case of Uttar Pradesh",
Oxford Development Studies, Taylor and Francis Journals, 37(2), 123-144.
Leuven, E. and Sianesi, B. (2003), "psmatch2: Stata module to perform full Mahalanobis and propensity score
matching, common support graphing, and covariate imbalance testing",
http://ideas.repec.org/c/boc/bocode/s432001.html., version April 2012.
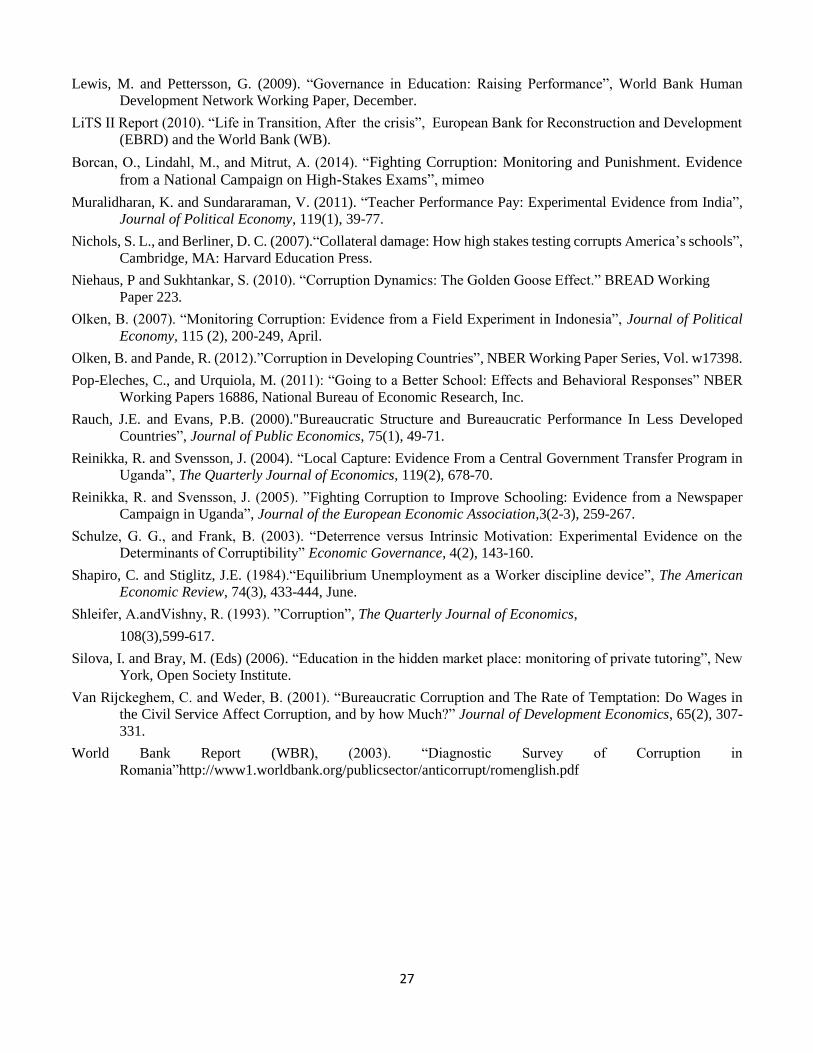
27
Lewis, M. and Pettersson, G. (2009). “Governance in Education: Raising Performance”, World Bank Human
Development Network Working Paper, December.
LiTS II Report (2010). “Life in Transition, After the crisis”, European Bank for Reconstruction and Development
(EBRD) and the World Bank (WB).
Borcan, O., Lindahl, M., and Mitrut, A. (2014). “Fighting Corruption: Monitoring and Punishment. Evidence
from a National Campaign on High-Stakes Exams”, mimeo
Muralidharan, K. and Sundararaman, V. (2011). “Teacher Performance Pay: Experimental Evidence from India”,
Journal of Political Economy, 119(1), 39-77.
Nichols, S. L., and Berliner, D. C. (2007).“Collateral damage: How high stakes testing corrupts America’s schools”,
Cambridge, MA: Harvard Education Press.
Niehaus, P and Sukhtankar, S. (2010). “Corruption Dynamics: The Golden Goose Effect.” BREAD Working
Paper 223.
Olken, B. (2007). “Monitoring Corruption: Evidence from a Field Experiment in Indonesia”, Journal of Political
Economy, 115 (2), 200-249, April.
Olken, B. and Pande, R. (2012).”Corruption in Developing Countries”, NBER Working Paper Series, Vol. w17398.
Pop-Eleches, C., and Urquiola, M. (2011): “Going to a Better School: Effects and Behavioral Responses” NBER
Working Papers 16886, National Bureau of Economic Research, Inc.
Rauch, J.E. and Evans, P.B. (2000)."Bureaucratic Structure and Bureaucratic Performance In Less Developed
Countries”, Journal of Public Economics, 75(1), 49-71.
Reinikka, R. and Svensson, J. (2004). “Local Capture: Evidence From a Central Government Transfer Program in
Uganda”, The Quarterly Journal of Economics, 119(2), 678-70.
Reinikka, R. and Svensson, J. (2005). ”Fighting Corruption to Improve Schooling: Evidence from a Newspaper
Campaign in Uganda”, Journal of the European Economic Association,3(2-3), 259-267.
Schulze, G. G., and Frank, B. (2003). “Deterrence versus Intrinsic Motivation: Experimental Evidence on the
Determinants of Corruptibility” Economic Governance, 4(2), 143-160.
Shapiro, C. and Stiglitz, J.E. (1984).“Equilibrium Unemployment as a Worker discipline device”, The American
Economic Review, 74(3), 433-444, June.
Shleifer, A.andVishny, R. (1993). ”Corruption”, The Quarterly Journal of Economics,
108(3),599-617.
Silova, I. and Bray, M. (Eds) (2006). “Education in the hidden market place: monitoring of private tutoring”, New
York, Open Society Institute.
Van Rijckeghem, C. and Weder, B. (2001). “Bureaucratic Corruption and The Rate of Temptation: Do Wages in
the Civil Service Affect Corruption, and by how Much?” Journal of Development Economics, 65(2), 307-
331.
World Bank Report (WBR), (2003). “Diagnostic Survey of Corruption in
Romania”http://www1.worldbank.org/publicsector/anticorrupt/romenglish.pdf
28
Figure 1. Upper secondary graduation and PISA tests, country ranking Figure 1A.
Figure 1B.
Notes: our calculations using the UNESCO Institute for Statistics data from 2009 (available at
http://www.uis.unesco.org/Education) and the 2009 PISA reading test scores (available at
http://www.oecd.org/pisa/pisaproducts/pisa2009keyfindings.htm). Please note that: 1) we have used all European
countries for which we have both information on upper secondary graduation rates and PISA 2009 tests; 2) Romania
scores last and similar figure (1B) would have been obtained if using the mathematics or science tests scores.
0
10
20
30
40
50
60
70
80
90
100
Upper secondary graduation rates (all tracks) in 2009, by country
380
400
420
440
460
480
500
520 2009 PISA reading test scores, by country
29
Figure 2.
Source: our calculations using the 2010 Life in Transition Surveys. We use the question: “In your opinion, how
often do people like you have to make unofficial payments or gifts in these situations?”, focusing only on the
receipt of public education. The answers are scored 1-5 where 1 corresponds to “never” and 5 to “always”. For
each county we display the average over all respondents’ scores within the respective county.
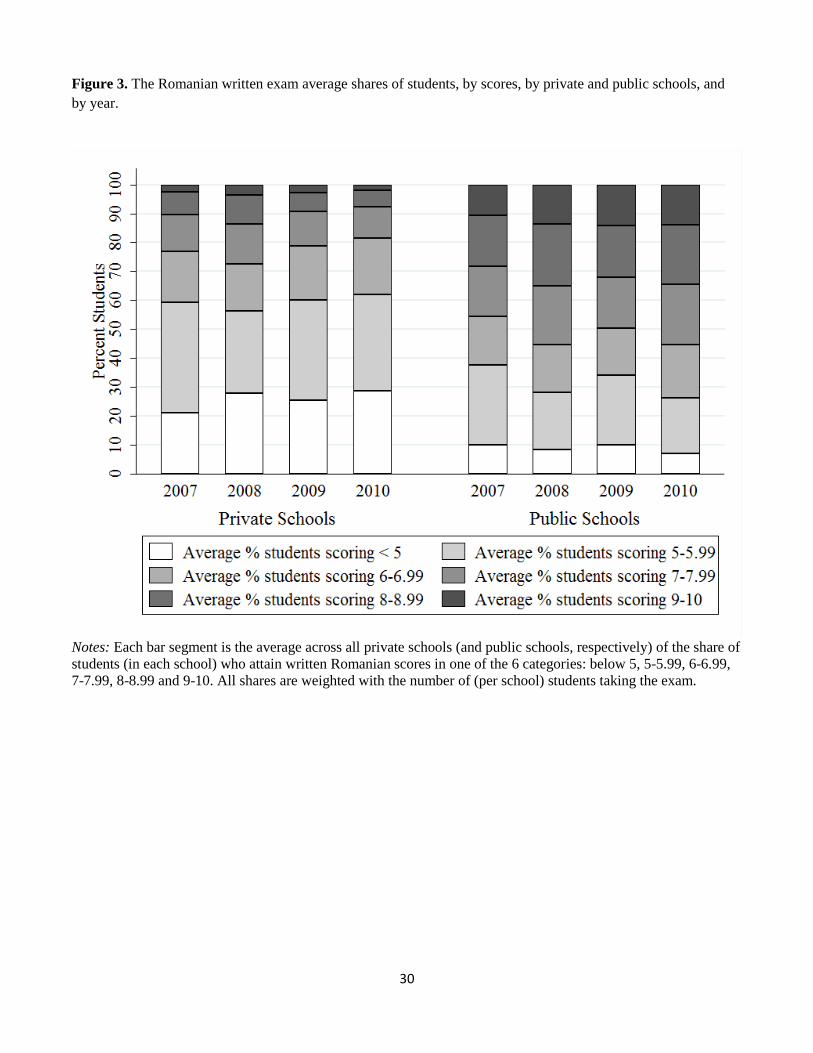
30
Figure 3. The Romanian written exam average shares of students, by scores, by private and public schools, and
by year.
Notes: Each bar segment is the average across all private schools (and public schools, respectively) of the share of
students (in each school) who attain written Romanian scores in one of the 6 categories: below 5, 5-5.99, 6-6.99,
7-7.99, 8-8.99 and 9-10. All shares are weighted with the number of (per school) students taking the exam.
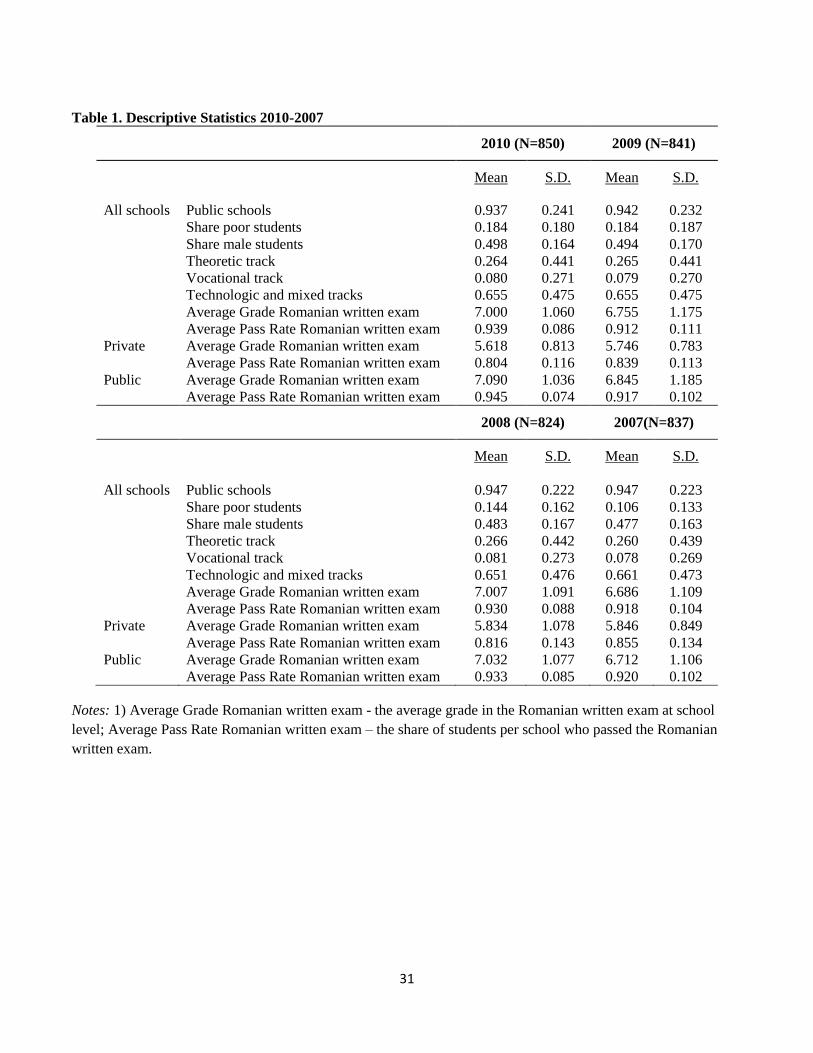
31
Table 1. Descriptive Statistics 2010-2007
2010 (N=850) 2009 (N=841)
Mean S.D. Mean S.D.
All schools Public schools 0.937 0.241 0.942 0.232
Share poor students 0.184 0.180 0.184 0.187
Share male students 0.498 0.164 0.494 0.170
Theoretic track 0.264 0.441 0.265 0.441
Vocational track 0.080 0.271 0.079 0.270
Technologic and mixed tracks 0.655 0.475 0.655 0.475
Average Grade Romanian written exam 7.000 1.060 6.755 1.175
Average Pass Rate Romanian written exam 0.939 0.086 0.912 0.111
Private Average Grade Romanian written exam 5.618 0.813 5.746 0.783
Average Pass Rate Romanian written exam 0.804 0.116 0.839 0.113
Public Average Grade Romanian written exam 7.090 1.036 6.845 1.185
Average Pass Rate Romanian written exam 0.945 0.074 0.917 0.102
2008 (N=824) 2007(N=837)
Mean S.D. Mean S.D.
All schools Public schools 0.947 0.222 0.947 0.223
Share poor students 0.144 0.162 0.106 0.133
Share male students 0.483 0.167 0.477 0.163
Theoretic track 0.266 0.442 0.260 0.439
Vocational track 0.081 0.273 0.078 0.269
Technologic and mixed tracks 0.651 0.476 0.661 0.473
Average Grade Romanian written exam 7.007 1.091 6.686 1.109
Average Pass Rate Romanian written exam 0.930 0.088 0.918 0.104
Private Average Grade Romanian written exam 5.834 1.078 5.846 0.849
Average Pass Rate Romanian written exam 0.816 0.143 0.855 0.134
Public Average Grade Romanian written exam 7.032 1.077 6.712 1.106
Average Pass Rate Romanian written exam 0.933 0.085 0.920 0.102
Notes: 1) Average Grade Romanian written exam - the average grade in the Romanian written exam at school
level; Average Pass Rate Romanian written exam – the share of students per school who passed the Romanian
written exam.
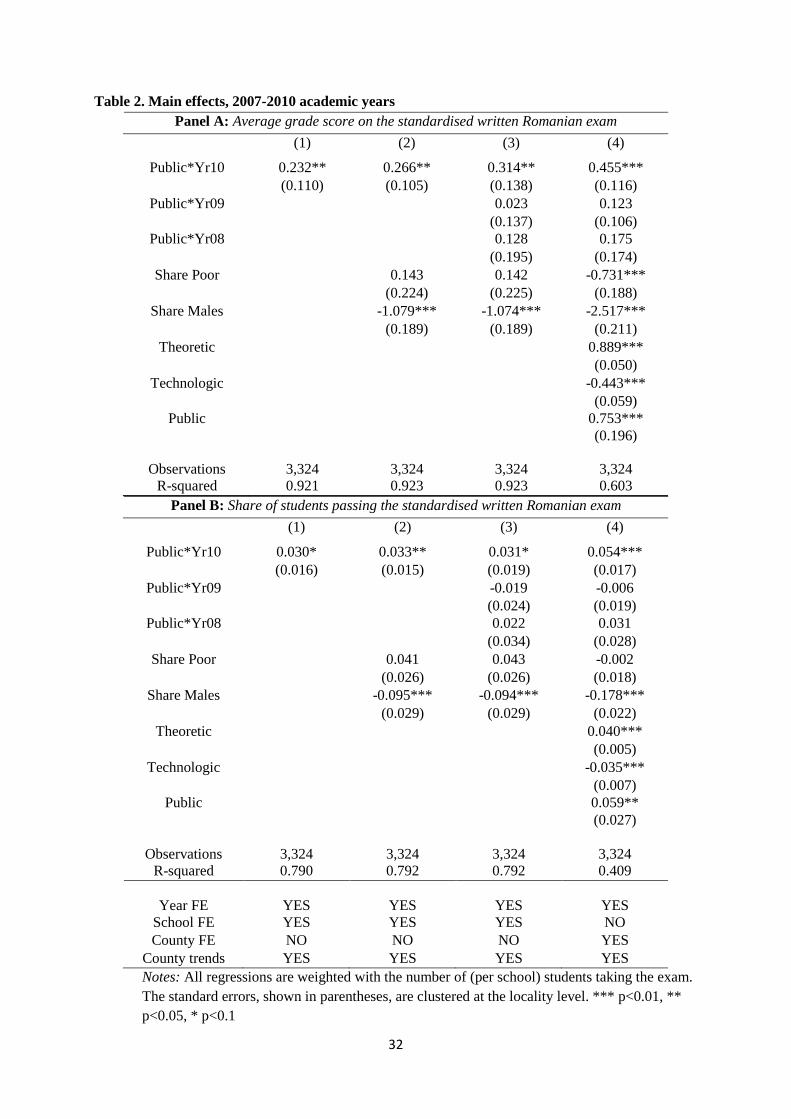
32
Table 2. Main effects, 2007-2010 academic years
Panel A: Average grade score on the standardised written Romanian exam
(1) (2) (3) (4)
Public*Yr10 0.232** 0.266** 0.314** 0.455***
(0.110) (0.105) (0.138) (0.116)
Public*Yr09 0.023 0.123
(0.137) (0.106)
Public*Yr08 0.128 0.175
(0.195) (0.174)
Share Poor 0.143 0.142 -0.731***
(0.224) (0.225) (0.188)
Share Males -1.079*** -1.074*** -2.517***
(0.189) (0.189) (0.211)
Theoretic 0.889***
(0.050)
Technologic -0.443***
(0.059)
Public 0.753***
(0.196)
Observations 3,324 3,324 3,324 3,324
R-squared 0.921 0.923 0.923 0.603
Panel B: Share of students passing the standardised written Romanian exam
(1) (2) (3) (4)
Public*Yr10 0.030* 0.033** 0.031* 0.054***
(0.016) (0.015) (0.019) (0.017)
Public*Yr09 -0.019 -0.006
(0.024) (0.019)
Public*Yr08 0.022 0.031
(0.034) (0.028)
Share Poor 0.041 0.043 -0.002
(0.026) (0.026) (0.018)
Share Males -0.095*** -0.094*** -0.178***
(0.029) (0.029) (0.022)
Theoretic 0.040***
(0.005)
Technologic -0.035***
(0.007)
Public 0.059**
(0.027)
Observations 3,324 3,324 3,324 3,324
R-squared 0.790 0.792 0.792 0.409
Year FE YES YES YES YES
School FE YES YES YES NO
County FE NO NO NO YES
County trends YES YES YES YES
Notes: All regressions are weighted with the number of (per school) students taking the exam.
The standard errors, shown in parentheses, are clustered at the locality level. *** p<0.01, **
p<0.05, * p<0.1
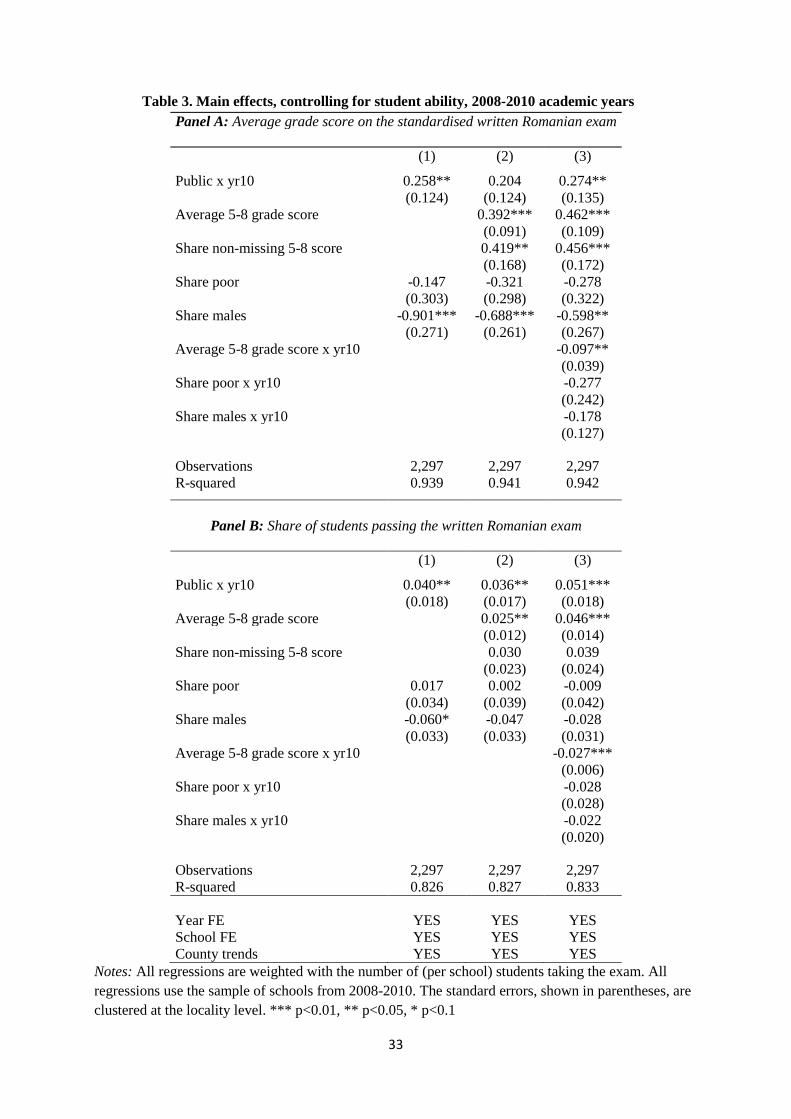
33
Table 3. Main effects, controlling for student ability, 2008-2010 academic years
Panel A: Average grade score on the standardised written Romanian exam
(1) (2) (3)
Public x yr10 0.258** 0.204 0.274**
(0.124) (0.124) (0.135)
Average 5-8 grade score 0.392*** 0.462***
(0.091) (0.109)
Share non-missing 5-8 score 0.419** 0.456***
(0.168) (0.172)
Share poor -0.147 -0.321 -0.278
(0.303) (0.298) (0.322)
Share males -0.901*** -0.688*** -0.598**
(0.271) (0.261) (0.267)
Average 5-8 grade score x yr10 -0.097**
(0.039)
Share poor x yr10 -0.277
(0.242)
Share males x yr10 -0.178
(0.127)
Observations 2,297 2,297 2,297
R-squared 0.939 0.941 0.942
Panel B: Share of students passing the written Romanian exam
(1) (2) (3)
Public x yr10 0.040** 0.036** 0.051***
(0.018) (0.017) (0.018)
Average 5-8 grade score 0.025** 0.046***
(0.012) (0.014)
Share non-missing 5-8 score 0.030 0.039
(0.023) (0.024)
Share poor 0.017 0.002 -0.009
(0.034) (0.039) (0.042)
Share males -0.060* -0.047 -0.028
(0.033) (0.033) (0.031)
Average 5-8 grade score x yr10 -0.027***
(0.006)
Share poor x yr10 -0.028
(0.028)
Share males x yr10 -0.022
(0.020)
Observations 2,297 2,297 2,297
R-squared 0.826 0.827 0.833
Year FE YES YES YES
School FE YES YES YES
County trends YES YES YES
Notes: All regressions are weighted with the number of (per school) students taking the exam. All
regressions use the sample of schools from 2008-2010. The standard errors, shown in parentheses, are
clustered at the locality level. *** p<0.01, ** p<0.05, * p<0.1
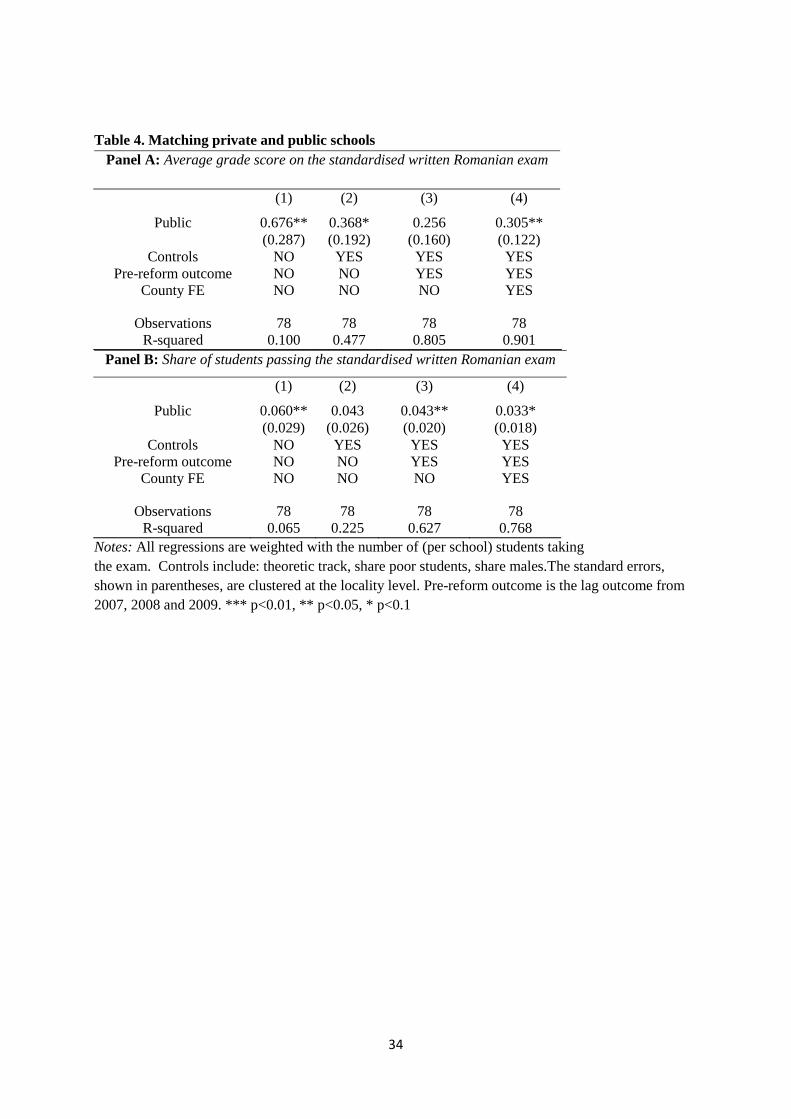
34
Table 4. Matching private and public schools
Panel A: Average grade score on the standardised written Romanian exam
(1) (2) (3) (4)
Public 0.676** 0.368* 0.256 0.305**
(0.287) (0.192) (0.160) (0.122)
Controls
Pre-reform outcome
County FE
NO
NO
NO
YES
NO
NO
YES
YES
NO
YES
YES
YES
Observations 78 78 78 78
R-squared 0.100 0.477 0.805 0.901
Panel B: Share of students passing the standardised written Romanian exam
(1) (2) (3) (4)
Public 0.060** 0.043 0.043** 0.033*
(0.029) (0.026) (0.020) (0.018)
Controls
Pre-reform outcome
County FE
NO
NO
NO
YES
NO
NO
YES
YES
NO
YES
YES
YES
Observations 78 78 78 78
R-squared 0.065 0.225 0.627 0.768
Notes: All regressions are weighted with the number of (per school) students taking
the exam. Controls include: theoretic track, share poor students, share males.The standard errors,
shown in parentheses, are clustered at the locality level. Pre-reform outcome is the lag outcome from
2007, 2008 and 2009. *** p<0.01, ** p<0.05, * p<0.1
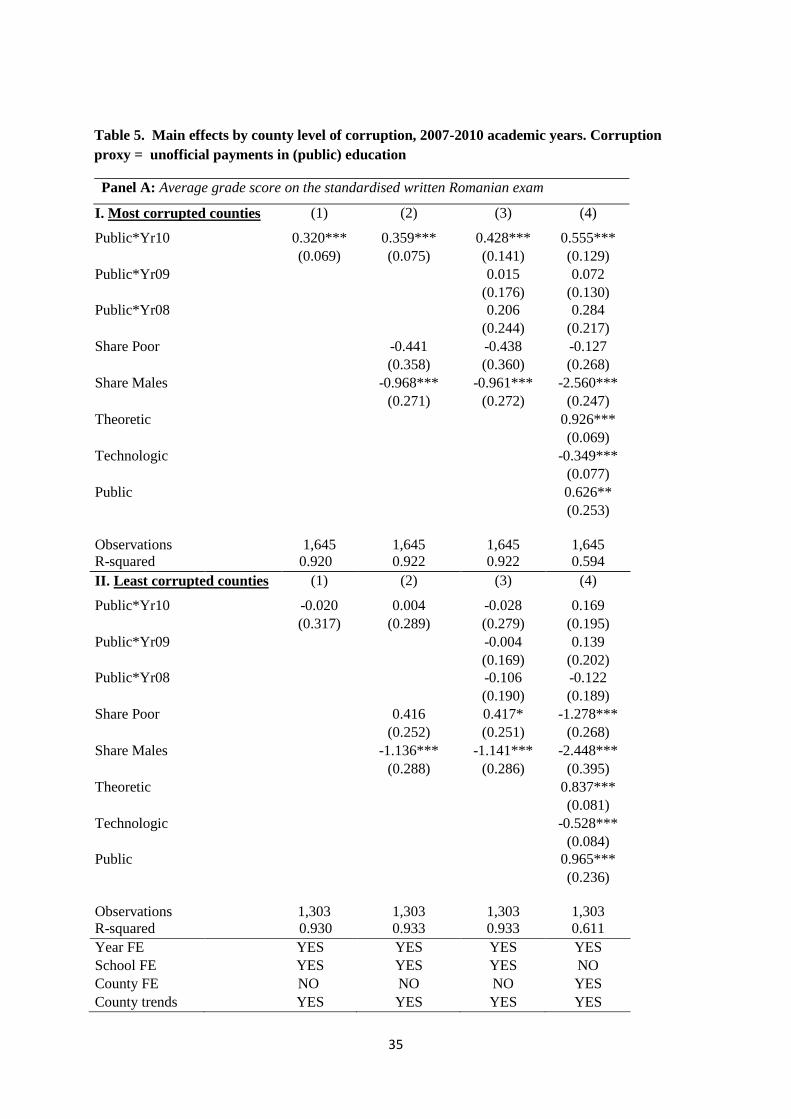
35
Table 5. Main effects by county level of corruption, 2007-2010 academic years. Corruption
proxy = unofficial payments in (public) education
Panel A: Average grade score on the standardised written Romanian exam
I. Most corrupted counties (1) (2) (3) (4)
Public*Yr10 0.320*** 0.359*** 0.428*** 0.555***
(0.069) (0.075) (0.141) (0.129)
Public*Yr09 0.015 0.072
(0.176) (0.130)
Public*Yr08 0.206 0.284
(0.244) (0.217)
Share Poor -0.441 -0.438 -0.127
(0.358) (0.360) (0.268)
Share Males -0.968*** -0.961*** -2.560***
(0.271) (0.272) (0.247)
Theoretic 0.926***
(0.069)
Technologic -0.349***
(0.077)
Public 0.626**
(0.253)
Observations 1,645 1,645 1,645 1,645
R-squared 0.920 0.922 0.922 0.594
II. Least corrupted counties (1) (2) (3) (4)
Public*Yr10 -0.020 0.004 -0.028 0.169
(0.317) (0.289) (0.279) (0.195)
Public*Yr09 -0.004 0.139
(0.169) (0.202)
Public*Yr08 -0.106 -0.122
(0.190) (0.189)
Share Poor 0.416 0.417* -1.278***
(0.252) (0.251) (0.268)
Share Males -1.136*** -1.141*** -2.448***
(0.288) (0.286) (0.395)
Theoretic 0.837***
(0.081)
Technologic -0.528***
(0.084)
Public 0.965***
(0.236)
Observations 1,303 1,303 1,303 1,303
R-squared 0.930 0.933 0.933 0.611
Year FE YES YES YES YES
School FE YES YES YES NO
County FE NO NO NO YES
County trends YES YES YES YES
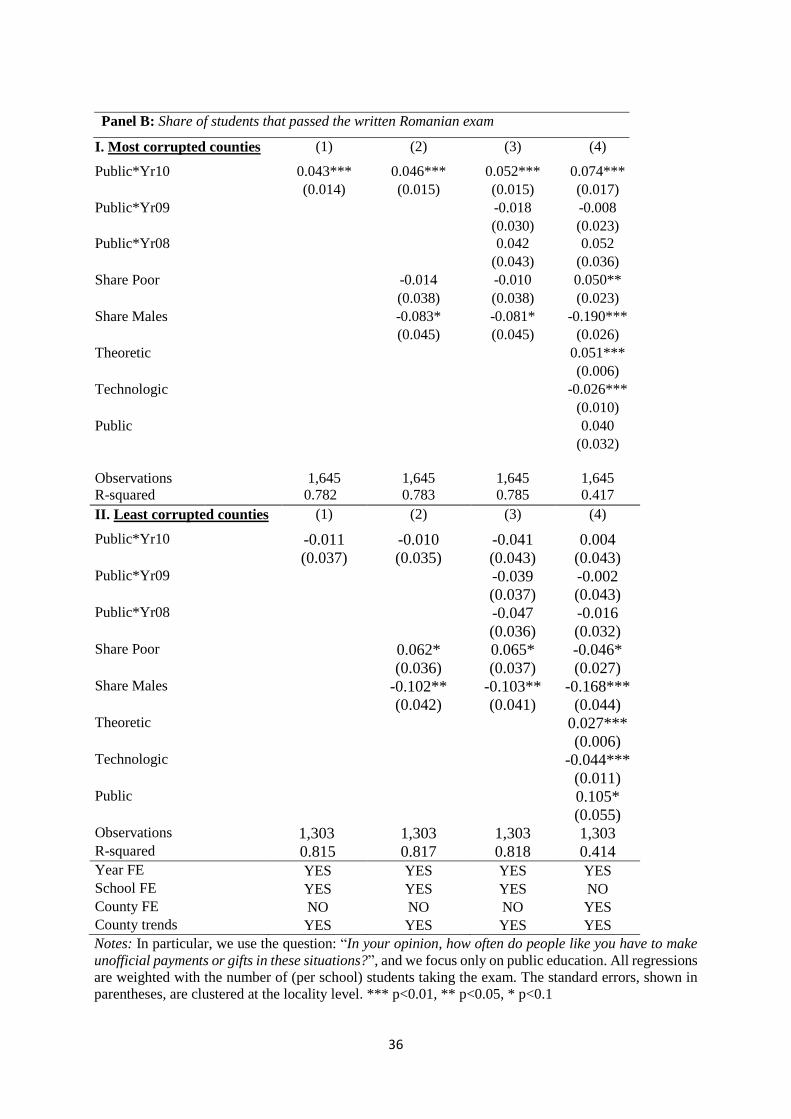
36
Panel B: Share of students that passed the written Romanian exam
I. Most corrupted counties (1) (2) (3) (4)
Public*Yr10 0.043*** 0.046*** 0.052*** 0.074***
(0.014) (0.015) (0.015) (0.017)
Public*Yr09 -0.018 -0.008
(0.030) (0.023)
Public*Yr08 0.042 0.052
(0.043) (0.036)
Share Poor -0.014 -0.010 0.050**
(0.038) (0.038) (0.023)
Share Males -0.083* -0.081* -0.190***
(0.045) (0.045) (0.026)
Theoretic 0.051***
(0.006)
Technologic -0.026***
(0.010)
Public 0.040
(0.032)
Observations 1,645 1,645 1,645 1,645
R-squared 0.782 0.783 0.785 0.417
II. Least corrupted counties (1) (2) (3) (4)
Public*Yr10 -0.011 -0.010 -0.041 0.004 (0.037) (0.035) (0.043) (0.043) Public*Yr09 -0.039 -0.002 (0.037) (0.043) Public*Yr08 -0.047 -0.016 (0.036) (0.032) Share Poor 0.062* 0.065* -0.046* (0.036) (0.037) (0.027) Share Males -0.102** -0.103** -0.168*** (0.042) (0.041) (0.044) Theoretic 0.027*** (0.006) Technologic -0.044*** (0.011) Public 0.105* (0.055) Observations 1,303 1,303 1,303 1,303 R-squared 0.815 0.817 0.818 0.414 Year FE YES YES YES YES
School FE YES YES YES NO
County FE NO NO NO YES
County trends YES YES YES YES
Notes: In particular, we use the question: “In your opinion, how often do people like you have to make
unofficial payments or gifts in these situations?”, and we focus only on public education. All regressions
are weighted with the number of (per school) students taking the exam. The standard errors, shown in
parentheses, are clustered at the locality level. *** p<0.01, ** p<0.05, * p<0.1
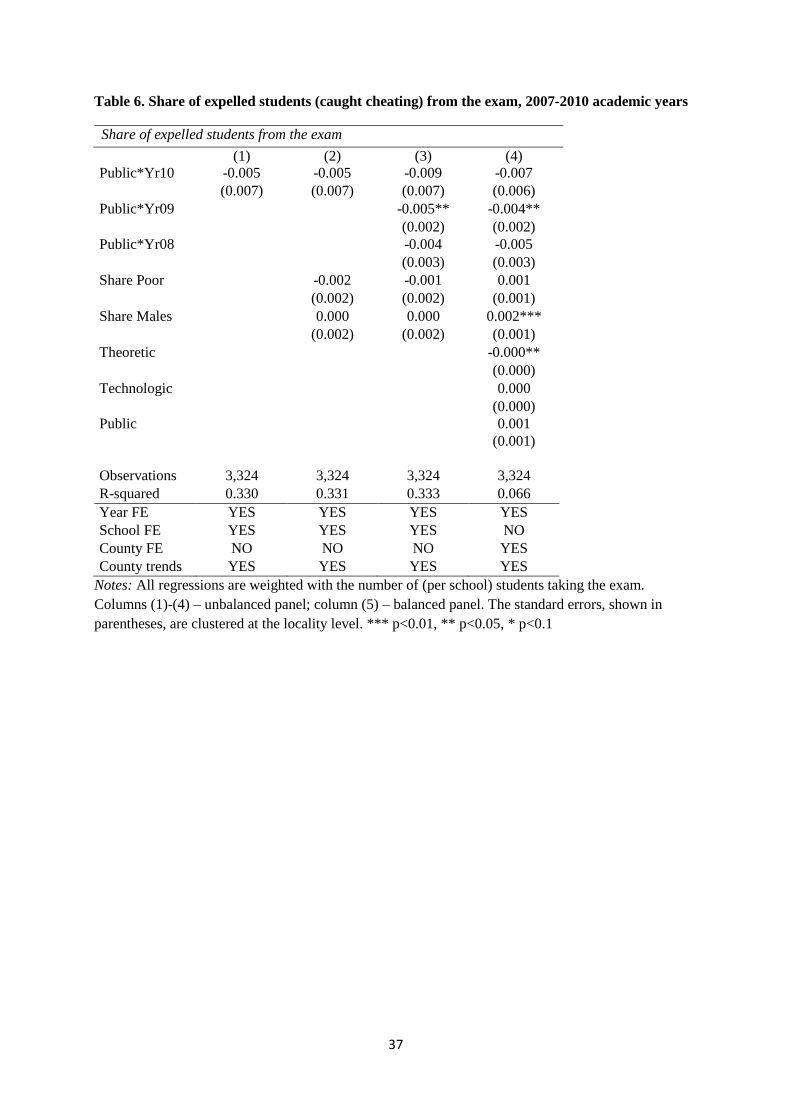
37
Table 6. Share of expelled students (caught cheating) from the exam, 2007-2010 academic years
Share of expelled students from the exam
(1) (2) (3) (4)
Public*Yr10 -0.005 -0.005 -0.009 -0.007
(0.007) (0.007) (0.007) (0.006)
Public*Yr09 -0.005** -0.004**
(0.002) (0.002)
Public*Yr08 -0.004 -0.005
(0.003) (0.003)
Share Poor -0.002 -0.001 0.001
(0.002) (0.002) (0.001)
Share Males 0.000 0.000 0.002***
(0.002) (0.002) (0.001)
Theoretic -0.000**
(0.000)
Technologic 0.000
(0.000)
Public 0.001
(0.001)
Observations 3,324 3,324 3,324 3,324
R-squared 0.330 0.331 0.333 0.066
Year FE YES YES YES YES
School FE YES YES YES NO
County FE NO NO NO YES
County trends YES YES YES YES
Notes: All regressions are weighted with the number of (per school) students taking the exam.
Columns (1)-(4) – unbalanced panel; column (5) – balanced panel. The standard errors, shown in
parentheses, are clustered at the locality level. *** p<0.01, ** p<0.05, * p<0.1
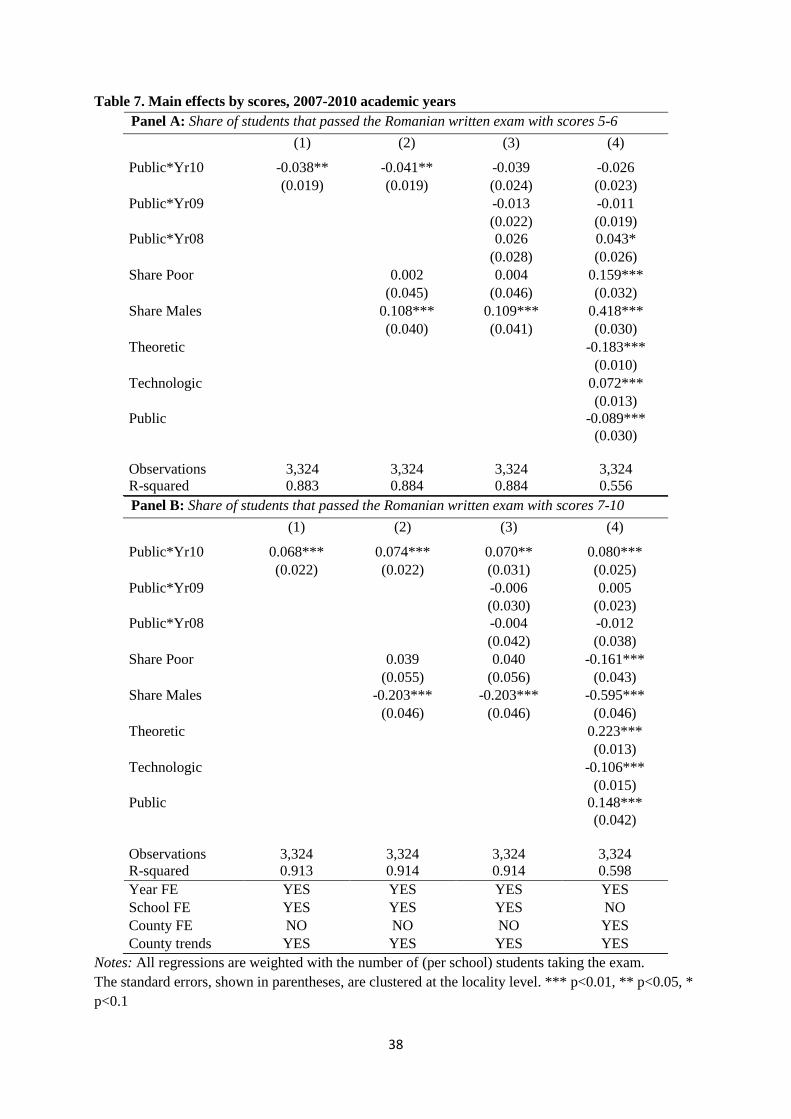
38
Table 7. Main effects by scores, 2007-2010 academic years
Panel A: Share of students that passed the Romanian written exam with scores 5-6
(1) (2) (3) (4)
Public*Yr10 -0.038** -0.041** -0.039 -0.026
(0.019) (0.019) (0.024) (0.023)
Public*Yr09 -0.013 -0.011
(0.022) (0.019)
Public*Yr08 0.026 0.043*
(0.028) (0.026)
Share Poor 0.002 0.004 0.159***
(0.045) (0.046) (0.032)
Share Males 0.108*** 0.109*** 0.418***
(0.040) (0.041) (0.030)
Theoretic -0.183***
(0.010)
Technologic 0.072***
(0.013)
Public -0.089***
(0.030)
Observations 3,324 3,324 3,324 3,324
R-squared 0.883 0.884 0.884 0.556
Panel B: Share of students that passed the Romanian written exam with scores 7-10
(1) (2) (3) (4)
Public*Yr10 0.068*** 0.074*** 0.070** 0.080***
(0.022) (0.022) (0.031) (0.025)
Public*Yr09 -0.006 0.005
(0.030) (0.023)
Public*Yr08 -0.004 -0.012
(0.042) (0.038)
Share Poor 0.039 0.040 -0.161***
(0.055) (0.056) (0.043)
Share Males -0.203*** -0.203*** -0.595***
(0.046) (0.046) (0.046)
Theoretic 0.223***
(0.013)
Technologic -0.106***
(0.015)
Public 0.148***
(0.042)
Observations 3,324 3,324 3,324 3,324
R-squared 0.913 0.914 0.914 0.598
Year FE YES YES YES YES
School FE YES YES YES NO
County FE NO NO NO YES
County trends YES YES YES YES
Notes: All regressions are weighted with the number of (per school) students taking the exam.
The standard errors, shown in parentheses, are clustered at the locality level. *** p<0.01, ** p<0.05, *
p<0.1
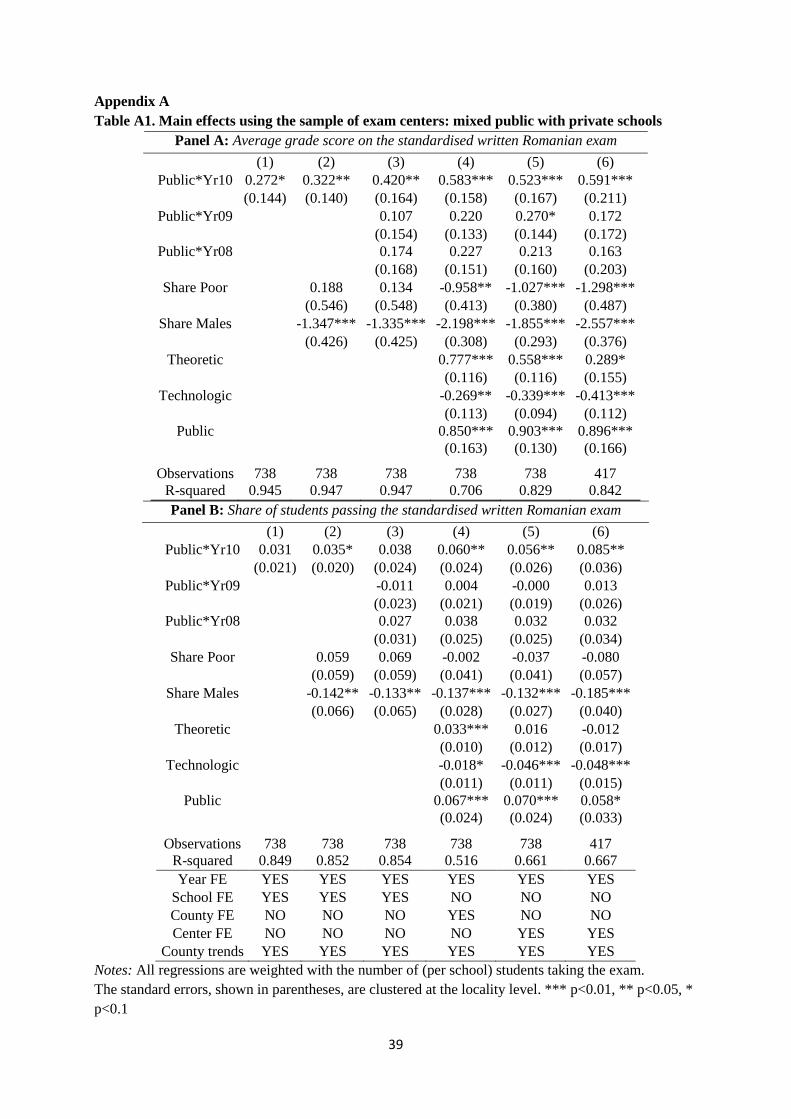
39
Appendix A
Table A1. Main effects using the sample of exam centers: mixed public with private schools
Panel A: Average grade score on the standardised written Romanian exam
(1) (2) (3) (4) (5) (6)
Public*Yr10 0.272* 0.322** 0.420** 0.583*** 0.523*** 0.591***
(0.144) (0.140) (0.164) (0.158) (0.167) (0.211)
Public*Yr09 0.107 0.220 0.270* 0.172
(0.154) (0.133) (0.144) (0.172)
Public*Yr08 0.174 0.227 0.213 0.163
(0.168) (0.151) (0.160) (0.203)
Share Poor 0.188 0.134 -0.958** -1.027*** -1.298***
(0.546) (0.548) (0.413) (0.380) (0.487)
Share Males -1.347*** -1.335*** -2.198*** -1.855*** -2.557***
(0.426) (0.425) (0.308) (0.293) (0.376)
Theoretic 0.777*** 0.558*** 0.289*
(0.116) (0.116) (0.155)
Technologic -0.269** -0.339*** -0.413***
(0.113) (0.094) (0.112)
Public 0.850*** 0.903*** 0.896***
(0.163) (0.130) (0.166)
Observations 738 738 738 738 738 417
R-squared 0.945 0.947 0.947 0.706 0.829 0.842
Panel B: Share of students passing the standardised written Romanian exam
(1) (2) (3) (4) (5) (6)
Public*Yr10 0.031 0.035* 0.038 0.060** 0.056** 0.085**
(0.021) (0.020) (0.024) (0.024) (0.026) (0.036)
Public*Yr09 -0.011 0.004 -0.000 0.013
(0.023) (0.021) (0.019) (0.026)
Public*Yr08 0.027 0.038 0.032 0.032
(0.031) (0.025) (0.025) (0.034)
Share Poor 0.059 0.069 -0.002 -0.037 -0.080
(0.059) (0.059) (0.041) (0.041) (0.057)
Share Males -0.142** -0.133** -0.137*** -0.132*** -0.185***
(0.066) (0.065) (0.028) (0.027) (0.040)
Theoretic 0.033*** 0.016 -0.012
(0.010) (0.012) (0.017)
Technologic -0.018* -0.046*** -0.048***
(0.011) (0.011) (0.015)
Public 0.067*** 0.070*** 0.058*
(0.024) (0.024) (0.033)
Observations 738 738 738 738 738 417
R-squared 0.849 0.852 0.854 0.516 0.661 0.667
Year FE YES YES YES YES YES YES
School FE YES YES YES NO NO NO
County FE NO NO NO YES NO NO
Center FE NO NO NO NO YES YES
County trends YES YES YES YES YES YES
Notes: All regressions are weighted with the number of (per school) students taking the exam.
The standard errors, shown in parentheses, are clustered at the locality level. *** p<0.01, ** p<0.05, *
p<0.1
40
Appendix B: Not intended for publication
B.1. Heterogeneous effects
Finally, in this section, we explore whether corruption responds to the wage cut in distinct ways across high
schools with different characteristics. In particular, in Table B1, we look at DD estimates in schools with different
proportions of female students (Panel A of Table B1), different ethnic compositions (Panel B), varying shares of
teachers paid by the hour (Panel C) and, different age of the school principal (Panel D).
The most interesting findings are the following:
a) The DD estimates are significant only for high schools with a minority population of female students,
suggesting that male dominated schools are more prone to appeal to corruption especially when the financial
incentives are accentuated. While this does not exclude milder forms of fraud, such as increased male to female
student cheating in the exam rooms, this finding is also consistent with an outward shift in demand for illegal
grades meeting the increased supply by didactic staff, where male students are dominant.
b) The impact of the wage cut is significant in ethnically mixed high schools (defined as having the share of
Romanians less than 1), which is true both for the average pass and for the average grade in the Romanian written
exam.
c) The findings are mixed for schools with a different share of teachers working part time. Effects are larger in
magnitude for those with higher prevalence (i.e., the share of teachers paid by the hour is larger than the
mean=11%), suggesting they might be more responsive to monetary incentives. This might indicate that less
organised schools or teachers who have loose ties to the teacher labor market (by being hired on a temporary
contract), are more easily influenced by principals to be involved in corrupt behavior. However, it should be noted
that very few schools have a high proportion of part-time teachers. If we exclude the few schools with more than
50% of teachers paid by the hour, we get positive and statistically DD-estimates that are in line with our baseline
estimates.
d) Schools with a younger school principal (i.e., smaller than the mean age=48) are more responsive to monetary
incentives. This might be in line with the increase in corruption in schools over time in Romania, so that older
principals were used to working in a system of less corruption.
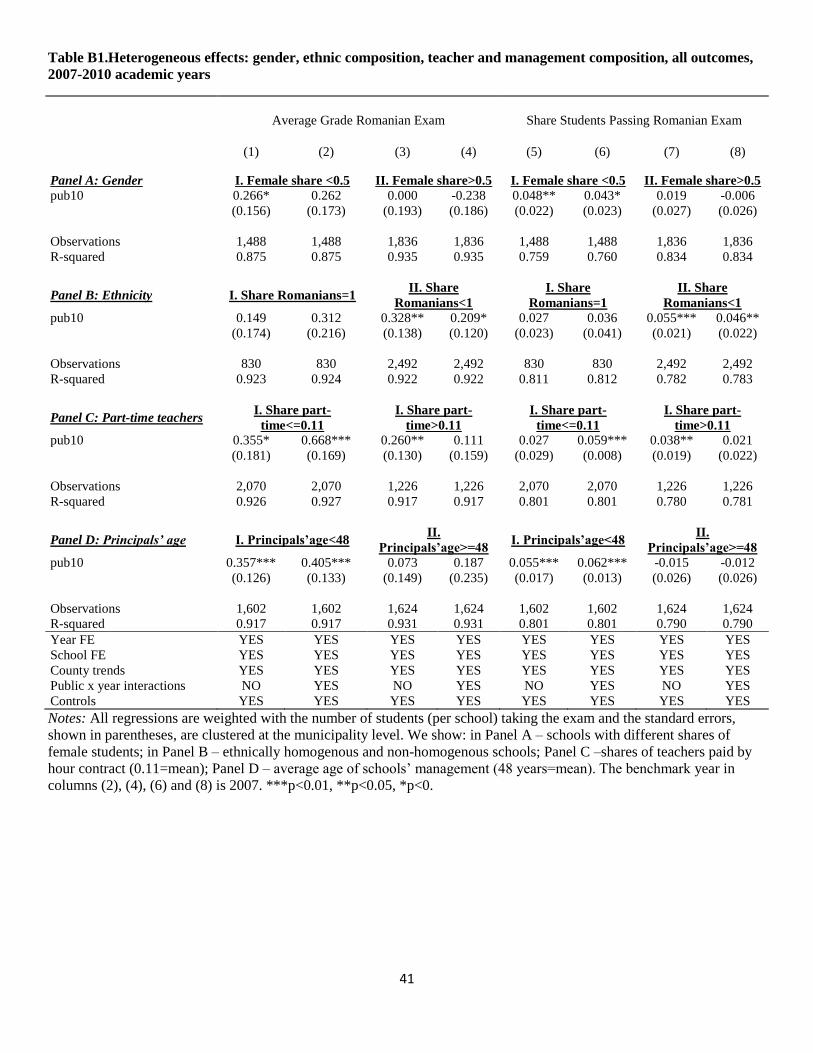
41
Table B1.Heterogeneous effects: gender, ethnic composition, teacher and management composition, all outcomes,
2007-2010 academic years
Average Grade Romanian Exam Share Students Passing Romanian Exam
(1) (2) (3) (4) (5) (6) (7) (8)
Panel A: Gender I. Female share <0.5 II. Female share>0.5 I. Female share <0.5 II. Female share>0.5
pub10 0.266* 0.262 0.000 -0.238 0.048** 0.043* 0.019 -0.006
(0.156) (0.173) (0.193) (0.186) (0.022) (0.023) (0.027) (0.026)
Observations 1,488 1,488 1,836 1,836 1,488 1,488 1,836 1,836
R-squared 0.875 0.875 0.935 0.935 0.759 0.760 0.834 0.834
Panel B: Ethnicity I. Share Romanians=1 II. Share
Romanians<1
I. Share
Romanians=1
II. Share
Romanians<1 pub10 0.149 0.312 0.328** 0.209* 0.027 0.036 0.055*** 0.046**
(0.174) (0.216) (0.138) (0.120) (0.023) (0.041) (0.021) (0.022)
Observations 830 830 2,492 2,492 830 830 2,492 2,492
R-squared 0.923 0.924 0.922 0.922 0.811 0.812 0.782 0.783
Panel C: Part-time teachers I. Share part-
time<=0.11
I. Share part-
time>0.11
I. Share part-
time<=0.11
I. Share part-
time>0.11 pub10 0.355* 0.668*** 0.260** 0.111 0.027 0.059*** 0.038** 0.021
(0.181) (0.169) (0.130) (0.159) (0.029) (0.008) (0.019) (0.022)
Observations 2,070 2,070 1,226 1,226 2,070 2,070 1,226 1,226
R-squared 0.926 0.927 0.917 0.917 0.801 0.801 0.780 0.781
Panel D: Principals’ age I. Principals’age<48 II.
Principals’age>=48 I. Principals’age<48
II.
Principals’age>=48 pub10 0.357*** 0.405*** 0.073 0.187 0.055*** 0.062*** -0.015 -0.012
(0.126) (0.133) (0.149) (0.235) (0.017) (0.013) (0.026) (0.026)
Observations 1,602 1,602 1,624 1,624 1,602 1,602 1,624 1,624
R-squared 0.917 0.917 0.931 0.931 0.801 0.801 0.790 0.790
Year FE YES YES YES YES YES YES YES YES
School FE YES YES YES YES YES YES YES YES
County trends YES YES YES YES YES YES YES YES
Public x year interactions NO YES NO YES NO YES NO YES
Controls YES YES YES YES YES YES YES YES
Notes: All regressions are weighted with the number of students (per school) taking the exam and the standard errors,
shown in parentheses, are clustered at the municipality level. We show: in Panel A – schools with different shares of
female students; in Panel B – ethnically homogenous and non-homogenous schools; Panel C –shares of teachers paid by
hour contract (0.11=mean); Panel D – average age of schools’ management (48 years=mean). The benchmark year in
columns (2), (4), (6) and (8) is 2007. ***p<0.01, **p<0.05, *p<0.
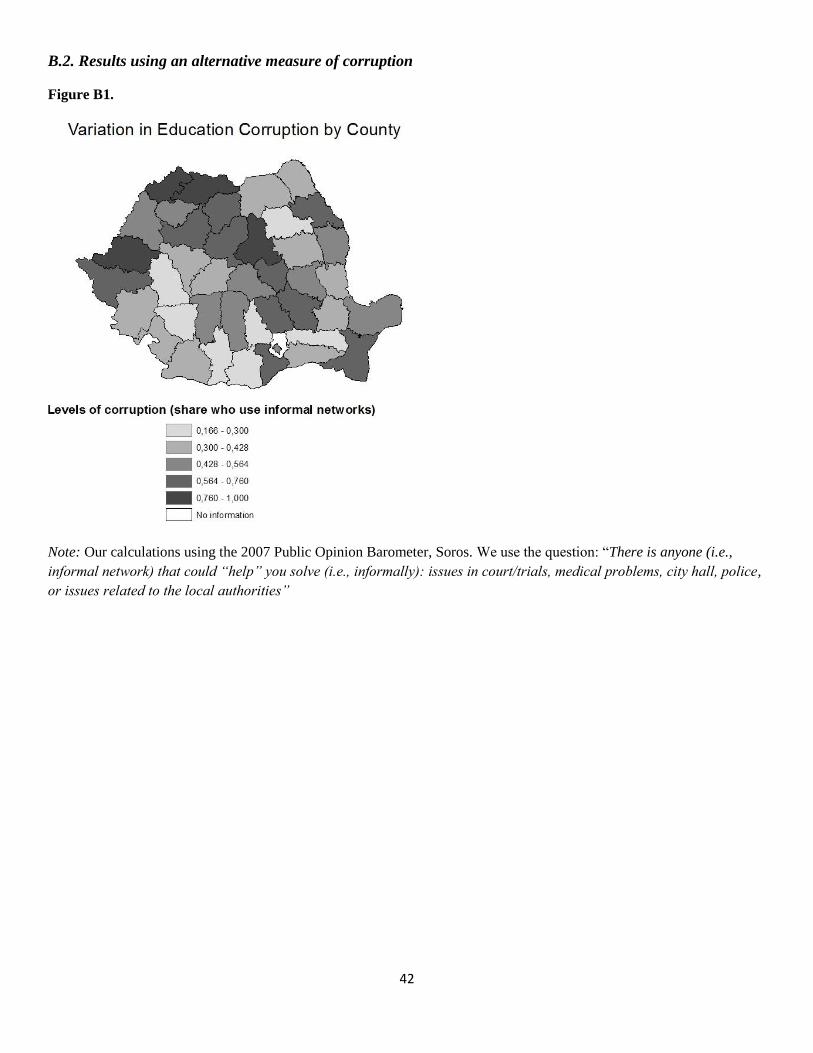
42
B.2. Results using an alternative measure of corruption
Figure B1.
Note: Our calculations using the 2007 Public Opinion Barometer, Soros. We use the question: “There is anyone (i.e.,
informal network) that could “help” you solve (i.e., informally): issues in court/trials, medical problems, city hall, police,
or issues related to the local authorities”
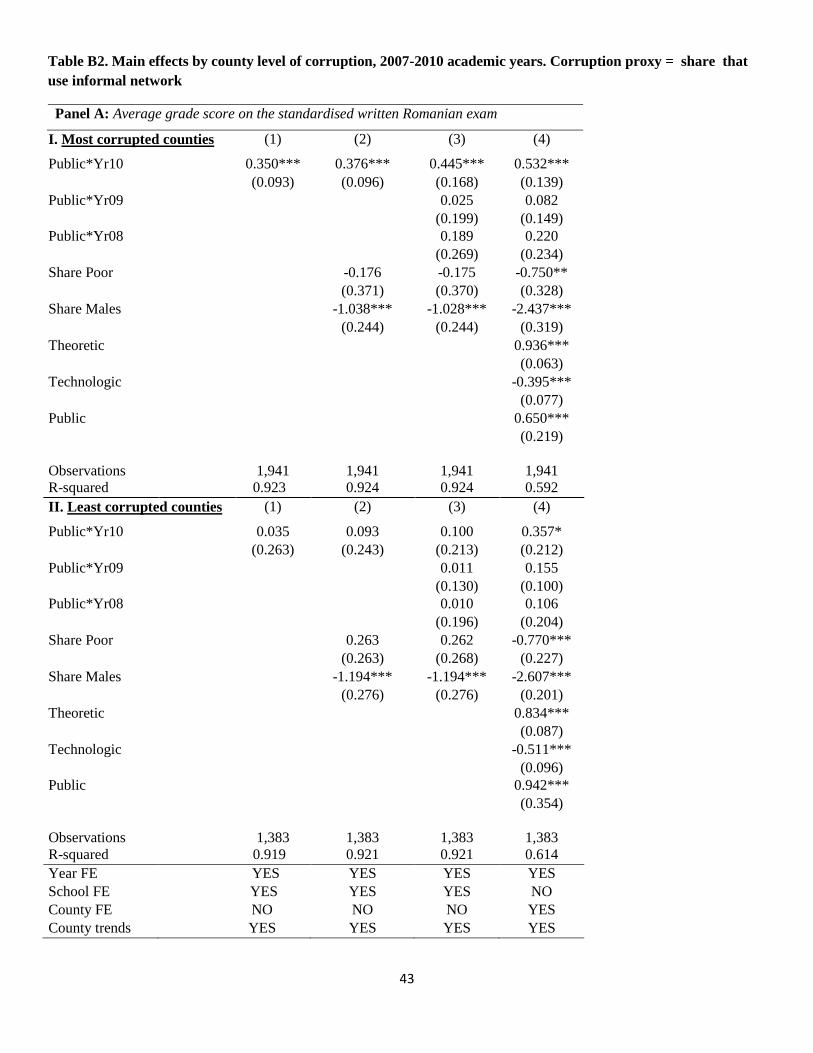
43
Table B2. Main effects by county level of corruption, 2007-2010 academic years. Corruption proxy = share that
use informal network
Panel A: Average grade score on the standardised written Romanian exam
I. Most corrupted counties (1) (2) (3) (4)
Public*Yr10 0.350*** 0.376*** 0.445*** 0.532***
(0.093) (0.096) (0.168) (0.139)
Public*Yr09 0.025 0.082
(0.199) (0.149)
Public*Yr08 0.189 0.220
(0.269) (0.234)
Share Poor -0.176 -0.175 -0.750**
(0.371) (0.370) (0.328)
Share Males -1.038*** -1.028*** -2.437***
(0.244) (0.244) (0.319)
Theoretic 0.936***
(0.063)
Technologic -0.395***
(0.077)
Public 0.650***
(0.219)
Observations 1,941 1,941 1,941 1,941
R-squared 0.923 0.924 0.924 0.592
II. Least corrupted counties (1) (2) (3) (4)
Public*Yr10 0.035 0.093 0.100 0.357*
(0.263) (0.243) (0.213) (0.212)
Public*Yr09 0.011 0.155
(0.130) (0.100)
Public*Yr08 0.010 0.106
(0.196) (0.204)
Share Poor 0.263 0.262 -0.770***
(0.263) (0.268) (0.227)
Share Males -1.194*** -1.194*** -2.607***
(0.276) (0.276) (0.201)
Theoretic 0.834***
(0.087)
Technologic -0.511***
(0.096)
Public 0.942***
(0.354)
Observations 1,383 1,383 1,383 1,383
R-squared 0.919 0.921 0.921 0.614
Year FE YES YES YES YES
School FE YES YES YES NO
County FE NO NO NO YES
County trends YES YES YES YES
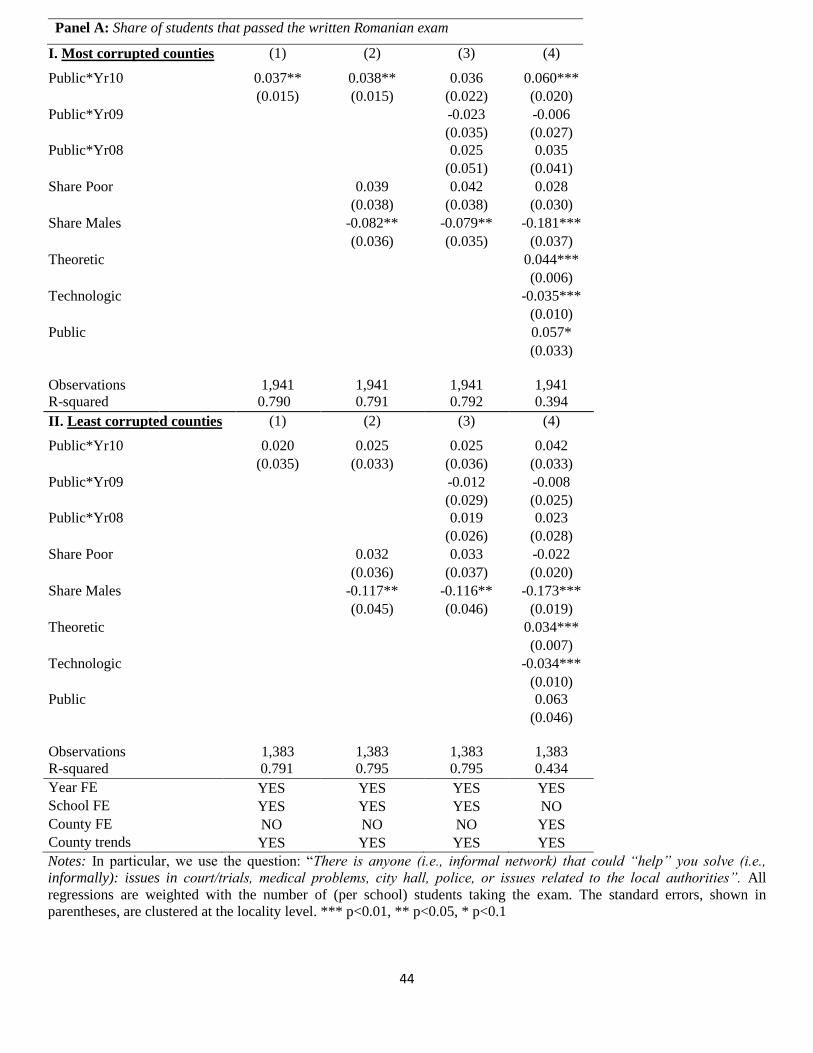
44
Panel A: Share of students that passed the written Romanian exam
I. Most corrupted counties (1) (2) (3) (4)
Public*Yr10 0.037** 0.038** 0.036 0.060***
(0.015) (0.015) (0.022) (0.020)
Public*Yr09 -0.023 -0.006
(0.035) (0.027)
Public*Yr08 0.025 0.035
(0.051) (0.041)
Share Poor 0.039 0.042 0.028
(0.038) (0.038) (0.030)
Share Males -0.082** -0.079** -0.181***
(0.036) (0.035) (0.037)
Theoretic 0.044***
(0.006)
Technologic -0.035***
(0.010)
Public 0.057*
(0.033)
Observations 1,941 1,941 1,941 1,941
R-squared 0.790 0.791 0.792 0.394
II. Least corrupted counties (1) (2) (3) (4)
Public*Yr10 0.020 0.025 0.025 0.042
(0.035) (0.033) (0.036) (0.033)
Public*Yr09 -0.012 -0.008
(0.029) (0.025)
Public*Yr08 0.019 0.023
(0.026) (0.028)
Share Poor 0.032 0.033 -0.022
(0.036) (0.037) (0.020)
Share Males -0.117** -0.116** -0.173***
(0.045) (0.046) (0.019)
Theoretic 0.034***
(0.007)
Technologic -0.034***
(0.010)
Public 0.063
(0.046)
Observations 1,383 1,383 1,383 1,383
R-squared 0.791 0.795 0.795 0.434
Year FE YES YES YES YES
School FE YES YES YES NO
County FE NO NO NO YES
County trends YES YES YES YES
Notes: In particular, we use the question: “There is anyone (i.e., informal network) that could “help” you solve (i.e.,
informally): issues in court/trials, medical problems, city hall, police, or issues related to the local authorities”. All
regressions are weighted with the number of (per school) students taking the exam. The standard errors, shown in
parentheses, are clustered at the locality level. *** p<0.01, ** p<0.05, * p<0.1