Embed Size (px)
Citation preview

1
The European Journal of Finance, Volume 15, Issue 4, June 2009, Pages 385-404
The Impact of Board Size on Firm Performance:
Evidence from the UK
ABSTRACT
We examine the impact of board size on firm performance for a large sample of 2,746
UK listed firms over 1981-2002. The UK provides an interesting institutional setting,
because UK boards play a weak monitoring role and therefore any negative effect of
large board size is likely to reflect the malfunction of the board’s advisory rather than
monitoring role. We find that board size has a strong negative impact on profitability,
Tobin’s Q and share returns. This result is robust across econometric models that
control for different types of endogeneity. We find no evidence that firm characteristics
that determine board size in the UK lead to a more positive board size – firm
performance relation. In contrast, we find that the negative relation is strongest for large
firms, which tend to have larger boards. Overall, our evidence supports the argument
that problems of poor communication and decision-making undermine the effectiveness
of large boards.
Keywords: Corporate governance; board size; firm performance; endogeneity; UK
JEL classification: G30

2
1. INTRODUCTION
In this paper we examine the relationship between board size and firm performance
for UK firms. Corporate boards of directors play a central role in the corporate
governance of modern companies, and hence understanding this relationship is very
important to our understanding of corporate governance. Much of the public debate on
board structure has centered on pressure for smaller board size. It is argued that
although larger board size initially facilitates key board functions, there comes a point
when larger boards suffer from coordination and communication problems and hence
board effectiveness (and firm performance) declines (Lipton and Lorsch, 1992; and
Jensen, 1993). The empirical evidence (reviewed below) appears to support this view,
with a majority of studies documenting a significantly negative relation between board
size and corporate performance. If larger board size indeed “causes” worse
performance, then larger boards would represent inefficient governance that could
possibly be improved by a “one size fits all” approach to board size. For example,
influential scholars have argued that board size should be no greater than 8 or 9 (Lipton
and Lorsch, 1992; and Jensen, 1993) for all firms. Hence the findings have important
regulatory implications.1
However, this interpretation is by no means universally held. A number of recent
papers (Lehn et al., 2004; Boone et al., 2007; Coles et al., 2008; Guest, 2008; and Linck
et al., 2008) show that board size is determined by firm specific variables, such as
Tobin’s Q, profitability and firm size. Since firm performance has a negative impact on
board size, previous studies have been heavily criticized for not adequately controlling
for endogeneity problems (Wintoki, 2007). To address this, Wintoki (2007) employs a
generalized method of moments (GMM) estimator that allows board size to adjust to

3
past performance, and finds no relationship between board size and firm performance.
Additionally, since board size is determined by firm specific characteristics, the impact
of board size on performance may differ according to these characteristics. Consistent
with this, Coles et al. (2008) find that the impact of board size on firm value is positive
for large firms, and hence large board size may be an optimal value maximising
outcome for such firms.
The relationship between board size and performance may differ not just by firm
specific characteristics but also by national institutional characteristics. In countries
with different institutional backgrounds, the functions of boards are different, and
therefore the expected board size - performance relation may be expected to differ.
Therefore examination of other countries is useful in more fully understanding the
relation between board size and performance. The few non-US empirical studies to date
employ either relatively small or cross-sectional samples, and consequently, we have
relatively little large sample non-US evidence.
In this paper, we contribute to the predominantly US based literature by examining
the relation between board size and performance for a large sample of UK firms (2,746)
over a long time period (1981-2002), and employ the largest sample to date (over
25,000 firm year observations). The large and long panel dataset ensures that our results
are less likely to be biased by the particular time period under investigation and allows
us to employ appropriate econometric methods to control for endogeneity. We
incorporate the implications of the above recent findings into our analysis, such as
whether the performance impacts of board size depend on other characteristics that
determine board size. The specific institutional context of the UK is interesting because
UK boards arguably play a much weaker monitoring role than US firms (Guest, 2008).

4
As a result, any negative effect of large board size is more likely to reflect problems in
carrying out the advisory role rather than the monitoring role. Thus by providing large
sample evidence on this country, we allow the US results to be placed in a broader
context.
Our main findings are as follows: We find strong evidence of a negative relation
between board size and three different firm performance measures (profitability,
Tobin’s Q, and share returns). This basic result proves robust to a variety of regression
models. We employ fixed effect models to control for unobserved variables and,
following Wintoki (2007), a generalized method of moments estimator which allows
board size and performance to be jointly determined and allows board size to adjust to
previous changes in firm performance. The optimal board size depends on the
performance measure employed, although it is less than ten members across all
measures. Decomposing board size into the number of outside and inside directors, we
find that both have a negative impact, although for the latter this is not significantly so
for every performance measure. We find no evidence that firm characteristics that
determine board size in the UK lead to a more positive board size – firm performance
relation. In contrast, we find that the negative board size – performance relation is
strongest for large firms, which have larger boards.
The paper proceeds as follows: Section 2 provides a review of the literature on board
size and performance. Section 3 describes the institutional context of the UK. Section 4
describes the data. Section 5 presents the empirical results. Section 6 concludes.

5
2. THE EFFECT OF BOARD SIZE ON COMPANY PERFORMANCE:
REVIEW OF THE LITERATURE
The two most important functions of the board of directors are those of advising and
monitoring (Raheja, 2005; and Adams and Ferriera, 2007). The advisory function
involves the provision of expert advice to the CEO and access to critical information
and resources (Fama and Jensen, 1983). This is performed by both insiders and
outsiders, although Fama and Jensen (1983) note the importance of outside directors,
who bring valuable expertise and potentially important connections. The advantage of
larger board size is the greater collective information that the board subsequently
possesses and hence larger boards will lead to higher performance (Dalton et al., 1999,
2005). Secondly, the board has the responsibility to monitor, discipline, and remove
ineffective management teams, to ensure that managers pursue the interests of
shareholders. Raheja (2005) argues that insiders are an important source of firm-specific
information for the board, but may have distorted objectives due to private benefits and
lack of independence from the CEO. Compared to insiders, outsiders are more
independent, providing better monitoring, but are less informed about the firm’s
activities. Again, the advantage of larger board size and an increasing number of non-
executive directors is the greater collective information possessed by the board which is
also valuable for the monitoring function (Lehn et al., 2004). Therefore, both functions
predict an initial improvement in board performance as board size increases, and
increases in the number of non-executives are expected to have a more positive impact
than increases in the number of executive directors.
However, there are eventually disadvantages of large boards in the form of
coordination costs and free rider problems. Firstly, coordination and communication

6
problems arise because it is more difficult to arrange board meetings, reach consensus,
leading to slower and less-efficient decision-making (Jensen 1993). Secondly, board
cohesiveness is undermined because board members will be less likely to share a
common purpose, communicate with each other clearly, and reach a consensus that
builds on the directors’ different points of view (Lipton and Lorsch, 1992). Thirdly,
director free-riding increases because the cost to any individual director of not
exercising diligence falls in proportion to board size (Lipton and Lorsch, 1992). Jensen
(1993) and Lipton and Lorsch (1992) suggest that as board size increases beyond a
certain point, these inefficiencies outweigh the initial advantages from having more
directors to draw on, leading to a lower level of corporate performance. Lipton and
Lorsch (1992) argue that a board size of eight or nine directors is optimal, whilst Jensen
(1993) argues that the optimum board size should be around seven or eight directors.
The key findings of existing empirical studies are reported in Table 1 below. The
majority of US empirical studies have documented a negative relationship between
board size and firm performance, leading Hermalin and Weisbach (2003) to conclude
that this relation is one of the prominent empirical regularities in the literature. Using
data from 452 large U.S. industrial corporations between 1984 and 1991, Yermack
(1996) documents a negative relationship between board size and firm performance, as
measured by Tobin’s Q and profitability. Other US studies have found very similar
results (Huther, 1997; Cheng et al., 2007; Coles et al., 2008). Only two US studies
(Adams and Mehran, 2005; Dalton et al., 1999 (meta analysis study not reported in
Table 1)) finds a positive effect of board size on performance. 2
INSERT TABLE 1 HERE

7
Evidence from other countries is broadly consistent but less robust. Eisenberg et al.
(1998) provide evidence that the negative relationship between board size and firm
performance holds for small private firms in Finland. For Switzerland, Loderer and
Peyer (2002) find a significantly negative impact on Tobin’s Q (although not on
profitability) whilst Beiner et al. (2004 and 2006) find no negative impact. For
Malaysian firms, both Mak and Kusnadi (2005) and Haniffa and Hudaib (2006) find a
significantly negative impact of board size on Tobin’s Q. Bozec (2005) finds that board
size has a significantly negative effect on sales margin but not profitability for 25 large
Canadian firms. For the UK, Conyon and Peck (1998) examine 481 listed UK firms for
1992-1995 and find a significantly negative effect of board size on both market to book
value and profitability, whilst Lasfer (2004) finds a significantly negative impact on
Tobin’s Q.
As Wintoki (2007) points out, a significant problem in examining the impact of
board size on performance is that of endogeneity. Firstly, unobserved heterogeneity can
arise if both firm performance and board size are jointly determined by an unobservable
firm specific variable. One way to address this concern is with a firm fixed effects
model. Yermack (1996) employs such a model and finds that the negative impact of
board size still holds. Secondly, board size may be determined simultaneously with firm
performance in any given period (simultaneous endogeneity) or may be determined by
past performance (dynamic endogeneity). Previous studies have attempted to overcome
these problems by employing instrumental variable techniques (Eisenberg et al., 1998;
Postma et al., 2003; Adams and Mehran, 2005; de Andres et al., 2005; Beiner et al.,
2006; and Bennedsen et al., 2008), and as shown in Table 1, the results suggest that
there is causality from board size to performance. However, although instrumental

8
variable regressions potentially eliminate endogeneity, they require the identification of
strictly exogenous instrumental variables which is almost impossible in a corporate
governance setting (Wintoki, 2007).
Therefore both methods can lead to biased results if board size and performance are
jointly determined by unobservable variables and board size adjusts to past
performance. Wintoki (2007) argues that an appropriate model to employ is the GMM
estimator (Arrellanno and Bond, 1991), which eliminates these sources of endogeneity.
When using this model, Wintoki (2007) no longer finds a negative relationship between
board size and performance. The only other study to employ this method is Conyon and
Peck (1998) who in contrast, do find a negative impact of board size on performance.
Therefore although the GMM method appears a very appropriate model to employ, the
evidence is mixed on whether board size has a negative impact on performance when
this model is used.
A number of recent empirical papers (Lehn et al., 2004; Boone et al., 2007; Coles et
al., 2008; Guest, 2008; and Linck et al., 2008) have examined the determinants of board
size. Board size is expected to be greater when the need for information and hence
board advice is high. Such needs are expected to increase with firm scale and
complexity. All the above studies find that board size is positively related to firm size.
A number of proxies are used to measure complexity and are shown to positively
influence board size, including financial leverage (Coles et al., 2008; Guest, 2008; and
Linck et al., 2008), firm age (Boone et al., 2007; Coles et al., 2008; Guest, 2008; and
Linck et al., 2008), and industrial diversification (Boone et al., 2007; Coles et al., 2008;
and Linck et al., 2008). These studies provide strong evidence that board size is
influenced by firm specific variables, which appear consistent with value maximising

9
motives. These findings suggest that the impact of board size on performance may
differ for different types of firms. Coles et al., (2008) indeed find evidence that larger
firms, diversified firms, and firms that rely more on debt financing, will derive greater
firm value from having larger boards.
3. THE EFFECT OF BOARD SIZE ON FIRM PERFORMANCE: THE UK
INSTITUTIONAL CONTEXT
The impact of board size on performance may be expected to differ not just
according to firm specific characteristics but also by country, since the role and function
of boards may differ by country. The potential problems of large boards will depend on
the specific functions and effectiveness of boards and this will differ according to the
institutional and legal environment. In the context of this study, it has been argued that
UK boards play a much weaker monitoring role than US boards (see e.g., Guest (2008)
for a more detailed discussion).
The prescribed advisory and monitoring functions of UK boards are very similar to
those of US boards (Cadbury, 1992). However, there are several reasons why the
monitoring function will be carried out less effectively in the UK. Firstly, UK outside
directors are rarely held legally accountable for failing to fulfill their legal duty of care
and loyalty, and consequently they regard their role as being primarily that of advising
rather than monitoring (Franks et al., 2001). Secondly, UK boards have historically
consisted of a lower proportion of outside directors who are less independent from
management (e.g., Cosh and Hughes, 1987).3 Thirdly, the financial incentives
(shareholding and remuneration) for outside directors in the UK to fulfill their functions
are lower (Cosh and Hughes, 1987; and Higgs, 2003).

10
The relative strength of other substitute governance mechanisms is stronger in the
UK and this further weakens the monitoring role played by outside directors (Agrawal
and Knoeber, 1996). Firstly, UK companies have less available takeover defences and
consequently the market for corporate control should perform a stronger function (Short
and Keasey, 1999). Secondly, British institutional investors are more active monitors,
able to act collectively (Crespi-Cladera and Renneboog, 2003), and expected to perform
a stronger role because ownership concentration is higher (Short and Keasey, 1999).
The idea that UK boards play a weaker monitoring role than their US counterparts is
supported by the UK empirical evidence on the determinants and effects of board
structure. In contrast to US findings, UK board size and structure is not determined by
the costs and benefits of monitoring, although it is determined by advisory needs
(Guest, 2008). The proportion of outside directors does not have a positive impact on
general firm performance (Vafeas and Theodorou, 1998), or on specific monitoring
tasks, such as CEO turnover (Cosh and Hughes, 1997; and Franks et al., 2001).4 In the
US, by contrast, although outsider proportion does not have a positive impact on overall
performance, it does have a positive impact on specific tasks (Hermalin and Weisbach,
2003).
Since UK boards only play a weak monitoring role, their monitoring effectiveness is
much less likely to depend on board size. However, UK boards do play an important
advisory function, and we therefore expect any negative relation between board size and
performance to be driven by problems associated with the advisory function. We expect
any negative relation to be weaker than in the US, where the detrimental effect of large
board size is arguably the result of boards becoming less effective at both the advisory
and monitoring functions.

11
4. DATA
The source for our sample of UK publicly quoted firms is Datastream, from which both
company board size and all financial variables are derived. Datastream reports both the
total number of (executive and non-executive) directors on the board and the number of
non-executive directors on the board. Non-executive directors are those that are neither
insiders nor officers of the firm, in contrast to executive directors. We restrict our
sample to those Datastream firm years in which data is available on the total number of
directors and the variables described below. Firm reporting on board size is very low
until the late 1970s. Coverage then increases over time. Board size observations are
available for less than 10% of Datastream firms in 1978 and 1979, roughly 50% in
1980, and 84% in 1981. We base our empirical analysis from 1981 onwards since this
year marks the start of high Datastream coverage on board size. We exclude financial
and property companies (Datastream Level 4 Industry groupings 80-89 inclusive). Our
final sample consists of an unbalanced panel of 2,746 companies between 1981 and
2002 for which we have 25,668 firm year observations. The balance of the panel is
shown in Table 2 below.
INSERT TABLE 2 HERE
Table 3 below presents the summary statistics for the variables used in the regression
analysis. Our key dependent variable is profitability. Return on assets (ROA) is the ratio
of operating profit before depreciation and provisions divided by total assets.
Throughout the analysis we also employ two other performance measures for
robustness; Tobin’s Q and the annual share return. Tobin’s Q is proxied by book value
of total assets plus market value of equity minus book value of equity divided by book

12
value of total assets (Cheng and Pruitt, 1994; and Perfect and Wiles, 1994). Share return
is the annual share return over the 12 months preceding the financial year end.
INSERT TABLE 3 HERE
Our key explanatory variable is board size, which is measured by the logarithm of
the total number of directors (Board size). We employ the logarithm of board size, as do
previous studies which show that the relationship between board size and performance
is convex rather than linear (see e.g., Yermack, 1996).5
Following Yermack (1996) and Coles et al., (2008) we include several other
explanatory variables. Size is the logarithm of the market value of equity adjusted for
inflation.6 Age is the logarithm of the number of years since the firm was first listed on
Datastream. Debt is the sum of long term debt, short term debt and preference capital,
divided by the sum of shareholder funds, long term debt, short term debt and preference
capital. R&D is research and development expenditure divided by sales, which we
include as a growth measure. STDDEV is the standard deviation of monthly stock
returns over the 12 months preceding the financial year end. All variables are
winsorized at the 1st and 99th percentiles to remove influential outliers.
In additional tests (Section 5.4 below) we also control for the impact of board
structure, diversification, and ownership structure. These variables are available for
smaller subsamples and are also reported in Table 3. Datastream reports the number of
non-executive directors on the board (where non-executive directors are those that are
neither insiders nor officers of the firm), and our board structure variable is therefore the
number of non-executive directors divided by the total number of directors (%
Outsiders).7 # Outsiders is the number of non-executive directors on the board. #
Insiders is the number of executive directors on the board. The breakdown of firm sales
13
by 3-digit SIC code is available on Datastream from 1988 onwards, and consistent with
prior studies (e.g., Linck et al., 2008), we employ the number of reported segments (#
Segments) as a proxy for diversification (14,894 firm year observations). Aggregate
board ownership is available on Datastream for the two most recent years of firm data
(5,034 firm year observations).
5. EMPIRICAL RESULTS
5.1 Main results
Our econometric approach closely follows that of Wintoki (2007). The specific
econometric regression that we run is as follows:
ROA = α + β1 Board size + β2 Size + β3 Age + β4 Debt + β5 R&D + β6 STDDEV +
Industry dummies + Year dummies + ε (1)
In addition to the explanatory variables described in Section 4, we also include
industry dummy variables (Industry dummies) which are defined with Datastream Level
four industry groupings, and year dummy variables (Year dummies). We firstly estimate
Equation (1) with ordinary least squares (OLS). In order to correct for clustering of
standard errors within firms, t-statistics are based on robust standard errors in which
observations are clustered at the firm level. The results are reported in Column (1) of
Table 4.
INSERT TABLE 4 HERE
The regression estimates show a negative and significant relationship between firm
profitability and board size. The estimate for the board-size log coefficient of -0.023
implies that expanding a six-person board by one member implies a reduction in
profitability of about 0.004. This change is economically significant. Since the average

14
firm in the sample has an asset value of £551m, a change in profitability of 0.004 is
equal to approximately £1.95 million for the average firm.8 The negative coefficient is
consistent with the hypothesis that coordination, communication, and decision making
problems increasingly hinder board performance when the number of directors
increases.
Coefficient estimates for the other variables in Table 4 are all statistically significant.
Size has a positive effect on ROA, whilst age, leverage, R&D, and STDDEV have a
negative effect.
5.2 Alternative econometric methods
We check the robustness of our key finding of a negative relationship between board
size and firm performance using a number of other different regression techniques. In
order to further control for outliers, we employ a median regression model which yields
an estimate of -0.025 for the board-size coefficient (significant at the one percent level).
In order to further control for bias in standard errors, we run year-by-year cross-
sectional estimates. These yield negative and significant coefficients for the board size
log variable in 12 of the 22 years, negative and insignificant coefficients in eight years,
and positive coefficients in just two years.
To address the concern that board size and profitability are jointly determined by
unobservable firm specific variables, we employ a fixed-effects model, which represents
a common method of controlling for omitted variables in a panel data set (see e.g.,
Yermack, 1996; and Wintoki, 2007). The results are reported in Column (2) of Table 4.
The coefficient estimate for board size is -0.011. This is less half the size of the OLS
estimate, but is still statistically significant at the one percent level. The other estimated
coefficients are of the same sign and statistical significance as the OLS results.

15
A major econometric concern highlighted by recent studies is that past and current
firm performance determines board size (Lehn et al., 2004; Boone et al., 2007; Coles et
al., 2008; Guest, 2008; and Linck et al., 2008). Hermalin and Weisbach (1988) show
that firms add outside directors during/following periods of poor performance. The
addition of outsiders is unlikely to come at the expense of insiders and so board size
may increase, yet the causation runs from performance to board size and not vice versa.
Ordinary least squares and fixed effects analysis will be biased in the presence of such
dynamic and simultaneous endogeneity.
To address this concern, some previous studies employ instrumental variable
analysis. However, as Wintoki (2007) points out, in corporate governance studies it is
very difficult to use such an approach because valid identification requires us to find
purely exogenous instruments which are correlated with board size but independent of
firm performance. To illustrate, we employ a two stage least squares analysis, where
we firstly model board size as endogenously determined by all the explanatory variables
in Table 3 (except board size) as well as two additional instrumental variables, free cash
flow and industry concentration. Both measures have been employed as determinants of
board size in previous studies.9 Secondly, the estimate of this endogenous board size
variable is used as an independent variable in the first regression in Table 4. The
coefficient estimate for instrumented board size is significantly negative. However, both
the Sargan test and Basmann test for instrument exogeneity reject the assumption that
our two instruments are exogenous and valid, and therefore the use of instrumental
variable analysis in this case.
In order to deal with the problems of unobserved heterogeneity, simultaneous
endogeneity and dynamic endogeneity, Wintoki (2007) employs the use of the GMM

16
dynamic panel data estimation procedure. This approach allows board size (and other
explanatory variables) to be determined by past and present performance but not future
performance, and therefore provides an appropriate econometric specification for
dealing with the endogeneity problems faced here.10 The approach includes lagged
performance as an explanatory variable, and takes first differences, which eliminates the
company specific fixed effects. GMM estimation then uses lagged levels (by two
periods and earlier) of board size and performance as instruments, which controls for
both dynamic and simultaneous endogeneity. We estimate the model using the
Arrellano and Bond (1991) procedure. We treat the other control variables (size, debt,
age, R&D, STDDEV) as endogeneous, and use up to 20 years of lagged values as
instruments.
The results using GMM analysis are reported in Column (3) of Table 4. The
coefficient estimate for board size log is -0.019, which is statistically significant at the
one percent level. The validity of the instrument set and the success of the
instrumentation process in purging the estimates of second order serial correlation are
examined using the Sargan test of instrument validity and a test for second order serial
correlation, respectively. Diagnostics for the instrument set are satisfactory. Both the
Sargan p-value and the 2nd order serial correlation p-value are insignificant (p-values of
0.3276 and 0.3020 respectively). We are reasonably confident therefore that our key
finding of a negative impact of board size on performance is not driven by unobserved
firm effects, simultaneous endogeneity, or dynamic endogeneity.
5.3 Alternative performance measures
We check the robustness of our findings to alternative performance measures as the
dependent variable. Firstly, we employ Tobin’s Q and the annual share return as the
17
dependent variable. Table 5 below presents the results using OLS analysis. Consistent
with the finding for profitability, both dependent variables have a significantly negative
relationship with board size. Companies with large boards appear to have lower Tobin’s
Q and lower share returns. As with profitability, the impacts are economically
significant. For example, in the Tobin’s Q regression, the estimate for the board-size log
coefficient of -0.616 implies that expanding a six-person board by one member implies
a reduction in Q of about 0.1. Since the average sample firm has a market value of
£392m and Tobin’s Q of 1.53, a change in Q of 0.1 reduces firm value by
approximately £25.6 million for the average firm.
INSERT TABLE 5 HERE
We employ four different methods of profitability. We divide pre-depreciation profit
by sales rather than total assets. We employ a cash flow measure numerator, by
adjusting pre-depreciation profit for changes in working capital, by subtracting
increases in stocks, work-in-progress, and debtors and by adding increases in creditors.
We also examine profit before interest and taxation over net assets, and net income over
shareholder funds. The results (untabulated) show the board size coefficient using all
four measures to be significantly negative.
One concern is that our results are driven by industry factors.11 Although we control
for this with industry dummy variables and firm fixed effects, we also employ an
industry adjusted profitability measure, calculated as the difference with median
profitability for all firms within the same Datastream Level four industry classification.
The results (untabulated) are very similar to those in Table 4, the coefficient for board
size log having a value of -0.02 and being significant at the one percent level.
5.4 Additional control variables

18
A further potential source of bias is that of omitted variables. In particular, some
previous board size – performance studies control for board composition, number of
business segments, and board ownership (e.g., Yermack, 1996; and Coles et al., 2008).
To test the sensitivity of our results to the inclusion of these additional control variables,
and to make our results more directly comparable with prior studies, we run three
additional regressions, using ROA as the dependent variable, on sub-samples for which
each of these variables is available. The results are reported in Columns (1)-(3) of Table
6 below, for the inclusion of board composition, number of business segments, and
board ownership respectively.
INSERT TABLE 6 HERE
Column (1) shows that the coefficient for % Outsiders is significantly negative.
However, the inclusion of this variable does not change the board size – performance
relation; the estimated coefficient for board size is -0.022 and significantly negative.
Column (2) shows that the coefficient for # Segments is significantly negative.
However, the estimated coefficient for board size is -0.012 and significantly negative,
hence the board size – performance relation is unaffected. Column (3) shows that the
coefficient for board ownership is significantly positive, whilst the coefficient for board
size is now smaller and statistically insignificant (-0.010). However, the insignificance
of the board size coefficient appears to be driven by the smaller sample employed.
When the regression is run for this subsample excluding board ownership, the board
size coefficient is still insignificantly negative with a similar value (-0.009). There is
therefore no evidence that the inclusion of board ownership changes the relation
between board size and performance.
5.5 Precise specification for the board size - performance relation

19
We investigate further the precise specification of the board size - performance
relation to establish whether there is an optimal board size or whether the results
suggest that boards should always be as small as possible.12 We do this by including
dummy variables for each different board size except for a board size of three (for
which there are 801 observations), which acts as the base case. The results are reported
in Columns (1)-(3) of Table 7 below for profitability, Tobin’s Q, and share return
respectively.
INSERT TABLE 7 HERE
The results differ by performance measure. For the profitability regression, the
coefficients for board size dummy variables 4 through 8 are all significantly positive,
those for board sizes 9 though 11 are statistically insignificant, whilst those for board
sizes 12 through 17 are significantly negative, and increasingly so. Therefore for this
measure, there is strong evidence of an inverted U-shaped relation between board size
and performance, which suggests that the optimal board size is between four and six.
However, in contrast, for Tobin’s Q and share return, there is clear evidence of a
negative linear relation between board size and performance, which implies in both
cases that the optimal board size is the minimum of three. Our results are therefore
somewhat inconclusive, the best we can conclude being that the optimal size lies at 9
and below, since for all performance measures the coefficients for all board sizes greater
than 9 are negative.
5.6 The separate impact of the number of inside and outside directors
Thus far we have treated the board as a homogenous group. However, as described in
Section 2, board size may have different effects depending on whether it consists of
inside or outside directors. To examine this issue, we re-estimate the regressions in

20
Table 4, replacing the log of board size with the log of the number of outside directors
(# Outsiders), and the log of the number of inside directors (# Insiders). Table 8 below
presents the results, with Columns (1)-(3) reporting the results of using ROA, Tobin’s
Q, and share returns respectively as the dependent variable.
INSERT TABLE 8 HERE
Again, our results differ by performance measure. For the profitability regression
(Column (1)), the coefficient for the number of outsiders is significantly negative,
whilst the coefficient for the number of insiders is not (being insignificantly negative),
and the two coefficients are significantly different from one another. However, in the
Tobin’s Q and share return regressions, both coefficients are significantly negative, and
there is no significant difference between the two. Therefore for the Tobin’s Q and
share returns, larger numbers of outsiders and insiders both result in lower performance,
indicating that the deterioration in performance stems from coordination costs, not
necessarily from lack of information to make value-maximizing decisions. This finding
supports our argument that any detrimental impact of larger boards in the UK will result
from the ineffectiveness of the advisory role rather than the monitoring role. Since
insiders are not expected to monitor but are expected to advise, the negative impact of
insider number is likely the result of their advisory role being undermined. Lastly, these
findings are unlikely to be driven by reverse causality because it is not expected that
boards increase the number of insiders following/during poor performance, only the
number of outsiders. However, since this finding does not hold for profitability, our
overall conclusion is that the negative impact of the number of outsiders is robust,
whilst the negative impact of the number of insiders is mixed.
5.7 Changes over time in the board size - performance relation

21
We examine whether the board size – performance relation has changed over time,
and in particular following the two significant board structure reforms over our sample
period. The Cadbury Report (1992) recommended that boards include at least three
outside directors, and the Hampel Report (1998) recommended that boards include at
least one third outside directors.13 Both reports resulted in larger boards after controlling
for the normal determinants of board size (Guest, 2008). One possibility is that these
reforms caused an inefficient increase in board size, leading to a negative (or more
negative) board size – performance relation.
To test this, we examine whether our results differ from before to after the Cadbury
Code. We include a dummy variable which is equal to zero prior to the Cadbury
implementation date (30/06/1993), and equal to one afterwards. We interact this dummy
variable with the board size log variable to examine whether the board size –
performance relation differs following Cadbury. The results (not tabulated) differ by
performance measure. The profitability regression shows that the board size –
performance relation is significantly less negative following Cadbury. However, the
share return regression shows that the relation is significantly more negative afterwards,
whilst for Tobin’s Q there is no significant difference. Furthermore, for each
performance measure we find that both before and after Cadbury, the board size –
performance relation is significantly negative. We conclude that there is no robust
evidence showing that board size – performance relation changed in a consistent way
following the corporate governance reforms of the 1990s.
5.8 Does the board size – performance relation differ by firm characteristics?
Finally, as described in Section 2, Coles et al. (2008) argue that the impact of board
size on performance will differ for different types of firms. In particular, for firms that

22
are large, old and have high debt, large board size may be an optimal value maximising
outcome. In contrast, for firms with high R&D and variability in performance, small
board size may be optimal.14 In order to examine this, we employ a similar method to
Coles et al. (2008) and include interactive variables between board size and each of
these measures. If the impact of board size has a different impact according to these
firm characteristics, then the coefficient for these interactive variables should be
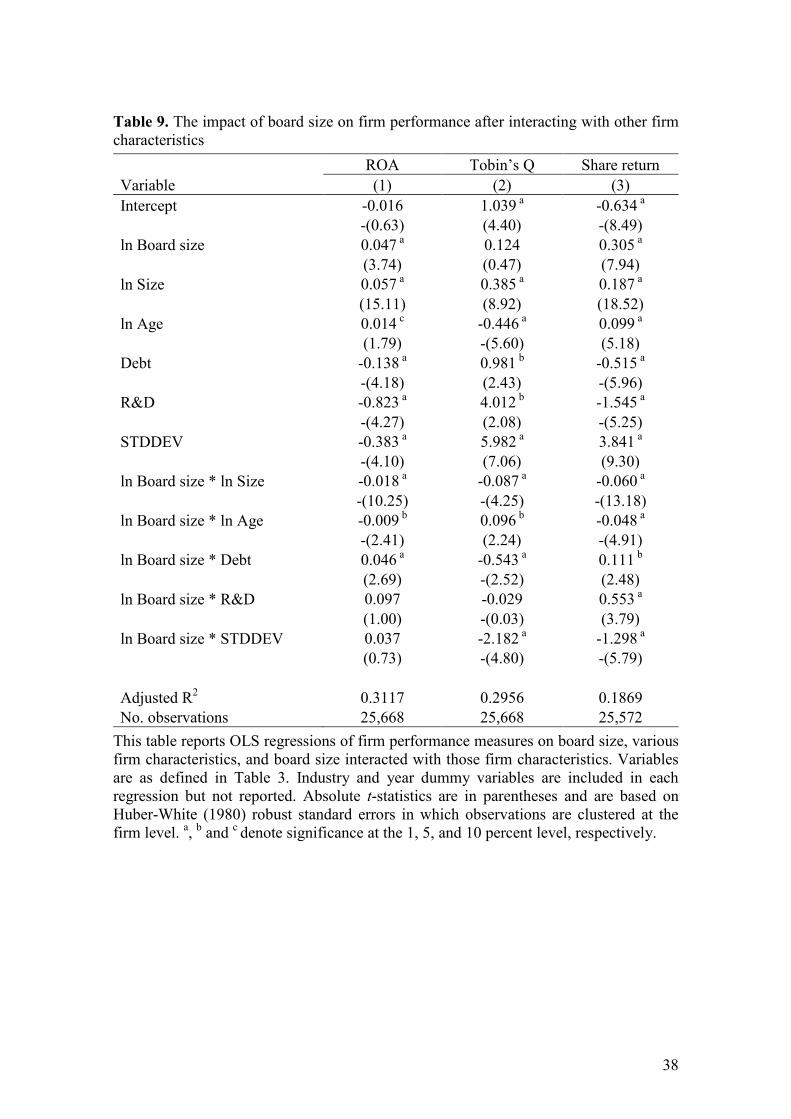
significant. The results are reported in Table 9 below. Columns (1)-(3) report the results
of using ROA, Tobin’s Q, and share returns respectively as the dependent variable.
INSERT TABLE 9 HERE
The coefficient for the interactive board size and firm size variable (Board size *
Size) is significantly negative in all three regressions. The coefficient for the other
interactive variables do not have a consistent sign across all three performance
measures. The size result implies that board size has a more negative impact on
performance in large firms that it does in small firms. Therefore, although larger UK
firms have larger boards (Guest, 2008) our evidence suggests that this is a suboptimal
rather than optimal outcome, whereby many large firms could improve performance by
moving to a smaller board size.
We explore this finding further by examining whether small firms also demonstrate a
negative board size – performance relation. We split all firms into quintiles based on
firm size for each year of the analysis. We rerun our regressions for each size quintile.
The results (untabulated) show that for profitability, board size is significantly negative
for only the largest two quintiles, insignificantly negative for quintiles 2-3, and
insignificantly positive for quintile 1. For share returns, board size is significantly
negative for only the largest quintile, insignificantly negative for quintiles 2-4, and

23
insignificantly positive for quintile 1. In contrast however for Tobin’s Q, the coefficient
for board size is significantly negative for all 5 quintiles. Therefore, for two of our three
performance measures, board size does not have a significantly negative impact for
small to medium size firms. We therefore provide some evidence that the negative
impact of board size on performance is not unequivocal (although a priori we expected
this to apply to large not small firms).
6. CONCLUSIONS
Using the largest sample employed to date over a long time period, we examine the
impact of board size on firm performance in the UK. The UK provides an interesting
institutional setting for this issue, because UK boards play a much weaker monitoring
role than US firms and therefore any negative impact of large board size is likely to
reflect the malfunction of the board’s advisory rather than monitoring role. Our key
conclusion is that we find board size has a negative impact on firm performance. This
basic result proves robust to regression models which control for unobserved
heterogeneity and the possibility that board size is simultaneously and dynamically
determined by firm performance. Our results are also robust to different performance
measures such as Tobin’s Q, share returns and other profitability measures, and to
controlling for a wide range of other factors. Our results are consistent with the
arguments of scholars and regulators who have argued for small boards of directors,
citing problems of poor communication and decision-making which undermine the
effectiveness of large groups.
Our results are somewhat inconclusive on the precise identification of an optimal
board size since this differs by performance measure, although we can reasonably
conclude that it is less than ten members. With regard to the differential impact of the
24
number of inside and outside directors, the number of outsiders has a significantly
negative and robust impact. The impact of the number of insiders is also negative but
not always significantly so, depending on the performance measure. With regard to any
changing relation over time, the board size – performance relation is significantly
negative both before and after the UK corporate governance reforms of the 1990s, and
although there are differences, these are not robust across the different performance
measures. Recent studies have shown that board size is determined by certain firm
characteristics, raising the possibility that board size is optimally determined. However,
we find no evidence that these characteristics lead to a more positive board size – firm
performance relation. In contrast, we find that large firms, which are more likely to have
large boards, are those firms for which the negative board size – performance relation is
the strongest.
The interpretation of our results and the implications for regulation is not
straightforward. One common interpretation of a negative board size – performance
relation is that many boards are inefficiently and persistently too large, and that a ‘one
size fits all’ approach to board size would improve performance for such firms (e.g.,
Jensen, 1993). This begs the question as to why competitive pressures have not
eliminated firms with such inefficiently large boards. An alternative explanation is that
such firms have an economically optimal target board size but are temporarily out of
equilibrium. Coles et al. (2008) suggest several transaction costs which could prohibit
firms from moving to an optimal size within a short time frame. For example, removing
a director purely for downsizing reasons could damage the firm’s reputation for
honoring implicit contracts, and therefore its ability to recruit in future (Coles et al.,
2008, p. 335). Consistent with this, Wintoki and Yang (2007) show that firms do have

25
target board sizes and that large firms take longer to reach these targets, one possible
explanation for our finding that the negative board size – performance relation is
stronger for large firms. Therefore, despite our robust finding of a negative impact of
board size on performance, especially for large firms, it does not necessarily follow that
a rule to restrict large boards will improve performance.

26
REFERENCES
Adams, R. B. and Ferreira, D. (2007) A theory of friendly boards, Journal of Finance,
62, 217-250.
Adams, R. and Mehran, H. (2005) Corporate performance, board structure and its
determinants in the banking industry, Working paper, Federal Reserve Bank of
New York.
Agrawal, A. and Knoeber, C. R. (1996) Firm performance and mechanisms to control
agency problems between managers and shareholders, The Journal of Financial and
Quantitative Analysis, 31, 377-397.
Arellano, M. and Bond, S. (1991). Some tests of specification for panel data: Monte
Carlo evidence and application to employment equations, The Review of Economic
Studies, 58, 277-297.
Beiner, S., Drobetz, W., Schmid, F. and Zimmermann, H. (2004) Is board size an
independent corporate governance mechanism? Kyklos, 57, 327-356.
Beiner, S., Drobetz, W., Schmid, M. M. and Zimmermann, H. (2006) An integrated
framework of corporate governance and firm valuation, European Financial
Management, 12, 249-283.
Bennedsen, M., Kongsted, H. C. and Nielsen, K. M. (2008) The causal effect of board
size in the performance of small and medium-sized firms, Journal of Banking &
Finance, 32, 1098-1109
Boone, A. L., Field, L. C., Karpoff, J. M. and Raheja, C. G. (2007) The determinants of
corporate board size and composition: An empirical analysis, Journal of Financial
Economics, 85, 65-101.
Bozec, R. (2005) Boards of directors, market discipline and firm performance, Journal
of Business Finance & Accounting, 32, 1921-1960.
FRC (2003) The Combined Code on Corporate Governance July 2003, Financial
Reporting Council, London.
Cadbury, A. (1992) Report of the Committee on the Financial Aspects of Corporate
Governance. Gee Publishing, London.
Cheng, S., Evans III J. H. and Nagarajan, N. (2008) Board size and firm performance:
the moderating effects of the market for corporate control, Review of Quantitative
Finance and Accounting, forthcoming, DOI: 10.1007/s11156-007-0074-3.

27
Chung, K. H. and Pruitt, S. W. (1994) A simple approximation of Tobin’s q, Financial
Management, 23, 70-74.
Coles, J. L., Daniel, N. D. and Naveen, L. (2008) Boards: Does one size fit all? Journal
of Financial Economics, 87, 329-356.
Conyon, M. J. and Peck, S. I. (1998) Board size and corporate performance: Evidence
from European countries, The European Journal of Finance, 4, 291-304.
Cosh, A. and Hughes, A. (1987) The anatomy of corporate control: Directors,
shareholders and executive remuneration in giant US and UK companies, Cambridge
Journal of Economics, 11, 285-313.
Crespi-Cladera, R. and Renneboog, L. (2003) Corporate monitoring by shareholder
coalitions in the UK, Working paper, European Corporate Governance Institute.
Dalton, D., Daily, C., Johnson, J. and Ellstrand, A. (1999) Number of directors and
financial performance: A meta-analysis, Academy of Management Journal, 42, 674-
686.
Dalton, D. and Dalton, C. R. (2005) Boards of directors: Utilizing empirical evidence in
developing practical prescriptions, British Journal of Management, 16, S91-S97.
de Andres, P. A., Azofra, V. and Lopez, F. (2005) Corporate boards in some OECD
countries: Size, composition, functioning and effectiveness, Corporate
Governance. An International Review, 13, 197-210.
Eisenberg, T., Sundgren, S. and Wells, M. T. (1998) Larger board size and decreasing
firm value in small firms, Journal of Financial Economics, 48, 35-54.
Fama, E. and Jensen, M. C. (1983) Separation of ownership and control, Journal of Law
and Economics, 26, 301-326.
Franks, J., Mayer, C. and Renneboog, L. (2001) Who disciplines management in poorly
performing companies? Journal of Financial Intermediation, 10, 209-248.
Guest, P. M. (2008) The determinants of board size and composition: Evidence from the
UK, Journal of Corporate Finance, 14, 51-72.
Hampel, Sir R. (1998) Committee on Corporate Governance: Final Report, GEE
Publishing, London.
Haniffa, R. and Hudaib, M. (2006) Corporate governance structure and performance of
Malaysian listed companies, Journal of Business Finance & Accounting, 33, 1034-
1062.
28
Hermalin, B. E. and Weisbach, M. S. (1988) The determinants of board composition,
Rand Journal of Economics, 19, 589-606.
Hermalin, B. E. and Weisbach, M. S. (2003) Boards of directors as an endogenously
determined institution: A survey of the economic evidence, Economic Policy
Review, 9, 7-26.
Higgs, D. (2003) Review of the Role and Effectiveness of Non–Executive Directors,
Department of Trade and Industry/HMSO, London.
Huther, J. (1997) An empirical test of the effect of board size on firm efficiency,
Economics Letters, 54, 259–264.
Jensen, M. C. (1993) The modern industrial revolution, exit, and the failure of internal
control systems, Journal of Finance, 48, 831-880.
Lasfer, M.A. (2004) On the monitoring role of the board of directors: The case of the
adoption of Cadbury recommendations in the UK, Advances in Financial
Economics, 9, 287-326.
Lehn, K., Sukesh, P. and Zhao, M. (2004) Determinants of the size and structure of
corporate boards: 1935-2000, Working Paper, Katz Graduate School of Business.
Linck, J., Netter, J. and Yang, T. (2008) The determinants of board structure, Journal of
Financial Economics, 87, 308-328.
Lipton, M. and Lorsch, J. W. (1992) A modest proposal for improved corporate
governance, Business Lawyer, 48, 59- 77.
Loderer, C. and Peyer, U. (2002) Board overlap, seat accumulation and share prices,
European Financial Management, 8, 165-192.
Mak, Y. T. and Kusnadi, Y. (2005) Size really matters: Further evidence on the negative
relationship between board size and firm value, Pacific-Basin Finance Journal, 13,
301-318.
Perfect, S. B. and Wiles, K. W. (1994) Alternative construction of Tobin’s q – An
empirical comparison, Journal of Empirical Finance, 1, 313-341.
Postma, T. J. B. M., Hans van Ees and Sterken, E. (2003) Board composition and firm
performance in the Netherlands, Eastern Economic Journal, 29, 41-58.
Raheja, C. G. (2005) Determinants of board size and composition: A theory of
corporate boards, Journal of Financial and Quantitative Analysis, 40, 283-306.

29
Short, H. and Keasey, K. (1999) Managerial ownership and the performance of firms:
Evidence from the UK, Journal of Corporate Finance, 5, 79-101.
Vafeas, N. (1999) Board meeting frequency and firm performance, Journal of Financial
Economics, 53, 113-142.
Vafeas, N. and Theodorou, E. (1998) The relationship between board structure and firm
performance in the UK, British Accounting Review, 30, 383-407.
Wintoki, J. (2007) Endogeneity and the dynamics of corporate governance, Working
paper, University of Georgia.
Wintoki, M. B. and Yang, T. (2007) Do firms adjust to a target board structure?
Working paper, University of Georgia.
Wu, Y. (2004) The impact of public opinion on board structure changes, director career
progression, and CEO turnover: Evidence from CalPERS’ corporate governance
program, Journal of Corporate Finance, 10, 199-227.
Yermack, D. (1996) Higher market valuation of companies with a small board of
directors, Journal of Financial Economics, 40, 185-221.

30
Table 1. The effect of board size on performance: Summary of previous studies
Study Year Country Time period # unique firms # observations Econometric model Performance measure
Tobin’s Q Profitability
Bozec 2005 Canada 76-00 25 459 OLS -
Conyon & Peck 1998 Denmark 92-95 22 88 GMM - - *
Bennedsen et al. 2008 Denmark 99 6,850 6,850 OLS/IV - * / -
Eisenberg et al. 1998 Finland 92-94 879 879 OLS/IV - * / - *
Conyon & Peck 1998 France 92-95 60 240 GMM - - *
Postma et al. 2003 Holland 97 94 94 IV - * - *
Conyon & Peck 1998 Italy 92-95 21 84 GMM - - *
Mak & Kusnadi 2005 Malaysia 99-00 230 230 OLS - *
Haniffa & Hudaib 2006 Malaysia 96-00 347 1,735 OLS - * + *
Conyon & Peck 1998 Netherlands 92-95 31 124 GMM - * - *
Mak & Kusnadi 2005 Singapore 99-00 230 230 OLS - *
Loderer & Peyer 2002 Switzerland 80-95 169 330 OLS - * +
Beiner et al. 2004 Switzerland 01 165 165 OLS/IV - / - -
Beiner et al. 2006 Switzerland 02 109 109 OLS/IV + * / + *
Conyon & Peck 1998 UK 92-95 481 1,924 GMM - * - *
Lasfer 2004 UK 90-91/ 96-97 1,424 1,798 OLS - *
Yermack 1996 US 84-91 452 3,400 OLS/FE - * / - * - *
Vafeas 1999 US 90-94 307 307 OLS - *
Adams & Mehran 2005 US 86-99 35 472 FE/IV + * / +
Wintoki 2007 US 91-03 >6,000 >16,000 OLS/ FE/ GMM - * / - * / -
Cheng et al. 2008 US 84-91 350 2,199 OLS - * - *
Coles et al. 2008 US 92-01 Not reported 8,165 OLS - *
de Andres et al. 2005 10 OECD countries 96 450 450 OLS/IV - * / - * +
This table reports the findings of previous studies that examine the impact of board size on performance. OLS stands for ordinary least squares regression models, FEstands for fixed effects models, IV stands for instrumental variable models, and GMM stands for generalized method of moment models. * denotes statisticalsignificance at the 10% level or better.

31
Table 2. Sample description
Number of Data Observations Per Year Number of Yearly Data Observations PerFirm
Year DataObservations
Percent
of total
Number ofYearly DataObservations
Number ofFirms
Percent
of total
1981 1,021 3.98 1 220 8.01
1982 1,052 4.10 2 218 7.94
1983 1,107 4.31 3 174 6.34
1984 1,200 4.68 4 210 7.65
1985 1,189 4.63 5 258 9.40
1986 1,176 4.58 6 198 7.21
1987 1,175 4.58 7 139 5.06
1988 1,204 4.69 8 128 4.66
1989 1,206 4.70 9 112 4.08
1990 1,194 4.65 10 90 3.28
1991 1,187 4.62 11 74 2.69
1992 1,161 4.52 12 87 3.17
1993 1,160 4.52 13 83 3.02
1994 1,173 4.57 14 70 2.55
1995 1,210 4.71 15 63 2.29
1996 1,235 4.81 16 62 2.26
1997 1,265 4.93 17 62 2.26
1998 1,279 4.98 18 64 2.33
1999 1,185 4.62 19 66 2.40
2000 1,099 4.28 20 42 1.53
2001 1,123 4.38 21 59 2.15
2002 1,067 4.16 22 267 9.72
Total 25,668 100 Total 2,746 100
This table reports the firm year observations for the sample used in the analysis on ayear by year basis, and in terms of the number of yearly observations per firm. Thesample consists of all UK firms in the Datastream database that have information onboard size and the financial variables described in Table 2 below, for at least onefinancial year from 1981 to 2002. We exclude all financial and real estate firms(Datastream Level 4 Industry groupings 80-89 inclusive).

32
Table 3. Descriptive statistics for variables used in the analysis
Variable Number Mean Median Standarddeviation
Minimum Maximum
ROA 25,668 0.11 0.12 0.12 -0.47 0.38
Tobin’s Q 25,668 1.53 1.22 1.07 0.43 7.35
Share return 25,572 0.17 0.09 0.54 -0.80 2.46
Board size 25,668 7.18 7.00 2.62 3.00 17.00
Size 25,668 391.64 36.97 1,236.71 0.91 8,881.58
Age 25,668 13.44 12.00 9.44 0.00 37.00
Debt 25,668 0.30 0.27 0.23 0.00 1.00
R&D 25,668 0.01 0.00 0.06 0.00 0.57
STDDEV 25,668 0.11 0.10 0.07 0.02 0.39
% Outsiders 19,307 0.41 0.40 0.16 0.00 0.80
# Outsiders 19,307 3.05 3.00 1.71 0.00 10.00
# Insiders 19,307 4.36 4.00 1.89 -6.00 16.00
# Segments 14,894 1.73 1.00 1.08 1.00 11.00
Board ownership 5,034 15.37 6.20 19.81 0.00 100.00
This table reports summary statistics for the sample. ROA is the ratio of operating profitbefore depreciation and provisions divided by total assets. Tobin’s Q is book value oftotal assets plus market value of equity minus book value of equity divided by bookvalue of total assets. Share return is the annual share return over the 12 monthspreceding the financial year end. Board size is the total number of directors on theboard. Size is the market value of equity in millions sterling adjusted for inflation. Ageis the number of years since the firm was first listed on Datastream. Debt is the sum oflong term debt, short term debt and preference capital, divided by the sum ofshareholder funds, long term debt, short term debt and preference capital. R&D isresearch and development expenditure divided by sales. STDDEV is the standarddeviation of monthly stock returns over the 12 months preceding the financial year end.% Outsiders is the number of non-executive directors divided by the total number ofdirectors. # Outsiders is the number of non-executive directors on the board. # Insidersis the number of executive directors on the board. # Segments is the number ofcompany 3 digit SIC codes. Board ownership is aggregate percentage share ownershipof the board. All variables are winsorized at the 1st and 99th percentiles to removeextreme observations.

33
Table 4. The impact of board size and composition on firm performance (ROA)
OLS Fixed effects GMM
Variable (1) (2) (3)
Intercept 0.083 a 0.086 a 0.048 a
(2.74) (9.34) (3.22)
ln Board size -0.023 a -0.011 a -0.019 a
-(5.61) -(2.97) -(3.28)
ln Size 0.020 a 0.027 a 0.017 a
(22.71) (19.54) (8.89)
ln Age -0.005 a -0.007 a -0.005 a
-(3.80) -(2.65) -(2.58)
Debt -0.057 a -0.057 a -0.014 b
-(8.96) -(8.75) -(2.13)
R&D -0.634 a -0.387 a -0.428 a
-(16.96) -(8.16) -(14.46)
STDDEV -0.341 a -0.118 a -0.028-(18.27) -(8.77) -(1.30)
ROA t-1 0.403 a
(40.66)
Industry dummies Yes No NoYear dummies Yes Yes YesAdjusted R2 0.3194 0.2325Sargan (p-value) 0.3276Serial correlation (p-value) 0.3020No. observations 25,668 25,668 20,143
This table reports regressions of return on assets (ROA) on board size and various firmcharacteristics. Variables are as defined in Table 3 above. Column (1) presents ordinaryleast squares estimates. Column (2) presents estimates from a fixed effects model.Column (3) presents estimates from a generalized method of moments model (Arellanoand Bond, 1991). Absolute t-statistics are in parentheses. For columns (1) and (2) theseare based on Huber-White (1980) robust standard errors in which observations areclustered at the firm level. a, b and c denote significance at the 1, 5, and 10 percent level,respectively.

34
Table 5. The impact of board size on other firm performance measures
Tobin’s Q Share return
Variable (1) (2)
Intercept 2.019 a 0.208 a
(23.79) (8.01)
ln Board size -0.616 a -0.140 a
-(13.50) -(11.36)
ln Size 0.209 a 0.065 a
(21.46) (27.65)
ln Age -0.270 a 0.008 b
-(20.94) (2.27)
Debt -0.034 -0.331 a
-(0.53) -(21.34)
R&D 3.927 a -0.503 a
(11.43) -(8.56)
STDDEV 2.093 a 1.501 a
(12.68) (19.13)
Adjusted R2 0.2879 0.1780No. observations 25,668 25,572
This table reports OLS regressions of firm performance ratios on board size and variousfirm characteristics. Variables are as defined in Table 3 above. Industry and yeardummy variables are included in each regression but not reported. Absolute t-statisticsare in parentheses and are based on Huber-White (1980) robust standard errors in whichobservations are clustered at the firm level. a, b and c denote significance at the 1, 5, and10 percent level, respectively.

35
Table 6. The impact of board size on firm performance (ROA) after controlling forboard composition, number of business segments, and board ownership
Variable (1) (2) (3)
Intercept 0.085 a -0.027 c 0.021(3.96) -(1.68) (0.84)
ln Board size -0.022 a -0.012 b -0.010-(4.46) -(2.12) -(1.31)
ln Size 0.020 a 0.025 a 0.025 a
(19.80) (20.65) (17.64)
ln Age -0.004 b -0.003 b 0.004-(2.37) -(2.16) (1.51)
Debt -0.050 a -0.048 a -0.023 b
-(7.04) -(6.07) -(2.29)
R&D -0.645 a -0.667 a -0.594 a
-(15.88) -(14.95) -(14.34)
STDDEV -0.372 a -0.364 a -0.401 a
-(17.13) -(15.13) -(11.21)
% Outsiders -0.032 a
-(3.63)
# Segments -0.009 a
-(6.93)
Board ownership 0.001 a
(4.98)
Adjusted R2 0.3375 0.3378 0.3672No. observations 19,307 14,894 5,034
This table reports OLS regressions of return on assets (ROA) on board size and variousfirm characteristics. Variables are as defined in Table 3 above. Industry and yeardummy variables are included in each regression but not reported. Absolute t-statisticsare in parentheses and are based on Huber-White (1980) robust standard errors in whichobservations are clustered at the firm level. a, b and c denote significance at the 1, 5, and10 percent level, respectively.

36
Table 7. Decomposition of the negative board size effect on firm performance
ROA Tobin’s Q Share returnVariable (1) (2) (3)Board size 4 0.020 a -0.296 a -0.005
(2.90) -(3.69) -(0.25)Board size 5 0.020 a -0.446 a -0.024
(2.95) -(5.35) -(1.15)Board size 6 0.020 a -0.537 a -0.036 c
(2.83) -(6.40) -(1.79)Board size 7 0.016 b -0.597 a -0.045 b
(2.28) -(7.13) -(2.25)Board size 8 0.012 c -0.639 a -0.059 a
(1.76) -(7.36) -(2.82)Board size 9 0.004 -0.756 a -0.111 a
(0.56) -(8.55) -(4.95)Board size 10 -0.007 -0.885 a -0.146 a
-(0.97) -(9.64) -(6.11)Board size 11 -0.012 -0.950 a -0.175 a
-(1.48) -(9.93) -(6.75)Board size 12 -0.024 a -0.996 a -0.175 a
-(2.79) -(10.05) -(6.54)Board size 13 -0.026 a -1.053 a -0.210 a
-(3.03) -(10.00) -(7.90)Board size 14 -0.021 b -1.066 a -0.176 a
-(2.01) -(8.65) -(4.81)Board size 15 -0.031 a -1.030 a -0.252 a
-(2.67) -(7.39) -(5.79)Board size 16 -0.027 b -1.145 a -0.327 a
-(2.06) -(6.93) -(8.66)Board size 17 -0.035 b -1.094 a -0.271 a
-(2.41) -(6.00) -(5.57)
Adjusted R2 0.3249 0.2892 0.1801No. observations 25,668 25,668 25,572
This table reports OLS regressions of firm performance on board size and various firmcharacteristics. Variables are as defined in Table 3 above. Dummy variables areincluded for each different board size except for a board size of three, which acts as thebase case. Control variables are included (as in Column (1) of Table 4 (ln Size, ln Age,Debt, R&D, STDDEV) and as defined in Table 3) but not reported. Industry and yeardummy variables are also included in each regression but not reported. Absolute t-statistics are in parentheses and are based on Huber-White (1980) robust standard errorsin which observations are clustered at the firm level. a, b and c denote significance at the1, 5, and 10 percent level, respectively.

37
Table 8. The separate impact of inside and outside director number on firmperformance
ROA Tobin’s Q Share return
Variable (1) (2) (3)
Intercept 0.090 b 1.155 a 0.072(2.40) (4.61) (0.76)
ln Outsiders -0.017 a -0.321 a -0.092 a
-(5.97) -(11.40) -(10.38)ln Insiders -0.004 -0.370 a -0.076 a
-(1.29) -(11.00) -(7.46)ln Size 0.020 a 0.229 a 0.069 a
(19.76) (21.08) (23.45)ln Age -0.003 b -0.240 a 0.002
-(2.32) -(16.54) (0.45)Debt -0.050 a 0.070 -0.317 a
-(7.06) (1.02) -(18.35)R&D -0.646 a 3.162 a -0.451 a
-(15.88) (7.97) -(6.29)STDDEV -0.371 a 1.505 a 1.249 a
-(17.09) (7.82) (13.22)
Test for difference between lnOutsiders and ln Insiders
9.42 a 1.74 1.82
Adjusted R2 0.3376 0.3351 0.1674No. observations 19,304 19,304 19,225
This table reports OLS regressions of firm performance ratios on board size and variousfirm characteristics. Variables are as defined in Table 3 above. Industry and yeardummy variables are included in each regression but not reported. Absolute t-statisticsare in parentheses and are based on Huber-White (1980) robust standard errors in whichobservations are clustered at the firm level. a, b and c denote significance at the 1, 5, and10 percent level, respectively
38
Table 9. The impact of board size on firm performance after interacting with other firmcharacteristics
ROA Tobin’s Q Share return
Variable (1) (2) (3)
Intercept -0.016 1.039 a -0.634 a
-(0.63) (4.40) -(8.49)ln Board size 0.047 a 0.124 0.305 a
(3.74) (0.47) (7.94)ln Size 0.057 a 0.385 a 0.187 a
(15.11) (8.92) (18.52)ln Age 0.014 c -0.446 a 0.099 a
(1.79) -(5.60) (5.18)Debt -0.138 a 0.981 b -0.515 a
-(4.18) (2.43) -(5.96)R&D -0.823 a 4.012 b -1.545 a
-(4.27) (2.08) -(5.25)STDDEV -0.383 a 5.982 a 3.841 a
-(4.10) (7.06) (9.30)ln Board size * ln Size -0.018 a -0.087 a -0.060 a
-(10.25) -(4.25) -(13.18)ln Board size * ln Age -0.009 b 0.096 b -0.048 a
-(2.41) (2.24) -(4.91)ln Board size * Debt 0.046 a -0.543 a 0.111 b
(2.69) -(2.52) (2.48)ln Board size * R&D 0.097 -0.029 0.553 a
(1.00) -(0.03) (3.79)ln Board size * STDDEV 0.037 -2.182 a -1.298 a
(0.73) -(4.80) -(5.79)
Adjusted R2 0.3117 0.2956 0.1869No. observations 25,668 25,668 25,572
This table reports OLS regressions of firm performance measures on board size, variousfirm characteristics, and board size interacted with those firm characteristics. Variablesare as defined in Table 3. Industry and year dummy variables are included in eachregression but not reported. Absolute t-statistics are in parentheses and are based onHuber-White (1980) robust standard errors in which observations are clustered at thefirm level. a, b and c denote significance at the 1, 5, and 10 percent level, respectively.

39
Endnotes
1 Regulators to date, whilst not being too prescriptive about board size, have pointed out thedisadvantages of large boards. For example, the UK Combined Code on corporate governancestates that, “boards should not be so large as to become unwieldy” (Code Provisions A.3.1,FRC, 2003).2 Yermack (1996) and Wu (2004) find that firms with smaller boards have a strongerrelationship between firm performance and CEO turnover than firms with larger boards,suggesting that smaller board size improves the quality of board actions as well as overall firmperformance.3 The Cadbury (1992) and Hampel (1998) Reports encouraged an increase in the number ofoutside independent directors, but although the proportion of outsiders increased followingCadbury (Dahya et al., 2002; and Guest, 2008), it is still relatively low and outside directorindependence is still weak due to an appointment process which is too informal (Higgs, 2003).4 However, increasing outside directors post-Cadbury did result in more effective CEO turnover(Dahya et al., 2002), CEO appointments (Dahya and McConnell, 2005), and firm performance(Dahya and McConnell, 2007).5 Our results are qualitatively unchanged if we use the number of directors rather than their log.6 All the absolute variables described here and employed in the subsequent analysis areconverted to 2002 sterling values using the UK Retail Price Index.7 Due to data availability on Datastream, we are only able to classify directors as executive ornon-executive, and not in terms of finer classifications of independence. This approach issimilar to most previous large sample studies for both the US and UK.8 This is calculated as follows: The log of 7 (1.95) minus the log of 6 (1.79) is 0.16, whichmultiplied by the coefficient of -0.023 gives -0.004. This multiplied by the average asset size of£551m gives -£1.95m.9 Free cash flow is a dummy variable set equal to one if for a given firm in a given year(relative to all other sample firms) it is ranked in the upper quartile in terms of cash holdingsand the lowest quartile in terms of market to book value. Industry concentration is calculated asthe sum of all the squared market shares, where market share for each firm is firm sales dividedby total sales for the industry, and industry is defined using Datastream Level four industrygroupings.10 See Wintoki (2007) for a detailed discussion on the advantages of this approach in acorporate governance setting.11 For example, mature low growth industries may tend to have larger firms with larger boardsbut also lower performance.12 Unlike US studies (e.g., Yermack, 1996), a sizeable minority (28 percent) of sampleobservations have board size below six, allowing us to examine board size – performancerelations at very low board size.13 Although carried out for similar reasons, UK and US corporate governance regulations differmarkedly. The 2002 Sarbanes-Oxley Act (SOA) is mandatory, requiring audit committees bylaw to be composed entirely of independent directors. In contrast, UK reforms have beenvoluntary and operate on a comply-or-explain basis.14 Guest (2008) finds that UK board size is positively related to firm size, age, and debt, whilstnegatively related to variability in performance.