Embed Size (px)
Citation preview

1
The Impact of BSE, FMD, and U.S. Export Promotion Expenditures on Japanese Meat Demand
Godfred Yeboah and Leigh J. Maynard
Department of Agricultural Economics, University of Kentucky
May, 2004
Contact Author:
Leigh Maynard 319 C.E. Barnhart Bldg.
Univ. of Kentucky Lexington, KY 40546 [email protected]
859-257-7286
Accepted for presentation at the annual meetings of the American Agricultural Economics Association, Denver, Co., August 1-4, 2004
Copyright 2000 by Godfred Yeboah and Leigh J. Maynard. All rights reserved. Readers may make verbatim copies of this document for non-commercial purposes by any means,
provided that this copyright notice appears on all such copies.

2
The Impact of BSE, FMD, and U.S. Export Promotion Expenditures on Japanese Meat Demand
Abstract
The study examined Japanese consumer response to the discovery of BSE and discusses
implications for the U.S. beef industry following BSE discovery in the U.S. Impacts of
FMD and export promotion expenditures were also modeled. Synthetic inverse and
ordinary demand systems were used to appropriately specify the demand system.
Background
Japan, with its economic might and high disposable income (2001 GNI per capita
of $35,990 (World Bank, 2002)), coupled with relatively low domestic production, has
always been seen as a potential market for high quality meat exports. However, in the late
1990�s meat imports and consumption decreased considerably in Japan. Among the
factors cited was the decline in economic activity and more importantly, the discovery of
Bovine Spongiform Encephalopathy (BSE) in Japanese herds (Hayes, Wahl and
Williams, 1990; Capps et al., 1994; Eales and Wessells, 1999; Peterson and Yun-Ju,
2003).
The main objective of this study is to examine any structural changes in Japanese
beef demand, especially due to the 1988 MMA agreement that eliminated quotas and the
discovery of BSE in Japanese herds. The study also examines Japanese consumer�s
response to the discovery of BSE and discusses the implications for U.S. exporters and
lessons for the U.S. cattle industry following BSE discovery in the U.S. Finally, the
study evaluates United States meat promotion efforts in Japan and its role in expanding
U.S. beef demand in Japan.

3
In empirical analysis, the choice among competing functional forms has mostly
been arbitrarily made, as economic theory does not provide a basis for selection. In this
case, however, we perform empirical tests to identify the most appropriate functional
form for this demand analysis. Studies by Alston and Chalfant (1993), Eales and
Wessells (1999), Fousekis and Revell (2000), Ogunyinka and Marsh (2003), among
others, have tested for the appropriate specification in demand analysis. An important and
related question to the choice of functional form is the choice of specification of the
demand model. Fourteen out of seventeen studies reviewed by Smallwood, Haidacher
and Blaylock (1989) had used the quantity dependent specification of demand. This has
been based on the assumption that prices are predetermined and quantity adjusts to clear
the market. However, as noted by Eales and Unnevehr (1994), there are some products
for which the notion of predetermined prices is untenable. Perishable products and
agricultural produce in particular, are subject to biological lags in production and can be
seen as having predetermined quantities.
This study models Japanese demand for beef products with characteristics similar
to those described for fish by Eales, Durham and Wessells (1997). These include
biological lags in production, import restriction and availability, storability of beef and
the existence of both fresh and frozen beef on the Japanese meat market. In Japan, beef
cuts sold at the retail level are mainly chilled with the frozen beef being channeled into
processing. However, when the premiums on chilled cuts are high, frozen cuts are sold at
the retail level. According to Reed and Iswariyadi (2001) this scenario is increasingly
observed for U.S. beef imports. Finally, monthly retail data are used in this study, as
opposed to the frequently used annual wholesale data in previous studies.

4
Empirical Model
An ordinary synthetic demand system originally due to Barten (1993) is utilized
to select from among four competing ordinary models. The system nests four ordinary
demand models; AIDS, Rotterdam, and the Central Bureau of Statistics (CBS) and
National Bureau of Research (NBR) models. The four models have identical right-hand-
side variables and are related as shown by Barten (1993) and Brown, Lee and Seale
(1994). The four models can be regarded as different ways of parameterizing the general
synthetic model. The general ordinary synthetic demand system is:
Synthetic model: ∑ −−++=j jjijiijiiii pdwweQdwdqdw ln)]([ln)(ln 21 δδδ (1)
In all models (and in the inverse models below), (i, j) = 1,�, N index the goods,
,ip iq and iw are the price, quantity and budget share for good i, and ijii b ββ ,, and ijb are
model parameters. In all cases, equations are indexed by i and price terms within
equation indexed by j. For the synthetic model (1), id is a weighted average of the
expenditure parameters from the differential AIDS and Rotterdam models given as:
,)1( 11 iii bd δβδ −+= and ije is the weighted average of the compensated price parameters
from the differential AIDS and Rotterdam models given as: .)1( 22 ijijij be δβδ −+= The
Kronecker delta ,ijδ is equal to one if i = j and zero otherwise.
Similarly, a synthetic inverse model developed by Brown, Lee and Seale (1994)
that nests four competing inverse models is utilized to help identify the most appropriate
inverse model. The inverse Rotterdam (IRDS), inverse AIDS (IAIDS), inverse Laitinen-
5
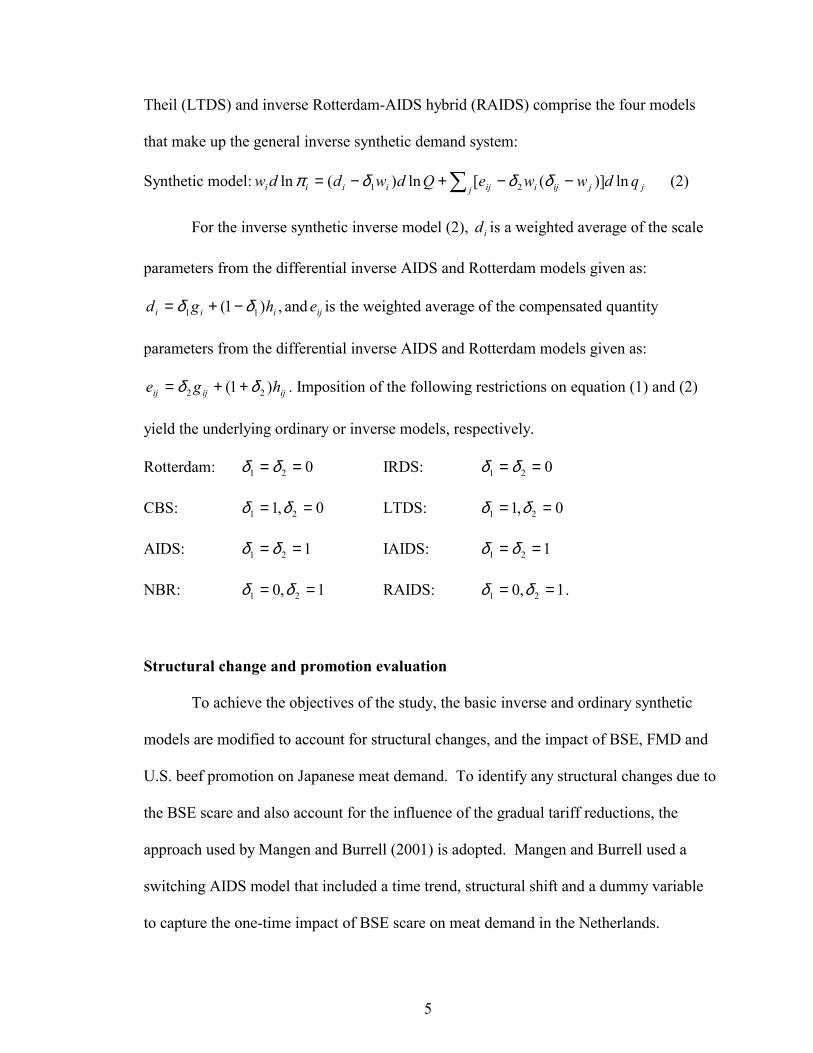
Theil (LTDS) and inverse Rotterdam-AIDS hybrid (RAIDS) comprise the four models
that make up the general inverse synthetic demand system:
Synthetic model: ∑ −−+−=j jjijiijiiii qdwweQdwddw ln)]([ln)(ln 21 δδδπ (2)
For the inverse synthetic inverse model (2), id is a weighted average of the scale
parameters from the differential inverse AIDS and Rotterdam models given as:
,)1( 11 iii hgd δδ −+= and ije is the weighted average of the compensated quantity
parameters from the differential inverse AIDS and Rotterdam models given as:
ijijij hge )1( 22 δδ ++= . Imposition of the following restrictions on equation (1) and (2)
yield the underlying ordinary or inverse models, respectively.
Rotterdam: 021 == δδ IRDS: 021 == δδ
CBS: 0,1 21 == δδ LTDS: 0,1 21 == δδ
AIDS: 121 == δδ IAIDS: 121 == δδ
NBR: 1,0 21 == δδ RAIDS: 1,0 21 == δδ .
Structural change and promotion evaluation
To achieve the objectives of the study, the basic inverse and ordinary synthetic
models are modified to account for structural changes, and the impact of BSE, FMD and
U.S. beef promotion on Japanese meat demand. To identify any structural changes due to
the BSE scare and also account for the influence of the gradual tariff reductions, the
approach used by Mangen and Burrell (2001) is adopted. Mangen and Burrell used a
switching AIDS model that included a time trend, structural shift and a dummy variable
to capture the one-time impact of BSE scare on meat demand in the Netherlands.

6
In this study it is assumed that the impact of varying tariffs rates are felt through
the increased openness of the Japanese economy over time and the general performance
of the Japanese economy. Thus, the trend variable will be expected to capture the impact
of varying tariff rates, any trend-induced changes in demographics that influence meat
consumption (Kinnucan et al., 1997), and the impact of any un-modeled trending
variables (Mangen and Burrell, 2001). A BSE dummy variable is included in this study to
determine changes that occurred in Japanese beef demand with the discovery of BSE in
Japan. A time path tr is assumed that allows the demand parameters to gradually change
over time and is defined below as:
,0=tr for 1,...1 tt =
)()( 121 ttttrt −−= for 21 ,.....1 ttt +=
1=tr for Ttt ,.....12 +=
where 1t is the end point of the first regime, 2t is the end of the transition period and T the
end of sample period.
Advertising or promotion is assumed to influence product demand. Two
approaches are described by Brester and Schroeder (1995). In the demand shifter
approach advertising variables are included as shift variables in demand models either as
a linear or auxiliary relationship. The second approach suggested by Theil (1980)
assumes that advertising affects demand elasticities of products. Advertising in this case
can be seen as acting as a �taste shifter� that affect the marginal utility of each good
(Kinnucan et al., 1997). Based on the observations of Coulibaly and Brorsen (1999),
Brester and Schroeder (1995) and Duffy (1995) that similar results are obtained by

7
modeling advertising as a demand shifter or as a scaling variable, and considering the
ease of estimation of the former, the demand shifter approach is used in this study.
Misspecification testing, endogeneity testing and functional form selection
The battery of misspecification tests advocated by McGuirk et al. (1995)
specifically for systems of equations is used to help identify any econometric violations
in the demand systems. The synthetic models purged of econometric violations are
subjected to endogeneity testing to select the appropriate specification of demand. The
system Durbin-Wu-Hausman test (McGuirk at al., 1995; Maynard and Veeramani, 2003)
is used to test for endogeneity in the right-hand-side variables. If parameter estimates are
significantly impacted by simultaneity from pd ln , qd ln and Qd ln , three stage least
squares (3SLS) estimation is appropriate.
Dummy variables D that take a value of one in July and December and zero all
other months of the year capture the gift giving seasons of December and July, when
Japanese workers receive annual bonuses.
The resulting empirical models are:
+−−+++++= ∑ j jjijiijtijiititiii pdwwerQdwdrdrqdw ln)]([ln)(ln 21 δδδσα l
∑ ++j jijBSEi AdaDf ln ∑ ∑ +−j k JDikjij DuAdy ln (13)
+−−++−++= ∑ j jjijiijtijiititiii qdwwerQdwdrdrdw ln)]([ln)(ln 21 δδδσαπ l
∑ ++j jijBSEi AdaDf ln ∑ ∑ +−j k JDikjij DuAdy ln (14)
Given equation (13) and (14) a test of 0,0,0 === σα l is a test of the hypothesis of no
structural change. The following demand restrictions apply to equations (13) and (14).

8
Adding up: ∑ ∑ ∑ ∑ ====i i i i iiii uf 0σα and ∑ ∑ ∑ ===
i i i ijijij ya 0l for all j
Homogeneity: ∑ ∑ ==i i ijij e 0l for all i
Symmetry: jiij ll = for jiij ee = all i,j.
Data
Four beef types, U.S., Australian, Japanese Wagyu and dairy, and pork, chicken
and fish are evaluated in this study. The sample data for pork, chicken and fish were not
distinguished by sources of origin. Previous studies have established that they should be
included as part of a separable meat group in modeling Japanese beef demand. The study
uses 105 monthly observations from April 1994 to December 2002.
Retail prices for beef and pork were derived from Agriculture and Livestock
Industries Corporations (ALIC) data. Beef prices were the weighted prices of four cuts
(chuck, loin, round and flank) reported by ALIC based on Nikkei Point-of-Sales (POS).
Retail pork prices were the weighted consumption shares of imported and domestic pork
weighted by the prices of three cuts (loin, shoulder and butt) reported by ALIC. Retail
prices for poultry and fish were both obtained from the Retail Price Survey (RPS) by the
Statistical Bureau (SB) Ministry of Public Management, Home Affairs, Post and
Telecommunications (MPMHAPT). Fish prices used in the study were the weighted
average of five fish types, tuna fish, horse mackerel, flounder, yellow tail and cuttlefish.
The fish types selected are composed of high, medium and low-end fish types. The
choice of fish types to include in the study reflects the most representative fish series for
which data were available and complete.

9
Quantity data ( iq ) represent per capita consumption of meat product i in grams.
Quantity variables were obtained by dividing aggregate consumption by population or
household consumption by the average number of persons per household. Data on beef,
pork and poultry quantities were obtained from reported consumption data by the SB,
MPMHAPT. Beef consumption data was derived from compiled ALIC data based on
retail sales. Fish consumption data was obtained by aggregating consumption data for the
five major fish types listed above and reported in the Family Income and Expenditure
Survey (FIES) administered by SB MPMHAPT.
Variables jA and kjA − represent real per capita advertising expenditures reported by
the U.S. Meat Export Federation (USMEF) and the lags of real per capita advertising
expenditures by k periods, respectively. Real per capita advertising expenditures were
obtained by converting USMEF advertising expenditures in dollars into Yen using Bank
of Japan spot rates and deflating by Japanese CPI and population. Exchange rate data
(yen/dollars) were obtained from Bank of Japan long-term time series data. The central
rate average monthly Interbank spot yen per dollars rate were used in this study. Monthly
Japanese CPI was obtained from the SB, MPMHAPT. Data on the average number of
persons per household were obtained from FIES. Average annual population estimates
were used as a proxy for average monthly population estimates and were obtained from
SB, Ministry of Health, Labor and Welfare (MHLW). The macro variables used as
instruments in the test for endogeneity included population, exchange rate, CPI and
interest on government bonds defined below. Yield on government bonds was the ten-
year yield to subscribers� corporate interest bearing government bonds obtained from the

10
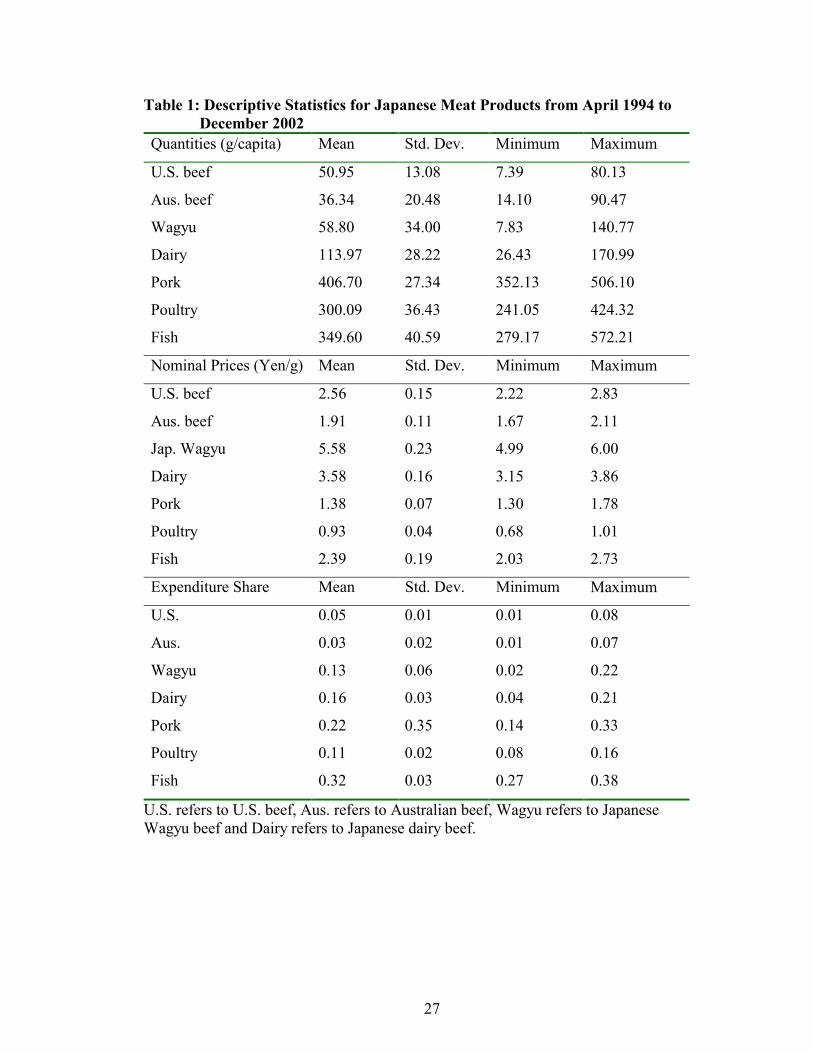
Bank of Japan long-term time series data. Table 1 below contains descriptive statistics
for the meat products used in the study.
<<Table 1 about here>>
Results
The joint conditional and conditional variance system misspecification tests
suggested by McGuirk at al. (1995) were rejected in both the ordinary and inverse
models. The approach used by Eales and Unnevehr (1988, p. 522) in replacing current
budget shares with its lag in computing Stone�s price index was adopted in computing the
Divisia volume index, after which the joint conditional mean test was not rejected.
The joint conditional variance test pointed to error variance instability as the most
likely source for the misspecification in both models as well as dynamic
heteroskedasticity in the case of the inverse model. In this study the most likely cause of
the unstable error variances will be the variation in consumption introduced by BSE.
However, examination of residuals and residual-squared plots over time indicated that the
instability in the error variance started much earlier and was concentrated around two
specific periods; March 2000 and September 2001-the date for the first outbreak of BSE
in Japan. Further literature search revealed that the first outbreak of foot-and-mouth
(FMD) in Japan in 90 years was reported in March 2000. Thus, the demand models were
re-specified with FMD and BSE dummy variables included among the regressors.
Equation-by-equation F-tests for instability in the error variances were not rejected in the
ordinary equations and only rejected in Japanese Wagyu in the inverse equations. Thus,
11
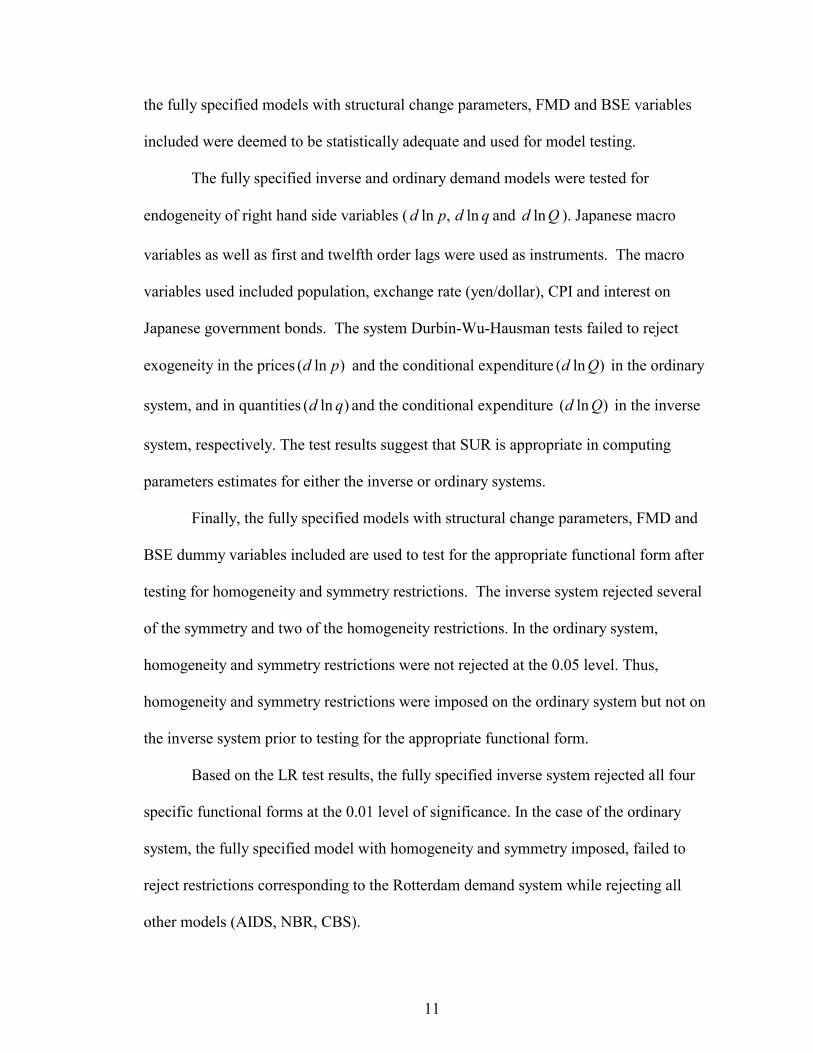
the fully specified models with structural change parameters, FMD and BSE variables
included were deemed to be statistically adequate and used for model testing.
The fully specified inverse and ordinary demand models were tested for
endogeneity of right hand side variables ( ,ln pd qd ln and Qd ln ). Japanese macro
variables as well as first and twelfth order lags were used as instruments. The macro
variables used included population, exchange rate (yen/dollar), CPI and interest on
Japanese government bonds. The system Durbin-Wu-Hausman tests failed to reject
exogeneity in the prices )ln( pd and the conditional expenditure )ln( Qd in the ordinary
system, and in quantities )ln( qd and the conditional expenditure )ln( Qd in the inverse
system, respectively. The test results suggest that SUR is appropriate in computing
parameters estimates for either the inverse or ordinary systems.
Finally, the fully specified models with structural change parameters, FMD and
BSE dummy variables included are used to test for the appropriate functional form after
testing for homogeneity and symmetry restrictions. The inverse system rejected several
of the symmetry and two of the homogeneity restrictions. In the ordinary system,
homogeneity and symmetry restrictions were not rejected at the 0.05 level. Thus,
homogeneity and symmetry restrictions were imposed on the ordinary system but not on
the inverse system prior to testing for the appropriate functional form.
Based on the LR test results, the fully specified inverse system rejected all four
specific functional forms at the 0.01 level of significance. In the case of the ordinary
system, the fully specified model with homogeneity and symmetry imposed, failed to
reject restrictions corresponding to the Rotterdam demand system while rejecting all
other models (AIDS, NBR, CBS).

12
The primary objective of the study is to identify any structural changes following
the discovery of BSE in Japan. Results from the endogeneity tests did not explicitly
indicate the best specification to be used in modeling beef demand in Japan. However,
the ordinary demand system produced an overall better fit than the synthetic inverse
system, conformed to the homogeneity and symmetry restrictions, and lends itself more
easily to the objective of evaluating U.S. beef promotional impacts. Advertising or
promotion, is expected to influence the purchasing decisions of consumers, and the
individual consumer choice variable is quantity. Thus, a quantity dependent specification
was used for analyzing advertising impact on quantity demand.
In testing for structural change, the switching regressions utilizing a transition
time path described above were used. The start of the transition period was assumed to
be September 2001, the month of BSE discovery in Japan. Thus, 1t is set to August 2001.
The results obtained by Peterson and Yun-Ju (2003) were used in determining the end of
the transition period as January 2002.
Testing for structural changed entailed testing if there was an instantaneous
reversible change in beef demand caused by BSE, as was done by Mangen and Burrell
(2001), and also determining if there was a gradual structural change caused by BSE in
Japan. The testing procedure follows that of Moschini and Meilke (1989). The results
suggested that there was a change in the structure of meat demand in Japan following the
discovery of BSE in Japanese beef herds. The test for parameter constancy in the full set
of parameters was rejected at the 0.01 level of significance.
As shown in table 2, positive and significant impacts were observed in pork,
chicken, fish, Japanese Wagyu and Australian beef while negative impacts were observed

13
for U.S. and Japanese dairy beef in response to BSE discovery in Japan. Incidentally, the
results for Japanese dairy beef were not significantly different from zero even though
BSE was discovered in Japanese dairy herds. The results did indicate that Japanese
consumers reacted negatively towards meat products they perceived as likely to transmit
BSE and vice versa. This response was similar to the results obtained by Mangen and
Burrell (2001) for Dutch meat consumers in response to the presence of BSE in the
Netherlands. These responses represent consumers� interpretation of the potentials of the
various beef products to transmit BSE.
<<Table 2 about here>>
The four beef types represented on the Japanese market have distinct qualities
that underscore the observed consumer responses. Wagyu beef is the most expensive beef
cut in Japan followed by dairy, U.S. and Australian beef, respectively. Wagyu are a
native beef breed associated with the heavy marbling preferred by Japanese consumers.
Japanese dairy cattle on the other hand are fattened for slaughter after their milk
producing life. They are intensively managed to achieve the fattening. This entails
feeding them with grains, bone meal and other concentrates. In general, feeding of
concentrates containing meat and bone meal (MBM) as protein supplements to livestock,
have been associated with the spread of BSE. This husbandry practice was a direct
contributor to BSE being found in the United Kingdom and in dairy but not Wagyu cattle
in Japan. Thus, Japanese consumers correctly assumed that they were less likely to
contract BSE through the Wagyu beef than through dairy beef. The negative response
observed for U.S. beef demand may be partly explained by the widely published remarks

14
attributed to a Japanese meat company that imported beef are the most likely sources for
the discovery of BSE in Japan (Jin and Koo, 2003).
The study also evaluated the impacts of FMD on the Japanese meat market. The
impact of FMD on Japanese meat demand was largely insignificant. FMD had a negative
impact on pork, poultry, Japanese Wagyu and U.S. beef demand and positive impacts on
fish, Japanese dairy and Australian beef. However, with the exception of fish and
Japanese dairy beef that were significant at the 0.10 level, none of the coefficients were
significant. The results indicate some level of sophistication among Japanese meat
consumers as they reacted negatively against most meat types even though FMD was
isolated in cattle. Their reaction indicated that they were very much aware that FMD
affects other livestock, unlike BSE that has mainly affected cattle.
As part of evaluating the impact of BSE on Japanese meat demand, elasticities
were computed for the various meat products before, during and after the discovery of
BSE in Japan. Parameter estimates from the Rotterdam model combined with average
expenditure shares for each period were used to compute the elasticity estimates. The
income elasticities and associated standard errors are presented below in table 3.
<<Table 3 about here>>
The expenditure elasticities were generally significant and had the expected signs
while most of the price elasticities had the expected signs but were largely insignificant.
At the height of BSE discovery in Japan, overall expenditure on meat products decreased.
The beef products became highly expenditure elastic while chicken and fish experienced
slight decreases in their expenditure elasticities. Peterson and Yun-Ju (2003) reported
negative income elasticities for pork, Wagyu and U.S. beef in their �during phase�. The

15
expenditure elasticities in the �after phase� generally resembled that of the �before phase�.
The beef products became more expenditure elastic while Australian beef and the non-
beef products became slightly less elastic in the aftermath of BSE.
Following the discovery of BSE in Japan, quantity demanded initially decreased
for the beef and pork products. Thus, based on the elasticity definition, one would expect
that Australian, Japanese dairy and Wagyu beef as well as pork would experience
increases in their expenditure elasticities, contrary to what Peterson and Yun-Ju (2003)
observed. From the results, fish and poultry were not affected by the discovery of BSE as
they both experienced decreases in expenditure elasticity, implying their quantities
demanded increased in the �during� phase.
In the case of the price elasticities, the own-price elasticities were mostly
inelastic. Japanese Wagyu and dairy beef, as well as fish were the most responsive to
price changes with higher own price elasticities. Among the own-price elasticities, only
fish was significant before, during and after BSE was discovered. In the �during� phase,
the beef products became highly own-price elastic. There was little variation in the prices
of meat products during the crisis. This in part explains the lack of significant price
elasticities as there was very little variation in the meat prices. From the above, any
changes in observed own-price elasticities can most likely be attributed to the changes in
consumption following discovery of BSE. See table 4 below for price elasticities and
associated standard errors.
<<Table 4 about here>>
The dramatic increases in price elasticities for the meat products in the �during
phase� can be attributed to the increased sensitivity of consumers to meat and beef in

16
particular. Meat consumption initially declined following the discovery of BSE. Beef
was the most affected as consumers switched from beef consumption at the height of the
discovery. Peterson and Yun-Ju (2003) cite a newspaper survey that reported that 75% of
consumers had stopped eating beef following BSE discovery in Japan.
The last objective of evaluating promotion or advertising impact is achieved using
the fully specified Rotterdam model with structural change parameters, BSE and FMD
dummy variables included. Three lag lengths of advertising variables were included to
capture the total advertising impacts. Lag length selection was based on LRT for
individual and joint lags. In addition, there was no significant individual coefficient
beyond lag length three and, finally, overall system misspecification tests (joint
conditional mean and variance) favored a maximum lag length of three.
The promotion expenditure data represented only generic promotion expenditures
from USMEF and did not include branded promotional expenditures. Similarly,
promotion expenditures for Australian, Japanese Wagyu and dairy beef, pork, chicken
and fish were not included due to lack of data. Overall, USMEF promotions of U.S. beef
in Japan had a positive impact on U.S. beef demand and a negative impact on its main
competitor, Australian beef (See table 5). However, these impacts were not statistically
significant. USMEF beef promotions also had positive but insignificant impacts on
Wagyu and dairy beef and negative and significant impacts on pork and poultry demand.
<<Table 5 about here>>
The own-advertising impact for U.S. beef appears to be rather low. Studies
conducted by Brester and Schroeder (1995) and Kinnucan et al. (1997) reported very low
and insignificant generic own-promotion and cross advertising elasticities for U.S. beef

17
and pork. They further observed that advertising elasticities were small compared to the
price and income elasticities. Kinnucan et al. (1997) concluded that the lack of
significant coefficients might be due to the relatively small role advertising plays in meat
consumption behavior evident by the small generic advertising intensities. Advertising
intensities for U.S. beef in Japan averaged 0.00346 between 1992 and 2002 (intensities
were obtained by dividing average promotion expenditure by average value of exports).
The results indicated that a 100% increase in USMEF promotions causes demand
for U.S. beef to increase by 6% and Australian beef and pork to decrease by 8% each.
Average per capita quantity for U.S. beef was 51 grams while average monthly aggregate
USMEF generic promotion expenditure for the study period was $620,000. Thus, from
the promotion elasticity, when USMEF promotions increases by $620,000, per capita
monthly quantity demanded of U.S. beef is expected to increase by 3.6 grams. This
translates to an aggregate monthly increase in U.S. meat demand by 385MT at the retail
level. Assuming an average exchange rate of 114, this translates into increased revenue
of $8,962,578 and a return on investment of over fourteen times. This return however, is
at retail, which involves other marketing and distributing costs not taken into
consideration. Based on the results, the decision to expend an additional dollar on
promotion should be based on a break even return of 7%. That is, if the promotion dollar
will return more than 7% in increased net revenue then the promotion is worthwhile.
Conclusions
The main objectives of the study were to identify and examine the impact of BSE
on Japanese beef demand as well as evaluate the impact of U.S. beef promotion on meat

18
demand in Japan. As part of achieving the above objectives, and as objectives in their
own right, the study also set out to identify the appropriate specification and functional
form to be used in the demand analysis. The current study offers more comprehensive
specification and system testing than previous studies.
The differences in specification are potential sources for some of the
discrepancies in the results mentioned above. For instance Peterson and Yun-Ju (2003)
obtained usually high own-price elasticities (-17.51, -44.09, -360.55 and -129.499 for
U.S., Australian, Wagyu and dairy beef respectively) during the BSE crisis. Commeau,
Mittlehammer and Wahl (1997) also obtained very high generic promotion coefficients
based on their choice of an inverse specification. This contrasts sharply with the low
coefficients obtained in this study and in other studies.
The tests of structural change indicated that BSE did impact Japanese beef
consumption and also had an overall impact on meat consumption in Japan. The gradual
switching Rotterdam specification employed in this study indicated that there were
significant changes in the structure of meat demand in Japan occasioned by the discovery
of BSE. Japanese consumers reacted negatively to U.S. and Japanese dairy beef. Though
BSE had not been reported in cattle herds in the United States and was discovered in a
dairy herd in Japan, both were impacted negatively by the discovery of BSE in Japan.
From the observed reaction, Japanese consumers believed that the grain fed U.S.
beef could be carriers of BSE, and its close similarities to Japanese dairy beef caused
consumers to avoid U.S. beef. Revelations of improper practices by Japanese meat
companies, including mislabeling of imported beef as domestic beef, surfaced in the
aftermath of BSE discovery in Japan and hurt U.S. beef demand (Peterson and Yun-Ju,
19
2003; Fox and Peterson, 2002). The grass-fed Australian beef is distinct from the
domestic beef, while the grain fed U.S. beef is very similar to the dairy beef in Japan.
Thus, any mislabeling would likely affect U.S. beef demand.
Contrary to the observations by Paarlberg, Lee and Seitzinger (2003) that
consumers may not understand the difference between the health risks associated with
BSE and FMD, the study results indicated otherwise. In this study consumers interpreted
the potential impact of FMD and reacted as expected against all the meat products that
can be carriers of FMD. Thus, beef, pork and poultry were all affected negatively while
fish was affected positively. BSE, on the other hand, initially affected all the meat
products with the exception of fish. Overall, however, it negatively affected only
Japanese dairy and U.S. beef and positively affected poultry, pork, fish, Japanese Wagyu
and Australian beef.
In the aftermath of the BSE discovery in Japan, the Japanese government
launched an aggressive marketing campaign on the theme that Japanese beef is the safest
in the world (Fox and Peterson, 2002). This was meant to restore consumer confidence
in the domestic beef herds. Based on the time it took the beef industry to recover from
the crisis (5 months) compared to other countries (21 months in the Netherlands (Mangen
and Burrell, 2001)), it appears the campaign was effective. Considering the general
suspicion of Japanese consumers to imports, exporters may benefit by promoting their
products� safety attributes equally aggressively. Following the worldwide BSE crisis,
U.S. meat exports now carry a label designating the U.S. as meeting all international
guidelines to be considered free of BSE (Fox and Peterson, 2002). This message may not
have yet extended to consumers at the retail level.

20
References
ALIC Agriculture and Livestock Industries Corporation. Various Years, 1994-2002.
Alston, J. M., and J. A. Chalfant. �The Silence of the Lambdas: A Test of the Almost
Ideal and Rotterdam Models.� American Journal of Agricultural Economics, Vol.
75 (May 1993): 304-313.
Barten, A. P. �Consumer Demand Functions Under Conditions of Almost Additive
Preferences.� Econometrica, 32 (Januaury-April 1964): 1-38.
Barten, A. P. �Consumer Allocation Models: Choice of Functional Form.� Empirical
Economics, 18 (1993): 129-158.
Barten, A. P., and Bettendorf, L. J. �Price Formation of Fish: An Application of an
Inverse Demand System.� European Economic Review, 33 (1989): 1509-1525.
Beef (National Cattlemen�s Beef Association Cattle and Beef Handbook (Revised June
1999.))
BOJ (Bank of Japan) Long-term Time Series Data, Various years 1994-2002.
Brester, G. W., and T. C. Schroeder. �The Impact of Brand and Generic Advertising on
Meat Demand.� American Journal of Agricultural Economics, Vol. 77 (1995):
69-79.
Brown, M.G., J. -Y. Lee, and J. L. Seale. �Demand Relationship Among juice Beverages:
A Differential Demand System Approach.� Journal of Agricultural and Applied
Economics, 26, 2 (December 1994): 417-429.
Capps, O. J., R. Tsai, R. Kirby, and G. W. Williams. �A Comparison of Demands for
Meat Products in the Pacific Rim Region.� Journal of Agricultural and Resource
Economics, 19, 1 (1994): 210-224.

21
Chung, C., and H.M. Kaiser �Determinants of Temporal Variations in Generic
Advertising Effectiveness.� Agribusiness, Vol. 16, 2 (2000): 197-214.
Comeau, A., R. C. Mittelhammer, and T. I. Wahl. �Assessing the Effectiveness of MPP
and TEA Promotion Efforts in the Japanese Market for Meat.� Journal of Food
Distribution, (July 1997): 2735.
Coulibaly, N., and B. W. Brorsen. �Explaining the Differences Between Two Previous
Meat Generic Advertising Studies.� Agribusiness, Vol. 15, 2 (1999): 501-515.
Davis, G. C. �The Science and Art of Promotion Evaluation.� Agribusiness, Vol. 15, 4
(1999): 465-483.
Deaton, A. and J. Muellbauer. �An Almost Ideal Demand System.� The American
Economic Review, Vol. 70, 3, (1980a): 312-326.
Deaton, A., and J. Muellbauer. �Economics and Consumer Behavior.� Cambridge
University Press, Cambridge, U.K. 1980b.
Duffy, M. H. �Advertising and Inter-Product Distribution of Demand.� European
Economic Review, Vol. 31 (July 1987): 1051-1070.
Duffy, M. �Advertising in Demand Systems for Alcoholic Drinks and Tobacco: A
Comparative Study.� Journal of Policy Model, Vol. 17, 6 (1995): 557-577.
Eales, J. S., C. Durham, and C. R. Wessells. �Generalized Models of Japanese Demand
for Fish.� American Journal of Agricultural Economics, Vol. 79, (November
1997): 1153-1163.
Eales, J., and C. R. Wessells. �Testing Separability of Japanese Demand for Meat and
Fish Within Differential Demand Systems.� Journal of Agricultural and Resource
Economics, 24, 1 (1999): 114-126.

22
Eales, J. S., and L. J. Unnevehr. �Demand for Beef and Chicken Products: Separability
and Structural Change.� American Journal of Agricultural Economics, vol. 75,
(August 1988): 521-532.
Eales, J. S., and L. J. Unnevehr. �The Inverse Almost Ideal Demand System.� European
Economic Review, 38 (1994): 101-115.
FIES Family Income and Expenditure Survey Various Years, 1994-2002.
Forker, O. D., and R. W. Ward. Commodity Advertising: The Economics and
Measurement of Generic Promotions Lexington Books, New York. 1993.
Fousekis, P., and B. J. Revell. �Meat Demand in the UK: A Differential Approach.�
Journal of Agricultural and Applied Economics, 32, 1 (April 2000): 11-19.
Fox, J. A., and H. H. Peterson. �Bovine Spongiform Encephalopathy (BSE): Risk and
Implications for the United States.� Paper Presented at the NCR-134 Conference
on Applied Commodity Price Analysis, Forecasting, and Market Risk
Management, St. Louis, MO, April 22-23, 2002.
Goodwin, B. K., D. Harper, and R. Schnepf. �Short-Run Demand Relationships in the
U.S. Fats and Oils Complex.� Journal of Agricultural and Applied Economics, 35,
1 (April 2003): 171-184.
Green, R. D., H. H. Carman, and K. McManus. �Some Empirical Methods of Estimating
Advertising Effects in Demand Systems: An Application to Dried Fruits.�
Western Journal of Agricultural Economics, Vol. 16, 1 (July 1991): 63-71.
Hausman, J. �Specification Tests In Econometrics.� Econometrica, 46 (November 1978):
1251-1271.

23
Hayes, J. D., T. I. Wahl, and G. W. Williams. �Testing Restrictions on a Model of
Japanese Meat Demand.� American Journal of Agricultural Economics, Vol. 75,
(August 1990): 556-566.
Holt, M. T., and B. K. Goodwin. �Generalized Habit Formation in an Inverse Almost
Ideal Demand System: An Application to Meat Expenditures in the U.S.�
Empirical Economics, 22 (1997): 293-320.
Huang, K. S. �The Family of Inverse Demand Systems.� European Economic Review, 23
(1983): 329-337.
Jan, M., C. L. Huang, and J. E. Epperson. �Measuring the Effects of Non-Price
Promotion on U.S. Poultry Meat Product Exports.� Selected Paper Submitted for
Presentation at the AAEA Annual Meeting in Salt Lake City, UT, August 1998.
Japan Agrinfo Newsletter �More Consumers Feel Japan Should Be Self-Sufficient in
Food.� Japan�s Food and Agriculture- News and Views Vol. 20 No. 09 May
2003.
Jin, J. H., and W. W. Koo. �The Effect of the BSE Outbreak in Japan on Consumers�
Preferences.� European Review of Agricultural Economics, Vol. 30, 2 (2003):
173-192.
Kinnucan, H. W., H. Xiao, C. J. Hisa, and J. D. Jackson. �Effects of Health Information
and Generic Advertising on U.S. Meat Demand.� American Journal of
Agricultural Economics, Vol. 79 (February 1997): 13-23.
Le, C. T., H. M. Kaiser, and W. G. Tomek. �Export Promotion and Import Demand for
U.S. Red Meat in Selected Pacific Rim Countries.� National Institute for

24
Commodity Promotion Research and Evaluation, NICPRE 97-04. September
1997.
MAFF Ministry of Agricultural, Forestry, and Fisheries Report on Agricultural, Forestry,
and Fishery Trade in 2002. Ministry of Agricultural, Forestry, and Fisheries,
Tokyo, Japan. March 2002.
MAFF (Ministry of Agricultural, Forestry, and Fisheries) Update Index #355, 2000.
Mangen, M. J. J., and A. M. Burrell. �Decomposing Preference Shifts for Meat and Fish
in the Netherlands.� Journal of Agricultural Economics Vol. 52, 5 (2001): 16-28.
Maynard, L. J., and V. N. Veeramani. �Price Sensitivities for U.S. Frozen Dairy
Products.� Journal of Agricultural and Applied Economics, Vol. 35, 3, (2003):
407-417.
McGuirk, A., P. Driscoll, J. Alwang, and H. Haung. �System Misspecification Testing
and Structural Change in the Demand for Meat.� Journal of Agricultural and
Resource Economics, 20, 1 (1995): 1-21.
MHLW Ministry of Health, Labor and Welfare Various Years, 1994-2002.
Moschini, G., and K. D. Meilke. �Modeling the Pattern of Structural Change in U.S.
Meat Demand.� American Journal of Agricultural Economics, Vol. 75, (May
1989): 253-261.
Moschini, G. and A. Vissa. �A Linear Inverse Demand System.� Journal of Agricultural
and resources Economics, 17, 2, (December 1992): 294-302.
MPMHAPT Ministry of Public Management, Home Affairs, Post and
Telecommunications. Various Years, 1994-2002.
25
Ogunyinka, E. O., and T. L. Marsh, �Testing Separability in a Generalized Ordinary
Differential Demand System: The Case of Nigerian Demand for Meat.� Selected
Paper Prepared for Presentation at the Southern Agricultural Economics
Association Annual Meeting, Mobile, Alabama, February 2003.
Paarlberg, P. L., J. G. Lee, and A. H. Seitzinger. �Measuring Welfare Effects of an FMD
Outbreak in the United States.� Journal of Agricultural and Applied Economics,
Vol. 35, 1 (April 2003): 53-65.
Peterson, H. H., and C. Yun-Ju. �The Impact of BSE on Japanese Retail Beef Market.�
Selected Paper Prepared for Presentation at the Southern Agricultural Economics
Association Annual Meeting, Mobile, Alabama, February 2003.
Reed, M., and A.Iswariyadi. �Competitive Forces in the Japanese Beef Market.� Paper
Presented at the Annual Meeting of the International Agricultural Trade Research
Consortium (IATRC), Auckland, New Zealand, January 2001.
Smallwood, D.M., R.C. Haidacher, and J. R. Blaylock. �A Review of the Research
Literature on Meat Demand,� in R.C. Buse, ed., The Economics of Meat Demand,
University of Wisconsin, Madison, WI 53706. (1989): 93-124.
*Theil, H. �The Information Approach to Demand Analysis.� Econometrica, 33 (January
1965): 67-87.
Theil, H. System-wide Explorations in International Economics Input-Output Analysis,
and Marketing Research. Amsterdam: North-Holland, 1980.
USMEF United States Meat Export Federation, Trade Statistics, Denver, CO, U.S.
Various Years.
USMEF United States Meat Export Federation, Trade Statistics, Denver, CO, U.S. 2002.

26
Ward, R. W. and C. Lambert. �Generic Promotion of Beef: Measuring the Impact of the
U.S. Beef Checkoff.� Journal of Agricultural Economics, Vol. 44, 3 (1993): 456-
465.
Weatherspoon D. D., and J. L. Seale, Jr. �Do the Japanese Discriminate Against
Australian Beef Imports?: Evidence From the Differential Approach.� Journal of
Agricultural and Applied Economics, Vol. 27, 2 (December 1995): 536-543.
Wohlgenant, M. K., and C. R. Clary. �Development and Measurement of Farm-to-Retail
Price Linkage for Evaluating Dairy Advertising Effectiveness.� Journal of
Agricultural Economics Research, Vol. 44 (1992): 18-27.
World Bank. World Development Indicators Database. Japan Data Profile. The World
Bank. Washington, DC. April 2002.
Xu, X., and M. Veeman. �Model Choice and Structural Specification for Canadian Meat
Consumption.� European Review of Agricultural Economics, Vol. 23 (1996):
301-315.
Yang, S., and W. W. Koo. �Japanese Meat Import Demand Estimation with Source
Differentiated AIDS Model.� Journal of Agricultural and Resource Economics, 1,
2, (December 1994): 396-408.
27
Table 1: Descriptive Statistics for Japanese Meat Products from April 1994 to December 2002 Quantities (g/capita) Mean Std. Dev. Minimum Maximum
U.S. beef 50.95 13.08 7.39 80.13
Aus. beef 36.34 20.48 14.10 90.47
Wagyu 58.80 34.00 7.83 140.77
Dairy 113.97 28.22 26.43 170.99
Pork 406.70 27.34 352.13 506.10
Poultry 300.09 36.43 241.05 424.32
Fish 349.60 40.59 279.17 572.21
Nominal Prices (Yen/g) Mean Std. Dev. Minimum Maximum
U.S. beef 2.56 0.15 2.22 2.83
Aus. beef 1.91 0.11 1.67 2.11
Jap. Wagyu 5.58 0.23 4.99 6.00
Dairy 3.58 0.16 3.15 3.86
Pork 1.38 0.07 1.30 1.78
Poultry 0.93 0.04 0.68 1.01
Fish 2.39 0.19 2.03 2.73
Expenditure Share Mean Std. Dev. Minimum Maximum
U.S. 0.05 0.01 0.01 0.08
Aus. 0.03 0.02 0.01 0.07
Wagyu 0.13 0.06 0.02 0.22
Dairy 0.16 0.03 0.04 0.21
Pork 0.22 0.35 0.14 0.33
Poultry 0.11 0.02 0.08 0.16
Fish 0.32 0.03 0.27 0.38
U.S. refers to U.S. beef, Aus. refers to Australian beef, Wagyu refers to Japanese Wagyu beef and Dairy refers to Japanese dairy beef.

28
Table 2: Estimated Parameters for BSE and FMD Dummies U.S. Aus Wagyu Dairy Pork Poultry Fish
BSED
-0.0098**
(0.0043)
0.0045**
(0.0023)
0.0284***
(0.0082)
-0.0010
(0.0059)
0.0098***
(0.0039)
0.0120***
(0.0031)
0.0155**
(0.0080)
FMDD
-0.0071
(0.0046)
0.0026
(0.0024)
-0.0012
(0.0088)
0.0112*
(0.0064)
-0.0018
(0.0041)
-0.0032
(0.0033)
0.0044*
(0.0027)
U.S. refers to U.S. beef, Aus. refers to Australian beef, Wagyu refers to Japanese Wagyu beef and Dairy refers to Japanese dairy beef. Values in parenthesis are the standard errors ***, ** and * represent statistically significance at the 0.01, 0.05 and 0.10 levels, respectively Table 3: Expenditure Elasticities �Before, During and After� the Structural Changes
Product Before (N=88) During (N=5) After (N=11)
U.S. beef 0.7998***
(0.1703)
-1.2162
(1.5636)
1.0417***
(0.2218)
Australian beef 0.3716*
(0.2246)
1.0631***
(0.3672)
0.1335*
(0.0807)
Japanese Wagyu 1.3312***
(0.1310)
3.9009***
(0.9781)
3.1458***
(0.3097)
Japanese dairy 1.0021***
(0.0746)
1.4510**
(0.6284)
1.7827***
(0.1327)
Pork 0.2834***
(0.0388)
0.3629***
(0.1222)
0.2119***
(0.0290)
Poultry 1.0080***
(0.0626)
0.6788***
(0.0838)
0.7654***
(0.0476)
Fish 1.1758***
(0.0522)
1.0826***
(0.1478)
1.1027***
(0.0489)
Standard errors in parenthesis ***, ** and * represent statistically significance at the 0.01, 0.05 and 0.10 levels, respectively

29
Table 4: Marshallian Price Elasticities �Before, During and After� Structural Changes Before Structural Change: April 1994-August 2001
U.S. Aus. Wagyu Dairy Pork Poultry Fish
U.S. -0.0699 (0.5697)
0.5211* (0.2829)
-0.6435 (0.9041)
-0.6604 (0.6045)
0.2137 (0.3134)
-0.2764 (0.2455)
0.1873 (0.3104)
Aus.
-0.0438 (0.9077)
0.4380 (1.5727)
-1.8206 (1.1375)
0.6248 (0.5201)
0.0782 (0.3798)
-0.3263 (0.4119)
Wagyu
-0.6519 (0.8778)
0.7821 (0.5489)
0.0674 (0.2373)
0.0232 (0.1798)
0.4215* (0.2357)
Dairy
-0.2561 (0.4157)
0.4174*** (0.1488)
0.0716 (0.1095)
0.5531*** (0.1393)
Pork
-0.0472 (0.0869)
-0.2581*** (0.0494)
0.1117* (0.0667)
Poultry
-0.1310 (0.1037)
0.3197*** (0.1092)
Fish
-0.3206*** (0.0445)
During Structural Change: September 2001-January 2002
U.S. Aus. Wagyu Dairy Pork Poultry Fish
U.S. -1.4120
(4.8759) -1.5556 (2.5785)
-12.6487** (6.1536)
-1.1494 (4.7189)
-2.8971 (3.2525)
-5.7899** (2.5678)
8.0463***
(2.6942) Aus.
-3.2280*** (1.1974)
3.4033** (1.4665)
0.7913 (1.3255)
2.1569** (1.0558)
-1.3884* (0.7358)
-0.0636 (0.6929)
Wagyu
-3.0359 (4.5522)
4.8472* (2.9369)
-1.7193 (1.6256)
3.1260** (1.2776)
4.3241*** (1.6715)
Dairy
-3.5358 (2.5024)
2.0306 (1.3689)
0.9996 (0.9497)
-1.4262 (1.1196)
Pork
-0.3160 (0.3727)
0.0626 (0.2094)
0.2471 (0.1967)
Poultry
-0.0222 (0.1849)
0.1505 (0.1458)
Fish
-0.7596*** (0.2467)

30
Table 4 (continued) After Structural Change: January 2002-December 2002
U.S. Aus. Wagyu Dairy Pork Poultry Fish
U.S. -0.1039 (0.7420)
0.7196** (0.3687)
-0.9133 (1.1774)
-0.9714 (0.7868)
0.1261 (0.4102)
-0.4035 (0.3204)
-0.0221 (0.4051)
Aus.
-0.0106 0.3262
0.1472 (0.5650)
-0.6692 (0.4086)
0.2044 (0.1874)
0.0219 (0.1366)
-0.1520 (0.1483)
Wagyu
-1.7814 (2.0741)
1.2175 (1.2964)
-0.1954 (0.5638)
0.0289 (0.4257)
0.2980** (0.5881)
Dairy
-0.5864 (0.7393)
0.8670*** (0.2659)
0.4381** (0.1952)
0.9138*** (0.2483)
Pork
-0.0205 (0.0651)
-0.1861*** (0.0370)
0.0451 (0.0508)
Poultry
-0.0747 (0. 0788)
0.2588*** (0.0831)
Fish
-0.2776*** (0.0421)
Standard errors are in parenthesis, U.S. refers to U.S. beef, Aus. refers to Australian beef, Wagyu refers to Japanese Wagyu beef and Dairy refers to Japanese dairy beef. ***, ** and * represent statistically significance at the 0.01, 0.05 and 0.10 levels, respectively Table 5: Estimated Promotion Elasticities and Standard Errors
Elasticities Standard error t-ratio
U.S. beef 0.0632 0.0884
0.7154
Australian beef -0.0800 0.0868
-0.9224
Japanese Wagyu 0.0415 0.0697
0.5916
Japanese dairy 0.0597 0.0395
1.5142
Pork -0.0780*** 0.0180
-4.3340
Poultry -0.0532* 0.0289
-1.8421
Fish 0.0369 0.0254
1.4576
*** statistically significant at the 0.01 level * statistically significant at the 0.10 level