Embed Size (px)
Citation preview
The impact of combined torrefaction and pelletization process on forestry biomass supply in
California
Yuanzhe Li
(Corresponding author)
Department of Civil and Environmental Engineering, University of California, Davis
Ghausi Hall, One Shields Avenue, Davis, CA 95616
Tel: 530-574-2360
Email: [email protected]
Peter Tittmann
Center for Forestry, University of California, Berkeley
UC Berkeley Richmond Field Station,
Building 478, 1301 S 46th St, Richmond, CA 94804
Tel: 707-849-4135
Email: [email protected]
Nathan Parker
Institute of Transportation Studies, University of California, Davis
1715 Tilia Street, Davis, CA 95616
Tel: 530-902-0947
Email: [email protected]
Bryan Jenkins
Energy Institute, University of California, Davis
2231 Academic Surge, One Shields Avenue, Davis, CA 95616
Tel: 530-754-8566
Email: [email protected]
Word count: 4143 words text + 13 tables/figures x 250 words (each) = 7393words
Submission Date: 8/1/2014

Abstract
The purpose of this study is to investigate combined torrefaction and pelletization as a pretreatment process to improve
the biomass feedstock supply efficiency for bioenergy production given the energy and transportation infrastructure
in California. Scale-dependent techno-economic assessment of biomass torrefaction and pelletization process from
existing literature was combined with biomass transportation cost evaluations derived from a spatial-explicit network
analysis to construct a mixed-integer linear program for finding the most economical biomass feedstock supply system
configuration. In addition, we assessed the sensitivity of the optimal system to variations of key system variables
including the operational scale of pretreatment facilities, road and rail transportation cost, feedstock procurement cost
and biorefinery-gate cost saving of torrefied pellet utilization. The results indicated that incorporation of torrefaction
and pelletization can reduce the average transportation cost and average total delivered costs by 16.7 % ($0.84/GJ) and
7.7% ($0.42/GJ) respectively compared to the optimal system without pretreatment.
Keywords: Biomass, GIS, supply chain design, pretreatment technology, torrefaction and pelletization
Preprint submitted to TRB 2015 August 1, 2014
1. Introduction
Biofuels as an alternative energy source for transportation have the potential to substantially reduce fossil fuel
dependence and greenhouse gas emissions and also can facilitate regional economic growth, which has been emphasized
in public policy (Pavley and Nunez, 2006; Congress, 2007). In the State of California, technically available biomass
is estimated to be about 36 million bone dry tons per year (BDT/year) in 2010 and 40 million BDT/year in 2020 not
including dedicated energy crops. In 2010 less than 15% of the available resource was used by solid-fuel biomass
facilities(California Bioenergy Interagency Working Group, 2012)
Biomass feedstocks produced from forest management activities are distributed across forested landscape in
varying densities depending upon growing conditions, management, and policy factors. As a result, procurement and
transportation costs can vary greatly and have a profound effect on overall production cost of energy from woody
biomass. Previous studies have extensively explored the realm of spatially-explicit supply chain design for the whole
bioenergy systems (Tittmann et al., 2010; Parker, Nathan, 2011; Dunnett et al., 2008). In earlier studies, bioenergy
production costs were predicted based upon cost estimates for each system component including procurement, site-
specific transportation, and conversion costs. Sensitivity analysis in these studies showed that transportation costs
have significant impact on the optimal system configuration and normalized biofuel production costs, which indicates
potential advantages of increasing the efficiency of biomass feedstock transport.
Torrefaction combined with densification (pellets, briquettes) of wood biomass produced from forest management
converts feedstock into a densified intermediate with higher energy and mass density, and it has potential to increase
efficiency of biomass feedstock handling and logistics by increasing feedstock energy density and flowability as well
as reducing energy use in grinding and refining (Bergman P.C.A., 2005). It also reduces cost for feedstock storage
and transportation, and reduce greenhouse gas and pollutant emissions associated with the feedstock supply chain
(Bergman P.C.A., 2005; Uslu et al., 2008; International Energy Agency, 2012a).
Torrefaction technology has not been widely commercialized and its economic utility in the supply chain is still not
clear, especially in different spatial and product contexts. This study aims to estimate the economic utility of torrefaction
and densification using constrained supply chain cost minimization. This analysis does not consider the system-wide net
energy balance when torrefaction is used, instead we focus on the economic viability of torrefaction pretreatment. The
modelling objective is to find the cost-optimal configuration of woody biomass supply chain, including the feedstock
procurement, torrefaction location, conversion scale and existing transportation infrastructure.
The rest of the paper is organized in the following order. In section 2, we elucidate the mathematical optimization
program for the supply chain design modeling. In section 3, we discuss various model input components, including
the geographic transportation network and economic evaluation of torrefaction and pelletization process at different
conversion scales. In section 4 we present the model results with sensitivity analysis, followed by discussion and
potential research extensions in section 5.
2

2. Methods
2.1. Model description and notations
To assess the economic impact of torrefaction and pelletization on woody biomass supply chains we developed a
mathematical optimization program using transportation cost data from a geographic information system (GIS) and
cost models for pretreatment via torrefaction and pelletization at a range of production scales. The optimization is
designed to answer the following questions:
• Can combined torrefaction and pelletization process significantly reduce bioenergy feedstock cost delivered to a
biorefinery?
• If so, where and what size should the pretreatment facilities be?
• How sensitive is the system to variation in different component costs such as the size of pretreatment facilities?
The supply chain network consists of three layers of nodes: (1) feedstock locations, (2) intermediate locations to
site stand-alone pretreatment facilities, and (3) biorefineries. Wood chips are procured at feedstock locations, typically
log landings on industrial forest operations. Torrefaction pretreatment can be conducted at the log landing, at an
intermediate location or at the biorefinery. Alternatively, chips can be delivered directly to the biorefinery without
pretreatment.
The two primary benefits from the use of torrefied pellets in transportation are 1) Its high energy density makes it
more efficient in satisfying the demand for feedstocks at the biorefineries on a mass basis. For example, we assume 1
ton of torrefied pellet equals more wood chips than 1 ton to meet the feedstock demand, and the ratio is consistent
with about 91 % net efficiency assumption of the pretreatment process (Bergman P.C.A., 2005) 2) The high mass
density increases the transportation efficiency by reducing the unit transportation cost ($/(ton · mile)), especially for rail
transportation. Transport cost details are discussed in section 3.3.5
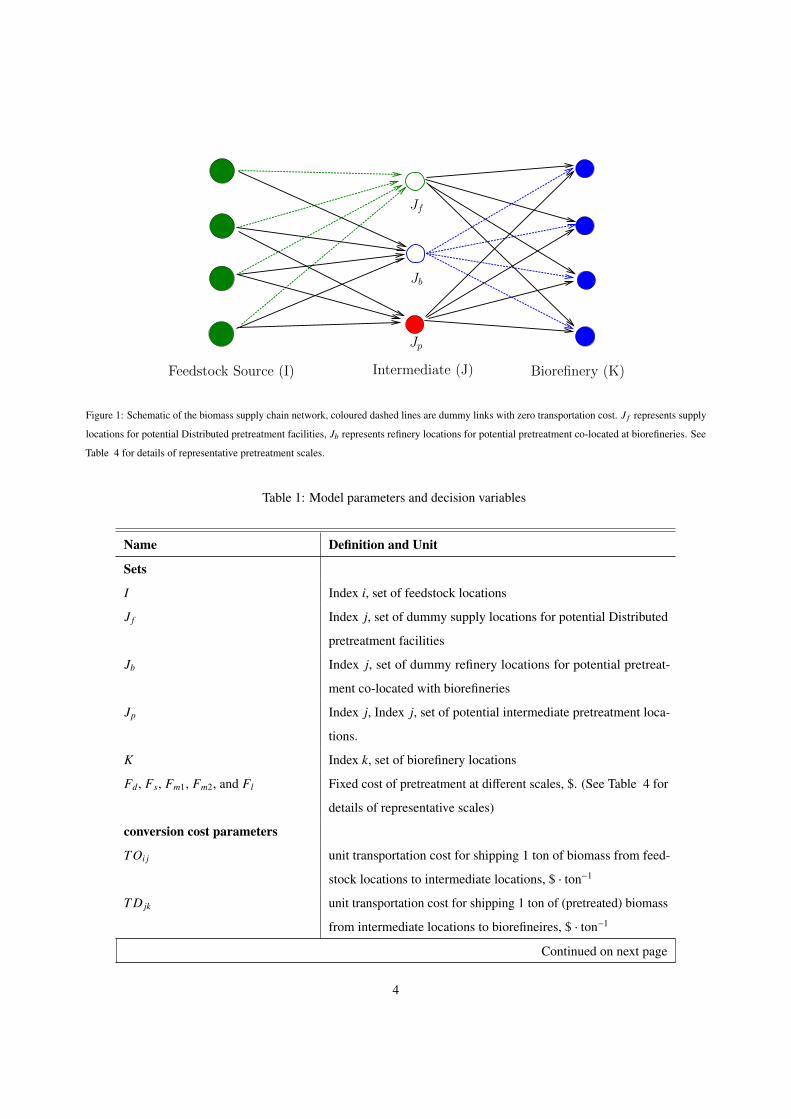
A schematic representation of the supply chain network is shown in Figure 1. Note that potential pretreatment
sites (J) include the biomass supply locations (J f ) and biorefineries (Jb). We assume that only the smallest distributed
scale pretreatment could be performed at log landings, and the largest facility-scale pretreatment facility would be
an integrated module co-located with the biorefinery conversion facility. In order to characterize this feature with a
three-layer network, we use dashed lines to represent dummy links where no transportation cost are incurred. Green
dashed lines between nodes in I and J f stand for wood chips that either are directly pretreated at log landings or will be
sent to biorefineries without pretreatment; the blue dashed lines between nodes in Jb and K indicate biomass feedstocks
that are pretreated at biorefineries. In this way, all the feedstock shipments start from sets I, go through sets J (contains
J f , Jb and Jp) and end in sets K.
By treating the feedstocks that go into the pretreatment process and those directly transported to the biorefineries
separately, we can formulate the problem as a mixed integer linear program. For convenience, all the notations used in
the model are listed in Table 1.
3
Feedstock Source (I) Biorefinery (K)Intermediate (J)
Jb
Jp
Jf
Figure 1: Schematic of the biomass supply chain network, coloured dashed lines are dummy links with zero transportation cost. J f represents supply
locations for potential Distributed pretreatment facilities, Jb represents refinery locations for potential pretreatment co-located at biorefineries. See
Table 4 for details of representative pretreatment scales.
Table 1: Model parameters and decision variables
Name Definition and Unit
Sets
I Index i, set of feedstock locations
J f Index j, set of dummy supply locations for potential Distributed
pretreatment facilities
Jb Index j, set of dummy refinery locations for potential pretreat-
ment co-located with biorefineries
Jp Index j, Index j, set of potential intermediate pretreatment loca-
tions.
K Index k, set of biorefinery locations
Fd, Fs, Fm1, Fm2, and Fl Fixed cost of pretreatment at different scales, $. (See Table 4 for
details of representative scales)
conversion cost parameters
TOi j unit transportation cost for shipping 1 ton of biomass from feed-
stock locations to intermediate locations, $ · ton−1
T D jk unit transportation cost for shipping 1 ton of (pretreated) biomass
from intermediate locations to biorefineires, $ · ton−1
Continued on next page
4
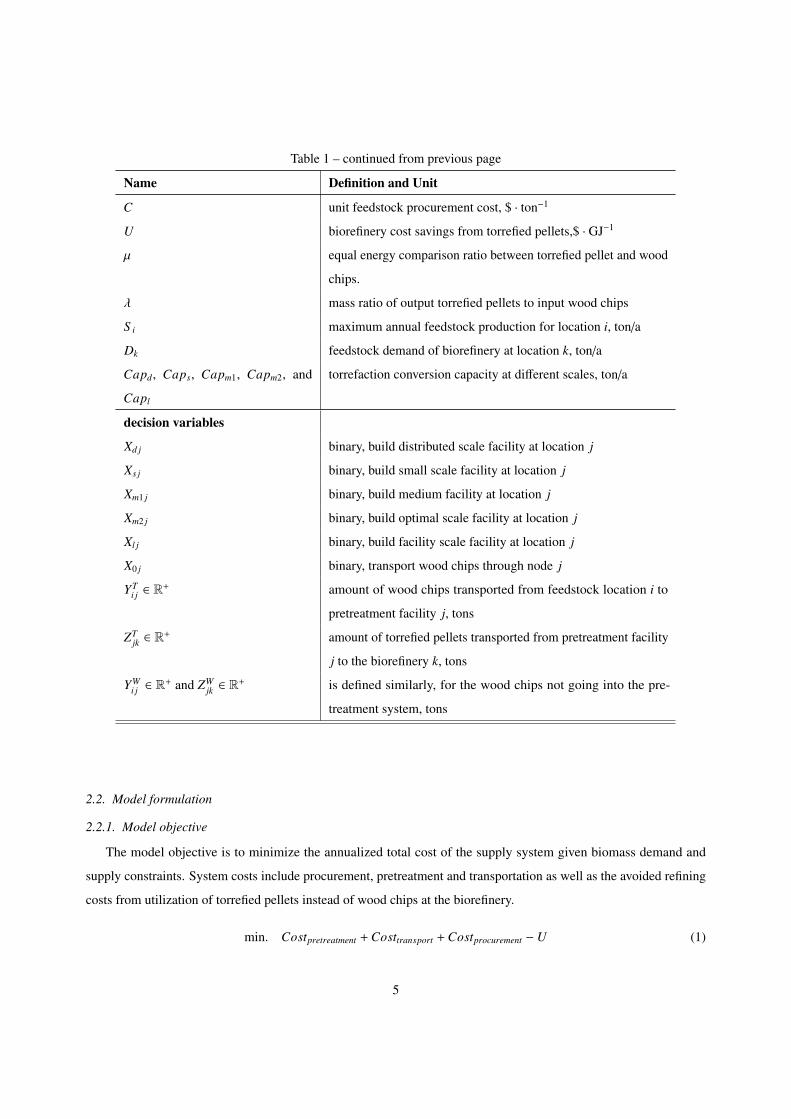
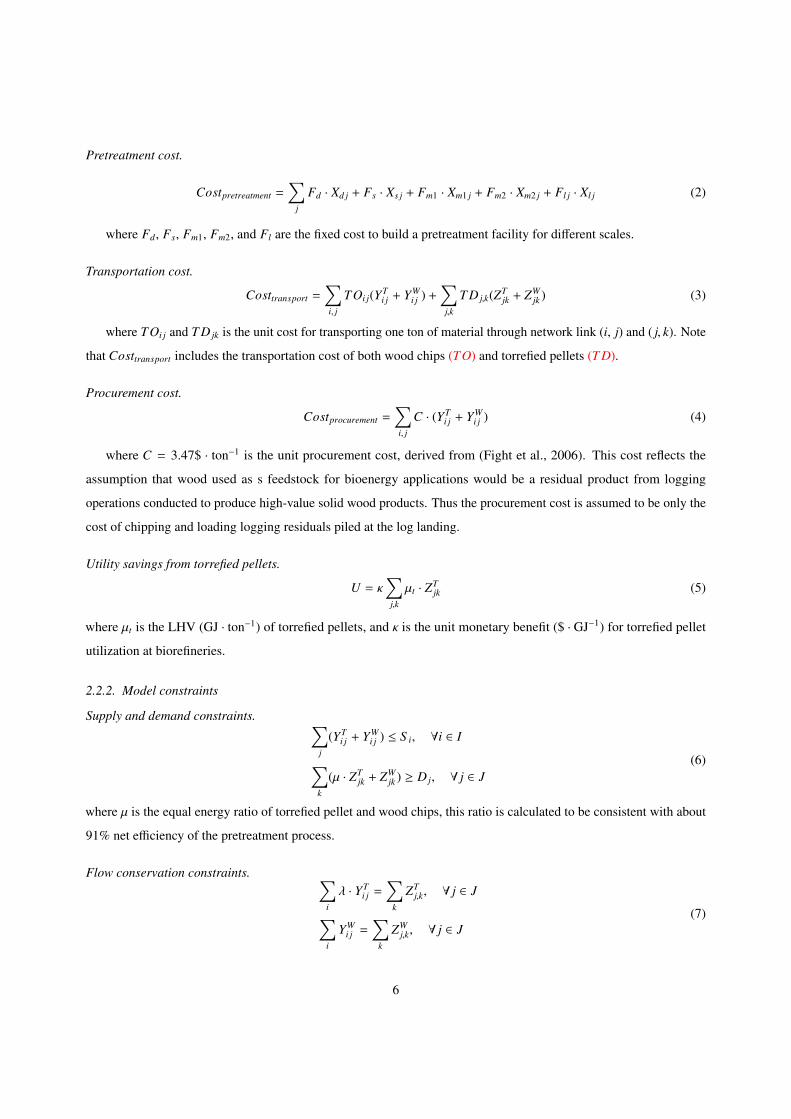
Table 1 – continued from previous page
Name Definition and Unit
C unit feedstock procurement cost, $ · ton−1
U biorefinery cost savings from torrefied pellets,$ · GJ−1
µ equal energy comparison ratio between torrefied pellet and wood
chips.
λ mass ratio of output torrefied pellets to input wood chips
S i maximum annual feedstock production for location i, ton/a
Dk feedstock demand of biorefinery at location k, ton/a
Capd, Caps, Capm1, Capm2, and
Capl
torrefaction conversion capacity at different scales, ton/a
decision variables
Xd j binary, build distributed scale facility at location j
Xs j binary, build small scale facility at location j
Xm1 j binary, build medium facility at location j
Xm2 j binary, build optimal scale facility at location j
Xl j binary, build facility scale facility at location j
X0 j binary, transport wood chips through node j
YTi j ∈ R
+ amount of wood chips transported from feedstock location i to
pretreatment facility j, tons
ZTjk ∈ R
+ amount of torrefied pellets transported from pretreatment facility
j to the biorefinery k, tons
YWi j ∈ R
+ and ZWjk ∈ R
+ is defined similarly, for the wood chips not going into the pre-
treatment system, tons
2.2. Model formulation
2.2.1. Model objective
The model objective is to minimize the annualized total cost of the supply system given biomass demand and
supply constraints. System costs include procurement, pretreatment and transportation as well as the avoided refining
costs from utilization of torrefied pellets instead of wood chips at the biorefinery.
min. Costpretreatment + Costtransport + Costprocurement − U (1)
5
Pretreatment cost.
Costpretreatment =∑
j
Fd · Xd j + Fs · Xs j + Fm1 · Xm1 j + Fm2 · Xm2 j + Fl j · Xl j (2)
where Fd, Fs, Fm1, Fm2, and Fl are the fixed cost to build a pretreatment facility for different scales.
Transportation cost.
Costtransport =∑i, j
TOi j(YTi j + YW
i j ) +∑
j,k
T D j,k(ZTjk + ZW
jk ) (3)
where TOi j and T D jk is the unit cost for transporting one ton of material through network link (i, j) and ( j, k). Note
that Costtransport includes the transportation cost of both wood chips (TO) and torrefied pellets (T D).
Procurement cost.
Costprocurement =∑i, j
C · (YTi j + YW
i j ) (4)
where C = 3.47$ · ton−1 is the unit procurement cost, derived from (Fight et al., 2006). This cost reflects the
assumption that wood used as s feedstock for bioenergy applications would be a residual product from logging
operations conducted to produce high-value solid wood products. Thus the procurement cost is assumed to be only the
cost of chipping and loading logging residuals piled at the log landing.
Utility savings from torrefied pellets.
U = κ∑
j,k
µt · ZTjk (5)
where µt is the LHV (GJ · ton−1) of torrefied pellets, and κ is the unit monetary benefit ($ · GJ−1) for torrefied pellet
utilization at biorefineries.
2.2.2. Model constraints
Supply and demand constraints. ∑j
(YTi j + YW
i j ) ≤ S i, ∀i ∈ I
∑k
(µ · ZTjk + ZW
jk ) ≥ D j, ∀ j ∈ J(6)
where µ is the equal energy ratio of torrefied pellet and wood chips, this ratio is calculated to be consistent with about
91% net efficiency of the pretreatment process.
Flow conservation constraints. ∑i
λ · YTi j =
∑k
ZTj,k, ∀ j ∈ J
∑i
YWi j =
∑k
ZWj,k, ∀ j ∈ J
(7)
6

Capacity constraints.∑i
YTi j ≤ Capd · Xd j + Caps · Xs j + Capm1 · Xm1 j + Capm2 · Xm2 j + Capl j · Xl j ∀ j ∈ J
∑i
YWi j ≤ M · X0 j ∀ j ∈ J
(8)
where Capd, Caps, Capm1, Capm2, and Capl are the production capacity of pretreatment facilities at different
scales. And M is just an arbitrary large positive number. These two inequalities are forcing constraints that captures the
fact that if there is no facility at location j, no torrefied pellets or wood chips could be sent there.
Other facility siting related constraints.
Xd j + Xs j + Xm1 j + Xm2 j + Xl j + X0 j ≤ 1, ∀ j ∈ J (9)
In order to maintain the network consistency, we require that at most one type of facility could be chosen at each
location.
Xs j, Xm1 j, Xm2 j, Xl j, Xl j = 0, ∀ j ∈ J f (10)
At dummy supply locations, only Distributed scale pretreatment or sending raw wood chips are allowed.
X0 j = 0, ∀ j ∈ {Jb, Jp} (11)
Unpretreated biomass could only be sent from feedstock sources to biorefineries through dummy supply locations, thus
no wood chip shipment is allowed via sets Jb, Jp.
Binary and non-negativity constraints.
Xd j, Xs j, Xm1 j, Xm2 j, Xl j, X0 j =
0 not built,
1 built.∀ j ∈ J (12)
YTi j ,Z
Tjk,Y
Wi j ,Z
Wjk ≥ 0 ∀(i, j) ∈ (I, J) (13)
3. Model input
3.1. Technical characteristics of the combined torrefaction and pelletization process
Torrefaction is a thermal process performed at atmospheric pressure in the absence of oxygen, at temperatures
ranging between 200◦ and 300◦ Celsius. Under these conditions water and some mass is volatilized and biomass
becomes more friable. The process results in improved fuel quality for combustion and gasification applications.
Torrefaction has not been widely commercialized however, existing literature shows that torrefaction significantly
7

increases energy density, hydrophobicity, friabilty, flowability, and combustion characteristics of biomass (Uslu et al.,
2008; Tumuluru et al., 2011; Ciolkosz and Wallace, 2011; International Energy Agency, 2012a,b; Shah et al., 2012;
Van der Stelt et al., 2011). Torrefied biomass typically contains 70% of its initial weight and 90% of its initial energy
content (Bergman P.C.A., 2005). Since torrefied biomass losses relatively more oxygen and hydrogen than carbon, the
calorific value of the product usually increases significantly.
Torrefied biomass possesses some undesirable properties as well, including increased porosity, low mass density,
decreased mechanical strength and increased dust formation (Uslu et al., 2008). Densification has been widely suggested
to ameliorate these issues. Pelletization densifies raw biomass materials under high pressure in order to improve
uniformity and increase density. Under pressure during pelletization, lignin present in wood biomass is mobilized and
becomes a binding agent. The Energy Research Center of Netherlands’ (ECN) has developed (Bergman P.C.A., 2005;
Bergman P.C.A., Boersma A.R., Zwart R.W.R, Kiel J.H.A, 2005) the so-called TOP process combining torrefaction
and pelletization. A schematic of the TOP process is demonstrated in Figure 2, in which torrefaction is introduced
between drying and size reduction steps in a traditional pelletization process.
Figure 2: Schematics of torrefaction, pelletization and TOP process (Bergman P.C.A., 2005)
The compressed torrefied pellet has significantly higher energy and bulk density. In addition torrefied pellets
are less hygroscopic, have greater mechanical strength, and form less dust when compared with traditional wood
pellets (Bergman P.C.A., 2005). In our baseline scenario, we assume that the LHV of torrefied pellet is 20.8 MJ/kg
(Bergman P.C.A., 2005) compared with 6.2 MJ/kg of wood chips at 57% moisture content (MC) (USDA Forest Products
Laboratory, 2004) as a result of the TOP process. The mass density is increased from 326 kg/m3 (Fiala and Bacenetti,
2012) to 850 kg/m3 (Bergman P.C.A., 2005). Performance data from the TOP process are listed in Table 2.
3.2. Economic evaluation of torrefaction and pelletization at multiple scales
The economy of scale is a crucial factor influencing production cost and efficiency (Jenkins, 1997). The scale effect
and the existence of an optimal investment cost for capital-intensive biomass pretreatment technologies used in this
8

Table 2: Technical characteristics of the TOP process (Bergman P.C.A., 2005; Fiala and Bacenetti, 2012)
Properties Unit Green wood chips TOP pellets
Moisture content wt% 57 % 3 %
Calorific value (LHV) MJ/kg 6.2 20.8
Mass density kg/m3 326 800
Energy density GJ/m3 2.0 16.6
Thermal efficiency LHV(ar) 96.5 %
Net efficiency LHV(ar) 90.8 %
paper have been investigated by Uslu et al. (2008). Lacking empirical economic data on pretreatment technologies at
industrial scale, economic evaluation of the TOP process from literature (Bergman P.C.A., 2005) is referred to as the
base size case (see Table 3). The formulaCC0
=
(MM0
)s
, where C ($) is the installed capital cost of a facility of capacity
M (MWth), and C0 ($) is the installed capital cost of the base size plant facility of capacity M0 (MWth)(Jenkins, 1997),
with a constant scaling factor of s = 0.7 is used to model the scale effect on the TOP process.
Table 3: Economic characteristics of the TOP process (Bergman P.C.A., 2005)
Item Unit TOP process
Feedstock Green wood chips
Feedstock input kton/a 170
Production capacity kton/a 56
MWth fuel 40
Total capital investment M$ 9.8
Total production cost $/ton 66
a Assumptions for this economic evaluation include: 10-year
depreciation period, 8000-hours load factor
Representative scales. Our research focuses on the impact of economies of scale in TOP process on normalized cost
for delivered biomass to the biorefinery. For this purpose, five representative scales with different capital investment
cost will serve as candidates for different locations on the supply chain network in the following scenarios, shown in
Table 4.
3.3. Biomass supply chain
3.3.1. Transportation network
The transportation network in this study is modelled in a GIS using the National Transportation Atlas Database
(2011) from the Bureau of Transportation Statistics (Bureau of Transportation Statistics, 2011). It includes multiple
9

Table 4: Representative conversion scales for the TOP process
Scale/IDPlant Size Specific Investment
kton/year, product MWth-fuel Cost ($/ton)
Distributed/Dist35 a 3.5 2.5 73.3
Small 28 20 39.9
Medium 1/Med56 56 40 31.7
Medium 2/Med105 105 75 26.4
Large/Large210 210 150 21.5
a Distributed scale pretreatment is a mobile process located at primary collection point
where wood chip van loading would take place.
modes (highway, railway and marine) for bulk biomass transportation, as well as inter-modal facilities, which allows
for unloading/loading of biomass to change transportation modes. For biomass transportation between two specific
nodes (e.g., forest landing to pretreatment facility or to biorefinery), rail or marine transportation could be used on long
routes for economic benefit assuming transloading is an option. The network allows for direct deliveries to biorefineries
via rail or marine routes if biorefineries are proximal to rail or marine routes, otherwise biorefineries must take delivery
by truck.
3.3.2. Feedstocks
Forest biomass feedstock data used in this analysis is derived from Sethi and Simmons (2005). The original data
was generated at a 30m spatial resolution. For the purposes of this analysis, 30m pixels were aggregated to 1.6km
harvest units to reflect the likely size of operational units. Feedstock availability is estimated based upon forest type
and ownership. Supply is annualized based upon an expected rotation of 60 years on private lands and 75 years on
public lands. Forest land area with administrative restrictions (wilderness areas, roadless, etc), riparian buffer zones,
and slopes greater than 35% are excluded.
3.3.3. Biorefineries
In Tittmann et al. (2010) optimal biorefinery locations were identified in California based on supply chain and
fuel distribution costs. We selected the locations of all biorefineries using greater that 10 BDT/a of forest sourced
material from the previous work, resulting in 20 distinct locations. To conform with the constraints of the optimization
(Equation 6) we randomly selected 10 locations from the locations meeting the above criteria.
3.3.4. Potential locations for biomass pretreatment facilities
We assume that the selection of potential optimal location for biomass pretreatment facilities would be significantly
influenced by transportation accessibility and the geographical features of the transport network. So we use mean shift
10

method (Fukunaga and Hostetler, 1975) to cluster all network nodes. Clustering is preformed on all junction nodes
in the road network. Junction nodes exist where two road segment s intersect. Clustering is needed as in many cases
multiple nodes are located in close proximity due to a freeway interchange or overpass. The clustering resulted in 90
(out of 5177 points) selected as potential locations for pre-treatment facilities.. For the purpose of simplicity, we dont
consider any other restrictions in selecting potential locations for biomass pretreatment facilities, such as labor, land
use, etc.
3.3.5. Transportation cost
Biomass transportation costs are modelled by the same cost function as in our previous work (Tittmann et al., 2010)
for three modes: truck, rail and marine. The details of the cost components for these modes are described in Table 5.
How we model the difference in unit tranportation cost for green wood chips and TOP pellets will also be discussed
here.
Table 5: Transportation cost components
Mode Cost Component Green Wood Chips Pelletized Biomass
Road
Loading/unloading $ 5 / wet ton
Time dependent $ 29.21 / hr per truckload a
Distance dependent $ 1.77 / mile per truckload b
Truck payload 25 wet tons
Rail
Loading/unloading $ 5 / wet ton
Fixed cost $ 19.5/ wet ton $ 9.7 / wet ton
Distance dependent $ 0.023 / (wet ton·mile) $ 0.012 / (wet ton·mile)
Rail car capacity 50 wet tons 100 wet tons
Waterway
Loading/unloading $ 5 / wet ton
Fixed cost $ 3.85 / wet tons
Distance dependent $ 0.043 / (wet ton·mile)
Barge capacity 3600 wet tons
a Including capital cost of $ 18.80 / hr and labor cost of $ 10.41 / hrb Including Fuel $ 1.33 / mile, Repair & Maintenance $ 0.06 / mile and Permits &
Licensing $ 0.33 / mile, the truck fuel economy is assumed to be 3.33 miles / gallon
The costs of trucking consist of two different component: a distance dependent component and time - dependent
component. We assume that these two components won’t vary by feedstock type and depend only on the actual truck
payload.
Normally, trucks used for biomass transport have a 25 ton weight limit and a volume limit of approximately 120 m3
11
(Idaho National Laboratory, 2010), simple calculation indicates that for both woodchips and torrefied pellets, the truck
load will be constrained by weight limit, instead of volume limit. In order to take advantage of the high mass density of
torrefied pellets, trucks with significantly higher weight capacity is required. Nontheless, the 25 ton weight limited
trucks are already hitting the 80,000 ton gross weight (Idaho National Laboratory, 2010). which is is the maximum
gross vehicle weight allowed on highways. So without any further details on truck transport, we assume that there’s no
benefit in road transportation for torrefied pellets, compared with traditional wood chips.
Rail transportation cost are derived from a mileage-based rate schedule for agricultural products. According to a
freight transportation & logistics organization, a common rail car has a weight limit of about 100 ton and a volume
limit of about 150 m3 (Enviromodal, 2012). So the transportation of green wood chips is at the volume capacity, and
the actual weight capacity for is 0.326 ton/m3× 150 m3 ≈ 50 tons per rail car. On the other hand, for TOP pellets with
a mass density of 0.8 ton/m3, the total weight is 0.8 ton/m3× 150 m3 = 120 tons > 100 tons, thus it’s at the weight
capacity and the acutal payload for TOP pellets is 100 tons per rail car. Since rail car payloads for green wood chips
and TOP pelltes differ significantly, the unit cost on ton-mile basis of green wood chips is assumed to be twice as high
as TOP pellets.
Similar to rail transportation, costs of waterway shipment are derived from a published rate schedule of a trans-
portation company Tidewater that serves the Pacific Northwest area. The size and capacity of their barges indicate that
the actual payload for green wood chips and TOP-pellets would both be at weight capacity, so there’s no significant
difference of the unit transportation cost on a ton-mile basis.
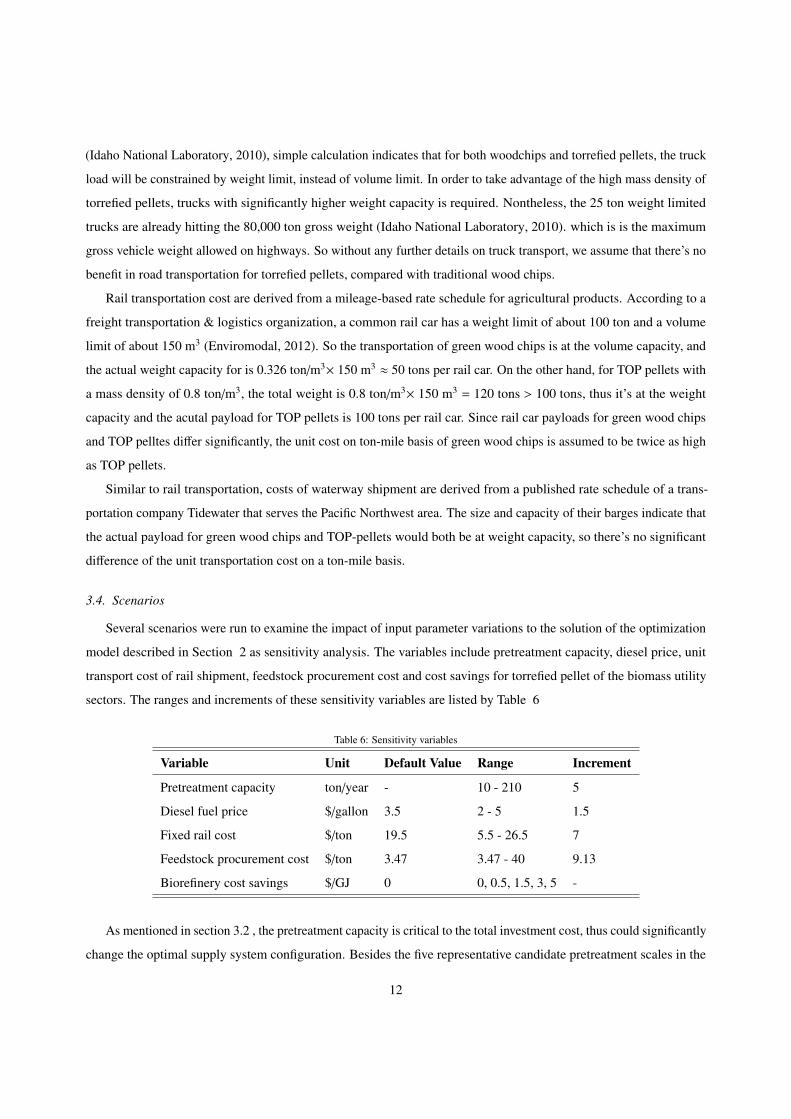
3.4. Scenarios
Several scenarios were run to examine the impact of input parameter variations to the solution of the optimization
model described in Section 2 as sensitivity analysis. The variables include pretreatment capacity, diesel price, unit
transport cost of rail shipment, feedstock procurement cost and cost savings for torrefied pellet of the biomass utility
sectors. The ranges and increments of these sensitivity variables are listed by Table 6
Table 6: Sensitivity variables
Variable Unit Default Value Range Increment
Pretreatment capacity ton/year - 10 - 210 5
Diesel fuel price $/gallon 3.5 2 - 5 1.5
Fixed rail cost $/ton 19.5 5.5 - 26.5 7
Feedstock procurement cost $/ton 3.47 3.47 - 40 9.13
Biorefinery cost savings $/GJ 0 0, 0.5, 1.5, 3, 5 -
As mentioned in section 3.2 , the pretreatment capacity is critical to the total investment cost, thus could significantly
change the optimal supply system configuration. Besides the five representative candidate pretreatment scales in the
12

baseline model run, we set pretreatment capacity as a sensitivity variable with a range from 10 kton to 210 kton per
year and a much finer increment of 5 kon/year to examine its impact on the system.
Diesel fuel price has been oscillating in the last 7 years with the highest price at 4.771 $/gallon in July 2008 and
the lowest price at 2.051 $/gallon in March 2009 (U.S. Energy Information Administration, 2014). To represent this
fluctuation and reflect the uncertainty in diesel price, we use three diesel price levels - 2 $/gallon, 3.5 $/gallon and 5
$/gallon in sensitivity analysis.
Rail transport costs are difficult to accurately predict. Bulk rail rates depend on the volume being transported; unit
trains carrying a single commodity in 100-150 cars result in substantially less cost than mixed load trains. Previous
analyses have used a published rate schedule (Union Pacific Railroad, 2007) for mixed trains. We estimate this rate to
be higher than what would likely be paid. Further, Searcy et al. (2007) estimated rail transport cost to be substantially
less than the UP rate schedule. Therefore we elected to conduct sensitivity analysis to reflect uncertainty regarding rail
transport rates.
The procurement cost range reflects the variability in costs associated with different harvest scenarios. Many
industrial timber harvesting operations produce biomass at the landing in the form of tops and limbs. The low end
procurement cost which is used in the base model makes the assumption that the limbs and tops at the landing are
available at no cost and thus the only cost associated with procuring that material is incurred from chipping and loading.
The high estimate assumes that all the costs from harvesting, yarding, chipping and loading must be paid to procure
material. The high case reflects a ’biomass only’ harvest scenario. Costs for high and low cases were calculated using
the Fuels Reduction Cost Simulator (Fight et al., 2006).
The cost savings at biorefineries brought by torrefied pellet utilization takes into account the fact that torrefied
pellets reduce energy consumptions of drying, size reduction and densification of biomass feedstock before the final
conversion, other types of capital investment such as outside storage would also be lowered by pellet utilization.
Although such cost savings were widely mentioned in literature (International Energy Agency, 2012a,b; Bergman
P.C.A., 2005; Uslu et al., 2008), an accurate quantitative measure of such benefit is hard. In our model analysis, we
choose a range from 0 $/GJ to 5 $/GJ for the cost saving parameter, where 5 $/GJ roughly corresponds to the point of
100 % torrefied pellet utilization in the optimal system.
4. Model results and sensitivity analysis
The model is applied to California as the case study and solved by optimization solver Gurobi (Gurobi Optimization,
2013).
4.1. Baseline scenario results
4.1.1. The optimal system design
Figure 3 spatially displays the optimal system design of the baseline scenario input, including the pretreatment
facility siting results and the woody biomass shipment decisions. The optimal siting solution consists of 3 of the 5
13
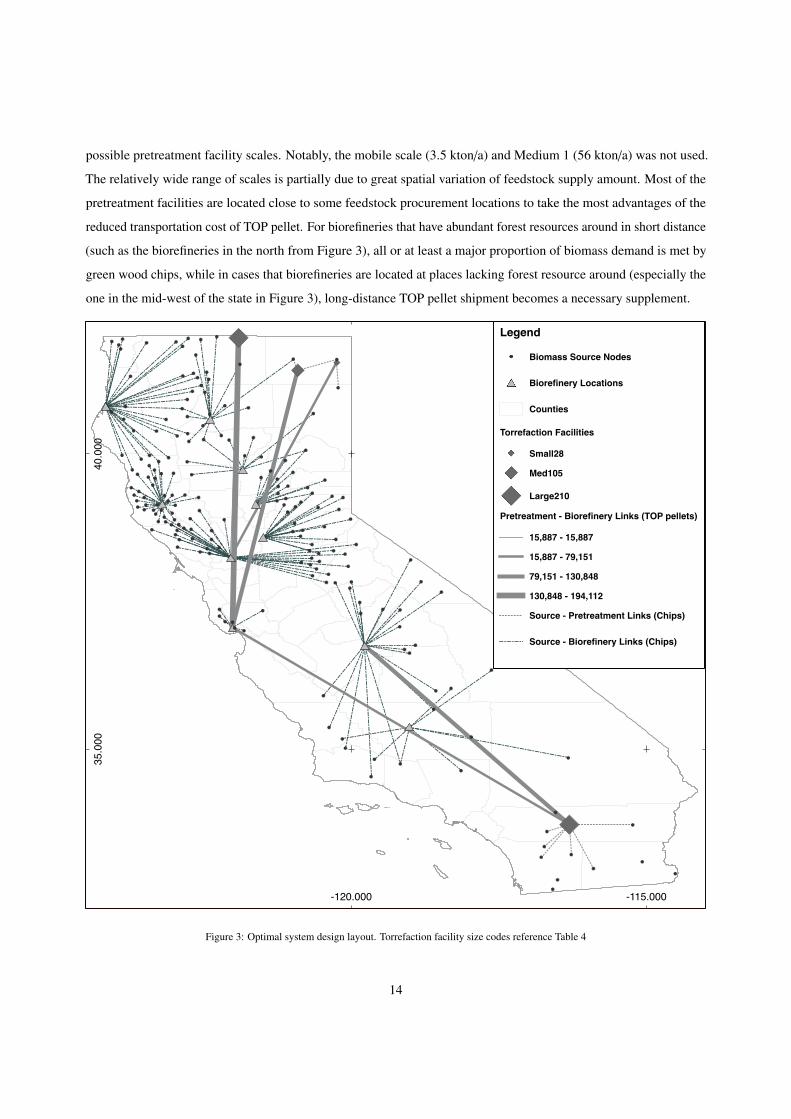
possible pretreatment facility scales. Notably, the mobile scale (3.5 kton/a) and Medium 1 (56 kton/a) was not used.
The relatively wide range of scales is partially due to great spatial variation of feedstock supply amount. Most of the
pretreatment facilities are located close to some feedstock procurement locations to take the most advantages of the
reduced transportation cost of TOP pellet. For biorefineries that have abundant forest resources around in short distance
(such as the biorefineries in the north from Figure 3), all or at least a major proportion of biomass demand is met by
green wood chips, while in cases that biorefineries are located at places lacking forest resource around (especially the
one in the mid-west of the state in Figure 3), long-distance TOP pellet shipment becomes a necessary supplement.
Figure 3: Optimal system design layout. Torrefaction facility size codes reference Table 4
14
4.1.2. System cost breakdown
The total system cost is comprised of three components: feedstock procurement cost, pretreatment production cost
and transportation cost.
We consider the breakdown of average system cost for biomass utilization of 1 GJ at biorefinery gate. The average
total delivered cost is $5.16/GJ, which is about $0.42/GJ lower than a system without any pretreatment process incurred.
In the baseline scenario run, 15.05 % of the final biomass supply (in GJ) to refineries is pretreated, and the procurement
cost does not change compared with the non-pretreatment system while the pretreatment production cost takes about
8.14% of the total system delivered cost. The transportation cost decreased from $5.03/GJ to $4.19/GJ, which shows
great potential in cost saving by biomass pretreatment utilization.
4.1.3. Transportation modal split
Another interesting aspect of optimal system is the transportation modal split. In the optimal system, 39.25 % of
the feedstock shipment (in gigajoule - miles) is made by rail transportation, and 60.74 % is made by road transportation.
For the same set of input data, the corresponding non-pretreatment system results in 25.39 % of rail transportation
usage, which indicates the particular advantage of rail transport for high mass-density material.
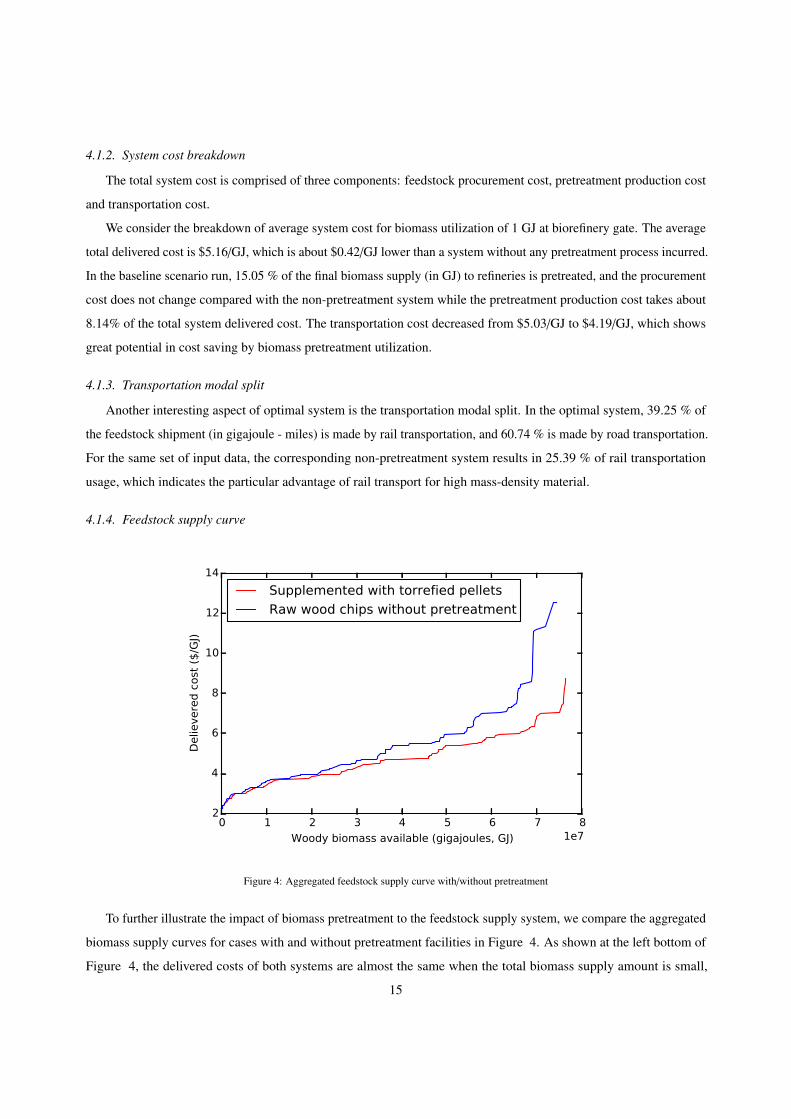
4.1.4. Feedstock supply curve
0 1 2 3 4 5 6 7 8
Woody biomass available (gigajoules, GJ) 1e7
2
4
6
8
10
12
14
Delie
vere
d c
ost
($
/GJ)
Supplemented with torrefied pellets
Raw wood chips without pretreatment
Figure 4: Aggregated feedstock supply curve with/without pretreatment
To further illustrate the impact of biomass pretreatment to the feedstock supply system, we compare the aggregated
biomass supply curves for cases with and without pretreatment facilities in Figure 4. As shown at the left bottom of
Figure 4, the delivered costs of both systems are almost the same when the total biomass supply amount is small,
15
these feedstocks often come from raw woodchips at close distances to biorefineries. As more biomass is required,
the delivered costs of both systems start to increase, but for the one supplemented with torrefied pellets, the grow of
delivered cost is not as rapidly as in a pure raw biomass supply system. This cost difference becomes greater and fairly
significant when the total demand is over 6 GJ.
4.2. Sensitivity Analysis
As mentioned in section 3.4, how variabilities of different model input parameters would impact the biomass
optimal system design were tested by the optimization model. Note that some of the input parameters are directly
determinant to some aspects of the optimal result, such as feedstock procurement cost and TOP pellet utilization
savings, thus we only examined the total delivered cost and especially the transportation cost component, instead of all
four components in the system cost.
4.2.1. Impact of pretreatment scale
In section 3.2, we set up five discrete pretreatment conversion scales (distributed, small, medium 1, medium 2 and
large-size) as candidates for the optimization model, where the result in section 4.1.1 showed that larger scales are
more likely to benefit the overall biomass supply system. However, more scenarios on pretreatment scales with finer
increment are needed to further demonstrate the explicit impact of pretreatment size on optimal system design. To do
so, we use single scale candidate in the model and range the TOP pellet production capacities from 10 kton/year to 210
kton/year, with an increment of 5 kton/year.
Figure 5 shows how average biomass delivered cost, transport cost, the proportion of TOP pellet in all delivered
biomass and the percentage of rail transportation in all biomass shipment in ton-miles change with respect to pretreat-
ment capacity variation. The total delivered cost and transport cost almost monotonically decrease from $ 5.52/GJ to $
5.16/GJ and from $ 4.84/GJ to $ 4.15/GJ, respectively. But after the fixed scale becomes larger than about 100 kton/year,
the transportation cost starts to fluctuate and the cost reduce is no longer significant. Consistently, the proportion of
biomass demand met by TOP-pellets has an increasing trend (from 3.06 % to 17.08 %) as pretreatment production
capacities get larger. Nonetheless there are still fluctuations between 70 kton/year and 140 kton/year capacities.
Since large-scale pretreatment facilities require a great amount of capital investment, which could make it less
profitable once the savings in handling, transport and utility sector were offset by this large amount of investment.
Despite the scale effect in our model assumption, the proportion of TOP pellet utilization in the optimal system is
eventually determined by the demand, feedstock availability and other system characteristics.
The proportion of rail shipment in total gigajoule-miles of biomass transport also has an increasing trend from
25.43 % to 42.32%. Although we mention in Section 3.3.5 that rail transport is much efficient than road specifically for
materials with high density such as TOP pellets, building a pretreatment facility in intermediate location still leads to
extra biomass handling and transportation, the cost of which depends on local transportation network characteristics
such as railway accessibility. As for the case of California, the fairly high percentage of railway transportation in
16

all pretreatment-scale scenarios shown in Figure 5 demonstrates how biomass pretreatment could benefit from rail
transportation for long-distance shipment when a large amount of biomass is required, which makes it a promising
mode for high-density biomass feedstock transportation in the California.
0 50 100 150 200 250
Maximum pretreatment capacity (kton/year)
4.0
4.2
4.4
4.6
4.8
5.0
5.2
5.4
5.6
cost
($
/GJ)
0.00
0.05
0.10
0.15
0.20
0.25
0.30
0.35
0.40
0.45
Perc
enta
ge (
%)
average delivered cost ($/GJ)
average transport cost ($/GJ)
Percentage of pretreated biomass
Percentage of rail transport
Figure 5: The impact of Pretreatment Capacities. (Average delivered and transportation cost in blue use left scale, pretreated biomass and rail
transport ratio in red use right scale)
4.2.2. Impact of transportation cost parameters
In this section, we investigate the impact of varying transport cost input parameters on the biomass supply system.
The changes in diesel price for road transportation and the fixed cost in rail transportation are combined as joint
scenarios. The same dependent model output variables as in the previous section were examined.
From Figure 6(a), we can see that although the increase in rail cost also raises the average system delivered cost
and average transport cost, the diesel fuel price clearly plays a more important role in doing so. Besides the reason that
road shipment is still the majority part of the biomass delivery, our transport cost model assumes that trucking is much
more expensive than rail transportation on a $/gigajoule-mile basis. Since the model was only applied to one state and
there is not too much demand for long-distance shipment, the cost of road transportation cost still dominates railway
transportation cost in the optimal system.
For the same reason, diesel price has greater impact on TOP pellet utilization proportion as shown in Figure 6(b).
Note that although on a $/ton-mile basis, trucking for greenwood chips was not modelled significantly different from
pretreated biomass, TOP pellet utilization would still reduce the total tonnage of biomass transported due to higher
energy density compared with green wood chips. The more expensive the diesel fuel is, the more likely it is for the
model to seek for more pretreatment utilization. The proportion of rail shipment is very sensitive in to variations of
17
rail cost estimation, and drops significantly when the fixed railway transport cost increases, which again, indicates
that the demand for rail transport in long-distance shipment is unstable and when only state-wide biomass delivery is
considered.
4.2.3. Impact of procurement cost and cost savings at utility sector
We also tuned two critical cost input parameters together as part of the sensitivity scenarios. Intuitively, cost saving
at biorefinery for TOP pellet utilization in $/GJ and feedstock procurement cost in $/ton will greatly affect the optimal
system configuration.
As shown in Figure 7(a), the system delivered cost decreases monotonically as the TOP utilization saving at
biorefinery is rising, and it is also elevated significantly from around $2/GJ - $5/GJ to about $7/GJ-$11/GJ as the
feedstock procurement increases from $3.47/ton to $40/ton. Note that the variation of feedstock procurement cost is
actually a huge rise by about $5.9/GJ in green wood chips handling cost.
The impact on average transport cost appeared to be similar with the impact on average delivered cost. Shown in
the bottom plot of Figure 7(a) as different coloured lines, the greater the procurement cost is, the larger the average
transport cost in $/GJ becomes, mainly because the high procurement cost in $/ton makes torrefied pellet less affordable
due to the energy loss factor in the pretreatment process, and less torrefied pellets lead to less rail transportation and a
higher average transportation cost. This is also demonstrated in Figure 7(b), as the percentage of pretreated biomass
decreases when procurement cost is assumed to be higher. The increase in TOP utilization saving at biorefinery (shown
in the bottom plot of Figure 7(a) in x-axis) also reduces the average transport cost in a even more rapidly fashion by
requiring a larger proportion of torrefied pellets in the system.
In terms of the impact on pretreated biomass percentage and rail transportation (in gigajoule-mile) proportion
shown in Figure 7(b). It is clear how increase in pretreatment utilization saving and reduce in procurement cost lead to
a growing proportion of pretreated biomass in the optimal system.
On the other hand, the impact on rail transportation proportion is not always consistent where a raise in pretreatment
utilization saving and a decrease in feedstock procurement cost (both lead to an increase in torrefied pellet utilization)
does have a trend of increasing the rail shipment percentage for biomass delivery, there are also jumps and fluctuations
in the plot. The reason is that when TOP utilization keeps increasing, some more pretreatment facilities will be selected
and possibly at places without good railway network accessibility. Although in general rail transport for densified
material is assumed to be more advantageous, local transportation network characteristics is in a higher hierarchical
position in deciding the optimal transportation mode.
5. Conclusion and Discussions
This study investigates the spatial and economic impact of combined torrefaction and pelletization (TOP) process
on woody biomass supply in California. By integrating economic assessment and scale factor of this pretreatment
18

technology with other economic and geographic components of biomass supply system, we are able to evaluate the
influence of feedstock pre-processing via a system optimization approach.
Our model result analysis shows that TOP process could reduce the total cost, especially biomass transportation
cost under all scenarios. In the baseline scenario, The total delivered feedstock cost and transportation cost of an
optimal biomass supply system incorporated with pretreatment facilities is 7.7% (0.42 $/GJ) and 16.7% (0.84 $/GJ)
lower than the optimal system without biomass pretreatment, respectively.
Critical factors affecting the performance of biomass pretreatment was investigated in sensitivity analysis. A scale
effect of pretreatment facility is clearly indicated in the context of whole feedstock supply system, but the trends of
reduction in total delivered cost and transportation cost has dropped significantly when the pretreatment capacity is
over 100 kton/year. Cheaper feedstock procurement cost and road transportation cost could both boost torrefied pellet
utilization, while the case is less significant for lower railway biomass transportation cost. Depending on the rail cost
and the locations of pretreatment facility, railway could take up as much as about 52 % percent of the total biomass
transportation measured in gigajoule-mile or only about 18% in high fixed rail transportation cost scenarios.
Our model addresses the feasibility and optimal design (pretreatment facility size, locations, and feedstock
transportation) of pre-processing incorporated biomass supply system. It provides insights into the potential of
combined torrefaction and pelletization technology in increasing economic efficiency in California’s forest biomass
feedstock supply. The modelling framework is also flexible to implement for investigating other types of pretreatment
technologies and biomass feedstocks.
The present model is limited in the several ways. The additional cost savings at biorefineires brought by torrefied
pellet utilization is assumed to be zero in the baseline scenario and 0 - 5 $/GJ in sensitivity analysis, which is only
an assumption that could fully stretch the pellet utilization potential in our model result. As a critical component in
the system that could markedly influence the optimal system configuration, a more fact-based measurement of the
additional saving parameter is needed to get an accurate estimate of the economic performances of this pretreatment
technology. The model as currently implemented in California also ignores biomass resources outside the state, and
does not consider torrefied pellets itself as a commodity for sale outside the state, which could remarkably influence
the feasibility and profitability of pretreatment facilities.
Future work and possible extension of the present model includes verification and more accurate evaluation of the
characteristics of the pretreatment technology, as well as integrating the model into the whole bioenergy production
supply chain system, where the dynamics among feedstock availability, biomass supply and the final market side of
fuel product could be synthesized to assess the total benefit that can be obtained by the TOP process.
19

4.0
4.5
5.0
5.5
6.0
cost
($/G
J)
Average delivered cost($/GJ)
5 10 15 20 25 30
Fixed Rail Cost ($/ton)
3.23.43.63.84.04.24.44.64.8
cost
($/G
J)
Average transportation cost($/GJ)Diesel price = $ 2.0 /gallonDiesel price = $ 3.5 /gallonDiesel price = $ 5.0 /gallon
(a) The impact on system cost
10111213141516171819
Perc
enta
ge(%
)
Percentage of pretreated biomass
5 10 15 20 25 30
Fixed Rail Cost ($/ton)
152025303540455055
Perc
enta
ge(%
)
Percentage of rail transportationDiesel price = $ 2.0 /gallonDiesel price = $ 3.5 /gallonDiesel price = $ 5.0 /gallon
(b) The impact on TOP utilization and rail shipment ratio
Figure 6: The impact of transportation cost parameters
20

0
2
4
6
8
10
12
cost
($
/GJ)
Average delivered cost($/GJ)
0 1 2 3 4 5
TOP utilization saving ($/GJ)
3.03.23.43.63.84.04.24.4
cost
($
/GJ)
Average transportation cost($/GJ)Procurement cost = $ 3.47 /ton
Procurement cost = $ 12.6 /ton
Procurement cost = $ 21.73 /ton
Procurement cost = $ 30.87 /ton
Procurement cost = $ 40.0 /ton
(a) The impact on system cost
102030405060708090
100
Perc
enta
ge(%
)
Percentage of pretreated biomass
Procurement cost = $ 3.47 /tonProcurement cost = $ 12.6 /tonProcurement cost = $ 21.73 /tonProcurement cost = $ 30.87 /tonProcurement cost = $ 40.0 /ton
0 1 2 3 4 5
TOP utilization saving ($/GJ)
37
38
39
40
41
42
43
Perc
enta
ge(%
)
Percentage of rail transportation
(b) The impact on TOP utilization and rail shipment ratio
Figure 7: The impact of input cost parameters
21
References
Bergman P.C.A., 2005. Combined torrefaction and pelletisationthe TOP process. Report ECN-C-05-073, The Netherlands.
URL http://www.ecn.nl/docs/library/report/2005/c05073.pdf
Bergman P.C.A., Boersma A.R., Zwart R.W.R, Kiel J.H.A, 2005. Torrefaction for biomass co-fireing in existing coal-fired power stations ”Biocoal”.
Report ECN-C-05-013, The Netherlands.
URL ftp://kernenergie.nl/pub/www/library/report/2005/c05013.pdf
Bureau of Transportation Statistics, 2011. National atlas transportation database of the united states.
URL http://www.bts.gov/publications/national transportation atlas database/2011/
California Bioenergy Interagency Working Group, 2012. Bioenergy action plan for california.
URL http://www.energy.ca.gov/bioenergy action plan/
Ciolkosz, D., Wallace, R., 2011. A review of torrefaction for bioenergy feedstock production. Biofuels, Bioproducts and Biorefining 5 (3), 317–329.
URL http://dx.doi.org/10.1002/bbb.275
Congress, U., 2007. Energy independence and security act of 2007. Public Law (110-140), 2.
Dunnett, A. J., Adjiman, C. S., Shah, N., Jan. 2008. A spatially explicit whole-system model of the lignocellulosic bioethanol supply chain: an
assessment of decentralised processing potential. Biotechnology for biofuels 1 (1), 13.
URL http://www.springerlink.com/content/uk08703145310322/
Enviromodal, 2012. Guide to common rail cars.
URL http://www.enviromodal.com/files/railcar guide.pdf
Fiala, M., Bacenetti, J., 2012. Economic, energetic and environmental impact in short rotation coppice harvesting operations. Biomass and Bioenergy
42 (0), 107 – 113.
URL http://www.sciencedirect.com/science/article/pii/S0961953411003953
Fight, R., Hartsough, B., Noordijk, P., 2006. Users guide for frcs: Fuel reduction cost simulator software,portland, or.
URL http://www.fs.fed.us/pnw/data/frcs/frcs.shtml
Fukunaga, K., Hostetler, L., 1975. The estimation of the gradient of a density function, with applications in pattern recognition. IEEE Transactions
on Information Theory 21 (1), 32–40.
Gurobi Optimization, I., 2013. Gurobi optimizer reference manual.
URL http://www.gurobi.com
Idaho National Laboratory, 2010. Uniform-format feedstock supply system: A commodity-scale design to produce an infrastructure-compatible
biocrude from lignocellulosic biomass (draft).
URL https://inlportal.inl.gov/portal/server.pt?open=512&objID=421&PageID=5806&cached=true&mode=2&userID=1829
International Energy Agency, 2012a. Possible effect of torrefaction on biomass trade (iea bioenergy task 40 report).
URL http://www.bioenergytrade.org/downloads/t40-torrefaction-2012.pdf
International Energy Agency, 2012b. Status overview of torrefaction technologies (iea bioenergy task 32 report).
URL http://www.ieabcc.nl/publications/IEA Bioenergy T32 Torrefaction review.pdf
Jenkins, B., 1997. A comment on the optimal sizing of a biomass utilization facility under constant and variable cost scaling. Biomass and Bioenergy
13 (12), 1 – 9.
Parker, Nathan, 2011. Modeling future biofuel supply chains using spatially explicit infrastructure optimization. Institute of Transportation Studies,
University of California, Davis, Research Report, UCD-ITS-RR-11-04.
URL http://publications.its.ucdavis.edu/publication detail.php?id=1471
Pavley, F., Nunez, F., 2006. Assembly Bill 32: the California global warming solutions act of 2006.
URL http://www.leginfo.ca.gov/pub/05-06/bill/asm/ab 0001-0050/ab 32 bill 20060927 chaptered.pdf
Searcy, E., Flynn, P., Ghafoori, E., Kumar, A., Apr. 2007. The relative cost of biomass energy transport. Applied biochemistry and biotechnology
22
137-140 (1-12), 639–52.
URL http://www.springerlink.com/content/h73770482r5p8418/
Sethi, P., Simmons, G., 2005. Biomass Potentials from California Forest and Shrublands Including Fuel Reduction Potentials to Lessen Wildfire
Threat. Tech. rep., California Energy Commission, Sacramento.
Shah, A., Darr, M. J., Medic, D., Anex, R. P., Khanal, S., Maski, D., JAN-FEB 2012. Techno-economic analysis of a production-scale torrefaction
system for cellulosic biomass upgrading. BIOFUELS BIOPRODUCTS & BIOREFINING-BIOFPR 6 (1), 45–57.
Tidewater, 2007. Rate schedule 200-a. tech. rep., tidewater inc.
URL http://tidewater.com/resources/rate-sheets
Tittmann, P., Parker, N., Hart, Q., Jenkins, B., 2010. A spatially explicit techno-economic model of bioenergy and biofuels production in california.
Journal of Transport Geography 18 (6), 715 – 728.
Tumuluru, J. S., Wright, C. T., Hess, J. R., Kenney, K. L., 2011. A review of biomass densification systems to develop uniform feedstock commodities
for bioenergy application. Biofuels, Bioproducts and Biorefining 5 (6), 683–707.
URL http://dx.doi.org/10.1002/bbb.324
Union Pacific Railroad, 2007. Item 1000-AG Mileage Scale.
U.S. Energy Information Administration, 2014. Weekly retail gasoline and diesel prices.
USDA Forest Products Laboratory, 2004. Fuel value calculator.
URL http://www.fpl.fs.fed.us/documnts/techline/fuel-value-calculator.pdf
Uslu, A., Faaij, A. P., Bergman, P., 2008. Pre-treatment technologies, and their effect on international bioenergy supply chain logistics. techno-
economic evaluation of torrefaction, fast pyrolysis and pelletisation. Energy 33 (8), 1206 – 1223.
Van der Stelt, M. J. C., Gerhauser, H., Kiel, J. H. A., Ptasinski, K. J., OCT 2011. Biomass upgrading by torrefaction for the production of biofuels: A
review. BIOMASS & BIOENERGY 35 (9), 3748–3762.
23