Embed Size (px)
Citation preview

The impact of combining between fundamental
and technical analysis on the decision of investors
at the currency market (Forex)
(An applied research on the Forex experts at FxPro, Markets
and Amana Capital companies)
الفني والتحليل األساسي على قرارالجمع بين التحليل أثر المستثمرين في أسواق العمالت )الفوركس(
FxPro ,Marketsخبراء الفوركس في شركة )دراسة تطبيقية على (Amana Capitalو
Prepared by
Yousef Atef Ahmed
Supervisor
Dr. Faris Mahmoud Abu Mouamer
This Thesis is submitted in Partial Fulfillment of the Requirements for the
Master Degree of Business Administration
May, 2016
ـــزةــغـ – الجـامعـــــة اإلســالميــــــة
العليا حث العلمي والدراساتبشئون ال ــارةــــــة التـــجــــــــــــــليـــــــــــــــكـ
إدارة األعمــــــــــــال رــــــــيـــــستــــــماج
The Islamic University–Gaza
Research and Postgraduate Affairs
Faculty of Commerce
Master Business Administration

I
إقــــــــــــــرار
أنا الموقع أدناه مقدم الرسالة التي تحمل العنوان:
The impact of combining between fundamental
and technical analysis on the decision of investors
at the currency market (Forex)
(An applied research on the Forex experts at FxPro, Markets and Amana
Capital companies)
أثر الجمع بين التحليل الفني والتحليل األساسي على قرار المستثمرين في أسواق العمالت )الفوركس(
(Amana Capitalو FxPro ,Markets)دراسة تطبيقية على خبراء الفوركس في شركة هذه الرسالة إنما هو نتاج جهدي الخاص، باستثناء ما تمت أقر بأن ما اشتملت عليه
لنيل االخرين اإلشارة إليه حيثما ورد، وأن هذه الرسالة ككل أو أي جزء منها لم يقدم من قبل درجة أو لقب علمي أو بحثي لدى أي مؤسسة تعليمية أو بحثية أخرى.
Declaration
I understand the nature of plagiarism, and I am aware of the University’s
policy on this.
The work provided in this thesis, unless otherwise referenced, is the researcher's own
work, and has not been submitted by others elsewhere for any other degree or qualification.
Yousef Atef Ahmed اسم الطالب:Student's name:
:Signature التوقيع:
:Date التاريخ:


II
In the name of Allah, the most
Beneficent, the most Merciful

III
ABSTRACT
This study aims to be familiar with the effects of combining between
technical and fundamental analysis on the decisions of the investors at Forex markets
(Foreign exchange market). in addition it works on offering pieces of advice that
help the investors in working out more much successful transaction which has good
returns and avoid loss and going out of the market.
For the sake of the study the researcher used the questionnaire as a tool of the
study .the researcher distributed 105 papers of questionnaire on the experts of trading
in (Amana Capital, FxPro and Markets) companies. the Number of questionnaires
recovered, which were considered valid for statistical analysis reached 90
questionnaire with percentage of (85,71%).these questionnaires were processed using
statistical methods that suit questions and hypotheses in the light of the use of
descriptive analytical method.
The study showed a lot of results the most important is the combination of
technical analysis and fundamental analysis is considered the best way when trading
in the Forex markets in terms of achieving higher returns and avoid losses as much as
possible. The study also showed that most loosing transaction occurred as a result of
trading with depending on one type of analysis and negligence of another and also
because of random trading.
The researcher recommended a number of recommendations, the most
important is the need of understanding the rules of technical and fundamental
analysis among the investors and the necessity of combining between them when
making decisions of investment especially with regard to the ( time of entry and exit
from the market, the amount invested and put the order of taking profits and stop
losses) on the consideration of that the combination of technical analysis and
fundamental analysis leads the investor to make the best investment decision.

IV
الملخص
هدفت هذه الدراسة إلى التعرف على أثر الجمع بين التحليل الفني والتحليل األساسي على قرار المستثمرين في أسواق العمالت )الفوركس(, باإلضافة إلى تقديم مجموعة من
حقق لهم عوائد مقبولة التوصيات التي تساعد المستثمرين على تنفيذ صفقات أكثر نجاحا ت وتجنبهم الخسائر والخروج من السوق.
105ولتحقيق أهداف الدراسة استخدم الباحث االستبانة كأداة للدراسة من خالل توزيع (. وقد بلغ عدد Amana Capitalو FxPro, Marketsاستبانة على خبراء التداول في شركة )
%, 85.71استبانة بنسبة 90للتحليل االحصائي االستبانات المستردة والتي اعتبرت صالحة حيث تم معالجتها إحصائيا باستخدام األساليب اإلحصائية التي تناسب أسئلة وفرضيات الدراسة
في ضوء استخدام المنهج الوصفي التحليلي.
وأظهرت الدراسة نتائج عدة من أهمها أن الجمع بين التحليل الفني والتحليل األساسي قة المثلى عند التداول في أسواق العمالت من حيث تحقيق عوائد أعلى وتجنب تعتبر الطري
الخسائر قدر اإلمكان, من جانب آخر فقد أظهرت الدراسة أن معظم الصفقات الخاسرة تحدث نتيجة التباع أحد انواع التحليل دون اآلخر أو نتيجة للتداول العشوائي.
أهمها ضرورة إدراك المتداولين لقواعد وقد أوصى الباحث بالعديد من التوصيات من االستثمارومبادئ التحليل الفني والتحليل األساسي وضرورة الجمع بينهما عند صنع قرار
خصوصا فيما يتعلق ب )وقت الدخول والخروج من السوق, المبلغ المستثمر ووضع أوامر جني ي والتحليل األساسي يقود أن الجمع بين التحليل الفن اعتباراألرباح ووقف الخسارة( على
المستثمر لصنع قرار استثمار رشيد.

V
DEDICATION
I dedicate this study to…
Palestine, the homeland and the identity...
Martyrs, Detainees and Freedom Fighters
My Father, love, sacrifice who is always beside me...
My Mother, the words are not enough to express my gratitude to you , you always
have the most important role in encouraging me to accomplish my study
My beloved brother Abed AL-Razeq, My sisters "Maysaa, Israa, Ayda, Malak, Hafsa
and Ganat"
And finally My fiancée "Eman", who makes my life beautiful..

VI
ACKNOWLEDGEMENT
Allah the almighty helped and supported me to complete this study and grant
me the ability to study, to write, to read and to see. Really, I am extremely grateful
for my Lord Allah.
I would like to express my deepest appreciation to Dr. Faris Abu Mouamer
for providing me with critical suggestions through his supervision of my study.
My sincere appreciation is to Dr. Wael Aldaya and Dr. Haithem Ayesh who
accepted to examine this research.
I would like to thank the Forex experts at (FxPro, Markets and Amana
Capital companies), who participated for granting their time to participate in this
study and offered the necessary information.
I would like to express my deepest gratitude to my father and my mother for
their highest encouragement and assistance to me.

VII
Table of Contents
Declaration ............................................................................................................... I
Abstrac .................................................................................................................. III
Abstract In Arabic ............................................................................................... IV
Dedication ............................................................................................................... V
Acknowledgement ................................................................................................ VI
Table Of Contents .............................................................................................. VII
List Of Tables ......................................................................................................... X
List Of Figure ..................................................................................................... XII
Chapter 1 .................................................................................................................... 1
General Framework .................................................................................................. 1
1.1 Introduction: ................................................................................................... 2
1.2 Research Problem: .......................................................................................... 3
1.3 The Purpose Of The Research: ....................................................................... 4
1.4 Importance: ..................................................................................................... 4
1.5 Research Hypothesis: ..................................................................................... 5
1.6 Research Variables: ........................................................................................ 5
1.7 Methodology: ................................................................................................. 7
1.8 Data Resources: .............................................................................................. 7
1.9 Terms Of The Study: ...................................................................................... 7
1.10 Research limitation: ...................................................................................... 9
Chapter 2 .................................................................................................................. 10
Theoretical Framework ........................................................................................... 10
Section 1 ................................................................................................................ 11
Foreign Exchange Market ................................................................................... 11
2.1.1 Foreign Exchange Markets "A Brief Background" .................................. 11
2.1.2 Forex History ............................................................................................. 13
2.1.3 The Main Participant In The Forex Market ............................................... 16
2.1.4 Benefits And Risks: ................................................................................... 19
2.1.5 Economic Theories And Data ................................................................... 23
Section 2 ................................................................................................................ 26

VIII
Fundamental Analysis ......................................................................................... 26
2.2.1 The Concept Of Fundamental Analysis ................................................... 26
2.2.2 Trading Using Economic Data ................................................................. 28
2.2.3 How To Trade Forex On News Releases? ................................................ 34
2.2.4 Strengths Of Fundamental Analysis .......................................................... 37
2.2.5 Criticisms Of Fundamental Analysis ......................................................... 39
Section 3 ................................................................................................................ 42
Technical Analysis ................................................................................................ 42
2.3.1 The Concept Of Technical Analysis .......................................................... 42
2.3.2 Efficient Market And Technical Analysis ................................................. 45
2.3.3 Technical Analysis Tools .......................................................................... 47
2.3.5 Strengths and Weaknesses Of Technical Analysis .................................... 55
2.3.6 Technical Analysis Vs. Fundamental Analysis ......................................... 59
Chapter 3 .................................................................................................................. 61
literature Review ...................................................................................................... 61
3.1 Foreign Studies: ............................................................................................ 62
3.2 Arab Studies: ................................................................................................ 70
3.3 Comments On The Previous Studies: ........................................................... 73
Chapter 4 .................................................................................................................. 75
Research Design ....................................................................................................... 75
4.1 Introduction .................................................................................................. 76
4.2 Research Design .......................................................................................... 76
4.3 Data Collection Methodology ...................................................................... 77
4.4 Population and Sample Size ......................................................................... 78
4.6 Data Measurement ........................................................................................ 78
4.7 Test Of Normality ......................................................................................... 78
4.8 Validity Of Questionnaire ............................................................................ 80
4.9 Reliability Of The Research ......................................................................... 82
Chapter 5 .................................................................................................................. 84
Data Analysis and Hypothesis ................................................................................ 84
5.1. Introduction: ................................................................................................ 85
5.2. The Characteristics Of The Sample ............................................................. 85

IX
5.2.6 The Size Of Trading .................................................................................. 88
5.3 Analysis For Each Field ............................................................................... 88
5.4 Research Hypothesis .................................................................................. 100
Chapter 6 ................................................................................................................ 104
Conclusions And Recommendations .................................................................... 104
6.1. Introduction: .............................................................................................. 105
6.2. Conclusions: .............................................................................................. 105
6.3 Recommendation: ....................................................................................... 107
6.4 Further Studies: .......................................................................................... 108
References ............................................................................................................... 109
APPENDIX ............................................................................................................. 115

X
List of Tables
Table (4.1): Kolmogorov-Smirnov Test .................................................................... 79
Table (4.2): Correlation Coefficient Of Each Item Of " The Investors Understanding
Of The Rules And Principals Of Technical Analysis " And The Total Of This Field
................................................................................................................................. 127
Table (4.3): Correlation Coefficient Of Each Item Of " The Investors Dependence
On Technical Analysis When Making An Investment Decision" And the Total Of
This Field ................................................................................................................. 128
Table (4.4) :Correlation Coefficient Of Each Item Of " The Investors Understanding
Of The Rules And Principals Of Fundamental Analysis" And The Total Of This
Field ......................................................................................................................... 129
Table (4.5): Correlation Coefficient Of Each Item Of "The Investors Dependence On
Technical Analysis When Making An Investment Decision" And The Total Of This
Field ......................................................................................................................... 130
Table (4.6): Correlation Coefficient Of Each Item Of " The Investors Understanding
To The Importance Of Combining Between Technical And Fundamental Analysis
And Their Dependence On It" And The Total Of This Field .................................. 131
Table (4.7): Correlation Coefficient Of Each Field And The Whole Of Questionnaire
................................................................................................................................... 82
Table (4.8): Cronbach's Alpha For Each Field Of The Questionnaire ...................... 83
Table (5.1): Gender .................................................................................................... 85
Table (5.2): Age ......................................................................................................... 86
Table (5.3): Specialization ......................................................................................... 86
Table (5.4): Practical Qualification ........................................................................... 87
Table (5.5): Years Of Experience At Forex ............................................................... 87
Table (5.6): The Size Of Trading ............................................................................... 88
Table (5.7): Means And Test Values For “The Investors Understanding Of The Rules
And Principals Of Technical Analysis” ..................................................................... 89
Table (5.8): Means And Test Values For “The Investors' Dependence On Technical
Analysis When Making An Investment Decision” .................................................... 91
Table (5.9): Means And Test Values For “The Investors Understanding Of The Rules
And Principals Of Fundamental Analysis” ................................................................ 93
Table (5.10): Means And Test Values For “The Investor's Dependence On Technical
Analysis When Making An Investment Decision” .................................................... 96

XI
Table (5.11): Means And Test Values For “The Investors Understanding To The
Importance Of Combining Between Technical And Fundamental Analysis And Their
Dependence On It” ..................................................................................................... 98
Table (5.12): Hypothesis#1 "The Investor's Understanding Of The Rules And
Principals Of Technical And Fundamental Analysis Affects Significantly On The
Investors Decision" .................................................................................................. 100
Table (5.13): Hypothesis#2 "There Are Statistically Significant Relationships
Between Combining Technical Analysis And Fundamental Analysis, And Making
The Rational Investment Decision" ......................................................................... 101
Table (5.14): Hypothesis#3 "The Achieved Yield When Combining Between
Technical Analysis And Fundamental Analysis Is Better Than The Achieved Yield
When Depending On Random Investment" ............................................................ 102
Table (5.15):Hypothesis#4 "The Achieved Yield When Combining Between
Technical Analysis And Fundamental Analysis Is Better Than The Achieved Yield
When Depending On One Type Of Analysis With The Negligence Of Another" .. 102
XII
List of Figure
Figure (1.1): Theoretical Framework Of The Variables ......................................... 6
Figure (2.1): The Effect Of GDP ............................................................................. 28
Figure (2.2): Economic Calender ............................................................................ 36
Figure (2.3): The Effect Of Non-Farm Payroll Indicator ..................................... 36
Figure (2.4): Line Chart ........................................................................................... 49
Figure (2.5): Bar Chart ............................................................................................ 49
Figure (2.6): Candlestick Chart............................................................................... 50
Figure( 2.7): Moving Average .................................................................................. 51
Figure( 2.8): Relative Strength Index (RSI) ........................................................... 51
Figure (2.9): MACD.................................................................................................. 52
Figure (2.10): Fibonacci ........................................................................................... 53
Figure (2.11): Support And Resistance ................................................................... 53
Figure (4.1): Illustrates The Methodology Flow Chart. ........................................ 77

Chapter 1
General Framework

2
Chapter 1
Introduction
1.1 Introduction:
Quite similar to the stock markets operate the foreign exchange market
(Forex) which is a worldwide decentralized over-the-counter financial market for the
trading of currencies. The foreign exchange market determines the relative values of
different currencies (levinson, 2006).
The primary purpose of the foreign exchange is to assist international trade
and investment, by allowing businesses to convert one currency to another currency.
For example, it permits a US business to import British goods and pay Pound
Sterling, even though the business's income is in US dollars. It also supports
speculation, and facilitates the carry trade, in which investors borrow low-yielding
currencies and lend (invest in) high-yielding currencies (Flassbeck and La Marca,
2009).
There are two main types of Forex analysis that the investors need to know to
succeed: technical analysis and fundamental analysis.
Technical analysis is the use of past price behavior and/or other market data,
such as volume, to guide trading decision in assets markets. These decisions are often
generated by applying simple rules to historical price data. A technical trading rule
(TTR), for example, might suggest buying a currency if its price has risen more than
1% from its value five days earlier. Trader in stock, commodity and foreign
exchange markets use such rule widely (Neely and Weller 2011).
Fundamental analysis for the Forex market examines the macroeconomic
indicators, asset markets, and political consideration of one nation currency as
opposed to another. Macroeconomic indicators include things such as: growth rates
(Gross Domestic Product), interest rates, inflation, unemployment, money supply,
foreign exchange reserves, and productivity. Asset markets are made up of stocks,
bonds and real estate. Political considerations influence the level of confidence in a
nation's government, the climate of stability, and the level of certainty (Mcdonald,
2007)

3
Technical analysis and fundamental analysis can be especially relevant when
considering the movements in (Forex). This research hypothesizes about the
importance of combining between these two types of analysis and its impact on the
investor's decisions at Forex market.
1.2 Research problem:
In the Forex market the investors make the investment decision depending on
technical analysis, fundamental analysis or make it randomly.
The most problem that the investors in Forex fall in when they make the
investment decision and lead to big loss is depending on technical analysis with the
negligence of fundamental analysis or depending on fundamental analysis with the
negligence of technical analysis or making the investment decision randomly and this
agrees with the result of (Mattar, 2014) that indicated that there is no one type of
analysis we can depend on it only to make a good transaction.
So the objective of the research is "What is the impact of combining between
fundamental analysis and technical analysis in an investors' decision?"
To answer the main question it is essential to answer the following sub-
questions:
1. What is the level of awareness the investors have about rules, principles and
tools of technical and fundamental analysis?
2. What is the level of awareness investors have to the importance of using
technical and fundamental analysis when they make the investment decision?
3. What is the impact of depending on one type of analysis with the negligence of
another?
4. What is the difference between the achieved yield when depending on the
combining between the technical analysis and fundamental analysis and the
achieved yield when depending on one type of analysis with the negligence of
another?
5. What is the difference between the achieved yield when depending on the
combining between the technical analysis and fundamental analysis and the
achieved yield when depending on random investment?

4
1.3 The purpose of the research:
The study seeks to examine the impact of the combination between
fundamental analysis and technical analysis on the investors' decision at Forex
market. And this because the random investment and depending on one type of
analysis with the negligence of another leads to big loss. The study might ends with
practical recommendations to investors that support them to make profitability
investments in Forex market
1.4 Importance of the research:
The importance of this research appears in knowing the impact of the
combining between technical analysis and fundamental analysis on investor's
decisions at the Forex market, where the impact of answering this question shown in
two major dimensions:
1. The economic dimension: this study might give practical information to investors
that helping them to make a rational investment decision and to determine the
time of entry and exiting from the market instead of random confusion in making
an investment decision. This leads to achieve acceptable returns for investors or
minimize losses, and strengthen the foreign exchange sector through enhancing
the rules of analysis.
2. The academic dimension: this dimension appears in the originality of the study
that concerned with the currency market (Forex), and studying the impact of the
combining between fundamental analysis and technical analysis on the decisions
of investors at this market.
The study seeks to achieve the following objectives:
1. Knowing the extent the investors are aware to the rules, principles and tools of
technical and fundamental analysis.
2. Standing on the importance of combining between the technical analysis and
fundamental analysis when making the investment decision.
3. Standing on the difference between the achieved yield when taking the results
from the combining between technical analysis and fundamental analysis and the

5
achieved yield when taking the results from depending on one type of analysis
with the negligence of another.
4. Standing on the difference between the achieved yield when taking the results
from the combining between technical analysis and fundamental analysis and the
achieved yield when depending on random investment.
5. Getting some results and recommendations that support investors to make
profitable investments in Forex market.
1.5 Research hypothesis:
1. The investor's understanding of the rules and principals of technical and
fundamental analysis affects significantly on the investors decision.
2. There are statistically significant relationships between combining technical
analysis and fundamental analysis, and making the rational investment decision.
3. The achieved yield when combining between technical analysis and fundamental
analysis is better than the achieved yield when depending on random investment.
4. The achieved yield when combining between technical analysis and fundamental
analysis is better than the achieved yield when depending on one type of analysis
with the negligence of another.
1.6 Research variables:
Dependent variable:
The dependent variable is the investor's decision at the Forex market.
Independent variables:
There is a number of independent variables which are:
1. The investors' understanding and awareness to the rules and principals of
technical and fundamental analysis.
2. The importance of technical and fundamental analysis for investors, where the
increasing of importance leads to increasing of influencing on decision.
3. The investors' understanding and awareness to the importance of combining
between the technical and fundamental analysis when making an investment
decision.

6
4. The investors' depending on combination between the technical and fundamental
analysis when making an investment decision related to buying or selling.
Figure (1.1): the relationship between dependent variable (investor's decision
in the Forex market) and independent variables.
Figure (1.1): Theoretical framework of the variables
investor's decision at the Forexmarket
The investors' understanding and awareness
to the importance of
combining between the technical and fundamental
analysis
investor's understanding
to the rules and principals of technical and fundamental
analysis.
The importance of technical and fundamental analysis for
investors
The investor's depending on combination between the technical and fundamental analysis when
making an investment
decision

7
1.7 Methodology:
In order to achieve the coverage and accuracy, the researcher will use the
descriptive method because it considers the mostly used method to study Social and
human phenomena and this method fit with this study.
The researcher will distribute the survey on Forex experts at (FxPro, Markets
and Amana capital) companies for these reasons:
1. FxPro Company is the best company as evaluated by NASDAQ.
2. Markets Company is the second company as evaluated by NASDAQ.
3. Amana capital is the best company in the Middle East.
1.8 Data resources:
Secondary sources:
Through a review of books, periodicals, research and previous publications
related to this research, and any other references that might contribute to the
enrichment of the research. Also it is through the use of secondary sources we can be
familiar with the scientific methods in writing research, and taking a general
perception about the latest developments that have occurred and occur in the field of
study.
Primary sources:
A special survey will be designed as a tool for collecting information from
the study population (investors in Markets Company). The questionnaire will include
four main sections dealing with the impact of the independent variable.
1.9 Terms of the study:
1. Forex:
Forex (foreign exchange market or currency market) - is a young and
developing market of currency exchange, whose daily turnover exceeds all the
financial markets of the world (Chen, 2009).

8
2. Market micro structure:
Is a branch of finance concerned with the details of how exchange occurs in
markets and examine the ways in which the working processes of a market affects
determinants of transaction costs, prices, quotes, volume, and trading behavior (Vital,
2006).
3. Technical analysis:
Technical analysis is a method of evaluating financial instruments by
analyzing statistics generated by market activity, such as past prices and volume.
Technical analysts do not attempt to measure a security's intrinsic value, but instead
use charts and other tools to identify patterns that can suggest future activity
(Janssen, Langager and Murphy, 2010).
4. Fundamental analysis:
A method of evaluating a financial instruments that entails attempting to
measure its intrinsic value by examining related economic, financial and other
qualitative and quantitative factors including macroeconomic factors (like the overall
economy and industry conditions) (Suresh A.S, 2013).
5. Interest rate:
Each currency carries with it an interest rate. This is almost like a barometer
of that economy’s strength or weakness. High and increasing rates at the beginning
of an economic expansion can generate growth and value in a currency. On the other
hand, low and lowering rates may represent a country experiencing difficult
economic conditions which is reflective in a reduction of the currency value
(Wagner, 2012).
6. Pipe:
price interest point that measures the amount of change in the exchange rate
for a currency pair. For currency pairs displayed to four decimal places, one pip is
equal to 0.0001. Yen-based currency pairs are an exception and are displayed to only
two decimal places (0.01) (King, Osler and Rime, 2011).

9
7. Lot:
A lot refers to a bundle of units in trade. It essentially refers to the size of the
trade that you are making. A standard lot is the term used for a 100,000 unit trade,
which on most major pairs means we are trading $10 per pip (Pasche, 2014).
8. Currency pair:
A currency pair is the quotation and pricing structure of the currencies traded
in the Forex market: the value of a currency is determined by its comparison to
another currency. The first currency of a currency pair is called the "base currency",
and the second currency is called the "quote currency". The currency pair shows how
much of the quote currency is needed to purchase one unit of the base currency.
1.10 Research limitation:
Place limitation: The place limitation due to the absence of Forex companies
in Gaza Strip, which has had an impact on the methodology of the study. I was
intending to implement a cross-sectional analytical study, in which I will provide tips
for a number of investors relating to the combination between technical and
fundamental analysis. Then make a comparison between their investment results
after and before these tips. Absence of Forex Company in Gaza Strip had an impact
in changing the methodology of the study.

10
Chapter 2
Theoretical Framework

11
Section 1
Foreign Exchange Market
2.1.1 Foreign Exchange Markets "A Brief Background"
Neil Record defined Forex as a global decentralized market for the trading
of currencies. This includes all aspects of buying, selling and exchanging currencies
at current or determined prices. In terms of volume of trading, it is by far the largest
market in the world (record, 2003).
(Ickes, 2006) indicated that the Forex involves the purchase and sale of
national currencies. A foreign exchange market exists because economies employ
national currencies. If the world economy used a single currency there would be no
need for foreign exchange markets. In Europe 11 economies have chosen to trade
their individual currencies for a common currency. But the euro will still trade
against other world currencies. For now, the foreign exchange market is a fact of life.
(Janssen, Langager and Murphy, 2010) said that foreign exchange market is
the "place" where currencies are traded. Currencies are important to most people
around the world, whether they realize it or not, because currencies need to be
exchanged in order to conduct foreign trade and business. If you are living in the
U.S. and want to buy cheese from France, either you or the company that you buy the
cheese from has to pay the French for the cheese in euros (EUR). This means that the
U.S. importer would have to exchange the equivalent value of U.S. dollars (USD)
into euros. The same goes for traveling. A French tourist in Egypt can't pay in euros
to see the pyramids because it's not the locally accepted currency. As such, the tourist
has to exchange the euros for the local currency, in this case the Egyptian pound, at
the current exchange rate.
When a currency is bought, another currency must be sold in exchange, and,
conversely, when a currency is sold, another currency must be bought in exchange.
This act of simultaneous buying and selling is the most important aspect of Forex: a
currency is always traded against another currency. Thus currencies are always
traded in pairs – for example, the US dollar and the Japanese Yen (USD/JPY) or the
Euro and the US dollar (EUR/USD). The first currency in the pair is known as the

12
base currency, and the second currency is the counter or terms currency (Cheng,
2011).
The primary purpose of the foreign exchange is to assist international trade
and investment, by allowing businesses to convert one currency to another currency.
For example, it permits a US business to import British goods and pay pound
sterling, even though the business's income is in US dollars. It also supports
speculation, and facilitates the carry trade, in which investors borrow low-yielding
currencies and lend (invest in) high yielding currencies (Flassbeck and La Marca,
2009).
The markets are situated throughout the different time zones of the globe in
such a way that when one market is closing the other is beginning its operations.
Thus at any point of time one market or the other is open. Therefore, it is stated that
foreign exchange market is functioning throughout 24 hours of the day. However, a
specific market will function only during the business hours. Some of the banks
having international network and having centralized control of funds management
may keep their foreign exchange department in the key centre open throughout to
keep up with developments at other centers during their normal working hours
(Pakira, 2015).
In most markets, US dollar is the vehicle currency. The currency used to
denominate international transactions. This is despite the fact that with currencies
like Euro and Yen gaining larger share, the share of US dollar in the total turnover is
shrinking (Gomez, 2010)
The foreign exchange market works through financial institutions, and it
operates on several levels. Behind the scenes banks turn to a smaller number of
financial firms known as “dealers,” who are actively involved in large quantities of
foreign exchange trading. Most foreign exchange dealers are banks, so this behind-
the-scenes market is sometimes called the “interbank market”, although a few
insurance companies and other kinds of financial firms are involved. Trades between
foreign exchange dealers can be very large, involving hundreds of millions of
dollars. Because of the sovereignty issue when involving two currencies, Forex has
little (if any) supervisory entity regulating its actions (Chen, 2009).

13
2.1.2 Forex History
Ancient
Currency and exchange was also a vital and crucial element of trade during
the ancient world so that people could buy and sell items like food, pottery and raw
materials. If a Greek coin held more gold than an Egyptian coin due to its size or
content, then a merchant could barter fewer Greek gold coins for more Egyptian
ones, or for more material goods. This is why, at some point in their history, most
world currencies in circulation today had a value fixed to a specific quantity of a
recognized standard like silver and gold (Cartwright, 2012).
After WWII, the Bretton Woods Accord was signed allowing currencies to
fluctuate within a range of 1% to the currencies par. In Japan, the law was changed
during 1954 by the Foreign Exchange Bank Law. So, the Bank of Tokyo was to
become, because of this, the centre of foreign exchange by September of that year.
Between 1954 and 1959 Japanese law was made to allow the inclusion of many more
Occidental currencies in Japanese Forex (Sumiya, 2012).
U.S. President Richard Nixon is credited with ending the Bretton Woods
Accord and fixed rates of exchange, eventually bringing about a free-floating
currency system. After the ceasing of the enactment of the "Bretton Woods Accord"
during 1971. The Smithsonian Agreement allowed trading to range to 2%. During
1961–62, the amount of foreign operations by the U.S. Federal Reserve was
relatively low (Meltzer, 2010).
The year 1973 marks the point to which nation-state, banking trade and
controlled foreign exchange ended and complete floating, relatively free conditions
of a market characteristic of the situation in contemporary times began (according to
one source) (Chen, 2009).
The concept of trade exchange exists since ancient times. It has taken
multiple forms until it reached to the current development. This development
included the concept of currency exchange until becoming the largest market in the
world at the present time.

14
Electronic trading revolution in FX markets
(King, Osler and Rime, 2011) Highlighted the Electronic trading revolution
in FX markets as following:
1. The telephone era:
Currency trading was a sleepy business before exchange rates began floating
in the early 1970s. As the business took off, FX trading in the over-the-counter
market was handled via telephone lines. A customer (C) wishing to trade would call
an FX dealer (D) and ask for his current bid and ask quotes. Based on the quotes the
customer would decide whether to buy the base currency, sell it, or “pass” without
trading. Confirmation involved the physical exchange of paperwork between the two
back offices. This back-office processing was paper-based, cumbersome and prone to
human error. In the interdealer market, dealers could call each other directly (line 1)
or they could remain anonymous by placing an order with a voice broker (VB)
(line 2). The voice brokers shouted the best available bid and ask prices into open
multi-party phone lines that ended in small speakers known as “squawk boxes” on
the desks of each dealer. Some emerging market currencies that are relatively illiquid
are still traded this way.
2. The rise of the computer:
Electronic trading platforms first transformed the interdealer market during
the late 1980s and then reached the customer market in the 1990s. Most of these
computer systems merely replaced the tele-phone, leaving the dealer-customer
relationship largely intact.
3. Electronic trading in the interdealer market:
In 1987, Reuters launched a system for bilateral trades between dealers now
known as Thomson Reuters Dealing (line 5). Though in principle it merely replaced
telephone conversations with typed messages, it was speedier and more efficient for
the dealers and it enhanced operating efficiency by creating electronic trading
records, so it quickly became the dominant tool for interdealer trading (Rime, 2003).
Transparency in the interdealer market was enhanced by a roughly contemporary
Reuters product, the “FXFX” page. This computer page was essentially a screen that

15
provided dealers’ indicative quotes for liquid currencies in real time, providing a
one-stop-shop for up-to-date price information from many dealers. For roughly a
decade, FXFX was the dealers’ main source of FX price information for the most
liquid currencies. In 1992, Reuters introduced the first electronic limit-order market
to FX, now known as Thomson Reuters Matching. Other banks, worried that Reuters
might monopolize interdealer trading, formed a consortium and introduced another
such platform a year later, the Electronic Broking Service (EBS). With the launch of
these competing electronic brokers (EB), dealers could now trade anonymously and
electronically. Dealers preferred the anonymity of these platforms to direct
interdealer trading because it allowed them to work off positions without tipping off
their competitors. A trader at, say, Deutsche Bank, would see the EBS screen but
would not know the identity of the banks placing the limit orders (say, Citibank).14
Dealers also preferred these trading platforms to the voice brokers because they were
faster and more operationally efficient.
4. Electronic trading for end-customers:
By the middle of the 1990s, bid-ask spreads on FX trades had narrowed in the
interbank market but they remained unchanged for end-customers, enabling dealers
to reap enhanced profits. This profitability spurred intensified competition for
customer business and an explosion of new electronic trading platforms targeting
customers. With the launch of these electronic trading platforms, the telephone
became largely irrelevant to anyone trading liquid currencies. At the same time, the
FX market’s structure became complex and multi-layered, defying easy
classification.
Electronic trading for end-customers began around 1996 when the global
custodian State Street launched its proprietary electronic platform, FX Connect. This
system simply replaced the telephone with an electronic connection and thus had no
effect on either transparency or bid-ask spreads in the FX markets. Nonetheless, it
allowed State Street and its customers to handle trades more efficiently and with
lower operational risk.
Around 1999, as the US dot-com boom was reaching its peak, a number of
independent (non-bank) firms began a more momentous shift in FX markets by

16
launching electronic trading platforms for FX that targeted end-customers. These
“multibank trading systems” (MBT) allowed customers to trade directly with a range
of dealers over proprietary computer networks (line 6). The first such platform,
Currenex launched in 1999, extended the existing FX markets in a natural direction.
Instead of calling individual banks in sequence to find the best quote, customers
could send a “request-for-quote” (RFQ) to many FX dealers simultaneously. Dealers
were required to respond within a few seconds, and end-customers would then trade
with the dealer of their choice. In 2000 State Street made FX Connect available to
end-users beyond its own customer base, effectively turning it into a multibank
trading system. Table 5 provides an overview of the leading multibank trading
systems for FX.
Other new entrants, such as Hotspot FX (2000) and Lava (2001), introduced
electronic limit-order markets, allowing end-customers to trade anonymously. These
platforms permit end-customers to make liquidity – by placing limit orders – as well
as to take it. Since the supply of liquidity from customers could potentially dry up at
times, these platforms contract with the dealers to stream continuous quotes.
Now anyone in the world can trade at any Forex company in any country on a
same program without any border through the internet.
2.1.3 The main participant in the Forex market
Unlike a stock market, the foreign exchange market is divided into levels of
access. At the top is the interbank market, which is made up of the
largest commercial banks and securities dealers. Within the interbank market,
spreads, which are the difference between the bid and ask prices, are razor sharp and
not known to players outside the inner circle. The difference between the bid and ask
prices widens (for example from 0 to 1 pip to 1–2 pips for currencies such as the
EUR) as you go down the levels of access. This is due to volume. If a trader can
guarantee large numbers of transactions for large amounts, they can demand a
smaller difference between the bid and ask price, which is referred to as a better
spread. The levels of access that make up the foreign exchange market are
determined by the size of the "line" (the amount of money with which they are

17
trading). The top-tier interbank market accounts for 39% of all transactions (BIS
Triennial Central Bank Survey, 2010).
From there, smaller banks, followed by large multi-national corporations
(which need to hedge risk and pay employees in different countries), large hedge
funds, and even some of the retail market makers. According to Galati and Melvin,
“Pension funds, insurance companies, mutual funds, and other institutional investors
have played an increasingly important role in financial markets in general, and in FX
markets in particular, since the early 2000s.” (2004) In addition, he notes, “Hedge
funds have grown markedly over the 2001–2004 period in terms of both number and
overall size (Gabriele and Michael 2004).
(Rajib, 2010) mentioned the main participant in the Forex market as
following:
1. Wholesale Forex Market:
Major Forex trading in the wholesale Forex markets is undertaken by banks –
popularly known as interbank market. In this market, banks and non-bank financial
institutions transact with each other. They undertake trading on behalf of customers,
but majority of trading is undertaken for their own account by proprietary desks.
Besides banks and non-bank financial institutions, multinational corporations, hedge
funds, pension and provident funds, insurance companies, mutual funds etc.
participate in the wholesale market.
2. Foreign Exchange Dealers and Brokers:
The role of foreign exchange dealers and brokers need to be discussed in
detail. But, let us first understand who Forex dealers are. Dealers: Banks and some
nonblank financial institutions act as foreign exchange dealer. These dealers quote
both “bid” and “ask” for a particular currency pair (for spot, forward and swap
contracts) and take opposite side to either buyers or sellers of currency. They make
profit from the spreads between buying and selling prices ie., bid and ask rate.
Brokers are agents, which merely match buyers and sellers and get a brokerage fee.

18
These dealers are also known as “market maker”. As market makers, these dealers
stand willing at all time to buy and sell currencies at the quoted rate. Dealers do not
necessarily make markets for all currency but specialize in some currency pair.
3. Brokers:
Brokers on the other hand, help clients to get a better rate on the currency
trade by making available different quotes offered by dealers. Traders can compare
rates and accordingly take a decision. Brokers charge a commission for providing
these services. Communication between brokers and clients also used to be through
dedicated telephone lines. A broker continuously remains connected to dealers to get
latest quotes, depth of the market. The broker compares the rates offered by the
dealers and provides the best rates to the clients i.e, highest bid prices quoted by
different dealers when the client wants to sell and lowest ask price quoted by
different dealers when the clients wants to buy. With the emergence of
communication technology, now most of the most of broker deals are happening in
electronic brokering system. Foreign exchange dealers trade among themselves
through direct dealing and through brokers. In case of direct dealing, two dealers
contact each other directly and undertake a trade. Like any other traders, dealers may
contact brokers for executing their proprietary trades if these dealers want anonymity
in trading.
4. Hedger, Speculators and Arbitrageurs:
Hedgers are traders who undertake Forex trading because they have assets or
liability in foreign currency. For example, when an importer requiring foreign
currency, sells domestic currency to buy foreign currency, he is termed as a hedger.
The importer has a foreign currency liability. Similarly, an exporter sells foreign
currency and buys domestic currency is a hedger. The exporter has assets
denominated in foreign currency. A MNC entering into a foreign currency forward
contract so that it can repatriate its earning to parent company. An Indian company
swapping its foreign currency interest payment obligations to INR interest obligation.
All these are examples of hedging. Hedgers use the foreign currency market to hedge
the risk associated with volatility in foreign exchange market.
19
Speculators are traders who essentially buy and sell foreign currency to make
profit from the expected futures movement of the currency. These traders do not
have any genuine requirement for trading foreign currency. They do not hold any
cash position in the currency.
Arbitrageurs buy and sell the same currency at two different markets
whenever there is price discrepancy. The principle of “law of one price” governs the
arbitrage principle. Arbitrageurs ensure that market prices move to rational or normal
levels. With the proliferation on internet, cross currency, cross currency arbitrage
possibility has increased significantly.
5. Central Banks and Treasuries:
All most all central bank and treasuries participate in the Forex market.
Central banks play very important role in foreign exchange market. However, these
banks do not undertake significant volume of trading. Each central bank has
official/unofficial target of the Forex rate for its home currency. If the actual price
deviates from the target rate, the central banks intervene in the market to set a tone.
6. Retail Market:
In the retail market, individuals (tourists, foreign students, patients traveling
to other countries for medical treatment) small companies, small exporters and
importers operate. Money transfer companies/remittance companies (for example
like Western Union) are also major players in the retail market.
There are plenty of players in the Forex market as we mentioned earlier, but
there is no one players can control the movement of the market. The only force that
affects on the Forex markets is the force of supply and demand.
2.1.4 Benefits And Risks:
(Burke and Nava, 2011) in their book "Trading Forex with TradeStation"
highlighted the benefits and risk of trading Forex as following:

20
2.1.4.1 Benefits of Trading Forex:
1. 24-Hour Market Action:
The Forex currency markets are a 24-hour marketplace, starting from 5 p.m.
ET Sunday to 5 p.m. ET on Friday. This gives you the flexibility to trade the Forex
markets fulltime or part-time, whenever your schedule or lifestyle permits.
2. Liquidity:
As the largest markets in the world, the cash Forex markets offer excellent
liquidity at all hours of the trading day, unlike many other 24-hour markets. This
means you can trade large amounts of currency into and out of foreign currency
markets with little market impact.
3. Leverage:
Cash Forex trading allows you to leverage up to 50 times your account value
on most major Forex pairs, minor pairs offer 20 to 1 margin. These leverage amounts
may change or may not be available at all times. For example, with 50:1 leverage,
you may control 100,000 units of the Euro quoted at $1.3000, using only $2,600.
Remember that while leverage can help build profits quickly, it can also produce
large catastrophic losses quickly.
4. Trading Opportunities:
In addition to technical trading, the Forex markets offer unique opportunities
to trade foreign currency exchange rates to take advantage of international news,
economic indicators, and interest rate changes and differentials.
2.1.4.2 Risks Associated with Forex Trading:
1. Leverage Risk:
Leverage is the mechanism by which a trader can control a large market
position with a much smaller initial investment. TradeStation enables you to take
positions of up to 50 times greater than the value of the initial investment for major
cash Forex pairs. However, professional traders will often recommend that your open
Forex positions not exceed more than 10 times your total account value at any one

21
time. In addition, sound money-management techniques suggest not risking any
more than 2-3 percent of your total account value on any one trade.
Even when market conditions are relatively calm, leverage can create large
gains or losses very quickly. This may cause your broker to take action to avoid a
negative account balance or to avoid your account exceeding that maximum allowed
margin. In either case, your broker, without prior notification, may close any or all
open positions in the account to remedy the situation. You are responsible for the
risks you take and the consequences of those risks, positive and negative, on every
trade you make. Because of the highly leveraged risk inherent to cash Forex, Forex
trading may not be suitable for all traders.
2. Price Risk:
Forex prices are quoted and charted using only the current bid price stream;
there is no concept of a last price in Forex. TradeStation offers analysis and trading
tools that allow you to visualize and measure the bid-ask spread.
Since the transactional cost of trading Forex is tied to the bid-ask spread, it is
important to understand what the normal bid-ask spread is for any pair, and what that
spread means in the actual cost per trade. The bid-ask spread can also fluctuate
throughout the trading day and is often a function of the liquidity of the Forex pair;
you may also see slightly wider bid-ask spreads in quiet market situations, especially
on lightly traded Forex pairs. Just like any trading market, Forex prices are driven by
short- and long-term supply and demand, which can cause prices to move rapidly and
often erratically. Traders need to employ sound risk-management techniques on each
and every trade.
3. Interest Rate Risk:
Traditionally, if a country’s interest rates rise, its currency will normally
strengthen because investors will shift their assets to that country to gain higher
returns. Conversely, if a country’s interest rates fall, its currency will normally
weaken as investors shift money away looking for higher returns.

22
Consequently, if the interest rate differential of one currency versus another
increases or decreases dramatically, the exchange rate and thus Forex prices may also
dramatically change.
4. News and Economic Risk:
In our global economy, news from anywhere in the world can affect the
Forex markets in many ways. These effects can manifest as rapid price movements
or changes in trend direction or long-term outlooks. It is prudent when trading either
long term or short term to keep your eye on news and other factors like government
reports that can affect your profitability.
Governments gather economic activity statistics and release reports almost
every day. The challenge is figuring out which reports may have an effect on Forex
prices.
5. Operational Risk:
Brokers face operational risk as they transact their daily business activities.
Some of these risks arise as internal procedures, human resources, organizational
structure, technology, etc. Although they do not impose a risk to the market system
as a whole, they could prevent you from monitoring positions or placing orders.
Forex traders should always maintain backup procedures in case the Internet, the
trading platform, or the broker fails.
6. Settlement Risk:
In a foreign exchange trade, one party delivers currency while the other takes
delivery of the currency. Settlement risk is the possibility that one of the parties in
the transaction fails to fulfill their responsibility.
The most important benefit at Forex market is that a landslide does not occur
on the market as it happens in stock markets and this is due to the fact that currencies
are traded in pairs, unlike stocks.
23
2.1.5. Economic Theories and Data
There is a great deal of academic theory revolving around currencies. While often
not applicable directly to day-to-day trading (Janssen, Langager and Murphy, 2010).
The main economic theories found in the foreign exchange deal with parity
conditions. A parity condition is an economic explanation of the price at which two
currencies should be exchanged, based on factors such as inflation and interest rates.
The economic theories suggest that when the parity condition does not hold,
an arbitrage opportunity exists for market participants. However, arbitrage
opportunities, as in many other markets, are quickly discovered and eliminated
before even giving the individual investor an opportunity to capitalize on them. Other
theories are based on economic factors such as trade, capital flows and the way a
country runs its operations (Janssen, Langager and Murphy, 2010).
The main Economic Theories related to Forex according to (Janssen,
Langager and Murphy, 2010) as following:
1. Major Theories: Purchasing Power Parity:
Purchasing Power Parity (PPP) is the economic theory that price levels
between two countries should be equivalent to one another after exchange-rate
adjustment. The basis of this theory is the law of one price, where the cost of an
identical good should be the same around the world. Based on the theory, if there is a
large difference in price between two countries for the same product after exchange
rate adjustment, an arbitrage opportunity is created, because the product can be
obtained from the country that sells it for the lowest price.
2. Interest Rate Parity:
The concept of Interest Rate Parity (IRP) is similar to PPP, in that it suggests
that for there to be no arbitrage opportunities, two assets in two different countries
should have similar interest rates, as long as the risk for each is the same. The basis
for this parity is also the law of one price, in that the purchase of one investment
asset in one country should yield the same return as the exact same asset in another
country; otherwise exchange rates would have to adjust to make up for the
difference.

24
3. International Fisher Effect:
The International Fisher Effect (IFE) theory suggests that the exchange rate
between two countries should change by an amount similar to the difference between
their nominal interest rates. If the nominal rate in one country is lower than another,
the currency of the country with the lower nominal rate should appreciate against the
higher rate country by the same amount.
4. Balance of Payments Theory:
A country's balance of payments is comprised of two segments - the current
account and the capital account - which measure the inflows and outflows of goods
and capital for a country. The balance of payments theory looks at the current
account, which is the account dealing with trade of tangible goods, to get an idea of
exchange-rate directions.
If a country is running a large current account surplus or deficit, it is a sign
that a country's exchange rate is out of equilibrium. To bring the current account
back into equilibrium, the exchange rate will need to adjust over time. If a country is
running a large deficit (more imports than exports), the domestic currency will
depreciate. On the other hand, a surplus would lead to currency appreciation.
5. Real Interest Rate Differentiation Model:
The Real Interest Rate Differential Model simply suggests that countries
with higher real interest rates will see their currencies appreciate against countries
with lower interest rates. The reason for this is that investors around the world will
move their money to countries with higher real rates to earn higher returns, which
bids up the price of the higher real rate currency.
6. Asset Market Model:
The Asset Market Model looks at the inflow of money into a country by
foreign investors for the purpose of purchasing assets such as stocks, bonds and other
financial instruments. If a country is seeing large inflows by foreign investors, the
price of its currency is expected to increase, as the domestic currency needs to be
purchased by these foreign investors. This theory considers the capital account of the
balance of trade compared to the current account in the prior theory. This model has

25
gained more acceptance as the capital accounts of countries are starting to greatly
outpace the current account as international money flow increases.
7. Monetary Model The Monetary Model:
Focuses on a country's monetary policy to help determine the exchange rate.
A country's monetary policy deals with the money supply of that country, which is
determined by both the interest rate set by central banks and the amount of money
printed by the treasury. Countries that adopt a monetary policy that rapidly grows its
monetary supply will see inflationary pressure due to the increased amount of money
in circulation. This leads to a devaluation of the currency.
8. Economic Data:
Economic theories may move currencies in the long term, but on a shorter-
term, day-to-day or week-to-week basis, economic data has a more significant
impact.
Economic data, such as the latest gross domestic product (GDP) numbers, are
often considered to be like a company's latest earnings data. In the same way that
financial news and current events can affect a company's stock price, news and
information about a country can have a major impact on the direction of that
country's currency.
26
Section 2
Fundamental Analysis
2.2.1 The Concept Of Fundamental Analysis
Fundamental analysis for the Forex market examines the macroeconomic
indicators, asset markets, and political considerations of one nation’s currency as
opposed to another. Macroeconomic indicators include things such as: growth rates
(Gross Domestic Product), interest rates, inflation, unemployment, money supply,
foreign exchange reserves, and productivity. Other macroeconomic indicators
include the CPI, a measurement of the cost of living, and the PPI, a measurement of
the cost of producing goods. Asset markets are made up of stocks, bonds, and real
estate. Political considerations influence the level of confidence in a nation’s
government, the climate of stability, and level of certainty (Mcdonald, 2011).
There are also musical, religious and scientific definitions of fundamental but
its definition in relation to the FX market is quite specific – it is the study of the
underlying factors that drive a currency’s price. In the FX market these underlying
factors include the economy, central banks and politics (Brooks, 2013).
Accoarding to (Brooks, 2013) we use fundamental analysis in the Forex
market to help us answer a few basic questions related to these factors, for example:
1. Which economies in the world are growing?
2. Is the growth healthy and sustainable?
3. What are governments and central banks doing to manage their economies?
4. What is the political situation?
The Forex trader making use of fundamental analysis takes the answers to
these questions and applies them to the decisions they make when placing a trade in
the Forex market (Brooks, 2013).
(Janssen, Langager and Murphy, 2010) said that "fundamental traders
evaluate currencies, and their countries, like companies and use economic data to
gain an idea of the currency’s true value".

27
All of the news reports, economic data and political events that come out
about a country are similar to news that comes out about a stock in that it is used by
investors to gain an idea of value. This value changes over time due to many factors,
including economic growth and financial strength. Fundamental traders look at all of
this information to evaluate a country's currency (Janssen, Langager and Murphy,
2010).
In the stocks market, (Janssen, Langager and Murphy, 2010) defined
fundamental analysis as "fundamental analysis is a technique that attempts to
determine a security’s value by focusing on underlying factors that affect a
company's actual business and its future prospects. On a broader scope, you can
perform fundamental analysis on industries or the economy as a whole. The term
simply refers to the analysis of the economic well-being of a financial entity as
opposed to only its price movements" (Janssen, Langager and Murphy, 2010).
And when we talking about stocks, (Janssen, Langager and Murphy, 2010)
said that fundamental analysis serves to answer questions, such as:
Is the company’s revenue growing?
Is it actually making a profit?
Is it in a strong-enough position to beat out its competitors in the future?
Is it able to repay its debts?
Is management trying to "cook the books"?
Fundamental analysis focuses on the following-up of important economic
news that makes substantial fluctuations in the value of the currency (such as interest
rates, unemployment rates and labor force rate).
Objectives of fundamental analysis:
To predict the direction of national economy because economic activity
affects the corporate profit, investor attitudes and expectation and ultimately
security prices.
To estimate the stock price changes by studying the forces operating in the
overall economy, as well as influences peculiar to industries and companies.
To select the right time and right securities for the investment (Suresh, 2013).

28
2.2.2 Trading Using Economic Data
The way to get the information needed for fundamental analysis is to look at
the official economic data releases. For most of the world’s major economies,
economic data is released regularly and it gives a glimpse of the overall economy
and how fast it is growing. The key thing for me is that economic growth means
future prosperity, which should then equate to a strengthening currency. Traders seek
out growth because that is usually where the best opportunities lie to jump on an
uptrend. Alternatively, economic data showing weakness in a country’s economy has
the effect of weakening the currency (Brooks, 2013).
Figure 2.1 show that EUR/USD currency pair fell from the 1.4200 big figure
over the past couple of sessions (far right handside of the chart) to establish support
just below 1.4050 in the 60-minute time frame. Observe how the euro appreciated by
about 50 pips, immediately following the March 28, 2011, release at 8:30 a.m. At
that time, it was revealed that the world's largest economy grew by less than what
was expected. Instead of rising by an estimated 1.9%, the U.S. grew by an advance
figure of only 1.8%. This was also less than the 3.1% from the previous quarter – a
visual slowdown in growth. As a result, traders sided with selling a weaker U.S.
dollar, helping the euro to retrace its losses and climb even higher through the 1.4200
resistance barrier.

29
Figure 2.1: the effect of GDP
source: eSignal
Accoarding to (Henry Liu, 2009) "the ideal way of Forex trading is knowing
ahead when the market is going to move, get in the market during that window of
opportunity, enter a trade, and then cash out once in decent profit"
One of the systems to trading well, accoarding to (Henry Liu, 2009) is Forex
news trading, it has some of the benefits:
1. Scheduled Trading Time:
You trade only the high impact news during their scheduled release time,
which are available through various news calendars up to few weeks ahead of time,
and you are in the market during a time where volatility is almost insured, with
ample liquidity, so you don’t waste your time or your money chasing the noises or
fake trends during low liquidity hours.
2. Reduce Losses:
Trading Forex is about having the odds stacked with you, not against you! By
limiting the amount of trades you take in a month, you are cutting down your
potential losses while picking the crème of the crop.
3. Managed Risk:
News trading generally gives you a manageable risk. You can always put
your stop order at pre‐release level, because it is a golden rule that once the market
travels back to the point before the news release, then the effect of the news is
presumably over.
4. High Profit:
Since the market is likely to overreact to news releases, volatility becomes
our friend. By getting in the right direction after the release, you can cash out on
most of the movements.
5. Less Time Trading:
There are only about 35 tradable news releases a month, and out of these 35
releases, you’ll probably get 50% giving you a tradable release figure. So the

30
tradable ones could take up to 2 hours per trade, but the untradeable ones should only
take 15 minutes of your time. Therefore, you are averaging less than 40 hours of
trading a month, or about 10 hours a week. While making probably the same amount
of money you’d be making trading 16 hours a day.
There is a lot of benefits to trading using economic data specially that a lot of
profitable transactions take place before or after a few minutes from a major
economic statement.
Economic indicators:
Accoarding to (Henry Liu, 2009) the most important economic indicators that
trader must take into account is:
1. CPI – Consumer Price Index:
Is defined as a statistical estimate of the government of the prices of goods
and services bought for consumption purposes by households. Its computation uses
price data collected for a sample of goods and services from a sample of sales outlets
in a sample of locations for a sample of times and estimates of the shares of the
different expenditures in the total covered by the index which are usually based upon
expenditure data obtained for sampled periods from a sample of households.
In short, CPI is what the economists call the Inflation number. CPI usually
has a Core number and a Headline number. The headline CPI number, or just CPI, is
a complete inflation number that includes everything. The Core CPI number is the
inflation number that excludes food and energy (gas) cost, which shows a clearer
view on inflation, since energy and food cost may vary depending on season.
2. PPI – Producer Price Index:
Measures the rate of inflation (i.e., the rate of price changes) experienced by
manufacturers when purchasing goods and services. A rising trend has a positive
effect on the nation's currency. When manufactures pay more for goods and services,
they are likely to pass the higher costs to the consumer, so PPI is thought to be a
leading indicator of consumer inflation. PPI is highly regarded, and at extremes will
have a market impact equal to that of its CPI counterpart.

31
Most PPI news releases aren’t classified as high‐ impact news. But as stated
above, in extreme cases, a high PPI input will affect CPI as a whole, since if it costs
more to produce a particular product or service, the provider will have no choice but
to eventually pass on the cost to the consumer. PPI numbers are usually released
before the monthly CPI numbers, therefore if we get a particularly high PPI input; it
makes sense to expect a higher CPI release numbers as well.
3. GDP ‐ Gross Domestic Product:
The sum of value added at every stage of production of all final goods and
services produced within a country in a given period of time. GDP is the primary
measure for the economy's health. In summary, if we were to reduce the entire
economy into a single number, it would the GDP number. GDP also comes in as
Core GDP and Headline GDP. Core GDP is GDP without the transportation
component, which varies from month to month.
4. Non‐Farm Payroll (or Employment Changes):
Measures the change in number of employed people during the previous
month, excluding the farming industry. A rising trend has a positive effect on the
nation's currency. Job creation is an important indicator of economic health because
consumer spending, which is highly correlated with labor conditions, makes up a
large portion of GDP. This report is the first of the month that relates to labor
conditions, making it susceptible to big surprises.
Different countries, other than the U.S.A., call this news release as
Employment Changes or Employment Rate. But they are pretty much the same
thing. The NFP is however, one of the most volatile news release for the Forex
Market. Other news releases related to the Employment are Unemployment Rate and
the weekly Jobless claims.
5. Trade Balance:
Is the difference between a country's output and its domestic demand (the
difference between what goods a country produces and how many goods it buys from
abroad; this does not include money re-spent on foreign stocks, nor does it factor the
concept of importing goods to produce for the domestic market).

32
6. Capital Flow (TIC Net Long‐Term):
Is the bookkeeping report of the capital flow in and out of the country, it
tracks the investment in this country and out of this country. A continuous negative
number means no one is investing in the country. The higher it stays, eventually
will drive down the currency value.
7. ISM Manufacturing Index:
The Institute of Supply Management (ISM) Manufacturing Index measures
the activity level of purchasing managers in the manufacturing sector, with a reading
above 50 indicating expansion. A rising trend has a positive effect on the nation's
currency. To produce the index, purchasing managers are surveyed on a number of
subjects including employment, production, new orders, supplier deliveries, and
inventories. Traders watch these surveys closely because purchasing managers, by
virtue of their jobs, have early access to data about their company's performance,
which can be a leading indicator of overall economic performance.
Speeches of Central Bankers:
Central Bankers are the most important people in the Forex Market. They
have the ability to move the market hundreds of pips with their speeches, and when
they speak, market listens (Henry Liu, 2009).
Example for Speeches of Central Bankers:
Federal Reserve Chairwoman Janet Yellen on Jun 6, 2016 told an audience in
Philadelphia that the latest employment report had raised significant questions about
the economic outlook that will weigh on officials as they determine when to raise
rates. But she cautioned against placing too much significance on one economic
report.
Other economic indicators mentioned by (Janssen, Langager and Murphy, 2010) as
following:
1. Interest Rates:
As was seen with some of the economic theories, interest rates are a major
focus in the Forex market. The most focus by market participants, in terms of interest

33
rates, is placed on the country's central bank changes of its bank rate, which is used
to adjust monetary supply and institute the country's monetary policy. In the U.S., the
Federal Open Market Committee (FOMC) determines the bank rate, or the rate at
which commercial banks can borrow and lend to the U.S. Treasury. The FOMC
meets eight times a year to make decisions on whether to raise, lower or leave the
bank rate the same; and each meeting, along with the minutes, is a point of focus.
2. Retail Sales:
Retail sales data measures the amount of sales that retailers make during the
period, reflecting consumer spending. The measure itself doesn't look at all stores,
but, similar to GDP, uses a group of stores of varying types to get an idea of
consumer spending. This measure also gives market participants an idea of the
strength of the economy, where increased spending signals a strong economy. In the
U.S., the Department of Commerce releases data on retail sales around the middle of
the month.
3. Durable Goods:
The data for durable goods (those with a lifespan of more than three years)
measures the amount of manufactured goods that are ordered, shipped and unfilled
for the time period. These goods include such things as cars and appliances, giving
economists an idea of the amount of individual spending on these longer-term goods,
along with an idea of the health of the factory sector. This measure again gives
market participants insight into the health of the economy, with data being released
around the 26th of the month by the Department of Commerce.
4. Macroeconomic and Geopolitical Events:
The biggest changes in the Forex often come from macroeconomic and
geopolitical events such as wars, elections, monetary policy changes and financial
crises. These events have the ability to change or reshape the country, including its
fundamentals. For example, wars can put a huge economic strain on a country and
greatly increase the volatility in a region, which could impact the value of its
currency. It is important to keep up to date on these macroeconomic and geopolitical
events.

34
Generally the economic indicators are used as helping tools to in confirming
the price trend and we can use it also to predict the market movements.
2.2.3 How to Trade Forex on News Releases?
Economic calendar:
It is important to know when economic data is released and the easiest way to
get this information is by using a calendar.
You can get reliable up-to-date calendars on economic news websites like
Bloomberg (www.bloomberg.com/markets/economic-calendar), some blogs have
them – like Forex Factory (www.forexfactory.com), and the financial press often
prints economic calendars at the start of each week. Also, ask your FX broker as they
may provide you with a free calendar. Some even contain widgets that let you place
orders or trade directly from the calendar (Brooks, 2013).
Example for economic calendar from Bloomberg:
Figure 2.2: economic calendar
source: Bloomberg

35
Trading in Forex dependence on economic data:
Economic data tends to be one of the most important catalysts for short-term
movements in any market, but this is particularly true in the currency market, which
responds not only to U.S. economic news, but also to news from around the world.
With at least eight major currencies available for trading at most currency brokers
and more than 17 derivatives of them, there is always some piece of economic data
slated for release that traders can use to inform the positions they take. Generally, no
less than seven pieces of data are released daily from the eight major currencies or
countries that are most closely followed. So for those who choose to trade news,
there are plenty of opportunities. Here we look at which economic news releases are
released when, which are most relevant to Forex (FX) traders, and how traders can
act on this market-moving data (lien, 2005).
Trading news is harder than it may sound. Not only is the reported consensus
figure important, but so are the whisper number and the revisions. Also, some
releases are more important than others; this can be measured in terms of both the
significance of the country releasing the data and the importance of the release in
relation to the other pieces of data being released at the same time (lien, 2005).
The relative importance of these releases may change. For example,
unemployment may be more important this month than trade or interest rate
decisions. Therefore, it is important to keep on top of what the market is focusing on
at the moment.
How long the effect last?
(Evans and Lyons, 2005) said that "the market could still be absorbing or
reacting to news releases hours, if not days, after they are released. The study found
that the effect on returns generally occurs in the first or second day, but the impact
does seem to linger until the fourth day. The impact on order flow, on the other hand,
is still very pronounced on the third day and is still observable on the fourth day".
How Do I Actually Trade News?
The most common way to trade news is to look for a period of consolidation
ahead of a big number and to just trade the breakout on the back of the number. This

36
can be done on both a short-term intraday basis and a daily basis. Let's look at the
chart in Figure 2 as an example. After a weak number in September, the market was
holding its breath ahead of the October number, which was to be released to the
public in November. In the 17 hours before the release, the EUR/USD was confined
within a tight 30-pip trading range. For news traders, this would have provided a
great opportunity to put on a breakout trade, especially since the likelihood of a sharp
move at this time was extremely high.
The chart in (figure 2.1) below, illustrates the indecision of the market
leading up to the October 2005 non-farm payroll numbers, which were released in
early November. Note the increase in volatility that occurred once the worse than
expected news was released (lien, 2005).
Figure 2.3: the effect of non-farm payroll indicator
source: eSignal
How currencies are affected by the various economic data?
Accoarding to (Brooks, 2013), some currencies are more sensitive to
particular economic indicators than they are to others. Here is my very quick guide to
which major economic data releases affect particular currencies.

37
Euro:
PMI data for the euro zone, inflation data, German factory orders, retail sales
and sovereign debt auctions.
Sterling:
PMI surveys, public sector borrowing figures, retail sales, GDP and GDP
revisions. For example, the August 2012 manufacturing PMI survey (released 3
September 2012) beat expectations, causing a sharp jump higher in GBPUSD.
Australian dollar:
Chinese PMI survey, Chinese GDP projections, domestic terms of trade data
and quarterly inflation report (Australia is unusual in that it only releases inflation
data every three months). For example, the Australian dollar is extremely sensitive to
developments in China because of the close trade links between the two economies.
When important Chinese data is released – like GDP – it can have a big impact on
the direction of AUDUSD.
US dollar:
NFP, ISM surveys, consumer confidence, retail sales and CPI.
Yen:
US NFP, domestic inflation data, the Tenkan survey of manufacturing
activity (a quarterly version of the ISM and PMI surveys) and central bank meetings
in the US and Japan.
When trading depending on economic data, the best time to enter the market
after the release of economic news and the confirmation of trend. Many of losing
transactions happen when investors open them before the release of economic news
where in sometimes results come contrary to expectations.
2.2.4 Strengths Of Fundamental Analysis
Accoarding to (Barnes, 2011) there is much Strength for Fundamental
Analysis as following:

38
Contains forward-looking comments - the Fed districts aim to draw relative
conclusions in the Beige Book, not just regurgitate facts already presented
Gives investors a "man on the street" perspective of economic health by taking
first-hand accounts from business owners, economist, and the like
Aims to put pieces from different reports together into an explanatory whole,
giving qualitative measurements instead of quantitative figures
It's the only indicator that gives reports by geographic region, rather than just by
industry group or sector.
Most regions will report on the state of the service industries, an area not well
covered in other indicator reports, although it is a large component of real gross
domestic product.
(Suresh A.S, 2013) mentioned some strength of Fundamental Analysis in the
stock market as following:
1. Value Spotting:
Sound fundamental analysis will help identify companies that represent a
good value. Some of the most legendary investors think for long-term and value.
Fundamental analysis can help uncover the companies with valuable assets, a strong
balance sheet, stable earnings, and staying power.
2. Business Acumen:
One of the most obvious, but less tangible rewards of fundamental analysis is
the development of a thorough understanding of the business. After such painstaking
research and analysis, an investor will be familiar with the key revenue and profit
drivers behind a company. Earnings and earnings expectations can be potent drivers
of equity prices. A good understanding can help investors avoid companies that are
prone to shortfalls and identify those that continue to deliver.
3. Value Drivers:
In addition to understanding the business, fundamental analysis allows
investors to develop an understanding of the key value drivers within the company.
A stock’s price is heavily influenced by the industry group. By studying these
groups, investors can better position themselves to identify opportunities that are

39
high-risk (tech), low-risk (utilities), growth oriented (computer), value driven (oil),
non-cyclical (consumer staples), cyclical (transportation) etc.
4. Knowing Who is Who:
Stocks move as a group. Knowing a company’s business, investors can better
categorize stocks within their relevant industry group that can make a huge
difference in relative valuations. The primary motive of buying a share is to sell it
subsequently at a higher price. In many cases, dividends are also to be expected.
Thus, dividends and price changes constitute the return from investing in shares.
Consequently, an investor would be interested to know the dividend to be paid on the
share in the future as also the future price of the share. These values can only be
estimated and not predicted with certainty. These values are primarily determined by
the performance of the company which in turn is influenced by the performance of
the industry to which the company belongs and the general economic and socio-
political scenario of the country.
The fundamental analysis can be valuable, but it should be approached with
caution. If you are reading research written by a sell-side analyst, it is important to be
familiar with the analyst behind the report. We all have personal biases, and every
analyst has some sort of bias. There is nothing wrong with this, and the research can
still be of great value. Learn what the ratings mean and track the record of an analyst
before jumping to a conclusion. Corporate statements and press releases of a
company offer good information, but they should be read with a healthy degree of
scepticism to separate the facts from the spin. Press releases don’t happen by
accident; they are an important PR tool for companies. Investors should become
skilled readers to weed out the important information and ignore the hype.
2.2.5 Criticisms Of Fundamental Analysis
Accoarding to (Costa, 2003) fundamental analysis, when used in isolation,
has a number of serious drawbacks:

40
There are a large numbers of factors that can affect the earnings of a company,
and its stock price, over time. These can include economic, political and social
factors, in addition to the various company statistics mentioned earlier.
The data used can be at least six months out of date.
Reported earnings can be dubious - due to creative accounting. For example,
property valuations; value of mastheads; deferring the reporting of product
development costs.
It is difficult to give appropriate weightings to the factors.
The results obtained from this analysis are only valid for a limited period of time
after the analysis has been performed. Forecasts are often downgraded - hence the
saying "if you are going to forecast, forecast often".
It assumes that the analyst is competent. In fact, the best analysts in stock brokers'
offices end up on the sales desk or in portfolio management where the salaries are
much higher.
A fundamental analyst assumes that other fundamental analysts will form the
same view about the company and buy the stock, thus restoring its value and
returning the trader or investor a capital gain. In practice, an undervalued
company's stock price can stay at approximately the same level (or decline) for
years!
It assumes that news travels instantly - but will everyone act on it instantly?
It ignores the influence of random events such as oil spills, product defects being
exposed, acts of God and so on.
It assumes that there is no monopolistic power over markets.
Even when fundamental analysis reveals an undervalued company, or a stock with
high growth prospects, it does not tell us anything about the timing of the
purchase of the stock. In other words, we may have discovered a grossly
undervalued stock whose price has been falling for some time, and may well
continue falling!
Fundamental analysis sounds plausible - even scientific!
Fundamental analysis has appeal, as traders and investors feel more secure
knowing why a stock should rise.

41
(Barnes, 2011) mentioned some weaknesses point of fundamental analysis:
Rarely is any new statistical data presented, only anecdotal reports
Filled with measured "Fed-speak"
Specific industry conclusions are hard to draw from the report.
Each Fed district can use its discretion on what to include in its report; one
region may discuss manufacturing activity while others don't report on the topic.
Private forecasts compiled by economists and analysts tend to closely match
what is reported, so estimates rarely change following the release.
Depending on the previous, fundamental analysis is considered one of the
objective bases for trading in currency market so we cannot ignore it and the
investors must aware the rules and principals of fundamental analysis to trade well in
Forex Market.

42
Section 3
Technical Analysis
2.3.1 The Concept Of Technical Analysis
Technical analysis (sometimes alternatively referred to as chartist analysis) is
a set of techniques for deriving trading recommendations for financial assets by
analyzing the time-series history of the particular asset price either graphically or
mathematically (Taylor, 2014).
Technical analysis is the use of past price behavior and/or other market data,
such as volume, to guide trading decisions in asset markets. These decisions are often
generated by applying simple rules to historical price data. A technical trading rule
(TTR), for example, might suggest buying a currency if its price has risen more than
1% from its value five days earlier. Traders in stock, commodity and foreign
exchange markets use such rules widely (Neely and Weller, 2011).
In technical analysis we prepare charts that contain all information related to
trade (price, volume and date of trading) which help in identifying the direction of
prices accurately depending on comparing between current market movement and
past market movement.
2.3.1.1 History Of Technical Analysis
The oldest known hints of technical analysis appear in Joseph de la Vega's
accounts of the Dutch markets in the 17th century. In Asia, the oldest example of
technical analysis is thought to be a method developed by Homma Munehisa during
early 18th century which evolved into the use of candlestick techniques, and is today
a main charting tool (Nison and Steve, 1991).
In the 1920s and 1930s Richard W. Schabacker published several books
which continued the work of Dow and William Peter Hamilton in his books Stock
Market Theory and Practice and Technical Market Analysis. At the end of his life he
was joined by his brother in law, Robert D. Edwards who finished his last book. In
1948 Edwards and John Magee published Technical Analysis of Stock Trends which
is widely considered to be one of the seminal works of the discipline. It is
43
exclusively concerned with trend analysis and chart patterns and remains in use to
the present. It is now in its 9th edition. As is obvious, early technical analysis was
almost exclusively the analysis of charts, because the processing power of computers
was not available for statistical analysis. Charles Dow reportedly originated a form of
chart analysis used by technicians—point and figure analysis (Nison and Steve,
1994).
Dow Theory is based on the collected writings of Dow Jones co-founder and
editor Charles Dow, and inspired the use and development of modern technical
analysis from the end of the 19th century. Other pioneers of analysis techniques
include Ralph Nelson Elliott, William Delbert Gann and Richard Wyckoff who
developed their respective techniques in the early 20th century. Many more technical
tools and theories have been developed and enhanced in recent decades, with an
increasing emphasis on computer-assisted techniques (Nison and Steve, 1994).
Technical analysis is based on the foundation that history repeats itself. The
procedure of technical analysis is made by standing on the movement of Elliot waves
which are considered the base of modern technical analysis was built on.
2.3.1.2 The Importance of Technical Analysis:
The Importance of Technical Analysis according to (Nison, 2001) in his book
Japanese Candlestick Charting Techniques as following:
1. While fundamental analysis may provide a gauge of the supply/demand situations
(i.e., price/earnings ratios, economic statistics) and so forth, there is no
psychological component involved in such analysis. Technical analysis provides
the only mechanism to measure the “irrational” (emotional) component present in
all markets.
2. Technicals are also an important components of disciplined trading. Discipline
helps mitigate the nemesis of all traders, namely, emotion. As soon as you have
money in the market emotionalism is in the driver’s seat and rationale and
objectivity are merely passengers. If you doubt this, try paper trading. Then try
trading with your own funds. You will soon discover how deeply the
counterproductive aspects of tension, anticipation, and anxiety alter the way you
trade and view the markets–usually in proportion to the funds committed.

44
3. Following the technicals is important even if you do not fully believe in their
use. This is because, at times, the chart actions are the major reason for a market
move. Since they are a market-moving factor, they should be watched.
4. Random walk proffers that the market price for one day has no bearing on the
price the following day. But this academic view leaves out an important
component–people. People remember prices from one day to the next and act
accordingly. To wit, people’s reactions indeed affect price, itself, is an important
component in market analysis. Those who disparage technical analysis forget this
last point.
Despite all the fancy and exotic tools it employs, technical analysis really just
studies supply and demand in a market in an attempt to determine what direction,
or trend, will continue in the future. In other words, technical analysis attempts to
understand the emotions in the market by studying the market itself, as opposed to its
components (Janssen, Langager and Murphy, 2011).
In the technical analysis we follow-up the forces of supply and demand as
they are the only ones responsible for determining the direction of price movement.
So the technical analysis is considered one of the objective bases for trading in
currency market so we cannot ignore it.
Characteristics of technical analysis accoarding to (Irwin and Park, 2007):
1. Technical analysis employs models and trading rules based on price and volume
transformations, such as the relative strength index, moving averages, regressions,
inter-market and intra-market price correlations, cycles or, classically, through
recognition of chart patterns.
2. Technical analysis stands in contrast to the fundamental analysis approach to
security and stock analysis. Technical analysis analyses price, volume and other
market information, whereas fundamental analysis looks at the actual facts of the
company, market, currency or commodity. Most large brokerage, trading group,
or financial institution will typically have both a technical analysis and
fundamental analysis team.

45
3. Technical analysis is widely used among traders and financial professionals, and
is very often used by active day traders, market makers, and pit traders. In the
1960s and 1970s it was widely dismissed by academics.
2.3.2 Efficient Market and Technical Analysis
2.3.2.1 Efficient Markets:
The idea that the expected risk-adjusted excess return on foreign exchange is
zero implies a sensible statement of the efficient markets hypothesis in the foreign
exchange context: Exchange rates reflect information to the point where the potential
excess returns do not exceed the transactions costs of acting (trading) on that
information (Jensen, 1978).
This description of the efficient markets hypothesis appears to be a
restatement of the first principle of technical analysis: Market action (price and
transactions volume) discounts all information about the asset’s value. There is,
however, a subtle but important distinction between the efficient markets hypothesis
and technical analysis: The efficient markets hypothesis posits that the current
exchange rate adjusts to all information to prevent traders from reaping excess
returns, while technical analysis holds that current and past price movements contain
just the information needed to allow profitable trading (Neely, 1997).
2.3.2.2 Efficient Market and Technical Analysis:
Technical analysts believe that their methods will permit them to beat the
market. Economists have traditionally been skeptical of the value of technical
analysis, affirming the theory of efficient markets that holds that no strategy should
allow investors and traders to make unusual returns except by taking excessive risk
(Samuelson, 1965).
Technicians say that EMH ignores the way markets work, in that many
investors base their expectations on past earnings or track record, for example.
Because future stock prices can be strongly influenced by investor expectations,
technicians claim it only follows that past prices influence future prices (Eugene,
1970).

46
Technicians say that EMH ignores the way markets work, in that many
investors base their expectations on past earnings or track record, for example.
Because future stock prices can be strongly influenced by investor expectations,
technicians claim it only follows that past prices influence future prices (Aronson,
2006).
They also point to research in the field of behavioral finance, specifically that
people are not the rational participants EMH makes them out to be. Technicians have
long said that irrational human behavior influences stock prices, and that this
behavior leads to predictable outcomes (Prechter and Wayne, 2007).
EMH advocates reply that while individual market participants do not always
act rationally (or have complete information), their aggregate decisions balance each
other, resulting in a rational outcome (optimists who buy stock and bid the price
higher are countered by pessimists who sell their stock, which keeps the price in
equilibrium) (Clarke and Gershon, 2001).
2.3.2.3 Evaluating Technical Analysis Based On Efficient Market Hypothesis:
The efficient markets hypothesis requires that past prices cannot be used to
predict exchange rate changes. If the hypothesis is true, technical analysis should not
enable a trader to earn profits without accepting unusual risk. This section examines
how two common types of trading rules are formulated and how the returns
generated by these rules are measured (Neely, Weller, and Dittmar, 1997).
Dealing with the Inventory Risk a solution to the market making problem
according to (Gueant, Lehalle and Tapia, 2012):
Market makers continuously set bid and ask quotes for the stocks they have
under consideration. Hence they face a complex optimization problem in which their
return, based on the bid-ask spread they quote and the frequency at which they
indeed provide liquidity, is challenged by the price risk they bear due to their
inventory. The market is modeled using a reference price St following a Brownian
motion with standard deviation σ, arrival rates of buy or sell liquidity-consuming
orders depend on the distance to the reference price St and a market maker
maximizes the expected utility of its P&L over a finite time horizon. They showed
that the Hamilton-Jacobi-Bellman equations associated to the stochastic optimal

47
control problem can be transformed into a system of linear ordinary differential
equations and we solve the market making problem under inventory constraints. Also
they shed light on the asymptotic behavior of the optimal quotes and propose closed-
form approximations based on a spectral characterization of the optimal quotes.
2.3.3 Technical Analysis Tools
Accoarding to (Suresh, 2013), There are numerous tools and techniques for
doing technical analysis. Basically this analysis is done from the following four
important points of view:
1. Prices:
Whenever there is change in prices of securities, it is reflected in the changes
in investor attitude and demand and supply of securities.
2. Time:
The degree of movement in price is a function of time. The longer it takes for
a reversal in trend, greater will be the price change that follows.
3. Volume:
The intensity of price changes is reflected in the volume of transactions that
accompany the change. If an increase in price is accompanied by a small change in
transactions, it implies that the change is not strong enough.
4. Width:
The quality of price change is measured by determining whether a change in
trend spreads across most sectors and industries or is concentrated in few securities
only. Study of the width of the market indicates the extent to which price changes
have taken place in the market in accordance with a certain overall trends.
2.3.4. Technical Analysis: Chart Types
There are three main types of charts that are used by investors and traders
accoarding to (Janssen, Langager and Murphy, 2006):

48
1. Line Chart :
The most basic of the four charts is the line chart because it represents only
the closing prices over a set period of time. The line is formed by connecting the
closing prices over the time frame. Line charts do not provide visual information of
the trading range for the individual points such as the high, low and opening prices.
However, the closing price is often considered to be the most important price in stock
data compared to the high and low for the day and this is why it is the only value
used in line charts.
Figure (2.4): Line Chart
source: investopeddia.com
2. Bar Charts:
The bar chart expands on the line chart by adding several more key pieces of
information to each data point. The chart is made up of a series of vertical lines that
represent each data point. This vertical line represents the high and low for the
trading period, along with the closing price. The close and open are represented on
the vertical line by a horizontal dash. The opening price on a bar chart is illustrated
by the dash that is located on the left side of the vertical bar. Conversely, the close is
represented by the dash on the right. Generally, if the left dash (open) is lower than
the right dash (close) then the bar will be shaded black, representing an up period for
the stock, which means it has gained value. A bar that is colored red signals that the
stock has gone down in value over that period. When this is the case, the dash on the
right (close) is lower than the dash on the left (open).

49
Figure (2.5): Bar Chart
source: investopeddia.com
3. Candlestick Chart:
The candlestick chart is similar to a bar chart, but it differs in the way that it
is visually constructed. Similar to the bar chart, the candlestick also has a thin
vertical line showing the period's trading range. The difference comes in the
formation of a wide bar on the vertical line, which illustrates the difference between
the open and close. And, like bar charts, candlesticks also rely heavily on the use of
colors to explain what has happened during the trading period. A major problem with
the candlestick color configuration, however, is that different sites use different
standards; therefore, it is important to understand the candlestick configuration used
at the chart site you are working with. There are two color constructs for days up and
one for days that the price falls. When the price of the stock is up and closes above
the opening trade, the candlestick will usually be white or clear. If the stock has
traded down for the period, then the candlestick will usually be red or black,
depending on the site.

50
Figure (2.6): Candlestick Chart
source: investopeddia.com
The candlestick is considered the best type of charts that used in financial
markets. It describes nicely the supply and demand for currencies in Forex market.
Japanese candles give a more complete picture to the market situation in comparison
with other types of charts because it does not only show the direction of price
movement, but the strength of this trend as well.
2.3.4.1 Technical Analysis Tools:
The most used technical analysis tools accoarding to (lutz, 2013) is:
1. Moving Averages:
One of the widely used tools is the 200-day moving average. You simply
have to plot the 200-day moving average on the price chart. When the price of the
stock rises above the moving average line, it's a buy signal, and when the price falls
below the moving average line, it is a sell signal. One can also look the 50-day
moving average or the 10-day moving average. Trading is a game of probability. So,
you have to arrive at your own methods to decide which parameters suit you the best.

51
Figure( 2.7): moving average
source: investopeddia.com
2. Relative Strength Index (RSI(:
RSI compares the magnitude of recent gains to recent losses to see if an asset
is oversold or overbought. RSI is plotted on a scale of 0-100. Generally, if it is above
70, the stock is considered overbought and so one can look to sell it. Similarly, an
RSI of less than 30 indicates the stock is oversold and can be bought.
Figure( 2.8): relative strength index (RSI)
Source: tradingconcepts.com

52
3. Moving average convergence divergence (MACD(:
This is a very important tool used by technical experts. You just have to
select the MACD and plot it on a chart. The MACD comprises two lines, fast and
slow. The fast line is the difference between the 26-day exponential moving average
and the 12 day-exponential moving average. The slow line, also called the signal
line, is the nine-day moving average.
Figure (2.9): MACD
Source: investopeddia.com
4. Fibonacci Retracement:
Fibonacci retracement is based on the assumption that the markets retrace by
a few predictable percentages, the best known of which are 38.2%, 50% and 61.8%.
So, when the market retraces 38%, it will generate either a sell or a buy call
depending on the trend.
You have to plot Fibonacci retracement from the peak price. The software
will give the above mentioned retracement levels. When the price reaches the 38.2%
level and bounces, it means the price of the stock at which the chart plots the 38.2%
retracement is the support level and you can buy. However, if the price falls below
the 38.2% level, you may look at the price at 50% retracement level as your next
support. The chart, Fibonacci Retracement, shows how the 38.2% retracement is
working well for the Ranbaxy stock.
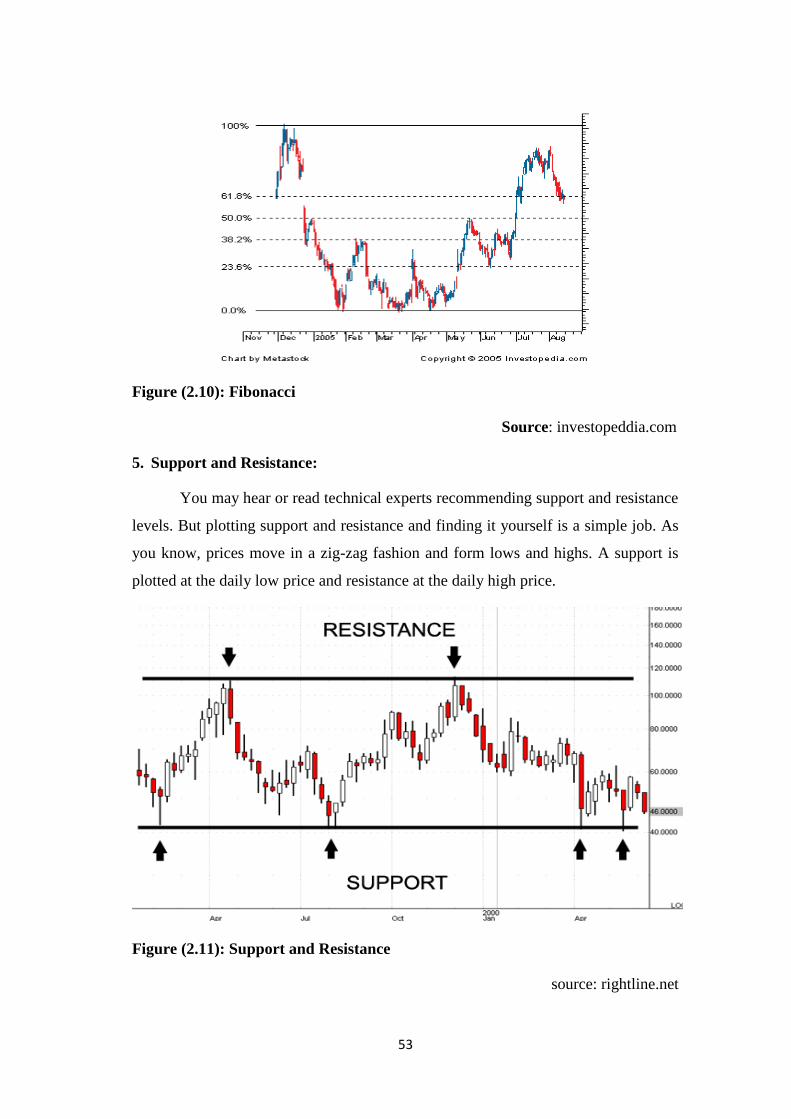
53
Figure (2.10): Fibonacci
Source: investopeddia.com
5. Support and Resistance:
You may hear or read technical experts recommending support and resistance
levels. But plotting support and resistance and finding it yourself is a simple job. As
you know, prices move in a zig-zag fashion and form lows and highs. A support is
plotted at the daily low price and resistance at the daily high price.
Figure (2.11): Support and Resistance
source: rightline.net

54
Other technical tools mentioned by (Australian investors association):
Trends:
Very simply a trend is the general direction in which a security or market is
headed. An uptrend can be described as a series of higher highs and higher lows and
a downtrend as a series of lower highs and lower lows.
One of the basic rules of investing is to trade with the trend so the ability to
identify trends and also trend changes and use these for profitable advantage is
important. Identifying trends isn't always easy as prices don't generally move in a
straight line.
Patterns:
Chart patterns are formed by a combination of support and resistance and
trendlines. Chart pattern analysis can be used in all timeframes. For example a
triangle may form in a matter of days or a head and shoulders top may take months to
form.
Patterns provide a framework to analyse the forces of supply and demand.
They give a clear and concise picture and allow an investor to determine who is more
dominant (buyers or sellers) so that they can position themselves appropriately.
On balance volume (OBV):
On balance volume measures the level of accumulation and distribution by
comparing volume to price movement. Volume is added to the indicator if closing
proice moves up and subtracted if closing price moves down. OBV can be used in
either a ranging or trending market and like most indicators is best used in
conjunction with other indicators.
Elliot wave theory:
Elliot wave theory is based on the premise that markets move in repetitive
cycles or 'waves' and measures investor psychology. Elliot wave theory can be used
to analyse current market structure and by understanding the wave patterns and
learning the wave principles you can identify the highest probability move with the

55
least risk. The theory is also closely aligned with the use of fibonacci ratios to
determine retracement and price target objectives.
2.1.4.2 How to use technical analysis?
The goal of every short-term trader is to determine the direction of a given
asset's momentum and to attempt to profit from it. There have been hundreds of
technical indicators and oscillators developed for this specific purpose, and this
slideshow has just revealed the tip of the iceberg. Now that you have been acquainted
with a few of the basic indicators used in technical analysis, you can go forward and
learn more - you are one step closer to being able to incorporate powerful technical
indicators into your own strategies (Janssen, Langager and Murphy, 2006).
The investor understanding and awareness to the technical analysis tools
gives him/her more power in predicting the market movements and helps him/her to
make a good investment decision. These tools are considered the most common tools
used in predicting prices in financial markets.
2.3.5 Strengths and Weaknesses Of Technical Analysis
Strengths of Technical Analysis accoarding to (Kumar, 2015):
1. Not Just for stocks:
Technical analysis has universal applicability. It can be applied to any
financial instrument -stocks, futures and commodities, fixed-income securities,
Forex, etc
2. Focus on price:
Fundamental developments are followed by price movements. By focusing
only on price action, technicians focus on the future. The price pattern is considered
as a leading indicator and generally leads the economy by 6 to 9 months. To track the
market, it makes sense to look directly at the price movements. More often than not,
change is a subtle beast. Even though the market is prone to sudden unexpected
reactions, hints usually develop before significant movements. You should refer to
periods of accumulation as evidence of an impending advance and periods of
distribution as evidence of an impending decline.

56
3. Supply, demand, and price action:
Technicians make use of high, low and closing prices to analyze the price
action of a stock. A good analysis can be made only when all the above information
is present.
Separately, these will not be able to tell much. However, taken together, the
open, high, low and close reflect forces of supply and demand.
4. Support and resistance:
Charting is a technique used in analysis of support and resistance level.
These are trading range in which the prices move for an extended period of time,
saying that forces of demand and supply are deadlocked. When prices move out of
the trading range, it signals that either supply or demand has started to get the upper
hand. If prices move above the upper band of the trading range, then demand is
winning. If prices move below the lower band, then supply is winning.
5. Pictorial price history:
A price chart offers most valuable information that facilitates reading
historical account of a security’s price movement over a period of time. Charts are
much easier to read than a table of numbers. On most stock charts, volume bars are
displayed at the bottom. With this historical picture, it is easy to identify the
following:
Market reactions before and after important events
Past and present volatility
Historical volume or trading levels
Relative strength of the stock versus the index.
6. Assist with entry point
Technical analysis helps in tracking a proper entry point. Fundamental
analysis is used to decide what to buy and technical analysis is used to decide when
to buy. Timings in this context play a very important role in performance. Technical
analysis can help spot demand (support) and supply (resistance) levels as well as

57
breakouts. Checking out for a breakout above resistance or buying near support
levels can improve returns.
First of all you should analyze stock’s price history. If a stock selected by you
was great for the last three years has traded flat for those three years, it would appear
that market has a different opinion. If a stock has already advanced significantly, it
may be prudent to wait for a pullback. Or, if the stock is trending lower, it might pay
to wait for buying interest and a trend reversal.
Weaknesses of Technical Analysis:
Much of the criticism of technical analysis has its roots in academic theory-
specifically the efficient market hypothesis (EMH). This theory says that the market's
price is always the correct one - any past trading information is already reflected in
the price of the stock and, therefore, any analysis to find undervalued securities is
useless (Janssen, Langager and Murphy, 2006).
Other weaknesses of technical analysis mentioned by (Kumar, 2015):
1. Analyst bias:
Technical analysis is not hard core science. It is subjective in nature and your
personal biases can be reflected in the analysis. It is important to be aware of these
biases when analyzing a chart. If the analyst is a perpetual bull, then a bullish bias
will overshadow the analysis. On the other hand, if the analyst is a disgruntled
eternal bear, then the analysis will probably have a bearish tilt.
2. Open to interpretation:
Technical analysis is a combination of science and art and is always open to
interpretation. Even though there are standards, many times two technicians will look
at the same chart and paint two different scenarios or see different patterns. Both will
be able to come up with logical support and resistance levels as well as key breaks to
justify their position. Is the cup half-empty or half-full? It is in the eye of the
beholder.

58
3. Too late:
You can criticize the technical analysis for being too late. By the time the
trend is identified, a substantial move has already taken place. After such a large
move, the reward to risk ratio is not great. Lateness is a particular criticism of Dow
Theory.
4. Always another level:
Technical analysts always wait for another new level. Even after a new trend
has been identified, there is always another “important” level close at hand.
Technicians have been accused of sitting on the fence and never taking an
unqualified stance. Even if they are bullish, there is always some indicator or some
level that will qualify their opinion.
5. Trader’s remorse:
An array of pattern and indicators arises while studying technical analysis.
Not all the signals work. For instance: A sell signal is given when the neckline of a
head and shoulders pattern is broken. Even though this is a rule, it is not steadfast
and can be subject to other factors such as volume and momentum. In that same vein,
what works for one particular stock may not work for another. A 50-day moving
average may work great to identify support and resistance for Infosys, but a 70-day
moving average may work better for Reliance. Even though many principles of
technical analysis are universal, each security will have its own idiosyncrasies.
6. TA is also useful in controlling risk:
It is Technical Analysis only that can provide you the discipline to get out
when you’re on the wrong side of a trade. The easiest thing in the world to do is to
get on the wrong side of a trade and to get stubborn. That is also potentially the worst
thing you can do. You think that if you ride it out you’ll be okay. However, there will
also be occasions when you won’t be okay. The stock will move against you in ways
and to an extent that you previously found virtually unimaginable.
7. It is more important to control risk than to maximize profits:
There is asymmetry between zero and infinity. What does that mean? Most of
us have very finite capital but infinite opportunities because of thousands of stocks.
59
If we lose an opportunity, we will have thousands more tomorrow. If we lose our
capital, will we get thousands more tomorrow? It is likely that we will not. We will
also lose our opportunities. Our capital holds more worth to us than our opportunities
because we must have capital in order to take advantage of tomorrow’s opportunities.
It is more important to control risk than to maximize profits! Technical
Analysis, if practiced with discipline, gives you specific parameters for managing
risk. It’s simply supply and demand. Waste what’s plentiful, preserve what’s scarce.
Preserve your capital because your capital is your opportunity. You can be right a
thousand times, become very wealthy and then get wiped out completely if you
manage your risk poorly just once. One last time: That is why it is more important to
control risk than to maximize profits.
In general technical analysis is considered one of the objective bases for
trading in currency market so we cannot ignore it and the investors must understand
the rules and principals of it.
2.3.6 Technical Analysis Vs. Fundamental Analysis
(Keerti Kulkarni and Gururaj Kulkarni, 2013) mentioned some differences
between Fundamental Analysis and Technical Analysis:
At the most basic level, a technical analyst approaches a security from the charts
while a fundaments analyst starts with the financial statements.
By looking at the balance sheet, cash flow statement and income statement, a
fundamental analyst tries to determine a company’s value. In financial terms, an
analyst attempts to measure a company’s intrinsic value. In this approach,
investment decisions are fairly easy to make – if the price of a stock trades below
its intrinsic value and in such a situation it will result into a good investment.
Although this is an oversimplification, fundamental analysis goes beyond just the
financial statements. Technical traders on the other hand believe that there are no
reasons to analyze a company’s fundamentals because these are all accounted for
in the stock’s price. Technicians believe that all the information they need about a
stock can be found in its charts.
Fundamental analysis takes relatively a long-term approach to analyze the market
compared to the technical analysis. While technical analysis can be used on a

60
timeframe of weeks, days or even minutes, fundamental analysis often looks at
data over a number of years.
Not only is technical analysis of more short term than fundamental analysis, but
the goals of purchase (or sale) of a stock are usually different for each approach.
In general, technical analysis is used for a trade, whereas fundamental analysis is
used to make an investment. Investors buy assets believing that the stock prices
may increase in value, while traders buy assets believing that they can sell it to
somebody else at a greater price.
Another difference mentioned by (Kumar, 2015):
Technical analysis works on Pareto principle. It considers the market to be
80% psychological and 20% logical. Fundamental analysts consider the market to be
20% psychological and 80% logical. Psychological or logical may be open for
debate, but there is no questioning the current price of a security. After all, it is
available for all to see and nobody doubts its legitimacy. The price set by the market
reflects the sum knowledge of all participants, and we are not dealing with
lightweights here. These participants have considered (discounted) everything under
the sun and settled on a price to buy or sell.
Both the technical analysis and fundamental analysis care considered of the
merits for trading in the Forex markets and complement each other. Investor must
study fundamental analysis to find out the reason of market move and studies
technical analysis to know the effects of released economic news.

61
Chapter 3
Literature Review

62
Chapter 3
Literature Review
Literature Review:
Many previous foreign and Arab studies associated with trade in Forex
market were done such as the following:
3.1 Foreign Studies:
1. (Avramov, Kaplanski and Levy, 2015) A study entitled "Talking Numbers:
Technical versus Fundamental Recommendations".
This study assesses the economic value of technical and fundamental
recommendations simultaneously featured on “Talking Numbers,” a CNBC and
Yahoo joint broadcast. Technicians display stock-picking skills, while
fundamentalists reveal no value.
The study shows that technicians overwhelmingly outperform fundamentalists in
predicting returns over horizons of three to nine months.
Considering market indexes, Treasuries, commodities, and various equity indexes,
both schools of recommendation generate poor forecasts. Overall, the evidence
shows that proprietary trading rules could, at best, enhance investments in single
stocks, while returns on broader assets are unpredictable.
2. (Devika and Poornima, 2015) A study entitled "Fundamental Analysis as a
Method of Share Valuation in Comparison with Technical Analysis".
This study reports the results of a questionnaire survey in September,
October/November 2014 on the use of Fundamental and Technical analysis by
brokers / fund managers in Indian stock market to form their forecasts of share price
movements. The findings of the research reveal that more than 85 percent of the
respondents rely upon both Fundamental and Technical analysis for predicting future
price movements at different time horizons. This paper envisages on different trends
of the stock market and it relates the trends towards the usage of Fundamental and
Technical analysis. The results show that when the market is bullish participants rely
more upon Technical analysis and when the market is bearish it is the other way

63
round the participants rely upon the Fundamental analysis. This paper gives special
emphasis on the usage of these tools while taking positions in Large Cap, Mid cap
and Small Cap companies.
3. (Suresh A.S, 2013) A study entitled "A study on fundamental and technical
analysis".
This study aimed to identify the two type of analysis in the financial markets
(technical and fundamental analysis) and showed that investors in the financial
market have different attitudes towards risk and varying levels of risk bearing
capacity.
The study reveales that each investor tries to maximize his welfare by
choosing the optimum combination of risk and return in accordance with his
preference and capacity. It is highly essential for the investor to do both fundamental
and technical analysis for deciding the suitable stock.
4. (Kulkarni K and Kulkarni G, 2013) A study entitled "Fundamental analysis
VS. Technical analysis: A choice of sectoral analysis".
The paper explores the analytical tools in evaluating sectoral stocks. In
particular focus has been set to understand the genesis of fundamental and technical
analysis in evaluating the sectoral stocks. To ascertain this effectively, fundamental
and technical analysis have been carried out among stocks of selected sectors.
Fundamental and Technical analysis of selected sectoral stocks have been
carried out. Interpretation of the secondary data clearly indicates Fundamental
analysis to be the most preferred analysis in choosing stocks to get higher returns.
The paper indicates also that investors strongly believe in the company’s past
performance, and its true value.
5. (King, Osler and Levy, 2012) A study entitled "The market microstructure
approach to foreign exchange: Looking back and looking forward".
This research on foreign exchange (FX) market microstructure stresses the
importance of order flow, heterogeneity among agents, and private information as
crucial determinants of short-run exchange rate dynamics.

64
The research also showed that microstructure researchers have produced
empirically-driven models that fit the data surprisingly well. But currency markets
are evolving rapidly in response to new electronic trading technologies.
Transparency has risen, trading costs have tumbled, and transaction speed has
accelerated as new players have entered the market and existing players have
modified their behavior. These changes will have profound effects on exchange rate
dynamics.
Microstructure researchers adopted a deductive approach of surveying FX
market participants and assembling detailed, high-frequency datasets. This effort
produced the breakthrough insight about the forces that drive exchange rates, most
notably order flow within the currency market. This insight, in turn, has led to other
powerful insights. It is now recognized that currency traders hold heterogeneous
beliefs and have access to different information, some of which is private. While
financial customers appear to be the best informed, their trades have only a transitory
impact. Corporations are typically less informed, provide liquidity in overnight
markets, and may contribute to the persistent impact of order flow on exchange rates.
This interaction between informed and uninformed agents is key to modeling short-
run exchange-rate dynamics. It is also recognized that currency market structure
differs in important ways from the other financial markets, so researchers must be
wise and selective in their reliance on the broader microstructure literature when
developing rigorous exchange rate models.
6. (King, Osler and Rime, 2011) A study entitled "Foreign exchange market
structure, players and evolution".
The study showed that electronic trading has transformed foreign exchange
markets over the past decade, and the pace of innovation only accelerates. This
formerly opaque market is now fairly transparent and transaction costs are only a
fraction of their former level. Entirely new agents have joined the fray, including
retail and high-frequency traders, while foreign exchange trading volumes have
tripled. Market concentration among dealers has risen reflecting the heavy
investments in technology. Undeterred, some new non-bank market participants have

65
begun to make markets, challenging the traditional foreign exchange dealers on their
own turf.
This study examines the state of play in the global FX market, which reflects
both stability and rapid technological change. As ever, currency trading still takes
place on a decentralized market in which most customers rely on professional dealers
to provide liquidity. Currencies are still traded to facilitate international trade, hedge
risk, earn speculative returns, and to profit from market making. The US dollar,
Japanese yen, and euro remain the dominant currencies and trading is still
concentrated in London and New York. The best-informed agents in the market
continue to be financial institutions, especially hedge funds.
7. (Neely and Weller, 2011) A study entitled "Technical Analysis in the Foreign
Exchange Market ".
This study introduces the subject of technical analysis in the foreign exchange
market, with emphasis on its importance for questions of market efficiency.
“Technicians” view their craft, the study of price patterns, as exploiting traders’
psychological regularities. The literature on technical analysis has established that
simple technical trading rules on dollar exchange rates provided 15 years of positive,
risk-adjusted returns during the 1970s and 80s before those returns were
extinguished. More recently, more complex and less studied rules have produced
more modest returns for a similar length of time. Conventional explanations that rely
on risk adjustment and/or central bank intervention do not plausibly justify the
observed excess returns from following simple technical trading rules. Psychological
biases, however, could contribute to the profitability of these rules. The researchers
view the observed pattern of excess returns to technical trading rules as being
consistent with an adaptive markets view of the world.
8. (Venkatesh and Tyagi, 2011) A study entitled "Technical analysis and its
usage in Indian capital markets: A survey".
This research reports the results of a questionnaire survey in September
to November 2010 on the use of Technical analysis by brokers/fund managers in
Indian stock market to form their forecasts of share price movements. The
findings of the research reveal that more than 85percent of the respondents

66
rely upon both Fundamental and Technical analysis for predicting future
price movements at different time horizons. The survey envisages at providing
insights about the way technical traders operate in the capital market and the trading
strategies they design. The survey covered Brokers, Sub-Brokers, Fund managers,
Portfolio managers and others.
9. (Toussi, Wah and Ngo, 2011) A study entitled "A novel Forex prediction
methodology based on fundamental data".
The study showed that Markets play a critical role in economics of the world
and the distribution of wealth. Predicting them can help with preventing crashes and
avoiding severe losses, or making significant profits. But such prediction is not easy
due to the very complex nature of markets and the wide variety of the influence
factors involved. Technical analysts or chartists rely on historical chart data to
predict patterns based on previous behaviours of graphs. This approach is fairly
straightforward and has also been automated to a great extent. There are computer
programs or predictor robots that use the technical approach and facilitate buy or sell
decisions. However, market behaviour obviously is more than repetition of old
patterns and many of the events in the outside world have constant impacts on it.
These external pieces of information can vary from political events to economic
statistics. Fundamental analysts are those with a knowledge and understanding of the
world events on market behaviour. This requires knowledge of politics, micro and
macroeconomics to say the least, and hence, there are far fewer of such analysts.
This study initiated a novel approach on fundamental data manipulation for
identification of relationships between market behaviour and external information by
observing the USD/GBP currency pair. In this research an approach was devised and
proposed for integration of fundamental data into automatic prediction. In this
approach 3 main sources for fundamental data were identified. From these sources
data was extracted, organized and then fed into a proposed neural network during 6
experiments. The experiments put the possible relationships between the identified
fundamental data and the price movements of the chosen currency pair (USD/GBP)
to test. The test results identified the datasets with plausible relationships with the

67
market behaviour. The observed positive output of 3 different sets of data-input
proved the proposed methodology to be of considerable value for market prediction.
10. (Newman, Potter and Wright 2011) A study entitled "Foreign Exchange
Market Intervention".
This study presents a new and improved data series on interventions by the
RBA (Reserve Bank of Australia) in the foreign exchange market. These data allow a
documentation of the evolution in the approach to foreign exchange market
intervention after the float of the exchange rate. This evolution reflects a recognition
that when foreign exchange markets are deep and liquid (and the capital account is
open), the effects of intervention on the level of the exchange rate are generally
short-lived. Moreover, under these ‘normal’ circumstances, the practical difficulties
involved in determining what the ‘fair value’ of an exchange rate should be suggest
that it is difficult for policymakers to systematically improve on market outcomes,
particularly in real time. Nevertheless, in instances of severe market dysfunction,
intervention can exert an important stabilising influence on the foreign exchange
market.
The study uses the new data to assess the effectiveness of foreign exchange
market intervention. It shows that it is not possible to draw strong conclusions,
notwithstanding the use of an improved measure of RBA interventions. The well-
known limitations of this type of analysis suggest that the estimates of the effect of
intervention on the exchange rate are expected to be understated, and may even be
perverse.
11. (Lechner and Nolte, 2007) A study entitled "Customer trading in the foreign
exchange market empirical evidence from an internet trading platform".
This paper analyzes the relationship between currency price changes and their
expectations. Currency price change expectations are derived with the help of
different order flow measures, from the trading behavior of investors on OANDA
FXTrade, which is an internet trading platform in the foreign exchange market.
68
The review concluded the following:
1. The price expectations for investors affected by the historical changes of prices.
2. The investors' behavior influenced by the historical changes of prices.
3. The stop-loss and take-profit order contributed to impeding price movements.
12. (Nolte and Konstanz, 2006) A study entitled "Retail investors’ trading
behavior in the foreign exchange market a panel duration approach".
The study aimed to identify behavior trends of investors in the foreign
exchange market and the impact of achieved returns on investment decisions. The
study considered that orders done by investors reflects their personal impressions by
testing the time required from the entry into an investment in a currency pair to its
exit and measuring the required time to do the next step in investment process.
The study findings can be summarized in the following way:
1. The disposition effect varies with the size of the profit or loss obtained over a
roundtrip.
2. For small profits and losses we find an inverse disposition effect, whereas for
large profits and losses the usual disposition effect is found.
3. The disposition effect is more pronounced for overconfident investors.
13. (Evans and Lyons, 2005) A study entitled "Exchange rate fundamentals and
order flow".
This paper addresses whether transaction flows in foreign exchange markets
convey information about fundamentals. The study begin with a GE model in the
spirit of Hayek (1945) in which fundamental information is first manifest in the
economy at the micro level, i.e., in a way that is not symmetrically observed by all
agents. With this information structure, induced foreign exchange transactions play a
central role in the aggregation process, providing testable links between transaction
flows, exchange rates, and future fundamentals. The study test these links using data
on all end-user currency trades received by Citibank over 6.5 years, a sample
sufficiently long to analyze real-time forecasts at the quarterly horizon. The

69
predictions are borne out in four empirical findings that define this paper's main
contribution:
1. Transaction flows forecast future macro variables such as output growth, money
growth, and inflation.
2. Transaction flows forecast these macro variables significantly better than spot
rates do.
3. Transaction flows (proprietary) forecast future spot rates.
4. Though proprietary flows convey new information about future fundamentals,
much of this information is still not impounded in the spot rate one quarter later.
These results indicate that the significance of transaction flows for exchange
rates extends well beyond high frequencies.
14. (Omrane and Heinen, 2004) A study entitled "The Foreign Exchange
Quoting Activity as an Informative Signal".
The researchers investigate the informative property of quoting activity,
measured by the frequency of price revisions, in the Euro/Dollar foreign exchange
market. We use the multivariate double autoregressive conditional Poisson model,
designed for time series of count data.
The study finds that dealers’ quoting activity reacts to both news
announcements and quoting activity of other dealers. Some dealers analyse quoting
activity of others to infer useful information like their different reactions to public
news announcements. Some of them increase their activity, whilst others decrease it
in response to the same news. We attribute this to the heterogeneous interpretation of
the news content by individual traders and to the significant influence of some
dealers on others.
15. (Papadamou and Tsopoglou, 2001) A study entitled "Investigating the
profitability of technical analysis systems on foreign exchange markets".
This study reviews previous research on exchange rate forecasting and
identifies some problems in building a predictive model and examines the
profitability of using various technical rules (as used by traders) in the USD/DM and
USD/BP foreign exchange markets. The study takes 1989‐1996 data, divided into

70
two sub‐periods with different macroeconomic features; and compares the results
from the technical rules in detail and with a buy and hold strategy.
The study finds that no rules produced statistically significant profits for the
whole period (although they did for the first sub‐period) and some evidence that buy
and hold is superior, especially if risk is taken into account.
16. (Neely, 1997) A study entitled "Technical Analysis in the Foreign Exchange
Market: A Layman’s Guide".
This study shows that Technical analysis is the most widely used trading
strategy in the foreign exchange market. Traders stake large positions on their
interpretations of patterns in the data. Economists have traditionally rejected the
claims of technical analysts because of the appealing logic of the efficient markets
hypothesis. More recently, however, the discovery of profitable technical trading
rules and other evidence against efficient markets have led to a rethinking about the
importance of institutional features that might justify extrapolative technical analysis
such as private information, sequential trading, and central bank intervention, as well
as the role of risk.
The weight of the evidence now suggests that excess returns have been
available to technical foreign exchange traders over long periods. Risk is hard to
define and measure, however, and this difficulty has obscured the degree of
inefficiency in the foreign exchange market. There is no guarantee, of course, that
technical rules will continue to generate excess returns in the future; the excess
returns may be bid away by market participants. Indeed, this may already be
occurring.
3.2 Arab Studies:
1. (Abu EL-Taif, 2011) A study entitled "The impact of technical analysis on the
traders' decisions in the Stock Exchange of Palestine".
This study aimed to determine the impact of technical analysis on the
decision of investors in the Stock Exchange of Palestine, and learn how to use, The
field study was on a group of active investors in the brokerage companies operating
in the Gaza Strip.

71
Result of the study showed that Technical Analysis is clear and easy to use,
the understanding and knowledge of technical analysis, assessment of its importance
and its degree of reliability is not affected by the personal data of the investor such
as: (Qualifications, brokerage company , the value of invested capital), but affected
by the investment period that increases the development of predictive capabilities,
Investors how follow the technical analysis in decision making, recognizes the
importance of technical analysis and its impact on his/her decision in a positive, may
especially in determining the time of entry and exit from the market, which
distinguishes him/her from the rest of the investors. Based on the drawn result of the
study, the following is the list of the most important recommendations: Investors are
urged to increase their knowledge and awareness in technical analysis, the need to
diversify technical analysis before making an investment decision. Academic are
urged to further shady the technical analysis through the promotion of research, the
opening of specialty financial markets and the offering of new courses in technical
analysis and theories. Add in mal urged the Palestine Stock Exchange is urged to
enhance the status of technical analysis as a quality tool used to improve the
investor's decision by increasing its capacity for analysis and forecasting.
2. (Shaheen and Saqer, 2010) A study entitled "The impact of using the strong
Japanese candles model on investment decisions at Forex Trading - An
Empirical Study".
This study aimed to investigate the effect of using the Japanese candlesticks
on the decisions of best investments in foreign exchange market (Forex), and that by
standing on the signs and indications of some form of Japanese candlesticks, and
their impact on return and risk, and to achieve the objective of the study applied
study was conducted by directing a group of investors in the Forex market advice
based on analysis of Japanese candles where they purchase and sale operations
during the study period, under the supervision and follow-up researchers. The study
concluded that investment was economically feasible compared to other investment
opportunities if they are to follow the correct principles in decision making, and the
following analysis by relying on candles for the Japanese market trends in the short
term contribute to the rational decision-making, the study also showed that the work
within the candles Japanese models useful in determining the timing of decisions and

72
give strong signals that warn investors of the imminent reversal of the market. The
study recommended the need for analysis models by candlelight when the Japanese
decision making and the need to hedge by not leaving the center open to the currency
pairs for the next day, and follow-up information on the currency pairs from reliable
sources.
3. (Al-Shokrajy, Taj El-Deen and Soliman, 2010) A study entitled "Technical
Analysis and Its Role in Investment Decision Making Concerning Financial
Securities: An analytical study for a sample from financial markets in Arab
Gulf".
The study showed that several supporters of technical analysis believe in
"Historical events are reoccurring" principle, as most analysis resort, depending on
this principle, to follow and use previous occurred technical models. These previous
models how repeated several times and that to assure their success and the extent of
their accuracy during previous periods of time. The relative strength index is
regarded one of the indices that measure momentum oscillator in stocks exchange.
The index has very important and useful analytical ability. So this index is adopted
for its ability to study and integrating the right technical inferences in making
investment decisions by participants in stocks exchange.
The research concluded that the process of technical analysis is represented
by checking and studying the indices, and technical maps to determine the special
paths and technical models which are repeated previously, hoping they will continue
as they are in coming periods.
4. (Al-Aoaisy, 2010) A study entitled "Analyzing the trends of individual
investors in the Palestine stock Exchange: Exploratory Study on the individual
investors in Gaza Strip".
The study aimed to identify the trends of individual investors at Palestine
Securities Exchange in Gaza strip. This was achieved through examining factors that
affect investors' manners and tendencies.
The study found that many investors cared about following the latest
developments of exchange market and other businesses through mass media. It also
found that staffs of financial mediators working at Palestine Securities Exchange are

73
not fully competent to help investors take their own investment decisions.
Furthermore, rumors constitute a major external factor negatively affecting
investment. The study also showed that the possibility of investment aboard has a
negative impact on investment decisions in the Palestine Securities Exchange.
3.3 Comments on the previous studies:
It is clear from what has been shown previously that the topic of trading in
Forex market has gained the attention of researchers which reflects the importance of
this subject.
The study has reviewed (20) studies. Most of these previous studies
addressed the issue of Forex market (its concept, players, structure, evolution,
benefits and risks, the differences between Forex and stock market and investors
behavior) such as: (King, Osler and Levy, 2012) study, (King, Osler and Rime, 2011)
study, (Lechner and Nolte, 2007) study, (Nolte and Konstanz, 2006) study,
(Newman, Potter and Wright 2011) study and (Al-Aoaisy, 2010) study.
Some of them discussed the technical analysis in the Forex and stock market
(its concept, tools, importance, characteristics, strength and weaknesses, comparison
with fundamental analysis and its effect on the investors' decision) such as: (Suresh
A.S, 2013) study, (Avramov, Kaplanski and Levy, 2015) study, (Kulkarni K and
Kulkarni G, 2013) study, (Neely and Weller, 2011) study, (Venkatesh and Tyagi,
2011) study, (Neely, 1997) study, (Papadamou and Tsopoglou, 2001) study,
(Shaheen and Saqer, 2010) study, (Abu EL-Taif, 2011) study and (Al-Shokrajy, Taj
El-Deen and Soliman, 2010) study.
The other part of these studies discussed the fundamental analysis in the
Forex and stock market (its concept, importance, strength and weaknesses, economic
indicators, trading using economic data, comparison with technical analysis and how
to trade in news releases) such as: (Suresh A.S, 2013) study, (Avramov, Kaplanski
and Levy, 2015) study, (Kulkarni K and Kulkarni G, 2013) study, (Evans and Lyons,
2005) study, (Devika and Poornima, 2015) study, (Toussi, Wah and Ngo, 2011)
study and (Omrane and Heinen, 2004) study.

74
After reviewing the previous studies the study found that:
Part of these studies has targeted the identification of Forex deeply by explaining
its structure, players, evolution, benefits and risks, investors' behavior, market
efficiency and the differences between Forex and stock market.
The other part of these studies discussed technical and fundamental analysis from
several sides by explaining their concept, tools, importance, characteristics,
strength and weaknesses, comparison between two type of analysis, economic
indicators and their effect on the investors' decision.
These studies were conducted in different environments, some of them were
conducted in foreign environments and others were conducted in Arabic ones, as
some of them were conducted in Forex market and other were conducted in stock
market.
These studies differ among themselves, and within each domain in terms of
dimensions, elements and variables that have been focused by each study, leaving
the field wide and open for researchers to fill the research gaps and to contribute
to the enrichment of the knowledge and practical sides of both domains of this
search.
These studies address the importance of combination between two types of
analysis on investors' decision but didn’t address the effect of combination
between two types of analysis on investors' decision.
What distinguishes the current study from previous studies?
According to the researcher's knowledge, this study shows the effect of
combination between two types of analysis on investors' decision.
It highlights the difference between the achieved yield when depending on
combination between two types of analysis and the achieved yield when
depending on one type of analysis with the negligence of another.
Its unique to help investors to make a rational investment decision by let them
know the time of entry and existing from the market instead of random
investment.

75
Chapter 4
Research Design

76
Chapter Four
Research Design
4.1 Introduction
This chapter describes the methodology that was used in this research. The
adopted methodology to accomplish this research uses the following techniques: the
information about the research design, research population, questionnaire design,
statistical data analysis, content validity and pilot study.
4.2 Research Design
1. The first phase of the research thesis proposal included identifying and defining
the problems and establishment objective of the study and development research
plan.
2. The second phase of the research included a summary of the comprehensive
literature review. Literatures on claim management were reviewed.
3. The third phase of the research included a field survey which was conducted
with the experts at Forex in three companies (FxPro, Markets and Amana capital).
4. The fourth phase of the research focused on the modification of the
questionnaire design, through distributing the questionnaire to pilot study, The
purpose of the pilot study was to test and prove that the questionnaire questions
are clear to be answered in a way that help to achieve the target of the study. The
questionnaire was modified based on the results of the pilot study.
5. The fifth phase of the research focused on distributing questionnaire. This
questionnaire was used to collect the required data in order to achieve the research
objective.
6. The sixth phase of the research was data analysis and discussion. Statistical
Package for the Social Sciences, (SPSS) was used to perform the required
analysis.
7. The final phase includes the conclusions and recommendations.
(105) questionnaires were distributed to the research population and a (90)
questionnaires are received.

77
Figure (4.1) shows the methodology flowchart, which leads to achieve the
research objective.
Figure (4.1) illustrates the methodology flow chart.
4.3 Developing the questionnaire:
In general most of the questionnaire questions developed from the seminar
and webinar sessions and educational videos for senior analysts that available on
Souqelmal site, the largest Arabic educational site.
4.4 Data Collection Methodology
In order to collect the needed data for this research, we use the secondary
resources in collecting data such as books, journals, statistics and web pages, in
addition to preliminary resources that not available in secondary resources through
Topic Selection
Literature Review
Identify the
Problem
Define the Problem
Establish Objective
Develop
Research Plan
Questionnaires
Questionnaires Design
Results and
Data Analysis
Conclusion &
Recommendation
Field Surveying
Thesis Proposal
Literature Review
Pilot
Questionnaires
Questionnaires
Validity
Questionnaires
Reliability

78
distribute questionnaires on study sample in order to get their opinions about the
impact of the combination between fundamental analysis and technical analysis on
the investors' decision at Forex market. Research methodology depends on the
analysis of data on the use of descriptive analysis, which depends on the poll and use
the main program (SPSS).
4.5 Sample size
The Sample of this study consisted of (90) of the expert at Forex in three
companies (FxPro, Markets and Amana capital).
4.6 Pilot Study
A pilot study for the questionnaire was conducted before collecting the results
of the sample, (20) questionnaire is distributed. It provides a trial run for the
questionnaire, which involves testing the wordings of question, identifying
ambiguous questions, testing the techniques that used to collect data, and measuring
the effectiveness of standard invitation to respondents.
4.7 Data Measurement
In order to be able to select the appropriate method of analysis, the level of
measurement must be understood. For each type of measurement, there is/are an
appropriate method/s that can be applied and not others. In this research, ordinal
scales were used. Ordinal scale is a ranking or a rating data that normally uses
integers in ascending or descending order. The numbers assigned to the important
(1,2,3,4,5) do not indicate that the interval between scales are equal, nor do they
indicate absolute quantities. They are merely numerical labels. Based on Likert scale
we have the following:
Item Strongly
agree Agree
Relatively
agree Disagree
Strongly
Disagree
Scale 5 4 3 2 1
4.8 Test of normality
The One-Sample Kolmogorov-Smirnov test procedure compares the observed
cumulative distribution function for a variable with a specified theoretical

79
distribution, which may be normal, uniform, Poisson, or exponential. The
Kolmogorov-Smirnov Z is computed from the largest difference (in absolute value)
between the observed and theoretical cumulative distribution functions. This
goodness-of-fit test tests whether the observations could reasonably have come from
the specified distribution. Many parametric tests require normally distributed
variables. The one-sample Kolmogorov-Smirnov test can be used to test that a
variable of interest is normally distributed (Henry, C. and Thode, Jr., 2002).
Table (4.1) shows the results for Kolmogorov-Smirnov test of normality.
From Table (4.1), the p-value for each variable is greater than 0.05 level of
significance, then the distributions for these variables are normally distributed.
Consequently, parametric tests should be used to perform the statistical data analysis.
Table (4.1): Kolmogorov-Smirnov test
Field
Kolmogorov-
Smirnov
Statistic P-value
The investors understanding of the rules and principals
of technical analysis 1.278 0.076
The investors dependence on technical analysis when
making an investment decision 1.343 0.054
Technical analysis 1.025 0.245
The investors understanding of the rules and principals
of fundamental analysis 1.261 0.083
The investors dependence on technical analysis when
making an investment decision 0.986 0.285
Fundamental analysis 1.079 0.195
Combining between technical and fundamental
analysis 1.345 0.054
All items of the questionnaire 1.280 0.076
Statistical analysis Tools
The researcher used data analysis both qualitative and quantitative data
analysis methods. The Data analysis made utilizing SPSS. The researcher utilizes the
following statistical tools:
1. Kolmogorov-Smirnov test of normality.
2. Pearson correlation coefficient for Validity.
80
3. Cronbach's Alpha for Reliability Statistics.
4. Frequency and descriptive analysis.
5. One-sample T test.
T-test is used to determine if the mean of an item is significantly different
from a hypothesized value 3 (Middle value of Likert scale). If the P-value (Sig.) is
smaller than or equal to the level of significance, , then the mean of an item is
significantly different from a hypothesized value 3. The sign of the Test value
indicates whether the mean is significantly greater or smaller than hypothesized
value 3. On the other hand, if the P-value (Sig.) is greater than the level of
significance, then the mean an item is insignificantly different from a hypothesized
value 3.
4.9 Validity of Questionnaire
Validity refers to the degree to which an instrument measures what it is
supposed to be measuring. Validity has a number of different aspects and assessment
approaches. Statistical validity is used to evaluate instrument validity, which include
internal validity and structure validity.
4.9.1 Internal Validity
Internal validity of the questionnaire is the first statistical test that used to test
the validity of the questionnaire. It is measured by a scouting sample, which
consisted of 90 questionnaires through measuring the correlation coefficients
between each item in one field and the whole field.
After the concluding of statistical test we found that:
The correlation coefficient for each item of the "The investors understanding
of the rules and principals of technical analysis" and the total of the field. The
p-values (Sig.) are less than 0.05, so the correlation coefficients of this field
are significant at α = 0.05, so it can be said that the items of this field are
consistent and valid to be measure what it was set for.
The correlation coefficient for each item of the "The investors dependence on
technical analysis when making an investment decision" and the total of the
field. The p-values (Sig.) are less than 0.05, so the correlation coefficients of
81
this field are significant at α = 0.05, so it can be said that the items of this
field are consistent and valid to be measure what it was set for.
The correlation coefficient for each item of the" The investors understanding
of the rules and principals of fundamental analysis" and the total of the field.
The p-values (Sig.) are less than 0.05, so the correlation coefficients of this
field are significant at α = 0.05, so it can be said that the items of this field are
consistent and valid to be measure what it was set for.
The correlation coefficient for each item of the "The investors dependence on
technical analysis when making an investment decision" and the total of the
field. The p-values (Sig.) are less than 0.05, so the correlation coefficients of
this field are significant at α = 0.05, so it can be said that the items of this
field are consistent and valid to be measure what it was set for.
The correlation coefficient for each item of the "The investors understanding
to the importance of combining between technical and fundamental analysis
and their dependence on it" and the total of the field. The p-values (Sig.) are
less than 0.05, so the correlation coefficients of this field are significant at α =
0.05, so it can be said that the items of this field are consistent and valid to
be measure what it was set for.
4.9.2 Structure Validity of the Questionnaire
Structure validity is the second statistical test that used to test the validity of
the questionnaire structure by testing the validity of each field and the validity of the
whole questionnaire. It measures the correlation coefficient between one field and all
the fields of the questionnaire that have the same level of liker scale.
Table (4.7) clarifies the correlation coefficient for each field and the whole
questionnaire. The p-values (Sig.) are less than 0.05, so the correlation coefficients of
all the fields are significant at α = 0.05, so it can be said that the fields are valid to be
measured what it was set for to achieve the main objective of the study.

82
Table (4.7): Correlation coefficient of each field and the whole of questionnaire
No. Field
Pearson
Correlation
Coefficient
P-Value
(Sig.)
1. The investors understanding of the rules and
principals of technical analysis .795 0.000*
2. The investors dependence on technical analysis
when making an investment decision .705 0.000*
Technical analysis .761 0.000*
1. The investors understanding of the rules and
principals of fundamental analysis .838 0.000*
2. The investors dependence on technical analysis
when making an investment decision .574 0.000*
Fundamental analysis .922 0.000*
Combining between technical and fundamental
analysis .884 0.000*
* Correlation is significant at the 0.05 level
4.10 Reliability of the Research
The reliability of an instrument is the degree of consistency which measures
the attribute; it is supposed to be measuring (George and Mallery, 2006). The less
variation an instrument produces in repeated measurements of an attribute, the higher
its reliability. Reliability can be equated with the stability, consistency, or
dependability of a measuring tool. The test is repeated to the same sample of people
on two occasions and then compares the scores obtained by computing a reliability
coefficient (George and Mallery, 2006). To insure the reliability of the questionnaire,
Cronbach’s Coefficient Alpha should be applied.
4.10.1 Cronbach’s Coefficient Alpha
Cronbach’s alpha (George D. & Mallery P, 2006) is designed as a measure of
internal consistency, that is, do all items within the instrument measure the same
thing? The normal range of Cronbach’s coefficient alpha value between 0.0 and +
1.0, and the higher values reflects a higher degree of internal consistency. The
Cronbach’s coefficient alpha was calculated for each field of the questionnaire.

83
Table (4.8) shows the values of Cronbach's Alpha for each field of the
questionnaire and the entire questionnaire. For the fields, values of Cronbach's Alpha
were in the range from 0.732 and 0.865. This range is considered high; the result
ensures the reliability of each field of the questionnaire. Cronbach's Alpha equals
0.905 for the entire questionnaire which indicates an excellent reliability of the entire
questionnaire.
Table (4.8): Cronbach's Alpha for each field of the questionnaire
No. Field Cronbach
's Alpha
1. The investors understanding of the rules and principals of
technical analysis 0.841
2. The investors dependence on technical analysis when making an
investment decision 0.732
Technical analysis 0.782
1. The investors understanding of the rules and principals of
fundamental analysis 0.865
2. The investors dependence on technical analysis when making an
investment decision 0.834
Fundamental analysis 0.811
Combining between technical and fundamental analysis 0.819
All items of the questionnaire 0.905
Therefore, it can be said that the questionnaire was valid, reliable, and ready
for distribution for the population sample.

84
Chapter 5
Data Analysis and
Hypothesis

85
Chapter Five
Data Analysis and Hypothesis
5.1. Introduction:
This chapter highlights the statistical techniques that were used in analyzing
data of this research and finding out the appropriate answers to the study questions.
In addition, this chapter describes the used techniques in testing the research
hypothesis. This chapter also highlights the characteristics of the research sample.
5.2. The characteristics of the sample
5.2.1. Gender:
Table No. (5.1) shows that 77.8% of the respondents are males and 22.2% of
the respondents are females, this is may be because most traders in the financial
markets is male where they are more willing regarding to the physiological state to
accept the loss than the female. This result agreed with the results of (Justin, 2015).
Table (5.1): Gender
Gender Frequency Percent
Male 70 77.8
Female 20 22.2
Total 90 100.0
5.22 Age:
Table No. (5.2) shows that 32.2% of the sample are "from 20-30 years ",
35.6% of the sample are "from 30-40 years ", 18.9% of the sample are "from 40-50
years" and 13.3% of the sample are of "50 years and above ", this is may be because
youth more adapted to technology and more willing to accept risk in exchange
achieving high returns.

86
Table (5.2): Age
Age Frequency Percent
from 20-30 years 29 32.2
from 30-40 years 32 35.6
from 40-50 years 17 18.9
50 and above 12 13.3
Total 90 100.0
5.2.3 Specialization
Table No. (5.3) shows that 72.2% of the sample specialized in "Finance and
accounting", 12.2% specialized in "business administration", 7.8% of the sample
specialized in "Engineering" and 7.8% of the sample specialized in "others", this is
may be because the finance and accounting specialization deals with the subject of
the financial markets so we find that most of the traders in these markets are those
who have a scientific background in this area.
Table (5.3): Specialization
Frequency Percent
valid Finance and Accounting 65 72.2
Business Administration 11 12.2
Engineer 7 7.8
Others 7 7.8
Total 90 100.0

87
5.2.4 Practical Qualification
Table No. (5.4) shows that 24.4% of the sample are "Diploma or less"
holders, 53.3% of the sample are "Bachelor" holders and 22.2% of the sample are
"Graduate studies" holders, this result when comparing with specialization reflects
that most of experts in Forex having a bachelor degree in finance and accounting
where this specialty have a direct relationship with trading in financial markets and it
supports the respondents' ability to answer the questionnaire accurately and
objectively.
Table (5.4): Practical Qualification
Practical Qualification Frequency Percent
Diploma or less 22 24.4
Bachelor 48 53.3
Graduate studies 20 22.2
Total 90 100.0
5.2.5 Years of experience at Forex:
Table No.(5.5) shows that 4.4% of the sample have experience " Less than 3
years", 56.7% of the sample have experience "3 – Less than 6 year", 26.7% of the
sample have experience "6- less than 10 years " and 12.2% of the sample have
experience "10 years and more", this clarifies that the majority of the respondents
have good experience. It also reflects that the results are based on practical
experience by the respondents.
Table (5.5): Years of experience at Forex
Years of experience at Forex Frequency Percent
Less than 3 year 4 4.4
3 – Less than 6 year 51 56.7
6- less than 10 years 24 26.7
10 years and more 11 12.2
Total 90 100.0

88
5.2.6 The size of trading
Table No. (5.6) shows that 37.8% of the sample invest amount "from 10000-
50000$", 32.2% of the sample invest amount " from 1000-10000$", 12.2% of the
sample invest amount "more than 100000$", 11.1% of the sample invest amount
"From 50000-100000$" and 6.7% of the sample invest amount" less than 1000$",
this is due to the investment in Forex markets is more secure when trading with
higher amounts as the trader can open transactions without hesitation or fear and put
acceptable stop loss and also this is linked to the financial ability of trader.
Table (5.6): The size of trading
The size of trading Frequency Percent
Less than 1000$ 6 6.7
from 1000-10000$ 29 32.2
from 10000-50000$ 34 37.8
From 50000-100000$ 10 11.1
more than 100000$ 11 12.2
Total 90 100.0
5.3 Analysis for each field
5.3.1 Technical analysis
5.3.1.1 The investors understanding of the rules and principals of technical
analysis.

89
Table (5.7): Means and Test values for “The investors understanding of the
rules and principals of technical analysis”
Item
Mea
n
S.D
Pro
port
ion
al
mea
n
(%)
Tes
t valu
e
P-v
alu
e (S
ig.)
Ran
k
1. To what extent the technical analysis
depends on comparing between current
market movement and past market
movement.
4.42 0.69 88.44 19.65 0.000* 2
2. In technical analysis we prepare charts
that contain all information related to
trade (price, volume and date of trading)
which help in identifying the direction of
prices accurately.
4.41 0.76 88.22 17.55 0.000* 3
3. The technical analyst focuses on trying to
discover the past pattern of price
movement and the current pattern to
predict the price in the future.
4.33 0.62 86.67 20.47 0.000* 4
4. The procedure of technical analysis is
made by standing on the movement of
Elliot waves which are considered the
base of modern technical analysis was
built on.
"The idea of Elliot waves is based on that
every growth process is followed by
recession process and the opposite .there
are five waves in the market called pay
waves and three waves in the other side –
after the end of the first five waves –
called corrector waves"
3.71 0.94 74.22 7.18 0.000* 8
5. To what extent the technical indicators
contribute in the confirmation of the
market direction and price movement
beside to charts.
3.60 0.73 72.00 7.78 0.000* 9
6. Investors make their decisions after the
confirm of market direction .trend tends
to continuant until the opposite is proved.
3.90 0.56 78.00 15.20 0.000* 5
7. In the technical analysis we follow-up the
forces of supply and demand as they are
the only ones responsible for determining
the direction of price movement.
3.73 0.76 74.67 9.14 0.000* 7
8. In technical analysis we take into 3.90 0.56 78.00 15.20 0.000* 5
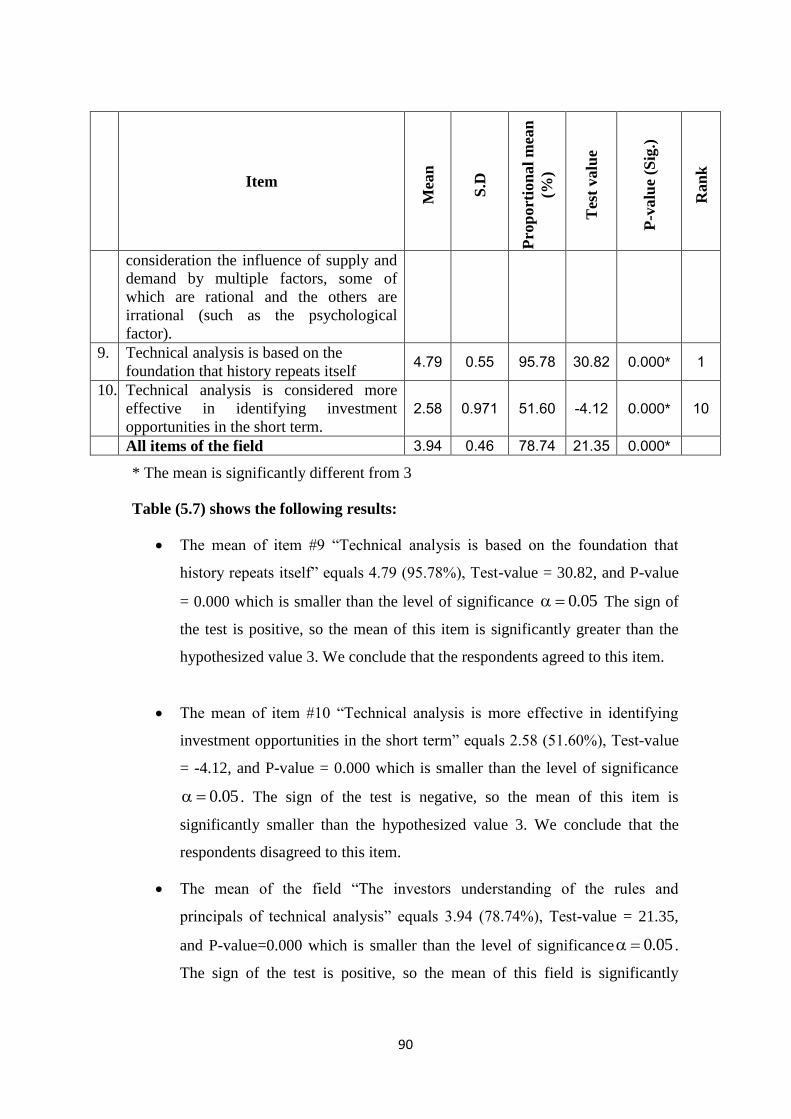
90
Item
Mea
n
S.D
Pro
port
ion
al
mea
n
(%)
Tes
t valu
e
P-v
alu
e (S
ig.)
Ran
k
consideration the influence of supply and
demand by multiple factors, some of
which are rational and the others are
irrational (such as the psychological
factor).
9. Technical analysis is based on the
foundation that history repeats itself 4.79 0.55 95.78 30.82 0.000* 1
10. Technical analysis is considered more
effective in identifying investment
opportunities in the short term.
2.58 0.971 51.60 -4.12 0.000* 10
All items of the field 3.94 0.46 78.74 21.35 0.000*
* The mean is significantly different from 3
Table (5.7) shows the following results:
The mean of item #9 “Technical analysis is based on the foundation that
history repeats itself” equals 4.79 (95.78%), Test-value = 30.82, and P-value
= 0.000 which is smaller than the level of significance 0.05 The sign of
the test is positive, so the mean of this item is significantly greater than the
hypothesized value 3. We conclude that the respondents agreed to this item.
The mean of item #10 “Technical analysis is more effective in identifying
investment opportunities in the short term” equals 2.58 (51.60%), Test-value
= -4.12, and P-value = 0.000 which is smaller than the level of significance
0.05 . The sign of the test is negative, so the mean of this item is
significantly smaller than the hypothesized value 3. We conclude that the
respondents disagreed to this item.
The mean of the field “The investors understanding of the rules and
principals of technical analysis” equals 3.94 (78.74%), Test-value = 21.35,
and P-value=0.000 which is smaller than the level of significance 0.05 .
The sign of the test is positive, so the mean of this field is significantly

91
greater than the hypothesized value 3. We conclude that the respondents
agreed to field of "The investors understanding of the rules and principals of
technical analysis".
The study concluded the followings:
The previous result clarifies that the respondents understand the rules and
principals of technical analysis. This is because that technical analysis is
indispensable when trading in financial markets where we cannot consider any trader
as an expert when he/she doesn't understand the basics of technical analysis. This
result agreed with the results of (Douglas, 2001) and with (Nolte and Konstanz,
2006) which indicated that in order to excel in the Forex markets, trader must be
aware of the principles and rules of technical analysis.
5.3.1.2 The investors dependence on technical analysis when making an
investment decision
Table (5.8): Means and Test values for “The investors' dependence on technical
analysis when making an investment decision”
Item
Mea
n
S.D
Pro
port
ion
al
mea
n
(%)
Tes
t valu
e
P-v
alu
e (S
ig.)
Ran
k
1. I use technical analysis to determine
the times of entry and exit from the
market
2.78 0.88 55.56 -2.38 0.010* 4
2. To what extent technical analysis is
considered one of the objective bases
for trading in currency market so we
cannot ignore it.
4.04 0.65 80.89 15.20 0.000* 1
3. I can understand and read a lot of
pricing models 3.82 0.59 76.44 13.18 0.000* 2
4. I use the technical indicators as a
helping tool to in confirming the price
trend
3.76 0.78 75.11 9.15 0.000* 3
5. I get most of my queries about the
market trend through technical
analysis only
1.83 0.84 36.67 -13.21 0.000* 6
6. I can determine the expected price 1.56 0.56 31.11 -24.33 0.000* 8

92
Item
Mea
n
S.D
Pro
port
ion
al
mea
n
(%)
Tes
t valu
e
P-v
alu
e (S
ig.)
Ran
k
depending on fundamental analysis
only, without the need of technical
analysis
7. The dependence of technical analysis
alone leads to a rational investment
decision
1.79 0.83 35.78 -13.88 0.000* 7
8. To what extent the achieved yield
when depending on technical analysis
only is considered higher than the
achieved yield when depending on
other types of analysis.
1.84 0.82 36.89 -13.37 0.000* 5
All items of the field 2.68 0.44 53.56 -6.88 0.000*
* The mean is significantly different from 3
Table (5.8) shows the following results:
The mean of item #2 “To what extent technical analysis is considered one of
the objective bases for trading in currency market so we cannot ignore it”
equals 4.04 (80.89%), Test-value = 15.20 and P-value = 0.000 which is
smaller than the level of significance 0.05 . The sign of the test is
positive, so the mean of this item is significantly greater than the
hypothesized value 3. We conclude that the respondents agreed to this item.
The mean of item #6 “I can determine the expected price depending on
fundamental analysis only, without the need of technical analysis” equals
1.56 (31.11%), Test-value = -24.33, and P-value = 0.000 which is smaller
than the level of significance 0.05 . The sign of the test is negative, so the
mean of this item is significantly smaller than the hypothesized value 3. We
conclude that the respondents disagreed to this item.
The mean of the field “The investors dependence on technical analysis when
making an investment decision” equals 2.68 (53.56%), Test-value = -6.88,
and P-value=0.000 which is smaller than the level of significance 0.05 .
The sign of the test is negative, so the mean of this field is significantly

93
smaller than the hypothesized value 3. We conclude that the respondents
disagreed to field of “The investors' dependence on technical analysis when
making an investment decision".
The study concluded the followings:
The respondent "experts" use technical analysis when they make the
investment decision because technical analysis is consider one of the objective bases
for trading in currency market they cannot ignore it from one side, but from the other
side they don't use it alone without considering the fundamental analysis because that
will lead to lower returns or until loss. This result agreed with the results of (Suresh
A.S, 2013) and with (Omrane and Heinen, 2004) which indicated that it is wrong to
use technical analysis without fundamental analysis and vice versa.
5.3.1 Fundamental analysis
5.3.1.1. The investors understanding of the rules and principals of
fundamental analysis.
Table (5.9): Means and Test values for “The investors understanding of the
rules and principals of fundamental analysis”
Item
Mea
n
S.D
Pro
port
ion
al
mea
n
(%
)
Tes
t valu
e
P-v
alu
e (S
ig.)
Ran
k
1. To what extent fundamental analysis
depends on following-up important
economic news which affects the currency
that I deal with.
4.47 0.80 89.33 17.48 0.000* 1
2. Brokerage firm uses the economic calendar
that’s clarifying the news that likely affects
the currency value and the importance of
these effects immediately.
4.44 0.75 88.89 18.24 0.000* 2
3. Fundamental analyst focuses on the
following-up of important economic news
that makes substantial fluctuations in the
value of the currency (such as interest
rates, unemployment rates and labor force
rate).
4.39 0.71 87.78 18.45 0.000* 3

94
Item
Mea
n
S.D
Pro
port
ion
al
mea
n
(%
)
Tes
t valu
e
P-v
alu
e (S
ig.)
Ran
k
4. Fundamental analyst makes his decision by
comparing the current reading with
previous reading and the expected reading
for the economic indicator.
4.02 1.02 80.44 9.54 0.000* 7
5. To what extent fundamental analysis
depends on the study of the macro
economy and on the principle that a
currency is a mirror of the strength or
weakness of the economy. When the
economy is strong then the currency value
is strong and vice versa.
4.24 0.93 84.89 12.72 0.000* 4
6. To what extent fundamental analysis
measures the strength of the economy
through economic statistics are called
economic indicators, each of them
expresses for one sector or group of sectors
of the economy.
4.22 0.97 84.44 11.97 0.000* 5
7. Fundamental analyst adopts a
comprehensive study for all the indicators
and available information to predict the
direction of the currency accurately
because the economy may grow partially
in one sector and deteriorating in the last
sector.
4.08 0.72 81.56 14.15 0.000* 6
8. One of the cons of fundamental analysis is
having a lot of economic indicators that
could confuse Investors.
3.26 0.80 65.11 3.03 0.002* 9
9. A lot of profitable transactions take place
before or after a few minutes from a major
economic statement.
3.71 0.77 74.22 8.78 0.000* 8
10. Fundamental analysis is more effective in
identifying investment opportunities in the
long term.
2.39 0.73 47.80 -7.95 0.000* 10
All items of the field 3.92 0.58 78.44 16.86 0.000*
* The mean is significantly different from 3

95
Table (5.9) shows the following results:
The mean of item #1 “To what extent fundamental analysis depends on
following-up important economic news which affects the currency that I deal
with” equals 4.47 (89.33%), Test-value = 17.48, and P-value = 0.000 which is
smaller than the level of significance 0.05 . The sign of the test is
positive, so the mean of this item is significantly greater than the
hypothesized value 3. We conclude that the respondents agreed to this item.
The mean of item #10 “Fundamental analysis is more effective in identifying
investment opportunities in the long term” equals 2.39 (47.80%), Test-value
= -7.95, and P-value = 0.000 which is smaller than the level of significance
0.05 . The sign of the test is negative, so the mean of this item is
significantly smaller than the hypothesized value 3 . We conclude that the
respondents disagreed to this item.
The mean of the field “The investors understanding of the rules and
principals of fundamental analysis” equals 3.92 (78.44%), Test-value =
16.86, and P-value=0.000 which is smaller than the level of significance
0.05 . The sign of the test is positive, so the mean of this field is
significantly greater than the hypothesized value 3. We conclude that the
respondents agreed to field of “The investors understanding of the rules and
principals of fundamental analysis ".
The study concluded the followings:
The previous result clarifies that the respondents understand the rules and
principals of fundamental analysis. This is because that fundamental analysis is
indispensable when trading in financial markets where we cannot consider any trader
as an expert when he/she doesn't understand the basics of fundamental analysis. This
result agreed with the results of (Douglas, 2001) and with (Nolte and Konstanz,
2006) which indicated that in order to excel in the currency markets, trader must be
aware of the principles and rules of fundamental analysis.

96
5.3.1.2.The investor's dependence on technical analysis when making an
investment decision
Table (5.10): Means and Test values for “The investor's dependence on
technical analysis when making an investment decision”
Item
Mea
n
S.D
Pro
port
ion
al
mea
n
(%
)
Tes
t valu
e
P-v
alu
e (S
ig.)
Ran
k
1. I use fundamental analysis to determine the
times of entry and exit from the market 2.81 0.82 56.22 -2.19 0.016* 4
2. To what extent fundamental analysis is
considered one of the objective bases for
trading in currency market so we cannot
ignore it.
4.04 0.72 80.89 13.81 0.000* 1
3. I can understand and read a lot of
important economic indicators that affect
the value of the currency.
3.80 0.62 76.00 12.21 0.000* 2
4. I use the economic calendar as a helping
tool in following-up the important
information that may affects the currency
value directly and knowing its importance
and the probability of its effect.
3.79 0.59 75.78 12.68 0.000* 3
5. I get most of my queries about the market
trend through fundamental analysis only 1.74 0.66 34.89 -17.97 0.000* 6
6. I can determine the expected price
depending on technical analysis only,
without the need of fundamental analysis
1.69 0.80 37.80 -15.50 0.000* 7
7. The dependence on fundamental analysis
alone leads to a rational investment
decision
1.62 0.73 32.44 -17.96 0.000* 8
8. To what extent the achieved yield when
depending on fundamental analysis only is
considered higher than the achieved yield
when depending on other types of analysis.
1.89 0.76 37.78 -13.94 0.000* 5
All items of the field 2.67 0.50 53.45 -5.14 0.000*
* The mean is significantly different from 3
Table (5.10) shows the following results:
The mean of item #2 “To what extent fundamental analysis is considered one
of the objective bases for trading in currency market so we cannot ignore it”

97
equals 4.04 (80.89%), Test-value = 13.81, and P-value = 0.000 which is
smaller than the level of significance 0.05 . The sign of the test is
positive, so the mean of this item is significantly greater than the
hypothesized value 3 . We conclude that the respondents agreed to this item.
The mean of item #7 “The dependence on fundamental analysis alone leads
to a rational investment decision” equals 1.62 (32.44%), Test-value = -17.96,
and P-value = 0.000 which is smaller than the level of significance 0.05 .
The sign of the test is negative, so the mean of this item is significantly
smaller than the hypothesized value 3. We conclude that the respondents
disagreed to this item.
The mean of the field “The investors dependence on technical analysis when
making an investment decision” equals 2.67 (53.45%), Test-value = -5.14,
and P-value=0.000 which is smaller than the level of significance 0.05 .
The sign of the test is negative, so the mean of this field is significantly
smaller than the hypothesized value 3. We conclude that the respondents
disagreed to field of “The investors' dependence on technical analysis when
making an investment decision ".
The study concluded the followings:
The respondent "experts" use fundamental analysis when they make the
investment decision because fundamental analysis is consider one of the objective
bases for trading in currency market they cannot ignore it from one side, but from the
other side they don't use it alone without considering the technical analysis because
that will lead to lower returns or until loss. This result agreed with the results of
(Suresh A.S, 2013) and with (Omrane and Heinen, 2004) which indicated that it is
wrong to use fundamental analysis without technical analysis and vice versa.
5.3.1.3.The investors understanding to the importance of combining between
technical and fundamental analysis and their dependence on it.

98
Table (5.11): Means and Test values for “The investors understanding to the
importance of combining between technical and fundamental analysis and their
dependence on it”
Item
Mea
n
S.D
Pro
port
ion
al
mea
n
(%
)
Tes
t valu
e
P-v
alu
e (S
ig.)
Ran
k
1. To what extent we can say that successful
investor is the one who combines between
technical and fundamental analysis when
making an investment decision.
4.29 0.60 85.78 20.24 0.000* 1
2. To what extent we can say that successful
investor is the one who studies
fundamental analysis to find out the reason
of market move and studies technical
analysis to know the effects of released
economic news.
4.22 0.61 84.44 18.88 0.000* 2
3. I can accurately determine the direction of
the market by following up the economic
news when it released and their impact on
the supply and demand forces.
3.81 0.52 76.22 14.88 0.000* 5
4. Most analysts in the financial markets
using technical analysis and fundamental
analysis in determining the direction of the
market and the expected price.
3.79 0.73 75.78 10.30 0.000* 6
5. I combine between technical and
fundamental analysis to determine the
times of entry and exit from the market
3.74 0.89 74.89 7.90 0.000* 8
6. I prefer the investment decision made by
combining between technical and
fundamental analysis
4.06 0.84 81.11 11.93 0.000* 4
7. Rational investment decision is the one
depending on technical analysis only. 1.34 0.81 26.89 -19.40 0.000* 10
8. Rational investment decision is the one
depending on the fundamental analysis
only.
1.28 0.60 25.56 -27.22 0.000* 11
9. I get most of my queries about the market
trend through combining between technical
and fundamental analysis.
3.79 0.89 75.78 8.38 0.000* 6
10. I can determine the expected price
depending on a combining between
technical and fundamental analysis.
3.68 0.92 73.56 6.97 0.000* 9

99
Item
Mea
n
S.D
Pro
port
ion
al
mea
n
(%
)
Tes
t valu
e
P-v
alu
e (S
ig.)
Ran
k
11. To what extent the achieved yield when
combining between technical and
fundamental analysis is considered higher
than the achieved yield when depending on
one type of analysis with the negligence of
another.
4.22 0.79 84.44 14.68 0.000* 2
All items of the field 3.47 0.45 69.49 9.95 0.000*
* The mean is significantly different from 3
Table (5.11) shows the following results:
The mean of item #1 “To what extent we can say that successful investor is
the one who combines between technical and fundamental analysis when
making an investment decision” equals 4.29 (85.78%), Test-value = 20.24,
and P-value = 0.000 which is smaller than the level of significance 0.05 .
The sign of the test is positive, so the mean of this item is significantly
greater than the hypothesized value 3. We conclude that the respondents
agreed to this item.
The mean of item #8 “Rational investment decision is the one depending on
the fundamental analysis only” equals 1.28 (25.56%), Test-value = -27.22,
and P-value = 0.000 which is smaller than the level of significance 0.05 .
The sign of the test is negative, so the mean of this item is significantly
smaller than the hypothesized value 3. We conclude that the respondents
disagreed to this item.
The mean of the field “The investors understanding to the importance of
combining between technical and fundamental analysis and their dependence
on it” equals 3.47 (69.49%), Test-value = 9.95, and P-value=0.000 which is
smaller than the level of significance 0.05 . The sign of the test is
positive, so the mean of this field is significantly greater than the
hypothesized value 3. We conclude that the respondents agreed to field of

100
“The investors understanding to the importance of combining between
technical and fundamental analysis and their dependence on it".
The study concluded the followings:
The respondent "experts" combine between fundamental and technical
analysis when they make the investment decision because they consider combining
between two types the best way to achieve acceptable returns and avoid losses. This
result agreed with the results of (Mattar, 2014) and with (Mendelsohn, 2010) which
indicated that the best way for trading in the financial markets through combine
between fundamental and technical analysis.
5.4 Research Hypothesis
Hypothesis # 1:
Table (5.12): Hypothesis#1 "The investor's understanding of the rules and
principals of technical and fundamental analysis affects significantly on the
investors decision"
Hypothesis
Mea
n
S.D
Pro
port
ion
al
mea
n
(%
)
Tes
t valu
e
P-v
alu
e (S
ig.)
The investors' understanding of the rules
and principals of technical and
fundamental analysis affects significantly
on the investors decision
3.37 0.31 67.40 11.53 0.000*
* The mean is significantly different from 3
Table (5.12) shows that the mean equals 3.37 (67.40%), Test-value = 11.53,
and P-value=0.000 which is smaller than the level of significance 0.05 . The sign
of the test is positive, so the mean is significantly greater than the hypothesized value
3. We conclude that the respondents agreed of "The investors' understanding of the

101
rules and principals of technical and fundamental analysis affects significantly on the
investors decision".
This result agreed with what (Suresh A.S, 2013) and with (Douglas, 2001).
The previous results indicated that the understanding of the rules and principals of
technical and fundamental analysis helps the investors to make their transaction
regarding to sell or buy, time of entry and exit, invested amount, and to put the take
profit and stop loss orders, so this will help them to making a good investment.
Hypothesis # 2:
Table (5.13): Hypothesis#2 "There are statistically significant relationships
between combining technical analysis and fundamental analysis, and making
the rational investment decision"
Hypothesis
Mea
n
S.D
Pro
port
ion
al
mea
n
(%
)
Tes
t valu
e
P-v
alu
e (S
ig.)
There are statistically significant
relationships between combining technical
analysis and fundamental analysis, and
making the rational investment decision
3.47 0.45 69.49 9.95 0.000*
* The mean is significantly different from 3
Table (5.13) shows that the mean equals 3.47 (69.49%), Test-value = 9.95,
and P-value=0.000 which is smaller than the level of significance 0.05 . The sign
of the test is positive, so the mean is significantly greater than the hypothesized value
3. We conclude that the respondents agreed of “There are statistically significant
relationships between combining technical analysis and fundamental analysis, and
making the rational investment decision ".
This result agreed with what (Mendelsohn, 2010) and with (Brooks, 2013).
The previous results indicated that the best way to trading Forex through
combining between technical and fundamental analysis to achieve acceptable return
and to avoid risk.

102
Hypothesis # 3:
Table (5.14): Hypothesis#3 "The achieved yield when combining between
technical analysis and fundamental analysis is better than the achieved yield
when depending on random investment"
Hypothesis
Mea
n
S.D
Pro
port
ion
al
mea
n
(%
)
Tes
t valu
e
P-v
alu
e (S
ig.)
The achieved yield when combining
between technical analysis and
fundamental analysis is better than the
achieved yield when depending on random
investment
4.22 0.79 84.44 14.68 0.000*
* The mean is significantly different from 3
Table (5.14) shows that the mean equals 4.22 (84.44%), Test-value = 14.68,
and P-value=0.000 which is smaller than the level of significance 0.05 . The sign
of the test is positive, so the mean is significantly greater than the hypothesized value
3. We conclude that the respondents agreed of “The achieved yield when combining
between technical analysis and fundamental analysis is better than the achieved yield
when depending on random investment ".
This result agreed with what (King, Osler and Rime, 2011) and with (Lechner
and Nolte, 2007).
The previous results indicated that to trade well, investor must follow a good
strategy instead of random trading because of random trading lead to big loss and get
out from the market, moreover the result indicated also that the best way to achieve
acceptable return and avoid loss through combining between technical and
fundamental analysis when making an investment decision.
Hypothesis # 4:
Table (5.15):Hypothesis#4 "The achieved yield when combining between
technical analysis and fundamental analysis is better than the achieved yield
when depending on one type of analysis with the negligence of another"

103
Hypothesis
Mea
n
S.D
Pro
port
ion
al
mea
n
(%
)
Tes
t valu
e
P-v
alu
e (S
ig.)
The achieved yield when combining
between technical analysis and
fundamental analysis is better than the
achieved yield when depending on one
type of analysis with the negligence of
another
4.13 0.79 82.60 13.53 0.000*
* The mean is significantly different from 3
Table (5.15) shows that the mean equals 4.13 (82.60%), Test-value = 13.53,
and P-value =0.000 which is smaller than the level of significance 0.05 . The sign
of the test is positive, so the mean is significantly greater than the hypothesized value
3. We conclude that the respondents agreed of “The achieved yield when combining
between technical analysis and fundamental analysis is better than the achieved yield
when depending on one type of analysis with the negligence of another".
This result agreed with what (Avramov, Kaplanski and Levy, 2015) and with
(Kulkarni K and Kulkarni G, 2013).
The previous results indicated that the best way to trading Forex through
combining between technical and fundamental analysis to achieve acceptable return
and to avoid risk, it's better than depending on one type of analysis and negligence of
another.

104
Chapter 6
Conclusions and
Recommendations

105
Chapter Six
Conclusions and Recommendations
6.1. Introduction:
This chapter included the most important conclusions which have addressed
the impact of combining between technical analysis and fundamental on the
investors' decision at Forex market. In addition, this chapter showed the most
important proposed recommendations which may enhance the effectiveness of
investment decision in order to increase the ability of investors to follow a strategy
that help them in making a good transaction with acceptable returns.
6.2. Conclusions:
6.2.1. Field of technical analysis:
1. Technical analysis is considered one of the objective bases for trading in currency
market so we cannot ignore it, and for successful investment, investor must realize
the principles and rules of technical analysis.
2. Technical indicators are used as helping tools in confirming the price trend.
3. We can't get most of queries about the market trend through technical analysis
only, so we can't determine the expected price depending on technical analysis
alone.
4. We can't achieve acceptable return and avoid losses when depending on technical
analysis only, so the dependence of technical analysis alone doesn't lead to a
rational investment decision.
7.2.2. Field of fundamental analysis:
1. Fundamental analysis is considered one of the objective bases for trading in
currency market so we cannot ignore it, and for successful investment, investor
must realize the principles and rules of technical analysis.
2. Economic calendar is used as a helping tool in following-up the important
information that may affects the currency value directly and knowing its
importance and the probability of its effect.

106
3. We can't get most of queries about the market trend through fundamental analysis
only, so we can't determine the expected price depending on fundamental analysis
alone.
4. We can't achieve acceptable return and avoid losses when depending on
fundamental analysis only, so the dependence of technical analysis alone doesn't
lead to a rational investment decision.
7.2.3. Field of combining between technical and fundamental analysis:
1. Successful investor is the one who combines between technical and fundamental
analysis when making an investment decision.
2. We can accurately determine the direction of the market by following up the
economic news when it released and their impact on the supply and demand
forces.
3. We can get most of queries about the market trend through combining between
technical and fundamental analysis, so we can determine the expected price
depending on combining between technical and fundamental analysis.
4. The best way to determine the times of entry and exit from the market through
combining between technical and fundamental analysis.
5. We can achieve acceptable return and avoid losses when depending on
combining between technical and fundamental analysis, so the dependence of
combining between technical and fundamental analysis lead to a rational
investment decision.

107
6.3 Recommendation:
1. The importance of understanding and awareness of the rules and principals of
technical and fundamental analysis, as trading without understanding and
awareness of these rules and principles consider a random trading that often leads
to big losses.
2. In order to avoid a big loss and exit from the market, we should not neglect the
technical and fundamental analysis as well as avoiding the random trading.
3. Avoid trading with few amounts of money because of the large fluctuations that
occur in these markets.
4. The best time to enter and exit from the market after the release of important
economic news and the confirmation of market direction.
5. There is no particular type of analysis considered the best when we invest in the
short term or in the long term. The best way to invest in the short term or in the
long term through combining between two type of analysis.
6. The best way to determine the time of enters and exit from the market through
combining between two types of analysis.
7. The best way to determine the expected price accurately through combining
between two types of analysis.
8. The best way to achieve acceptable returns through combining between two types
of analysis.
9. The best way to get most queries about the market trend through combining
between technical and fundamental analysis.
10. The best way to make a rational investment decision through combining between
technical and fundamental analysis.

108
6.4 Further Studies:
1. The impact of psychological factor on investors’ decision at Forex market.
2. Preparing applied study that showing the effect of combination between technical
and fundamental analysis on the decision of investors at Forex markets. The study
sample (beginners investors)
3. The impact of amount invested on investors’ decision at Forex market.
4. The impact of time of entry and exit from the market on investors’ decision at
Forex market.

109
References

110
References:
Abu EL-Taif, N. (2011). The impact of technical analysis on the traders' decisions in
the Stock Exchange of Palestine. Palestine: the Islamic university of Gaza.
Aronson, D. (2006). Evidence-Based Technical Analysis. (1st ed.). Hoboken, New
Jersey: John Wiley and Sons.
Avramov, D., Kaplanski, G., & Levy, H. (2015). A study entitled "Talking Numbers:
Technical versus Fundamental Recommendations". Israel: The Hebrew
University of Jerusalem.
Barnes, R. (2011). Economic Indicators: Beige Book. Invesetopedia. From:
investopedia.com.
BIS Triennial Central Bank Survey. (2010). Foreign exchange and derivatives
market activity in April 2010. Switzerland: Basel.
Brooks, K. (2013). A simple approach to trading foreign exchange using
fundamental and technical analysis. U.K: Harriman House.
Burke, M., & Nava, J. (2011). Trading Forex with TradeStation. United States:
Tradestation.
Cartwright M, (2012). Trade in Ancient Greece. Ancient history encyclopedia. From:
http://www.ancient.eu/article/115/.
Chen, J. (2009). Essentials of Foreign Exchange Trading. (2nd
ed.). New Jersey: John
Wiley & Sons.
Cheng, G. (2011). 7 Winning strategies for trading Forex. (1st ed.). U.K: Harriman
House Ltd.
Clarke, J., & Gershon, M. (2001). "The efficient markets hypothesis,” Expert
Financial Planning: Advice from Industry Leaders. New York: Wiley & Sons.
Costa, N. (2003). The Problems with Fundamental Analysis. From:
http://Marketmasters.com.
Douglas, M. (2001). Trading in the Zone. (1st ed.). New Jersey: Prentice Hall Press.

111
Eugene, F. (1970). Efficient Capital Markets: A Review of Theory and Empirical
Work. The Journal of Finance, pp.383-417.
Evans, M., & Lyons, R. (2005). Exchange rate fundamentals and order flow. USA:
Georgetown University.
Flassbeck, H., & La Marca, M. (2009). Global imbalances and destabilizing
speculation. J. Bus. Finance. Econ. Emerging Econ, 4(2), 149-196.
Gabriele, G., & Michael, M. (2004)."Why has FX trading surged? Explaining the
2004 triennial survey". Switzerland: Basel. Bank for International Settlements.
George, D., & Mallery, P. (2006). SPSS for Windows Step by Step. A Simple Guide
and Reference. USA: Boston. Allyn and Bacon.
Gomez, C. (2010). Financial Markets, Institutions, and Financial Services. India:
PHI Learning.
Henry, C. & Thode, J. (2002). Testing for Normality. New York: Marcel Dekker, Inc.
Ickes, B. (2006). The Foreign Exchange Market. USA: University Bulletin.
Irwin, S., & Park, C. (2007). "What Do We Know About the Profitability of
Technical Analysis?" Journal of Economic Surveys, 25(2),786–826.
Janssen, C., Langager, C., & Murphy, C. (2006). Technical Analysis tutorial.
Invesetopedia. From: investopedia.com.
Janssen, C., Langager, C., & Murphy, C. (2010). Introduction to Fundamental
Analysis. Invesetopedia. From: investopedia.com.
Janssen C, Langager C and Murphy C (2010). The Forex Market Tutorial. A division
of valueclick Inc. Invesetopedia. From: investopedia.com.
Janssen, C., Langager, C., & Murphy, C. (2010). The resource for investing and
personal finance education. Invesetopedia. From: investopedia.com.
Janssen, C., Langager, C., & Murphy, C. (2011). Basics of Technical Analysis.
Invesetopedia. From: investopedia.com.
Jensen, M. (1978). Some Anomalous Evidence Regarding Market Efficiency.
Journal of Financial Economics, 6(2/3), 95-101.

112
Justin, G. (2015). Males and females. Wall Street journal, pp.12-15.
King, M., Osler, C., & Levy, D. (2012). The market microstructure approach to
foreign exchange: Looking back and looking forward. Journal of International
Money and Finance. 38(13), 95–119.
King, M., Osler, C., & Rime, D. (2011). Foreign exchange market structure, players
and evolution. Oslo: Norges Bank.
Kulkarni, K., & Kulkarni, G. (2013). Fundamental analysis VS. Technical analysis: a
choice of sectoral analysis. Belgaum: Gogte Institute of Technology.
Kumar, P. (2015). Overview on Technical Analysis. Article. From:
http://articles.economictimes.indiatimes.com.
Lechner, S., & Nolte, I. (2007). Customer trading in the foreign exchange market
empirical evidence from an internet trading platform. Germany: University of
Konstanz.
Levinson, M. (2006). Guide to financial markets (4th edition). NY: Bloomberg
Press.
Lien, K. (2005). How to trade Forex on news releases. Invesetopedia. From:
investopedia.com.
Liu, H. (2009). News profiteer’s guide to fundamental news trading. Book. From:
https://www.Newsprofiteer.com.
Mattar, N. (2014). Combining fundamental and technical analysis. Article. From:
https://www.www.ig.com.
Mcdonald, M. (2011). Forex simplified behind the scenes of currency trading. (2nd
ed.). USA: Marketplace Books.
Meltzer, A. (2010). A History of the Federal Reserve. Journal of Monetary
Economics, volume (2), University of Chicago Press.
Mendelsohn, L. (2010). It's Time to Combine Fundamental and Technical Analysis
for a Total Game Plan. Article. Form: https://www.tradertech.com.
Nassirtoussi, A., Wah, T., & Ngo, D. (2011). A novel forex prediction methodology
based on fundamental data. Malaysia: University of Malaya.
113
Neely, C. (1997). Technical Analysis in the Foreign Exchange Market: A Layman’s
Guide. Wall Street Journal, 79(5).
Neely, C., & Weller, P. (2011). Technical Analysis in the Foreign Exchange Market.
USA: University of Iowa.
Neely, C., Weller, P., & Dittmar, R. (1997). Is Technical Analysis in the Foreign
Exchange Market Profitable? A Genetic Programming Approach. USA: Federal
Reserve Bank.
Newman, V., Potter, C., & Wright, M. (2011). Foreign Exchange Market
Intervention". Australia: Reserve Bank of Australia.
Nison, S. (2001). Japanese Candlestick Charting Techniques. (2nd
ed.). New York:
institute of finance.
Nison, S. (1994). Beyond Candlesticks: New Japanese Charting Techniques
Revealed. New York: institute of finance.
Nolte, I. (2006). Retail investors’ trading behavior in the foreign exchange market a
panel duration approach. Germany: University of Konstanz.
Omrane, B., & Heinen, A. (2004). The Foreign Exchange Quoting Activity as an
Informative Signal. Canada: Brock University.
Pakira, S. (2015). Understanding the casual association of exchange rate of the
Pound Sterling and Yen on Indian Rupee. International Journal in Management
and Social Science. 3(12), 1784-2321.
Pasche, R. (2014). Understanding Forex Trade Sizes. Article. From:
http://www.dailyfx.com.
Prechter, R., & Wayne, P. (2007). The Financial/Economic Dichotomy in Social
Behavioral Dynamics: The Socionomic Perspective. Journal of Behavioral
Finance.8(2), 84-108.
Pugsley, J. (2012). What Are The Key Differences Between Trading Forex And
Shares? Article. From: http://www.Mahifx.com.
Record, N. (2003). Currency overlay. (1st ed.). Atlanta: Clean Earth Books.

114
Rime, D. (2003). New Electronic Trading Systems in the Foreign Exchange Markets.
(2nd
ed.). San Diego: Academic Press.
Samuelson, P. (1965). Proof that Properly Anticipated Prices Fluctuate Randomly:
Industrial Management Review. USA: Massachusetts institute of technology
Shaheen, A., & Saqer, A. (2010). The impact of using the strong Japanese candles
model on investment decisions at Forex Trading - An Empirical Study. Palestine:
the Islamic university of Gaza.
Sumiya, M. (2012). A History of Japanese Trade and Industry Policy. U.K: Oxford
University.
Suresh, A.S. (2013). A study on fundamental and technical analysis. International
journal of marketing, financial services & management research. 2(5).
Taylor, M. (2014). Forty Years, Thirty Currencies and 21,000 Trading Rules: A
Large-scale, Data-snooping Robust Analysis of Technical Trading in the Foreign
Exchange Market. Hong Kong: University of Hong Kong.
Venkatesh, C., & Tyagi, M. (2011). Technical analysis and its usage in Indian capital
markets: A survey. Bangladesh research publications journal. 7(1), 46-54.
Villamar, L. (2011). 5 Differences between Forex Trading and Stock Trading.
Article. From: http://www.Ibtimes.com.
Vital, P. (2006). A Guided Tour of the Market Microstructure Approach to Exchange
Rate Determination. Italy: D’Annunzio University.
Wagner, J. (2012). Interest Rates and the FX Market. Article. From:
www.dailyfx.com.

115
APPENDIX

116
APPENDIX (A)
Questionnaire Arbitrators
No. Name University
1. Dr. Faris Abu Mouamer Islamic University of Gaza
2. Dr. Wael Aldaya Islamic University of Gaza
3. Dr. Hamdy Zourb Islamic University of Gaza
4. Dr. Ali Shaheen Islamic University of Gaza
5. Dr. Yaser AL Shorafa Islamic University of Gaza
6. Dr. Mohammed Fares Al- Azhar University - Gaza
7. MR. Ali Sunallah Statistics Expert at Alpha For Statistical Analysis

117
APPENDIX (B)
English Questionnaire
Islamic University of Gaza
Deanship of Graduate Studies
Faculty of Commerce
Department of Business Administration
Dear Mrs. /Mr.
Subject / Filling a questionnaire
This questionnaire aims to collect data for preparing a Master thesis entitled "The
impact of combining between fundamental and technical analysis on the decision of
investors at the currency market (FOREX)". The study focuses on the investors at
currency markets with different level of their experience.
I kindly ask you to fill out the present questionnaire neutrality and accurately. Each
section contains a set of paragraphs .Your cooperation supports the success of this
study, finds a succeed trading strategy that maximizes profits, and reduces losses. It
is important to notice that the information gathered in the questionnaire will be used
for scientific research purposes only.
Thank you for your cooperation.
Researcher
Yousef Atef Ahmed

118
Section l: General Information:
1- Gender:
Male Female
2- Age:
From 20-30 years from 30-40 years from 40-50
50 and above
3- Specialization………………………
4- Practical Qualification:
Diploma or less Bachelor Graduate studies
5- years of experience at FOREX :
Less than 3 years 3 to less than 6 years 6 to less than
10 years 10 years and more
6- The size of trading:
Less than 1000$ from 1000-10000 from 10000-
50000$
From 50000-100000$ more than 100000$

119
Section II: Technical analysis
Assessment is from (5) to (1) , in which (5) indicates the highest
extent of accuracy while ( 1 ) the lowest one.
No. Paragraph Assessme
nt (1-5)
First: The investors understanding of the rules and principals of technical analysis
1. To what extent the technical analysis depends on comparing between current market
movement and past market movement.
2. In technical analysis we prepare charts that contain all information related to trade
(price, volume and date of trading) which help in identifying the direction of prices
accurately.
3. The technical analyst focuses on trying to discover the past pattern of price movement
and the current pattern to predict the price in the future.
4. The procedure of technical analysis is made by standing on the movement of Elliot
waves which are considered the base of modern technical analysis was built on.
"The idea of Elliot waves is based on that every growth process is followed by
recession process and the opposite .there are five waves in the market called pay waves
and three waves in the other side –after the end of the first five waves –called corrector
waves"
5. To what extent the technical indicators contribute in the confirmation of the market
direction and price movement beside to charts.
6. Investors make their decisions after the confirm of market direction .trend tends to
continuant until the opposite is proved.
7. In the technical analysis we follow-up the forces of supply and demand as they are the
only ones responsible for determining the direction of price movement.
8. In technical analysis we take into consideration the influence of supply and demand by
multiple factors, some of which are rational and the others are irrational (such as the
psychological factor).
9. Technical analysis is based on the foundation that history repeats itself
10. Technical analysis is more effective in identifying investment opportunities in the short
term.
Second: The investors dependence on technical analysis when making an investment decision
11. I use technical analysis to determine the times of entry and exit from the market
12. To what extent technical analysis is considered one of the objective bases for trading in
currency market so we cannot ignore it.
13. I can understand and read a lot of pricing models
14. I use the technical indicators as a helping tool to in confirming the price trend
15. I get most of my queries about the market trend through technical analysis only
16. I can determine the expected price depending on fundamental analysis only, without
the need of technical analysis
17. The dependence of technical analysis alone leads to a rational investment decision
18. To what extent the achieved yield when depending on technical analysis only is
considered higher than the achieved yield when depending on other types of analysis.

120
Section III: Fundamental analysis
No. Paragraph Response
(1-5)
First: The investors understanding of the rules and principals of fundamental analysis
1. To what extent fundamental analysis depends on following-up important economic news
which affects the currency that I deal with.
2. Brokerage firm uses the economic calendar that’s clarifying the news that likely affects the
currency value and the importance of these effects immediately.
3. Fundamental analyst focuses on the following-up of important economic news that makes
substantial fluctuations in the value of the currency (such as interest rates, unemployment rates
and labor force rate).
4. Fundamental analyst makes his decision by comparing the current reading with previous
reading and the expected reading for the economic indicator.
5. To what extent fundamental analysis depends on the study of the macro economy and on the
principle that a currency is a mirror of the strength or weakness of the economy. When the
economy is strong then the currency value is strong and vice versa.
6. To what extent fundamental analysis measures the strength of the economy through economic
statistics are called economic indicators, each of them expresses for one sector or group of
sectors of the economy.
7. Fundamental analyst adopts a comprehensive study for all the indicators and available
information to predict the direction of the currency accurately because the economy may grow
partially in one sector and deteriorating in the last sector.
8. One of the cons of fundamental analysis is having a lot of economic indicators that could
confuse Investors.
9. A lot of profitable transactions take place before or after a few minutes from a major economic
statement.
10. Fundamental analysis is more effective in identifying investment opportunities in the long
term.
Second: The investors dependence on technical analysis when making an investment decision
11. I use fundamental analysis to determine the times of entry and exit from the market
12. To what extent fundamental analysis is considered one of the objective bases for trading in
currency market so we cannot ignore it.
13. I can understand and read a lot of important economic indicators that affect the value of the
currency.
14. I use the economic calendar as a helping tool in following-up the important information that
may affects the currency value directly and knowing its importance and the probability of its
effect.
15. I get most of my queries about the market trend through fundamental analysis only
16. I can determine the expected price depending on technical analysis only, without the need of
fundamental analysis
17. The dependence on fundamental analysis alone leads to a rational investment decision
18. To what extent the achieved yield when depending on fundamental analysis only is considered
higher than the achieved yield when depending on other types of analysis.

121
Section IIII: combining between technical and fundamental analysis
No. Paragraph Response
(1-5)
The investors understanding to the importance of combining between technical and
fundamental analysis and their dependence on it.
1. To what extent we can say that successful investor is the one who combines between
technical and fundamental analysis when making an investment decision.
2. To what extent we can say that successful investor is the one who studies fundamental
analysis to find out the reason of market move and studies technical analysis to know
the effects of released economic news.
3. I can accurately determine the direction of the market by following up the economic
news when it released and their impact on the supply and demand forces.
4. Most analysts in the financial markets using technical analysis and fundamental
analysis in determining the direction of the market and the expected price.
5. I combine between technical and fundamental analysis to determine the times of entry
and exit from the market
6. I prefer the investment decision made by combining between technical and
fundamental analysis
7. Rational investment decision is the one depending on technical analysis only.
8. Rational investment decision is the one depending on the fundamental analysis only.
9. I get most of my queries about the market trend through combining between technical
and fundamental analysis.
10. I can determine the expected price depending on a combining between technical and
fundamental analysis.
11. To what extent the achieved yield when combining between technical and fundamental
analysis is considered higher than the achieved yield when depending on one type of
analysis with the negligence of another.

122
APPENDIX (C)
Arabic Questionnaire
بسم هللا الرحمن الرحيم
األخ/ت حفظه/ا اهلل
السالم عليكم ورحمة اهلل وبركاته,,,
الموضوع/ طلب تعبئة استبيان
الجمع بين "أثر تهدف هذه االستبانة لجمع البيانات لغرض إعداد رسالة ماجستير بعنوان وتستهدف ",التحليل األساسي والتحليل الفني على قرار المستثمرين في أسواق العمالت
المستثمرين في أسواق العمالت باختالف مستويات خبراتهم.الدراسة
منكم التكرم بتعبئة هذه االستبانة آمال توخي الدقة والموضوعية, حيث أن تعاونك سيكون افأرجو وايجاد استراتيجية تداول فعالة تعظم األرباح وتقلل من مستوى هذا البحث سببًا في نجاح
, علمًا بأن المعلومات الواردة في هذه االستبانة ستستخدم ألغراض الخسائر ألكبر قدر ممكن البحث العلمي فقط.
شاكرين لكم حسن استجابتكم وتعاونكم معنا
الباحث
يوسف عاطف أحمد
زةـغ –الجامعة االسالمية ــاــات العـليـــعمـادة الدراس
ـــــارةـــــــة التجــــــــــــــــــــــكليــــ ـــالــــــــــــــــقســم إدارة األعـم

123
األول: بيانات عامة: القسم
الجنس: -1
ذكر أنثى
العمر: -2
فما فوق 50 50 أقل من –40 40أقل من – 30 سنة 30أقل من – 20
...........................العملي: التخصص -3
المؤهل العملي: -4
دبلوم فأقل بكالوريوس دراسات عليا
عدد سنوات التداول في أسواق العمالت: -5
سنوات 10 10أقل من -3 6أقل من -3سنوات 3أقل من
فأكثر
حجم التداول بالدوالر: -6
50000-1000من 10000-1000من 1000أقل من
100000أكثر من 50000-1000من

124
التحليل الفني القسم الثاني: .جدا الصغيرة الموافقة ( تمثل1والدرجة ) ,جدا الكبيرة الموافقة ( تمثل5الدرجة ) أن (, حيث1( وحتى )5من ) الدرجة
التقييم الفقرة الرقم(1-5)
إدراك المستثمر لمبادئ وقواعد التحليل الفنيأواًل: .مقارنة تحركات السوق الحالية مع تحركات السوق في السابقيعتمد التحليل الفني على إلى أي درجة .1في التحليل الفني يتم اعداد رسومات بيانية تحوي جميع المعلومات المعلومات الخاصة بالتداول .2
)أسعار وأحجام وتاريخ التداول(, إذ تساعد هذه الرسوم في تحديد اتجاهات األسعار بدقة.
يركز المحلل الفني على محاولة اكتشاف نمط من حركة السعر في السابق وحركة السعر الحالي لتوقع .3 ما سيكون عليه السعر في المستقبل.
ي بني عليه التحليل الفني الحديث.تعتبر امواج إليوت األساس الذ .4 5وهي عبارة عن "تقوم فكرة أمواج إليوت على أن كل عملية ازدهار يتبعها عملية ركود والعكس
موجات في التجاه المعاكس بعد انتهاء الخمس 3موجات في اتجاه السوق تسمى موجات الدفع و موجات األولى وتسمى الموجات التصحيحية"
إلى أي درجة تساهم المؤشرات التقنية في تأكيد اإلتجاه وحركة األسعار إلى جانب الرسومات البيانية. .5 .إلى اإلستمرار حتى يثبت العكساإلتجاه يميل إذ اتجاه السوقبمجرد تأكيد يصنع المستثمر قرراه .6 في التحليل الفني يتم متابعة قوى العرض والطلب باعتبارها الوحيدة المسؤولة عن تحديد اتجاه حركة السعر. .7 رشيدعوامل متعددة، بعضها بالعرض والطلب في التحليل الفني يجب األخذ بعين اإلعتبار تأثر .8
)مثل العامل النفسي(. والبعض اآلخر غير رشيد )كفاءة السوق مثال(
.يقوم التحليل الفني على أساس أن التاريخ يعيد نفسه .9 في تحديد فرص اإلستثمار على المدى القصيرمن التحليل األساسي يعتبر التحليل الفني أكثر فعالية .10 على التحليل الفني عند صنع قرار اإلستثمار المستثمر اعتمادثانيًا:
أستخدم التحليل الفني في تحديد أوقات الدخول والخروج من السوق. .11 إلى أي درجة يعتبر التحليل الفني من األسس الموضوعية للتداول في أسواق العمالت بحيث ال يمكن اإلستغناء عنه. .12 أستطيع فهم وقراءة الكثير من النماذج السعرية. .13 .أستخدم المؤشرات الفنية كأدوات مساعدة في تأكيد اتجاه السعر .14 .أحصل على معظم استفساراتي الخاصة باتجاه السوق من خالل التحليل الفني فقط .15 .الحاجة للتحليل الفنيأستطيع تحديد السعر المتوقع باإلعتماد على التحليل األساسي فقط دون .16 دون الحاجة للتحليل األساسي. استخدام التحليل الفني بمفرده يقود إلى قرار استثمار رشيد .17أعلى من العوائد المحققة عند اإلعتماد د على التحليل الفني بمفرده هي العوائد المحققة عند اإلعتما .18
على األنواع األخرى للتحليل.
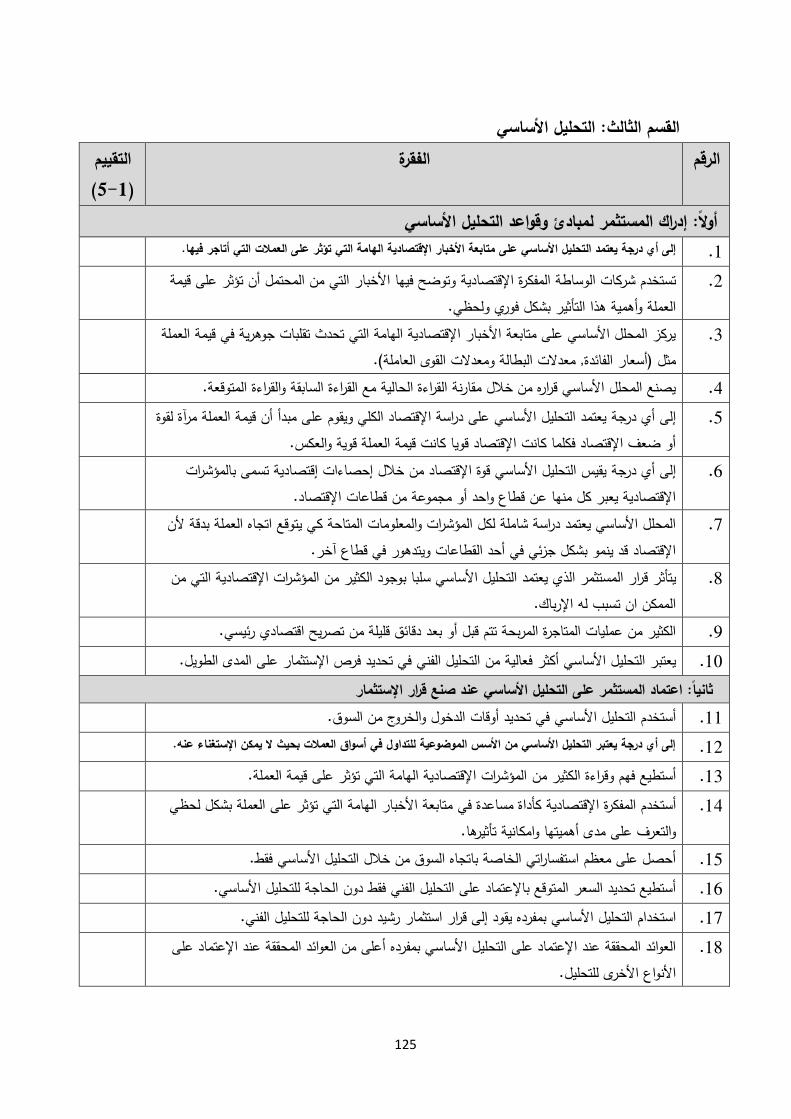
125
التحليل األساسي :لثالقسم الثا التقييم الفقرة الرقم
(1-5) إدراك المستثمر لمبادئ وقواعد التحليل األساسيأواًل: متابعة األخبار اإلقتصادية الهامة التي تؤثر على العمالت التي أتاجر فيها.إلى أي درجة يعتمد التحليل األساسي على .1وتوضح فيها األخبار التي من المحتمل أن تؤثر على قيمة تستخدم شركات الوساطة المفكرة اإلقتصادية .2
العملة وأهمية هذا التأثير بشكل فوري ولحظي.
يركز المحلل األساسي على متابعة األخبار اإلقتصادية الهامة التي تحدث تقلبات جوهرية في قيمة العملة .3 مثل )أسعار الفائدة, معدالت البطالة ومعدالت القوى العاملة(.
يصنع المحلل األساسي قراره من خالل مقارنة القراءة الحالية مع القراءة السابقة والقراءة المتوقعة. .4يعتمد التحليل األساسي على دراسة اإلقتصاد الكلي ويقوم على مبدأ أن قيمة العملة مرآة لقوة إلى أي درجة .5
وية والعكس. أو ضعف اإلقتصاد فكلما كانت اإلقتصاد قويا كانت قيمة العملة ق
يقيس التحليل األساسي قوة اإلقتصاد من خالل إحصاءات إقتصادية تسمى بالمؤشرات إلى أي درجة .6 اإلقتصادية يعبر كل منها عن قطاع واحد أو مجموعة من قطاعات اإلقتصاد.
العملة بدقة ألن المحلل األساسي يعتمد دراسة شاملة لكل المؤشرات والمعلومات المتاحة كي يتوقع اتجاه .7 اإلقتصاد قد ينمو بشكل جزئي في أحد القطاعات ويتدهور في قطاع آخر.
لتي من وجود الكثير من المؤشرات اإلقتصادية اسلبا بالتحليل األساسي يتأثر قرار المستثمر الذي يعتمد .8 الممكن ان تسبب له اإلرباك.
.د دقائق قليلة من تصريح اقتصادي رئيسيالكثير من عمليات المتاجرة المربحة تتم قبل أو بع .9 .في تحديد فرص اإلستثمار على المدى الطويلمن التحليل الفني يعتبر التحليل األساسي أكثر فعالية .10 عند صنع قرار اإلستثمار األساسيثانيًا: اعتماد المستثمر على التحليل
في تحديد أوقات الدخول والخروج من السوق. األساسيأستخدم التحليل .11 إلى أي درجة يعتبر التحليل األساسي من األسس الموضوعية للتداول في أسواق العمالت بحيث ال يمكن اإلستغناء عنه. .12 . المؤشرات اإلقتصادية الهامة التي تؤثر على قيمة العملةأستطيع فهم وقراءة الكثير من .13متابعة األخبار الهامة التي تؤثر على العملة بشكل لحظي مساعدة في اإلقتصادية كأداةأستخدم المفكرة .14
والتعرف على مدى أهميتها وامكانية تأثيرها.
.فقط األساسيأحصل على معظم استفساراتي الخاصة باتجاه السوق من خالل التحليل .15 األساسي.فقط دون الحاجة للتحليل الفنيأستطيع تحديد السعر المتوقع باإلعتماد على التحليل .16 دون الحاجة للتحليل الفني. بمفرده يقود إلى قرار استثمار رشيد األساسياستخدام التحليل .17أعلى من العوائد المحققة عند اإلعتماد على األساسي بمفرده العوائد المحققة عند اإلعتماد على التحليل .18
األنواع األخرى للتحليل.

126
الجمع بين التحليل الفني والتحليل األساسي :الرابعالقسم التقييم الفقرة الرقم
(1-5) إدراك المستثمر ألهمية الجمع بين التحليل الفني والتحليل األساسي واعتماده على ذلك
المستثمر الناجح هو الذي يجمع بين التحليل الفني والتحليل األساسيإلى إي درجة يمكن القول بأن .1 .عند صنع قرار اإلستثمار
لمعرفة المستثمر الناجح يدرس التحليل األساسي لمعرفة سبب تحرك السوق ويدرس التحليل الفني .2 اآلثار المترتبة على األخبار اإلقتصادية الصادرة.
أستطيع تحديد اتجاه السوق بدقة من خالل متابعة األخبار اإلقتصادية فور صدورها وأثرها على قوى .3 العرض والطلب.
معظم المحللين في األسواق المالية يستخدموا التحليل الفني إلى جانب التحليل األساسي في تحديد .4 اتجاه السوق والسعر المتوقع
أجمع بين التحليل األساسي والتحليل الفني في تحديد أوقات الدخول والخروج من السوق. .5 األساسي.التحليل من خالل الجمع بين التحليل الفني و أفضل قرارات اإلستثمار هي التي تكون .6 . فقطقرار اإلستثمار الرشيد يصنع من خالل اإلعتماد على التحليل الفني .7 . فقط األساسيقرار اإلستثمار الرشيد يصنع من خالل اإلعتماد على التحليل .8والتحليل الفني بين التحليلالجمع أحصل على معظم استفساراتي الخاصة باتجاه السوق من خالل .9
األساسي
الفني والتحليل األساسي.التحليل الجمع بين أستطيع تحديد السعر المتوقع باإلعتماد على .10أعلى من العوائد المحققة عند والتحليل األساسي التحليل الفني الجمع بينالعوائد المحققة عند .11
. أحد أنواع التحليل دون اآلخراإلعتماد على

127
APPENDIX (D)
Correlation coefficient of each item of "The investors understanding of the rules
and principals of technical analysis" and the total of this field
No. Item Pearson
Correlation
Coefficient
P-
Value
(Sig.)
1. To what extent the technical analysis depends on
comparing between current market movement and
past market movement.
.694 0.000*
2. In technical analysis we prepare charts that contain
all information related to trade (price, volume and
date of trading) which help in identifying the
direction of prices accurately.
.682 0.000*
3. The technical analyst focuses on trying to discover
the past pattern of price movement and the current
pattern to predict the price in the future.
.741 0.000*
4. The procedure of technical analysis is made by
standing on the movement of Elliot waves which
are considered the base of modern technical
analysis was built on.
"The idea of Elliot waves is based on that every
growth process is followed by recession process
and the opposite .there are five waves in the market
called pay waves and three waves in the other side
–after the end of the first five waves –called
corrector waves"
.665 0.000*
5. To what extent the technical indicators contribute in
the confirmation of the market direction and price
movement beside to charts.
.783 0.000*
6. Investors make their decisions after the confirm of
market direction .trend tends to continuant until the
opposite is proved.
.605 0.000*
7. In the technical analysis we follow-up the forces of
supply and demand as they are the only ones
responsible for determining the direction of price
movement.
.509 0.000*
8. In technical analysis we take into consideration the
influence of supply and demand by multiple factors,
some of which are rational and the others are
irrational (such as the psychological factor).
.596 0.000*
9. Technical analysis is based on the foundation that
history repeats itself .607 0.000*
10. Technical analysis is more effective in identifying
investment opportunities in the short term. .591 0.000*
* Correlation is significant at the 0.05 level

128
APPENDIX (E)
Correlation coefficient of each item of "The investors dependence on technical
analysis when making an investment decision" and the total of this field
No. Item Pearson
Correlation
Coefficient
P-Value
(Sig.)
1. I use technical analysis to determine the
times of entry and exit from the market .591 0.000*
2. To what extent technical analysis is
considered one of the objective bases for
trading in currency market so we cannot
ignore it.
.287 0.003*
3. I can understand and read a lot of pricing
models .650 0.000*
4. I use the technical indicators as a helping
tool to in confirming the price trend .231 0.014*
5. I get most of my queries about the market
trend through technical analysis only .838 0.000*
6. I can determine the expected price depending
on fundamental analysis only, without the
need of technical analysis
.347 0.000*
7. The dependence of technical analysis alone
leads to a rational investment decision .847 0.000*
8. To what extent the achieved yield when
depending on technical analysis only is
considered higher than the achieved yield
when depending on other types of analysis.
.832 0.000*
* Correlation is significant at the 0.05 level

129
APPENDIX (F)
Correlation coefficient of each item of "The investors understanding of the rules
and principals of fundamental analysis" and the total of this field
No. Item
Pearson
Correlation
Coefficient
P-Value
(Sig.)
1. To what extent fundamental analysis depends on
following-up important economic news which affects
the currency that I deal with.
.595 0.000*
2. Brokerage firm uses the economic calendar that’s
clarifying the news that likely affects the currency
value and the importance of these effects immediately.
.909 0.000*
3. Fundamental analyst focuses on the following-up of
important economic news that makes substantial
fluctuations in the value of the currency (such as
interest rates, unemployment rates and labor force
rate).
.885 0.000*
4. Fundamental analyst makes his decision by comparing
the current reading with previous reading and the
expected reading for the economic indicator.
.815 0.000*
5. To what extent fundamental analysis depends on the
study of the macro economy and on the principle that
a currency is a mirror of the strength or weakness of
the economy. When the economy is strong then the
currency value is strong and vice versa.
.897 0.000*
6. To what extent fundamental analysis measures the
strength of the economy through economic statistics
are called economic indicators, each of them expresses
for one sector or group of sectors of the economy.
.925 0.000*
7. Fundamental analyst adopts a comprehensive study for
all the indicators and available information to predict
the direction of the currency accurately because the
economy may grow partially in one sector and
deteriorating in the last sector.
.779 0.000*
8. One of the cons of fundamental analysis is having a lot
of economic indicators that could confuse Investors. -.229 0.015*
9. A lot of profitable transactions take place before or
after a few minutes from a major economic statement. .584 0.000*
10. Fundamental analysis is more effective in identifying
investment opportunities in the long term. .671 0.000*
* Correlation is significant at the 0.05 level

130
APPENDIX (G)
Correlation coefficient of each item of "The investors dependence on technical
analysis when making an investment decision" and the total of this field
No. Item Pearson
Correlation
Coefficient
P-Value
(Sig.)
1. I use fundamental analysis to determine the times
of entry and exit from the market .659 0.000*
2. To what extent fundamental analysis is
considered one of the objective bases for trading
in currency market so we cannot ignore it.
.499 0.000*
3. I can understand and read a lot of important
economic indicators that affect the value of the
currency.
.673 0.000*
4. I use the economic calendar as a helping tool in
following-up the important information that may
affects the currency value directly and knowing
its importance and the probability of its effect.
.634 0.000*
5. I get most of my queries about the market trend
through fundamental analysis only .846 0.000*
6. I can determine the expected price depending on
technical analysis only, without the need of
fundamental analysis
.614 0.000*
7. The dependence on fundamental analysis alone
leads to a rational investment decision .762 0.000*
8. To what extent the achieved yield when
depending on fundamental analysis only is
considered higher than the achieved yield when
depending on other types of analysis.
.775 0.000*
* Correlation is significant at the 0.05 level

131
APPENDIX (H)
Correlation coefficient of each item of "The investors understanding to the
importance of combining between technical and fundamental analysis and their
dependence on it" and the total of this field
No. Item
Pearson
Correlation
Coefficient
P-Value
(Sig.)
1. To what extent we can say that successful investor is the
one who combines between technical and fundamental
analysis when making an investment decision.
.550 0.000*
2. To what extent we can say that successful investor is the
one who studies fundamental analysis to find out the
reason of market move and studies technical analysis to
know the effects of released economic news.
.745 0.000*
3. I can accurately determine the direction of the market by
following up the economic news when it released and
their impact on the supply and demand forces.
.737 0.000*
4. Most analysts in the financial markets using technical
analysis and fundamental analysis in determining the
direction of the market and the expected price.
.709 0.000*
5. I combine between technical and fundamental analysis to
determine the times of entry and exit from the market .861 0.000*
6. I prefer the investment decision made by combining
between technical and fundamental analysis .623 0.000*
7. Rational investment decision is the one depending on
technical analysis only. -.239 0.012*
8. Rational investment decision is the one depending on
the fundamental analysis only. .359 0.000*
9. I get most of my queries about the market trend through
combining between technical and fundamental analysis. .807 0.000*
10. I can determine the expected price depending on a
combining between technical and fundamental analysis. .838 0.000*
11. To what extent the achieved yield when combining
between technical and fundamental analysis is
considered higher than the achieved yield when
depending on one type of analysis with the negligence of
another.
.613 0.000*
* Correlation is significant at the 0.05 level


![No. 1[58]/2016 · Mirela ATANASIU, PhD Researcher Cristian BĂHNĂREANU, PhD Senior Researcher Cristina BOGZEANU, PhD Researcher ... Case Study: Russia – Western World. ... terrain](https://img.pdfslide.net/doc/110x75/5e9355de713da969aa54a1f0/no-1582016-mirela-atanasiu-phd-researcher-cristian-bhnreanu-phd-senior.jpg)