Embed Size (px)
Citation preview
NBER WORKING PAPER SERIES
THE IMPACT OF COMPARATIVE EFFECTIVENESS RESEARCH ON HEALTHAND HEALTH CARE SPENDING
Anirban BasuTomas J. Philipson
Working Paper 15633http://www.nber.org/papers/w15633
NATIONAL BUREAU OF ECONOMIC RESEARCH1050 Massachusetts Avenue
Cambridge, MA 02138January 2010
Dr. Basu acknowledges support from a research grant from the National Institute of Mental Health,1R01MH083706 – 01. Dr Philipson acknowledges support from the Stigler Center for Study of TheEconomy and The State at The University of Chicago as well as The National Pharmaceutical Council.We also a thankful for comments from Steve Parente and seminar participants of the 2009 AnnualHealth Economics Meeting, The University of Chicago, Rice University, University of Houston, andThe Wharton School. The statements, findings, conclusions, views, and opinions contained and expressedin this article are based in part on data obtained under license from the following IMS Health Incorporatedinformation service(s): National Disease and Therapeutic Index™ (2003-2008), IMS Health Incorporated.All Rights Reserved. The statements, findings, conclusions, views, and opinions contained and expressedherein are those of the authors and do not necessarily reflect the views of IMS Health Incorporatedor any of its affiliated or subsidiary entities, University of Chicago or the National Bureau of EconomicResearch.
© 2010 by Anirban Basu and Tomas J. Philipson. All rights reserved. Short sections of text, not toexceed two paragraphs, may be quoted without explicit permission provided that full credit, including© notice, is given to the source.
The Impact of Comparative Effectiveness Research on Health and Health Care SpendingAnirban Basu and Tomas J. PhilipsonNBER Working Paper No. 15633January 2010JEL No. I0,I1,I11,I18
ABSTRACT
Public subsidization of technology assessments in general, and Comparative Effectiveness Research(CER) in particular, has received considerable attention as a tool to simultaneously improve patienthealth and lower the cost of health care. However, little conceptual and empirical understanding existsconcerning the quantitative impact of public technology assessments such as CER. This paper analysesthe impact of CER on health and medical care spending interpreting CER to shift the demand for sometreatments at the expense of others. We trace out the spending and health implications of such demandshifts in private- as well as subsidized health care markets. In contrast to current wisdom, our analysisimplies that CER may well increase spending and adversely affect patient health, particularly whentreatment effects are heterogeneous across patients. We simulate these economic effects for antipsychoticsthat are among the largest drug classes of the US Medicaid program and for which CER has been conductedby means of the CATIE trial in 1999. Using conservative estimates, we find that if Medicaid wouldhave eliminated coverage for the least cost-effective treatments of the CATIE trial then under homogeneouseffects, it would save about 90% of the $1.3B Medicaid class sales annually in non-elderly adult patientwith schizophrenia. However, taking into account the observed heterogeneity in treatment effects,it would incur a loss of health valued annually at about 98% of class spending and thus a net loss ofabout 8% of annual class spending.
Anirban BasuSection of of Hospital MedicineDepartment of MedicineUniversity of Chicago5841 S. Maryland AvenueMC-2007, AMD B226CChicago, IL 60637and [email protected]
Tomas J. PhilipsonIrving B. Harris Graduate Schoolof Public Policy StudiesThe University of Chicago1155 E 60th StreetChicago, IL 60637and [email protected]
Section 1: Introduction
The debate about the appropriate role of public technology assessments has a long history in the
US.1 More recently, as both private and public payers attempt to improve the efficiency of
health care spending, comparative effectiveness research (CER) has been offered as a potential
solution. The rationale for CER is to generate better evidence about what works and does not
work in health care and to thereby improve the productivity of health care spending through
improved patient outcomes at lower spending levels. (FCCCER Report 2009; IOM 2009)
Moreover, recent public subsidization of CER through the 2009 American Recovery and
Reinvestment Act (ARRA) has raised awareness and funding for CER.
Although CER has been positioned as a means to improve health and potentially lower costs,
little is understood about how exactly this will take place and how CER as it is practiced
currently, will translate into different health care decisions. Indeed, despite the importance of
comparative effectiveness research in the policy debate, there has been little explicit and
quantitative analysis of the potential impact of CER on health or medical care spending. Given
this lack of understanding of the consequences of CER, the purpose of this paper is to attempt to
provide a framework to quantitatively evaluate the effects of CER. Such a framework is needed
to identify relevant designs and studies of CER and also to estimate whether the costs of
investments in CER are outweighed by their benefits.
The paper may be outlined as follows. Section 2 specifies the economic context in which we
analyze the impact of public technology assessments such as CER. We interpret the evidence
generated by public subsidies for CER to raise the demand of some treatments at the expense of
others. Section 3 considers the health- and costs implications of such demand shifts induced by
CER in a private market. Section 4 analyzes these impacts in a subsidized market where the
treatments that fare better under CER are the ones that receive better coverage, e.g. through less
formulary restrictions, changes in prior authorization requirements, or lower co-pays.
1 They date back at least to the 1970s with the National Center for Health Services Research and the US Congress Office of Technology Assessment.
Section 5 discusses the impacts of such CER-responsive coverage decisions when there is
heterogeneity in treatment effects. An important issue here is that CER may favor one treatment,
deemed “the best” by some summary statistic, even though the best treatment varies across
patients. Heterogeneity is necessary but not sufficient for welfare losses from product-specific
reimbursement responses to CER. Rather, what’s central is negative dependence across
treatments; a patient may not respond to a reimbursed “winner” of CER study but may respond
to a non-reimbursed “loser”.
Overall, our main conclusions from the conceptual analysis is that CER has indeterminate
effects on spending and patient health and, under natural assumptions on how markets respond to
new quality information, may even adversely affect both. Among the factors that govern the
health and spending impact of CER are the price-elasticity of supply of treatments as well as the
evidence-elasticity of demand.
Section 6 provides an illustrative empirical simulation for antipsychotic drugs. This drug class is
among the top spending classes covered by Medicaid and there has been considerable interest in
the comparative effectiveness issues surrounding them. This is partly due to the 1999 CATIE
trial that found that second generation therapies were equally effective as first-generation
therapies. Following the release of this study, a policy debate emerged around how Medicaid
coverage policy might respond. Many argued that Medicaid should preferentially subsidize first
generation over second generation treatments. Subsequent to the release of CATIE,
approximately 40% of the state-run Medicaid programs have instituted prior authorization
restrictions on some second generation drugs. Little is known about the quantitative health and
spending effects of such coverage proposals and policies. To better understand such effects, we
simulate the impact on health and spending for the counter-factual case of providing no coverage
for second generation antipsychotics2. We find that if Medicaid coverage policy had responded
to the CER results of CATIE to by limiting second generation use then under a standard
assumption of homogeneous treatment effects, it would save about 90% of class spending.
However, taking into account the observed heterogeneity in treatment effects, limiting access to
second generation drugs would incur a net loss valued at about 98% of class spending. Thus, for
2 This reimbursement response is inconsistent with current law, but our analysis is aimed at understanding the desirability of future policies and laws that may potentially those currently in place.
one the largest drug classes in one of the major health care subsidy programs, heterogeneity
alters not only the magnitude but also the sign of the effect reimbursement responses to CER
studies.
Lastly, section 7 concludes by discussing the future research and the policy implications our
analysis suggest. In particular, given the discussed problems with simplistic uses of CER as
commonly discussed, we discuss new research avenues on how more useful forms of CER may
be conducted.
Section 2: The Basic Framework
This section specifies the framework in which health and spending implications are analyzed and
estimated. There are two aspects to CER – one is the generation of comparative information
between two treatment alternatives. This is usually accomplished using randomized trials or
other appropriate evaluation methodologies that produces estimates of the treatment effects. The
second is the potential response by the market3 or public payers to this information affecting the
use or uptake of treatments in the population.
Consider two treatments with true treatment effects q=(q1,q2) which we interpret as product
qualities. For example, these two treatments may be first-and second generation treatments for a
given clinical condition. The beliefs over the unknown levels of quality for the two treatments
are specified as F=F(q1,q2) before the CER and F’=F’(q1,q2) after the CER . Throughout, un-
primed quantities denote variables, functions or levels prior to the CER and the primed quantities
denote the corresponding items after the CER. The demand functions for the two treatments are
given by D1 and D2 and depend on the perceived qualities through F as well as prices. For
example, demand functions may be governed by the expected quality levels given the evidence.
We consider the impact that CER has not only on the evidence of quality of products but also on
market prices and quantities. We let Y=(Y1, Y2) and P=(P1,P2) denote the equilibrium quantities
and prices of the two treatments. The total spending S and health outcomes Q in this class of
3 Such responses may include the shift in physician practices and behaviors.
treatments for the condition are determined by the use of both the treatments and their average
cost-effectiveness is determined by their ratio
( )( )
1 1 2 2
1 1 2 2
+=
+Y P Y PS
Q Y q Y q
CER has two possible effects on market outcomes. First, it may generate evidence that changes
quality beliefs and shifts demand and second may thereby affect equilibrium prices and
quantities observed. The CER changes the average health outcome according to
( ) ( )1 1 1 2 2 2′ ′Δ = − + −Q Y Y q Y Y q
Regardless of the perceived health benefits of the treatments, this states that the true quality level
determines the actual health impact. Thus, the true quality differences and quantity changes
complement each other in determining the overall health impact of CER so that equilibrium
responses matter more when there are big quality differences.
The CER changes overall spending on the two treatments according to
( ) ( )1 1 2 2 1 1 2 2′ ′ ′ ′Δ = + − +S Y P Y P Y P Y P
There are thus two ways in which CER may affect spending. One is to through substitution
across treatments and the other is through changes in equilibrium prices. Although CER is
typically concerned with only evaluating effectiveness of treatments, it naturally has
consequences for the cost-effectiveness of treatments through affecting both the health and
spending patterns in equilibrium. More precisely, the impact of CER on cost-effectiveness is the
ratio of the increased spending and health impact, ∆S/ ∆Q. Cost-effectiveness of use is raised if
spending responds less than the levels of health and is lowered if spending responds much more
than health governed by price or quantity responses to the CER.
Section 3: Impact of CER in a Private Market
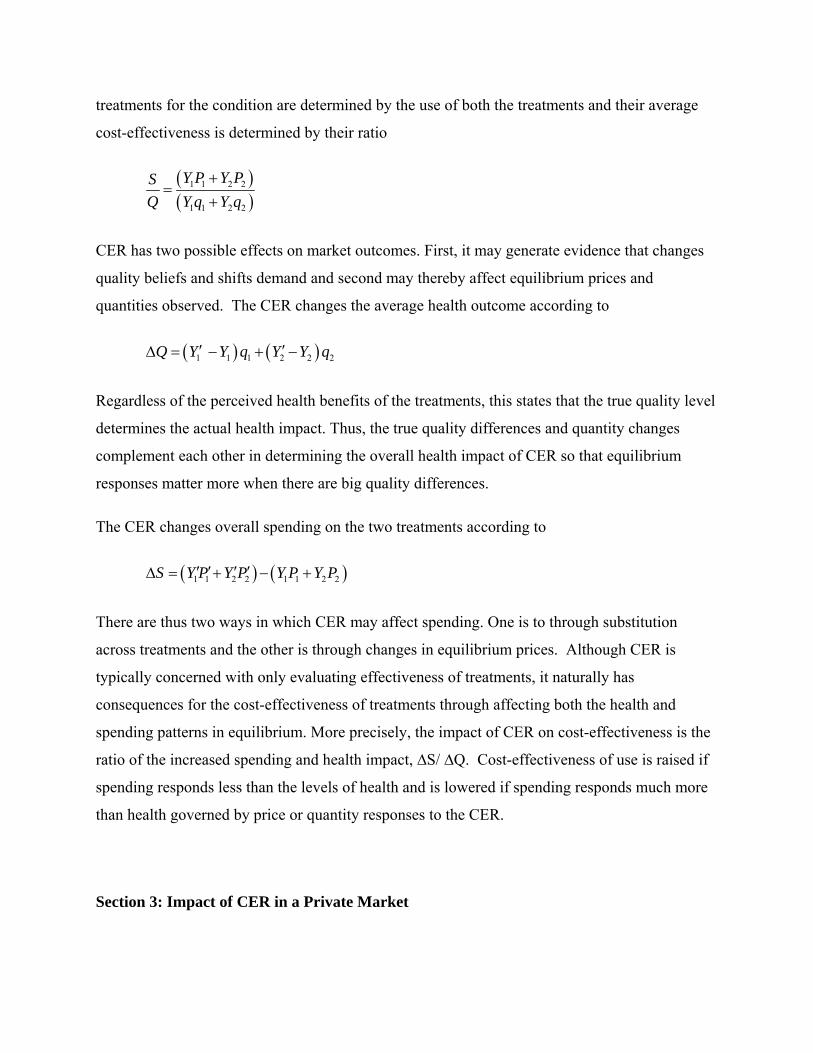
Consider first the implications of CER in a private and competitive market, although our analysis
carries over to non-competitive market structures. As illustrated in Figure 1 we assume that,
without loss of generality, the demand for the superior (first) product shifts weakly outward and
the demand for the inferior (second) product shifts weakly inward as a consequence of the CER;
D’1≥D1 and D’2≤D2. Moreover, we assume that the evidence of the CER is valid in the sense
that these demand shifts are consistent with true quality levels; q1≥q2. For illustrative purposes
only, the Figure concerns the case when both the demand and supply curves prior to the CER
coincide.
Figure 1: Demand shifts associated with CER
The supply functions of the two products are not assumed to be affected by the CER but
determined by the costs of production of the two treatments. An outward (inward) shift in
demand holding supply constant raises (lowers) both the equilibrium quantity and price. In other
words, for the superior treatment 1 its price and quantity rises as opposed to for the inferior
treatment 2 for which they fall
1 1′≥P P & 2 2′ ≤P P and 1 1′≥Y Y & 2 2′ ≤Y Y
By standard arguments, when demand for the two products shifts in response to the evidence
generated by the CER, the equilibrium quantities and prices that result will “trace out” the supply
curve as in the Figure above. Thus, the impact of CER on health and spending are not merely
driven by how sensitive demand is to the evidence generated by the CER but more importantly
how responsive supply is to price.
Now consider the health and spending implications of these market responses to CER. As both
quantity and price rise for the superior treatment, it follows directly that spending on the superior
treatment rises. By analog arguments, spending on the inferior treatment falls. The impact on
overall spending, ∆S, is thus indeterminate as it may rise or fall dependent on whether the
positive spending effect of the superior treatment dominates the negative spending effect of the
inferior treatment. However, the overall health effect is clearly positive, ∆Q≥0, as long as the
evidence of the CER is valid. This is because quantity is raised for the superior treatment and
lowered for the inferior second treatment. The magnitude of the health effect induced by CER is
determined by the price-elasticities of supply.
To illustrate, consider the example when demand and supply for a treatment is linear D(p)=a(F)-
bp and S(p)=c+dp where the demand is shifted by the treatment beliefs by assuming the intercept
is a function of the beliefs F. The equilibrium quantity that equates demand and supply is then
given by
( )( )+=
+
a F d cbY
b d
This implies the CER induces a change in quantity for each treatment given by
( ) ( )( )' ⎛ ⎞′− = − ⎜ ⎟+⎝ ⎠dY Y a F a F
b d
If a change in the beliefs F shifts the demand through raising (lowering) the intercept a(F) for
the first (second) treatment then the impact on health, ∆Q, is governed to a large extent on how
sensitive supply is to price, d. For example, it is generally true that in the standard long-run case
of an infinitely elastic industry supply, corresponding to free entry, then there are no price-effects
from CER. For example, this may be the case for markets for generic drugs or the market for
procedures that are not patentable. In this case, ∆Y converges to a(F)-a(F’) above as d goes to
infinity so that the impact on health and spending is driven only through quantity effects induced
by how sensitive demand is to the evidence generated by the CER.
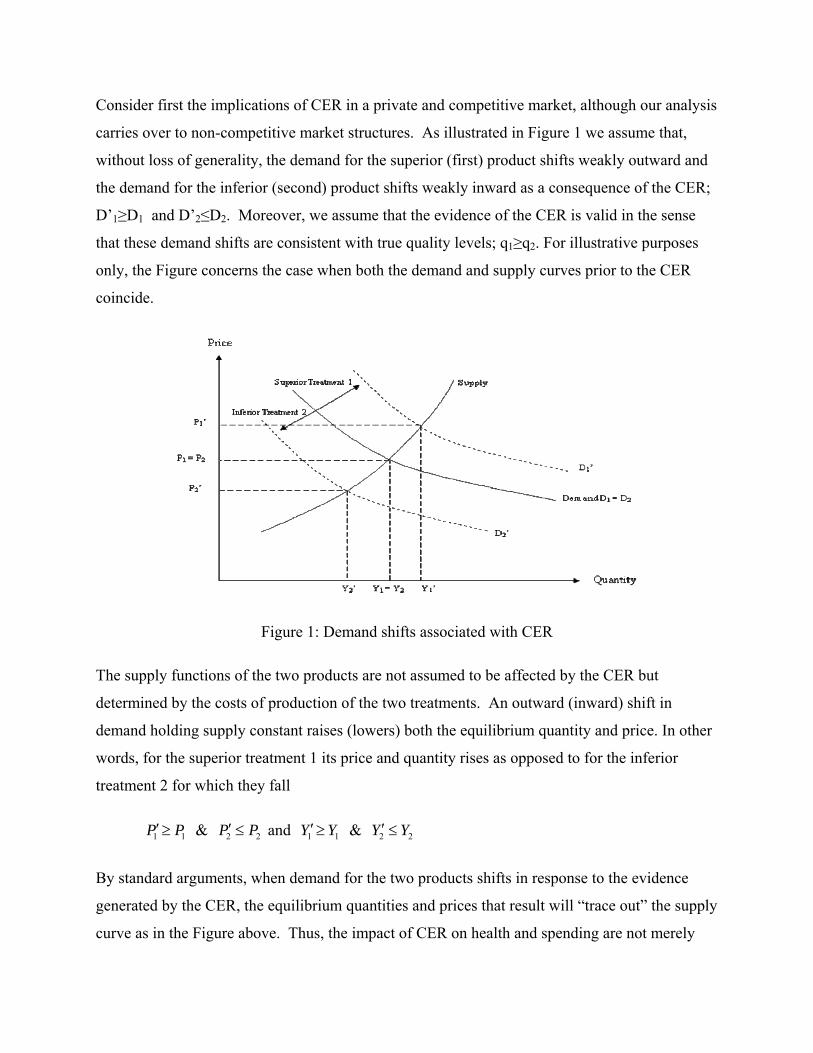
Section 4: Impact of CER in Subsidized Market
In most countries, health care markets are subsidized thereby separating supply-prices received
by sellers and demand prices paid by patients. For example, the US government through the
Medicare and Medicaid program pays manufacturers and providers at prices above the co-pays
of those eligible for the programs. In a market subsidized at rate s, let the equilibrium quantity,
supply- and demand price for a treatment be denoted by Y (s), PS(s) and PD(s) as depicted in
Figure 2.
Price
Quantity
PS(s)
PS(0) = PD(0)
PD(s)
Y(0) Y(s)
Supply
Subsidys
Subsidy s’
Y’(s)
D1
D’1
Figure 2: Multiplier Effects of CER in a Subsidized Market
As illustrated in Figure 2, for a given market it is well known a rise in the subsidy s raises the
supply price, lowers the demand price, and raises the equilibrium quantity; dPS/ds ≥0, dPD/ds ≤0
, dY/ds≥0.
In a subsidized market, CER will impact health and spending not only through the demand shifts
discussed earlier but also through any changes in subsidy levels set by governments as a
consequence of the CER. For example, Medicare or Medicaid may expand coverage or
reimburse more heavily those treatments that did well in CER through lower co-pays, reduced
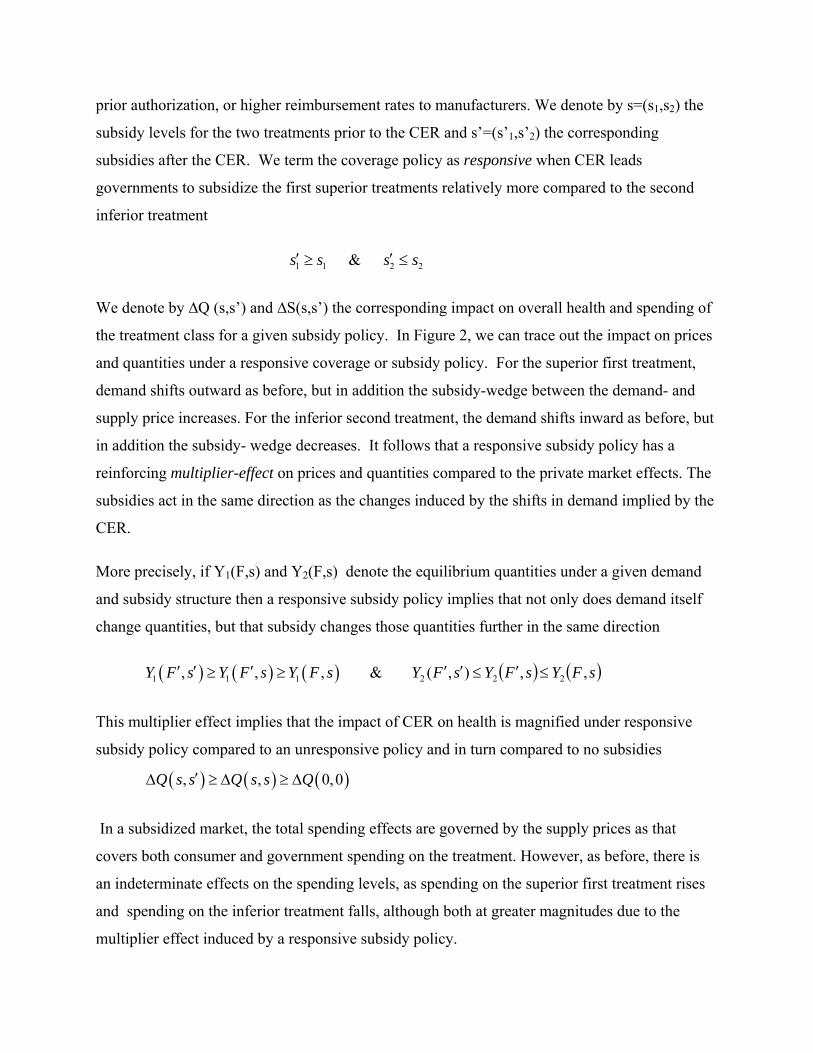
prior authorization, or higher reimbursement rates to manufacturers. We denote by s=(s1,s2) the
subsidy levels for the two treatments prior to the CER and s’=(s’1,s’2) the corresponding
subsidies after the CER. We term the coverage policy as responsive when CER leads
governments to subsidize the first superior treatments relatively more compared to the second
inferior treatment
1 1′ ≥s s & 2 2′ ≤s s
We denote by ∆Q (s,s’) and ∆S(s,s’) the corresponding impact on overall health and spending of
the treatment class for a given subsidy policy. In Figure 2, we can trace out the impact on prices
and quantities under a responsive coverage or subsidy policy. For the superior first treatment,
demand shifts outward as before, but in addition the subsidy-wedge between the demand- and
supply price increases. For the inferior second treatment, the demand shifts inward as before, but
in addition the subsidy- wedge decreases. It follows that a responsive subsidy policy has a
reinforcing multiplier-effect on prices and quantities compared to the private market effects. The
subsidies act in the same direction as the changes induced by the shifts in demand implied by the
CER.
More precisely, if Y1(F,s) and Y2(F,s) denote the equilibrium quantities under a given demand
and subsidy structure then a responsive subsidy policy implies that not only does demand itself
change quantities, but that subsidy changes those quantities further in the same direction
( ) ( ) ( )1 1 1, , ,′ ′ ′≥ ≥Y F s Y F s Y F s & ( ) ( )sFYsFYsFY ,,),( 222 ≤′≤′′
This multiplier effect implies that the impact of CER on health is magnified under responsive
subsidy policy compared to an unresponsive policy and in turn compared to no subsidies
( ) ( ) ( ), , 0,0′Δ ≥ Δ ≥ ΔQ s s Q s s Q
In a subsidized market, the total spending effects are governed by the supply prices as that
covers both consumer and government spending on the treatment. However, as before, there is
an indeterminate effects on the spending levels, as spending on the superior first treatment rises
and spending on the inferior treatment falls, although both at greater magnitudes due to the
multiplier effect induced by a responsive subsidy policy.
Section 5: Impact of CER under Heterogeneous Treatment Effects
This section extends the previous analysis of health- and spending impacts of CER by
considering heterogeneity in treatment effects or quality across patients. As opposed to the
previous sections, responsive subsidy policy may adversely affect health in this case under some
specific forms of heterogeneity described below.
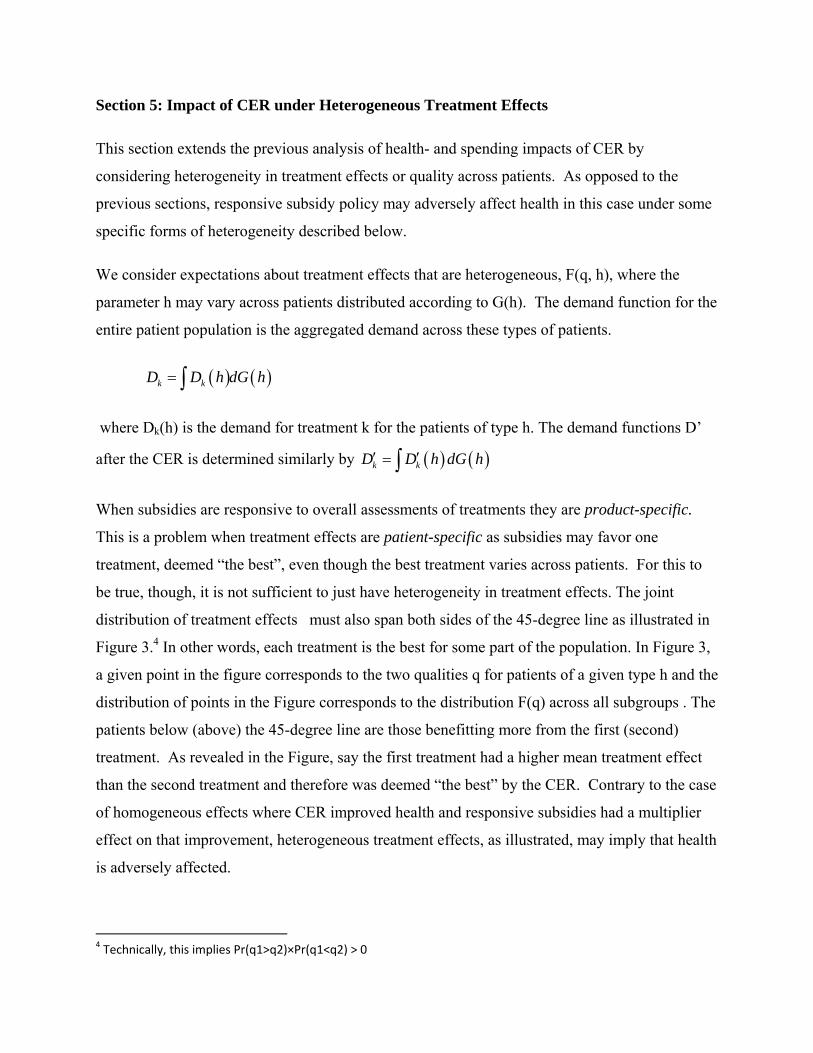
We consider expectations about treatment effects that are heterogeneous, F(q, h), where the
parameter h may vary across patients distributed according to G(h). The demand function for the
entire patient population is the aggregated demand across these types of patients.
( ) ( )= ∫k kD D h dG h
where Dk(h) is the demand for treatment k for the patients of type h. The demand functions D’
after the CER is determined similarly by ( ) ( )′ ′= ∫k kD D h dG h
When subsidies are responsive to overall assessments of treatments they are product-specific.
This is a problem when treatment effects are patient-specific as subsidies may favor one
treatment, deemed “the best”, even though the best treatment varies across patients. For this to
be true, though, it is not sufficient to just have heterogeneity in treatment effects. The joint
distribution of treatment effects must also span both sides of the 45-degree line as illustrated in
Figure 3.4 In other words, each treatment is the best for some part of the population. In Figure 3,
a given point in the figure corresponds to the two qualities q for patients of a given type h and the
distribution of points in the Figure corresponds to the distribution F(q) across all subgroups . The
patients below (above) the 45-degree line are those benefitting more from the first (second)
treatment. As revealed in the Figure, say the first treatment had a higher mean treatment effect
than the second treatment and therefore was deemed “the best” by the CER. Contrary to the case
of homogeneous effects where CER improved health and responsive subsidies had a multiplier
effect on that improvement, heterogeneous treatment effects, as illustrated, may imply that health
is adversely affected.
4 Technically, this implies Pr(q1>q2)×Pr(q1<q2) > 0
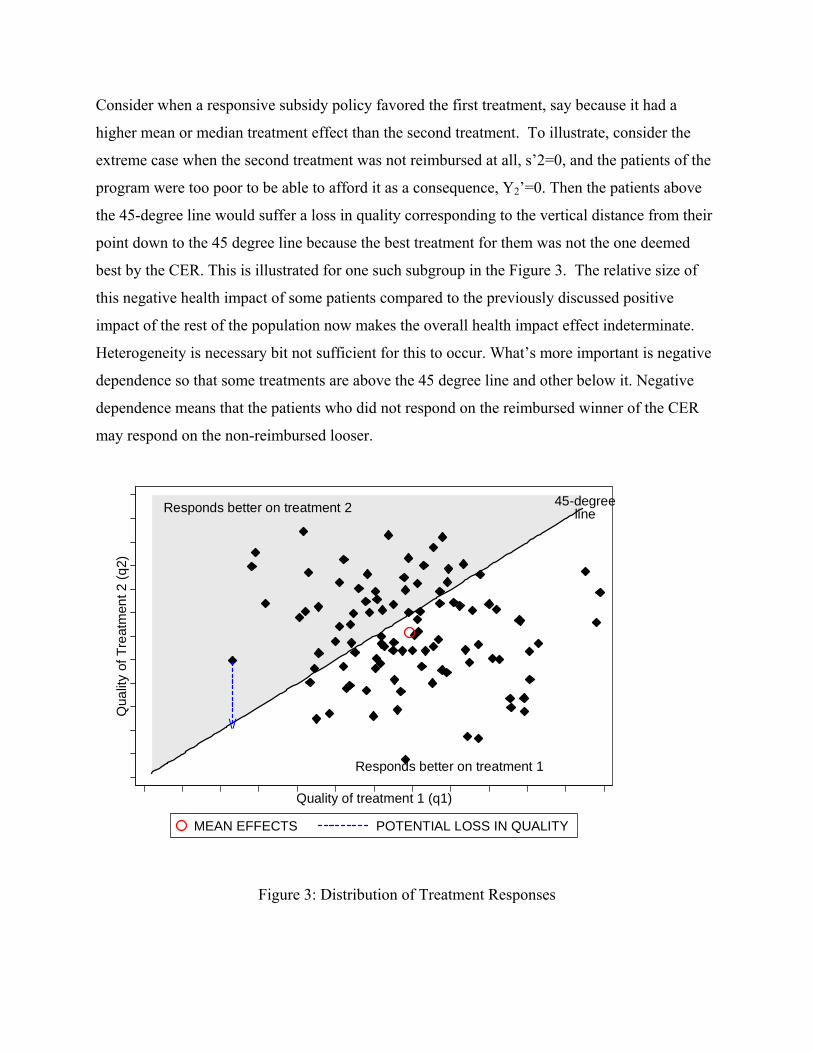
Consider when a responsive subsidy policy favored the first treatment, say because it had a
higher mean or median treatment effect than the second treatment. To illustrate, consider the
extreme case when the second treatment was not reimbursed at all, s’2=0, and the patients of the
program were too poor to be able to afford it as a consequence, Y2’=0. Then the patients above
the 45-degree line would suffer a loss in quality corresponding to the vertical distance from their
point down to the 45 degree line because the best treatment for them was not the one deemed
best by the CER. This is illustrated for one such subgroup in the Figure 3. The relative size of
this negative health impact of some patients compared to the previously discussed positive
impact of the rest of the population now makes the overall health impact effect indeterminate.
Heterogeneity is necessary bit not sufficient for this to occur. What’s more important is negative
dependence so that some treatments are above the 45 degree line and other below it. Negative
dependence means that the patients who did not respond on the reimbursed winner of the CER
may respond on the non-reimbursed looser.
Responds better on treatment 2
Responds better on treatment 1
45-degreeline
\/
Qua
lity
of T
reat
men
t 2 (q
2)
Quality of treatment 1 (q1)
MEAN EFFECTS POTENTIAL LOSS IN QUALITY
Figure 3: Distribution of Treatment Responses
More generally, the average quality before and after the CER are given by
1 1 2 2= +Q Y E Y E
1 1 2 2′ ′ ′ ′ ′= +Q Y E Y E
where the quality expectations Ek and E’k, k=1,2 are the average quality levels conditional on
selecting the treatment before and after the CER. The impact on health Q’-Q therefore partly
determined by the effects among people who change their treatment choices due to the
responsive policy, as is also the case under homogenous treatment effects. However, in the
heterogeneous case, this impact comprises of the effect on those whose new choices lead to
better outcomes and the effect on those whose new choices lead to inferior outcomes. The degree
of heterogeneity and the extent of self-selection before the responsive policy would determine
the overall effect of these two groups.
A responsive subsidy policy may alter quantity towards the first treatment that is superior on
average but, due to heterogeneity, the overall effect on those selecting into that treatment may
very well be negative. For example, if due to a responsive subsidies the demand for the first
treatment absorbs the demand for the second treatment, then Y’1=Y1+Y2. This implies that the
impact on health is given as
1 1 1 2 1 2( ) ( )′ ′Δ = − + −Q Y E E Y E E ,
which is determined by the changes in average effects for those who selected into either
treatment prior to the CER. If, prior to CER, patients were able to select treatment that were
more beneficial on average for them, then 1 1 1 2&′ ′< <E E E E and the overall health impact of
CER could be negative. However, if patents were incorrect in their choice prior to CER, then the
impact could be positive5.
Because of the potential negative impact on health from responsive subsidies or coverage
policies, CER may have indeterminate effect on incremental cost-effectiveness, CE=∆ S/∆ Q.
5 See Meltzer et al. (2003) for evidence of such self‐selection among diabetes patients. See also Basu(2009) for a discussion of these effects.
This is because the cost per unit of quality may fall or rise dependent on the patient heterogeneity
in the population. For example, in Figure 3 above if responsive subsidies induces everyone to
choose the first treatment even when it is not optimal then clearly average quality of care is
lowered, thereby lowering cost-effectiveness under constant prices.
Section 6: Empirical Analysis of Responsive Subsidies for Antipsychotics
In this section, we conduct an illustrative empirical analysis of the potential impact of CER
responsive subsidies using the case of antipsychotic drugs. These drugs represent one of the
largest drug classes in one of the major US public subsidy programs, Medicaid (Bruen and
Ghosh, 2004). Antipsychotic drugs represent the primary treatments for patients with
schizophrenia. Beginning from 1990 a second generation of antipsychotic drugs, also known as
the atypical antipsychotics (AA) were introduced. These drugs are believed to cause less
movement disorders as side effects compared to the first generation antipsychotics (also known
as typical or neuroleptics) (Kane, 2004; Meltzer 2009). More recently, some of the second
generation antipsychotics have been linked to increased metabolic side-effects such as weight
gain and diabetes (Meltzer, 2005).
We consider the recent CER (CATIE trial) that was conducted for antipsychotics in the US
(Lieberman et al, 2005), following a series of other comparative effectiveness studies conducted
on this issue (Polsky et al., 2006; Leucht et al., 2009). The CATIE results found equivalence in
the effectiveness for a first generation (typical) and all the second generation (atypicals)
antipsychotic drugs (Lieberman et al, 2005; Rosenheck et al, 2006). This sparked a vigorous
debate about coverage of the expensive second generation drugs as costs of antipsychotics have
been one of the fastest growing pharmaceutical expenditures within Medicaid in the late 1990's
and early 2000's (Banthin and Miller, 2006). Several CATIE investigators, including the authors
of the CATIE study, have stated that that study was not designed to directly answer questions of
policy regarding access to antipsychotic drugs, while others have suggested that the CATIE
results clearly established that it is wasteful to use public funds to pay for second-generation
antipsychotics, a perspective that has been adopted by some influential media outlets, and some
pharmacy benefit managers (Rosenheck, 2007; NY Times, 2005; Soumerai and Law, 2007 ).
This has put pressure on various states’ public health officials to cut their budgets by restricting
coverage on the AAs (Carey, 2005) and has led to considerable policy debate on whether the
effectiveness evidence generated by the CATIE trial should be used as basis for limiting
reimbursement or coverage for AAs, that is, whether subsidies should be responsive to the CER
(Parks et al., 2008). Debate about the comparative effectiveness of these drugs persists (AHRQ
EPC Project, 2009).
We examine two highly debated counter-factual policy options, which severely restricts access to
AAs and compare them to the pre-CATIE scenario where AAs were not restricted. Using results
from the CATIE trial, we trace out the health and spending effects of the two responsive policy
positions and examine what determines those effects. Since Medicaid is one of the primary payer
of antipsychotic medications, and since much of the policy debate has been about appropriate
public reimbursement responses to CER, our discussions will surround the Medicaid population
of non-elderly adult patients with schizophrenia. We stress the fact that none of these policy
positions we consider, which severely restricts access to AAs, were actually implemented in real
practice, partly owing to concerns regarding design issues of the CATIE trial and to avoid the
potential adverse impact on health associated with such restrictions for this very vulnerable
population (Parks et al., 2008; Meltzer et al., 2009). Nevertheless, as described previously,
access to some AAs was restricted through prior authorization (PA) policies by approximately 40
percent of state Medicaid programs in 2005,6 many having PA requirements for multiple drugs
(Polinski et al, 2007). Even with the recognition in the research literature on the biological
heterogeneity in treatment effects and outcomes in schizophrenia, CER studies such as CATIE
may have reinforced the will for instituting these stringent access restriction policies.
However, less is understood about the consequences of such policies especially when different
subgroups of the patient population find the largest benefits from different drugs. The goal here
is therefore to trace out the implications of these policies by intentionally using very drastic
coverage restriction scenarios, not to argue that they should or should not be implemented. The
rationale is that, if we see welfare is enhanced even in these restricted scenarios, we will be more
6 Even though these observed policies were not as restrictive as full denial of drugs that we study as counterfactual policies in our simulations, these policies do highlight the CER results can considerably influence coverage decisions even without a formal mechanism as in a UK‐based system.
confident about the impact of CER-responsive policy changes. Otherwise, our illustration points
out the implications of CER and the potential consequences of responsive policies.
6.1. Evidence on treatment effect heterogeneity
Our concern about the effects of responsive subsidies applied to treatments, when different
subgroups of patients may find alternative treatments to be beneficial, can be highlighted by
illustrating responses to different drugs by the same patient. This can be achieved using data
from the CATIE trial, as unlike traditional randomized designs, CATIE followed a novel
approach where patients, who discontinued their first drug assignment, were re-randomized to
receive an alternative drug. This design aspect of CATIE helps to establish the joint distribution
of effects from alternative drugs for the same individuals, conditional on the fact that these
individuals discontinued from one of them.
We reanalyze the individual level CATIE data to estimate the joint distribution of treatment
effects between risperidone as the 1st line and olanzapine or quetiapine as the second line drug.
The data only allowed us to estimate the effects of these second generation drugs, but
nevertheless illustrates our point about treatment effect heterogeneity. Since these drugs
influence both the symptoms and the side-effect profile in patients, we study the health effects of
these drugs in terms of quality-adjusted life year that integrates these effects into a single metric.
We use the Positive and Negative Syndrome Scale (PANSS) scores, which measure severity of
psychotic symptoms among patients with schizophrenia, to compute a severity index (Mohr et
al., 2004) and then assign quality of life weights to each severity category. Similarly, we assign
quality of life weights to each of the most common side-effects, akathisia, akinesia and weight
gain. Overall quality of life for a patient at any given time is computed by taking the minimum of
the symptom-based QOL and side-effects based QOL. The key outcome on which comparisons
are made is the average monthly change in QOL, modeled using linear mixed-effects models.
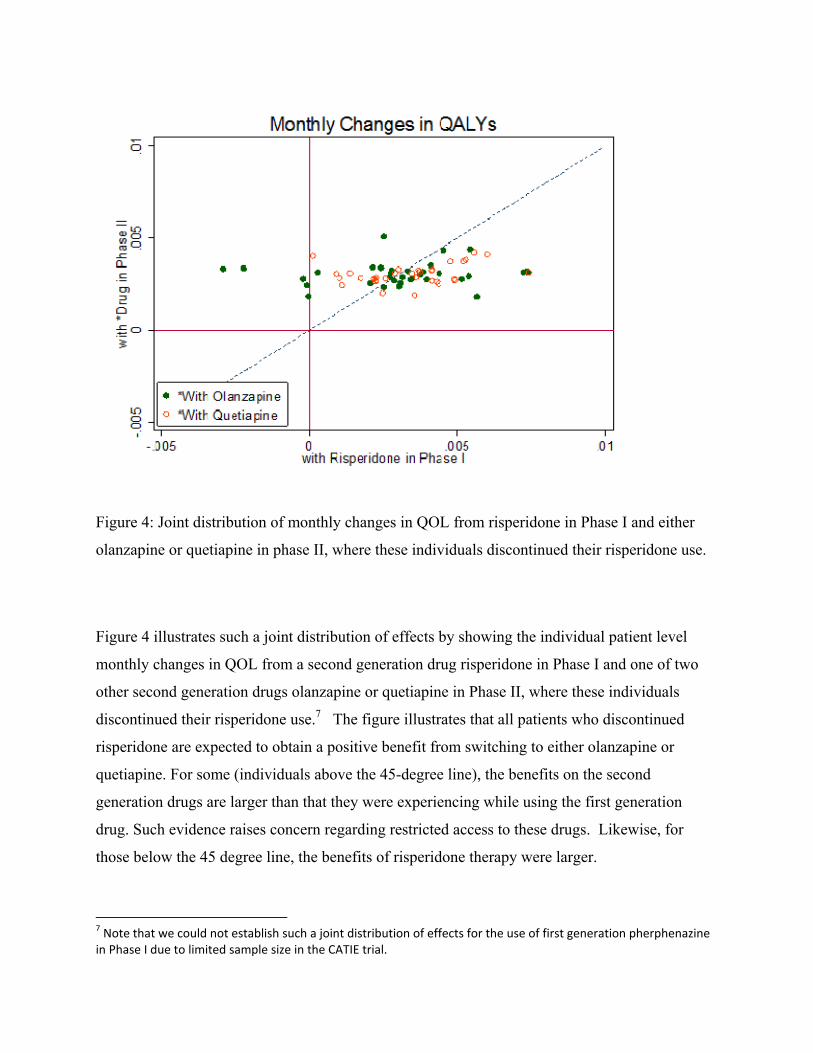
Figure 4: Joint distribution of monthly changes in QOL from risperidone in Phase I and either
olanzapine or quetiapine in phase II, where these individuals discontinued their risperidone use.
Figure 4 illustrates such a joint distribution of effects by showing the individual patient level
monthly changes in QOL from a second generation drug risperidone in Phase I and one of two
other second generation drugs olanzapine or quetiapine in Phase II, where these individuals
discontinued their risperidone use.7 The figure illustrates that all patients who discontinued
risperidone are expected to obtain a positive benefit from switching to either olanzapine or
quetiapine. For some (individuals above the 45-degree line), the benefits on the second
generation drugs are larger than that they were experiencing while using the first generation
drug. Such evidence raises concern regarding restricted access to these drugs. Likewise, for
those below the 45 degree line, the benefits of risperidone therapy were larger.
7 Note that we could not establish such a joint distribution of effects for the use of first generation pherphenazine in Phase I due to limited sample size in the CATIE trial.
Note that heterogeneity in treatment effects is a necessary but not sufficient condition for
responsive subsidies to induce welfare loss. Even if there was heterogeneity but the entire joint
distribution was below or above the 45-degree line, there would be little loss from responsive
subsidies. What central is whether there the best treatment differs across patients. For example,
if there is positive covariance then not responding on a first-line therapy may imply the patient
won’t respond on second-line therapies as well. However, if there is independence or negative
correlation, then failing one treatment means the next is more likely to succeed. The lack of
dependence illustrated in the figure above is therefore central for the negative health impact we
simulate below.
6.2 Simulated Pre-CER levels (Pre-CATIE scenario)
We consider when prior to the CER (CATIE) both generation antipsychotics are covered under
the Medicaid program. Since the second generation drugs are costlier, this resembles a greater
subsidy on the second generation drugs compared to first generation drugs (i.e. s2 ≥ s1).
Demand for these drugs are partly determined by the demand prices faced by the patients, which
were close to zero, i.e. PD(s) =0, so that overall spending closely coincide with the supply prices
PS and has been substantial incurred by Medicaid for this class.8 Demand is also affected by
heterogeneity in treatment effects as with unrestricted coverage physicians were able to try out
alternative drugs and often settle on a drug that appears to produce better quality for an
individual patient. That is, irrespective of the drug that a patient initiates on, the physician can
switch patients as needed to an alternative drug that may be more efficacious for that patient.
Since this resembles the standard practice in the pre-CATIE era, we capture the overall effect of
these switches using the intention-to-treat effects of specific drug initiation from CATIE data.
8 Total Medicaid expenditures on antipsychotic medication increased from $484 million in 1995 to $1.3 billion in 1998 (Lewin Group, 2000). In 2004, the annual health care costs for patients with schizophrenia is estimated to be about US $28 billion, of which nearly one‐third can be attributed to pharmacy costs (Gilmer et al., 2004). More recent estimates suggest that expenditures on antipsychotic medications across all payers have crossed $10 billion this year and account for a third to a half of all mental health expenditures (NIMH, 2006).
We focus on three second-generation antipsychotic drugs, risperidone, olanzapine, quetiapine as
well as one first generation drug perphenazine. These comprise nearly 70% of the market of
antipsychotic prescriptions written in the United States.
Wu et al. (2006) estimated prevalence of diagnosed schizophrenia among non-elderly Medicaid
patients to be 1.66%. We apply this estimate to about 15 million non-elderly adult Medicaid
enrollees (www.statehealthfacts.org) to obtain a total number of 250,000 non-elderly adult
enrollees with schizophrenia. We assume that the drug-specific shares of scripts estimated from
the 2005 IMS data represent equilibrium shares of use both across patients at the initial
assignment and within each initial assignment over a one year period. Therefore, we use these
shares to split the 250,000 patients with schizophrenia to obtain the number of patients initiating
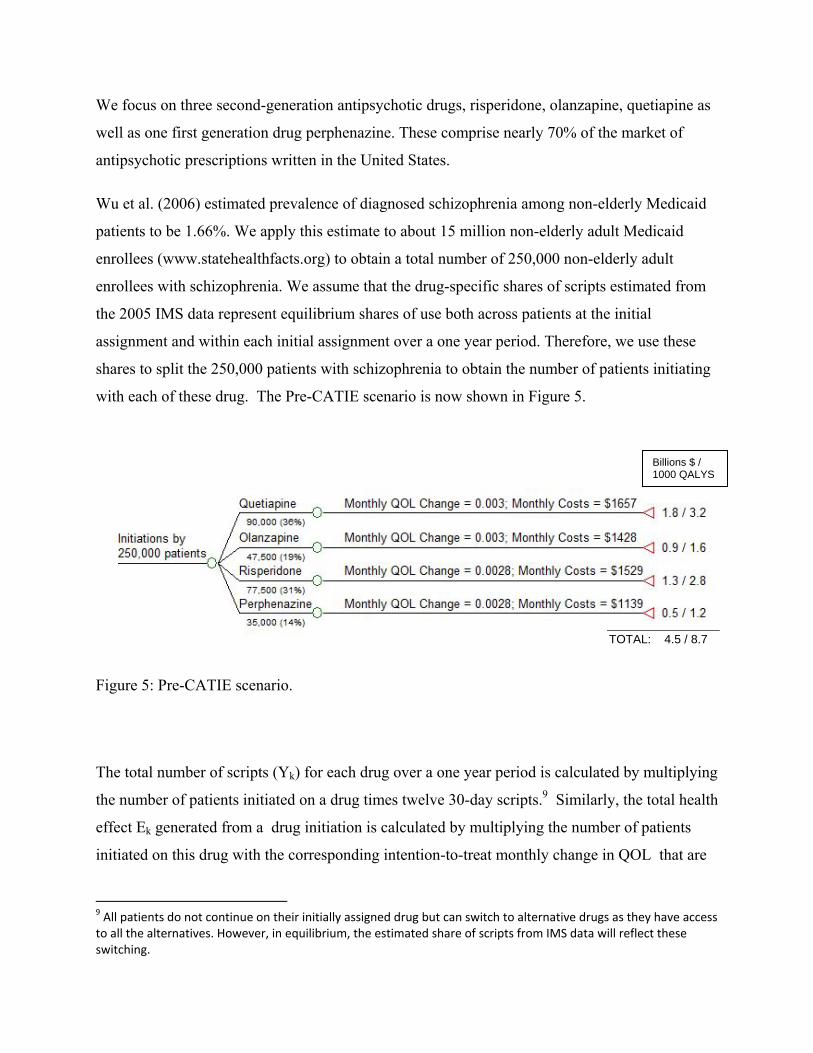
with each of these drug. The Pre-CATIE scenario is now shown in Figure 5.
Figure 5: Pre-CATIE scenario.
The total number of scripts (Yk) for each drug over a one year period is calculated by multiplying
the number of patients initiated on a drug times twelve 30-day scripts.9 Similarly, the total health
effect Ek generated from a drug initiation is calculated by multiplying the number of patients
initiated on this drug with the corresponding intention-to-treat monthly change in QOL that are
9 All patients do not continue on their initially assigned drug but can switch to alternative drugs as they have access to all the alternatives. However, in equilibrium, the estimated share of scripts from IMS data will reflect these switching.
Billions $ / 1000 QALYS
TOTAL: 4.5 / 8.7
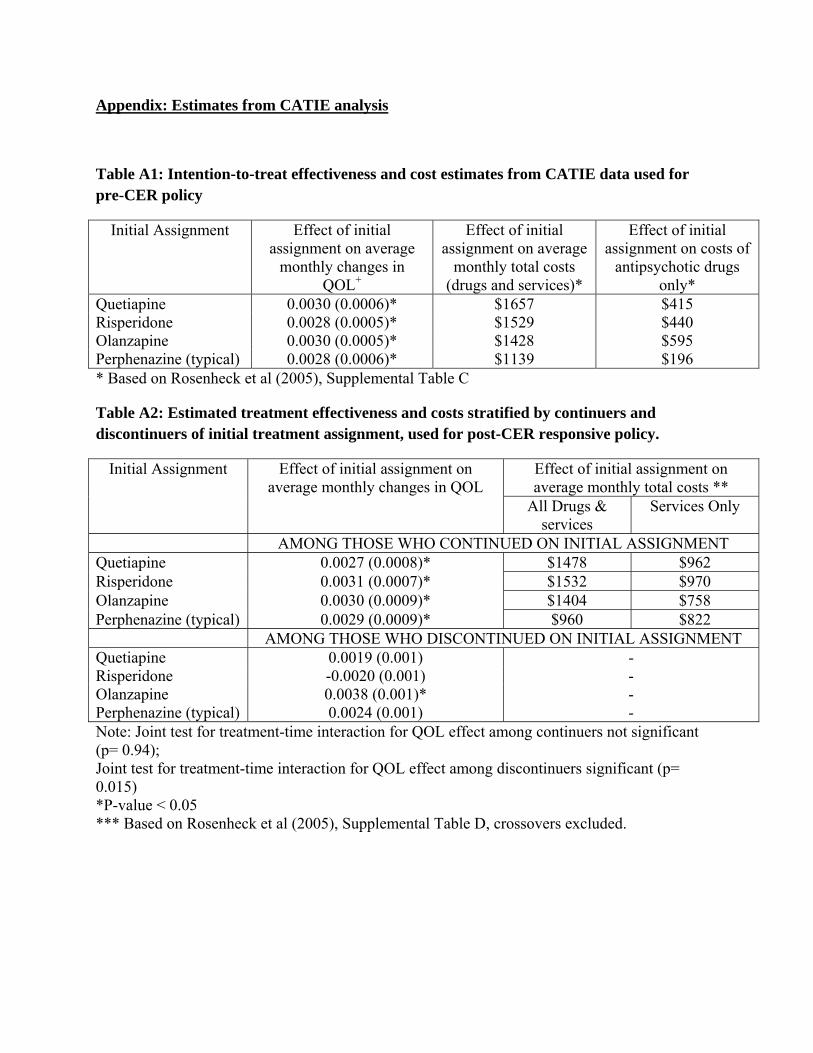
estimated from CATIE data (shown in Figure 5 and summarized in Table A1).10 For example,
90,000 patients inititated on quetiapine. They are expected to experience 0.003 monthly
increments in their quality of life. Therefore the total annual QALYs experienced by this cohort
is calculated as 90,000 X 0.003 X 12 = 3240 QALYS. Similar calculation are made for each drug
initiation and then the total benefits are summed across all the drug initiations. Similarly, total
costs under this policy is calculated by multiplying the number of patients initiated on a drug
with the corresponding intention-to-treat effects (Figure 5 and summarized in Table A1) on total
drugs and services costs that were reported by Rosenheck et al (2005) in their Supplemental
Table C (reproduced here in Table A1). Of these costs, about 18 - 34% is due to the use of any of
the antipsychotic medications under study (Table A1). Note that the overall health outcomes and
costs across each drug initiation-arm in the figure are relatively homogeneous, partly due to that
these are intent to treat effects that involved substantial switching to drugs not started on.
6.3 Simulated Post-CER levels (Post-CATIE scenarios)
To simulate the effects of a highly restrictive CER-responsive subsidy policy, we compare the
pre-CATIE scenario with two hypothetical (counter-factual) post- CER scenarios. In the first
scenario, in response to the CATIE results the responsive subsidy policy entails the second
generation drug not being covered; s’2=0. Given the low income of the Medicaid population, this
is assumed to eliminate demand in this population so that the post-CER quantity satisfies
Y’2=0.11 This case is included as it provides an upper bound on the harmful effects of a subsidy
response, the lower bound being induced by no response occurring at all (i.e. pre-CER policy
remains). In the second scenario, under the responsive subsidy policy the second generation
10 These intention‐to‐treat effects represent the average quality levels for a given initial drug assignments after incorporating the effect of trial‐and‐error selection into the best treatment. We apply mixed effects linear models to individual‐level longitudinal quality of life data from CATIE and estimate the intention‐to‐treat effects of the initial assignment of alternative drugs. Specifically, we look at look at the coefficients on treatment‐time interaction to compare the average rate of change in QALYs under alterative first line treatment. 11 It is stressed that this is a very extreme form of restriction. Usually, such a scenario, if at all exists, would often have the appeals process through which the patient can get an atypical drug. Appeals process is a more stringent version of PA policies. It is not clear how long such appeals usually takes and whether patients are more likely to give up switching to another drugs given this hurdle. We certainly see effects to this end for PA policies ( Soumerai et al., 2007).
drugs are again subsidized less than before , s’2 < s2, but only one of the second-generation drugs
is covered , thereby allowing Y’2 to be positive.
Post-CATIE scenario with responsive subsidies, Scenario #1:
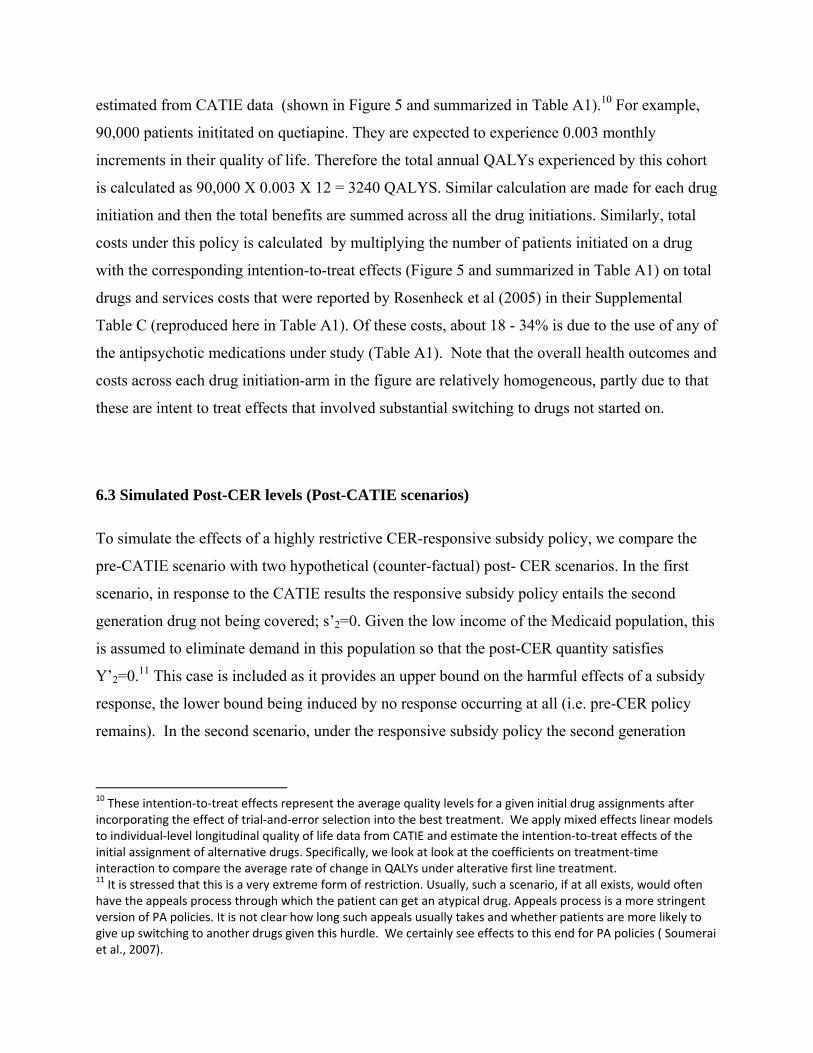
The post-CER scenario #1 is illustrated in Figure 6. In this scenario, the typical antipsychotic
(perphenazine) is the only drug subsidized and the atypicals are not reimbursed. That is, s’1 is set
so that the consumer price is zero and the second subsidy is eliminated, s’2 =0. We will assume
that all patients are initiated with perphenazine, 25% these patients (estimated using CATIE data)
will find perphenazine to be efficacious and tolerable and therefore continue on it. The remaining
75% will discontinue perphenazine after six months (median time to discontinuation estimated
using CATIE data) but will not be able to switch to other drugs due to lack of subsidies ( i.e.
Y’2=0), and thus will be without drug therapy for the remaining six months. We run separate
mixed effects models to estimate the effect of the initially assigned drug on monthly changes in
quality of life over the duration of the trial for those who continued on their initial assignment
and till the time of discontinuation for those who discontinued the initially assigned drug. These
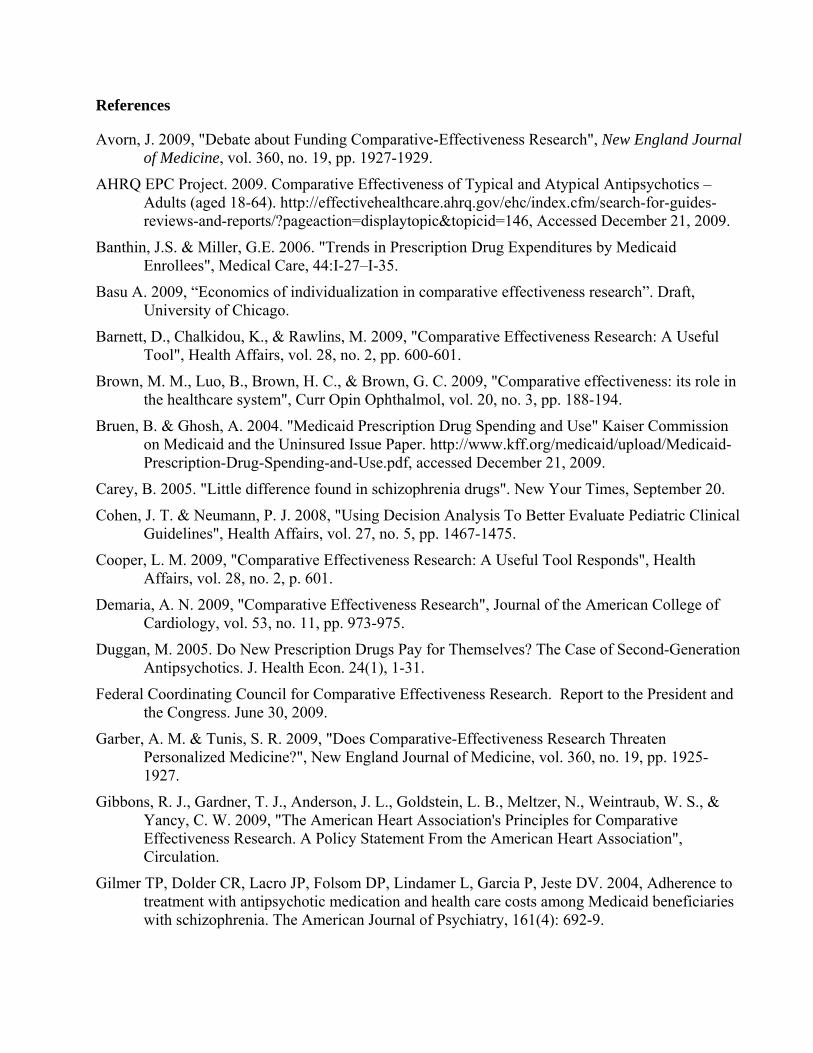
estimates are shown in Figure 6 and also summarized in Table A2 in the Appendix.
Figure 6: Patterns of utilization under the post-CATIE scenario # 1 with a responsive subsidy
policy.
Billions $ / 1000 QALYS
TOTAL: 3.3 / -4.4
Among the discontinuers, we assume that 11% of them will have a relapse (Weiden and Olfson,
1995) and the remaining will not experience any more gain in their quality of life in that year.
Patient who relapse, will on average experience two hospitalization (Weiden and Olfson, 1995)
worth $14,000 each and a loss in quality of life of 0.45 per patient (Lenert et al. 2004).
Total QALYs under this scenario are calculated as follows. Continuers accumulate the average
monthly change in QOL, estimated from among perphenazine continuers in the CATIE data,
over 12 months. Discontinuers accumulate the average monthly change in QOL, estimated from
among perphenazine discontinuers from CATIE data, for 6 months before they discontinue
perphenazine, and zero QOL change thereafter. Among discontinuers, those who relapse
experience an additional loss of 0.45 QOL units per patient (Lenert et al. 2004). For example,
1,87,500 (75%) patients would discontinue perphenazine at the 6 month mark. 20,625 (11%) of
these patients will experience a relapse in the next six months. The total annual QALYs for
these 20,625 patients are calculated as: (20,625*6*0.0024) + (20,625 * - 0.45) = 297 + (-9281) =
-8984 QALYS.
Similarly, total costs are calculated as follows. Continuers accumulate the estimated average
monthly costs (drugs plus services use) among perphenazine continuers over 12 months.
Monthly costs for the compliant group are calculated based on the estimates on total drugs and
services reported by Rosenheck et al (2005) in their Supplemental Table D, where treatment
crossovers were excluded. The same monthly costs are applied to the noncompliant group during
the first 6 month when they were on perphenazine. After discontinuation, patients continue to
accumulate the average monthly services costs ( but not any drug costs12) and also additional
costs of hospitalization due to relapse.
Post-CATIE scenario with responsive subsidies, Scenario #2:
The post-CER scenario #2 is illustrated in Figure 7. In this second scenario, the typical
antipsychotic (perphenazine) but also one atypical antipsychotic are subsidized with the other
atypicals still not reimbursed. That is, s’2 for one atypical and s’1 are set so that the consumer
prices are zero for each while s’2 =0 for all other atypicals. We will consider risperidone to be the
12 To obtain a conservative estimate on costs, we did not include costs of concomitant medications, as part of these costs may be due to the use of antipsychotics themselves.
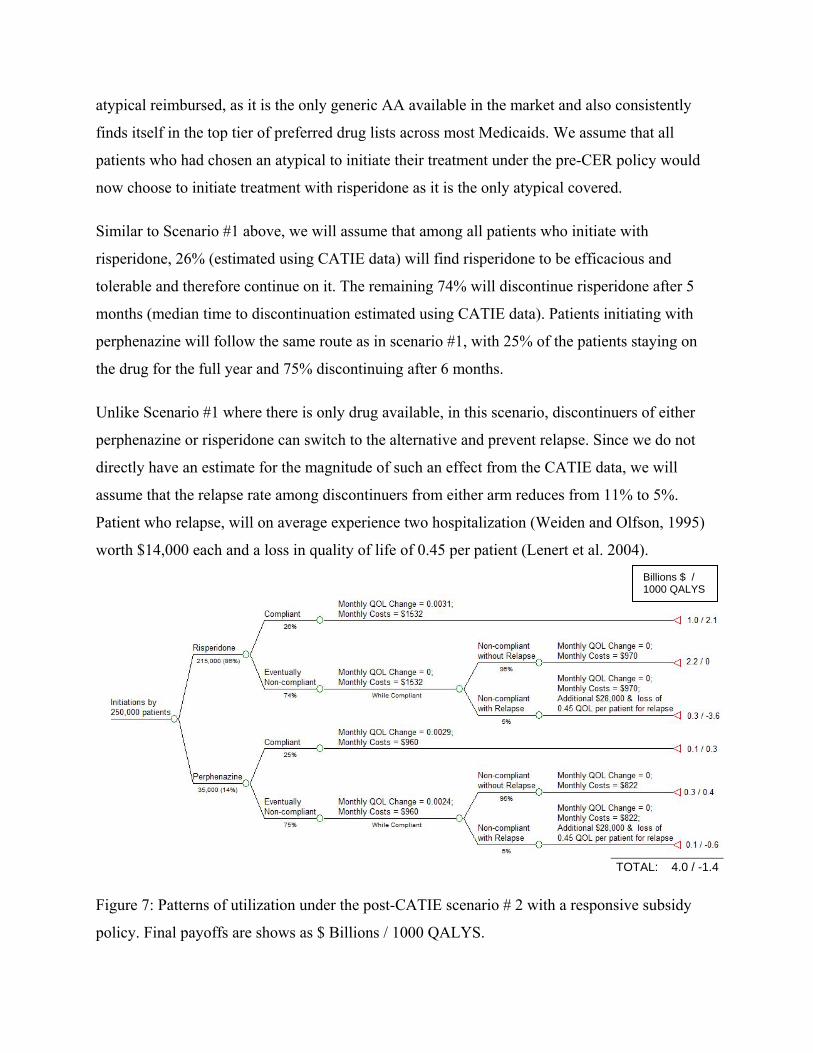
atypical reimbursed, as it is the only generic AA available in the market and also consistently
finds itself in the top tier of preferred drug lists across most Medicaids. We assume that all
patients who had chosen an atypical to initiate their treatment under the pre-CER policy would
now choose to initiate treatment with risperidone as it is the only atypical covered.
Similar to Scenario #1 above, we will assume that among all patients who initiate with
risperidone, 26% (estimated using CATIE data) will find risperidone to be efficacious and
tolerable and therefore continue on it. The remaining 74% will discontinue risperidone after 5
months (median time to discontinuation estimated using CATIE data). Patients initiating with
perphenazine will follow the same route as in scenario #1, with 25% of the patients staying on
the drug for the full year and 75% discontinuing after 6 months.
Unlike Scenario #1 where there is only drug available, in this scenario, discontinuers of either
perphenazine or risperidone can switch to the alternative and prevent relapse. Since we do not
directly have an estimate for the magnitude of such an effect from the CATIE data, we will
assume that the relapse rate among discontinuers from either arm reduces from 11% to 5%.
Patient who relapse, will on average experience two hospitalization (Weiden and Olfson, 1995)
worth $14,000 each and a loss in quality of life of 0.45 per patient (Lenert et al. 2004).
Figure 7: Patterns of utilization under the post-CATIE scenario # 2 with a responsive subsidy
policy. Final payoffs are shows as $ Billions / 1000 QALYS.
Billions $ / 1000 QALYS
TOTAL: 4.0 / -1.4
Following Scenario #1, we use the QOL effects for continuers and discontinuers for the
corresponding drug assignment (as indicated in Figure 7 and summarized in Table A2) to
calculate the total effect of this assignment. For risperidone, the QOL-effect among those who
discontinue is found to be negative but not statistically significant (Table A2). Therefore, we
assume a zero monthly change in QOL for the discontinuers during the first five months when
they are on risperidone. Similarly, costs for the compliant groups under each drug initiation are
calculated based on the estimates on total drugs and services reported by Rosenheck et al (2005)
in their Supplemental Table D, where treatment crossovers were excluded. The same monthly
costs are applied to the noncompliant group during the month when they were on their initial
assignment. After discontinuation, patients continue to accumulate the assignment-specific
average monthly services costs and additional costs of hospitalization due to relapse.
In order to be conservative, we ignore the number of scripts sold to patients who switch to
risperidone after discontinuing from perphenazine and vice versa. We will defer the discussion of
price responses for risperidone that is expected as its equilibrium quantity soars to the next
section.
We compare the expected incremental costs and benefits, in terms of Quality adjusted life years
(QALYs),) between the pre- and post CER scenarios.
6.3 Results
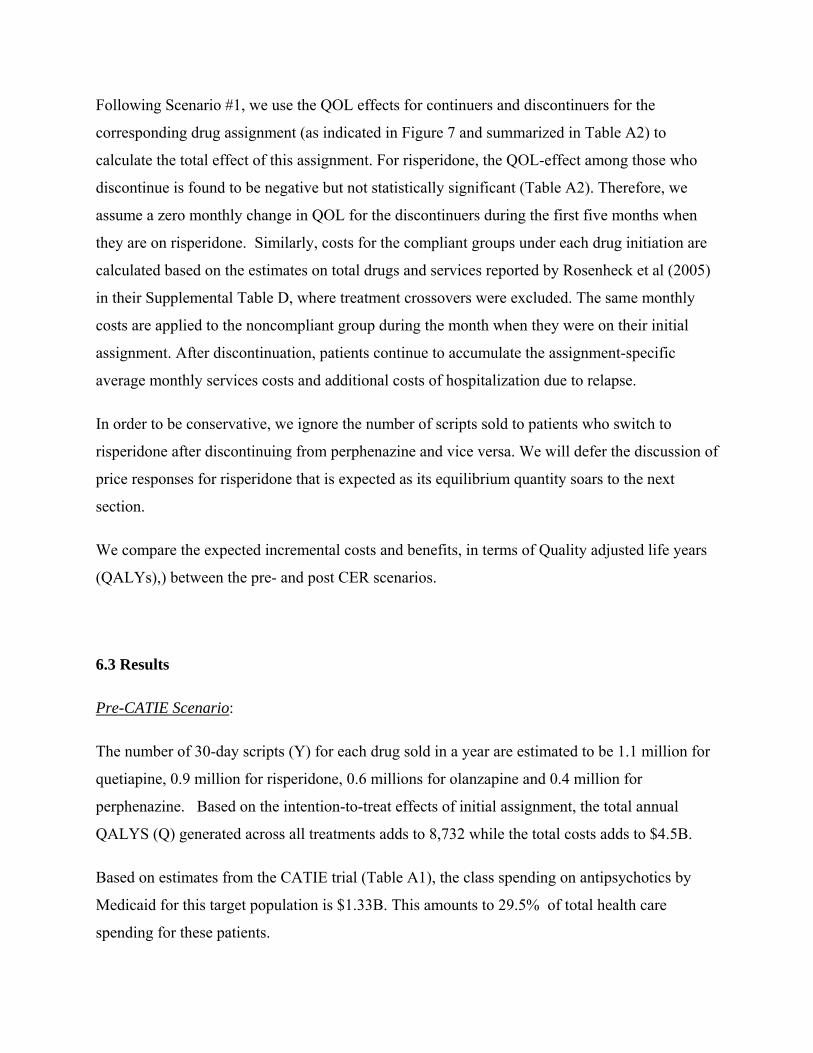
Pre-CATIE Scenario:
The number of 30-day scripts (Y) for each drug sold in a year are estimated to be 1.1 million for
quetiapine, 0.9 million for risperidone, 0.6 millions for olanzapine and 0.4 million for
perphenazine. Based on the intention-to-treat effects of initial assignment, the total annual
QALYS (Q) generated across all treatments adds to 8,732 while the total costs adds to $4.5B.
Based on estimates from the CATIE trial (Table A1), the class spending on antipsychotics by
Medicaid for this target population is $1.33B. This amounts to 29.5% of total health care
spending for these patients.
Post- CATIE Scenario with responsive subsidies, Scenario#1:
When all of the 250,000 patients are started on perphenazine, 25% of them continue with it and
generate a total of 2,175 QALYs and $0.7B in total annual costs. Those who discontinue
perphenazine but do not relapse obtain an additional 2,403 of QALYs and incur $1.8B in
spending. Those who discontinue perphenazine and relapse suffer a loss of 8,984 QALYs and
add $0.8B in spending. Consequently, this post- CER scenario would produce a loss of 4,406
QALYs at total annual costs of $3.3B, mainly due to the severe effect on the quality of life of
those who relapse due to the unavailability of drugs.
Post- CATIE Scenario with responsive subsidies, Scenario#2:
When the first generation drug perphenazine and the second generation drug risperidone are the
only two drugs that are subsidized, 35,000 patients initiate with perphenazine and the rest with
risperidone. Patients initiating with risperidone will generate a net loss of 1,504 QALYs and
those initiating on perphenazine will generate a net gain of 90 QALYs, totaling to a net loss of
1,414 QALYs for this scenario at a cost of $4.0B.
Incremental cost-effectiveness of alternative policies
Table 1 presents the cost-effectiveness results for the two alternative responses in subsidies
compared to the pre-CER policy. The first part of the table presents a standard cost-effectiveness
table. Here policies are presented in order of increasing costs. The second and the fourth
columns present the incremental costs and QALYs respectively for a policy compared to a less
costly policy. The last column reports the incremental cost-effectiveness ratio, which is the ratio
of the incremental costs over the incremental QALYs. For example, Post CER#2 policy incurs
$0.7B in additional costs and produces 2,992 additional QALYS compared to Post CER#1 policy
and therefore has an ICER of $0.7B/2,992 = $222,816/QALY.
The second part of the table present the net monetary benefits (Stinnett and Mullahy, 1998) of
alternative policies when each QALY is valued at $100,000.
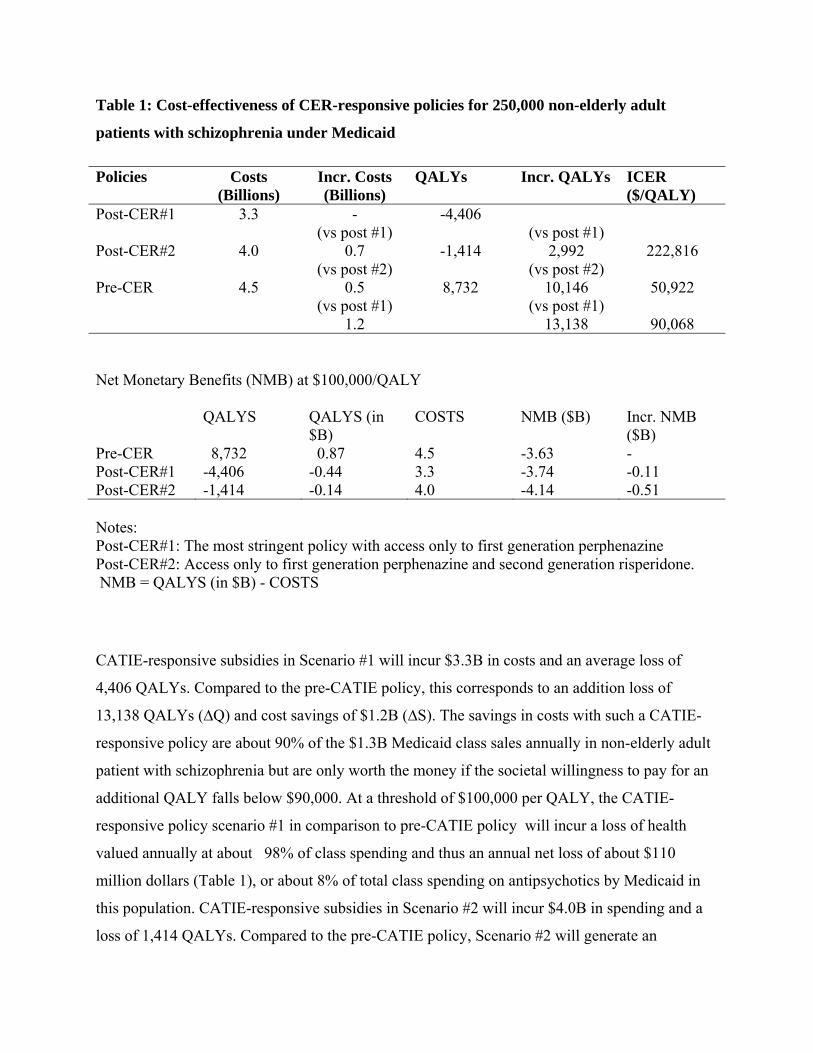
Table 1: Cost-effectiveness of CER-responsive policies for 250,000 non-elderly adult
patients with schizophrenia under Medicaid
Policies Costs (Billions)
Incr. Costs (Billions)
QALYs Incr. QALYs ICER ($/QALY)
Post-CER#1 3.3 - -4,406 Post-CER#2
4.0
(vs post #1) 0.7
-1,414
(vs post #1) 2,992
222,816
Pre-CER
4.5
(vs post #2) 0.5
8,732
(vs post #2) 10,146
50,922
(vs post #1) 1.2
(vs post #1) 13,138
90,068
Net Monetary Benefits (NMB) at $100,000/QALY
QALYS QALYS (in $B)
COSTS NMB ($B) Incr. NMB ($B)
Pre-CER 8,732 0.87 4.5 -3.63 - Post-CER#1 -4,406 -0.44 3.3 -3.74 -0.11 Post-CER#2 -1,414 -0.14 4.0 -4.14 -0.51 Notes: Post-CER#1: The most stringent policy with access only to first generation perphenazine Post-CER#2: Access only to first generation perphenazine and second generation risperidone. NMB = QALYS (in $B) - COSTS
CATIE-responsive subsidies in Scenario #1 will incur $3.3B in costs and an average loss of
4,406 QALYs. Compared to the pre-CATIE policy, this corresponds to an addition loss of
13,138 QALYs (∆Q) and cost savings of $1.2B (∆S). The savings in costs with such a CATIE-
responsive policy are about 90% of the $1.3B Medicaid class sales annually in non-elderly adult
patient with schizophrenia but are only worth the money if the societal willingness to pay for an
additional QALY falls below $90,000. At a threshold of $100,000 per QALY, the CATIE-
responsive policy scenario #1 in comparison to pre-CATIE policy will incur a loss of health
valued annually at about 98% of class spending and thus an annual net loss of about $110
million dollars (Table 1), or about 8% of total class spending on antipsychotics by Medicaid in
this population. CATIE-responsive subsidies in Scenario #2 will incur $4.0B in spending and a
loss of 1,414 QALYs. Compared to the pre-CATIE policy, Scenario #2 will generate an
additional loss of 10,146 QALYs and cost savings of $0.5 billion dollars. These savings are only
worth the money if the societal willingness to pay for an additional QALY falls below $50,000.
At a threshold of $100,000 per QALY, this CATIE-responsive policy scenario #2 will result in
an annual loss of $0.5 billion dollars in value compared to pre-CATIE policy (Table 1), or about
38% of total class spending by Medicaid in this population.
The Importance of Price Responses
More generally, the debate about whether second generation treatments should be reimbursed at
par with first generation drugs is somewhat misguided as it relies on the wrong evidence to argue
that higher-priced second generation treatments are equally effective but less cost-effective than
lower-priced first generation treatments. First, in the presence of treatment heterogeneity, cost-
effectiveness of treatments often do not translate to cost-effectiveness of coverage policies.
Second, cost-effectiveness analysis often use effectiveness evidence after the CER but prices
before the CER, that is, F’ and p in our framework. Rather, what should matter is the evidence
and prices both after the CER, F’ and p’ in our framework. The important point here is that the
prices after the CER will adjust dependent on whatever the responsive subsidy rules are. Thus,
endogenous pricing is central to any conclusion of appropriate reimbursement after the CER.
Even if, hypothetically, the social willingness to pay was less than $90K/QALY and the
estimates from scenario #1 were considered to be precise, which would have favored the CATIE-
responsive subsidy policy #1, prices of atypical could have adjusted in response to the new
evidence. Any estimates of cost-savings from not reimbursing second generation treatments
assuming that p’=p are unlikely to be consistent with actual pricing behavior after the CER.
Those cost-savings may be an upper bound and should contrasted to cost-savings that occur
under a given reimbursement rule in place. The endogenous nature of prices given government
subsidy rules is central to determine the welfare effects of reimbursement of first vs second
generation antipsychotics.
Section 7: Concluding Remarks
Given the growth in public subsidization of CER to raise quality and lower cost, little conceptual
and empirical understanding exists concerning the quantitative impact of CER. This paper
analyzed the impact of CER on patient health and costs interpreting CER to shift the demand
from some treatments at the expense of others. We traced out the general spending and health
implications of such shifts in private- as well as subsidized health care markets. In contrast to
commonly held views, our analysis implies that CER may well increase quality of care but also
spending when treatment effects are homogenous; in contrast, CER may increase spending and
adversely impact health under plausible assumptions of how markets respond to quality
information. This was particularly relevant when treatment effects are heterogeneous as product
specific coverage policies failed to account for patient-specific treatment effects. We illustrated
these economic effects for antipsychotics that are among the largest drug classes of the US
Medicaid program and for which CER has been conducted. We simulated that if subsidies were
eliminated for atypical based CATIE trial, a loss of value at 8% of class spending would be
observed.
Concerns about the implications of CER-responsive subsidy policies in the face of heterogeneous
treatment effects cut across many other clinical scenarios. Indeed, it is difficult to think of a
single drug class where the drug that is best for one patient is always best for every other patient.
The literature is voluminous on the many other classes to which our analysis may generalize
including, for example, the use of antipsychotics drugs in Alzheimer’s disease (Schneider et al.,
2006), use of antihypertensive drugs (Matchar et al., 2008) and the treatments for clinically
localized prostate cancer (Wilt, 2008). The fact that the vast majority of drug classes involve
several drugs priced differentially certainly suggests that there is product differentiation, that is,
treatment effect heterogeneity. Price differences would not be able to survive under
homogeneous treatment effects.
The main conclusion of our analysis is that simplistic thinking about the impact of traditionally
perceived CER may have adverse effects. However, this does not mean that CER may not have
useful role to play and that good forms of CER should not take place. The analysis thereby
suggests several future research issues to consider in improving the use of CER. First, our
analysis of the impact of CER-responsive subsidies suggests that a better understanding is
needed as to how CER should be stratified towards obtaining the right treatments for the right
subpopulations rather than focused on the best treatment for all patients. There may not be a “one
size fits all” for the entire patient population so having reimbursement based on such a policy
induces inefficiencies. (Lewin 2009) In particular, our analysis suggests that the data generated
by CER should not only consider aggregate measures of response but more individualized
measures beyond standard demographics such as gender, age, or race (Basu, 2009).
Second, traditional RCTs that focus on intention-to-treat effects are not useful when there is
sequencing of treatments over time with a first line therapy, second line therapy and so on. This
is because RCTs generate marginal distributions of treatment responses. What would be more
valuable to know would be conditional distributions of treatment responses of the second stage
conditional on failure of a first-stage treatment. If there is dependence in treatment responses, as
suggested by the data we considered for the CATIE trial, learning about the joint distribution is
of great value (Basu, 2009). CER should be tailored to incorporate such dependence when trial
and error of finding the right treatment for the right patient is of importance.
Beyond improving the forms of CER that are done to go beyond mean treatment effects for large
populations, our analysis needs to be extended in several directions. First, future analysis should
consider the impact of market power on the analysis, but we refrained from this analysis here as
it would yield similar implications to the competitive case discussed. The basic quantity and
price implications of CER will likely carry over to some non-competitive market conditions as
well. For example, standard monopoly analysis would imply that an outward (inward) shift in
demand raises (lowers) price and quantity, just as in the competitive case discussed here. Under
the case when both treatments have market-power, many differentiated oligopoly models may
also imply the quantity and price implications discussed in response to the demand shifts
discussed to be induced by CER.
Second, evaluating the effects of CER is a special case of the general issue of assessing the value
of randomized clinical trials for understanding real treatment choices in a real health care setting.
This is so because a RCT investigates effects under different prices and information than what is
present after the RCT. Using the discussed framework for a more general examination of the
value of RCTs for assessing patient welfare in real world markets is an important area of future
research.
Third, a better understanding needs to be developed when and in what areas public technology
assessment offers an added value beyond similar private market activities (Meltzer et al, 2007).
For example, intellectual property on medical products such as drugs and devices implies strong
incentives on manufacturers to get the right information generated about the quality of their
products or the lack of quality of their competitors’ products. This is in opposition to procedures
which without patents have no owners with similar protective interests. In addition, many
countries mandate quality evidence to be produced, in the US through the FDA, before
marketing. This suggests that the biggest impact of public subsidies for these activities will be
for procedures and not products. This would be supported by evidence showing that the share of
private funding for technology assessments was higher for patented medical products than it was
for generic products or procedures.
As a better understanding develops along these lines, we hope that improved evaluation can take
place regarding the value of public technology assessments in general and CER in particular. As
it stands right now, there are no methods to quantitatively assess the impact from these activities
and why they improve on private sector activities aimed at the same purpose. We hope that
quantitative frameworks similar to the ones discussed here will help to bridge that gap, making
precise assessments of the value of public subsidies for technology assessments feasible and
more common.
Appendix: Estimates from CATIE analysis
Table A1: Intention-to-treat effectiveness and cost estimates from CATIE data used for pre-CER policy
Initial Assignment Effect of initial assignment on average
monthly changes in QOL+
Effect of initial assignment on average
monthly total costs (drugs and services)*
Effect of initial assignment on costs of
antipsychotic drugs only*
Quetiapine 0.0030 (0.0006)* $1657 $415 Risperidone 0.0028 (0.0005)* $1529 $440 Olanzapine 0.0030 (0.0005)* $1428 $595 Perphenazine (typical) 0.0028 (0.0006)* $1139 $196 * Based on Rosenheck et al (2005), Supplemental Table C
Table A2: Estimated treatment effectiveness and costs stratified by continuers and discontinuers of initial treatment assignment, used for post-CER responsive policy.
Initial Assignment Effect of initial assignment on average monthly changes in QOL
Effect of initial assignment on average monthly total costs **
All Drugs & services
Services Only
AMONG THOSE WHO CONTINUED ON INITIAL ASSIGNMENT Quetiapine 0.0027 (0.0008)* $1478 $962 Risperidone 0.0031 (0.0007)* $1532 $970 Olanzapine 0.0030 (0.0009)* $1404 $758 Perphenazine (typical) 0.0029 (0.0009)* $960 $822 AMONG THOSE WHO DISCONTINUED ON INITIAL ASSIGNMENT Quetiapine 0.0019 (0.001) - Risperidone -0.0020 (0.001) - Olanzapine 0.0038 (0.001)* - Perphenazine (typical) 0.0024 (0.001) - Note: Joint test for treatment-time interaction for QOL effect among continuers not significant (p= 0.94); Joint test for treatment-time interaction for QOL effect among discontinuers significant (p= 0.015) *P-value < 0.05 *** Based on Rosenheck et al (2005), Supplemental Table D, crossovers excluded.
References
Avorn, J. 2009, "Debate about Funding Comparative-Effectiveness Research", New England Journal of Medicine, vol. 360, no. 19, pp. 1927-1929.
AHRQ EPC Project. 2009. Comparative Effectiveness of Typical and Atypical Antipsychotics – Adults (aged 18-64). http://effectivehealthcare.ahrq.gov/ehc/index.cfm/search-for-guides-reviews-and-reports/?pageaction=displaytopic&topicid=146, Accessed December 21, 2009.
Banthin, J.S. & Miller, G.E. 2006. "Trends in Prescription Drug Expenditures by Medicaid Enrollees", Medical Care, 44:I-27–I-35.
Basu A. 2009, “Economics of individualization in comparative effectiveness research”. Draft, University of Chicago.
Barnett, D., Chalkidou, K., & Rawlins, M. 2009, "Comparative Effectiveness Research: A Useful Tool", Health Affairs, vol. 28, no. 2, pp. 600-601.
Brown, M. M., Luo, B., Brown, H. C., & Brown, G. C. 2009, "Comparative effectiveness: its role in the healthcare system", Curr Opin Ophthalmol, vol. 20, no. 3, pp. 188-194.
Bruen, B. & Ghosh, A. 2004. "Medicaid Prescription Drug Spending and Use" Kaiser Commission on Medicaid and the Uninsured Issue Paper. http://www.kff.org/medicaid/upload/Medicaid-Prescription-Drug-Spending-and-Use.pdf, accessed December 21, 2009.
Carey, B. 2005. "Little difference found in schizophrenia drugs". New Your Times, September 20.
Cohen, J. T. & Neumann, P. J. 2008, "Using Decision Analysis To Better Evaluate Pediatric Clinical Guidelines", Health Affairs, vol. 27, no. 5, pp. 1467-1475.
Cooper, L. M. 2009, "Comparative Effectiveness Research: A Useful Tool Responds", Health Affairs, vol. 28, no. 2, p. 601.
Demaria, A. N. 2009, "Comparative Effectiveness Research", Journal of the American College of Cardiology, vol. 53, no. 11, pp. 973-975.
Duggan, M. 2005. Do New Prescription Drugs Pay for Themselves? The Case of Second-Generation Antipsychotics. J. Health Econ. 24(1), 1-31.
Federal Coordinating Council for Comparative Effectiveness Research. Report to the President and the Congress. June 30, 2009.
Garber, A. M. & Tunis, S. R. 2009, "Does Comparative-Effectiveness Research Threaten Personalized Medicine?", New England Journal of Medicine, vol. 360, no. 19, pp. 1925-1927.
Gibbons, R. J., Gardner, T. J., Anderson, J. L., Goldstein, L. B., Meltzer, N., Weintraub, W. S., & Yancy, C. W. 2009, "The American Heart Association's Principles for Comparative Effectiveness Research. A Policy Statement From the American Heart Association", Circulation.
Gilmer TP, Dolder CR, Lacro JP, Folsom DP, Lindamer L, Garcia P, Jeste DV. 2004, Adherence to treatment with antipsychotic medication and health care costs among Medicaid beneficiaries with schizophrenia. The American Journal of Psychiatry, 161(4): 692-9.
Horn, S. D. & Gassaway, J. 2007, "Practice-based evidence study design for comparative effectiveness research", Medical Care , vol. 45, no. 10, p. S50-S57.
IOM Initial National Priorities for Comparative Effectiveness Research: Committee on Comparative Effectiveness Research Prioritization Board on Health Care Services, June 2009
Jobson, K.O. 2009, “The International Psychopharmacology Algorithm Project (IPAP).” www.ipap.org.
Johnston, S. C. & Hauser, S. L. 2009, "Comparative Effectiveness Research in the Neurosciences", Annals of Neurology, vol. 65, no. 2, p. A6-A8.
Kaldy, J. & Schlosberg, C. 2008, "Comparing apples to apples: policymakers take a shine to comparative effectiveness research", Consult Pharm, vol. 23, no. 9, pp. 666-678.
Kane, J.M. 2004. “Tardive dyskinesia rates with atypical antipsychotics in adults: prevalence and incidence” Journal Clinical Psychiatry, 65(suppl 9):16-20.
Lancet Editorial, 2009, "Comparative effectiveness research in the USA", Lancet, vol. 373, no. 9665, p. 694.
Leucht, S., Corves, C., Arbter, D., Engel, R.R., Li, C., & Davis, J.M. 2009. "Second-generation versus first-generation antipsychotic drugs for schizophrenia: a meta-analysis", Lancet, 373: 31–41.
Lewin Group. Comparative Effectiveness Research and Personalized Medicine: From Contradiction to Synergy White Paper. Presented Comparative Effectiveness Research and Personalized Medicine: Policy, Science, and Business on October 28, 2009.
Lewin Group. Access and Utilization of New Antidepressant and Antipsychotic Medications. Report submitted to The Office of the Assistant Secretary for Planning and Evaluation and The National Institute of Mental Health, U.S. Department of Health and Human Services, January, 2000. http://aspe.hhs.gov/health/reports/Psychmedaccess/.
Lauer, M. S. 2009, "Comparative Effectiveness Research: The View From the NHLBI", Journal of the American College of Cardiology, vol. 53, no. 12, pp. 1084-1086.
Lenert, L., Sturley, A. P., Rapaport, M.H., Chavez, S., Mohr, P., Rupnow, M. 2004, "Public preferences for health states with schizophrenia and a mapping function to estimate utilities from positive and negative syndrome scale scores." Schizophrenia Research, 71:155–165.
Laugesen, M. J. 2009, "Siren Song: Physicians, Congress, and Medicare Fees", Journal of Health Politics Policy and Law, vol. 34, no. 2, pp. 157-179.
Lubowitz, J. H. & Poehling, G. G. 2009, "Comparative effectiveness research: we must lead (so as not to be misled)", Arthroscopy, vol. 25, no. 5, pp. 455-456.
Luce, B. R., Paramore, L. C., Parasuraman, B., Liljas, B., & de Lissovoy, G. 2008, "Can managed care organizations partner with manufacturers for comparative effectiveness research?", Am J Manag Care, vol. 14, no. 3, pp. 149-156.
Lyles, A. 2008, "Comparative Effectiveness Research: NICE for the NHS, But False Starts for the US", Clinical Therapeutics, vol. 30, no. 9, pp. 1702-1703.
Matchar, D.B., Douglas C. McCrory, MD, MHS; Lori A. Orlando, MD, MHS; Manesh R. Patel, MD; Uptal D. Patel, MD; Meenal B. Patwardhan, MD, MHSA; Benjamin Powers, MD;
Gregory P. Samsa, PhD; and Rebecca N. Gray, DPhil, 2008, Systematic Review: Comparative Effectiveness of Angiotensin-Converting Enzyme Inhibitors and Angiotensin II Receptor Blockers for Treating Essential Hypertension. Annals of Internal Medicine 148(1): 16-29.
Mazor, K. M., Sabin, J. E., Goff, S. L., Smith, D. H., Rolnick, S., Roblin, D., Raebel, M. A., Herrinton, L. J., Gurwitz, J. H., Boudreau, D., Meterko, V., Dodd, K. S., & Platt, R. 2009, "Cluster randomized trials to study the comparative effectiveness of therapeutics: stakeholders' concerns and recommendations", Pharmacoepidemiol Drug Saf.
Meltzer, D, Huang, E., Jin, L., Shook, M., and M. Chin. 2003, “Major bias in cost-effectiveness analysis due to failure to account for self-selection: impact in intensive therapy for type 2 diabetes among the elderly.” Med Decision Making 23(6): 576.
Meltzer, D., Basu, A., and R. Conti. 2007, "The Economics of Comparative Effectiveness Studies: Societal and Private Perspectives." Draft manuscript prepared at the request of the IOM Roundtable on Evidence-Based Medicine, University of Chicago.
Meltzer, D., Basu, A., and H.Y. Meltzer. 2009, “Comparative Effectiveness Research for Antipsychotic Medications: How Much Research is Enough?” Health Affairs, 28(5): w794-w808.
Meltzer, H.Y. 2005. The metabolic consequences of long-term treatment with olanzapine, quetiapine and risperidone: are there differences?” International Journal of Neuropsychopharmacology, 8:153-6.
Meltzer, H.Y. 2009. Atypical antipsychotic drugs have their merits. Lancet, 373:1007.
Mohr, P.E., Cheng, C.M., Claxton, K., et al. 2004, "The heterogeneity of schizophrenia in disease states." Schizophrenia Research, 71: 83-95.
Naik, A. D. & Petersen, L. A. 2009, "The Neglected Purpose of Comparative-Effectiveness Research", New England Journal of Medicine, vol. 360, no. 19, pp. 1929-1931.
NIMH Perspective on Antipsychotic Reimbursement: Using Results from CATIE. http://www.nimh.nih.gov/about/director/updates/2006/nimh-perspective-on-antipsychotic-reimbursement-using-results-from-the-catie-cost-effectiveness-study.shtml (accessed September 17, 2009)
New York Times Editorial “Comparing schizophrenia drugs”, September 21, 2005.
Olfson, M., Marcus, S.C., and G. J. Wan, 2009, "Treatment Patterns for Schizoaffective Disorder and Schizophrenia Among Medicaid Patients", Psychiatric Services 60:210-216.
Parks, J. J., Radke, A. Q. and R. Tandon, 2008. "Impact of the CATIE Findings on State Mental Health Policy" Psychiatric Services 59(5):534–536.
Pearson, S. D., Knudsen, A. B., Scherer, R. W., Weissberg, J., & Gazelle, G. S. 2008, "Assessing The Comparative Effectiveness Of A Diagnostic Technology: CT Colonography", Health Affairs, vol. 27, no. 6, pp. 1503-1514.
Polinski, J. M., Wang, P. S. & Fisher, M. A. 2007, "Medicaid’s Prior Authorization Program And Access To Atypical Antipsychotic Medications", Health Affairs 26(3): 750-760.
Polsky, D., Doshi, J.A., Bauer, M.S. & Glick, H.A. 2006. Clinical trial-based cost-effectiveness analyses of antipsychotic use. Am J Psychiatry, 163: 2047–56.
Rich, E. C. 2009, "The policy debate over public investment in comparative effectiveness research", J Gen Intern Med, vol. 24, no. 6, pp. 752-757.
Rosenberg, L. 2009, "Comparative effectiveness research: making it work for those we serve", J Behav Health Serv Res, vol. 36, no. 3, pp. 283-284.
Rosenheck RA et al. CATIE Investigator’s Educations Series; 2007.
Rosengren, K. & Trinity, M. 2009, "Roundtable on Expanding Capacity for Comparative Effectiveness Research in the United States", Health Services Research, vol. 44, no. 2, pp. 327-342.
Rosenheck RA et al. “Cost-effectiveness of Second Generation Antipsychotics and Perphenazine in a Randomized Trial of Treatment for Chronic Schizophrenia” American Journal of Psychiatry,2006;163(12):2080-9.
Lon S. Schneider, M.D., Pierre N. Tariot, M.D., Karen S. Dagerman, M.S., Sonia M. Davis, Dr.P.H., John K. Hsiao, M.D., M. Saleem Ismail, M.D., Barry D. Lebowitz, Ph.D., Constantine G. Lyketsos, M.D., M.H.S., J. Michael Ryan, M.D., T. Scott Stroup, M.D., David L. Sultzer, M.D., Daniel Weintraub, M.D., Jeffrey A. Lieberman, M.D., for the CATIE-AD Study Group. 2006, “Effectiveness of Atypical Antipsychotic Drugs in Patients with Alzheimer's Disease” New England Journal of Medicine, 355(15):1525-1538
Schneeweiss, S. 2007, "Developments in post-marketing comparative effectiveness research", Clinical Pharmacology & Therapeutics, vol. 82, no. 2, pp. 143-156.
Selker, H. P. 2009, "Comparative effectiveness research: medical practice, payments, and politics: the need to retain standards of medical research", J Gen Intern Med, vol. 24, no. 6, pp. 776-778.
Stinnett A. & Mullahy, J. 1998. "Net Health Benefits: A New Framework for the Analysis of Uncertainty in Cost-Effectiveness Analysis." Medical Decision Making 18: S68-S80.
Soumerai SB, Law MR. “Cost-effectiveness of schizophrenia pharmacotherapy” American Journal Psychiatry,164:678, 2007.
Traynor, K. 2009, "Officials eye comparative effectiveness research", American Journal of Health-System Pharmacy, vol. 66, no. 5, p. 430.
Tunis, S., Clancy, C., Helms, W. D., McGinnis, J. M., & Pearson, S. D. 2009, "Roundtable on expanding capacity for comparative effectiveness research in the United States: discussion took place on June 3, 2007, at the AcademyHealth Annual Research Meetingin Orlando, FL", Health Serv Res, vol. 44, no. 2 Pt 1, pp. 327-342.
Wang, P. S., Ulbricht, C. M., & Schoenbaum, M. 2009, "Improving mental health treatments through comparative effectiveness research", Health Aff (Millwood), vol. 28, no. 3, pp. 783-791.
Wechsler, J. 2007, "More comparative effectiveness research could be beneficial when assessing new medical treatments", Formulary, vol. 42, no. 6, p. 411.
Wechsler, J. 2008, "Comparative effectiveness research legislation likely to raise drug pricing issues", Formulary, vol. 43, no. 9, pp. 342-343.
Timothy J. Wilt, MD, MPH; Roderick MacDonald, MS; Indulis Rutks, BA; Tatyana A. Shamliyan, MD, MS; Brent C. Taylor, PhD; and Robert L. Kane, MD. 2008, “Systematic Review: Comparative Effectiveness and Harms of Treatments for Clinically Localized Prostate Cancer” Annals of Internal Medicine 148(6): 435-448.
Weiden, P.J. and Oltson, M. 1995, “Cost of Relapse in Schizophrenia”, Schizophrenia Bulletin, 21(3):419-429.
Wu, E.Q., Shi, L., Birnbaum, H., Hudson T. & Kessler R. 2006. "Annual prevalence of diagnosed schizophrenia in the USA: a claims data analysis approach", Psychological Medicine 36:1535–1540.
Zigmond, J. 2009, "Healthy choices", Mod Healthc, vol. 39, no. 13, pp. 6-7, 16, 1.
Congress of the United Stated. Congressional Budget Office. Research on the Comparative Effectiveness of Medical Treatments: Issues and Options for an Expanded Federal Role. December 2007.