Embed Size (px)
Citation preview
The Impact of Cross-listing on the Cost of Equity Capital: The Case of
American Depository Receipts (ADRs) and Global Depository Receipts
(GDRs)*
Oksana Kim
The University of Melbourne Department of Accounting and Business Information Systems
Abstract
The study contributes to the cross-listing literature and examines the impact of cross-listing via an American Depository Receipt (ADR) or a Global Depository Receipt (GDR) program on the cost of equity capital. The study covers a global sample of firms that were cross-listed as ADRs on the NYSE, NASDAQ and AMEX, or GDRs on the London Stock Exchange (LSE). Using the implied cost of capital models that are based on the [1] realized accounting earnings (O’Hanlon and Steele 2000 - OHS) and [2] analysts’ predictions (Easton et al. 2002 - ETSS) and asset-pricing models (Fama and French 1993), the study finds that the cost of capital declines for both ADRs and GDRs. This result holds across both methodological approaches to estimating the cost of capital. Consistent with this decline being due to information risk reduction, we find some evidence that it varies as a function of the quality of the disclosed information. The findings of the study will enhance our understanding of why firms chose to cross-list as ADRs or GDRs, provide insights into the impact of information risk on the cost of capital and have practical implications for exchanges that consider accommodating depository receipts programs, such as Dubai, Singapore, and Hong Kong. Keywords: American Depository Receipts, Global Depository Receipts, cost of equity capital, information risk, cross-listing.
* We thank the participants of the workshops at the University of Technology Sydney and the University of New South Wales for their helpful comments and suggestions.
2
1. INTRODUCTION The study investigates the impact of cross-listing via American Depository Receipts (ADRs)
or Global Depository Receipts (GDRs) on cost of equity capital. While ADRs, a more
traditional cross-listing mechanism, were extensively examined in the empirical cross-listing
literature, the GDRs, which is a more recent globalization phenomenon, received limited
attention. The two cross-listing mechanisms are expected to result in cost of capital decline
through a number of avenues. One of them is the reduction in information risk of firms that
choose to cross-list, as they become a subject to more stringent mandatory disclosure
requirements enforced by the respective standard setting regulatory bodies. In case of ADRs it
is the Securities and Exchanges Commission (SEC), while in case of the GDRs listed on the
London Stock Exchange’s (LSE) Main Market it is the United Kingdom Listing Authority
(UKLA)2 that is a regulatory body for all regulated markets of the European Union.
The study has a twofold motivation and will make a number of contributions to both the
cross-listing literature and the literature examining the impact of information risk on cost of
capital. First, prior studies did not examine properties of GDRs alone or in comparison to
ADRs. GDR programs are fundamentally different from ADR programs in a number of ways
and therefore generalizing findings of ADR-based empirical studies on GDRs may not be
appropriate. As of 2006, the capital raising activity via GDRs far exceeded that of ADRs (JP
Morgan 2008). If the total Depository Receipts market constituted a stock exchange of its
own, it would have the world’s 10th largest market capitalization (Bank of New York 2008).
The market would be far ahead of the Australian and Swiss markets in terms of liquidity and
well ahead of the Toronto Stock Exchange and the Hong Kong Stock Exchange in terms of
trading volume, for instance. The share of GDRs in the total Depository Receipts (DR) market
was 26 percent as of 2005, reached 44 percent as of 2007 and is expected to increase (Bank of
New York 2008). Given the growing economic significance of GDRs, it is important to
understand whether the alternative depository receipts programs such as GDRs provides
benefits in the form of a reduced cost of capital compared to ADRs that represent a more
traditional cross-listing tool.
2 Formerly known as the Securities and Investments Board Ltd, currently also known as the UK Financial Services Authority (FSA).
3
The motivation of this study is to provide empirical evidence on the alternative programs,
GDRs, alone and in comparison to the more traditional cross-listing mechanism - ADRs. The
findings of the study will have important practical implications for firms intending to cross-
list via an ADR or a GDR program, as well as for stock exchanges that have been actively
promoting themselves as a new cross-listing destination in an attempt to enter the cross-listing
market, for example Dubai, Singapore, Hong Kong, etc.
Second, the study contributes to the empirical literature examining the association between
information risk and cost of capital. Among the studies that have established a theoretical
association between the information risk and the cost of equity capital are those of Lambert,
Leuz and Verrecchia (2007), Easley and O’Hara (2004), and others. While a strong theoretical
link between the information risk and the cost of capital is well established in the literature,
the findings of the empirical work that attempted to test this prediction in cross-listing settings
are mixed. Using realized returns methodology Errunza and Miller (2000) documented
economically significant cost of capital decline – around 42 percent. Employing a different
methodology - the implied cost of capital models – Hail and Leuz (2009) documented a
modest cost of capital decline for exchange-listed ADRs, while increase in cost of capital for
the Rule 144A private placement programs. The motivation for this study is to provide new
empirical evidence on the impact of changes in the information environment as a result of
cross-listing on the cost of capital, given the mixed results of extant literature. Provided that
the requirements of the SEC in relation to ADRs and those of UKLA in relation to GDRs
differ in terms of the quantity and quality of the disclosed information, the two samples of
ADR and GDR cross-listed firms offer a powerful experiment for testing the rank order effect
of the theory of information risk on the cost of capital.
Next, the study makes a contribution to the accounting literature that examines the association
between the level of disclosure and cost of capital. The findings from this literature have been
mixed (Botosan, 1997; Botosan and Plumlee 2002). One of the reasons for the mixed results
of extant literature is that the studies have examined the association in the levels of the two
variables and were primarily based on voluntary disclosure practice of the US-registered firms
where the disclosure environment under the US GAAP regime is rich anyway (Leuz and
Verrecchia 2000). In addition, market participants recognize that voluntary commitment does
not necessarily imply enhanced reporting in the future and may be reversed any time (Leuz
and Verrecchia 2000). In this study we propose to construct experimental settings that allow
4
tests for the association between the changes in the level of disclosure and cost of equity
capital as a result of a mandatory disclosure increase. This will represent a more powerful test
of the impact of improved disclosure on cost of capital3.
The final contribution of the study is in the improved research design. The potential
explanation for the mixed findings of prior cross-listing literature is both the low power of
empirical tests due to limitations of the research design and sampling technique and failure to
control for potential endogeneity. Recognizing this, we adopt several innovations. First, the
study controls for the self-selection bias by using the ADR and GDR cross-listed firms as
their own control. This avoids the matching procedure used in prior studies that compared
cost of capital of all existing ADRs and non-ADRs4. Second, when comparing the magnitude
of changes in cost of capital of ADRs versus GDRs we use a two-stage estimation procedure
that addresses a potential self-selection bias issue and attempts to account for a number of
characteristics that might drive a firm’s decision to list as an ADR or a GDR.
Another potential explanation for the mixed findings of prior studies is inappropriate and
noisy sample construction. Prior studies used the term “ADR” and “cross-listed”
interchangeably, while in fact far not all ADRs (and GDRs) are cross-listed firms. It is often
the case that one cross-listed firm enters an ADR/GDR sample several times when a company
changed a name, was acquired or was restructured, for instance. Besides, there are multiple
cases when ADR-listed firms changed cross-listing programs and/or switched to a GDR
listing (and vice versa), or prior to an ADR/GDR listing they had been directly listed on the
exchanges that required extensive disclosure of accounting information. Assigning cross-
listed firms to a correct sub sample is crucial to the study given small sample sizes of ADRs
and GDRs. Therefore the manual background check for each ever existing ADR and GDR
3 Larcker and Rusticus (2010) discuss problems with estimating the association between voluntary disclosure and cost of capital. They argue that while the earlier studies treated the disclosure as exogenous, the relationship in fact suffers from endogeneity issue. It is possible that firms with lower disclosure level have higher cost of capital and hence the association between the cost of capital and the disclosure level is negative, provided the disclosure level is a priced factor. But if such firms decide to disclose more (voluntary disclosure) and do not succeed, the observed association will be positive. This may explain mixed findings of the studies such as Botosan (1997). In the present study this is not an issue, as cross-listed firms are subject to mandatory disclosure and do not have much discretion over the extent and content of the reported information. 4 As argued by Stulz (1999), the problem with the interpretation of results based on a matching procedure is that the theory does not make a direct prediction about how changes in cost of capital for ADRs should differ from non-ADRs. Instead, the theory helps making predictions in regard to the changes in cost of capital for the same firms after a certain event that is expected to result in such changes.
5
program is essential5. In addition, some ADR and GDR-listed firms never list on their
domestic markets and hence never become cross-listed. Such firms should not be treated as
cross-listed firms and should be excluded from the ADR/GDR sample.
The study pays specific attention to the institutional differences and the pre- and post-listing
disclosure requirements of ADRs and GDRs that were largely overlooked in prior literature.
For example, prior literature that mentioned existence of GDRs as a LSE listing tool argued
that GDRs were not a subject to enhanced disclosure requirements and hence were not
expected to experience positive changes in the information environment upon cross-listing
(Abdallah 2008). While the argument is applicable to the GDRs listed on the unregulated
Professional Securities Market (PSE) and the Alternative Investment Market (AIM) of the
LSE, it is not applicable to the GDRs listed on the Main Market of the LSE that are the focus
of the present study. The Main Market (MM) of the LSE is the European Union (EU)
regulated market that puts in place stringent disclosure requirements for all companies listed
on it. Although being exempt from a number of reporting obligations that the native (directly
listed) UK firms are subject to, the GDR programs listed on the MM have been a subject to
more rigorous disclosure requirements compared to their domestic markets. The institutional
details and the disclosure requirements for the existing LSE markets are disclosed in details in
Section 2.
Our findings indicate that cost of capital declines for both ADRs and GDRs and the result
holds across both methodological approaches to estimating cost of capital. There is, however,
only week evidence in support to the prediction that the magnitude of changes in cost of
capital varies as a function of disclosed information.
The remainder of the paper is organized as follows. Section 2 provides background details on
ADRs and GDRs, Section 3 is dedicated to the related research and hypotheses development.
Section 4 discusses data collection process and the issues associated with the manual
background check, Section 5 describes the research design. Section 6 discusses the results of
empirical tests and Section 7 concludes.
5 Section 4 elaborates on the striking findings of the manual background check for each ADR and GDR program that ever existed and provides evidence on how the composition of the ADRs and GDRs sample changes as a result of the background verification compared to if a simple matching procedure is used.
6
2. DEPOSITORY RECEIPTS PROGRAMS: HISTORY, TRENDS AND INSITUTIONAL DETAILS
2.1. HISTORY AND TRADING MECHANISM
As documented by JP Morgan (2003), the history of the first depository receipt program goes
back to 1920s. The UK-based retail company “Selfridge Provincial Stores Ltd.” decided to
expand its shareholding base and aimed to start selling its shares to the US investors. As the
same time, the US investors expressed their interest in buying the company’s shares; however
the awkward settlement procedures complicated the process. For instance, the potential US
buyers would have to pass through the list of registered holders in England in order to buy the
shares (Deutsche Bank 2003). At the same time, if a US investor further decided to sell the
shares to other US investors through the NYSE, he would fail to do so because the new
investor would have to be registered in the UK as well. Hence, there was a clear need to
establish the mechanism that would allow overcoming those barriers (Deutsche Bank 2003;
Mondevisione 2009).
A US bank, Morgan Guarantee Trust (the predecessor of the J.P. Morgan) solved the problem
by holding the Selfridge’s shares on its name in the UK and at the same time issuing
promissory notes to the US investors through its US branch. The notes were freely tradable on
the NYSE, as they were registered in the US, and had no limitations on purchase and
transferability (JP Morgan 2003). The mechanism proved to be a successful tool and
following the Selfridge’s practice, a few other companies expressed their desire to open the
same programs. The promissory notes issued by the Guarantee Trust became known as
“American Depository receipts” and were a predecessor of today’s ADRs (JP Morgan 2003).
The stock market crush in 1929 and the following periods of Great Depression in 1930s
resulted in lack of investment resources and low demand for foreign issuers’ securities. With
stock markets recovering from the financial crisis, the World War II resulted in certain
restrictions imposed on the capital movement (Mondevisione 2009). The DR programs no
longer existed until the US economy partially recovered and in 1950’s the new era for the DR
programs began with SEC’s introduction of the ADR programs registration in the US market
(Deutsche Bank 2003). In 1960-1970s the ADR programs were primarily in high demand by
7
the leading hi-tech and car manufacturing companies from Japan6 and the mining companies
from South Africa7. More companies from the developed markets joined the ADR market in
1980s (primarily from Australia and Great Britain).
The cross-listing boom started in 1990s primarily due to the relaxation of the ADR
registration requirements accompanied by the development of trading and communication
technology. The globalization process resulted in the growing desire from the US investors to
diversify their portfolios and invest in foreign companies’ stocks (Karoliy 1998)8. The ADR
mechanism that was substantially less costly than the direct listing of shares in the US gave
rise to the corresponding growing offer of foreign equities to the US investors. Finally, the
companies from emerging markets (Latin America, Middle East, Eastern Europe, and Asia)
joined the ADRs market primarily in mid-late 1990s and have continued their cross-listing via
the ADR programs until the present moment9.
The growing ability of emerging markets’ companies to offer their stocks overseas (not
limited by the US market) due to the gradual removal of trade barriers and the overall
relaxation of the capital movement was met with the foreign, non-US (global) investors,
demand for their securities (Mondevisione 2009). This gave rise to the DR program that
represents an alternative to the ADR programs, namely Global Depository Receipts (GDRs).
Initially it was expected that Luxembourg Stock Exchange (LuxSE) would be the primary
exchange for GDRs due to its well-established historic linkage to the Eurobond market and
direct settlement procedures through Euroclear and Clearstream electronic systems
(Mondevisione 2009). However, the London Stock Exchange (LSE) was the first exchange
that provided a convenient regulatory approach and established trading of GDRs through the
International Order Book (IOB) with high liquidity and global investor access (Russian IPO
2010). Therefore the LSE and not Luxembourg occupied the niche of GDR business
(Mondovisione, 2009). The first GDR program was registered on the LSE in 1994 but other
exchanges have been accommodating a few new GDR programs per year. Luxembourg
5 Sony, Panasonic, TDK, Toyota were listed as ADRs on the NYSE back in 1973. 7 AngloGold Ashanti, Gold Fields, Harmony Gold Mining were listed as ADRs on the NYSE in early 1970s. 8 The example would be a relaxation of the requirement for institutional investors to hold privately placed securities for two years before trading them. 9 The example of the cost efficiency of ADRs over the direct listing is absence of brokerage fees, lower accounting and legal costs, and a low chance of the trade failure in case of ADRs, compared to the direct listing (Karoliy 1998).
8
remains the second largest GDR destination after the LSE, followed by Dubai, Singapore, and
Hong Kong. The LSE, however, is the clear leader in attracting GDRs by providing special
services to firms intending to cross-list as GDRs and maintaining comprehensive database on
GDR trends, history, and analysis (London Stock Exchange 2009).
GDRs target investors from all over the world and are done primarily by the companies from
emerging (developing) markets, while ADRs have been and remain the major investment tool
for the US investors (Bank of New York 2006). Both ADRs and GDRs represent a certificate,
an underlying number of shares, and the creation and cancellation mechanisms are very
similar for them. There is an effective exchange mechanism in place between a local
custodian bank based in the domestic market of an ADR/GDR-listed firm, and a foreign
depository bank that represents a firm overseas10. When an international investor wishes to
invest in the ADR/GDRs, its broker contacts a foreign depository bank with a request to
deliver a certain number of securities. The depository bank then contacts the local custodian
bank that purchases the required number of shares from the local market, holds them and
gives instructions to the depository bank to issue a certain number of certificates representing
the number of underlying shares. The depository bank then issues DRs on the name of the
international investor. The cancellation of DRs is a reverse mechanism. Such a dual exchange
mechanism establishes a price linkage between the two markets. Therefore the liquidity of the
DRs should be the same as liquidity of underlying shares and there are no arbitrage
opportunities expected, as the DR certificates are simply multiple of common shares. In
practice, however, due to state restrictions that put a cap on the tradability of DRs on foreign
markets, the DRs may be of lower liquidity than their underlying shares (Russian IPO 2010).
Despite the similarities in purpose and mechanism of establishing a program, ADRs and
GDRs differ in terms of the disclosure requirements set up by the respective listing authorities
– SEC in case of ADRs and UKLA (FSA) in case of GDRs. The institutional details of ADRs
and GDRs are discussed separately.
2.2. ADRs: REGULATORY STRUCTURE AND INSITUTIONAL DETAILS
2.2.1. Regulatory Structure
10 The four major financial institutions that have had a proven success of working with GDRs are the Bank of New York Mellon, the Citibank, the JP Morgan Chase, and the Deutsche Bank.
9
ADRs provide a number of advantages for US investors compared to buying foreign stocks on
local markets. First, the settlements are done in accordance with the US regulations and are
less time-consuming and the transaction costs (such as brokerage fees) are substantially lower
(Karolyi 1998). The trade failure rates are typically lower than on domestic markets (Velli
1994). Second, for some types of ADRs the issuers are required to be registered with the
Securities and Exchanges Commission (SEC) and to fulfill a set of stringent requirements,
both ex ante and as ongoing obligations, resulting in lower information asymmetry for
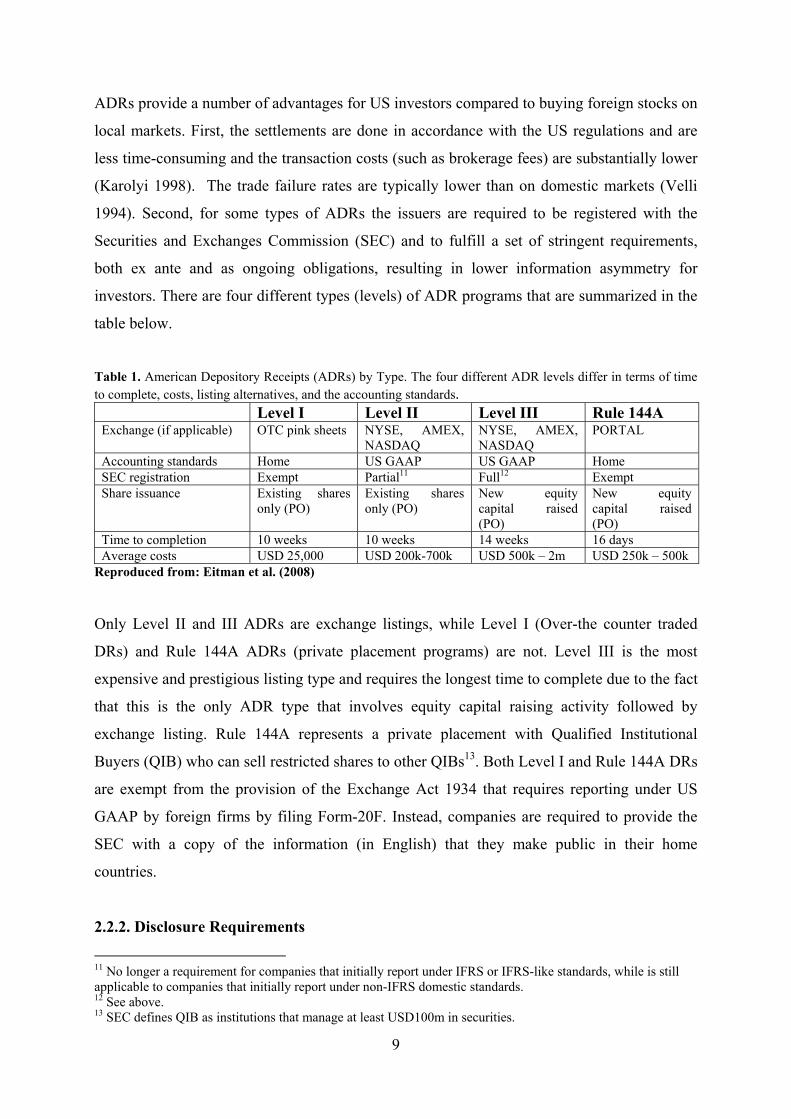
investors. There are four different types (levels) of ADR programs that are summarized in the
table below.
Table 1. American Depository Receipts (ADRs) by Type. The four different ADR levels differ in terms of time to complete, costs, listing alternatives, and the accounting standards. Level I Level II Level III Rule 144A Exchange (if applicable) OTC pink sheets NYSE, AMEX,
NASDAQ NYSE, AMEX, NASDAQ
PORTAL
Accounting standards Home US GAAP US GAAP Home SEC registration Exempt Partial11 Full12 Exempt Share issuance Existing shares
only (PO) Existing shares only (PO)
New equity capital raised (PO)
New equity capital raised (PO)
Time to completion 10 weeks 10 weeks 14 weeks 16 days Average costs USD 25,000 USD 200k-700k USD 500k – 2m USD 250k – 500k
Reproduced from: Eitman et al. (2008)
Only Level II and III ADRs are exchange listings, while Level I (Over-the counter traded
DRs) and Rule 144A ADRs (private placement programs) are not. Level III is the most
expensive and prestigious listing type and requires the longest time to complete due to the fact
that this is the only ADR type that involves equity capital raising activity followed by
exchange listing. Rule 144A represents a private placement with Qualified Institutional
Buyers (QIB) who can sell restricted shares to other QIBs13. Both Level I and Rule 144A DRs
are exempt from the provision of the Exchange Act 1934 that requires reporting under US
GAAP by foreign firms by filing Form-20F. Instead, companies are required to provide the
SEC with a copy of the information (in English) that they make public in their home
countries.
2.2.2. Disclosure Requirements
11 No longer a requirement for companies that initially report under IFRS or IFRS-like standards, while is still applicable to companies that initially report under non-IFRS domestic standards. 12 See above. 13 SEC defines QIB as institutions that manage at least USD100m in securities.
10
ADR Level II cross-listed firms are required to file Form 20-F annually and Form 6-K
quarterly after cross-listing. Those forms require reconciliation of material differences in
companies’ financial statements (major balance sheet and income statement items) to the US
GAAP. In addition to this, ADR Level III firms (capital raising firms) must fully reconcile
their financial statements to the US GAAP and submit Form F-1 (registration of securities
publicly offered to the US investors through IPO) and Form 8-K (disclosure of material
information made available to the home market’s shareholders). Thus, Level II and III ADRs
are associated with the extended and most rigorous disclosure requirements.
Level II and III ADRs can be listed on the NYSE, NASDAQ, and AMEX and are clearly
subject to more stringent disclosure requirements than Level I ADRs and Rule 144A private
placement programs. This study focuses on Level II and Level III ADRs, while Level I and
Rule 144A programs are not covered due to the fact that the disclosure requirements for them
are low and are not expected to result in improvement in firms’ information environment
upon cross-listing14.
Prior to 1983 there were so called unsponsored ADRs in place that were originated by
depositories in response to the investors’ demand and did not require a formal agreement with
the issuer. The number of such programs was small; they were not subject to enhanced
disclosure requirements upon cross-listing and no longer exist. Therefore the unsponsored
ADRs are not covered in the present study.
2.3. GDRs: REGULATORY STRUCTURE AND INSITUTIONAL DETAILS
2.3.1. Regulatory Structure
The study focuses on the Main Market LSE-listed GDRs and does not cover GDRs listed on
the LuxSE and other exchanges due to the fact that, first, the LSE is the world’s largest GDR
market in terms of market capitalization and liquidity (London Stock exchange 2009) and,
second, the cross-sectional variety of companies trading as GDRs through the LSE’s
14 Potentially Level I and Rule 144A programs could serve as a controlling sample for the exchange-listed Level II and III ADRs due to differential disclosure requirements – low for the former group of programs and extensive for the latter group. However, this would lead to the same trap of using a matching procedure used in prior studies that is viewed as a limitation in the present study due to the self-selection bias issues. Instead, the study attempts to control for this weakness in methodology by using the samples of the same cross-listed firms as their own control and therefore Level I and Rule 144A are not examined.
11
International Order Book (IOB) far exceeds that of the next largest GDR destination – the
LuxSE. To compare, as of 2009 there were over 270 securities from 46 countries trading on
the IOB service as GDRs (Russian IPO 2010), while the majority, 88 percent, of the LuxSE
GDRs were represented by companies from India and Taiwan (Bank of New York 2009).
The structure of the LSE GDRs closely parallels that of ADRs. There are Level I OTC-traded
GDRs that are not subject to any enhanced disclosure requirements. Level II and Level III
GDRs are exchange-listed programs. The companies that chose the LSE as their GDR-listing
destination has a choice of listing on the Main Market, the Professional Securities Market
(PSM), and the Alternative Investment Market (AIM). The AIM and the PSE are designed for
listing by small and mid-cap firms with high growth potential. The PSE is a relatively new
market and is the least liquid of all the LSE markets (London Stock Exchange 2009). Both
markets are not EU regulated markets. There are very few GDRs listed on the PSE and AIM,
compared to the Main Market, which is the most highly regulated market. The reason for this
is that the LSE discourages foreign entities from listing GDRs on the AIM due to insufficient
regulatory framework (Russian IPO 2010).
The UKLA (FSA) is the regulatory body for the Main Market. It reviews and approves
companies’ listing applications and prospectuses and grants a listing status to successful
applicants. The rules governing the admission of securities to trade on regulated markets and
the continuing obligations are set out in the Listing Rules, the Prospectus Rules, and the
Transparency and Disclosure Rules. The LSE, however, is responsible for trade admission
and makes a decision about which market a company qualifies to be admitted to (JP Morgan
2008). To be admitted to the trade on the Main Market, for instance, a company should have a
market capitalization of at least GBP 700 000, have underlying shares that are fully
transferable, and 25 percent of the GDRs must be in public hands.
Similarly to the Rule 144 for ADRs, there is a private placement program for GDRs that
represents a selective process of targeting a small number of QIBs. This is generally known as
a Regulation S (Reg S) offering. At the same time, a company may choose to include both the
US and non-US (global) QIBs into the pool by issuing a US tranche under the Rule 144A that
does not require a formal registration with the SEC and doesn’t lead to the enhanced
disclosure under US GAAP. In this case the GDR program is called a Bifurcated GDR.
12
2.3.2. Disclosure Requirements
While the trading mechanism is similar for ADRs and GDRs, the reporting and disclosure
requirements differ in terms of quantity, quality, and frequency of the disclosed information.
The European nations have been going through the unionization process, and so did their
markets. The development of a single trade market system with a regulatory system that
would apply to all member states of the European Union (EU) have resulted in bringing the
regulated markets of Europe in compliance with the EU Directives (FSA 2010). While each
regulated European market has its own national listing authority (UKLA in the United
Kingdom), the transparency and disclosure requirements set by the EU Directives apply to all
the companies listed on those regulated markets. The GDRs listed on the Main Market of the
LSE therefore must comply with the minimum disclosure requirements set up by the EU and
additionally with the specific requirements set up by the UKLA and the LSE (FSA 2009).
In contrast to the ADRs for which the disclosure requirements have remained relatively
unchanged historically (in terms of the frequency and the extent of the disclosed information,
filing the forms, reporting GAAP, etc.), the disclosure requirements for GDRs have
experienced substantial changes starting from the first year of GDRs registration, 1994, until
the present day. The changes primarily concern the accounting standards in accordance to
which GDRs were to disclose information and report. Historically, prior to 2005 the GDRs
listed either on the Main Market, PSE or AIM, were allowed to show the financial
information in the prospectus, as well as ongoing obligations, based on their national GAAP.
However, the Main Market LSE GDRs disclosed the major items of the balance sheet and the
income statement in accordance with the International Accounting Standards (IAS) prior to
2001 and in accordance with the International Financial Reporting Standards (IFRS) after
2001. In addition, the financial statements were to be audited annually in accordance with the
International Standards on Auditing (ISA). Any departure from the IAS and ISA would have
to be explained and the UKLA had discretion to decide whether or not the disclosed
information was in compliance with its requirements set up for the securities listed on the
Main Market.15 The GDRs listed on the PSE and AIM were exempt from such requirements
15 The UKLA guidance on the Depository Receipts (2000) cites: “The UK Listing Authority may enquire as to whether accounting principles which are consistent with IAS have been applied and as to the standing of the
13
and were allowed to submit the information that they made available to domestic market
investors.
Starting from 2005 all companies listed on the EU-regulated markets, including the GDRs
listed on the Main Market of the LSE, were required to fully report under IFRS or another
GAAP that was deemed equivalent under the EU regulation 1569/2007. Those are US GAAP,
Canadian GAAP and Japanese GAAP. This requirement arises from the EU regulation
1606/2002, which mandated the use of IFRS for listed groups in the EU from 2005. As prior
to 2005, the GDRs listed on the PSE or AIM of the LSE are exempt from the enhanced
disclosure requirements.
To summarize, the GDRs listed on the Main Market of the LSE were subject to partial
disclosure of the financial information in accordance with IAS/IFRS and the annual audit in
accordance with ISA prior to 2005, and full reconciliation of the annual financials to the IFRS
subsequent to 2005. The extent of the information disclosed by those GDRs was greater than
what they reported on their domestic market and was in compliance with the LSE, UKLA and
EU directives. The PSE and AIM GDRs were exempt from all the enhanced disclosure
requirements and the quantity of disclosed information for them was lower.
2.4. DIFFERENTIAL DISCLOSURE REQUIREMENTS FOR ADRs VERSUS GDRs
The above discussion on the differential quality and quantity of disclosed information by
ADRs versus GDRs can be summarized as follows:
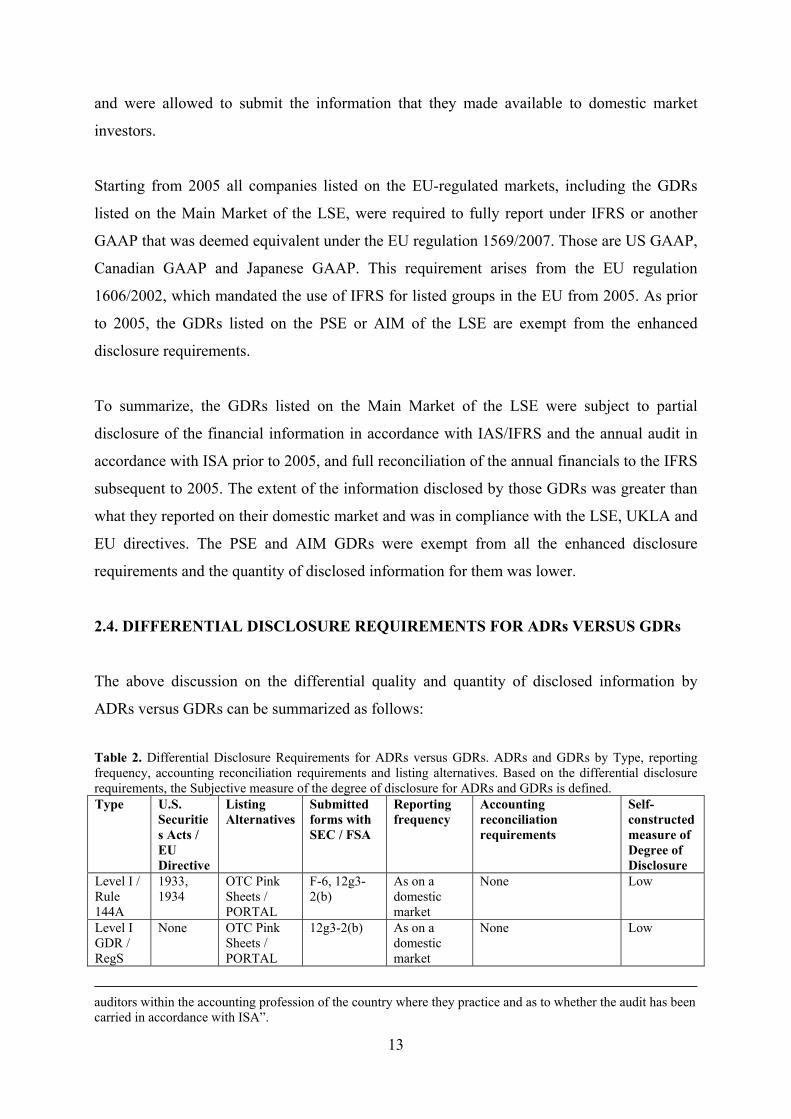
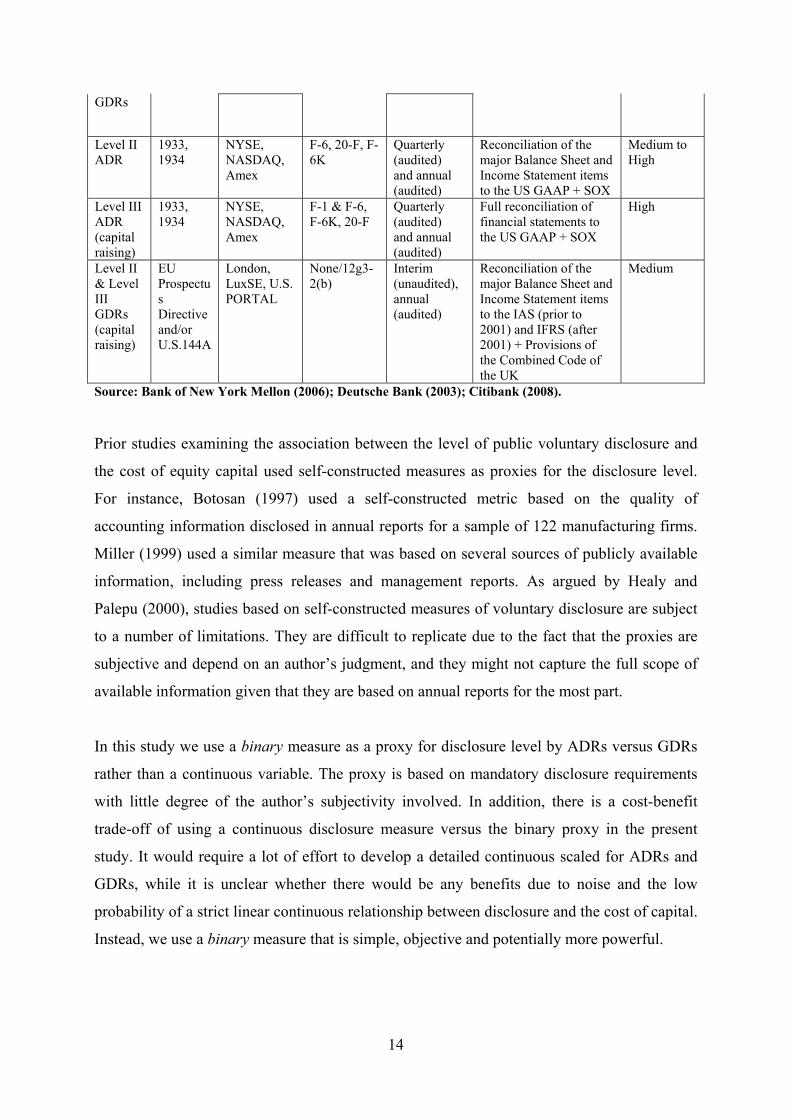
Table 2. Differential Disclosure Requirements for ADRs versus GDRs. ADRs and GDRs by Type, reporting frequency, accounting reconciliation requirements and listing alternatives. Based on the differential disclosure requirements, the Subjective measure of the degree of disclosure for ADRs and GDRs is defined. Type U.S.
Securities Acts / EU Directive
Listing Alternatives
Submitted forms with SEC / FSA
Reporting frequency
Accounting reconciliation requirements
Self-constructed measure of Degree of Disclosure
Level I / Rule 144A
1933, 1934
OTC Pink Sheets / PORTAL
F-6, 12g3-2(b)
As on a domestic market
None Low
Level I GDR / RegS
None OTC Pink Sheets / PORTAL
12g3-2(b) As on a domestic market
None Low
auditors within the accounting profession of the country where they practice and as to whether the audit has been carried in accordance with ISA”.
14
GDRs
Level II ADR
1933, 1934
NYSE, NASDAQ, Amex
F-6, 20-F, F-6K
Quarterly (audited) and annual (audited)
Reconciliation of the major Balance Sheet and Income Statement items to the US GAAP + SOX
Medium to High
Level III ADR (capital raising)
1933, 1934
NYSE, NASDAQ, Amex
F-1 & F-6, F-6K, 20-F
Quarterly (audited) and annual (audited)
Full reconciliation of financial statements to the US GAAP + SOX
High
Level II & Level III GDRs (capital raising)
EU Prospectus Directive and/or U.S.144A
London, LuxSE, U.S. PORTAL
None/12g3-2(b)
Interim (unaudited), annual (audited)
Reconciliation of the major Balance Sheet and Income Statement items to the IAS (prior to 2001) and IFRS (after 2001) + Provisions of the Combined Code of the UK
Medium
Source: Bank of New York Mellon (2006); Deutsche Bank (2003); Citibank (2008).
Prior studies examining the association between the level of public voluntary disclosure and
the cost of equity capital used self-constructed measures as proxies for the disclosure level.
For instance, Botosan (1997) used a self-constructed metric based on the quality of
accounting information disclosed in annual reports for a sample of 122 manufacturing firms.
Miller (1999) used a similar measure that was based on several sources of publicly available
information, including press releases and management reports. As argued by Healy and
Palepu (2000), studies based on self-constructed measures of voluntary disclosure are subject
to a number of limitations. They are difficult to replicate due to the fact that the proxies are
subjective and depend on an author’s judgment, and they might not capture the full scope of
available information given that they are based on annual reports for the most part.
In this study we use a binary measure as a proxy for disclosure level by ADRs versus GDRs
rather than a continuous variable. The proxy is based on mandatory disclosure requirements
with little degree of the author’s subjectivity involved. In addition, there is a cost-benefit
trade-off of using a continuous disclosure measure versus the binary proxy in the present
study. It would require a lot of effort to develop a detailed continuous scaled for ADRs and
GDRs, while it is unclear whether there would be any benefits due to noise and the low
probability of a strict linear continuous relationship between disclosure and the cost of capital.
Instead, we use a binary measure that is simple, objective and potentially more powerful.
15
We classify ADRs and GDRs in accordance with subjective binary measure proxying for
overall Degree of Disclosure (final column of Table 2). Based on the accounting
reconciliation requirements, quantity of disclosed information and the reporting frequency
summarized in Table 2, the degree of disclosure is high for level III capital raising ADRs, is
medium for Level II and III GDRs and is medium-to-high for level II ADRs16. Overall, the
quality of the disclosed information is higher for ADRs compared to GDRs due to more
rigorous disclosure requirements put in place by the SEC compared to those of UKLA. The
quantity of the disclosed information should be higher for ADRs, too, given the higher
reporting frequency and the fact that GDRs are exempt from preparing a number of
statements and forms ADRs must submit. For instance, GDR-listed firms do not have to
include the forecast information in the prospectus and in later reports, don’t have to prepare
the working capital statement, do not file pro-forma financial statements in case of significant
changes in business, etc. In addition, their interim financials do not have to be audited. To
summarize, the anticipated improvements in the information environment of cross-listed firms
are higher for ADRs, compared to GDRs. The argument is further developed in Section 3.
3. HYPOTHESES DEVELOPMENT
3.1. Related Research
While a firm’s cost of capital is crucial to its decisions, there is still no consensus in the
theoretical and empirical literature as to whether information risk is priced. A number of
theoretical studies provide support for the view that firms’ information environment affect
expected returns. That is, firm-specific information is a priced factor. Economic theory
suggests that there are two channels through which information risk can affect expected
returns (cost of capital) – the diversification and the adverse selection path. The first stream of
research focuses on the incomplete information argument (Merton 1987) and the second
stream builds on the asymmetric information explanation (Easley and O’Hara 2004).
The investor recognition explanation in the study by Merton (1987) represents the first stream
of related research. Merton examined how stocks are priced in equilibrium when the
information about existing stocks is incomplete, i.e. investors are unaware about existence of
16 The classification is in line with that of Bank of New York Mellon (2008). One point to make here is that the presented disclosure requirements that are in place at cross-listing destinations should be treated as minimum mandatory disclosure requirements, as even under mandatory reporting regime some firms might choose to disclose more information voluntarily.
16
some stocks. He argues that incomplete information results in the under-diversification
problem. As a result, some firms will be recognized by relatively few investors and will
experience lower demand for their securities. Such firms should offer compensation to other
investors in the form of higher returns and will have higher cost of capital as a result.
More recently Easley and O’Hara (2004) developed a model showing that firms with higher
proportion of private versus public information have higher expected returns. They argue that
informed investors are better able to change their portfolios when the new information
becomes available. Uninformed investors end up holding more stocks with bad news, for
which they require compensation. The information risk they face cannot be diversified away
and is therefore priced. Overall, the difference in composition of information, public versus
private, should affect cost of capital. Other studies have also showed a theoretical link
between firms’ information environment and cost of equity capital but used a different
approach, e.g. Leuz and Verrecchia (2004).
The theoretical predictions on the positive association between information risk and cost of
capital have been empirically tested using different characteristics for firm-specific proxies
for information environment. Using the level of voluntary disclosure by firms as a proxy for
information environment, Botosan and Plumlee (2002) documented negative association
between the level of disclosure and cost of capital. Francis et al. (2004) used seven attributes
of earnings that they believed were a premier-source of firm-specific information and reached
a similar conclusion. The findings of Francis et al. (2005) who focused on the accrual quality
and Barth and Landsman (2003) who used value relevance as firm-specific information
attributes are in line with the predictions of Easley and O’Hara (2004), too. Finally,
Bhattacharya et al. (2003) and Francis et al. (2005) provided evidence on the negative
association between country-level measures of disclosure and cost of equity capital of firms
domiciled outside the US.
A number of theoretical and empirical studies found only partial support to the predicted
positive association between information risk and cost of capital. Lambert et al. (2007) built a
model that is consistent with the Capital Asset Pricing Model (CAPM) and includes multiple
securities whose cash flows are correlated. They demonstrated that the information risk can
affect required returns directly through the market participants’ assessment of the covariance
of firms’ cash flows with those of the market, and indirectly through firms’ decisions.
17
Accordingly, information risk affects firms’ beta and not the required returns, and if the beta
is measured with error, the information risk might appear to be a priced factor. They extended
their analysis to a model with multiple securities and demonstrated that as the number of
market participants (investors) increases, the information risk is more likely to be diversified
away.
The more recent study by Hughes, Liu and Liu (2007) builds on Easley and O’Hara (2004)
and shows that in a large economy model with the asymmetric information, the risk premium
is determined by the market betas and factor risk premiums. After controlling for beta in the
cross-section, information asymmetry does not affect required returns. To summarize, the
findings of the theoretical information risk studies, with some exception, provide support to
the positive association between the information risk and the cost of capital.
3.2. Testable predictions
The review of the theoretical and empirical literature on information risk suggests that
investors require higher rates of return when information is incomplete (investor recognition
hypothesis, Merton 1987) or is asymmetric (adverse selection problem, Easley and O’Hara
2004).
Easley and O’Hara argue that for two stocks that are otherwise identical, the stock with a
higher proportion of private and less public information will have larger expected returns.
This occurs when uninformed investors are unable to infer information from prices and treat
stocks with greater proportion of private information as riskier. These investors, however, are
still better off holding stocks with little public information rather than holding no stocks at all
(Easley and O’Hara 2004, Proposition 6). In this case information structure of each individual
stock will define how it is priced in equilibrium. The authors show that converting private
information into public will decrease expected returns, as uninformed investors have a better
change to invest in “good” stocks when information environment improves.
The mechanisms through which companies can increase the proportion of public versus
private information is by increasing the quantity and quality of the public (accounting)
information through enhanced disclosure or, alternatively, by improving properties of
analysts’ forecasts such as following and accuracy (Easley and O’Hara 2004). Each path will
result in increase in proportion of public versus private information. The shift will lead to the
18
decline in cost of capital, as predicted by the model. The argument is directly applicable to
our first prediction.
When firms choose to cross-list, the quantity and quality of publicly available information
substantially increases. Consistent with Easley and O’Hara (2004), two significant sources of
improvement in information environment for cross-listed firms are public (accounting)
disclosure and analysts’ forecasts (accuracy and following). The increase in the first source,
public (accounting) disclosure, is due the following.
Upon cross-listing both ADRs and GDRs become subject to more rigorous reporting
compared to that on their domestic markets. They have to report more frequently and must
disclose additional information by filing a number of forms. This additionally reported
information must be disclosed regardless of its content and despite the fact that omitting it
may be a preferred strategy. This suggests increase in quantity of disclosed information. Next,
ADRs and GDRs must prepare financial reports in accordance with US GAAP and IAS/IFRS,
respectively, and the audit of their reports must be conducted in accordance with the
International Standards on Auditing (ISA). Prior studies found that the US GAAP and IFRS
are overall more informative and comprehensive than other local GAAPs (Leuz and
Verrecchia 2000; Ashbaugh 2001). The superior value-relevance and timeliness of the US
GAAP and IFRS compared to other national accounting standards is also well documented in
the literature (Bath et al. 2008). Based on the findings of the prior literature, the quality of
disclosed information for ADRs and GDRs is expected to improve after cross-listing, too.
As for the second component of information environment, analysts’ forecasts, the theory
suggests several paths through which the properties of analysts’ forecasts are expected to
improve as a result of improved disclosure. Hope (2003) argues that better enforcement of
accounting disclosure standards makes firms’ reporting more transparent and less uncertain
for analysts encouraging them to follow firms more actively. The increase in analysts’
following in this case is a result of the improved disclosure and lower cost of following a firm
(Lang et al. 2003). Provided that after cross-listing ADRs and GDRs become subject to
stringent disclosure with better enforcement mechanism of the SEC and UKLA, respectively,
this path suggests that analysts’ following should improve for both ADRs and GDRs.
Alternatively, analysts might follow firms more actively in response to increased investors’
demand. When the information asymmetry declines as a result of improved disclosure,
19
investors’ transaction costs decline and their demand for securities rises (Amihud and
Mendelson 1986). Positive changes in analysts’ following for ADRs and GDRs through this
avenue are plausible, too, provided that the firms disclose more and better quality information
when offering their securities via cross-listing.
Improvement in accuracy of analysts’ forecasts is expected to occur due to improved
communication of information by firms as a result of improved disclosure. Hope (2003)
suggests that annual reports help analysts understand firms’ reporting practices at a broad
level, while notes to the reports with additionally disclosed information assist them in
assessing firms’ future prospective in order to make forecasts more accurately. Therefore
better quality disclosure is expected to be positively associated with accuracy of forecasts.
Alternatively, the increased competition among analysts when the demand from investors
rises should encourage them to produce better quality forecasts due to the fact that each
additional analyst reduces others’ marker share (Lys and Soo 1995). Each theoretical path is
relevant to the discussion on ADRs and GDRs suggesting that accuracy of forecasts should
improve for them.
The empirical findings do not strongly support the theoretical predictions on the positive
changes in analysts’ following and accuracy. On one hand, it is well documented that overall
analysts contribute to a firm’s information environment either through increased following,
improved accuracy of forecasts, or both. For example, Hope (2003) examined the association
between the firm-level disclosure, level of enforcement, analysts’ following and accuracy for
firms domiciled in 22 countries. He documented positive association between disclosure and
analysts’ following and between the level of enforcement of accounting standards and
accuracy of analysts’ forecasts. Findings of Lang et al. (2003) who examined changes in
information environment for ADR-listed firms are in line with those of Hope (2003).
The findings of the study by Lang and Lundholm (1996) and a more recent study by Abdallah
(2008) provide conflicting evidence on the changes in properties of analysts’ forecasts as a
result of better disclosure. Lang and Lundholm (1996) showed that for the sample of US firms
the ratings of annual report disclosure as measured by the Association for Investment
Management and Research (AIMR) are not associated with forecast accuracy and analyst
following. The predicted positive association is only observed when various information
20
sources including annual reports, media coverage and investor relations, are aggregated to
form the total public information score. In cross-listing settings Abdallah (2008) documented
that the improvement in analysts’ following is in fact more pronounced for firms that cross-
list through programs with lower disclosure requirement, such as private placement programs
traded through PORTAL, and that there is no improvement in quality of analysts’ forecasts
(accuracy) observed for ADRs listed on both regulated and unregulated markets in the US and
the UK. The results of the study by Abdallah are robust to various partitioning of firms and
provide strong evidence that analysts’ following and accuracy may experience changes in
different direction as a result of cross-listing and do not necessarily improve when disclosure
improves.
The discussion suggests that information environment of firms that cross-list as ADRs or
GDRs is expected to improve, either through changes in only one component of the
information environment (public disclosure) or both (public disclosure and analysts’
forecasts). Based on the above, our first hypothesis is stated as follows:
H1: Ceteris paribus, the cost of capital of ADR-listed firms and GDR-listed firms declines in
the post-listing period.
The requirements of the SEC for ADR-listed firms with regard to the extent of disclosure are
higher than those prescribed by UKLA for GDR-listed firms in a number of aspects. The
quality of disclosed information is expected to be higher for ADRs because GDRs are exempt
from a number of reporting requirements both when preparing a prospectus and as ongoing
obligations. The quantity of the disclosed information is expected to be higher for ADRs, too.
First, the reporting frequency is lower for GDRs, as they are required to publish interim and
annual reports, while ADR-listed firms report quarterly and annually. Second, the number of
forms and reports that GDRs have to submit is not as high as for ADRs. For example, GDRs
are exempt from preparing the working capital statement and do not have to prepare
additional statements when changes in business occur, etc. Therefore based on the first
component of information environment – public disclosure - alone, the magnitude of changes
in cost of capital is expected to be greater for ADRs compared to GDRs17.
17 The argument is built on the post-listing disclosure requirements in the US and UK markets. One possibility is that the origins of cross-listed firms and their disclosure level on a domestic market prior to cross-listing should also be considered when changes in public disclosure are assessed. This would require estimating the pre-listing
21
As for the second component of information environment, properties of analysts’ forecasts, it
is unclear whether the changes in following and accuracy should be more pronounced for
ADRs or GDRs. On one hand, greater positive changes in the quantity and quality of
disclosed information shall manifest in greater analysts’ following due to lower cost of
processing information, as well as in the improved accuracy of analysts’ forecasts for ADRs
rather than GDRs (Lang et al. 2003). On the other hand, GDRs attract global investors and are
aimed at a more diverse pool of market participants and therefore the increase in analysts’
following should be more pronounced for them and not for ADRs, as analysts are expected to
respond to a higher demand from investors by increased following (Merton 1987). Greater
competition and following, in turn, can lead to greater accuracy of analysts’ forecasts for
GDRs, as each additional following of a company by analysts reduces others’ market share
(Lys and Soo, 1995).
Based on the above discussion, while it is intuitive that the first component of firms’
information environment - public disclosure – should experience more positive changes in
case of ADRs, it is not entirely clear how the changes in properties of analysts’ forecasts
should differ between ADRs and GDRs. Therefore the differential impact of cross-listing via
ADRs versus GDRs on cost of capital is ultimately an empirical question. On the assumption
that public disclosure component is a greater contributor to the information risk reduction
than properties of analysts’ forecasts, we assume:
H2: Ceteris paribus, the magnitude of decrease in the cost of capital in the pre-post listing
period is greater for ADR-listed firms than for GDR-listed firms.
4. RESEARCH DESIGN AND METHODOLOGY
4.1. Cost of equity capital estimation – overview of existing approaches
Prior literature employed two distinct approaches to estimation of the cost of equity capital:
the approach based on calculating implied cost of capital and the approach based on realized
disclosure level for each cross-listed firm, which is hardly possible because it suggests analysing financial report of each firm and self-constructing a disclosure index. Instead, this study follows the argument of prior cross-listing works that suggest focusing on the post-listing requirements that are at place at cross-listing destinations because in assessing changes in risk associated with cross-listing investors heavily rely on those requirements.
22
returns. Realized returns as a proxy for cost of capital have been extensively used in prior
studies in various settings, including cross-listing, and represent a more traditional
methodology than the implied cost of capital models (Miller 1999; Errunza and Miller 2000).
Realized returns require large sample sizes and are a noisy measure of cost of capital, as
information surprises do not always cancel over time and may have substantial variances on
the individual stock level (Botosan and Plumlee 2005). They are, however, not subject to the
measurement errors due to bias in analysts’ forecasts, for instance, and have fewer restrictions
on variables than implied cost of capital models are subject to (Francis et al. 2004).
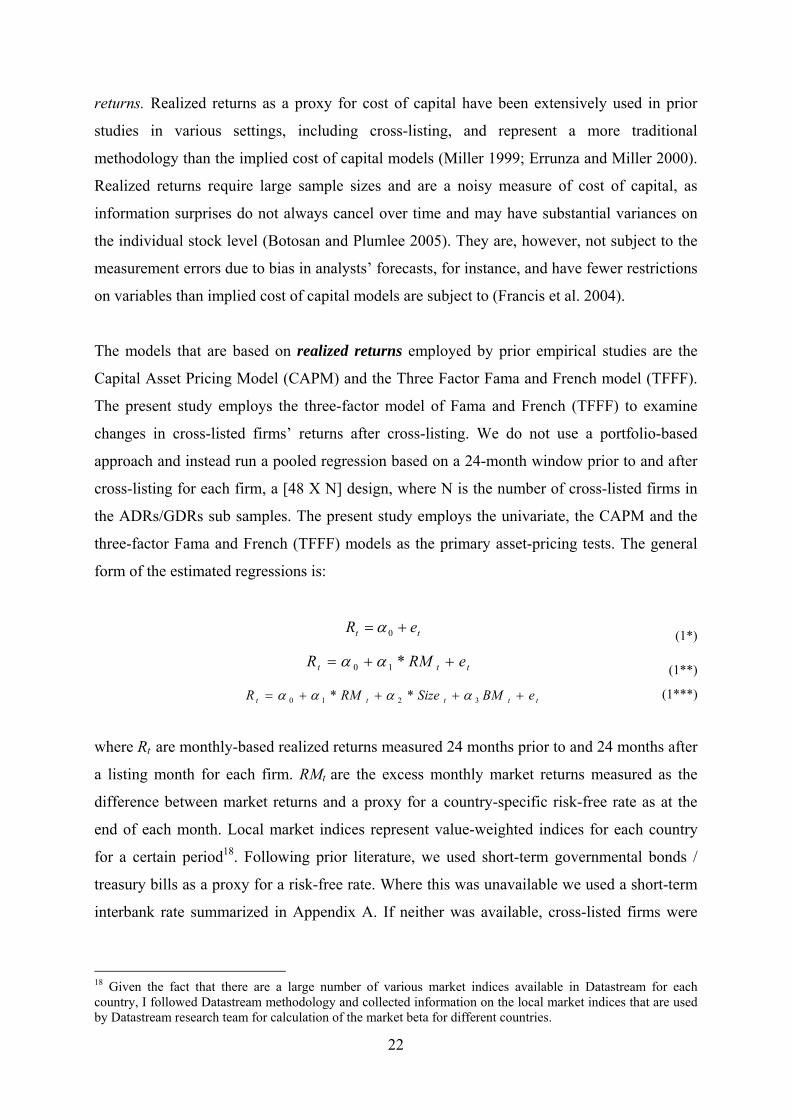
The models that are based on realized returns employed by prior empirical studies are the
Capital Asset Pricing Model (CAPM) and the Three Factor Fama and French model (TFFF).
The present study employs the three-factor model of Fama and French (TFFF) to examine
changes in cross-listed firms’ returns after cross-listing. We do not use a portfolio-based
approach and instead run a pooled regression based on a 24-month window prior to and after
cross-listing for each firm, a [48 X N] design, where N is the number of cross-listed firms in
the ADRs/GDRs sub samples. The present study employs the univariate, the CAPM and the
three-factor Fama and French (TFFF) models as the primary asset-pricing tests. The general
form of the estimated regressions is:
tt eR 0 (1*)
ttt eRMR *10 (1**)
ttttt eBMSizeRMR 3210 ** (1***)
where Rt are monthly-based realized returns measured 24 months prior to and 24 months after
a listing month for each firm. RMt are the excess monthly market returns measured as the
difference between market returns and a proxy for a country-specific risk-free rate as at the
end of each month. Local market indices represent value-weighted indices for each country
for a certain period18. Following prior literature, we used short-term governmental bonds /
treasury bills as a proxy for a risk-free rate. Where this was unavailable we used a short-term
interbank rate summarized in Appendix A. If neither was available, cross-listed firms were
18 Given the fact that there are a large number of various market indices available in Datastream for each country, I followed Datastream methodology and collected information on the local market indices that are used by Datastream research team for calculation of the market beta for different countries.

23
excluded from the sample19. Sizet is a market value of equity, and BMt is a book-to-market
value of equity measured at the end of each period20.
The implied cost of capital methodology provides an alternative to the realized returns tests
and is relatively new. Those models suggest reverse-engineering valuation models in order to
obtain the cost of capital estimates. They are based on the dividend capitalization model
(Botosan 1997), residual income valuation model (O’Hanlon and Steele 2000; Claus and
Thomas 2001; ETSS 2002), and abnormal growth in earnings model (Gode and Mohanram
2003). There were attempts to validate those measures of cost of capital by [1] examining
correlation of the cost of capital with the ex-ante firm-specific risk proxies such as beta,
leverage, firm size, etc. (Gode and Mohanran 2003) and by [2] examining correlation between
the cost of capital and realized returns (Easton and Monahan 2005). The conclusions of those
studies are that the two approaches to estimation of cost of equity capital do not produce
consistent results (Easton 2006). Among the potential reasons for inconsistency are bias in
analysts’ forecasts used in the models, noise in realized returns due to information surprises,
and others21. Given the imperfection of existing approaches to estimate cost of capital, the
study adopts both methods.
Implied cost of capital models provide advantage over realized returns tests in that they allow
explicitly separating cash flows (growth) from the cost of capital effects (Hail and Leuz
2009). Therefore accurate estimation of the growth rate is essential, yet studies have used
different approaches to estimating growth beyond the forecast horizon. Gebhardt, Lee and
Swaminathan (GLS 2001) and Claus and Thomas (CT 2001), for instance, make assumptions
19 The analysis resulted in excluding Russia from the CAPM and TFFF estimation due to the fact that the first governmental bonds were originated in 2003 and the only available interest rate for 1990s – 2003 was the interbank short-term lending rate. However, the rate was changing in accordance with no particular trend and for some months it exceeded 100% due to the poor economic condition of the country and hyper inflation. Next, Argentina had only interbank lending rate available which was used as a risk-free proxy for all the Argentinean firms in the sample. The Australian treasury bills rate was truncated in 2002 and the only available rate after that period was a one-month interbank loan rate. The correlation between the two rates in the pre-2002 period was 88% and it was decided to use the interbank rate as a risk-free proxy for the 2002-2008 periods. Finally, Denmark which was represented by only 1 firm, was excluded from the sample due to the fact there were no interest rates available prior to 1981, while its Novo Nordisk was listed in 1979. 20 A 24-month pre- and post window is used to ensure a higher statistical power. For robustness, a shorter 12-month window is used as an additional analysis. In the main analysis the pooled regression is used, while for robustness a firm-specific test is performed. 21 The more recent stream of literature has focused on improving the accounting-based valuation models by, for instance, explicitly correcting for the analysts’ bias (Guy et al. 2005, Gode and Mohanran 2008).However, the approach is yet to be validated. Correcting for bias in analysts’ forecasts is not of interest for this study.
24
about the growth rate22 before proceeding to cost of capital estimation, while O’Hanlon and
Steele (OHS 2000) and ETSS (2002) estimate a growth rate and a cost of capital
simultaneously as implied by data. As demonstrated by Easton (2006), cost of capital
estimates are sensitive to assumptions about a growth rate23. The estimates derived from the
OHS and ETSS models are viewed as superior to those of GLS and CT due to the fact that,
first, they allow avoiding making an assumption about the growth rate that may lead to
incorrect inferences; second, they allow estimating cost of capital for a portfolio of stocks that
is required by the research design of the study.
The model of ETSS (2002) is a regression-based model that allows simultaneous estimation
of the implied cost of capital and the growth rate implied by the market prices, book values
and earnings forecast data. However, as pointed out by Easton and Sommers (2007), the
methodology of obtaining the implied cost of capital based on the analysts’ forecasts has its
limitations. The estimation requires the firms to have positive earnings forecasts, several years
of consecutive data and is based on the assumption that analysts’ forecasts are good proxies
for market expectations. The requirements put substantial limitations on the size of the ADRs
and GDRs samples that are small anyway.
The model by O’Hanlon and Steele (2000) is similar to that of ETSS (2002) and also suggests
simultaneous estimation of the implied rate of return and a growth rate; however their model
is based on reported rather than forecasted earnings. This approach avoids the forecasts bias
problem discussed above, while making no assumptions about the growth rate in abnormal
earnings. We therefore adopt the model derived by O’Hanlon and Steele (2000) as the main
model of the study and further discuss the details of the estimation technique. The ETSS
model is used as the second model to validate the findings. The two models are discussed
separately.
22 GLS approach is to forecast earnings explicitly for the next three years and to forecast earnings beyond that horizon implicitly, that is by mean reverting the period t+3 ROE to the median industry ROE. Easton (2009) points out (and provides an examples of) to why mean-reverting to the industry median assumption is not feasible. For example, in the IT sector the median numbers can be driven by the big firms such as Microsoft and are not representative of the whole population of IT companies. 23 Easton (2006) performed a comparison of estimates of the implied rate of return obtained from the models used in the several mentioned studies and came up with the conclusion that the assumption about the growth rate beyond the forecasted horizon is critical to the analysis of cost of capital and may lead to incorrect inferences, as making explicit assumptions about the growth rate suggests making implicit assumptions about the required rate of return itself. He suggests that the simultaneous estimation technique used by ETSS (2002) is superior to other studies.
25
O’Hanlon and Steele (2000)
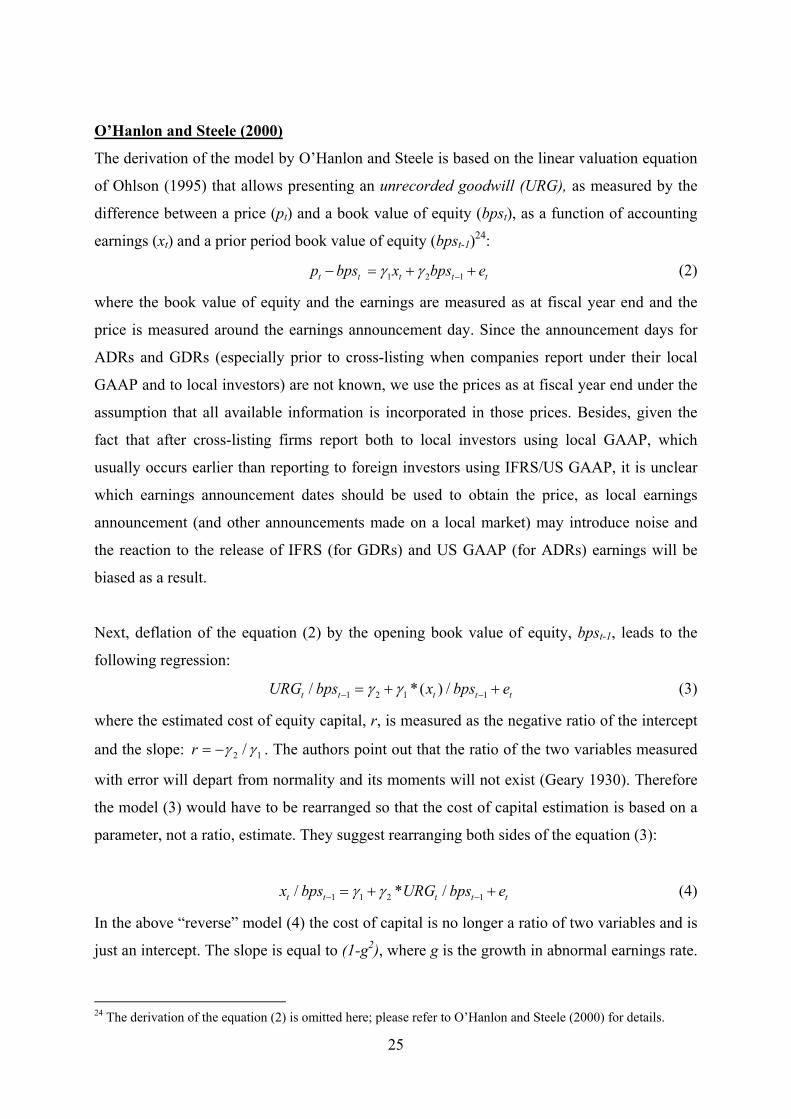
The derivation of the model by O’Hanlon and Steele is based on the linear valuation equation
of Ohlson (1995) that allows presenting an unrecorded goodwill (URG), as measured by the
difference between a price (pt) and a book value of equity (bpst), as a function of accounting
earnings (xt) and a prior period book value of equity (bpst-1)24:
1 2 1t t t t tp bps x bps e (2)
where the book value of equity and the earnings are measured as at fiscal year end and the
price is measured around the earnings announcement day. Since the announcement days for
ADRs and GDRs (especially prior to cross-listing when companies report under their local
GAAP and to local investors) are not known, we use the prices as at fiscal year end under the
assumption that all available information is incorporated in those prices. Besides, given the
fact that after cross-listing firms report both to local investors using local GAAP, which
usually occurs earlier than reporting to foreign investors using IFRS/US GAAP, it is unclear
which earnings announcement dates should be used to obtain the price, as local earnings
announcement (and other announcements made on a local market) may introduce noise and
the reaction to the release of IFRS (for GDRs) and US GAAP (for ADRs) earnings will be
biased as a result.
Next, deflation of the equation (2) by the opening book value of equity, bpst-1, leads to the
following regression:
1 2 1 1/ *( ) /t t t t tURG bps x bps e (3)
where the estimated cost of equity capital, r, is measured as the negative ratio of the intercept
and the slope: 12 / r . The authors point out that the ratio of the two variables measured
with error will depart from normality and its moments will not exist (Geary 1930). Therefore
the model (3) would have to be rearranged so that the cost of capital estimation is based on a
parameter, not a ratio, estimate. They suggest rearranging both sides of the equation (3):
1 1 2 1/ * /t t t t tx bps URG bps e (4)
In the above “reverse” model (4) the cost of capital is no longer a ratio of two variables and is
just an intercept. The slope is equal to (1-g2), where g is the growth in abnormal earnings rate.
24 The derivation of the equation (2) is omitted here; please refer to O’Hanlon and Steele (2000) for details.
26
O’Hanlon and Steele (2000) and later Easton and Sommers (2007) use equation (4) for the
cost of capital estimation.
The suggested by O’Hanlon and Steele rearrangement in the final empirical model has some
practical estimation issues. The problem with estimating the “reverse” regression (4) is that it
is the case that the reversal suggested by O’Hanlon and Steele does not eliminate the
econometric problem completely but rather transforms it into a different form. After reversal,
in model (4) the URG becomes correlated with the error term and hence the coefficients based
on a simple OLS estimation may be biased. As such, there is an issue as to whether use a
“normal” regression (3) to estimate cost of capital, which would be more justified provided
that it is (3) and not (4) that is derived from the linear value relevant information equation of
Ohlson (1995), or to use the “reverse” regression (4) that was validated in prior studies.
There are two potential solutions to the problem, each representing a trade off. First, instead
of using the equation (4), we need to go back to the equation (3) and estimate it with a non-
linear restriction on the coefficients in the following form:
1 1 1 1/ * *( ) /t t t t tURG bps r x bps e (5)
Tthe properties of r in this case may be poor due to a small sample size of ADRs and GDRs.
Alternatively, as is done in the present study, we can use equation (4) that O’Hanlon and
Steele used as their final model after correcting for correlation between the independent
variable and the error term. The correction can be done by using the Generalized Methods of
Moments (GMM), for instance, which requires findings an instrumental variable that would
be correlated with the independent variable, URG, but uncorrelated with the error term.
Finding an instrumental variable (IV) represents a challenge for a researcher, and unless there
are successful IV “candidates” for which valid economic justifications exist, a simple OLS
model may be preferred (Larcker and Rusticus 2010). Using semi-endogenous instruments
that are weakly correlated with an error term would also make properties of estimated
coefficients poorer compared to a simple OLS estimation (Francis and Lennox 2008; Larcker
and Rusticus 2010). Therefore it is essential to test for the validity of the chosen instruments
when running the GMM estimation, as is done in the present study. For robustness, a simple
OLS estimation is performed.
27
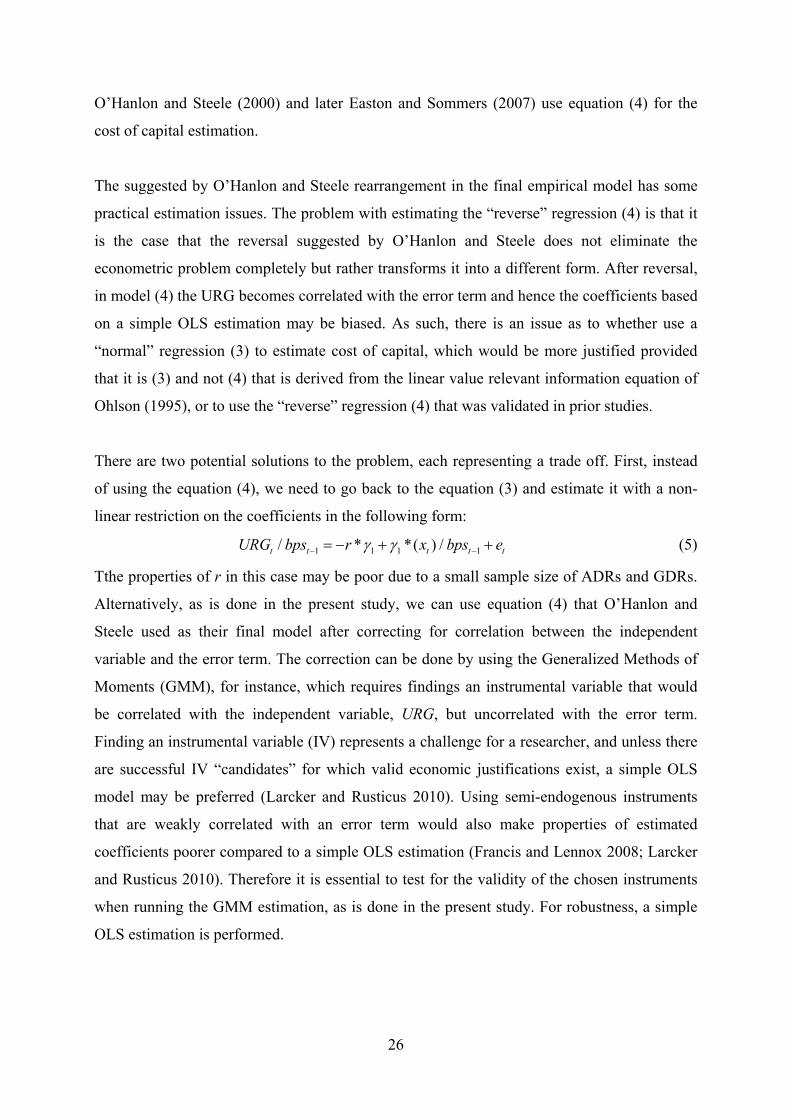
ETSS (2002)
For robustness, the model by ETSS (2002) is considered. Similar to the model of O’Hanlon
and Steele (2000), the model is derived from the residual income valuation model but is based
on analysts’ forecasts of earnings rather than the actual earnings figures. The model can be
presented as follows:
1 1 2/ * /t t t t tx bps p bps (6)
where all the variables are as previously defined for the OHS model, except for earnings xt+1
that are annual forecasted (consensus) figures obtained from the IBES database (ETSS 2002).
The intercept in the model represented the growth in abnormal earnings rate, g, while the
slope is the difference between the growth rate and the cost of capital, (r-g). Hence, the r is
the sum of the slope and the intercept 21 . Appendix B summarizes definitions of all the
variables.
4.2. Hypotheses testing
To test the predictions of the study the models (1), (4) and (6) are modified accordingly. In a
general form, the predictions can be presented as follows:
H1: Δr<0;
H2: | ΔrADR| > | ΔrGDR|;
The H1 prediction is tested separately for a sample of ADRs and a sample of GDRs. The H2
test is based on the pooled sample of ADRs and GDRs.
4.2.1. Implied cost of capital models
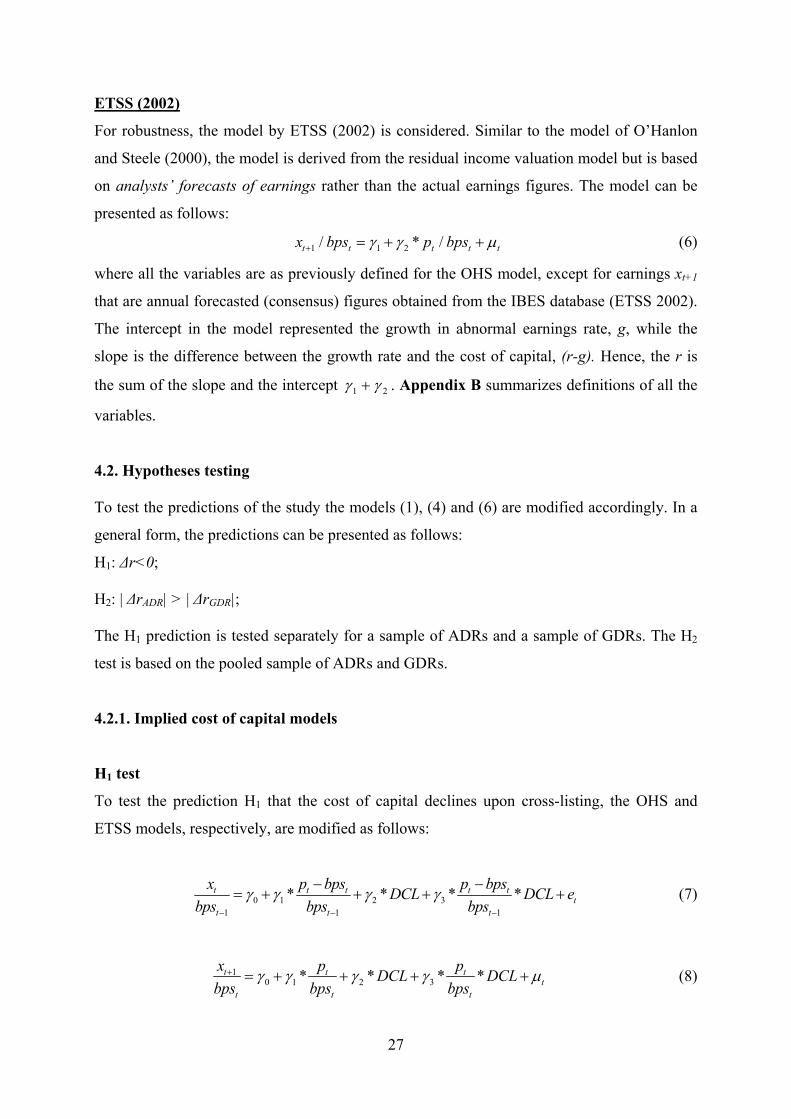
H1 test
To test the prediction H1 that the cost of capital declines upon cross-listing, the OHS and
ETSS models, respectively, are modified as follows:
0 1 2 31 1 1
* * * *t t t t tt
t t t
x p bps p bpsDCL DCL e
bps bps bps
(7)
10 1 2 3* * * *t t t
tt t t
x p pDCL DCL
bps bps bps (8)
28
where all the variables are as previously defined for the original models (3) and (6),
respectively, and DCL is the dummy variable that takes the value of 1 after cross-listing25.
In the model (7):
γ0 – cost of capital prior to cross-listing;
γ0+γ2 – cost of capital after cross-listing;
γ2 – change in cost of capital after cross-listing. γ2 is expected to be negative.
In the model (8):
γ0+γ1 - cost of capital prior to cross-listing;
γ0+γ1+ γ2+γ3 - cost of capital after cross-listing;
γ2+γ3 - change in cost of capital after cross-listing. (γ2+γ3) is expected to be negative.
The H1 is tested separately for the samples of ADRs and GDRs. The research design for both
models (7) and (8) is a pooled regression, [2XN] where each variable is measured one year
before and one year after cross-listing and N is a number of ADRs/GDRs in the respective
sample. This event-study approach makes changes in the cost of capital less likely to be
confounded by the effect of correlated omitted factors as in the case of the cross-sectional or
long time-series approaches (Hribar and Jenkins 2004).
If tested individually from other predictions of the study, the prediction H1 should be tested
using the models (7) and (8). Otherwise, the results for testing the H2 include the results for
the prediction H1, as will be discussed next.
H2 test
The H2 test is not as straightforward, as it is based on the two samples of ADRs and GDRs
pooled together. When testing for which programs, ADRs or GDRs, result in greater decline
in cost of capital, it is necessary to correct for the self-selection bias. Cross-listed firms
voluntarily select an appropriate program (ADR or GDR) after considering costs and benefits
25 In the study’s main analysts the implied cost of capital models modified according to the predictions do not contain control variables that are expected to affect cost of capital in general, such as Size and BM value of equity. The reason for this is that, first, the changes in the cost of capital and the changes in those variables are simultaneously driven by the changes in information risk and are the product of cross-listing and, second, the prediction tests for the changes in the cost of capital as a result of cross-listing in general. In addition, the price measured one year after cross-listing should adjust for the changes in firms’ findumentals due to cross-listing.
29
of their decision. There are a number of characteristics that might drive firms’ decisions to list
as ADRs rather than GDRs. Prior literature identifies several of them. Size is an important
factor and larger firms with greater liquidity demand, for instance, may choose the US
destination rather than the UK (Bianconi and Tan 2008). The Disclosure level on a domestic
market may drive firms’ decision in favor of ADRs or GDRs, as additional disclosure is
costly and time-consuming, and as a result firms with poorer disclosure may choose GDRs to
minimize their costs (Francis et al. 2005). Next, companies may choose a cross-listing
destination based on where their industry peers list. An example would be the high-tech firms
concentrated on the NASDAQ. Finally, the business cycles are important, as firms with
higher growth may choose a destination that provides better realization for such growth
opportunities.
The above discussion suggests that standard OLS estimation where the differential changes in
cost of capital of ADRs versus GDRs are measured by the simple dummy variable will
produce biased results. To address the issue, we adopt an empirical approach used in prior
literature. The approach suggests the estimation of a “treatment effect” model that allows
controlling for the self-selection bias that ADR and GDR-listed firms may be subject to (see
Leuz and Verrecchia 2000; Bianconni and Tan 2008). The model requires estimation of the
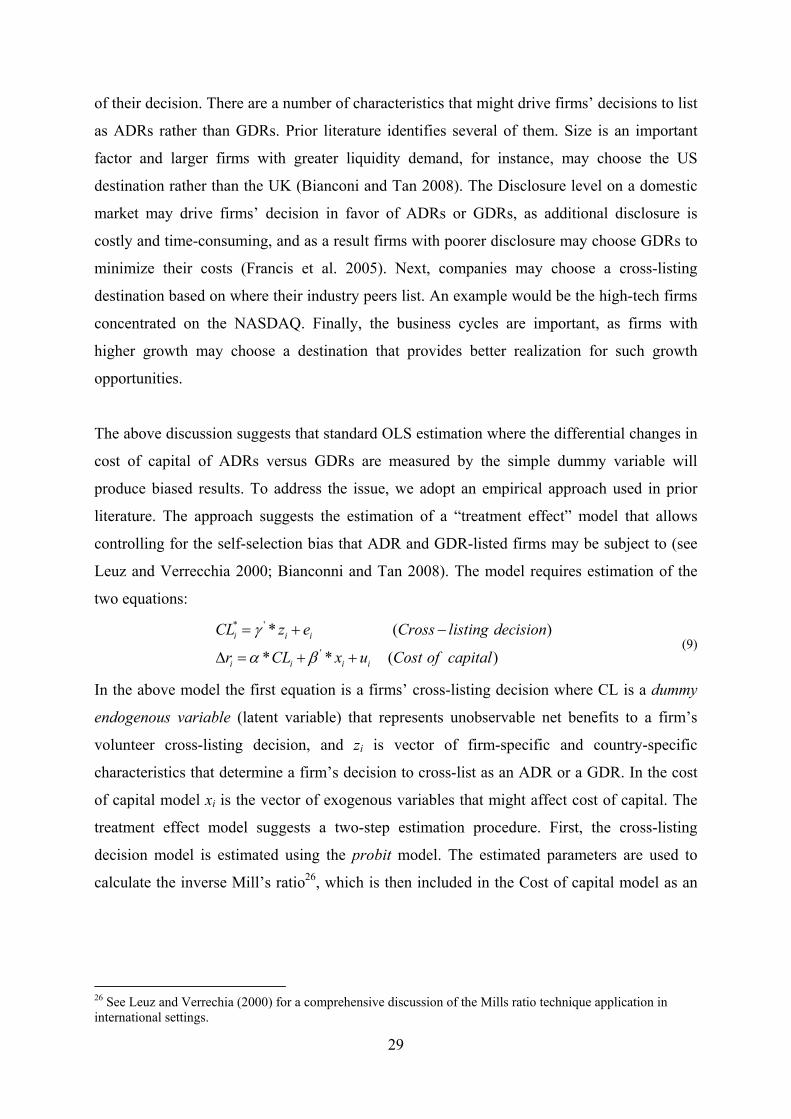
two equations:
* '
'
* ( )
* * ( )
i i i
i i i i
CL z e Cross listing decision
r CL x u Cost of capital
(9)
In the above model the first equation is a firms’ cross-listing decision where CL is a dummy
endogenous variable (latent variable) that represents unobservable net benefits to a firm’s
volunteer cross-listing decision, and zi is vector of firm-specific and country-specific
characteristics that determine a firm’s decision to cross-list as an ADR or a GDR. In the cost
of capital model xi is the vector of exogenous variables that might affect cost of capital. The
treatment effect model suggests a two-step estimation procedure. First, the cross-listing
decision model is estimated using the probit model. The estimated parameters are used to
calculate the inverse Mill’s ratio26, which is then included in the Cost of capital model as an
26 See Leuz and Verrechia (2000) for a comprehensive discussion of the Mills ratio technique application in international settings.
30
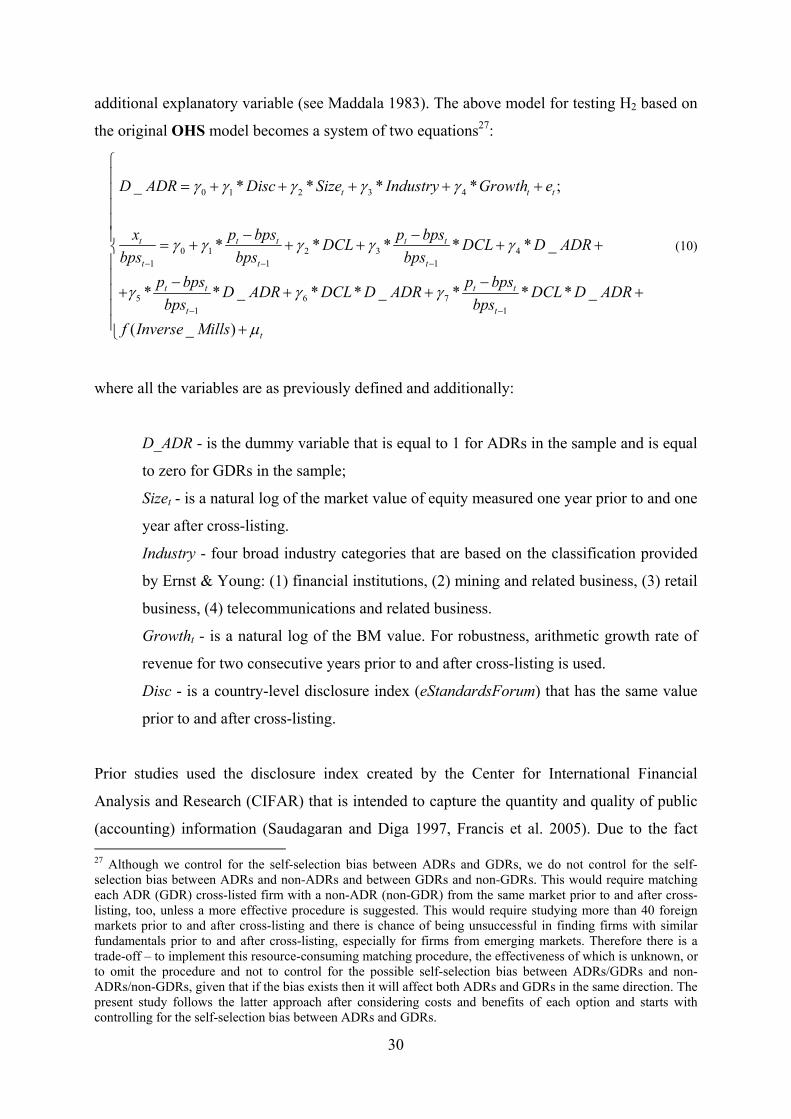
additional explanatory variable (see Maddala 1983). The above model for testing H2 based on
the original OHS model becomes a system of two equations27:
0 1 2 3 4
0 1 2 3 41 1 1
5 6 71 1
_ * * * * ;
* * * * * _
* * _ * * _ * * * _
( _ )
t t t
t t t t t
t t t
t t t t
t t
D ADR Disc Size Industry Growth e
x p bps p bpsDCL DCL D ADR
bps bps bps
p bps p bpsD ADR DCL D ADR DCL D ADR
bps bps
f Inverse Mills
t
(10)
where all the variables are as previously defined and additionally:
D_ADR - is the dummy variable that is equal to 1 for ADRs in the sample and is equal
to zero for GDRs in the sample;
Sizet - is a natural log of the market value of equity measured one year prior to and one
year after cross-listing.
Industry - four broad industry categories that are based on the classification provided
by Ernst & Young: (1) financial institutions, (2) mining and related business, (3) retail
business, (4) telecommunications and related business.
Growtht - is a natural log of the BM value. For robustness, arithmetic growth rate of
revenue for two consecutive years prior to and after cross-listing is used.
Disc - is a country-level disclosure index (eStandardsForum) that has the same value
prior to and after cross-listing.
Prior studies used the disclosure index created by the Center for International Financial
Analysis and Research (CIFAR) that is intended to capture the quantity and quality of public
(accounting) information (Saudagaran and Diga 1997, Francis et al. 2005). Due to the fact 27 Although we control for the self-selection bias between ADRs and GDRs, we do not control for the self-selection bias between ADRs and non-ADRs and between GDRs and non-GDRs. This would require matching each ADR (GDR) cross-listed firm with a non-ADR (non-GDR) from the same market prior to and after cross-listing, too, unless a more effective procedure is suggested. This would require studying more than 40 foreign markets prior to and after cross-listing and there is chance of being unsuccessful in finding firms with similar fundamentals prior to and after cross-listing, especially for firms from emerging markets. Therefore there is a trade-off – to implement this resource-consuming matching procedure, the effectiveness of which is unknown, or to omit the procedure and not to control for the possible self-selection bias between ADRs/GDRs and non-ADRs/non-GDRs, given that if the bias exists then it will affect both ADRs and GDRs in the same direction. The present study follows the latter approach after considering costs and benefits of each option and starts with controlling for the self-selection bias between ADRs and GDRs.
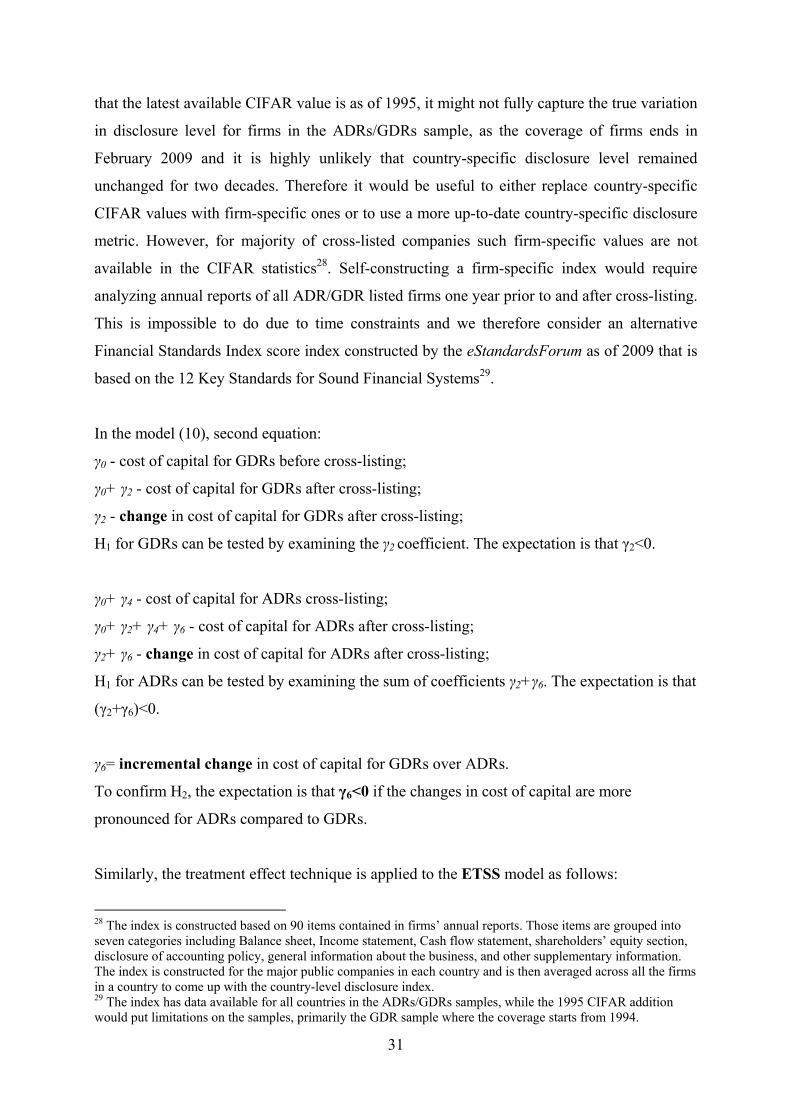
31
that the latest available CIFAR value is as of 1995, it might not fully capture the true variation
in disclosure level for firms in the ADRs/GDRs sample, as the coverage of firms ends in
February 2009 and it is highly unlikely that country-specific disclosure level remained
unchanged for two decades. Therefore it would be useful to either replace country-specific
CIFAR values with firm-specific ones or to use a more up-to-date country-specific disclosure
metric. However, for majority of cross-listed companies such firm-specific values are not
available in the CIFAR statistics28. Self-constructing a firm-specific index would require
analyzing annual reports of all ADR/GDR listed firms one year prior to and after cross-listing.
This is impossible to do due to time constraints and we therefore consider an alternative
Financial Standards Index score index constructed by the eStandardsForum as of 2009 that is
based on the 12 Key Standards for Sound Financial Systems29.
In the model (10), second equation:
γ0 - cost of capital for GDRs before cross-listing;
γ0+ γ2 - cost of capital for GDRs after cross-listing;
γ2 - change in cost of capital for GDRs after cross-listing;
H1 for GDRs can be tested by examining the γ2 coefficient. The expectation is that γ2<0.
γ0+ γ4 - cost of capital for ADRs cross-listing;
γ0+ γ2+ γ4+ γ6 - cost of capital for ADRs after cross-listing;
γ2+ γ6 - change in cost of capital for ADRs after cross-listing;
H1 for ADRs can be tested by examining the sum of coefficients γ2+γ6. The expectation is that
(γ2+γ6)<0.
γ6= incremental change in cost of capital for GDRs over ADRs.
To confirm H2, the expectation is that γ6<0 if the changes in cost of capital are more
pronounced for ADRs compared to GDRs.
Similarly, the treatment effect technique is applied to the ETSS model as follows:
28 The index is constructed based on 90 items contained in firms’ annual reports. Those items are grouped into seven categories including Balance sheet, Income statement, Cash flow statement, shareholders’ equity section, disclosure of accounting policy, general information about the business, and other supplementary information. The index is constructed for the major public companies in each country and is then averaged across all the firms in a country to come up with the country-level disclosure index. 29 The index has data available for all countries in the ADRs/GDRs samples, while the 1995 CIFAR addition would put limitations on the samples, primarily the GDR sample where the coverage starts from 1994.
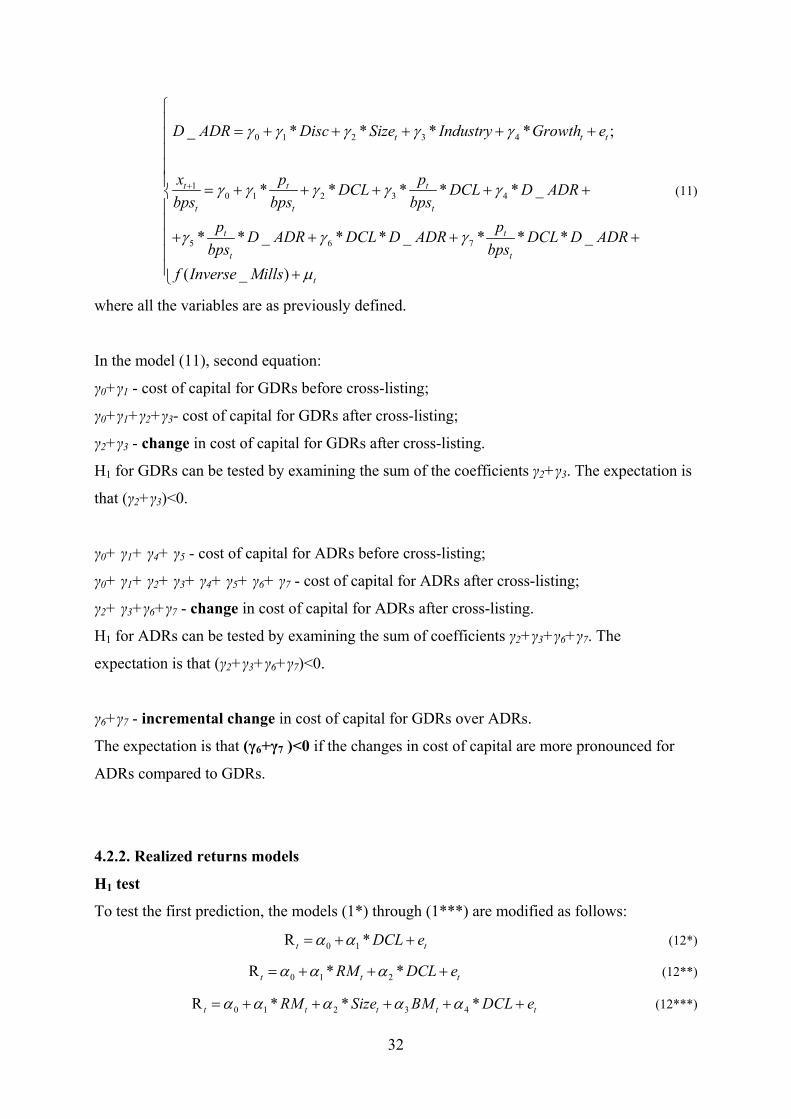
32
0 1 2 3 4
10 1 2 3 4
5 6 7
_ * * * * ;
* * * * * _
* * _ * * _ * * * _
( _ )
t t t
t t t
t t t
t t
t t
t
D ADR Disc Size Industry Growth e
x p pDCL DCL D ADR
bps bps bps
p pD ADR DCL D ADR DCL D ADR
bps bps
f Inverse Mills
(11)
where all the variables are as previously defined.
In the model (11), second equation:
γ0+γ1 - cost of capital for GDRs before cross-listing;
γ0+γ1+γ2+γ3- cost of capital for GDRs after cross-listing;
γ2+γ3 - change in cost of capital for GDRs after cross-listing.
H1 for GDRs can be tested by examining the sum of the coefficients γ2+γ3. The expectation is
that (γ2+γ3)<0.
γ0+ γ1+ γ4+ γ5 - cost of capital for ADRs before cross-listing;
γ0+ γ1+ γ2+ γ3+ γ4+ γ5+ γ6+ γ7 - cost of capital for ADRs after cross-listing;
γ2+ γ3+γ6+γ7 - change in cost of capital for ADRs after cross-listing.
H1 for ADRs can be tested by examining the sum of coefficients γ2+γ3+γ6+γ7. The
expectation is that (γ2+γ3+γ6+γ7)<0.
γ6+γ7 - incremental change in cost of capital for GDRs over ADRs.
The expectation is that (γ6+γ7 )<0 if the changes in cost of capital are more pronounced for
ADRs compared to GDRs.
4.2.2. Realized returns models
H1 test
To test the first prediction, the models (1*) through (1***) are modified as follows:
0 1R *t tDCL e (12*)
0 1 2R * *t t tRM DCL e (12**)
0 1 2 3 4R * * *t t t t tRM Size BM DCL e (12***)
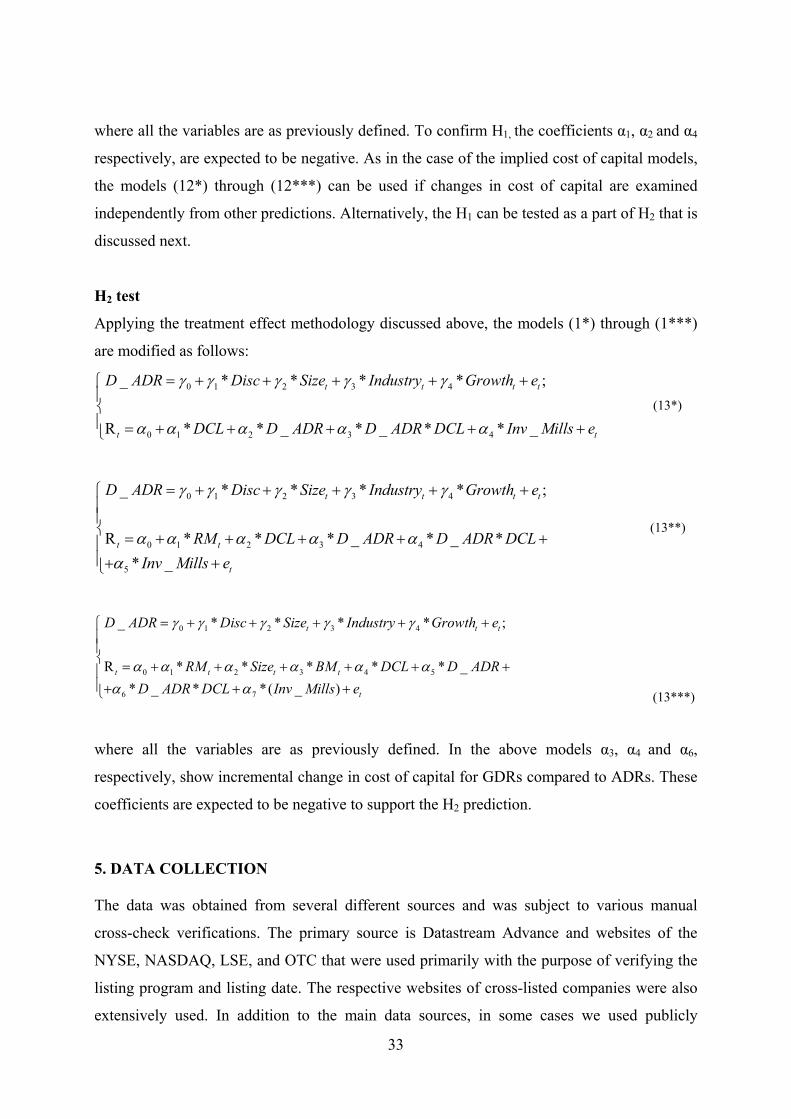
33
where all the variables are as previously defined. To confirm H1, the coefficients α1, α2 and α4
respectively, are expected to be negative. As in the case of the implied cost of capital models,
the models (12*) through (12***) can be used if changes in cost of capital are examined
independently from other predictions. Alternatively, the H1 can be tested as a part of H2 that is
discussed next.
H2 test
Applying the treatment effect methodology discussed above, the models (1*) through (1***)
are modified as follows:
0 1 2 3 4
0 1 2 3 4
_ * * * * ;
R * * _ * _ * * _
t t t t
t t
D ADR Disc Size Industry Growth e
DCL D ADR D ADR DCL Inv Mills e
(13*)
0 1 2 3 4
0 1 2 3 4
5
_ * * * * ;
R * * * _ * _ *
* _
t t t t
t t
t
D ADR Disc Size Industry Growth e
RM DCL D ADR D ADR DCL
Inv Mills e
(13**)
0 1 2 3 4
0 1 2 3 4 5
6 7
_ * * * * ;
R * * * * * _
* _ * *( _ )
t t t
t t t t
t
D ADR Disc Size Industry Growth e
RM Size BM DCL D ADR
D ADR DCL Inv Mills e
(13***)
where all the variables are as previously defined. In the above models α3, α4 and α6,
respectively, show incremental change in cost of capital for GDRs compared to ADRs. These
coefficients are expected to be negative to support the H2 prediction.
5. DATA COLLECTION
The data was obtained from several different sources and was subject to various manual
cross-check verifications. The primary source is Datastream Advance and websites of the
NYSE, NASDAQ, LSE, and OTC that were used primarily with the purpose of verifying the
listing program and listing date. The respective websites of cross-listed companies were also
extensively used. In addition to the main data sources, in some cases we used publicly
34
available Internet sources such as Yahoo! Finance, Google Finance along with the search
tools such as Google to search for the news related to companies’ listings announcements and
actual listings dates. This was done in cases when the aforementioned primary sources
provided conflicting information about the exchange listing program and/or a firm’s listing
date.
5.1. Identification of starting sample
ADRs
The construction of the ADRs sample started from the complete lists of cross-listed firms
from the two main sources that had been extensively used in prior literature – the “DR
Universe” guide of the Citibank and the “DR Directory” of the Bank of New York Mellon30
(thereafter BNY) that cover ADRs starting from 1960s. The starting sample included all
active ADR programs of NYSE, NASDAQ and AMEX as of February 2009 with the
information on a country of origin, effective listing year, listing exchange, a sponsor, etc. The
ADRs that existed in the past and were cancelled prior to February 2009 (inactive ADRs),
were available only from the Citibank’s “DR Universe”, while BNY’s list of terminated
ADRs started from 2005 and included ADRs for which the BNY was a sponsor.
Listing programs and dates – Main (Active) ADRs
Given the fact that the sample of cross-listed firms is small, it was critical to identify each
firm’s listing program and date as precisely as possible. To compare the data reported by the
two sources, the Citibank and the BNY, 40 ADR programs were selected at random31. The
listing dates and programs were cross-checked against the records of the NYSE, NASDAQ,
and AMEX. The cross-checking showed that the BNY database was substantially more
reliable and comprehensive than that of Citibank. The records of the Citibank often showed
the same company under two different ADR programs (for example, preference share issue
30 The third DR source that is similar to the Citibank and Bank of New York databases is the ADRs Guide by JP Morgan. However, we found the two above mentioned sources to be more comprehensive and continued working with them. 31 It became apparent that the number of ADR programs as per Citibank was substantially different from that as per BNY Mellon. For instance, the Citibank’s list showed around 570 active ADR programs, while the BNY database showed only 290 ADRs, including NYSE, NASDAQ, AMEX (Level II and III programs) and OTC listings. It was found that the effective listing dates for some ADR listings also differed between the two sources and it was unclear what those inconsistencies were due to. Prior studies that used the two databases did not specify which data source in particular they found to be supplying the most reliable information. As having the correct listing dates and program types are crucial to the research, it was necessary to verify the effective listing date (including the listing month which is important) for each company manually.
35
and ordinary share issue, or the primary issue and an additional tranche) with different listing
periods that overlapped. This made it difficult to understand what the actual listing years were
and which program was the primary one. In addition, up to 80 percent of the listing
dates/program types as per the BNY were the same as per the NYSE. However, the remaining
20 percent of listing dates and programs was uncertain.
Investigating companies’ background information, press releases and other publicly available
reports revealed that the above mentioned inconsistencies in the listing dates and programs
occurred for two reasons. First, in some cases ADR-listed firms changed the sponsor and
switched from Citibank, for instance, to the Bank of New York. In this case the BNY
database showed the effective listing date as the day when it actually became the sponsor.
This is not the actual NYSE listing date of a company. Second, if a company switched from
the NYSE listing to the OTC trading (the company delisted from an exchange), the BNY
database would display OTC as the listing program of that company along with the OTC-
listing year, since this is the last trading program for the company. For the purpose of our
sample, however, such a company is a NYSE-listed Level II or III ADR-listed firm and
should be included in the respective sample. To address these inconsistencies we tracked
ADR-listed companies back to their first (original) ADR program to find out whether or not
their first listing program was a Level II or III NYSE/NASDAQ listing rather than an OTC
trading program.
We checked the listing background of each company to make sure that a company did not
switch from NYSE to NASDAQ or AMEX and vice versa. This allowed us to assign ADR
programs to the correct exchange samples – NYSE ADRs, NASDAQ, or AMEX ADRs. The
initial verified sample of firms that had their NYSE, NASDAQ or AMEX listing as the first
ADR-listed program consisted of 442 companies (334 NYSE, 105 NASDAQ and 3 AMEX
ADRs) domiciled in 40 countries.
Identification Issue: Cross-listed versus single-listed ADRs
A review of data retrieved from Datastream showed that not all 442 ADR-listed firms in the
initial Active sample met the definition of a cross-listed firm. For the purpose of the study we
define a cross-listed firm as the one that was already listed on its local market at the time of
listing as an ADR. Prior studies did not make distinction between ADR-listed and cross-listed
firms; they treated all available ADRs as cross-listed firms. They assumed that firms first list

36
on their local markets and then proceed to ADR listing; hence the terms “ADR” and “cross-
listed firm” could be used interchangeably. When analyzing Chinese ADRs, we found that
none of the 39 firms in the initial ADR sample met a definition of a cross-listed firm at the
time of ADR listing. For this reason Datastream coverage for some of those firms’ local
market listing does not exist, while for others it starts substantially later than the ADR-listing
year. Further investigation revealed that those Chinese ADRs were either listed only on the
NYSE without being listed on the local market (22 companies), or they became listed on the
local market later and ADR listing is the first listing for them (17 companies). Thus, none of
Chinese ADRs meet the definition of a cross-listed firm and should be removed from the
initial Main (Active) sample32.
After checking every company in the initial sample of ADRs, we found that only 167 NYSE-
listed (out of 334), 22 NASDAQ-listed (out of 105) and none of AMEX-listed (out of 5)
ADRs met a definition of a cross-listed firm. This is just 50 percent of the initial NYSE, 20
percent of NASDAQ and 0 percent of AMEX initial ADRs sample. The countries that lost the
greatest number of firms (as a percentage of their total ADRs) due to the fact that those firms
did not meet the definition of a cross-listed firm were Brazil, Chile, China, Germany, Japan,
Italy, Netherlands, Russia, Mexico, Spain, and Switzerland. The UK lost some of its sample
due to the fact that different ADR tranches were listed as separate ADR programs by the BNY
and the NYSE, while for the purpose of the study we need to select the earliest ADR-listed
trance for a particular company and ignore its subsequent ADR issues because the changes in
the information risk are expected to occur around the first listing.
To summarize, the starting sample of cross-listed firms included 50 percent of NYSE, 80
percent of NASDAQ and 100 percent of the AMEX ADR-listed firms that should not be in
the sample because at the time of their ADR listing they were not listed on their local market
(or listed simultaneously with an ADR program) and hence do not meet the definition of a
cross-listed firm. The loss of observations for this reason resulted in some countries being
excluded from the sample or represented only by one or two firms.
32 The case of Chinese ADRs, however, was not an exception. ADRs from several other countries followed the same pattern. For some of them ADR listing was the first market listing ever, while for others local market listing occurred in the same financial year as their ADR listing or later. It was often the case that ADR and local market listings were one or two days apart which can be considered as the simultaneous listing on two markets and hence those companies do not meet the definition of a cross-listed firm and should be excluded from the sample.
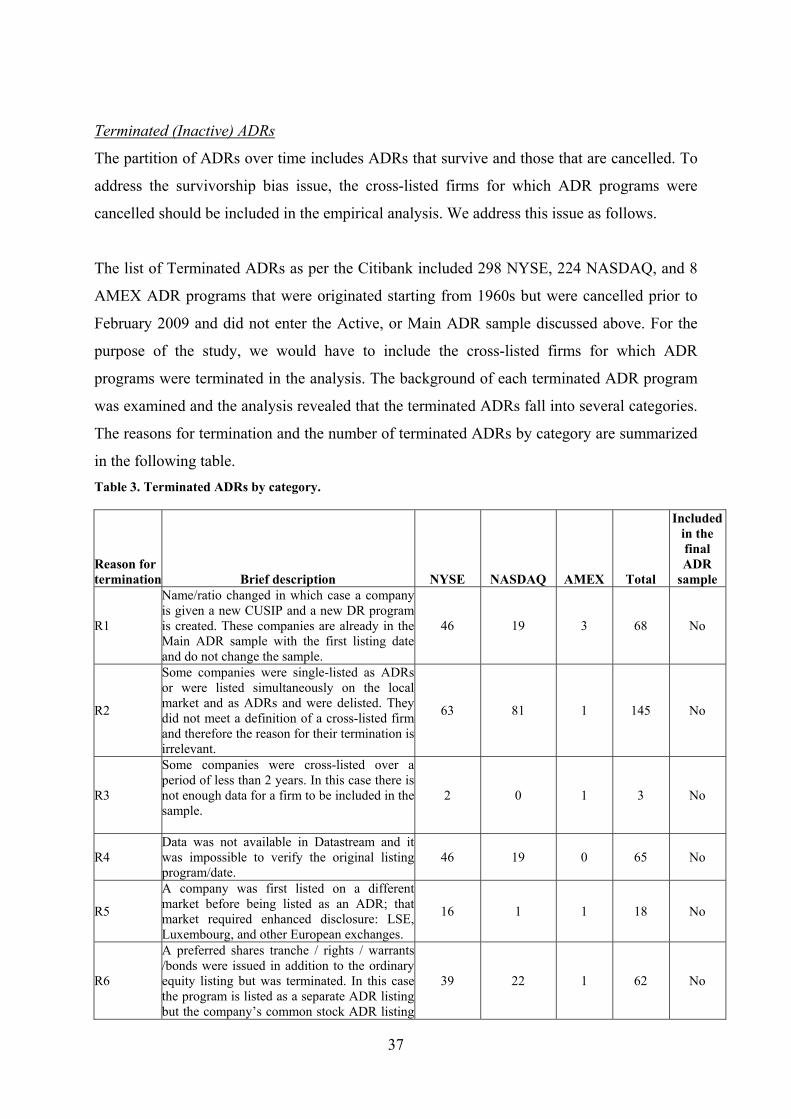
37
Terminated (Inactive) ADRs
The partition of ADRs over time includes ADRs that survive and those that are cancelled. To
address the survivorship bias issue, the cross-listed firms for which ADR programs were
cancelled should be included in the empirical analysis. We address this issue as follows.
The list of Terminated ADRs as per the Citibank included 298 NYSE, 224 NASDAQ, and 8
AMEX ADR programs that were originated starting from 1960s but were cancelled prior to
February 2009 and did not enter the Active, or Main ADR sample discussed above. For the
purpose of the study, we would have to include the cross-listed firms for which ADR
programs were terminated in the analysis. The background of each terminated ADR program
was examined and the analysis revealed that the terminated ADRs fall into several categories.
The reasons for termination and the number of terminated ADRs by category are summarized
in the following table.
Table 3. Terminated ADRs by category.
Reason for termination Brief description NYSE NASDAQ AMEX Total
Included in the final ADR
sample
R1
Name/ratio changed in which case a companyis given a new CUSIP and a new DR programis created. These companies are already in theMain ADR sample with the first listing dateand do not change the sample.
46 19 3 68 No
R2
Some companies were single-listed as ADRs or were listed simultaneously on the localmarket and as ADRs and were delisted. Theydid not meet a definition of a cross-listed firm and therefore the reason for their termination isirrelevant.
63 81 1 145 No
R3
Some companies were cross-listed over a period of less than 2 years. In this case there is not enough data for a firm to be included in thesample.
2 0 1 3 No
R4 Data was not available in Datastream and it was impossible to verify the original listing program/date.
46 19 0 65 No
R5
A company was first listed on a differentmarket before being listed as an ADR; thatmarket required enhanced disclosure: LSE,Luxembourg, and other European exchanges.
16 1 1 18 No
R6
A preferred shares tranche / rights / warrants/bonds were issued in addition to the ordinary equity listing but was terminated. In this casethe program is listed as a separate ADR listingbut the company’s common stock ADR listing
39 22 1 62 No
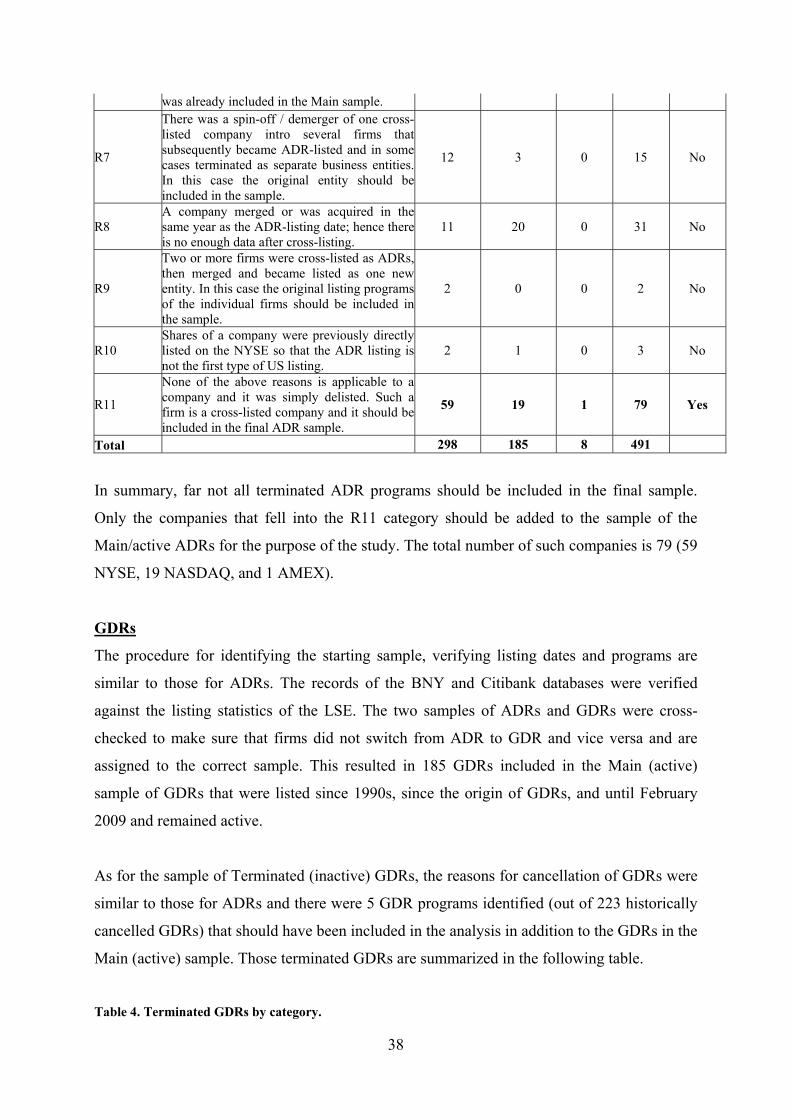
38
was already included in the Main sample.
R7
There was a spin-off / demerger of one cross-listed company intro several firms thatsubsequently became ADR-listed and in somecases terminated as separate business entities.In this case the original entity should be included in the sample.
12 3 0 15 No
R8 A company merged or was acquired in thesame year as the ADR-listing date; hence thereis no enough data after cross-listing.
11 20 0 31 No
R9
Two or more firms were cross-listed as ADRs, then merged and became listed as one newentity. In this case the original listing programsof the individual firms should be included inthe sample.
2 0 0 2 No
R10 Shares of a company were previously directly listed on the NYSE so that the ADR listing is not the first type of US listing.
2 1 0 3 No
R11
None of the above reasons is applicable to acompany and it was simply delisted. Such a firm is a cross-listed company and it should be included in the final ADR sample.
59 19 1 79 Yes
Total 298 185 8 491
In summary, far not all terminated ADR programs should be included in the final sample.
Only the companies that fell into the R11 category should be added to the sample of the
Main/active ADRs for the purpose of the study. The total number of such companies is 79 (59
NYSE, 19 NASDAQ, and 1 AMEX).
GDRs
The procedure for identifying the starting sample, verifying listing dates and programs are
similar to those for ADRs. The records of the BNY and Citibank databases were verified
against the listing statistics of the LSE. The two samples of ADRs and GDRs were cross-
checked to make sure that firms did not switch from ADR to GDR and vice versa and are
assigned to the correct sample. This resulted in 185 GDRs included in the Main (active)
sample of GDRs that were listed since 1990s, since the origin of GDRs, and until February
2009 and remained active.
As for the sample of Terminated (inactive) GDRs, the reasons for cancellation of GDRs were
similar to those for ADRs and there were 5 GDR programs identified (out of 223 historically
cancelled GDRs) that should have been included in the analysis in addition to the GDRs in the
Main (active) sample. Those terminated GDRs are summarized in the following table.
Table 4. Terminated GDRs by category.
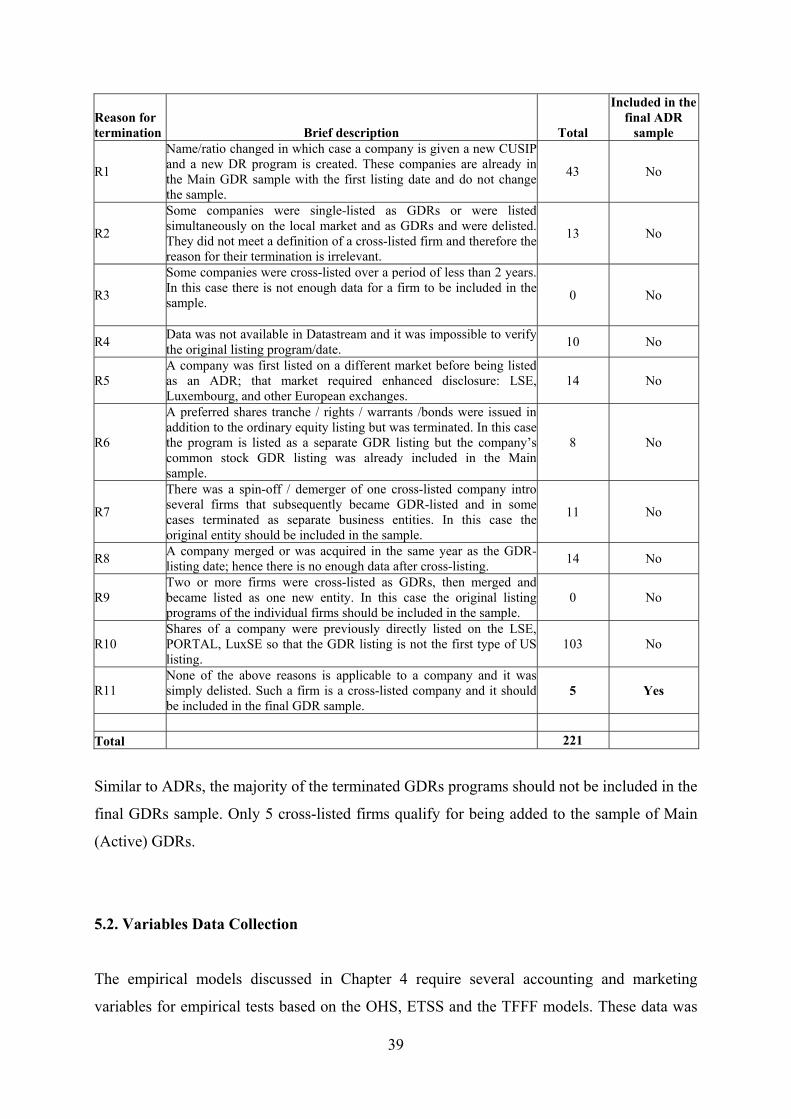
39
Reason for termination Brief description Total
Included in the final ADR
sample
R1
Name/ratio changed in which case a company is given a new CUSIPand a new DR program is created. These companies are already inthe Main GDR sample with the first listing date and do not changethe sample.
43 No
R2
Some companies were single-listed as GDRs or were listedsimultaneously on the local market and as GDRs and were delisted.They did not meet a definition of a cross-listed firm and therefore thereason for their termination is irrelevant.
13 No
R3
Some companies were cross-listed over a period of less than 2 years.In this case there is not enough data for a firm to be included in thesample.
0 No
R4 Data was not available in Datastream and it was impossible to verifythe original listing program/date.
10 No
R5 A company was first listed on a different market before being listedas an ADR; that market required enhanced disclosure: LSE,Luxembourg, and other European exchanges.
14 No
R6
A preferred shares tranche / rights / warrants /bonds were issued inaddition to the ordinary equity listing but was terminated. In this casethe program is listed as a separate GDR listing but the company’scommon stock GDR listing was already included in the Mainsample.
8 No
R7
There was a spin-off / demerger of one cross-listed company introseveral firms that subsequently became GDR-listed and in somecases terminated as separate business entities. In this case theoriginal entity should be included in the sample.
11 No
R8 A company merged or was acquired in the same year as the GDR-listing date; hence there is no enough data after cross-listing.
14 No
R9 Two or more firms were cross-listed as GDRs, then merged andbecame listed as one new entity. In this case the original listingprograms of the individual firms should be included in the sample.
0 No
R10 Shares of a company were previously directly listed on the LSE,PORTAL, LuxSE so that the GDR listing is not the first type of USlisting.
103 No
R11 None of the above reasons is applicable to a company and it wassimply delisted. Such a firm is a cross-listed company and it shouldbe included in the final GDR sample.
5 Yes
Total 221
Similar to ADRs, the majority of the terminated GDRs programs should not be included in the
final GDRs sample. Only 5 cross-listed firms qualify for being added to the sample of Main
(Active) GDRs.
5.2. Variables Data Collection
The empirical models discussed in Chapter 4 require several accounting and marketing
variables for empirical tests based on the OHS, ETSS and the TFFF models. These data was
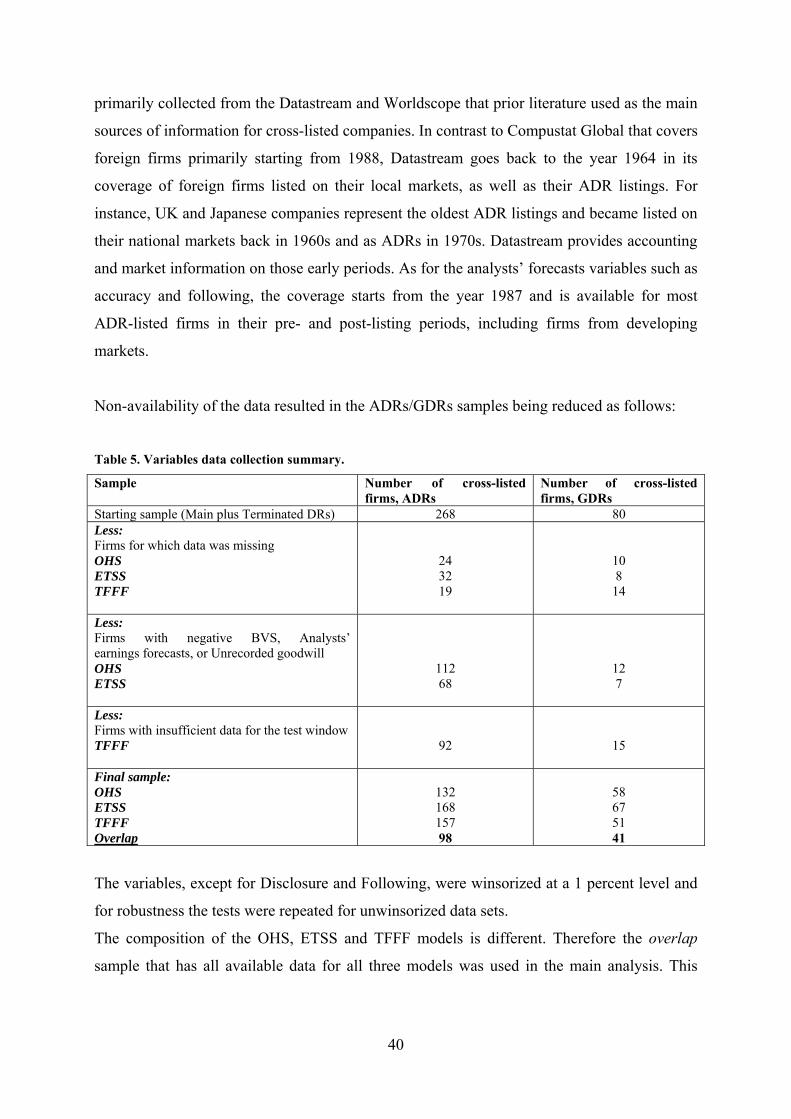
40
primarily collected from the Datastream and Worldscope that prior literature used as the main
sources of information for cross-listed companies. In contrast to Compustat Global that covers
foreign firms primarily starting from 1988, Datastream goes back to the year 1964 in its
coverage of foreign firms listed on their local markets, as well as their ADR listings. For
instance, UK and Japanese companies represent the oldest ADR listings and became listed on
their national markets back in 1960s and as ADRs in 1970s. Datastream provides accounting
and market information on those early periods. As for the analysts’ forecasts variables such as
accuracy and following, the coverage starts from the year 1987 and is available for most
ADR-listed firms in their pre- and post-listing periods, including firms from developing
markets.
Non-availability of the data resulted in the ADRs/GDRs samples being reduced as follows:
Table 5. Variables data collection summary.
Sample Number of cross-listed firms, ADRs
Number of cross-listed firms, GDRs
Starting sample (Main plus Terminated DRs) 268 80 Less: Firms for which data was missing OHS ETSS TFFF
24 32 19
10 8
14
Less: Firms with negative BVS, Analysts’ earnings forecasts, or Unrecorded goodwill OHS ETSS
112 68
12 7
Less: Firms with insufficient data for the test window TFFF
92
15
Final sample: OHS ETSS TFFF Overlap
132 168 157 98
58 67 51 41
The variables, except for Disclosure and Following, were winsorized at a 1 percent level and
for robustness the tests were repeated for unwinsorized data sets.
The composition of the OHS, ETSS and TFFF models is different. Therefore the overlap
sample that has all available data for all three models was used in the main analysis. This
41
sample contains 98 cross-listed ADR firms and 41 cross-listed GDR firms. For robustness, the
empirical tests were repeated for the individual OHS, ETSS and TFFF sub samples.
6. EMPIRICAL RESULTS
Univariate Analysis
Table 6 provides details on changes in the main variables as a result of cross-listing. Panel A
shows that for ADRs cross-listed firms raw returns dropped after cross-listing being
consistent with the decline in risk, while the market premium did not change. As expected, the
firms became larger in size with the marginally significant decrease in the book-to-market
ratio. In addition to the changes in the main variables, changes in analysts’ following and
accuracy are analyzed, too, although they are not used in the empirical tests. This provides
some insight into the changes in differential components of information environment of
ADRs and GDRs.
Analysts’ following experienced increase based on the two different measures used in the
analysis – annual number of analysts following a company measured one year prior to and
one year after cross-listing (corresponding to the implied cost of capital models) and a number
of monthly reports in a given month issued by analysts measured 24 months prior to and 24
months after cross-listing (corresponding to the realized returns models). The increase,
however, is insignificant which is not in line with the findings of Lang et al. (2003) and
Abdallah (2008) who documented increase in number of analysts following a cross-listed
firm. The result is driven by the NASDAQ ADRs and their exclusion from the sample shows
statistically significant increase in analyst following. In addition, there is no difference in
mean / median between the two measures of analyst following, suggesting that conclusions of
the study would remain unchanged regardless of the analysts’ following measure used –
monthly or annual. The analysis of the accuracy of analysts’ forecasts shows no changes in
the forecast error as a result of cross-listing. In contrast to the results of analysts’ following,
the two different measures of the accuracy – annual and monthly – might lead to different
inferences. The annual-based measure used in the implied cost of capital models shows no
improvement in the accuracy, while the monthly based measure shows improvement in the
accuracy of forecasts which is marginally significant at a 10 percent level.
42
Panel B of Table 6 provides descriptive statistics for the sample of GDRs. The raw returns are
significantly lower after cross-listing. The market returns follows a similar trend and are
lower after cross-listing. As expected, the firms are larger after cross-listing and the book-to-
market ratio drops. Unlike in the case of ADRs, analysts’ following experiences significant
increase 3.12 analysts based on the annual and by 3.5 analysts based on the monthly measure,
on average. This evidence is consistent with the findings of earlier empirical works that
documented improvement in analysts’ following for cross-listed firms (Lang et al. 2003;
Abdallah 2008). The change in the Forecast Error is consistent with that for ADRs. The
annual based forecast error shows no improvement in accuracy of forecasts, while the
monthly based measure shows improvement in the accuracy that is significant at the 10
percent level.
Comparative analysis of the descriptive statistics presented in Panels A and B of Table 6
shows that the mean estimates of the forecast error (annual measure) before and after cross-
listing are positive for both ADRs and GDRs suggesting that analysts are optimistically
biased towards cross-listed firms and that the bias is not eliminated despite improved
disclosure. The bias is larger for GDRs compare to ADRs, which is plausible provided that
GDRs sample is represented primarily by firms from emerging markets for which, on
average, the disclosure level before cross-listing is lower than for the sample of ADRs. Next,
the magnitude (mean estimate) of the forecast error and its standard deviation documented in
Table 6 are comparable to those in prior cross-listing studies. For example, in the study by
Abdallah (2008) the average forecast error was around 1.2 percent before and after cross-
listing. In this study it is 1.2 and 1.5 percent for ADRs before and after cross-listing,
respectively, and is 1.8 percent for GDRs in both periods.
Further, the findings that changes in analysts’ following are greater for GDRs is consistent
with findings by Abdallah (2008) who showed that analysts are more inclined to follow the
LSE-listed firms rather than the US-listed firms, despite higher regulations in place in the US
market. Although increase in analysts’ following for GDRs jumps from 6.95 to 10.07 analysts
after cross-listing, it is still below the level of analysts’ following for ADRs, which is 15.7
analysts. This is consistent with the fact that ADRs are on average larger than GDRs and
hence are expected to have higher analysts’ following given the positive association between
a firm’s size and analysts’ activity documented in prior literature (Bhushan 1989).
43
Finally, overall the realized returns declined after cross-listing for both ADRs and GDRs.
This is consistent with the decline in risk for investors, although the evidence cannot be
interpreted as the support to the prediction of the decline in cost of capital being due to the
reduction in information risk. Other variables used in the study such as market returns, Size,
and BM also changed in the direction that is consistent with the reduction in risk. Therefore
the evidence on the decline in realized returns after cross-listing can be due to changes in
other risk variables with which the returns experience correlation rather than due to the
changes in information risk. The multivariate tests reported in the next section are designed to
control for those explanatory variables and to test specifically for the impact of changes in
information risk on the cost of capital.
Pearson (ordinary) correlation among the variables associated with the cost of capital is
shown in Table 7. Based on the implied cost of capital models (Panel A), as expected, higher
analysts’ following is associated with higher level of public (accounting) disclosure, as well
as higher accuracy, although the correlation between accuracy and disclosure is insignificant.
The findings are consistent with prior literature and are in the predicted direction (Lang et al.
2002; Hope 2003). Panel B reports correlation among the variables used in the asset-pricing
tests. Bigger firms have lower returns and are more actively followed by analysts. The
forecast accuracy is higher for them, too. Consistent with the findings reported in Panel A,
analysts’ following is positively associated with accuracy of forecasts and the disclosure
level. Analysts’ following has a favorable impact on the cost of capital, while accuracy has an
opposite to the predicted effect. The disclosure and returns are negatively correlated, as
expected, but the association is not statistically significant.
Panel C of Table 7 provides similar information for GDRs. Panel C shows that the
correlations among disclosure level, analysts’ following and accuracy are not statistically
significant. This is possibly due to a small sample size and low statistical power. Panel D
provides evidence that is only partly consistent with that for ADRs. Unlike for ADRs, GDR-
listed firms with lower level of disclosure attract more analysts. This can be explained by the
higher demand for analysts’ services in cases where disclosure insufficient to investors. The
findings reaffirm the intermediary role of analysts that becomes even stronger in the case of
GDRs. The fact that the increase in analysts’ following is more pronounced for GDRs is in
line with this, too. Analysts’ following and accuracy are positively correlated, although the
latter has no association with the level of public (accounting) disclosure. This suggests that in
44
case of GDRs better accuracy is driven by the collective effort of analysts rather than by
additionally disclosed information.
Realized returns are negatively correlated with the analysts’ following but are positively
correlated with the accuracy of analysts’ forecasts. Larger GDR firms have higher returns
providing evidence that is not consistent with the prior literature and the ADR evidence
(Fama and French 1993). Such firms attract more analysts and the accuracy of forecasts is
higher for them, similar to ADRs. The book-to-market ratio is strongly correlated with returns
of GDRs, while was weakly correlated with returns in case of ADRs. Although some results
for GDRs provide conflicting evidence, the pair-wise (Pearson) correlation alone does not
allow making conclusions on the predictions of the study. The multivariate analysis provides
more insight into the impact of the variables on the cost of capital.
Multivariate Analysis33
ADRs
Table 8 reports results from tests of H1 based on the OHS and the ETSS models. The OHS
model was estimated using the GMM approach with a book-to-market value as an
Instrumental Variables (IV) for the URG. The explanatory power is substantially higher for
the ETSS model that is based on analysts’ forecasts. The R-squared for the model is 38.68
percent compared to the R-squared for the OHS model which is 19.67 percent. For both
models the R-squared numbers are higher than those reported in the study by Easton and
Sommers (2007). The results show that the cost of capital declines after cross-listing from
20.3 percent to 15.3 percent based on the OHS model, and from 18.40 percent to 13.58
percent based on the ETSS model. The declines are statistically significant providing support
to H1. Both point estimates after cross-listing are in line with those reported in the original
studies of OHS and ETSS who examined the UK and the US-listed firms, respectively.
O’Hanlon and Steele (2000) reported an average estimate of 14 percent for their sample of the
UK firms and in the study by ETSS (2002) cost of capital was in the range of 11.3-16.2
percent for the sample of US firms. The fact that OHS-based estimates are consistently higher
than the ETSS-based, however, is not in line with findings of Easton and Sommers (2007)
who suggested that estimates based on analysts’ forecasts should produce higher estimates
33 All OLS and GMM-based regressions reported in this section were estimated with the Newey-West standard errors.
45
due to analysts’ optimistic bias. While optimistic bias is present in the ADRs sample, the
ETSS-based estimates are still lower than OHS-based ones.
The Durbin-Wu-Hausman test suggests that the set of IVs that includes the BM and
exogenous variables is valid for estimation, as evidenced by the insignificant Sargan (J)
statistic.
The results for testing the predictions based on realized returns models are consistent with
those of implied cost of capital models and are summarized in the Table 9. The H1 is
supported based on three models and the returns decline by about 2 percent on average as a
result of cross-listing. The results hold across the three modifications of the TFFF model.
GDRs
Table 10 summarizes the results from testing the predictions for the sample of GDRs. The
OHS model was estimated using the GMM approach with a book-to-market value as an
Instrumental Variables (IV) for the URG. Unlike for ADRs, the explanatory power of the
OHS and the ETSS models is comparable with the R-squared value of 11.85 and 11.19
percent, respectively. These R-squared numbers are substantially lower than those reported
for ADRs, although somewhat in line with those reported by Easton and Sommers (2007).
The result shows that the cost of capital declines from 26.1 percent to 15.6 percent for the
OHS model and from 17.5 to 13.4 percent for the ETSS model. The decline in cost of capital
is significant for the OHS model supporting the H1 but is not statistically different from zero
for the ETSS model. One possible explanation for the insignificant result is low power of tests
due to a small sample size of GDRs. As in the case of ADRs, both point estimates after cross-
listing are close to those reported in the original studies by OHS (14 percent) and ETSS (11.3-
16.2 percent). In addition, the estimates are close to those reported for ADRs, except for the
OHS-based estimate before cross-listing which is 26.1 percent for GDRs and 20.3 percent for
ADRs. The magnitude of decline in cost of capital is therefore more pronounced for GDRs,
although we cannot directly test for the statistical significance of the incremental changes in
cost of capital for GDRs. The prediction H2 is specifically designed for such test.
The Durbin-Wu-Hausman test suggests that the set of IVs that includes the BM and
exogenous variables is valid for estimation, as evidenced by the insignificant Sargan (J)
statistic, although is not as good as in the case of ADRs.
46
Table 9 reports the results of testing the predictions based on the realized returns models. The
H1 prediction is confirmed and the cost of capital declines after cross-listing as GDRs.
Consistent with findings for implied cost of capital models, the magnitude of decline in
returns is slightly higher, around 2.6 percent, than for ADRs.
H2: ADRs versus GDRs
The H2 test results are summarized in Table 11 (implied cost of capital models) and in Table
12 (realized returns models). The estimation of the cross-listing decision model (first stage)
using Probit model is presented in Panel A and the cost of capital model (second stage) is
presented in Panel B of each Table. The first-stage model is the same for the OHS and the
ETSS models.
Table 11, Panel A, provides evidence that is consistent with prior research and expectations.
The firms that choose ADR listing are bigger and are domiciled in countries with higher
disclosure level, on average. This is consistent with the fact that the GDRs sample is mostly
represented by the firms form emerging markets with less stringent disclosure requirements.
Industry factor plays important role in choosing a cross-listing destination but growth does
not explain firms’ decisions to list as ADRs or GDRs. The likelihood ratio statistics indicates
that overall the cross-listing decision model has significant explanatory power.
Table 11, Panel B, shows that changes in cost of capital are not more pronounced for ADRs
compared to GDRs, as evidenced by the insignificant 6 coefficient. Therefore the H2 is not
confirmed based on the OHS model estimation. Based on the ETSS model (Panel C of Table
11), the prediction is not confirmed either: the sum of coefficients 76 is not statistically
different from zero. . In the OHS and ETSS models the Inverse Mills ratio is not a significant
explanatory variables, suggesting that controlling for the self-selection bias using the
treatment effect methodology does not affect the results. Alternatively, the applied
methodology is not effective for the self-selection bias control in given settings.
The cross-listing decision model for realized returns estimation is presented in the Table 12,
Panel A. It shows that firms that are bigger and have a higher level of public disclosure on
domestic markets are more likely to cross-list as ADRs rather than GDRs. As before, the
47
industry factor is important to the decision. Unlike for implied cost of capital models, growth
is an important factor, too, and rapidly growing firms are more likely to raise capital in the
UK market.
The H2 prediction is not supported based on realized returns models. However, when a simple
dummy model (Model 1) is used, the coefficient is positive and statistically significant
suggesting that the cost of capital changes are in fact more pronounced for GDRs. The
findings can be interpreted as the evidence that the changes in cost of capital vary with the
quality of disclosed information. When the market premium, size and book-to-market
variables are introduced (Models 2 and 3), the coefficients is no longer significant. As before,
the Inverse Mills ratio is insignificant. The result is contrary to predictions and indicates that
cross-listing on the market with higher reporting requirements does not necessarily result in
greater changes in the cost of capital. The finding is consistent with Leuz and Verrecchia
(2000) who failed to find the difference in three proxies for the information asymmetry
component of the cost of capital for firms reporting in accordance with IAS versus US GAAP.
No difference in magnitude of changes in cost of capital for ADRs versus GDRs implies that
it is the commitment to enhanced disclosure rather than accounting standards per se that are
important to investors (Leuz and Verrecchia 2000).
ROBUSTNESS ANALYSIS
In this section the study reports results from using alternative specification for some variables,
modifications of samples, and estimation techniques for some models. Those tests were
conducted to assess the validity of the assumptions used in the main analysis.
Individual sub sample
Chapter 5 that describes details on data collection discusses the procedures used to construct
the ADRs and the GDRs samples that were used in the main analysis of the study. To remind,
due to the fact that some cross-listed firms were missing either accounting, marketing
variables or both, the final samples of ADRs and GDRs comprised of only 98 and 41 cross-
listed firms, respectively. Those firms have all the necessary information required to estimate
cost of capital based on all three models of the study – OHS, ETSS, and realized returns
models.
48
The individual OHS, ETSS and realized returns subsamples of ADRs and GDRs are larger
due to lower data restrictions imposed. Given the fact that the small sample sizes of 98 and 41
firms for ADRs and GDRs may result in low statistical power and the higher probability of
the type II error, we repeat the main analysis and test the study’s predictions based on the
individual sub samples that are larger. The first sub sample of ADRs/GDRs (sub sample 1) is
the one that comprises of firms that have sufficient data for the implied cost of capital models
- OHS and ETSS – and the second sub sample (sub sample 2) contains the firms that have
enough data for realized returns models but do not have all the necessary variables for the
implied cost of capital models. This allows making the ADRs and GDRs samples larger and
assessing the sensitivity of the results to the exclusion of firms that were lost as a result of
matching the three samples. The procedure does not affect NASDAQ and AMEX ADRs that
are not numerous in the main analysis’ sample but does allow including a few additional
NYSE ADRs in the samples.
For the ADRs the sub sample 1 contains 116 cross-listed firms and the sub sample 2 contains
141 cross-listed firms, compared to 98 firms in the main sample. None of the conclusions of
the main analysis change. The tests based on the realized returns models return similar results
and conclusions for the sub sample 2 are as for the main sample. The explanatory power is
lower for the sub sample 1 compared to the main sample, despite the larger sample size, and
is higher for the sub sample 2 compared to the main sample. For the GDRs the sub sample 1
has 48 firms and the sub sample 2 has 45 firms. The conclusions remain the same for all the
predictions and, as before, the explanatory power for the sub sample 1 is lower than that for
the main sample, while it is higher for the sub sample 2 compared to the main sample.
Alternative time periods for realized returns models
As an additional analysis, we use a shorter window of 12 months prior to and 12 months after
cross-listing. As would be expected, the statistical power of the tests is lower and some of the
coefficients become marginally significant or loose significance. The H1 prediction is no
longer confirmed for ADRs, while it was supported based on the 24-month window analysis.
Other conclusions remain valid.
7. CONCLUSIONS AND LIMITATIONS
49
The study extends the cross-listing literature and provides empirical evidence on the impact of
cross-listing via two alternative depository receipts tools – American Depository Receipts and
Global Depository Receipts – on the cost of equity capital. Using a global sample of ADRs
and GDRs cross-listed companies we show that cost of capital declines for both ADRs and
GDRs cross-listed firms following a cross-listing and the results are robust to the
methodology choice. In addition, there is some evidence that the changes in cost of equity
capital of cross-listed firms vary with the quality of disclosed information.
LIMITATIONS OF THE STUDY
The cost of capital estimation models used in prior literature and that are used in the present
study are far from providing consistent results and suffer from a number of limitations. The
models based on realized earnings, such as O’Hanlon and Steele (2000), suggest that having
accounting based measures such as realized earnings and book value per share is sufficient to
estimate rate of return required by investors. The implied cost of capital models that are based
on forward-looking analysts’ forecasts, such as ETSS (2002) suffer from analysts’ optimistic
bias, and there is no technique up to date that would allow correcting for the bias. Finally, the
realized returns models are noise proxies for the cost of capital as they assume rational pricing
and ignore information surprises that usually occur during the sampled periods. Validating the
cost of capital models, however, is not the purpose of the study. Instead, the study assesses the
validity of the results by using all three described methodologies and compares the findings.
The small sample size of the ADRs and GDRs samples suggest that the presented results
should be interpreted with caution. Low power of statistical tests and a high probability of
making a type II error is an obvious limitation of the study. To ensure that the lost
observations would not affect the main conclusions of the study we performed the robustness
check and repeated the analysis based on the larger (individual) sub samples of ADRs and
GDRs and conclude that the main results of the study remain unchanged.
Another potential limitation of the study is that we use the country-based disclosure proxy
rather than firm-specific ones. There is a risk that a country-specific metric would not capture
the full scope of disclosed information by firms. Due to time constrains it is not feasible to
construct firm-specific measures and we therefore rely on the most up to date country-based
variable.
50
References
Abdallah, A. A-N. “Do regulations matter? The effects of cross-listing on analysts’ coverage
and forecast errors”. Review of Accounting and Finance, 7/ 3 (2008): 285-307. Alexander, G., C. Eun, and S. Janakiraman. “Asset pricing and dual listing on foreign capital
markets: A note”. The Journal of finance, 42 (1987): 151-158. Alexander, G., C. Eun, and S. Janakiraman. “International listings and stock returns: Some
empirical evidence”. Journal of Financial and Quantitative Analysis, 23 (1988): 135-151.
Amihud, Y. and H. Mendelson. “Asset pricing and the bid-ask spread”. Journal of Financial Economics”, 17 (1986): 223-249.
Barth, M.E., Y. Konchitchki and W.R. Landsman. “Cost of capital and earnings transparency”. Working paper, Stanford University (2009).
Basu, S. “The conservatism principle and the asymmetric timeliness of earnings”. Journal and Accounting and Economics, 24/1 (1997): 3-37.
Bhattacharya, U., H. Daouk and M. Welker. “The world pricing of earnings opacity”. The Accounting Review, 78 (2003): 641-673.
Botosan, C.A. “Disclosure level and the cost of equity capital”. The Accounting Review, 72/3 (1997): 323-349.
Botosan, C.A and M.A. Plumlee. “A Re-examining of disclosure level and the expected cost of capital”. Journal of Accounting Research, 40/1 (2002): 21-40.
Botosan, C.A and M.A. Plumlee. “Assessing alternative proxies for the expected risk premium”. The Accounting Review, 80/1 (2005): 21-53.
Bhushan, R. “Firm characteristics and analyst following”. Journal of Accounting and Economics, 11 (1989): 255-174.
Claus, J., Thomas, J. “Equity premia as low as three percent? Evidence from analysts’ earnings forecasts for domestic and international stock markets”. Journal of Finance, 56 (2001): 1629-66.
Easley, D. and M. O’Hara. “Information and the cost of capital”. The Journal of Finance, LIX/4 (2004): 1553-83.
Easton, P.D. “PE ratios, PEG ratios, and estimating the implied expected rate of return on equity capital”. The Accounting Review, 79/1 (2004): 73-96.
Easton, P.D. and S. Monahan. “An evaluation of accounting-based measures of expected returns”. The Accounting Review, 80 (2005): 501-38.
Easton, P.D. and G.A. Sommers. “Effect of analysts’ optimism on estimates of the expected rate of return implied by earnings forecasts”. Journal of Accounting Research, 45/5 (2007): 983-1015.
Easton, P., Taylor, G., Shroff, P. and T. Sougiannis. “Using forecasts of earnings to simultaneously estimate growth and the rate of return on equity investment”. Journal of Accounting Research, 40/3 (2002): 657-676.
Errunza, V.R. and D.P. Miller. “Market segmentation and the cost of capital in international equity markets”. Journal of Financial and Quantitative analysis, 35/ 4 (2000): 577-600.
Foerster, S. and G.A. Karolyi. “International listings of stocks: The case of Canada and the U.S.”. Journal of International Business Studies, 24 (1993): 763-784.
Foerster, S.R. and G.A. Karolyi. “The effects of market segmentation and investor recognition on asset prices: evidence from foreign stocks listing in the United States”. The Journal of Finance, LIV/3 (1999): 981-1013.
Francis, J.R., I.K. Khurana, and R. Pereira. “Disclosure incentives and effects on cost of capital around the world”. The Accounting Review, 80/4 (2005): 1125-62.
51
Francis, J., LaFond, R., Olsson, Per M. and K. Schipper. “Cost of Equity and Earnings Attributes”. The Accounting Review, 40/7 (2004): 967-1010.
Francis, J., LaFond, R., Olsson, Per M. and K. Schipper. “The market pricing of accruals quality”. Journal of Accounting and Economics, 39/2 (2005): 295-327.
Francis, J.R. and C.S. Lennox. “Selection models in Accounting Research”. Working paper (2008).
Geary, R. “The frequency distribution of the quotient of two normal variates”. Journal of Royal Statistical Society, Vol. 93 (1930): 442-46.
Gebhardt, W.R., Lee, C.M. and B. Swaminathan. “Toward an implied cost of capital”. Journal of Accounting Research, 39/1 (2001): 135-176.
Gode, D. and P. Mohanram. “Inferring the cost of capital using the Ohlson – Juettner model”. Reviews of Accounting Studies, 8 (2003): 399-431.
Ashbaugh, M. “Non-US firms’ accounting standard choices”. Journal of Accounting and Public Policy, Vol. 20 (2001): 129-153.
Hail, L. and C. Leuz. “Cost of capital effects and changes in growth expectations around U.S. cross-listings”. Journal of Financial Economics, 93/3 (2009): 428-454.
Healy, P.M. and K.G. Palepu. “Information asymmetry, corporate disclosure and the capital markets: A review of the empirical disclosure literature”. Journal of Accounting and Economics, 31 (2001): 405-40.
Hribar, P. and N. Jenkins. ‘The effect of accounting restatement on earnings revisions and the estimated cost of capital”. Review of Accounting studies”, Vol. 9 (2004): 337-356.
Hope, O-K. “Disclosure practices, enforcement of accounting standards, and analysts’ forecast accuracy: an international study”. Journal of Accounting Research, 41/2 (2003): 235-272.
Hughes, J.S., Liu, J. and J. Liu. “Information asymmetry, diversification, and cost of capital”. The Accounting Review, 82/3 (2007): 705-729.
Karolyi, G.A. “Why do companies list abroad? A survey of the evidence and its managerial implications”. Financial Markets, Institutions and Instruments, 7 (1998): 1-60.
Karolyi, G.A. “The world of cross-listing and cross-listing of the World: challenging conventional wisdom”. Review of Finance, 10 (2006): 99-152.
Lambert, R., C. Leuz, and R.E. Verrecchia. “Accounting information, disclosure, and the cost of capital”. Journal of Accounting Research, 45/2 (2007): 385-420.
Lang, M.H., Lins, K.V. and D.P. Miller. “ADRs, analysts, and accuracy: does cross listing in the United States improve a firm’s information environment and increase market value?” Journal of Accounting Research, 41/2 (Supplement 2003).
Larcker, D.F. and T.O. Rusticus. “On the use of instrumental variables in accounting research”. Journal of Accounting and Economics, 49 (2010): 186-205.
Leuz, C. and R.E. Verrecchia. “The economic consequences of increased disclosure”. Journal of Accounting Research, 38 (Supplement, 2000): 91-124.
Lys, T. and L.G. Soo. “Analysts’ forecast precision as a response to competition”. Journal of Accounting, Auditing and Finance, 10/4 (1995): 751-765.
Merton, R.C. “A simple model of capital market equilibrium with incomplete information”. The Journal of Finance, 42/3 (1987): 483-510.
Miller, D.P. “The market reaction to international cross-listings: evidence from Depository Receipts”. Journal of Financial Economics”, 51 (1999): 103-123.
O’Hanlon, J. and A. Steele. “Estimating the equity risk premium using accounting fundamentals”. Journal of Business Finance and Accounting, 27 (9) (2000): 1051-83.
Ohlson, J.A. “Earnings, book values, and dividends in equity valuation”. Contemporary Accounting Research, 11/2 (1995): 661-687.

52
Saudagaran, S.M. and J.G. Diga. “Financial reporting in emerging capital markets: characteristics and policy issues”. Accounting Horizons, 97/11 (1997): 41-64.
Stulz, R. “The cost of capital in internationally integrated markets: The case of Nestle”. European Financial Management, 1 (1995): 1-23.
Stulz, R. “Globalization, corporate finance, and the cost of capital”. Journal of Applied Corporate Finance, 12 (1999): 8-25.
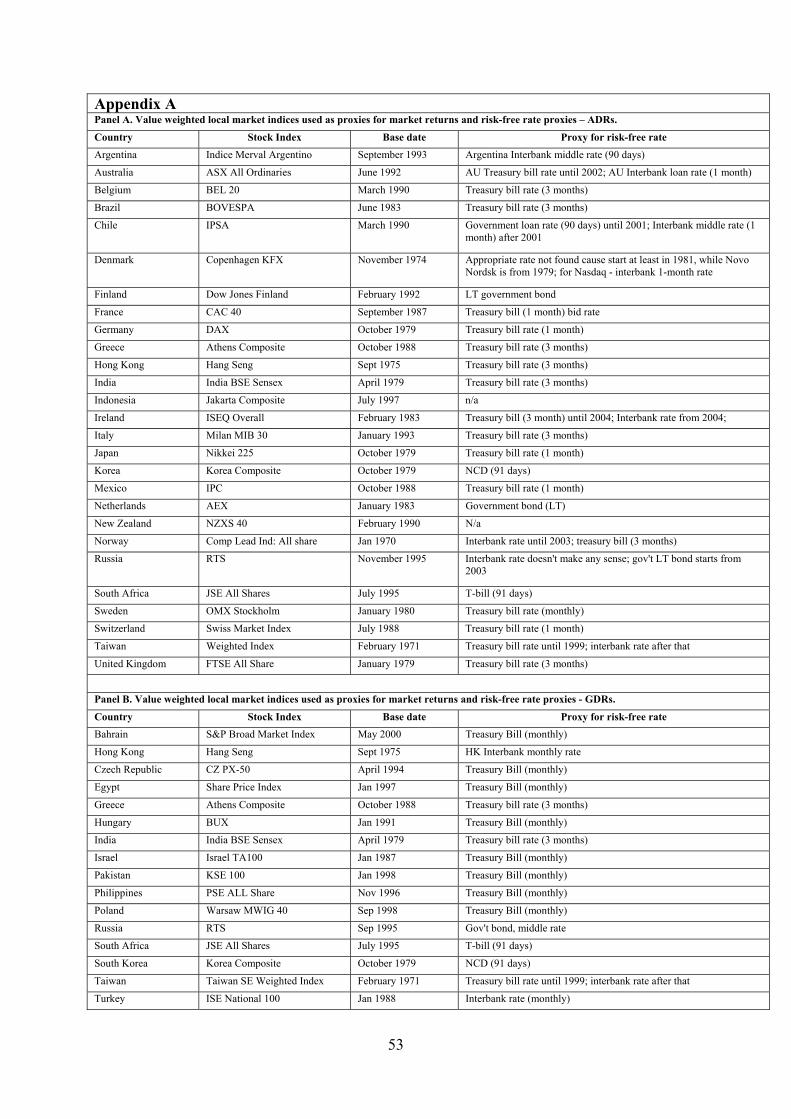
53
Appendix A Panel A. Value weighted local market indices used as proxies for market returns and risk-free rate proxies – ADRs.
Country Stock Index Base date Proxy for risk-free rate
Argentina Indice Merval Argentino September 1993 Argentina Interbank middle rate (90 days)
Australia ASX All Ordinaries June 1992 AU Treasury bill rate until 2002; AU Interbank loan rate (1 month)
Belgium BEL 20 March 1990 Treasury bill rate (3 months)
Brazil BOVESPA June 1983 Treasury bill rate (3 months)
Chile IPSA March 1990 Government loan rate (90 days) until 2001; Interbank middle rate (1 month) after 2001
Denmark Copenhagen KFX November 1974 Appropriate rate not found cause start at least in 1981, while Novo Nordsk is from 1979; for Nasdaq - interbank 1-month rate
Finland Dow Jones Finland February 1992 LT government bond
France CAC 40 September 1987 Treasury bill (1 month) bid rate
Germany DAX October 1979 Treasury bill rate (1 month)
Greece Athens Composite October 1988 Treasury bill rate (3 months)
Hong Kong Hang Seng Sept 1975 Treasury bill rate (3 months)
India India BSE Sensex April 1979 Treasury bill rate (3 months)
Indonesia Jakarta Composite July 1997 n/a
Ireland ISEQ Overall February 1983 Treasury bill (3 month) until 2004; Interbank rate from 2004;
Italy Milan MIB 30 January 1993 Treasury bill rate (3 months)
Japan Nikkei 225 October 1979 Treasury bill rate (1 month)
Korea Korea Composite October 1979 NCD (91 days)
Mexico IPC October 1988 Treasury bill rate (1 month)
Netherlands AEX January 1983 Government bond (LT)
New Zealand NZXS 40 February 1990 N/a
Norway Comp Lead Ind: All share Jan 1970 Interbank rate until 2003; treasury bill (3 months)
Russia RTS November 1995 Interbank rate doesn't make any sense; gov't LT bond starts from 2003
South Africa JSE All Shares July 1995 T-bill (91 days)
Sweden OMX Stockholm January 1980 Treasury bill rate (monthly)
Switzerland Swiss Market Index July 1988 Treasury bill rate (1 month)
Taiwan Weighted Index February 1971 Treasury bill rate until 1999; interbank rate after that
United Kingdom FTSE All Share January 1979 Treasury bill rate (3 months)
Panel B. Value weighted local market indices used as proxies for market returns and risk-free rate proxies - GDRs.
Country Stock Index Base date Proxy for risk-free rate
Bahrain S&P Broad Market Index May 2000 Treasury Bill (monthly)
Hong Kong Hang Seng Sept 1975 HK Interbank monthly rate
Czech Republic CZ PX-50 April 1994 Treasury Bill (monthly)
Egypt Share Price Index Jan 1997 Treasury Bill (monthly)
Greece Athens Composite October 1988 Treasury bill rate (3 months)
Hungary BUX Jan 1991 Treasury Bill (monthly)
India India BSE Sensex April 1979 Treasury bill rate (3 months)
Israel Israel TA100 Jan 1987 Treasury Bill (monthly)
Pakistan KSE 100 Jan 1998 Treasury Bill (monthly)
Philippines PSE ALL Share Nov 1996 Treasury Bill (monthly)
Poland Warsaw MWIG 40 Sep 1998 Treasury Bill (monthly)
Russia RTS Sep 1995 Gov't bond, middle rate
South Africa JSE All Shares July 1995 T-bill (91 days)
South Korea Korea Composite October 1979 NCD (91 days)
Taiwan Taiwan SE Weighted Index February 1971 Treasury bill rate until 1999; interbank rate after that
Turkey ISE National 100 Jan 1988 Interbank rate (monthly)
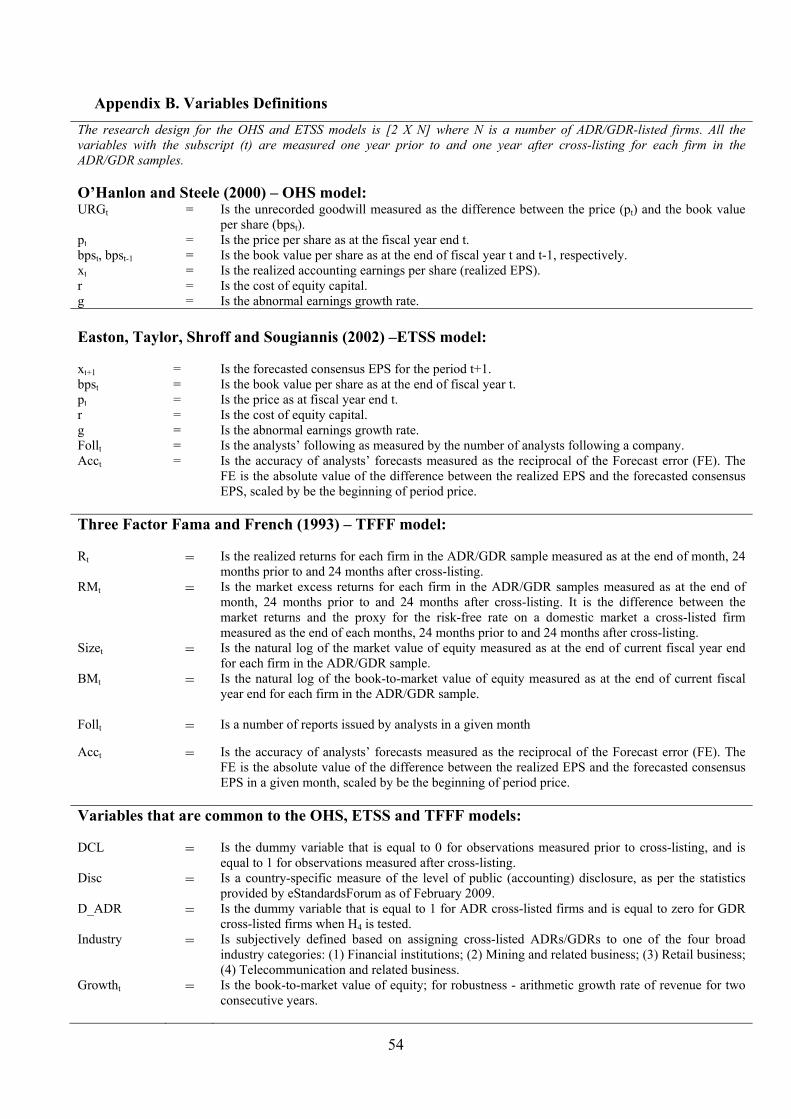
54
Appendix B. Variables Definitions
The research design for the OHS and ETSS models is [2 X N] where N is a number of ADR/GDR-listed firms. All the variables with the subscript (t) are measured one year prior to and one year after cross-listing for each firm in the ADR/GDR samples. O’Hanlon and Steele (2000) – OHS model: URGt = Is the unrecorded goodwill measured as the difference between the price (pt) and the book value
per share (bpst). pt = Is the price per share as at the fiscal year end t. bpst, bpst-1 = Is the book value per share as at the end of fiscal year t and t-1, respectively. xt = Is the realized accounting earnings per share (realized EPS). r = Is the cost of equity capital. g = Is the abnormal earnings growth rate.
Easton, Taylor, Shroff and Sougiannis (2002) –ETSS model: xt+1 = Is the forecasted consensus EPS for the period t+1. bpst = Is the book value per share as at the end of fiscal year t. pt = Is the price as at fiscal year end t. r = Is the cost of equity capital. g = Is the abnormal earnings growth rate. Follt = Is the analysts’ following as measured by the number of analysts following a company. Acct = Is the accuracy of analysts’ forecasts measured as the reciprocal of the Forecast error (FE). The
FE is the absolute value of the difference between the realized EPS and the forecasted consensus EPS, scaled by be the beginning of period price.
Three Factor Fama and French (1993) – TFFF model: Rt = Is the realized returns for each firm in the ADR/GDR sample measured as at the end of month, 24
months prior to and 24 months after cross-listing. RMt = Is the market excess returns for each firm in the ADR/GDR samples measured as at the end of
month, 24 months prior to and 24 months after cross-listing. It is the difference between the market returns and the proxy for the risk-free rate on a domestic market a cross-listed firm measured as the end of each months, 24 months prior to and 24 months after cross-listing.
Sizet = Is the natural log of the market value of equity measured as at the end of current fiscal year end for each firm in the ADR/GDR sample.
BMt = Is the natural log of the book-to-market value of equity measured as at the end of current fiscal year end for each firm in the ADR/GDR sample.
Follt = Is a number of reports issued by analysts in a given month
Acct = Is the accuracy of analysts’ forecasts measured as the reciprocal of the Forecast error (FE). The FE is the absolute value of the difference between the realized EPS and the forecasted consensus EPS in a given month, scaled by be the beginning of period price.
Variables that are common to the OHS, ETSS and TFFF models: DCL = Is the dummy variable that is equal to 0 for observations measured prior to cross-listing, and is
equal to 1 for observations measured after cross-listing. Disc = Is a country-specific measure of the level of public (accounting) disclosure, as per the statistics
provided by eStandardsForum as of February 2009. D_ADR = Is the dummy variable that is equal to 1 for ADR cross-listed firms and is equal to zero for GDR
cross-listed firms when H4 is tested. Industry = Is subjectively defined based on assigning cross-listed ADRs/GDRs to one of the four broad
industry categories: (1) Financial institutions; (2) Mining and related business; (3) Retail business; (4) Telecommunication and related business.
Growtht = Is the book-to-market value of equity; for robustness - arithmetic growth rate of revenue for two consecutive years.
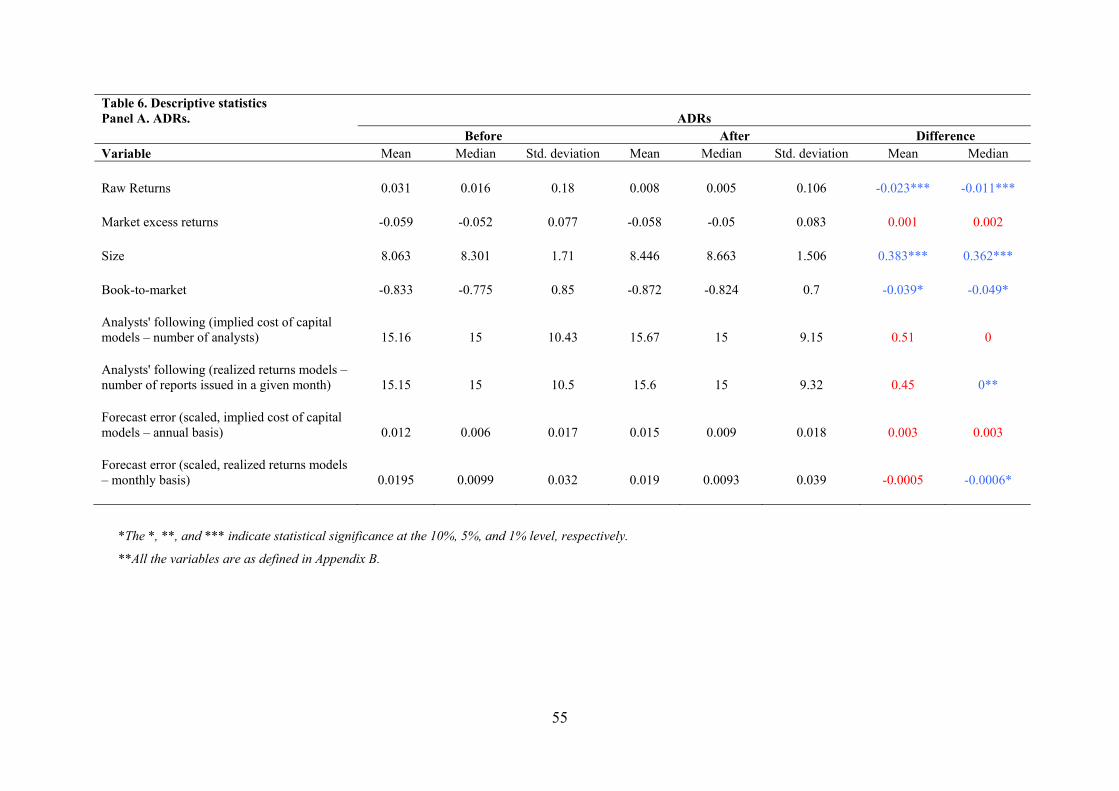
55
Table 6. Descriptive statistics Panel A. ADRs. ADRs Before After Difference Variable Mean Median Std. deviation Mean Median Std. deviation Mean Median Raw Returns 0.031 0.016 0.18 0.008 0.005 0.106 -0.023*** -0.011*** Market excess returns -0.059 -0.052 0.077 -0.058 -0.05 0.083 0.001 0.002 Size 8.063 8.301 1.71 8.446 8.663 1.506 0.383*** 0.362*** Book-to-market -0.833 -0.775 0.85 -0.872 -0.824 0.7 -0.039* -0.049* Analysts' following (implied cost of capital models – number of analysts) 15.16 15 10.43 15.67 15 9.15 0.51 0 Analysts' following (realized returns models – number of reports issued in a given month) 15.15 15 10.5 15.6 15 9.32 0.45 0** Forecast error (scaled, implied cost of capital models – annual basis) 0.012 0.006 0.017 0.015 0.009 0.018 0.003 0.003 Forecast error (scaled, realized returns models – monthly basis) 0.0195 0.0099 0.032 0.019 0.0093 0.039 -0.0005 -0.0006*
*The *, **, and *** indicate statistical significance at the 10%, 5%, and 1% level, respectively.
**All the variables are as defined in Appendix B.
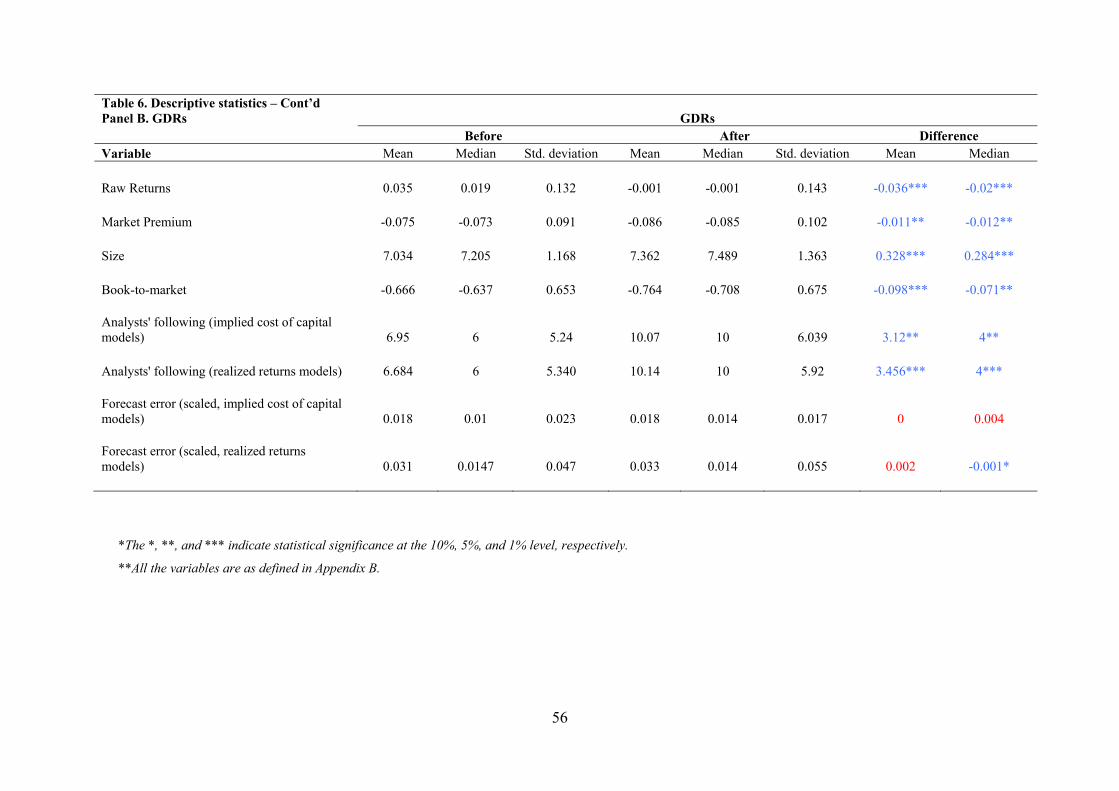
56
Table 6. Descriptive statistics – Cont’d Panel B. GDRs GDRs Before After Difference Variable Mean Median Std. deviation Mean Median Std. deviation Mean Median Raw Returns 0.035 0.019 0.132 -0.001 -0.001 0.143 -0.036*** -0.02*** Market Premium -0.075 -0.073 0.091 -0.086 -0.085 0.102 -0.011** -0.012** Size 7.034 7.205 1.168 7.362 7.489 1.363 0.328*** 0.284*** Book-to-market -0.666 -0.637 0.653 -0.764 -0.708 0.675 -0.098*** -0.071** Analysts' following (implied cost of capital models) 6.95 6 5.24 10.07 10 6.039 3.12** 4** Analysts' following (realized returns models) 6.684 6 5.340 10.14 10 5.92 3.456*** 4*** Forecast error (scaled, implied cost of capital models) 0.018 0.01 0.023 0.018 0.014 0.017 0 0.004 Forecast error (scaled, realized returns models) 0.031 0.0147 0.047 0.033 0.014 0.055 0.002 -0.001*
*The *, **, and *** indicate statistical significance at the 10%, 5%, and 1% level, respectively.
**All the variables are as defined in Appendix B.
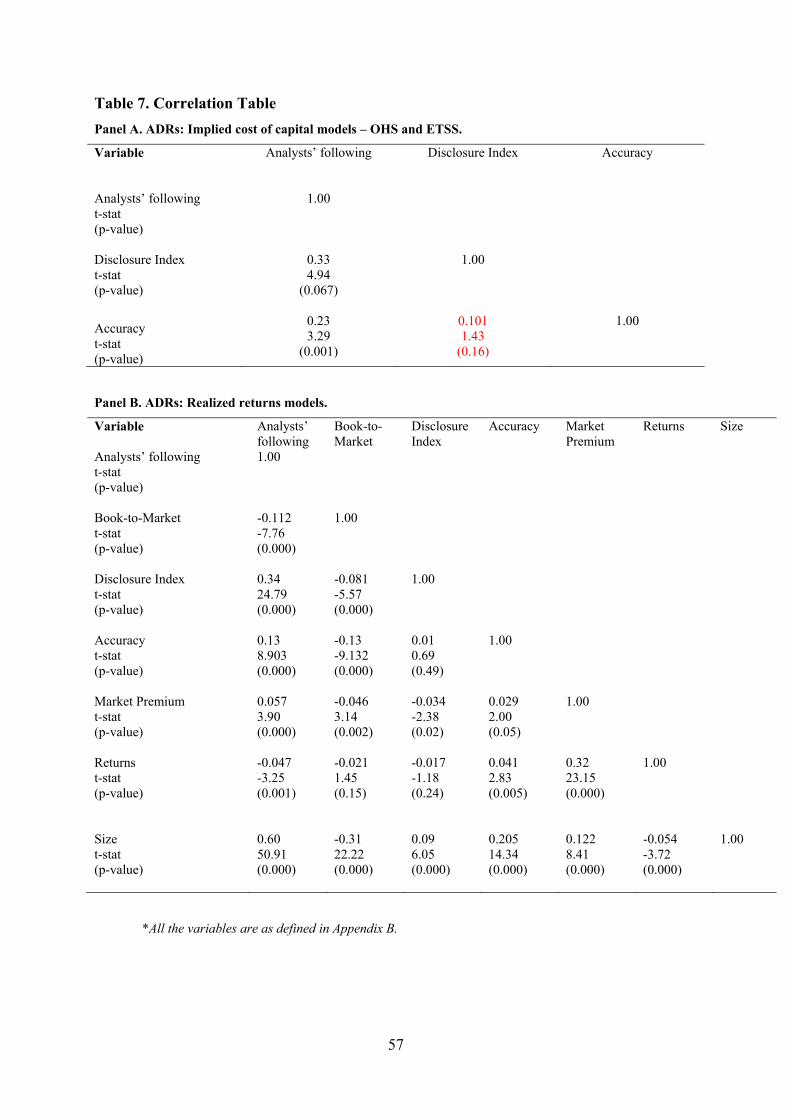
57
Table 7. Correlation Table
Panel A. ADRs: Implied cost of capital models – OHS and ETSS.
Variable
Analysts’ following Disclosure Index Accuracy
Analysts’ following t-stat (p-value)
1.00
Disclosure Index t-stat (p-value)
0.33 4.94
(0.067)
1.00
Accuracy t-stat (p-value)
0.23 3.29
(0.001)
0.101 1.43
(0.16)
1.00
Panel B. ADRs: Realized returns models.
Variable Analysts’ following
Book-to-Market
Disclosure Index
Accuracy Market Premium
Returns Size
Analysts’ following t-stat (p-value)
1.00
Book-to-Market t-stat (p-value)
-0.112 -7.76 (0.000)
1.00
Disclosure Index t-stat (p-value)
0.34 24.79 (0.000)
-0.081 -5.57 (0.000)
1.00
Accuracy t-stat (p-value)
0.13 8.903 (0.000)
-0.13 -9.132 (0.000)
0.01 0.69 (0.49)
1.00
Market Premium t-stat (p-value)
0.057 3.90 (0.000)
-0.046 3.14 (0.002)
-0.034 -2.38 (0.02)
0.029 2.00 (0.05)
1.00
Returns t-stat (p-value)
-0.047 -3.25 (0.001)
-0.021 1.45 (0.15)
-0.017 -1.18 (0.24)
0.041 2.83 (0.005)
0.32 23.15 (0.000)
1.00
Size t-stat (p-value)
0.60 50.91 (0.000)
-0.31 22.22 (0.000)
0.09 6.05 (0.000)
0.205 14.34 (0.000)
0.122 8.41 (0.000)
-0.054 -3.72 (0.000)
1.00
*All the variables are as defined in Appendix B.
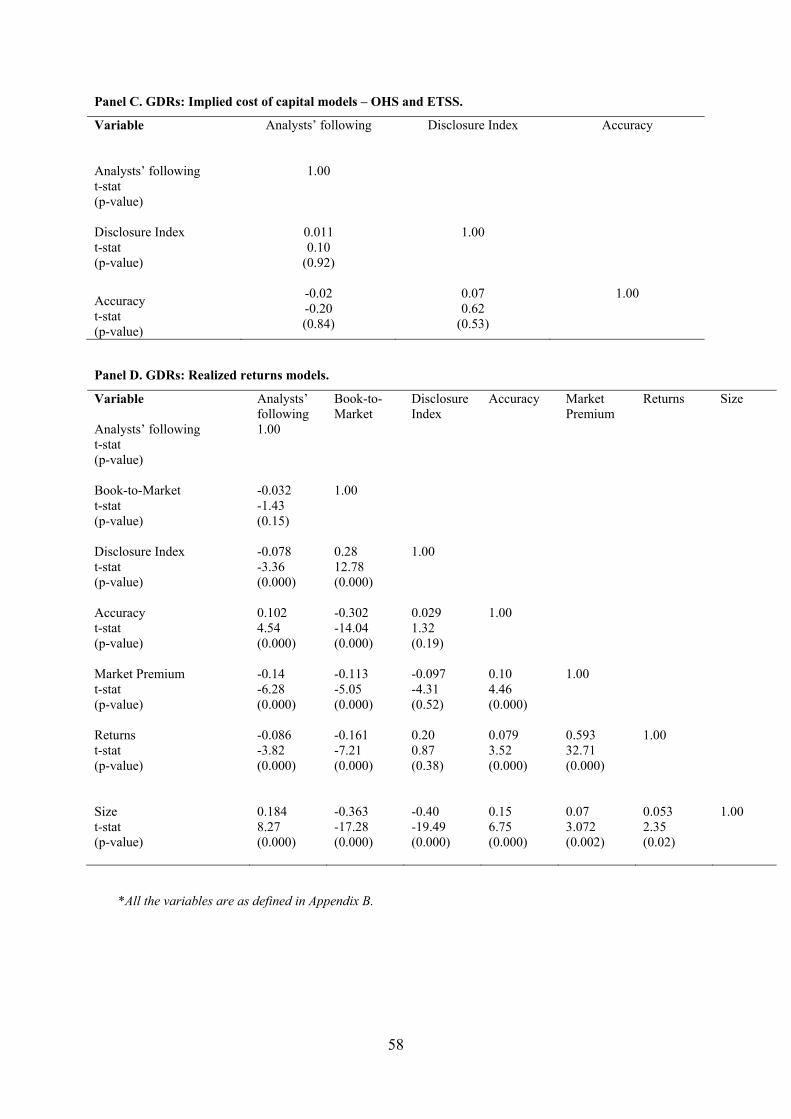
58
Panel C. GDRs: Implied cost of capital models – OHS and ETSS.
Variable
Analysts’ following Disclosure Index Accuracy
Analysts’ following t-stat (p-value)
1.00
Disclosure Index t-stat (p-value)
0.011 0.10
(0.92)
1.00
Accuracy t-stat (p-value)
-0.02 -0.20 (0.84)
0.07 0.62
(0.53)
1.00
Panel D. GDRs: Realized returns models.
Variable Analysts’ following
Book-to-Market
Disclosure Index
Accuracy Market Premium
Returns Size
Analysts’ following t-stat (p-value)
1.00
Book-to-Market t-stat (p-value)
-0.032 -1.43 (0.15)
1.00
Disclosure Index t-stat (p-value)
-0.078 -3.36 (0.000)
0.28 12.78 (0.000)
1.00
Accuracy t-stat (p-value)
0.102 4.54 (0.000)
-0.302 -14.04 (0.000)
0.029 1.32 (0.19)
1.00
Market Premium t-stat (p-value)
-0.14 -6.28 (0.000)
-0.113 -5.05 (0.000)
-0.097 -4.31 (0.52)
0.10 4.46 (0.000)
1.00
Returns t-stat (p-value)
-0.086 -3.82 (0.000)
-0.161 -7.21 (0.000)
0.20 0.87 (0.38)
0.079 3.52 (0.000)
0.593 32.71 (0.000)
1.00
Size t-stat (p-value)
0.184 8.27 (0.000)
-0.363 -17.28 (0.000)
-0.40 -19.49 (0.000)
0.15 6.75 (0.000)
0.07 3.072 (0.002)
0.053 2.35 (0.02)
1.00
*All the variables are as defined in Appendix B.
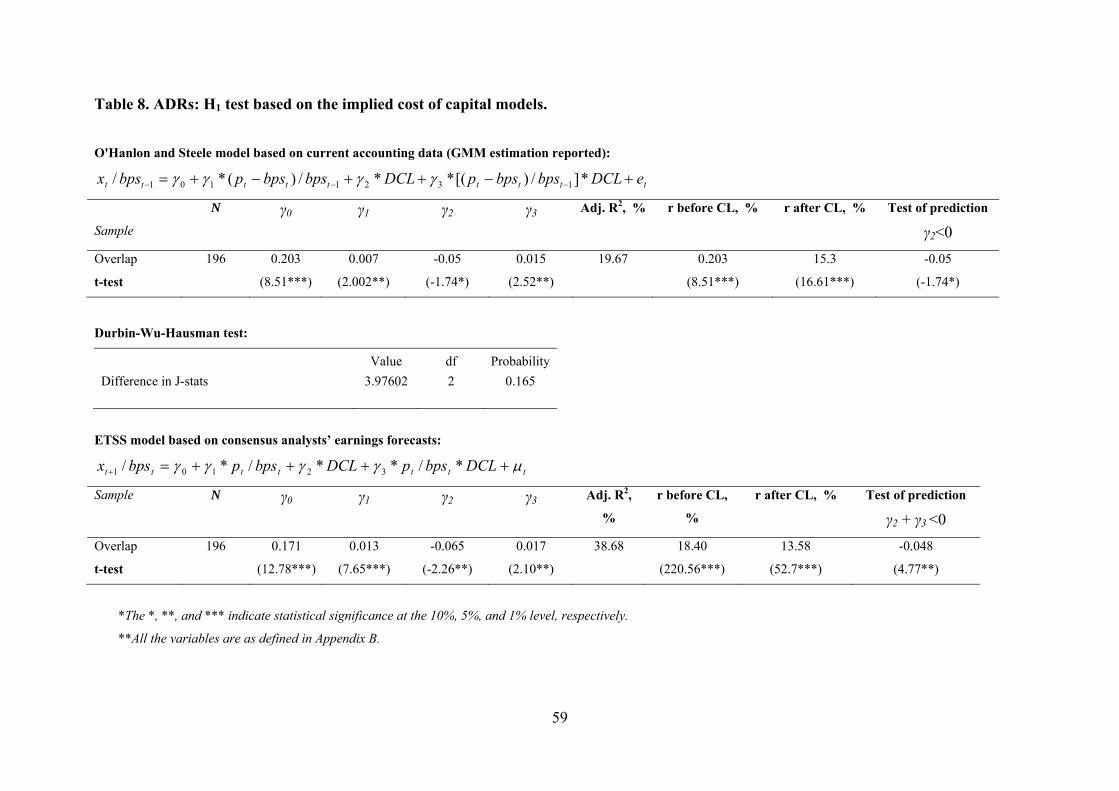
59
Table 8. ADRs: H1 test based on the implied cost of capital models.
O'Hanlon and Steele model based on current accounting data (GMM estimation reported):
ttttttttt eDCLbpsbpspDCLbpsbpspbpsx *]/)[(**/)(*/ 1321101
Sample
N γ0 γ1 γ2 γ3 Adj. R2, % r before CL, % r after CL, % Test of prediction
γ2<0
Overlap 196 0.203 0.007 -0.05 0.015 19.67 0.203 15.3 -0.05
t-test (8.51***) (2.002**) (-1.74*) (2.52**) (8.51***) (16.61***) (-1.74*)
Durbin-Wu-Hausman test:
Value df Probability
Difference in J-stats 3.97602 2 0.165
ETSS model based on consensus analysts’ earnings forecasts:
ttttttt DCLbpspDCLbpspbpsx */**/*/ 32101
Sample N γ0 γ1 γ2 γ3 Adj. R2,
%
r before CL,
%
r after CL, % Test of prediction
γ2 + γ3 <0
Overlap 196 0.171 0.013 -0.065 0.017 38.68 18.40 13.58 -0.048
t-test (12.78***) (7.65***) (-2.26**) (2.10**) (220.56***) (52.7***) (4.77**)
*The *, **, and *** indicate statistical significance at the 10%, 5%, and 1% level, respectively.
**All the variables are as defined in Appendix B.
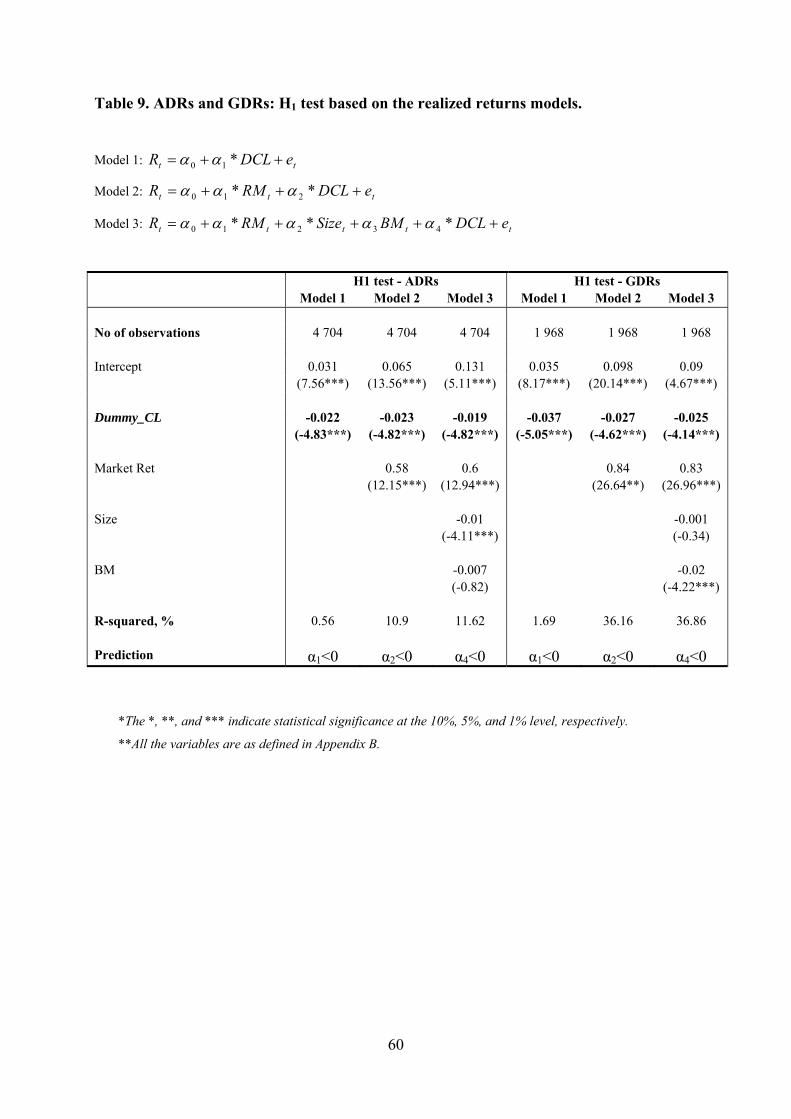
60
Table 9. ADRs and GDRs: H1 test based on the realized returns models.
Model 1: tt eDCLR *10
Model 2: ttt eDCLRMR ** 210
Model 3: ttttt eDCLBMSizeRMR *** 43210
H1 test - ADRs H1 test - GDRs Model 1 Model 2 Model 3 Model 1 Model 2 Model 3 No of observations 4 704 4 704 4 704 1 968 1 968 1 968 Intercept 0.031 0.065 0.131 0.035 0.098 0.09 (7.56***) (13.56***) (5.11***) (8.17***) (20.14***) (4.67***) Dummy_CL -0.022 -0.023 -0.019 -0.037 -0.027 -0.025 (-4.83***) (-4.82***) (-4.82***) (-5.05***) (-4.62***) (-4.14***) Market Ret 0.58 0.6 0.84 0.83 (12.15***) (12.94***) (26.64**) (26.96***) Size -0.01 -0.001 (-4.11***) (-0.34) BM -0.007 -0.02 (-0.82) (-4.22***) R-squared, % 0.56 10.9 11.62 1.69 36.16 36.86 Prediction α1<0 α2<0 α4<0 α1<0 α2<0 α4<0
*The *, **, and *** indicate statistical significance at the 10%, 5%, and 1% level, respectively.
**All the variables are as defined in Appendix B.
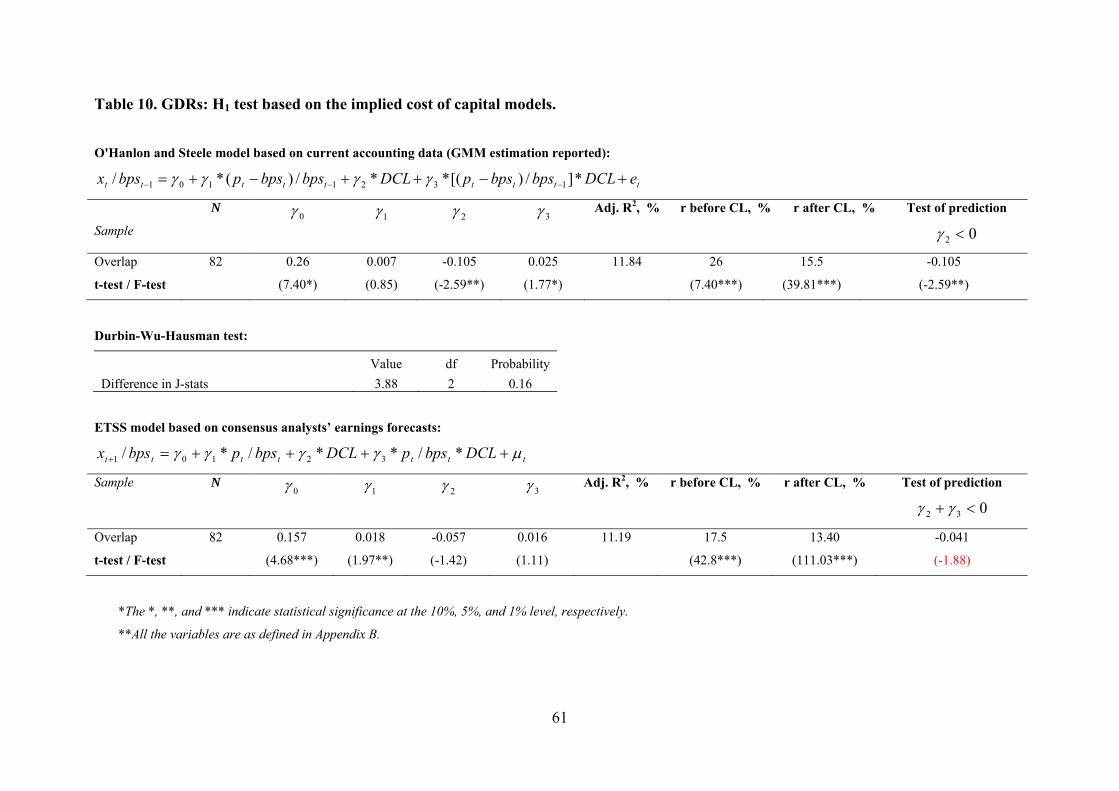
61
Table 10. GDRs: H1 test based on the implied cost of capital models.
O'Hanlon and Steele model based on current accounting data (GMM estimation reported):
ttttttttt eDCLbpsbpspDCLbpsbpspbpsx *]/)[(**/)(*/ 1321101
Sample
N 0 1 2 3 Adj. R2, % r before CL, % r after CL, % Test of prediction
02
Overlap 82 0.26 0.007 -0.105 0.025 11.84 26 15.5 -0.105
t-test / F-test (7.40*) (0.85) (-2.59**) (1.77*) (7.40***) (39.81***) (-2.59**)
Durbin-Wu-Hausman test:
Value df Probability
Difference in J-stats 3.88 2 0.16
ETSS model based on consensus analysts’ earnings forecasts:
ttttttt DCLbpspDCLbpspbpsx */**/*/ 32101
Sample N 0 1 2 3 Adj. R2, % r before CL, % r after CL, % Test of prediction
032
Overlap 82 0.157 0.018 -0.057 0.016 11.19 17.5 13.40 -0.041
t-test / F-test (4.68***) (1.97**) (-1.42) (1.11) (42.8***) (111.03***) (-1.88)
*The *, **, and *** indicate statistical significance at the 10%, 5%, and 1% level, respectively.
**All the variables are as defined in Appendix B.
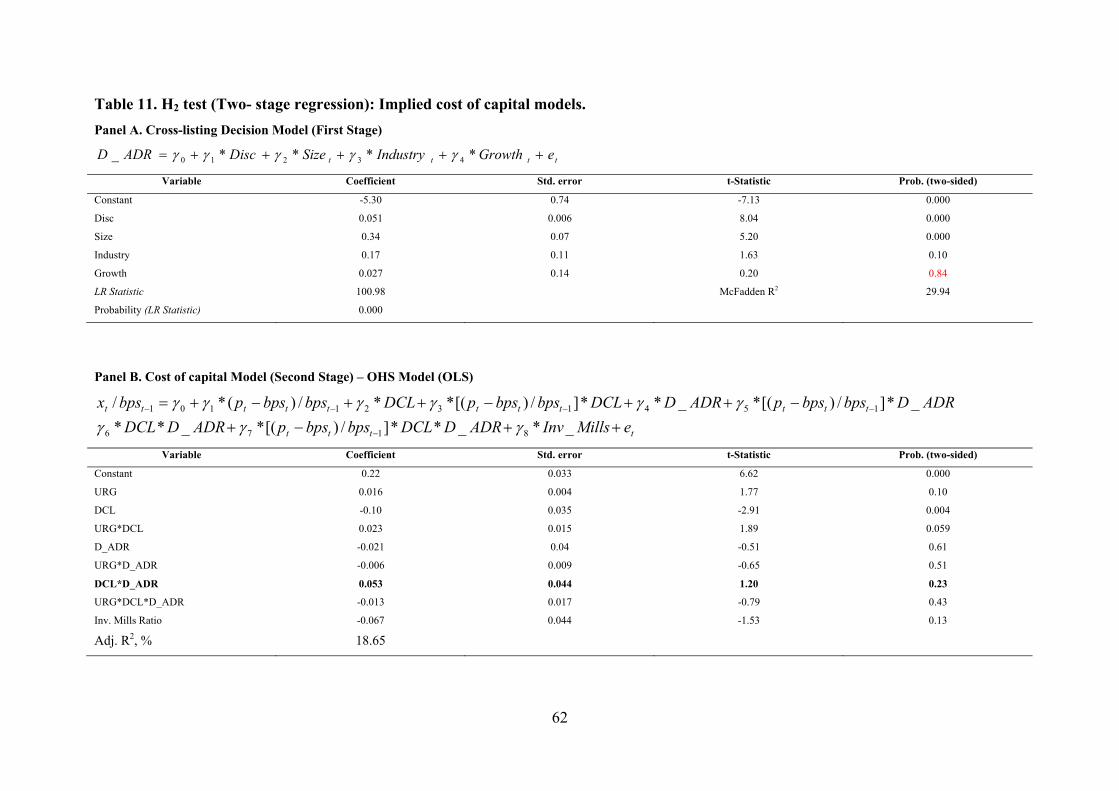
62
Table 11. H2 test (Two- stage regression): Implied cost of capital models.
Panel A. Cross-listing Decision Model (First Stage)
tttt eGrowthIndustrySizeDiscADRD ****_ 43210
Variable Coefficient Std. error t-Statistic Prob. (two-sided)
Constant -5.30 0.74 -7.13 0.000
Disc 0.051 0.006 8.04 0.000
Size 0.34 0.07 5.20 0.000
Industry 0.17 0.11 1.63 0.10
Growth 0.027 0.14 0.20 0.84
LR Statistic 100.98 McFadden R2 29.94
Probability (LR Statistic) 0.000
Panel B. Cost of capital Model (Second Stage) – OHS Model (OLS)
tttt
ttttttttttt
eMillsInvADRDDCLbpsbpspADRDDCL
ADRDbpsbpspADRDDCLbpsbpspDCLbpsbpspbpsx
_*_**]/)[(*_**
_*]/)[(*_**]/)[(**/)(*/
8176
1541321101
Variable Coefficient Std. error t-Statistic Prob. (two-sided)
Constant 0.22 0.033 6.62 0.000
URG 0.016 0.004 1.77 0.10
DCL -0.10 0.035 -2.91 0.004
URG*DCL 0.023 0.015 1.89 0.059
D_ADR -0.021 0.04 -0.51 0.61
URG*D_ADR -0.006 0.009 -0.65 0.51
DCL*D_ADR 0.053 0.044 1.20 0.23
URG*DCL*D_ADR -0.013 0.017 -0.79 0.43
Inv. Mills Ratio -0.067 0.044 -1.53 0.13
Adj. R2, % 18.65
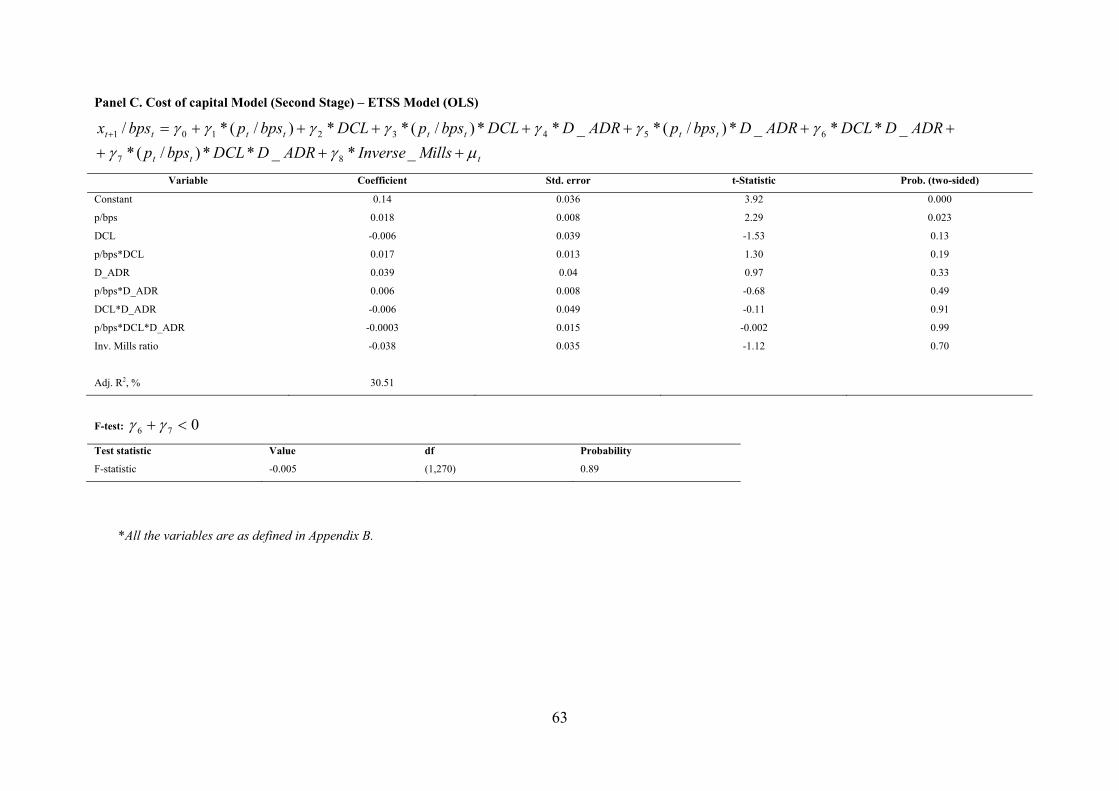
63
Panel C. Cost of capital Model (Second Stage) – ETSS Model (OLS)
ttt
tttttttt
MillsInverseADRDDCLbpsp
ADRDDCLADRDbpspADRDDCLbpspDCLbpspbpsx
_*_**)/(*
_**_*)/(*_**)/(**)/(*/
87
65432101
Variable Coefficient Std. error t-Statistic Prob. (two-sided)
Constant 0.14 0.036 3.92 0.000
p/bps 0.018 0.008 2.29 0.023
DCL -0.006 0.039 -1.53 0.13
p/bps*DCL 0.017 0.013 1.30 0.19
D_ADR 0.039 0.04 0.97 0.33
p/bps*D_ADR 0.006 0.008 -0.68 0.49
DCL*D_ADR -0.006 0.049 -0.11 0.91
p/bps*DCL*D_ADR -0.0003 0.015 -0.002 0.99
Inv. Mills ratio -0.038 0.035 -1.12 0.70
Adj. R2, %
30.51
F-test: 076
Test statistic Value df Probability
F-statistic -0.005 (1,270) 0.89
*All the variables are as defined in Appendix B.
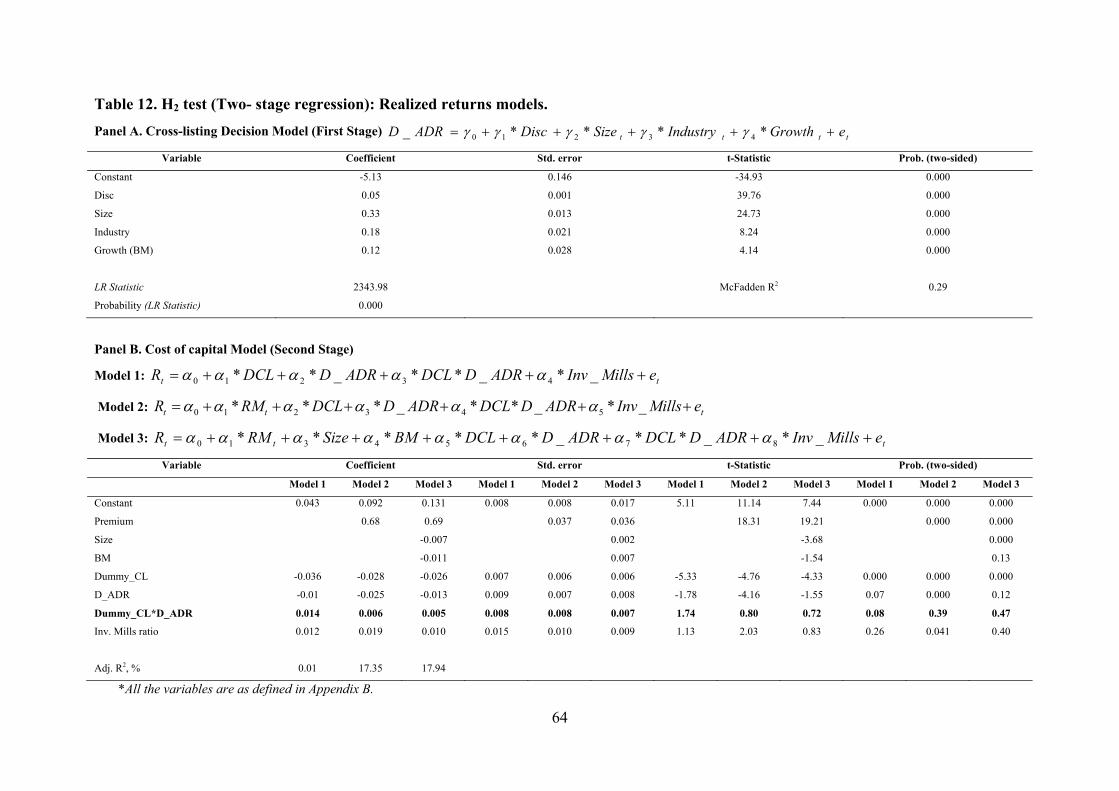
64
Table 12. H2 test (Two- stage regression): Realized returns models.
Panel A. Cross-listing Decision Model (First Stage) tttt eGrowthIndustrySizeDiscADRD ****_ 43210
Variable Coefficient Std. error t-Statistic Prob. (two-sided)
Constant -5.13 0.146 -34.93 0.000
Disc 0.05 0.001 39.76 0.000
Size 0.33 0.013 24.73 0.000
Industry 0.18 0.021 8.24 0.000
Growth (BM) 0.12 0.028 4.14 0.000
LR Statistic
2343.98
McFadden R2
0.29
Probability (LR Statistic) 0.000
Panel B. Cost of capital Model (Second Stage)
Model 1: tt eMillsInvADRDDCLADRDDCLR _*_**_** 43210
Model 2: ttt eMillsInvADRDDCLADRDDCLRMR _*_**_*** 543210
Model 3: ttt eMillsInvADRDDCLADRDDCLBMSizeRMR _*_**_***** 87654310
Variable Coefficient Std. error t-Statistic Prob. (two-sided)
Model 1 Model 2 Model 3 Model 1 Model 2 Model 3 Model 1 Model 2 Model 3 Model 1 Model 2 Model 3
Constant 0.043 0.092 0.131 0.008 0.008 0.017 5.11 11.14 7.44 0.000 0.000 0.000
Premium 0.68 0.69 0.037 0.036 18.31 19.21 0.000 0.000
Size -0.007 0.002 -3.68 0.000
BM -0.011 0.007 -1.54 0.13
Dummy_CL -0.036 -0.028 -0.026 0.007 0.006 0.006 -5.33 -4.76 -4.33 0.000 0.000 0.000
D_ADR -0.01 -0.025 -0.013 0.009 0.007 0.008 -1.78 -4.16 -1.55 0.07 0.000 0.12
Dummy_CL*D_ADR 0.014 0.006 0.005 0.008 0.008 0.007 1.74 0.80 0.72 0.08 0.39 0.47
Inv. Mills ratio 0.012 0.019 0.010 0.015 0.010 0.009 1.13 2.03 0.83 0.26 0.041 0.40
Adj. R2, %
0.01
17.35
17.94
*All the variables are as defined in Appendix B.