Embed Size (px)
Citation preview

“The Impact of Cruise Ship Tourism on Local Economies”
• Thomas J. Murray Virginia Institute of Marine Science
Virginia Sea Grant Marine Extension Program Social Coast Forum
Charleston, S.C. February 11,2016

Cruise Ship Tourism Industry Growth and Local Challenges
• Cruise tourism has been the fastest growing sector of the tourist industry for the past thirty years. Since 1980, the industry has had an average annual passenger growth rate of 8.1% per year.
• This growth is expected to continue into the future. Globally the trend is increasing.
• Carnival Lines represents 40% of the global market its 2015 earnings were up more than one-third from 2014
Thomas J. Murray & Associates, Inc 2

Case Study: Impact of Cruise ship Tourism on Quality of Life in Key west. Identification of the population
Main types of tourism in Key West, by mode of entry 2010 estimates
– 1. Cruise vessels – almost 1 million passengers
– 2. Land and air-based tourists – over 2.5
million visitors

Sampling sites
SITES
A – Cruise ship passenger sampling site
B – Land-based visitor sampling site
C – Air-based visitor sampling site

ECONOMIC IMPACT

GROWTH OF TOURISM INDICATORS IN KEY WEST (1990 = 100)
100
200
300
400
500
600
700
800
900
1990 1992 1994 1996 1998 2000 2002 Year
Cha
nge
Bed Tax Revenues Deplanements Cruise Ship Passengers

How much is spent?
• Cruise Passengers spent on average $32.10 per capita while in Key West.
• Crew members spent on average $65.80 • Cruise Ship Lines spent $14 million on local
purchases.
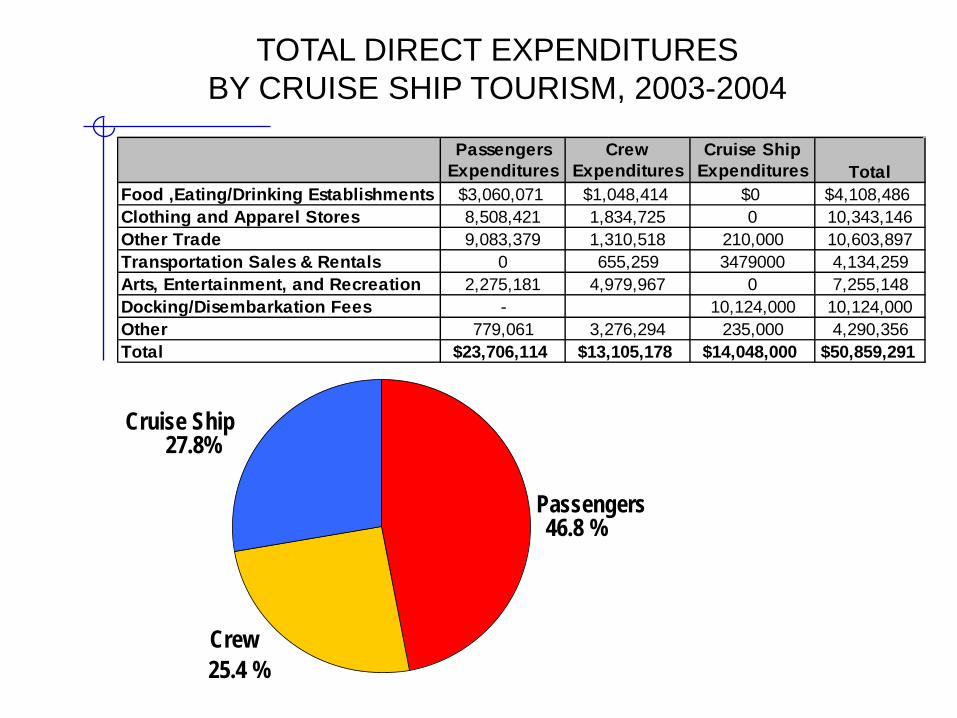
TOTAL DIRECT EXPENDITURES BY CRUISE SHIP TOURISM, 2003-2004
Passengers Expenditures
Crew Expenditures
Cruise Ship Expenditures Total
Food ,Eating/Drinking Establishments $3,060,071 $1,048,414 $0 $4,108,486Clothing and Apparel Stores 8,508,421 1,834,725 0 10,343,146Other Trade 9,083,379 1,310,518 210,000 10,603,897Transportation Sales & Rentals 0 655,259 3479000 4,134,259Arts, Entertainment, and Recreation 2,275,181 4,979,967 0 7,255,148Docking/Disembarkation Fees - 10,124,000 10,124,000Other 779,061 3,276,294 235,000 4,290,356Total $23,706,114 $13,105,178 $14,048,000 $50,859,291
Passengers 46.8 %
Crew
25.4 %
Cruise Ship 27.8%

EXPENDITURES FROM CRUISE SHIP TOURISM BY EXPENDITURE CATEGORY
11%
Clothing S tores 24%
Other Trade
Transportation
Sales & Rentals 14%
20%
9% Eating/Drinking Establishments Other
22%
Disembarkation Fees

ESTIMATED NON-CRUISE SHIP TOURISM EXPENDITURES IN KEY WEST, 2003-04
Sector ExpendituresEating $162,962,551 Drinking 68,576,584Groceries 23,811,464Clothing 24,542,783Other Retail 26,335,119Transportation 2,061,568Lodging 299,409,859Entertainment 28,569,811Business Services 957,907Other 22,119,692Total $659,347,338
Eating estabs 25%
Drinking estabs 10% Lodging
46%
Other Retail 11%
4% 4% Entertainment Other

TOTAL TOURIST EXPENDITURES BY TYPE IN KEY WEST, 2003-04
Eating/Drinking Establishments $4,108,486 $231,539,135 $235,647,621 33.2%Clothing 10,343,146 24,542,783 34,885,929 4.9%Other Retail 10,603,897 50,146,583 60,750,480 8.6%Lodging/Accommodation 0 299,409,859 299,409,859 42.2%Attractions/Transportation 11,389,407 30,631,379 42,020,786 5.9%Docking/Disembarkation Fees 10,124,000 0 10,124,000 1.4%Other 4,290,356 23,077,599 27,367,955 3.9%Total $50,859,291 $659,347,338 $710,206,629 100.0%
Non-Cruise Tourists
Percentage of Total
Cruise Tourists
Total All Tourists

TOTAL EXPENDITURES BY EXPENDITURE CATEGORY
Eating/Drinking Establishments 33%
Lodging 43%
Other Retail 14%
5% Disembarkation Fees 1%
Entertainment 4%
Oth er

Comparing Economic Impact by Visitation Type
• Cruise Ship Tourism was responsible for 50% of the visitations to Key West in the year of the Study.
• It provided 7.8 % of the economic impact of tourism to the community that year.

DIRECT AND INDIRECT IMPACTS OF TOURISM AND CRUISE SHIP EXPENDITURES KEY WEST
Direct Indirect Total
All tourism
Output $710,206,629 $423,388,768 $1,133,595,397
Employment 8,060 4,134 12,194
Cruise Ship Tourism
Output $50,859,291 $30,319,701 $81,178,992
Employment 577 296 873

FISCAL IMPACT

FISCAL BALANCE FOR TOURISM AND CRUISE SHIP TOURISM ACTIVITY
Revenues $5,072,746 $15,072,553 $21,745,855
Expenditures $3,245,936 $14,728,343 $14,728,343
Fiscal Balance $1,826,810 $344,210 $7,017,512 sca a a ce Ratio 1.56 1.02 1.48
Cruise Ship
TourismAll
Tourism
Adjusted All
Tourism

PUBLIC PERCEPTION

RESIDENTIAL DISTRICTS

0.0%
5.0%
10.0%
15.0%
20.0%
25.0%
30.0%
35.0%
1 2 3 4 5
Rating
Perc
enta
ge
Tourism
Cruise ShipTourism
OVERALL EFFECT ON QUALITY OF LIFE OF TOURISM AND CRUISE SHIP TOURISM
1 = strongly negative 5 = strongly positive

PROPER LEVEL OF TOURISM AND CRUISE SHIP TOURISM
0.0%
5.0%
10.0%
15.0%
20.0%
25.0%
30.0%
35.0%
40.0%
45.0%
1 2 3 4 5 Rating
Perc
enta
ge
Tourism
Cruise Ship Tourism
1 = much less 5 = much more

TO WHAT EXTENT SHOULD CITY BE INVOLVED IN REGULATING TOURISM AND CRUISE SHIP TOURISM?
0.0%
5.0%
10.0%
15.0%
20.0%
25.0%
30.0%
35.0%
40.0%
1 2 3 4 5
Rating
Perc
enta
ge
Tourism
Cruise Ship Tourism
1 = much less 5 = much more

RATING TO MANAGEMENT STRATEGIES
0 0.5 1 1.5 2 2.5 3 3.5 4 4.5 5
Limitations on Port Calls
Imposition of Black Out Days
Increasing the Minimum Length of Stay
Increasing Tariffs/ Disembarkation Fees
Use of Best Management Practices
Man
agem
ent S
trat
egy
Rating

BUSINESS DISTRICTS

PROPER LEVEL OF TOURISM/CRUISE SHIP ACTIVITY
0.0%
5.0%
10.0%
15.0%
20.0%
25.0%
30.0%
35.0%
1 2 3 4 5
Rating
Perc
enta
ge
Tourism
Cruise Ship Tourism
1 = much less 5 = much more
than current levels

TO WHAT EXTENT SHOULD THE CITY BE INVOLVED IN REGULATING TOURISM/CRUISESHIP ACTIVITY?
0.00%
5.00%
10.00%
15.00%
20.00%
25.00%
30.00%
35.00%
40.00%
1 2 3 4 5
Rating
Perc
enta
ge
Tourism
Cruise Ship Tourism
1 = much less 5 = much more

RATINGS ON MANAGEMENT STRATEGIES
Thomas J. Murray & Associates, Inc 26
0 1 2 3 4 5
Limitations on Port Calls
Imposition of Black Out Days
Increasing the Min. Length of Stay
Increasing Tariffs/ Disembarkation Fees
Use of Best Management Practices
Man
agem
ent S
trat
egy
Rating

BMPS • Require ships to suspend on-board entertainment and activities while in port to • encourage more people to leave ship. • § Require cruise lines to use local agents for cruise ship organized shore excursions and • activities. A maximum service charge for museums, tours, and other local activities sold • on ship would be of benefit to area merchants. • § Require restocking of supplies from local companies, although Key West is often an • early port of call so that restocking requirements are typically low. • § Develop more sightseeing attractions and entertainment activities for cruise passengers • and development of a calendar of cruise-ship visits for distribution to all taxi drivers, • hoteliers, and interested parties. • § Focus upon targeted promotion aimed at improving and expanding the proportion of • cruise passengers that return to the destination as overnight guests. The cruise passenger • surveys clearly indicated the opinion that improved tourism literature and guides to the • destination for cruise passengers was needed. Most cruise ship passengers rated Key • West very highly as a destination, 68.3% of cruise ship visitors stated that they would • return for a longer, non-cruise ship trip • § Attract more upscale, luxury cruise lines, encouraging longer shore stays for these ships • with higher-income passengers.

How can cruise tourism continue to Grow?
• Trade press suggests the rate of growth in cruise tourism is slowing in the long established regions such as the Caribbean.
• Growth is underway and targeted to increase in the Orient.
• Carnival reportedly plans to increase its fleet of cruise ships in China from 4 to 6 this year
• Mega Cruise ships are being designed for that market. RCL Quantum of the Seas can carry 4,180 passengers and is based in Shanghai.

Field session results • A total of 1,822 surveys completed with Key
West tourists – 919 cruise ship passenger surveys completed – 903 general visitor surveys completed
• NOTE: even if summer and winter populations
are considered as separate populations, a significant (95% confidence level and +/- 5% confidence interval) random sample was obtained for both cruise ship passengers and general visitors for EACH period – Sample total for each period for each visitor type > 384.2 samples