Embed Size (px)
Citation preview

sustainability
Article
The Impact of CSR and Financial Distress onFinancial Performance—Evidence from ChineseListed Companies of the Manufacturing Industry
Liu Wu 1, Zhen Shao 1,2,3,*, Changhui Yang 1,2,3, Tao Ding 1 and Wan Zhang 4
1 School of Management, Hefei University of Technology, Hefei 230009, China;[email protected] (L.W.); [email protected] (C.Y.); [email protected] (T.D.)
2 Key Laboratory of Process Optimization and Intelligent Decision-making, Hefei University of Technology,Ministry of Education, Hefei 230009, China
3 Ministry of Education Engineering Research Center for Intelligent Decision-Making and Information SystemTechnologies, Hefei 230009, China
4 School of Humanities and Social Science, University of Science and Technology of China,Hefei 230026, China; [email protected]
* Correspondence: [email protected]; Tel./Fax: +86-055-162-901-501
Received: 28 July 2020; Accepted: 17 August 2020; Published: 21 August 2020�����������������
Abstract: This paper explores the impact of corporate social responsibility (CSR) and financialdistress on corporate financial performance (CFP) in Chinese listed companies of the manufacturingindustry. Covering a total of 1445 manufacturing observations from 2013 to 2018 by matching theChina Stock Market & Accounting Research Database (CSMAR) and Ranking CSR Ratings (RKS)database and regression models, we find that CSR has a significant positive impact on CFP, and therelationship is more pronounced for firms that are more stable. Further, the win-win relationshipof CSR and CFP is also stronger in state-owned enterprises (SOEs). These empirical results suggestthat enterprises should actively embrace CSR in response to the call of the country. At the same time,corporate stability should be increased to enhance the role of CSR in promoting CFP. We providea quantitative analysis of the CSR, CFP, and financial distress of listed firms, and help to alleviatemanagers’ concern of CSR fulfillment and risk control.
Keywords: corporate social responsibility; financial performance; financial distress; ownership
1. Introduction
In recent decades, social responsibility has become a key issue that cannot be ignored, but cannotget enough attention from developing countries [1]. As the main supplier of global raw materials andcommodities and the hub of the global supply chain, the fulfillment of corporate social responsibility(CSR) in China’s manufacturing industry is a valuable research issue. Would corporate financialperformance (CFP) be hurt or promoted if firms pursue CSR activities? By all appearances, this questionprovides significant implications when making CSR decisions for managers. In order to rationalizeCSR on reasonable economic grounds and alleviate the worries of managers, the relationship betweenthe two is a hotly debated topic in research [2].
If the high cost of corporate social responsibility cannot bring economic benefits to an enterprise,then any amount of appeal is just moral preaching [3]. The conclusion is still controversial amongthe classical theoretical and empirical research when it comes to the link between social responsibilityand CFP. Stakeholder theory [4] believes that stakeholders include corporate shareholders, creditors,and even government departments and environmentalist pressure groups, etc. An increase in socialspending will improve stakeholder relationships, which is conducive to reducing the social costs of
Sustainability 2020, 12, 6799; doi:10.3390/su12176799 www.mdpi.com/journal/sustainability
Sustainability 2020, 12, 6799 2 of 19
firms, leading to an increase in the net financial worth [5,6]. Similarly, signaling theory providesevidence that the transmission of CSR signals can generate positive information beneficial to theenterprise and improve the reputation and competitiveness of the enterprise [7], thus increasing thecompany’s goodwill and the economic return of the enterprise [8,9]. On the contrary, the agency theoryand shareholder theory has introduced an opposite view. The social responsibility of a company willimpose agency costs on shareholders. Hence, the focus on CSR may hurt corporate performance [10].In empirical studies conducted over the past few decades, half or more have confirmed irrelevant, weak,or even negative correlations [11]. As a hotly debated topic, there are no insights about manufacturingin China.
The condition of financial distress is closely related to the fulfillment of CSR. When an enterprise isin financial distress, its priority is to relieve the financial strain and interests of shareholders, rather thanto benefit the society [12]. Previous research have shown that experienced managers avoid gettinga company into financial distress, and low-risk companies outperform firms with high risk [13,14].Firms with a more unstable financial structure are more likely to lose their market share, especiallyduring industry downturns. While there are a few studies combining CSR, CFP, and financial distressin the context of Chinese manufacturing enterprises, our second main research question therefore isthe relationship between financial distress and CFP and whether the relationship between CSR andCFP is more pronounced for companies that are more stable.
This paper aims to explore the connection of CSR, CFP, and financial distress. To do so, we compiledata from CSMAR and Ranking CSR Ratings (RKS). RKS is an authoritative third-party rating agencyfor corporate social responsibility in China, dedicated to providing objective and scientific corporateresponsibility rating information for responsible investors (SRI), responsible consumers, and thepublic. China’s listed companies of manufacturing are a good laboratory to test the relationship.The manufacturing industry is the principal part of the national economy in China. As part ofthe pillar industry, the listed companies in manufacturing are becoming the center of CSR, so itis imperative to evaluate the financial impact of CSR [15]. Figure 1 illustrates the proportion ofmanufacturing output in GDP, indicating the pivotal role of manufacturing in the national economy.Hence, the motivation of this paper is to explore the connection between the CSR and CFP of listedcompanies in Chinese manufacturing.
Sustainability 2020, 12, x FOR PEER REVIEW 2 of 20
reducing the social costs of firms, leading to an increase in the net financial worth [5,6]. Similarly, signaling theory provides evidence that the transmission of CSR signals can generate positive information beneficial to the enterprise and improve the reputation and competitiveness of the enterprise [7], thus increasing the company’s goodwill and the economic return of the enterprise [8,9]. On the contrary, the agency theory and shareholder theory has introduced an opposite view. The social responsibility of a company will impose agency costs on shareholders. Hence, the focus on CSR may hurt corporate performance [10]. In empirical studies conducted over the past few decades, half or more have confirmed irrelevant, weak, or even negative correlations [11]. As a hotly debated topic, there are no insights about manufacturing in China.
The condition of financial distress is closely related to the fulfillment of CSR. When an enterprise is in financial distress, its priority is to relieve the financial strain and interests of shareholders, rather than to benefit the society [12]. Previous research have shown that experienced managers avoid getting a company into financial distress, and low-risk companies outperform firms with high risk [13,14]. Firms with a more unstable financial structure are more likely to lose their market share, especially during industry downturns. While there are a few studies combining CSR, CFP, and financial distress in the context of Chinese manufacturing enterprises, our second main research question therefore is the relationship between financial distress and CFP and whether the relationship between CSR and CFP is more pronounced for companies that are more stable.
This paper aims to explore the connection of CSR, CFP, and financial distress. To do so, we compile data from CSMAR and Ranking CSR Ratings (RKS). RKS is an authoritative third-party rating agency for corporate social responsibility in China, dedicated to providing objective and scientific corporate responsibility rating information for responsible investors (SRI), responsible consumers, and the public. China’s listed companies of manufacturing are a good laboratory to test the relationship. The manufacturing industry is the principal part of the national economy in China. As part of the pillar industry, the listed companies in manufacturing are becoming the center of CSR, so it is imperative to evaluate the financial impact of CSR [15]. Figure 1 illustrates the proportion of manufacturing output in GDP, indicating the pivotal role of manufacturing in the national economy. Hence, the motivation of this paper is to explore the connection between the CSR and CFP of listed companies in Chinese manufacturing.
Figure 1. Proportion of manufacturing output in GDP from 2014 to 2018 in China. Figure 1. Proportion of manufacturing output in GDP from 2014 to 2018 in China.
Sustainability 2020, 12, 6799 3 of 19
The empirical results contribute the following aspects. Much of the previous research [16,17]focuses on the association between CSR performance and CFP. This paper surveys the major nationaleconomy industry in China, and also focus on the mediating role of financial distress. In addition,we examined the differences between state-owned enterprises (SOEs) and non-SOEs and made someempirical contributions to the implementation of CSR in China’s context. Finally, when we conducteda robustness test, with the help of a natural exogenous event, one-to-one propensity score matching(PSM) was used to explore whether there is a discrepancy in the relationship before and after thepolicy was introduced—that is, the guidance on state-owned enterprises (SOEs) to better fulfill theirsocial responsibilities issued by the State-Owned Assets Supervision and Administration Commission(SASAC), a landmark policy to promote CSR performance.
The existing literature concerning CSR in emerging markets usually focuses on entire A-sharelisted companies to explore its relationship with corporate performance. We focus on the manufacturingindustry and incorporate financial distress into the study of CSR and CFP. In detail, after studying theeffect of CSR and financial distress on financial performance, this paper explores the moderating effectof financial distress on CSR and CFP. In this way, managers can realize the importance of controllingfinancial risks while fulfilling social responsibilities. Besides, we have fully taken into account theownership in our hypothesis, and conducted group tests on all relationships. To be specific, we divideall the sample enterprises into SOEs and non-SOEs, and conduct a group test between CSR, financialdistress, and CFP, which is not considered fully in the previous literature.
The following content is arranged as follows: the next part is a review of the related literature,Sections 3–5 are the empirical research process and additional test, while the conclusion is presented inthe final part in this paper.
2. Literature Reviews and Hypotheses
2.1. CSR in China
Since the reform in 1979, China’s economy has experienced remarkable developments in the pastfew decades. However, the excessive pursuit of profits causes some social responsibility problems—suchas with the environment, employment relations, consumer rights, etc.—and inevitably increases the costof enterprises [18]. In the early 21st century, relevant departments gradually realized the importance ofCSR and called on enterprises to consider the interests of stakeholders in the course of business. In theconstruction of the social responsibility system, Chinese entrepreneurs have carried out excellent socialresponsibility practices and have made outstanding achievements [19].
Evidence shows that CSR is undergoing a rapidly growing salience in China, albeit from a weakfoundation, and is increasingly becoming a management issue, with the importance of the governmentand entrepreneurs attached to it [20]. In 2006, the new company law expects enterprises to participatein social responsibility. Then came China’s first social responsibility report from the state grid. SASACissued special instructions for SOEs to fulfill their social responsibilities in 2008. In 2011, SASAC andthe Chinese Academy of Social Sciences jointly issued the Guidelines for the Preparation of ChineseCorporate Social Responsibility Report. It seems that the policy indicates that state-owned enterprisesshould assume more social responsibility, but some scholars think that state-owned enterprises aremore reluctant to undertake the construction of corporate social responsibility [21].
At the same time, CSR rating agencies have emerged, among which one of the most professionalis RKS. RKS is an authoritative third-party rating agency for CSR in China. It is committedto providing objective and scientific corporate responsibility rating information for responsibleinvestment, consumers, and the public [22]. In developed countries, in view of the early start of CSR,the definition and measurement of CSR are more complete. Some studies have defined CSR as a moralbehavior, including social, political, economic, and cultural aspects [23]. According to this definition,a mature social responsibility rating is gradually formed. The Kinder, Lynderberg, Domini Research,and Analytics Inc. (KLD) databases are good examples. Based on an extensive analysis of surveys,
Sustainability 2020, 12, 6799 4 of 19
financial statements, news, academic research, and government reports, KLD has provided CSRinformation to more than 3000 companies, accounting for 98% of the total market capitalization of allpublicly traded companies in the United States [5].
In recent years, many studies have concentrated on the CSR in China, an emerging market,and tried to figure out the social responsibility of Chinese companies in multiple dimensions. This willbe mentioned in detail in the literature review and hypothetical development below.
2.2. Relationship between CSR and CFP
Existing studies have shown that the relationship between CSR and CFP is inconclusive globallyand controversial [24]. Numerous studies show that CSR is significantly positive with a firmvalue [25,26]. Research proves that, although the company is under pressure to allocate scarce resourcesin management, there is a virtuous circle between corporate performance and social performance [27],which also confirms the point of view of the slack resource theory. Slack resource is a good method toresolve conflict when firms face difficulty. Meanwhile, CSR is an excellent way to obtain redundantresources through good social reputation, good employment relationship, etc. Ethical managersrealize the importance of CSR and take advantage of it. When there are conflicts among stakeholders,managers will skillfully adopt CSR to solve the conflicts and maximize the interests of shareholders,thus proving that CSR is conducive to corporate performance [28].
As researchers are developing a more profound understanding of CSR, empirical study showsthat embracing social performance is not only a skillful management strategy in developed countries,but also in developing countries. The company’s historical performance has a significant and positiveimpact on the release of independent CSR reports, and there is a positive correlation between CSRdisclosure and subsequent performance [16]. As for the relationship between the two, the existingliterature is still inconclusive about China’s manufacturing industry. We adopt Chinese listed companiesin the manufacturing industry as our research sample to enrich the literature.
Conversely, some studies have proved the opposite. They believe that, in order to enhance personalreputation, the internal personnel or major shareholders of the company may carry out irrational orexcessive CSR construction, but the cost is borne by the company rather than by themselves [5]. As aresult, the interests of the enterprises will be harmed. More interestingly, while most scholars highlightthe linear relationship, a third find that the link between the two may be not linear but rather a slightlycomplicated nonlinear relation [29]. One of the reasons for these mixed results is the different selectionof variables and limited data in different enterprises and industries. The positive effect is found bymost literature, despite the conflicting conclusions in the literature. Hence, our first hypothesis isthe following:
Hypothesis 1 (H1). CSR is positively related to CFP in China’s listed manufacturing industries.
2.3. Relationship between Financial Distress and CFP
Financial distress is often thought of as poor financial structure and bringing financial risk tofirms [30]. Scholars claim that managers usually have smaller voice in management when the companywith a high leverage, which incurs agency costs and in turn leads managers to be more inclined tomake high-risk decisions [31]. Similarly, empirical results have proved that negative correlation usuallyemerges between poor debt structure (usually manifested as leverage) and corporate performance afterunsuccessful takeovers [32]. The occurrence of the financial crisis has made enterprise managers realizethe importance of the level of financial distress. Companies are vulnerable during financial crises [33].Based on the negative correlation between financial crisis and corporate performance, as an exogenousvariable the financial crisis will amplify this effect [34]. Correspondingly, the literature further provesthat there is a more significant negative correlation in the relationship after the crisis than before [35].
In recent research, many scholars have found that CSR affects corporate ratings, which in turnaffect corporate debt costs and financing costs [36,37]. Specifically, CSR raises the ranking of enterprises,
Sustainability 2020, 12, 6799 5 of 19
and the improvement of reputation brings a reduction in the financing barriers, which is conducive tocorporate performance.
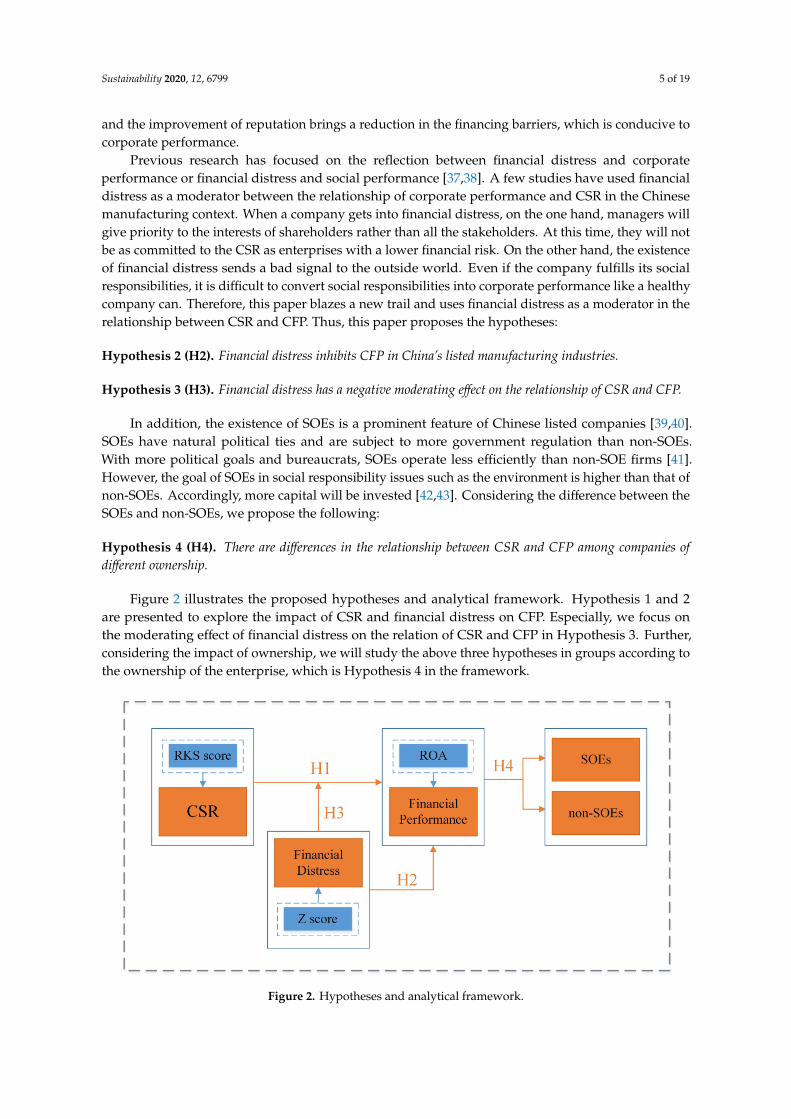
Previous research has focused on the reflection between financial distress and corporateperformance or financial distress and social performance [37,38]. A few studies have used financialdistress as a moderator between the relationship of corporate performance and CSR in the Chinesemanufacturing context. When a company gets into financial distress, on the one hand, managers willgive priority to the interests of shareholders rather than all the stakeholders. At this time, they will notbe as committed to the CSR as enterprises with a lower financial risk. On the other hand, the existenceof financial distress sends a bad signal to the outside world. Even if the company fulfills its socialresponsibilities, it is difficult to convert social responsibilities into corporate performance like a healthycompany can. Therefore, this paper blazes a new trail and uses financial distress as a moderator in therelationship between CSR and CFP. Thus, this paper proposes the hypotheses:
Hypothesis 2 (H2). Financial distress inhibits CFP in China’s listed manufacturing industries.
Hypothesis 3 (H3). Financial distress has a negative moderating effect on the relationship of CSR and CFP.
In addition, the existence of SOEs is a prominent feature of Chinese listed companies [39,40].SOEs have natural political ties and are subject to more government regulation than non-SOEs.With more political goals and bureaucrats, SOEs operate less efficiently than non-SOE firms [41].However, the goal of SOEs in social responsibility issues such as the environment is higher than that ofnon-SOEs. Accordingly, more capital will be invested [42,43]. Considering the difference between theSOEs and non-SOEs, we propose the following:
Hypothesis 4 (H4). There are differences in the relationship between CSR and CFP among companies ofdifferent ownership.
Figure 2 illustrates the proposed hypotheses and analytical framework. Hypothesis 1 and 2are presented to explore the impact of CSR and financial distress on CFP. Especially, we focus onthe moderating effect of financial distress on the relation of CSR and CFP in Hypothesis 3. Further,considering the impact of ownership, we will study the above three hypotheses in groups according tothe ownership of the enterprise, which is Hypothesis 4 in the framework.
Sustainability 2020, 12, x FOR PEER REVIEW 5 of 20
Previous research has focused on the reflection between financial distress and corporate performance or financial distress and social performance [37,38]. A few studies have used financial distress as a moderator between the relationship of corporate performance and CSR in the Chinese manufacturing context. When a company gets into financial distress, on the one hand, managers will give priority to the interests of shareholders rather than all the stakeholders. At this time, they will not be as committed to the CSR as enterprises with a lower financial risk. On the other hand, the existence of financial distress sends a bad signal to the outside world. Even if the company fulfills its social responsibilities, it is difficult to convert social responsibilities into corporate performance like a healthy company can. Therefore, this paper blazes a new trail and uses financial distress as a moderator in the relationship between CSR and CFP. Thus, this paper proposes the hypotheses:
Hypothesis 2 (H2). Financial distress inhibits CFP in China’s listed manufacturing industries.
Hypothesis 3 (H3). Financial distress has a negative moderating effect on the relationship of CSR and CFP.
In addition, the existence of SOEs is a prominent feature of Chinese listed companies [39,40]. SOEs have natural political ties and are subject to more government regulation than non-SOEs. With more political goals and bureaucrats, SOEs operate less efficiently than non-SOE firms [41]. However, the goal of SOEs in social responsibility issues such as the environment is higher than that of non-SOEs. Accordingly, more capital will be invested [42,43]. Considering the difference between the SOEs and non-SOEs, we propose the following:
Hypothesis 4 (H4). There are differences in the relationship between CSR and CFP among companies of different ownership.
Figure 2 illustrates the proposed hypotheses and analytical framework. Hypothesis 1 and 2 are presented to explore the impact of CSR and financial distress on CFP. Especially, we focus on the moderating effect of financial distress on the relation of CSR and CFP in Hypothesis 3. Further, considering the impact of ownership, we will study the above three hypotheses in groups according to the ownership of the enterprise, which is Hypothesis 4 in the framework.
Figure 2. Hypotheses and analytical framework.
3. Measurement of Variance and Model Construction
3.1. Measurement of CSR
In China, the measurement of CSR is a complex issue. For the United States and European countries, the Dominican 400 Social Index database is widely used when referring to CSR. The
Figure 2. Hypotheses and analytical framework.
Sustainability 2020, 12, 6799 6 of 19
3. Measurement of Variance and Model Construction
3.1. Measurement of CSR
In China, the measurement of CSR is a complex issue. For the United States and European countries,the Dominican 400 Social Index database is widely used when referring to CSR. The Dominican 400Social Index is the first index in the United States based on social and environmental issues. The Kinder,Lydenberg, and Domini (KLD) database was founded in 1990 and began to use this index. The databasewas widely adopted by scholars for its professionalism [44,45]. Therefore, scholars who have studiedChinese CSR for a long time could only measure CSR through the content scoring method based on theGlobal Reporting Initiative (GRI) [46], until the emergence of the RKS database [20,47]. It focuses onthe corporate governance, environmental and social issues and covers the 15 first-level indicators suchas strategy, stakeholders, fair operation and the 63 secondary indicators of its subordinates. Therefore,under the existing conditions, we chose the RKS scores as our research basis.
3.2. Measurement of CFP
Compared to CSR, CFP is more consistent and easier to measure. Based on previous studies,the existing literature mainly adopts two methods to measure CFP. One is to adopt accounting indicators;the most common indicator is Return on Assets (ROA) [48,49] or Return on Equity (ROE) [50]. Another isto use market indicators, such as Tobin’s Q or the market shares [51]. This paper chooses ROA asthe proxy CFP. ROA is an indicator to measure how much net profit is created per unit of assets.It organically combines the relevant information in the balance sheet and income statement, and is aconcentrated reflection of the ability of an enterprise to use all its funds to obtain profit. Therefore,the paper uses ROA to measure CFP, and the data on ROA is more complete in the CSMAR databasethan other indicators.
ROA =Net Pro f it
Total Asset Balance(1)
3.3. Measurement of Financial Distress
Regarding the measurement of financial distress, the current literature mainly uses the financialindex method. Among the representative financial indicator methods, the typical way is the Z scoreproposed by Altman in 1968, which is widely used in the research of financial distress and its prediction.Initially, Altman selected 33 bankrupt and excellent companies as a sample of manufacturing companies.Relevant data in the balance sheet and income statement of the sample companies were collected,and the predicted bankrupt companies from 22 variables by sorting were selected. Finally, five usefulvariables were selected to establish the Z score. In this equation, different weights to five financialindicators were assigned to produce the Z score, which is:
Z = 0.012X1 + 0.014X2 + 0.033X3 + 0.006X4 + 0.999X5 (2)
Among them, X1 represents the working capital/total assets, X2 equals the retained earnings/totalassets, X3 is the profit before interest and tax/total assets, X4 represents the total market value of commonstock and the preferred stock/total book value of liabilities, and X5 is the total sales revenue/totalassets. The model is a comprehensive reflection of the financial situation of an enterprise. Therefore,the Altman Z score is adopted to measure financial distress in order to obtain objective conclusions.In particular, a high Z score means that the enterprise is less likely to face financial distress, so thefinancial risk is lower.
3.4. Model Construction
In our model, in addition to the variables mentioned above, there are other variables should beincluded as control variables. Following previous studies, we chose these variables in our estimation
Sustainability 2020, 12, 6799 7 of 19
equation, including: (1) Leverage, which is equal to the asset liability. It is used to measure the abilityof a company to operate with the funds provided by creditors and to reflect the degree of securityof loans made by creditors. Research have proved that leverage is positively related to CFP [52].(2) Growth. This refers to the growth range of the operating revenue in the current period comparedwith the previous period. The larger the index value is, the stronger the profitability of the enterpriseis. In general, the higher the growth rate, the more promising the company’s development prospectsare [53]. Meanwhile, it affects the investor’s willingness to invest. (3) CR (Current Ratio), measured asthe current assets divided by the current liabilities. This is used to measure the ability of an enterprise’scurrent assets to be converted into cash and used to repay liabilities before short-term debts mature.Generally speaking, a high ratio means a stronger liquidity of the enterprise assets, which also meansthe rationality of the enterprise financial structure. However, if the index is too large, it also means thatthe company has not balanced the financial leverage well, which reduces the efficiency of the use offunds. (4) CASH (Cash Ratio). Similar to CR, CASH can affects solvency of the enterprise. The cashratio measures only the most liquid items of all assets relative to current liabilities, so it is the mostconservative measure of solvency relative to current ratios and quick ratios. (5) Slack, which is equalto monetary capital divided by total assets, and represents the redundant resources of the enterprise.Based on agency theory and organization theory, the impact of redundant resources on corporateperformance is a U-shaped curve. Table 1 illustrates all the variables in our model.
Table 1. Definitions of all the variables.
Definition
Dependent variable ROA Return on assets.
Independent variable CSR Corporate social responsibility.Z Financial distress.
Control variables
Lev Asset-liability ratio.Growth Operating revenue growth rate.
CR Current ratio.CASH Cash ratio.
SLACK Redundant resources.
To test Hypotheses 1 and 2, the following two quadratic regressions are constructed:
ROAi,t = α0 + α1CSRi,t + α2Levi,t + α3Growthi,t + α4CRi,t + α5Cashi,t + α6Slacki,t +ωi,t (3)
ROAi,t = γ0 + γ1Zi,t + γ2Levi,t + γ3Growthi,t + γ4CRi,t + γ5Cashi,t + γ6Slacki,t +ωi,t (4)
where, for firm i and year t, ROA is the dependent variable and represents the CFP in all regressionsin this paper. As independent variables, CSR is the rating score from the RKS database and Z is theAltman score in Equations (3) and (4), respectively. The other are a set of control variables which havebeen mentioned above; ω is the error term.
Similarity, to verify H3, the paper constructs the third regression:
ROAi,t= θ0 + θ1CSRi,t + θ2Zi,t ∗CSRi,t + θ3Levi,t + θ4Growthi,t + θ5CRi,t + θ6Cashi,t + θ7Slacki,t
+ωi,t(5)
In Equation (5), an interaction term is added to explore the moderating effect of financial distresson the CSR–CFP relation. In this part, if the interaction terms’ coefficients are significant, H3 willbe confirmed. Furthermore, the sign of coefficients will prove the direction of the effect. In order toexplore H4, we do not perform a special model, but divide all the samples into two groups of SOEsand non-SOEs. The three regression equations above are tested separately for SOEs and non-SOEs.The regression results will be presented in Section 5.
Sustainability 2020, 12, 6799 8 of 19
4. Sample and Data
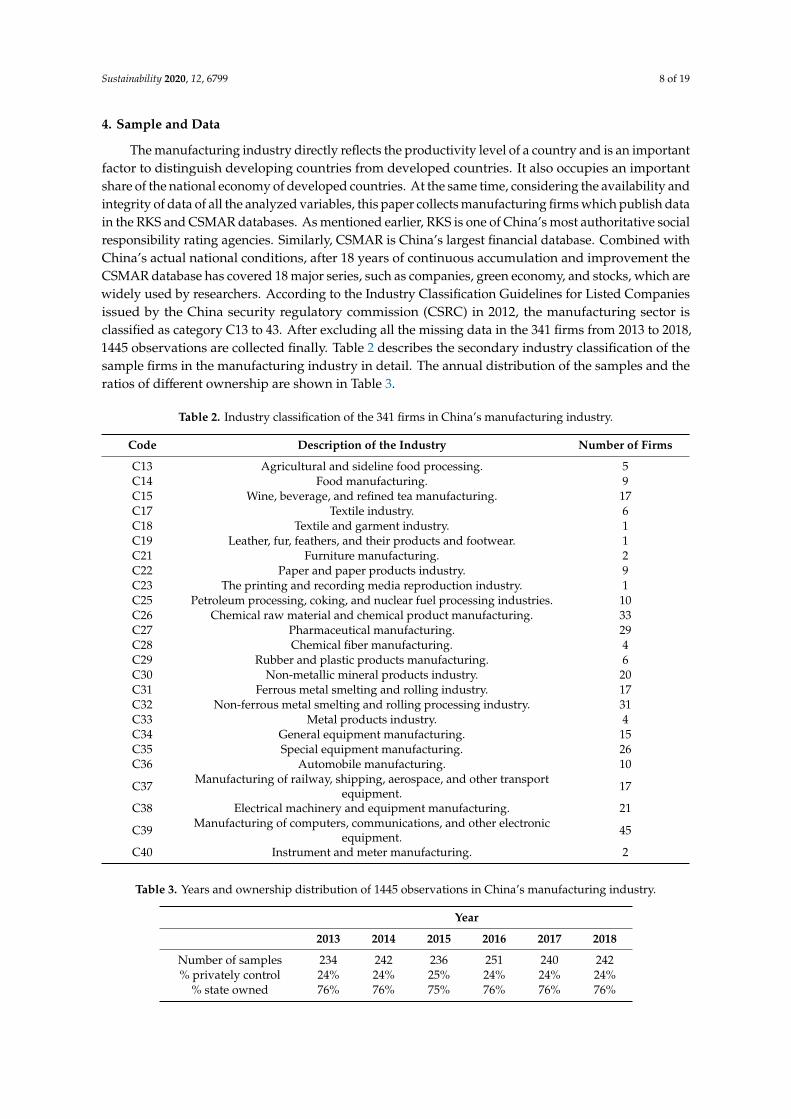
The manufacturing industry directly reflects the productivity level of a country and is an importantfactor to distinguish developing countries from developed countries. It also occupies an importantshare of the national economy of developed countries. At the same time, considering the availability andintegrity of data of all the analyzed variables, this paper collects manufacturing firms which publish datain the RKS and CSMAR databases. As mentioned earlier, RKS is one of China’s most authoritative socialresponsibility rating agencies. Similarly, CSMAR is China’s largest financial database. Combined withChina’s actual national conditions, after 18 years of continuous accumulation and improvement theCSMAR database has covered 18 major series, such as companies, green economy, and stocks, which arewidely used by researchers. According to the Industry Classification Guidelines for Listed Companiesissued by the China security regulatory commission (CSRC) in 2012, the manufacturing sector isclassified as category C13 to 43. After excluding all the missing data in the 341 firms from 2013 to 2018,1445 observations are collected finally. Table 2 describes the secondary industry classification of thesample firms in the manufacturing industry in detail. The annual distribution of the samples and theratios of different ownership are shown in Table 3.
Table 2. Industry classification of the 341 firms in China’s manufacturing industry.
Code Description of the Industry Number of Firms
C13 Agricultural and sideline food processing. 5C14 Food manufacturing. 9C15 Wine, beverage, and refined tea manufacturing. 17C17 Textile industry. 6C18 Textile and garment industry. 1C19 Leather, fur, feathers, and their products and footwear. 1C21 Furniture manufacturing. 2C22 Paper and paper products industry. 9C23 The printing and recording media reproduction industry. 1C25 Petroleum processing, coking, and nuclear fuel processing industries. 10C26 Chemical raw material and chemical product manufacturing. 33C27 Pharmaceutical manufacturing. 29C28 Chemical fiber manufacturing. 4C29 Rubber and plastic products manufacturing. 6C30 Non-metallic mineral products industry. 20C31 Ferrous metal smelting and rolling industry. 17C32 Non-ferrous metal smelting and rolling processing industry. 31C33 Metal products industry. 4C34 General equipment manufacturing. 15C35 Special equipment manufacturing. 26C36 Automobile manufacturing. 10
C37 Manufacturing of railway, shipping, aerospace, and other transportequipment. 17
C38 Electrical machinery and equipment manufacturing. 21
C39 Manufacturing of computers, communications, and other electronicequipment. 45
C40 Instrument and meter manufacturing. 2
Table 3. Years and ownership distribution of 1445 observations in China’s manufacturing industry.
Year
2013 2014 2015 2016 2017 2018
Number of samples 234 242 236 251 240 242% privately control 24% 24% 25% 24% 24% 24%
% state owned 76% 76% 75% 76% 76% 76%
Sustainability 2020, 12, 6799 9 of 19
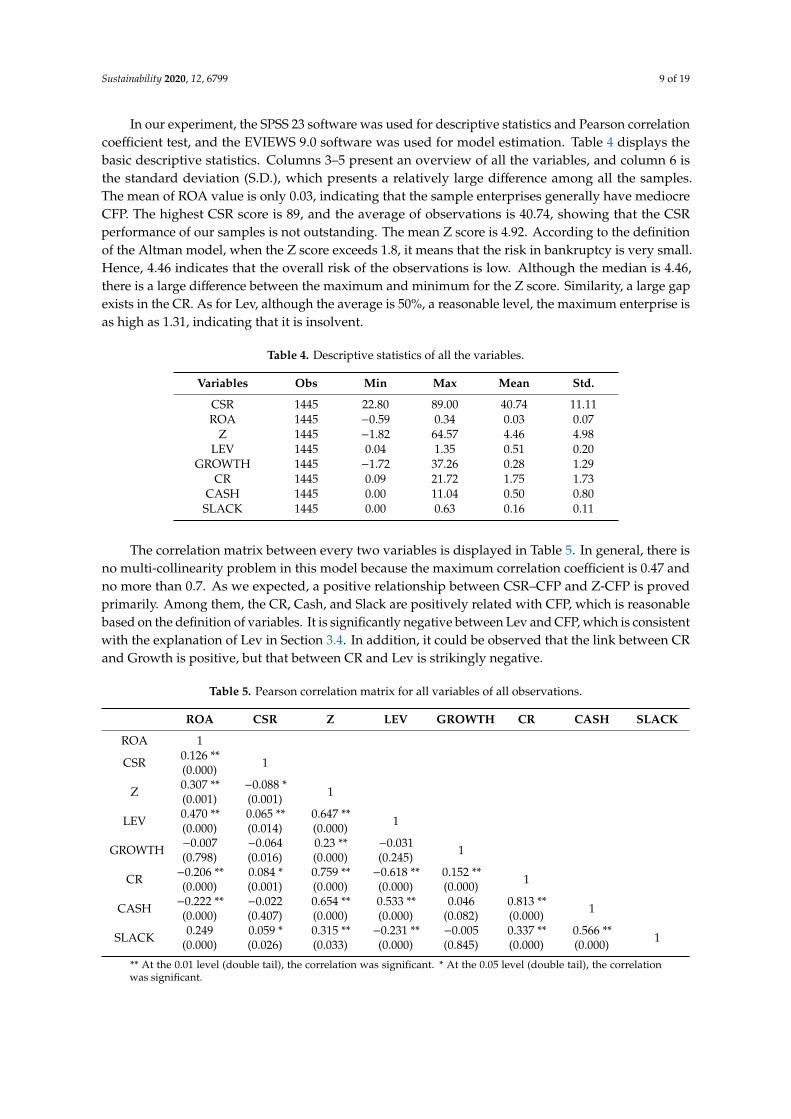
In our experiment, the SPSS 23 software was used for descriptive statistics and Pearson correlationcoefficient test, and the EVIEWS 9.0 software was used for model estimation. Table 4 displays thebasic descriptive statistics. Columns 3–5 present an overview of all the variables, and column 6 isthe standard deviation (S.D.), which presents a relatively large difference among all the samples.The mean of ROA value is only 0.03, indicating that the sample enterprises generally have mediocreCFP. The highest CSR score is 89, and the average of observations is 40.74, showing that the CSRperformance of our samples is not outstanding. The mean Z score is 4.92. According to the definitionof the Altman model, when the Z score exceeds 1.8, it means that the risk in bankruptcy is very small.Hence, 4.46 indicates that the overall risk of the observations is low. Although the median is 4.46,there is a large difference between the maximum and minimum for the Z score. Similarity, a large gapexists in the CR. As for Lev, although the average is 50%, a reasonable level, the maximum enterprise isas high as 1.31, indicating that it is insolvent.
Table 4. Descriptive statistics of all the variables.
Variables Obs Min Max Mean Std.
CSR 1445 22.80 89.00 40.74 11.11ROA 1445 −0.59 0.34 0.03 0.07
Z 1445 −1.82 64.57 4.46 4.98LEV 1445 0.04 1.35 0.51 0.20
GROWTH 1445 −1.72 37.26 0.28 1.29CR 1445 0.09 21.72 1.75 1.73
CASH 1445 0.00 11.04 0.50 0.80SLACK 1445 0.00 0.63 0.16 0.11
The correlation matrix between every two variables is displayed in Table 5. In general, there isno multi-collinearity problem in this model because the maximum correlation coefficient is 0.47 andno more than 0.7. As we expected, a positive relationship between CSR–CFP and Z-CFP is provedprimarily. Among them, the CR, Cash, and Slack are positively related with CFP, which is reasonablebased on the definition of variables. It is significantly negative between Lev and CFP, which is consistentwith the explanation of Lev in Section 3.4. In addition, it could be observed that the link between CRand Growth is positive, but that between CR and Lev is strikingly negative.
Table 5. Pearson correlation matrix for all variables of all observations.
ROA CSR Z LEV GROWTH CR CASH SLACK
ROA 1
CSR 0.126 **(0.000) 1
Z 0.307 **(0.001)
−0.088 *(0.001) 1
LEV 0.470 **(0.000)
0.065 **(0.014)
0.647 **(0.000) 1
GROWTH −0.007(0.798)
−0.064(0.016)
0.23 **(0.000)
−0.031(0.245) 1
CR −0.206 **(0.000)
0.084 *(0.001)
0.759 **(0.000)
−0.618 **(0.000)
0.152 **(0.000) 1
CASH −0.222 **(0.000)
−0.022(0.407)
0.654 **(0.000)
0.533 **(0.000)
0.046(0.082)
0.813 **(0.000) 1
SLACK 0.249(0.000)
0.059 *(0.026)
0.315 **(0.033)
−0.231 **(0.000)
−0.005(0.845)
0.337 **(0.000)
0.566 **(0.000) 1
** At the 0.01 level (double tail), the correlation was significant. * At the 0.05 level (double tail), the correlationwas significant.

Sustainability 2020, 12, 6799 10 of 19
5. Empirical Results
5.1. Regression Results
Firstly, as the results show in Table 6, ROA and CSR are employed as the dependent andindependent variable, respectively, and the ordinary least squares (OLS) regression model is adopted toinvestigate the relation between CSR and ROA. The regression results show that the CSR is significantlypositively correlated with ROA at the level of 0.01, and the correlation coefficient is 0.000835, indicatingthat CSR will significantly promote CFP. This result verifies the H1. It is worth noting that thecoefficients in our model are small, because the value of the dependent variable ROA is small (below 1),but the independent variable CSR is mostly above 30.
Table 6. Regression results of the OLS of all samples for the three models.
ROA ROA ROA
Z 0.001636 ***(3.19)
CSR 0.000835 ***(6.14)
0.000610 ***(3.99)
Z * CSR 0.0000663 ***(4.98)
LEV −0.189454 ***(−1.78)
−0.175630 ***(−16.63)
−0.168616 ***(−16.02)
GROWTH 0.000487(0.41)
−0.000751(−0.61)
−0.000463(−0.39)
CR −0.004984 ***(−2.95)
−0.007944 ***(−4.32)
−0.007898 ***(−4.45)
CASH −0.00636 *(−1.76)
−0.006985 *(−1.77)
−0.008492 **(−2.21)
SLACK 0.124342 ***(7.20)
0.127508 ***(7.31)
0.120164 ***(7.00)
c 0.085587 ***(9.75)
0.110319 ***(14.78)
0.079318 ***(9.02)
R2 28.40 27.04 29.62
***, **, * are statistically significant at the 1%, 5%, and 10% levels, respectively.
Secondly, the relationship between Z and ROA is examined. As shown in the third column, Z is aproxy variable for financial distress. Similarity to CSR, Z is significantly positively correlated withROA, and the correlation coefficient is 0.001636. This implies that, with an increase in the Z score,which represents a lower risk of financial distress, the CFP also increases. Therefore, H2 is proved.
Thirdly, in model 3, the interaction terms of financial distress and CSR are added, and thecoefficient of the interaction terms is significantly positive (0.0000663, p < 0.01). This indicates that theZ score plays a positive moderating role in the CSR–CFP relation. The higher the Z score, the strongerthe role of CSR in promoting CFP. A higher Z score means a company is less likely to face financialdistress and is accordingly more stable and healthy. Therefore, H3 has passed the test, and the win-winrelation of CSR–CFP is more pronounced for firms that are more stable.
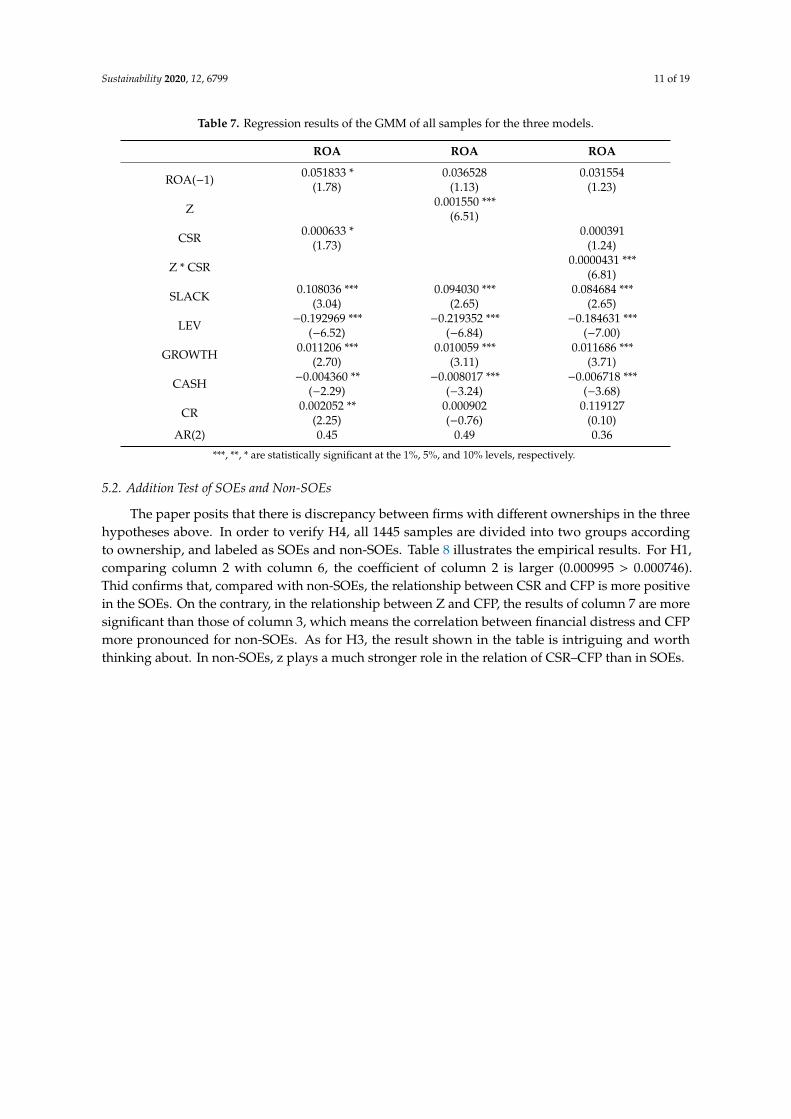
Considering the possible endogenous problems, we further use Generalized Method of Moments(GMM) to test the hypothesis. Table 7 shows the results of the GMM. It shows that at least at the levelof 10% our three hypotheses are passed. The results of AR (2) prove that there is no second-order serialautocorrelation (p values are significantly greater than 0.1). On the whole, the positive relationshipof CSR–CFP and the inverse relation between financial distress and financial performance is stillsignificant. Meanwhile, the negative moderate role of financial distress in the relation of CSR–CFP hasnot changed yet.
Sustainability 2020, 12, 6799 11 of 19
Table 7. Regression results of the GMM of all samples for the three models.
ROA ROA ROA
ROA(−1) 0.051833 *(1.78)
0.036528(1.13)
0.031554(1.23)
Z 0.001550 ***(6.51)
CSR 0.000633 *(1.73)
0.000391(1.24)
Z * CSR 0.0000431 ***(6.81)
SLACK 0.108036 ***(3.04)
0.094030 ***(2.65)
0.084684 ***(2.65)
LEV −0.192969 ***(−6.52)
−0.219352 ***(−6.84)
−0.184631 ***(−7.00)
GROWTH 0.011206 ***(2.70)
0.010059 ***(3.11)
0.011686 ***(3.71)
CASH −0.004360 **(−2.29)
−0.008017 ***(−3.24)
−0.006718 ***(−3.68)
CR 0.002052 **(2.25)
0.000902(−0.76)
0.119127(0.10)
AR(2) 0.45 0.49 0.36
***, **, * are statistically significant at the 1%, 5%, and 10% levels, respectively.
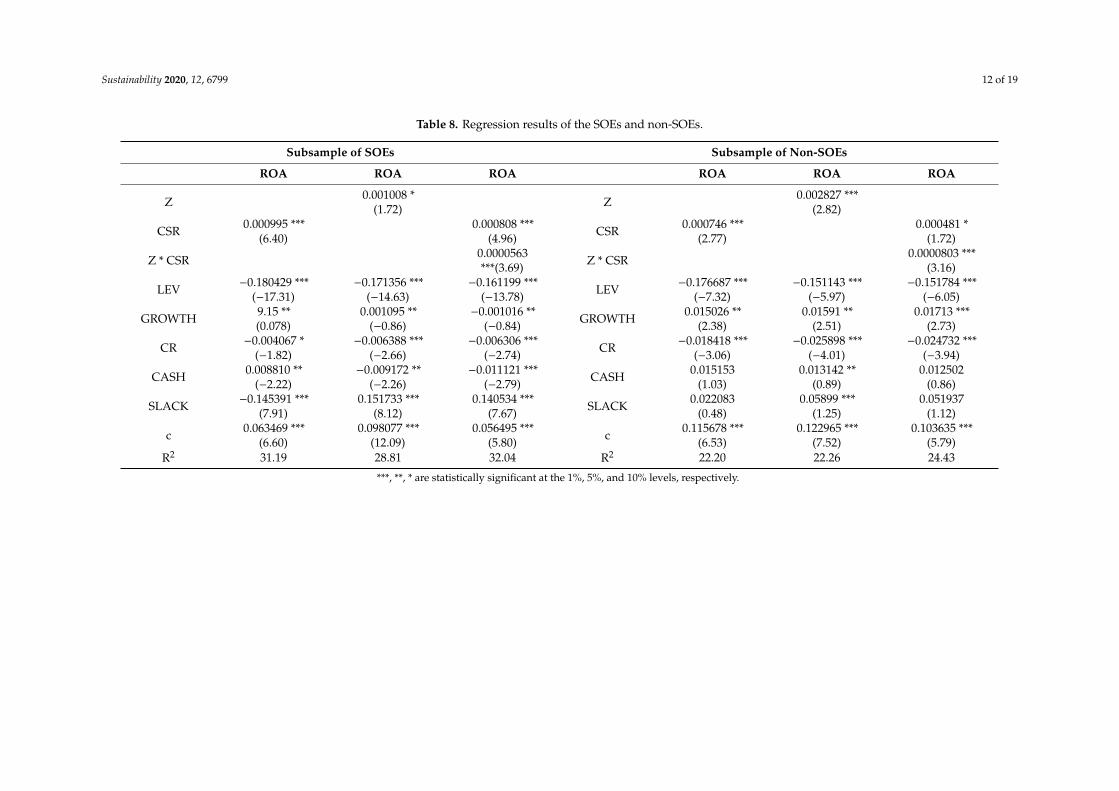
5.2. Addition Test of SOEs and Non-SOEs
The paper posits that there is discrepancy between firms with different ownerships in the threehypotheses above. In order to verify H4, all 1445 samples are divided into two groups accordingto ownership, and labeled as SOEs and non-SOEs. Table 8 illustrates the empirical results. For H1,comparing column 2 with column 6, the coefficient of column 2 is larger (0.000995 > 0.000746).Thid confirms that, compared with non-SOEs, the relationship between CSR and CFP is more positivein the SOEs. On the contrary, in the relationship between Z and CFP, the results of column 7 are moresignificant than those of column 3, which means the correlation between financial distress and CFPmore pronounced for non-SOEs. As for H3, the result shown in the table is intriguing and worththinking about. In non-SOEs, z plays a much stronger role in the relation of CSR–CFP than in SOEs.
Sustainability 2020, 12, 6799 12 of 19
Table 8. Regression results of the SOEs and non-SOEs.
Subsample of SOEs Subsample of Non-SOEs
ROA ROA ROA ROA ROA ROA
Z 0.001008 *(1.72) Z 0.002827 ***
(2.82)
CSR 0.000995 ***(6.40)
0.000808 ***(4.96) CSR 0.000746 ***
(2.77)0.000481 *
(1.72)
Z * CSR 0.0000563***(3.69) Z * CSR 0.0000803 ***
(3.16)
LEV −0.180429 ***(−17.31)
−0.171356 ***(−14.63)
−0.161199 ***(−13.78) LEV −0.176687 ***
(−7.32)−0.151143 ***
(−5.97)−0.151784 ***
(−6.05)
GROWTH 9.15 **(0.078)
0.001095 **(−0.86)
−0.001016 **(−0.84) GROWTH 0.015026 **
(2.38)0.01591 **
(2.51)0.01713 ***
(2.73)
CR −0.004067 *(−1.82)
−0.006388 ***(−2.66)
−0.006306 ***(−2.74) CR −0.018418 ***
(−3.06)−0.025898 ***
(−4.01)−0.024732 ***
(−3.94)
CASH 0.008810 **(−2.22)
−0.009172 **(−2.26)
−0.011121 ***(−2.79) CASH 0.015153
(1.03)0.013142 **
(0.89)0.012502
(0.86)
SLACK −0.145391 ***(7.91)
0.151733 ***(8.12)
0.140534 ***(7.67) SLACK 0.022083
(0.48)0.05899 ***
(1.25)0.051937
(1.12)
c 0.063469 ***(6.60)
0.098077 ***(12.09)
0.056495 ***(5.80) c 0.115678 ***
(6.53)0.122965 ***
(7.52)0.103635 ***
(5.79)R2 31.19 28.81 32.04 R2 22.20 22.26 24.43
***, **, * are statistically significant at the 1%, 5%, and 10% levels, respectively.
Sustainability 2020, 12, 6799 13 of 19
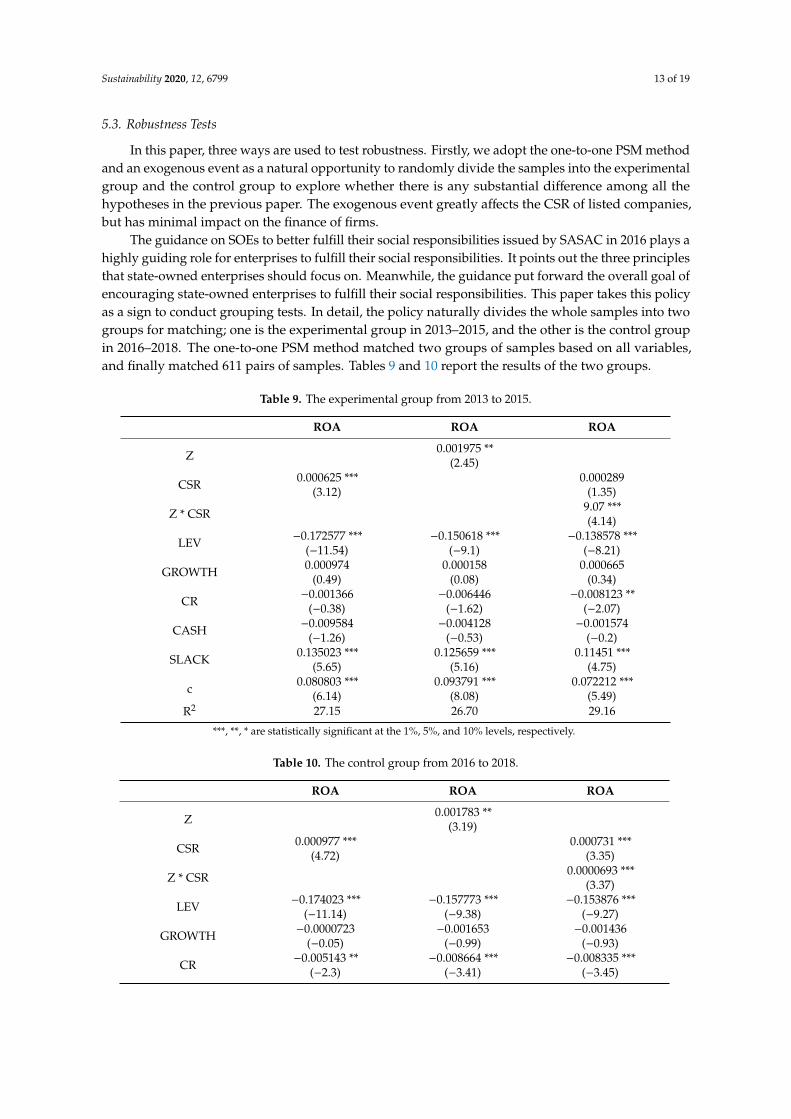
5.3. Robustness Tests
In this paper, three ways are used to test robustness. Firstly, we adopt the one-to-one PSM methodand an exogenous event as a natural opportunity to randomly divide the samples into the experimentalgroup and the control group to explore whether there is any substantial difference among all thehypotheses in the previous paper. The exogenous event greatly affects the CSR of listed companies,but has minimal impact on the finance of firms.
The guidance on SOEs to better fulfill their social responsibilities issued by SASAC in 2016 plays ahighly guiding role for enterprises to fulfill their social responsibilities. It points out the three principlesthat state-owned enterprises should focus on. Meanwhile, the guidance put forward the overall goal ofencouraging state-owned enterprises to fulfill their social responsibilities. This paper takes this policyas a sign to conduct grouping tests. In detail, the policy naturally divides the whole samples into twogroups for matching; one is the experimental group in 2013–2015, and the other is the control groupin 2016–2018. The one-to-one PSM method matched two groups of samples based on all variables,and finally matched 611 pairs of samples. Tables 9 and 10 report the results of the two groups.
Table 9. The experimental group from 2013 to 2015.
ROA ROA ROA
Z 0.001975 **(2.45)
CSR 0.000625 ***(3.12)
0.000289(1.35)
Z * CSR 9.07 ***(4.14)
LEV −0.172577 ***(−11.54)
−0.150618 ***(−9.1)
−0.138578 ***(−8.21)
GROWTH 0.000974(0.49)
0.000158(0.08)
0.000665(0.34)
CR −0.001366(−0.38)
−0.006446(−1.62)
−0.008123 **(−2.07)
CASH −0.009584(−1.26)
−0.004128(−0.53)
−0.001574(−0.2)
SLACK 0.135023 ***(5.65)
0.125659 ***(5.16)
0.11451 ***(4.75)
c 0.080803 ***(6.14)
0.093791 ***(8.08)
0.072212 ***(5.49)
R2 27.15 26.70 29.16
***, **, * are statistically significant at the 1%, 5%, and 10% levels, respectively.
Table 10. The control group from 2016 to 2018.
ROA ROA ROA
Z 0.001783 **(3.19)
CSR 0.000977 ***(4.72)
0.000731 ***(3.35)
Z * CSR 0.0000693 ***(3.37)
LEV −0.174023 ***(−11.14)
−0.157773 ***(−9.38)
−0.153876 ***(−9.27)
GROWTH −0.0000723(−0.05)
−0.001653(−0.99)
−0.001436(−0.93)
CR −0.005143 **(−2.3)
−0.008664 ***(−3.41)
−0.008335 ***(−3.45)
Sustainability 2020, 12, 6799 14 of 19
Table 10. Cont.
ROA ROA ROA
CASH −0.002361 *(−0.4)
−0.001177(−0.2)
−0.005407(−0.92)
SLACK 0.083492 ***(3.07)
0.082441 ***(2.98)
0.081329 ***(3.01)
c 0.075141 ***(5.55)
0.106561 ***(9.33)
0.070954 ***(5.26)
R2 23.93 21.73 25.34
***, **, * are statistically significant at the 1%, 5%, and 10% levels, respectively.
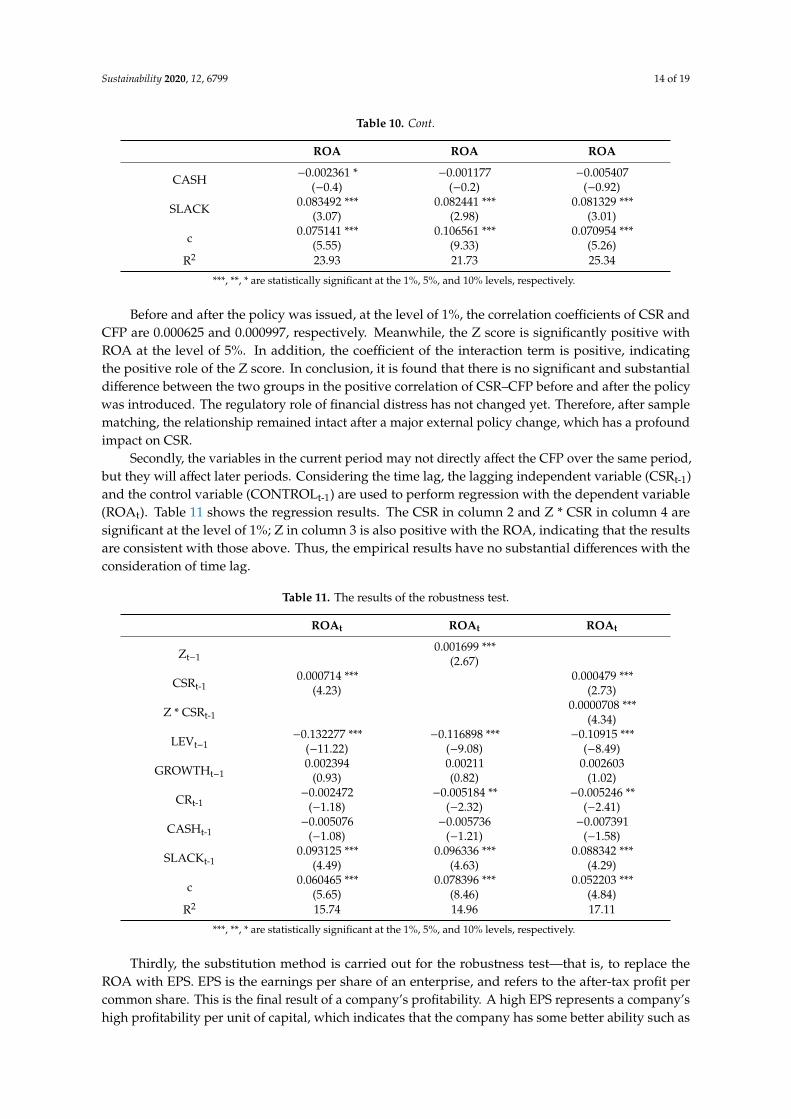
Before and after the policy was issued, at the level of 1%, the correlation coefficients of CSR andCFP are 0.000625 and 0.000997, respectively. Meanwhile, the Z score is significantly positive withROA at the level of 5%. In addition, the coefficient of the interaction term is positive, indicatingthe positive role of the Z score. In conclusion, it is found that there is no significant and substantialdifference between the two groups in the positive correlation of CSR–CFP before and after the policywas introduced. The regulatory role of financial distress has not changed yet. Therefore, after samplematching, the relationship remained intact after a major external policy change, which has a profoundimpact on CSR.
Secondly, the variables in the current period may not directly affect the CFP over the same period,but they will affect later periods. Considering the time lag, the lagging independent variable (CSRt-1)and the control variable (CONTROLt-1) are used to perform regression with the dependent variable(ROAt). Table 11 shows the regression results. The CSR in column 2 and Z * CSR in column 4 aresignificant at the level of 1%; Z in column 3 is also positive with the ROA, indicating that the resultsare consistent with those above. Thus, the empirical results have no substantial differences with theconsideration of time lag.
Table 11. The results of the robustness test.
ROAt ROAt ROAt
Zt−10.001699 ***
(2.67)
CSRt-10.000714 ***
(4.23)0.000479 ***
(2.73)
Z * CSRt-10.0000708 ***
(4.34)
LEVt−1−0.132277 ***
(−11.22)−0.116898 ***
(−9.08)−0.10915 ***
(−8.49)
GROWTHt−10.002394
(0.93)0.00211(0.82)
0.002603(1.02)
CRt-1−0.002472
(−1.18)−0.005184 **
(−2.32)−0.005246 **
(−2.41)
CASHt-1−0.005076
(−1.08)−0.005736
(−1.21)−0.007391
(−1.58)
SLACKt-10.093125 ***
(4.49)0.096336 ***
(4.63)0.088342 ***
(4.29)
c 0.060465 ***(5.65)
0.078396 ***(8.46)
0.052203 ***(4.84)
R2 15.74 14.96 17.11
***, **, * are statistically significant at the 1%, 5%, and 10% levels, respectively.
Thirdly, the substitution method is carried out for the robustness test—that is, to replace theROA with EPS. EPS is the earnings per share of an enterprise, and refers to the after-tax profit percommon share. This is the final result of a company’s profitability. A high EPS represents a company’shigh profitability per unit of capital, which indicates that the company has some better ability such as

Sustainability 2020, 12, 6799 15 of 19
product marketing, technical ability, management ability, etc. Therefore, we use EPS to replace theROA, which represents CFP in the previous paper, and observe whether the results are still robust.In columns 2 and 3 in Table 12, the positive relationship of CSR–CFP (0.014912, p < 0.01) and Z-CFP(0.011241, p < 0.1) are verified. Similarity, the coefficient of the interaction term proves the positivemoderation of Z in the relationship of CSR and firm performance (0.000645, p < 0.01).
Table 12. The results of robustness test 2.
EPS EPS EPS
Z 0.011241 *(1.74)
CSR 0.014912 ***(8.83)
0.012719 ***(7.17)
Z * CSR 0.000645 ***(3.89)
LEV −1.657791 ***(−13.71)
−1.546731 ***(−11.61)
−1.455025 ***(−11.1)
GROWTH 0.000892(0.06)
−0.011116(−0.72)
−0.008356(−0.56)
CR −0.013444(−0.64)
−0.041711 **(−1.8)
−0.041802 **(−1.89)
CASH −0.202457 ***(−4.23)
−0.194576 ***(−3.96)
−0.218573 ***(−4.58)
SLACK 1.947439 ***(9.08)
2.039097 ***(9.27)
1.906784 ***(8.92)
c 0.436359 ***(4.00)
0.971364 ***(10.32)
0.375361 ***(3.43)
R2 21.32 22.14 17.23
***, **, * are statistically significant at the 1%, 5%, and 10% levels, respectively.
Therefore, the results show that there is no substantial difference between the results mentioned in5.1 after considering the time lag and taking EPS as the substitution variable of enterprise performance.This means that the relationship of CSR–CFP and Z-CFP is significantly positive. In addition, the relationof CSR and CFP is more pronounced among firms with a higher stability.
5.4. Discussion
Research on CSR is a hot topic, especially in recent years, and is becoming a skillful businessstrategy. This study explores the impact of CSR and financial distress on CFP in Chinese listedcompanies of manufacturing. In particular, we explore the moderating role of financial distress on therelation of CSR–CFP. A total of 1445 observations from 2013 to 2018 in the CSMAR and RKS databasesare adopted to conduct regression models.
In the first model, as the regression results show, we adopt the RKS score and ROA as theproxy of CSR and CFP. We could conclude that the positive relation of CSR and CFP is supportedabsolutely. In detail, the two have a positive correlation at 1% and at least at the 10% level in other tests.The investment in social performance could promote financial performance, whether in the currentperiod or in a lag period. In model 2, which examines the relationship between financial distress andCFP, the Z score and CFP are positive at least at the level of 10%. With the increase in the Z score,the CFP is increasing. This proves that financial distress inhibits CFP due to the fact that a high levelof Z score means a low level of financial distress. A bad financial situation leads to poor financialperformance. In the third model, we add the interactive item to verify the moderating role of the Z scorein relation of CSR and CFP. At the level of 1%, the positive coefficient proves the negative moderatingrole of financial distress in the link of CSR and CFP. This result may be due to the fact that, when thecompany is in financial distress, the manager will give priority to the improvement of the financial
Sustainability 2020, 12, 6799 16 of 19
situation. A focus on the interests of shareholders may lead to the neglect of other stakeholders.The transformation of CSR investment into CFP will not be like that of normal enterprises.
To verify hypothesis 4, which takes the ownership into account, enterprises of different ownershipshow differences between the relationship above. In China, SOEs are owned or controlled by the state.The behavior of SOEs is determined by the will and interests of the government. The results mean thatSOEs are more effective in promoting CSR to CFP; meanwhile, the financial situation has a deeperimpact on the relationship between them. SOEs are the pillar of our national economy, and the leadingstrength of the industrial enterprise of our country. Fulfilling social responsibility is the duty of SOEs,and they are more likely to achieve a win-win situation between CSR and CFP, especially, when in goodfinancial situation. Compared with SOEs, non-SOEs would concentrate more on financial promotingin a highly competitive environment. Financial situation is more important for them. As a result,the negative relation of financial distress with CFP is more significant in non-SOEs.
6. Conclusions
Many empirical studies have given multiple perspectives on the relationship of CSR and CFP.Despite the abundant empirical evidence on the CSP–CFP relationship, few studies focus on therelationship between CSR and CFP and the role of financial distress in such a relationship in Chineselisted companies of manufacturing. To answer this call, we built 1445 samples from the CSMARand RKS databases and examined the complex relationship between the CSR score and Z score andROA. In addition, some interesting differences are proved between SOEs and non-SOEs throughsample grouping.
Several findings are noted as follows. Firstly, as the signaling theory and stakeholder theory show,CSR is a positive sign for corporations. When a company fulfills its social responsibility and performswell, it sends a positive signal to its stakeholders, such as shareholders, creditors, employees, and evengovernment agencies, thus providing multiple ways to benefit the CFP. For example, companies couldget loans at a lower cost, government agencies will adopt more preferential tax policies, and employeeswill work harder. Secondly, the paper concludes that the CSR–CFP relationship is more significant incompanies with a low bankruptcy risk. Hence, the empirical results provide a practical implication forfirms to improve both CSR and financial health. The lower financial risk allows the managers of theenterprise not to be confined to controlling financial risks. This allows the focus of management andthe investment of economic resources to be placed in direct production and operation. At this time,the CSR has a higher conversion rate to corporate performance. Thirdly, the win-win relationship ofCSR and CFP is a little stronger in SOEs. This result is reasonable and instructive. SOEs are generallybacked by the government or nation, and thus they are more motivated to carry out CSR activities toobtain a higher reputation and achieve a win-win with the firm value, especially when the enterprisefaces low risk. Compared with SOEs, non-SOEs enjoy a higher degree of marketization and competitivepressure; accordingly, they are more profit-driven. Therefore, they pay more attention to the financialsituation. A good financial condition makes non-SOEs more involved in the improvement of economicefficiency, which confirms the fact that the inverse relation between CFP and financial distress is moresignificant in non-SOEs.
Compared with previous studies, this paper has some differences and makes some contributions.On the one hand, the objects of research are Chinese manufacturing enterprises. In addition to studyingthe impact of CSR and financial distress on financial performance, we also take the moderatingrole of financial distress into account and draw conclusions about the inhibitory effect. In this way,the relationship between CSR, financial distress, and CFP in manufacturing enterprises is studiedmore comprehensively. On the other hand, considering the particular characteristics of the Chineseenterprise, we combine the relationship between the variables and the ownership of the firms foranalysis. Compared with previous studies that considered the ownership in CSR and CFP mostly,we considered the impact of ownership more broadly.
Sustainability 2020, 12, 6799 17 of 19
The results are consistent with policies released in recent years that aim to raise awareness of CSRand achieve win-win development. Meanwhile, our empirical results have certain implications for thepolicy-making of government and enterprise managers. First of all, the fulfillment of social responsibilityis a win-win situation. Efforts to improve the CSR score will not only benefit social development,but also enable enterprises to obtain economic returns. Secondly, the risk of bankruptcy plays arestraining role in the process of corporate social responsibility to improve corporate performance.Hence, the managers of enterprises should always pay attention to corporate financial distress,rationally use financial leverage, and effectively control corporate risks. Further, the governmentshould encourage non-SOEs to fulfill their CSR because of the natural political freedom they have.For example, for consumers, they need to take the social responsibility of being polite and honest toensure the authenticity of products, so as to maintain the market order. For environmental issues,they could attach great importance to resource conservation and improve production efficiency.
Due to the limiting conditions of data collection, the paper regards CSR as an overall indicatorand adopts a comprehensive score to measure it, but not in several dimensions. In fact, CSR is acomprehensive concept including consumers, community, and the environment etc. Future researchcould focus on the impact of different dimensions of CSR on finance if data are available, thus providingmore implications in detail when making CSR decisions for managers.
Author Contributions: Conceptualization, L.W.; methodology, L.W.; writing-original draft preparation, L.W.;writing-review and editing, Z.S. and L.W.; data resource C.Y., funding acquisition, Z.S. and C.Y.; visualization, T.D.and W.Z. All authors have read and agreed to the published version of the manuscript.
Funding: This research was funded by the National Natural Science Foundation of China, grant number 71601063and 71771076; the Fundamental Research Funds for the Central Universities, grant number JZ2020HGTB0038.
Conflicts of Interest: The authors declare no conflict of interest.
References
1. Jamali, D. The case for strategic corporate social responsibility in developing countries. Bus. Soc. Rev. 2007,112, 1–27. [CrossRef]
2. Margolis, J.D.; Elfenbein, H.A.; Walsh, J.P. Does it pay to be good. And does it matter? A meta-analysis ofthe relationship between corporate social and financial performance. SSRN Electron. J. 2009. [CrossRef]
3. Wang, K.; Sewon, O.; Claiborne, M.C. Determinants and consequences of voluntary disclosure in an emergingmarket: Evidence from China. J. Int. Account. Audit. Tax. 2008, 17, 14–30. [CrossRef]
4. Freeman, R.E. The politics of stakeholder theory: Some future directions. Bus. Ethics Q. 1994, 4, 409–421.[CrossRef]
5. Barnea, A.; Rubin, A. Corporate social responsibility as a conflict between shareholders. J. Bus. Ethics 2010,97, 71–86. [CrossRef]
6. Harrison, J.S.; Wicks, A.C. Stakeholder theory, value, and firm performance. Bus. Ethics Q. 2013, 23, 97–124.[CrossRef]
7. Connelly, B.L.; Certo, S.T.; Ireland, R.D.; Reutzel, C.R. Signaling theory: A review and assessment. J. Manag.2010, 37, 39–67. [CrossRef]
8. Bae, S.M.; Masud, A.K.; Kim, J.D. A Cross-country investigation of corporate governance and corporatesustainability disclosure: A signaling theory perspective. Sustainability 2018, 10, 2611. [CrossRef]
9. Uyar, A.; Karaman, A.S.; Kılıç, M. Is corporate social responsibility reporting a tool of signaling orgreenwashing? Evidence from the worldwide logistics sector. J. Clean. Prod. 2020, 253, 119997. [CrossRef]
10. Nguyen, P.-A.; Kecskés, A.; Mansi, S. Does corporate social responsibility create shareholder value?The importance of long-term investors. J. Bank. Financ. 2020, 112, 105217. [CrossRef]
11. Lu, W.; Chau, K.W.; Wang, H.; Pan, W. A decade’s debate on the nexus between corporate social and corporatefinancial performance: A critical review of empirical studies 2002–2011. J. Clean. Prod. 2014, 79, 195–206.[CrossRef]
12. Aguilera, R.V.; Rupp, D.E.; Williams, C.A.; Ganapathi, J. Putting the S back in corporate social responsibility:A multilevel theory of social change in organizations. Acad. Manag. Rev. 2007, 32, 836–863. [CrossRef]
Sustainability 2020, 12, 6799 18 of 19
13. Capon, N.; Farley, J.U.; Hoenig, S. Determinants of financial performance: A meta-analysis. Manag. Sci. 1990,36, 1143–1159. [CrossRef]
14. Männasoo, K.; Maripuu, P.; Hazak, A. Investments, credit, and corporate financial distress: Evidence fromCentral and Eastern Europe. Emerg. Mark. Financ. Trade 2018, 54, 677–689. [CrossRef]
15. Feng, L.; Zhang, X.; Zhou, K. Current problems in China’s manufacturing and countermeasures for industry4.0. EURASIP J. Wirel. Commun. Netw. 2018, 2018, 90. [CrossRef]
16. Cheng, S.; Lin, K.Z.; Wong, W. Corporate social responsibility reporting and firm performance: Evidencefrom China. J. Manag. Gov. 2015, 20, 503–523. [CrossRef]
17. Lin, L.; Hung, P.-H.; Chou, D.-W.; Lai, C.W. Financial performance and corporate social responsibility:Empirical evidence from Taiwan. Asia Pac. Manag. Rev. 2019, 24, 61–71. [CrossRef]
18. Kao, E.H.C.; Yeh, C.-C.; Wang, L.-H.; Fung, H.-G. The relationship between CSR and performance: Evidencein China. Pac. Basin Financ. J. 2018, 51, 155–170. [CrossRef]
19. Schmidpeter, R.; Stehr, C. A history of research on CSR in China: The obstacles for the implementationof CSR in emerging markets. In Sustainable Development and CSR in China: A Multi-Perspective Approach;Schmidpeter, R., Lu, H., Stehr, C., Huang, H., Eds.; Springer International Publishing: Cham, Switzerland,2015; pp. 1–11.
20. Marquis, C.P.; Qian, C. Corporate social responsibility reporting in China: Symbol or substance? Organ. Sci.2014, 25, 127–148. [CrossRef]
21. Kuo, L.; Yeh, C.-C.; Yu, H.-C. Disclosure of corporate social responsibility and environmental management:Evidence from China. Corp. Soc. Responsib. Environ. Manag. 2011, 19, 273–287. [CrossRef]
22. Gong, Y.; Ho, K.-C. Does corporate social responsibility matter for corporate stability? Evidence from China.Qual. Quant. 2017, 52, 2291–2319. [CrossRef]
23. Timothy, M.D. Is the socially responsible corporation a myth? The good, the bad, and the ugly of corporatesocial responsibility. Acad. Manag. Persp. 2009, 23. [CrossRef]
24. Scholtens, B. A note on the interaction between corporate social responsibility and financial performance.Ecol. Econ. 2008, 68, 46–55. [CrossRef]
25. Waddock, S.A.; Graves, S.B. The corporate social performance–financial performance link. Strat. Manag. J.1997, 18, 303–319. [CrossRef]
26. Quéré, B.P.; Nouyrigat, G.; Baker, C.R. A bi-directional examination of the relationship between corporatesocial responsibility ratings and company financial performance in the European context. J. Bus. Ethics 2015,148, 527–544. [CrossRef]
27. Duque-Grisales, E.; Aguilera-Caracuel, J. Environmental, Social and Governance (ESG) scores and financialperformance of multilatinas: Moderating effects of geographic international diversification and financialslack. J. Bus. Ethics 2019, 1–20. [CrossRef]
28. Jo, H.; Harjoto, M.A. Corporate governance and firm value: The impact of corporate social responsibility.J. Bus. Ethics 2011, 103, 351–383. [CrossRef]
29. Adegbite, E.; Guney, Y.; Kwabi, F.; Tahir, S. Financial and corporate social performance in the UK listed firms:The relevance of non-linearity and lag effects. Rev. Quant. Financ. Account. 2018, 52, 105–158. [CrossRef]
30. Inekwe, J.; Jin, Y.; Valenzuela, M.R. The effects of financial distress: Evidence from US GDP growth.Econ. Model. 2018, 72, 8–21. [CrossRef]
31. Jensen, M.C.; Meckling, W.H. Theory of the Firm: Managerial Behavior, Agency Costs and Ownership Structure;Springer: Berlin/Heidelberg, Germany, 1979; pp. 163–231.
32. Jandik, T.; Makhija, A.K. Debt, debt structure and corporate performance after unsuccessful takeovers:Evidence from targets that remain independent. J. Corp. Financ. 2005, 11, 882–914. [CrossRef]
33. Agostini, M. Corporate Financial Distress: A Roadmap of the Academic Literature Concerning its Definition andTools of Evaluation; Springer: Berlin/Heidelberg, Germany, 2018; pp. 5–47.
34. Tan, T.K. Financial distress and firm performance: Evidence from the Asian financial crisis. J. Financ. Account.2012, 11, 1.
35. Bouslah, K.; Kryzanowski, L.; M’Zali, B. Social performance and firm risk: Impact of the financial crisis.J. Bus. Ethics 2016, 149, 643–669. [CrossRef] [PubMed]
36. Goss, A.; Roberts, G.S. The impact of corporate social responsibility on the cost of bank loans. J. Bank. Financ.2011, 35, 1794–1810. [CrossRef]
Sustainability 2020, 12, 6799 19 of 19
37. Oikonomou, I.; Brooks, C.; Pavelin, S. The impact of corporate social performance on financial risk andutility: A longitudinal analysis. Financ. Manag. 2012, 41, 483–515. [CrossRef]
38. Chollet, P.; Sandwidi, B.W. CSR engagement and financial risk: A virtuous circle? International evidence.Glob. Financ. J. 2018, 38, 65–81. [CrossRef]
39. See, G. Harmonious society and Chinese CSR: Is there really a link? J. Bus. Ethics 2008, 89, 1–22. [CrossRef]40. Li, W.; Zhang, R. Corporate social responsibility, ownership structure, and political interference: Evidence
from China. J. Bus. Ethics 2010, 96, 631–645. [CrossRef]41. He, Y.; Chiu, Y.-H.; Zhang, B. The impact of corporate governance on state-owned and non-state-owned
firms efficiency in China. N. Am. J. Econ. Financ. 2015, 33, 252–277. [CrossRef]42. Chang, L.; Li, W.; Lu, X. Government engagement, environmental policy, and environmental performance:
Evidence from the most polluting Chinese listed firms. Bus. Strat. Environ. 2013, 24, 1–19. [CrossRef]43. Ma, L.; Liang, J. The effects of firm ownership and affiliation on government’s target setting on energy
conservation in China. J. Clean. Prod. 2018, 199, 459–465. [CrossRef]44. Makni, R.; Francoeur, C.; Bellavance, F. Causality between corporate social performance and financial
performance: Evidence from Canadian firms. J. Bus. Ethics 2008, 89, 409–422. [CrossRef]45. Cho, S.Y.; Lee, C.; Pfeiffer, R.J. Corporate social responsibility performance and information asymmetry.
J. Acc. Public Policy 2013, 32, 71–83. [CrossRef]46. Du, X.; Chang, Y.; Zeng, Q.; Du, Y.; Pei, H. Corporate environmental responsibility (CER) weakness, media
coverage, and corporate philanthropy: Evidence from China. Asia Pac. J. Manag. 2015, 33, 551–581.[CrossRef]
47. McGuinness, P.B.; Vieito, J.P.; Wang, M. The role of board gender and foreign ownership in the CSRperformance of Chinese listed firms. J. Corp. Financ. 2017, 42, 75–99. [CrossRef]
48. Fischer, T.M.; Sawczyn, A.A. The relationship between corporate social performance and corporate financialperformance and the role of innovation: Evidence from German listed firms. J. Manag. Control 2013, 24,27–52. [CrossRef]
49. Jacobs, B.; Kraude, R.; Narayanan, S. Operational productivity, corporate social performance, financialperformance, and risk in manufacturing firms. Prod. Oper. Manag. 2016, 25, 2065–2085. [CrossRef]
50. Petitjean, M. Eco-friendly policies and financial performance: Was the financial crisis a game changer forlarge US companies? Energy Econ. 2019, 80, 502–511. [CrossRef]
51. O’Sullivan, J.; Mamun, A.; Hassan, M.K. The relationship between board characteristics and performance ofbank holding companies: Before and during the financial crisis. J. Econ. Financ. 2015, 40, 438–471. [CrossRef]
52. Esteban-Sanchez, P.; de La Cuesta-Gonzalez, M.; Paredes-Gazquez, J.D. Corporate social performance and itsrelation with corporate financial performance: International evidence in the banking industry. J. Clean. Prod.2017, 162, 1102–1110. [CrossRef]
53. Liu, T.; Zhang, Y.; Liang, D. Can ownership structure improve environmental performance in Chinesemanufacturing firms? The moderating effect of financial performance. J. Clean. Prod. 2019, 225, 58–71.[CrossRef]
© 2020 by the authors. Licensee MDPI, Basel, Switzerland. This article is an open accessarticle distributed under the terms and conditions of the Creative Commons Attribution(CC BY) license (http://creativecommons.org/licenses/by/4.0/).