Embed Size (px)
Citation preview

The impact of Enseña por México on student socioemotional skills
November 2017 Microanalitica

i
Prepared by Armando Chacón and Pablo A. Peña
Acknowledgements
The evaluation presented in this report was possible thanks to the work of many people. We are very
grateful to Andrés Peña for his tireless support in coordinating with educational authorities and
providing information from Enseña por México. Robbie Dean and Laura Lewis played the essential role
of coordinating the many facets of the project. We appreciate the comments and insights of Hunter
Gehlbach, Andy Sokatch, Koji Miyamoto, Patrick Kyllonen and Daniel Santos on the measurement of
socioemotional skills. Eva Anderson-Park, Alex Bowers and Ariel Lindorff contributed their comments
and insights on teacher surveys to measure teaching practices and attitudes. We also appreciate the
feedback on preliminary versions of this report from Dave Evans, Patrick McEwan, and Tim Kautz. All
errors and omissions are our responsibility.

ii
Executive summary
This report presents the results of an evaluation of the impact of Enseña por México on student
socioemotional skills in the academic year 2016-17 in the states of Baja California, Chiapas, Hidalgo and
Puebla. Using self-applied student questionnaires, we measured the four socioemotional scales of the
CORE Districts Survey (self-management, growth mindset, self-efficacy and social awareness), grit, and
locus of control. We also measured six behaviors and attitudes that could be interpreted as proxies of
socioemotional skills: educational expectations, perceived general and pecuniary returns on education,
tardiness and absenteeism, time devoted to homework, and community involvement.
We use a difference-in-differences approach to compare growth in the metrics of impact between the
start and the end of the academic year across treated and non-treated students. Some non-treated
students are in treated schools, while others are in comparable, non-treated or control schools. Control
schools were found using a Coarsened Exact Matching technique. The sample includes over 56,000
student observations (baseline plus endline) in 1,194 classrooms in grades 4-12 in 328 schools.
We find that exposure to Enseña por México fellows is associated with short-run improvements in
socioemotional skills in Secundaria (grades 7-9), as measured by the CORE scales. There is also evidence
of a reduction in tardiness and absenteeism in all educational levels analyzed. The magnitudes are
modest—the main estimates are below 0.15 standardized units. These results are in line with
evaluations of other members of the Teach For All network.
We also measured a set of seven scales of effective teaching that are predictive of students’ academic
achievement using the Teach For All Student Survey (TSS), and teaching practices and attitudes using
instructor surveys. Using those two sources we found that Enseña por México fellows differ from regular
teachers. Fellows score between 0.15 and 0.30 standard deviations higher than regular teachers in the
seven TSS scales. At the same time, fellows give more importance to developing student curiosity, and
they think it is more important for students to set ambitious goals. Fellows engage in extracurricular
activities, use evaluations, and give feedback to students to a larger extent than regular teachers. In
terms of the Big Five personality traits, fellows are more open to new experiences, more extraverted,
and more agreeable.
In sum, the results indicate that Enseña por México fellows are more effective than regular teachers,
and that they help foster student socioemotional skills.

1
1 Introduction
Teach For All is both a global network of 46 independent, locally led and governed partner
organizations, inspired by the Teach For America and Teach First UK models, and a global organization
that works to accelerate the progress of the network. According to Teach For All, these organizations
“recruit and develop promising future leaders to teach in their nations’ under-resourced schools and
communities and, with this foundation, work with others, inside and outside of education, to ensure all
children are able to fulfill their potential.” Throughout we refer to Teach For All recruits as fellows. In
Mexico, the member organization is Enseña por México. In the summer of 2016, Teach For All hired
Microanalitica through a competitive process to conduct a short-term evaluation of the impact of
Enseña por México fellows on student socioemotional skills. This report summarizes the methodology
and the results of the evaluation carried out in the academic year 2016-17.
The term “socioemotional skills” encompasses concepts that, depending on the context, are referred to
by different names, such as non-cognitive skills, soft skills, character skills, life skills or 21st century skills
(Sanchez et al., 2016). Socioemotional skills are: “(a) conceptually independent from cognitive ability, (b)
generally accepted as beneficial to the student and to others in society, (c) relatively rank-order stable
over time in the absence of exogenous forces […], (d) potentially responsive to intervention, and (e)
dependent on situational factors for their expression” (Duckworth and Yeager, 2015). Socioemotional
skills have become a central issue in the discussion on how to improve educational outcomes. A rich
body of literature has established that these skills matter (Sanchez et al., 2016). Indeed, they may be as
important as intelligence in determining academic and professional success (Heckman, Stixrud, and
Urzúa, 2006). However, many questions remain about the extent to which these skills are malleable,
exactly how they can be cultivated, and how to properly measure them for evaluation purposes
(Farrington et al., 2012).
Although there is evidence indicating that socioemotional skills can be cultivated (Sanchez et al., 2016),
results are hard to generalize. Some studies estimate the impact of programs specifically aimed at
enhancing socioemotional skills of a well-defined target population, while others estimate the impact of
general interventions such as attaining more years of schooling. The evaluation presented here falls
somewhere between those two points. Enseña por México’s goal is to expand quality education and
opportunities for all children, and as part of that, to also promote socioemotional learning. The impact
of such intervention on student socioemotional skills cannot be inferred from studies like those
mentioned above, which are either about more specific or more general interventions.
Two lines of research are relevant for situating the context of this evaluation. The first line includes
studies that have produced evidence on whether teachers can have an impact on student
socioemotional skills, and how a teacher’s ability to enhance socioemotional skills relates to the ability
to improve academic performance, as measured by test scores. In some instances, socioemotional skills
are proxied by “non-test outcomes” such as unexcused absences or suspensions. Some studies have
found that teachers’ abilities to foster socioemotional learning and academic performance show little
correlation (Kraft, 2017; Jennings and DiPrete, 2010; Jackson, 2016; Blazar and Kraft, 2017). In other
words, the teachers who are good at adding value in terms of test scores are usually not the same ones
who are good at fostering socioemotional skills. However, there is some evidence of a positive

2
correlation (Rusek et al., 2015; Ladd and Sorensen, 2017). In the context of Enseña por México, this
means that even if the organization’s fellows are good at improving academic performance, it is an open
question whether they are good at fostering socioemotional skills.
The second relevant line of research consists of evaluations of Teach For All members. Most of the
evaluations publicly available are for Teach For America, and the majority focus on academic
performance as the metric of impact. Except for one study that finds no effects on academic
achievement (Kane, Rockoff and Staiger, 2008), the studies of Teach For America find that fellows have a
positive impact on math achievement, but no impact on reading (Xu, Hannaway and Taylor, 2011;
Chiang, et al. 2017; Antecol, Eren and Ozbeklik, 2013). Other studies that focused on socioemotional
skills and related behaviors, reveal mixed results. Some found decreases in unexcused absences and
suspensions (Backes and Hansen, 2017), while others found no effect on attendance, promotion or
disciplinary incidents (Glazerman, Mayer and Decker, 2006). There are two evaluations of other
members of the Teach For All network. A study of Teach First UK found evidence indicative of
improvements in test scores (Allen and Allnutt, 2013), and a study of Enseña Chile found positive effects
on test scores, self-esteem and self-efficacy (Alfonso, Santiago and Bassi, 2010).
The present evaluation builds on previous studies and sheds light on whether the instructors selected
and trained by Enseña por México have a positive impact on student socioemotional skills in the short
term—specifically, one academic year. Enseña por México selects and trains its fellows to provide
quality education and expand opportunities for students. Although comparisons with the evaluation
results for Teach For America are inevitable, it must be noted that Enseña por México operates in a very
different environment. Mexico is a middle-income country (its GDP per capita is one third that of the
US.) Education is not organized in the same way. Teachers are trained and paid differently (OCDE, 2017).
Whatever is observed for Teach For America may not necessarily be applicable to Mexico or any other
country where the Teach For All network is present.
The way Enseña por México operates made a quasi-experimental difference-in-differences approach the
best option for an impact evaluation. The difference-in-differences method “compares the changes in
outcomes over time between a population that is enrolled in a program (the treatment group) and a
population that is not (the comparison group)” (Gertler et al., 2011, p.95). Given a set of schools where
Enseña por México fellows were to be deployed in the academic year 2016-17 (the treatment schools),
we found a set of similar schools to use as a comparison group (the control group.) Treatment schools
included three educational levels: Primaria (grades 1-6), Secundaria (grades 7-9), and Bachillerato
(grades 10-12).
As metrics of impact, we used six measures of socioemotional skills and six measures of attitudes or
behaviors related to those skills. Four socioemotional scales were taken from the CORE Districts Survey:
self-management, growth mindset, self-efficacy and social awareness. Those scales are positively related
to academic performance and positive behaviors (West, 2016). We also included the scales of grit
(Duckworth and Quinn, 2009) and academic locus of control (Arocha and Lezama, 2007). The scales for
attitudes or behaviors related to socioemotional skills that we measured are: educational expectations,
perceived pecuniary and general returns on education, tardiness and absenteeism in school, time
devoted to homework, and community involvement. Those scales can be thought of as proxies for

3
socioemotional skills, but are more easily malleable and directly interpretable. All the scales rely on
students’ responses to questions about their attitudes and behaviors. They were measured at the
beginning and the end of the academic year in treatment and control schools among students in grades
4-12. Our impact estimates are the result of comparing growth in socioemotional skills between
students who were exposed to the fellows and students who were not exposed. For our estimation
approach to be valid, “the comparison group must accurately represent the change in outcomes that
would have been experienced by the treatment group in the absence of treatment” (Gertler et al., 2011,
p.96). Hence the importance of finding comparable schools for the control group.
As part of the evaluation, Teach For All also requested a comparison of Enseña por México fellows and
regular teachers within the same schools, as well as in different but comparable schools. For that
purpose, we applied an instructor questionnaire to elicit teaching values and practices. In the student
questionnaire we included some scales that measure effective teaching. Information about instructors’
values and practices is crucial for gauging the room for potential impact. Positive differences between
fellows and regular teachers may indicate that fellows can make a positive difference, and the larger the
difference, the more room for impact. Additionally, the information provided by scales on teaching
values and practices may help Enseña por México learn what works better and adapt its practices
accordingly.
The evaluation produced two main findings. First, Enseña por México fellows differ from regular
teachers in their teaching values and attitudes. Fellows give more importance to developing student
curiosity. They think it is more important for students to set ambitious goals. Fellows engage in
extracurricular activities, use evaluations, and give feedback to students to a larger extent than regular
teachers. In terms of the Big Five personality traits (Goldberg, 1993), fellows are more open to new
experiences, more extraverted, and more agreeable. Fellows seem to follow practices more conducive
to better academic achievement, as measured by student surveys. They score between 0.15 and 0.30
standard deviations higher than regular teachers in The Teach For All Student Survey (TSS). The survey
includes seven scales similar to other scales that are predictive of students’ academic gains (Kane,
McCaffrey, Miller and Staiger, 2013).
Second, we find evidence that exposure to fellows is associated with modest short-run improvements in
socioemotional skills in Secundaria. We also find evidence of a reduction in tardiness and absenteeism in
all educational levels. The magnitudes are modest—below 0.15 standardized units.
The report is organized as follows. Section 2 explains Enseña por México’s treatment and lays out its
theory of change. Section 3 presents the empirical strategy to compare fellows and regular teachers,
estimate the impact of fellows on student socioemotional skills, and assess whether there is reference
bias. Section 4 describes the questionnaires used, which are included in the online Appendix. Section 5
describes the process employed to collect the data and the main features of the sample of analysis.
Section 6 presents the results of comparing fellows and regular teachers, the estimates of impact, and
the assessment of reference bias presence. Our findings and its implications are discussed in section 7.
4
2 Treatment
According to Enseña por México, its overarching goal can be summarized as:
Producing systemic change through leadership development in education. The organization
promotes personal growth in Mexican young professionals—its fellows. Fellows work with others
to build collective leadership and transform communities. They are selected and trained to be
effective teachers who foster student cognitive and socioemotional skills, improve students’ life
opportunities, and narrow academic achievement gaps. The organization also encourages current
and former fellows to join or lead efforts to promote sustainable improvements in classrooms,
schools and communities.
To achieve that goal, Enseña por México “selects and trains talented and driven college graduates to
teach for two years in underperforming schools.” Its fellows “are meant to be excellent instructors,
interacting with their students inside and outside the classroom, and to be role-models.” Fellows are
recruited via an open call—anyone interested may apply. Through a competitive process involving tests
and interviews, Enseña por México selects the best candidates based on several attributes. Among them
are: leadership, perseverance, critical thinking, motivation and influence. Between 2013 and 2017,
Enseña por México received 8,137 applications and hired 619 fellows—8% of the total. Two thirds of
fellows active in the academic year 2016-17 are women, and roughly one third are Psychology or
Education majors. Their ages range between 22 and 32 years, with an average of 26.
Selected candidates attend an intensive four-week training course to “develop basic skills and acquire
tools to lead the classrooms they will teach.” Once fellows join schools, Enseña por México offers them
continuous training and tutoring. At the start of the academic year 2016-17, 232 fellows were teaching
in 12 states in grades K-12.
A crucial part of the operation of Enseña por México is the selection of the schools where the fellows
teach. The selection is made through case-by-case negotiations with state educational authorities. The
intention is to send fellows to schools in need of high-quality instructors. It is not unusual for fellows to
be sent to schools facing staff shortages.
Fellows teach in different educational levels across diverse types of schools. In the academic year 2016-
17, Enseña por México sent some fellows to a system of Primarias (elementary schools, grades 1-6)
administered by the National Council for Education Development (CONAFE). CONAFE schools operate in
communities with fewer than 30 students. Those communities are in remote areas and lack basic
services, such as electricity, running water or cellphone signal. Frequently, regular teachers in these
schools are graduates of the schools where they teach and have no postsecondary education. Fellows
sent to CONAFE schools usually stay with the families of the students. They split their time between two
CONAFE schools and switch locations every other week. Their role is to provide tutoring to
underperforming students; their job title is “itinerant pedagogic counselor.” In Chiapas, one of the two
states where fellows worked in CONAFE schools, tensions between unionized teachers from regular
schools and authorities have been a fixture in recent years. A teacher strike accompanied by road blocks
prevented the 2016-17 academic year from starting normally (“Mexican Dissident Teachers Strike as
School Year Starts” by Anthony Harrup, Aug. 22, 2016, The Wall Street Journal). In this context, it is fair

5
to say that fellows sent to CONAFE schools face harsh conditions and retention in the program is a
challenge.
Some fellows are sent to regular Primaria schools, where they assume the role of regular teachers.
Others are sent to Secundaria schools (grades 7-9) or Bachillerato schools (grades 10-12). In those
grades each subject could be taught by a different teacher. As a consequence, although fellows are full-
time instructors and teach an average of 13 hours per week, they usually teach only a subset of the
subjects across several classrooms. In Secundaria and Bachillerato, fellows usually teach Math, English or
Science. A distinction between Secundaria and Bachillerato is that courses are organized by semesters in
the latter. Thus, exposure to fellows may be more heterogeneous in Bachillerato.
In Bachillerato and Secundaria, the distribution of each fellow’s workload across subjects and
classrooms is ultimately decided by the school principal. As a result, there is idiosyncratic variation in the
level of exposure even among treated students in the same school. For instance, within the same school,
students in one classroom may take one course with a fellow, while students in a different classroom
may take three courses with the same fellow. The latter would have three times the exposure of the
former.
2.1 Theory of change
Enseña por México describes its theory of change in the following manner:
Enseña por México strives for both immediate and long-term impact: recruiting and developing
effective teachers to provide quality education and expanded opportunities for students in under-
resourced schools and communities today (short-term impact), and investing in their development
as collaborative leaders who will continue to pursue lasting change for children, within and beyond
the education sector, throughout their careers (long-term impact).
By recruiting and placing participants to teach for two years within schools in disadvantaged
communities and supporting the leadership development of those participants through training,
pedagogical coaching, and leadership mentoring, Enseña por México strives for participants to
have a short-term impact on student academic achievement and socioemotional skills, and in the
long-term, develop the skills needed to pursue careers, within and beyond the education sector, to
make lasting systemic change.
The description above makes clear that Enseña por México aims at having short- and long-term impact
on several student, fellow, community and system-wide outcomes. This evaluation focuses on the short-
term impact on student socioemotional skills.
As part of Enseña por México’s goal of “expanding quality education and opportunity for all children […],
the organization also promotes socioemotional learning.” The organization believes its fellows “are
excellent instructors and a positive influence, who work with others inside and outside the classroom
that can transform the way students see their world and themselves.” For Enseña por México, “the
mindsets and competencies used to screen its fellows, plus the training and support they receive from
the organization, make them strong classroom leaders and determined advocates of their students.”
6
Thus, by being exposed to fellows—instead of regular teachers—students are more likely to change
their academic mindsets and behaviors in a positive way.
The theory of change is consistent with the evidence of teachers having the ability to change student
socioemotional skills and related attitudes or behaviors in the short-run (Kraft, 2017; Jennings and
DiPrete, 2010; Jackson, 2016; Blazar and Kraft, 2017; Rusek et al., 2015; Ladd and Sorensen, 2017). An
implicit assumption in the theory of change is that, on average, fellows are more effective at promoting
socioemotional learning than regular teachers. Evaluations of Enseña Chile and Teach for America lend
support to this assumption. They have found positive effects of fellows on self-esteem and self-efficacy,
and negative effects on unexcused absences and suspensions (Alfonso, Santiago and Bassi, 2010; Backes
and Hansen, 2017). However, there is also evidence from Teach For America showing no significant
impact of fellows on attendance, promotion or disciplinary incidents (Glazerman, Mayer and Decker,
2006).
2.2 Prior evidence
Two previous studies provided some cross-sectional evidence that supports Enseña por México’s theory
of change. In the 2014-15 academic year, Microanalitica conducted a study in the state of Puebla using
data from 6,889 students in 37 participating high schools and 71 non-participating high schools. Relative
to teachers in the same schools and in comparable schools, fellows obtained average scores roughly
0.25 standard deviations higher in six of the seven TSS scales of effective teaching, and students exposed
to fellows scored roughly 0.10 standard deviations higher in Gallup’s engagement and wellbeing scales
(Chacón and Peña, 2015).
In the 2015-16 academic year, Microanalitica carried out another study comparing 125 fellows and 125
quasi-randomly selected regular teachers teaching to the same 3,249 students in Middle and High
schools. Regular teachers were included in the comparison group if they were teaching Monday’s
earliest class—excluding fellows’ classes. In direct comparisons of fellows and regular teachers, students
ranked the former above the latter, and fellows scored 0.30-0.45 standard deviations higher in the
seven TSS scales (Chacón and Peña, 2016).
The two studies suggest that Enseña por México fellows make a positive difference in the academic
environment of the students they serve. However, it is an open question whether that difference
translates into meaningful changes in student socioemotional skills. Hence the interest in further
evidence.
3 Empirical strategy
The empirical strategy has three parts. First, we explore whether the evidence that we collected is in line
with the assumptions of the theory of change—namely, that fellows provide a quality education, as well
as support and opportunities for their students. Second, we estimate the impact of exposure to fellows
on student socioemotional skills—this is the core of the analysis. Third, we assess whether there is a
reference bias that could be affecting the impact estimation—one of the chief concerns that Teach For
All expressed about the evaluation.

7
3.1 Empirical support to the theory of change
To test whether Enseña por México fellows appear to be different from regular teachers in the same
schools or in comparable schools, we compare the seven TSS scales that measure effective teaching. We
also compare sociodemographic traits (e.g., gender, age, experience) and attitudes and practices (e.g.,
the percent of the days the instructor gives homework.) Those scales are explained in more detail in
section 4.
By comparing fellows and regular teachers, we attempt to answer three questions. The first question is
whether fellows differ from regular teachers in self-reported traits, attitudes and practices. The second
question is whether fellows score higher than regular teachers in the TSS scales. We test those
hypotheses with t-tests for numerical or Likert-type scales. The third question is which self-reported
scales (i.e., traits, attitudes and practices) explain differences between fellows and regular teachers in
the TSS scales—if any differences are found. To answer the third question, we follow four steps. First,
we estimate a model in which each TSS scale is a linear function of instructors’ self-reported traits,
attitudes and practices. Using only data for regular teachers, we estimate the following specification for
each TSS scale:
iii Zc
(1)
The variable ci denotes one of the Cs for instructor i. The vector Zi denotes self-reported instructor
scales, which includes traits, attitudes and practices. Second, we compute differences in the averages
for each of the components of Zi between fellows and regular teachers. The differences in averages are
denoted by the vector ΔZ. Third, we multiply the estimates of the vector λ by the vector ΔZ. The sign
and magnitude of each term of the product λΔZ is informative of the source of the difference between
fellows and regular teachers in each TSS scale. Fourth, we compare predicted average differences (using
the estimates of λ and ΔZ) and observed differences to assess whether there are unobserved
differences between fellows and regular teachers—not attributable to the self-reported instructor
scales.
3.2 Impact estimation
The impact evaluation involved the application of questionnaires at two points in time, one at the
beginning of the academic year, before exposure to fellows occurred in treatment schools (baseline),
and another at the end of the academic year, after exposure to fellows took place (endline).
Questionnaires were applied to all students in treatment and non-treatment schools in the sample of
analysis.
In the difference-in-differences approach we adopted, the metric of impact is given by different
socioemotional scales and some behaviors related to those scales. The first difference is across periods:
baseline versus endline. The second difference is between students exposed to fellows and students not
exposed to fellows. The difference-in-differences approach identifies the impact of exposure to fellows
assuming that, absent the treatment, the metrics of impact would behave similarly in the treatment and
control groups.

8
In principle, it is possible that not all students in treated schools (referred to as “EPM schools”
throughout) are exposed to fellows during the period of analysis. As we mentioned in section 2, in
schools with many classrooms, fellows may teach only a subset of those classrooms. That possibility
provides an additional source of variation. We have an external control group given by students in non-
EPM schools. We also have an internal control group given by students in EPM schools who were not
exposed to fellows in the period of analysis. We use those two groups for our main estimates.
There are multiple ways to implement difference-in-differences estimators. The simplest way involves
linking baseline and endline questionnaires for each student. That straightforward way could take the
following form:
iiiii Xyy 01
(2)
Where yi1 is the metric of impact for student i in the endline, and yi0 is the metric of impact for the same
student in the baseline. The vector Xi represents controls such as the socio-economic status of the
student, and scores in the Big Five personality traits. The variable τi denotes the treatment status: it
takes the value of one for students exposed to fellows, and zero for students not exposed to fellows.
The coefficient β is the parameter of interest: the impact of being exposed to fellows. The estimation of
(2) poses a practical challenge: it requires identifying and linking students across baseline and endline
questionnaires.
Any questionnaire requesting personal information from students (e.g., birthdate, full name, population
registry number) could turn into an obstacle for the evaluation. Asking information that allows the
identification of students is likely to face resistance from students, parents, teachers or principals. To
avoid such a potential obstacle, we opted for a pragmatic alternative. In both the baseline and endline
questionnaires we did not include any information identifying students. However, we did include
information to identify grade and group (i.e., classroom.) That information allows us to implement the
difference-in-differences approach with an alternative yet equivalent specification.
The alternative to specification (2) that does not require linking every student’s baseline and endline
information is given by a fixed classroom-effect specification:
itiitigtit Xy )(
(3)
Where yit is the metric of impact for student i in period t. In this specification, the baseline and endline
data are stacked. If we have N students in the sample and all of them are surveyed twice, then
specification (3) has 2N observations. The coefficient θt denotes a fixed time-effect, which is meant to
capture the general trend in the metric of impact. The coefficient ηg(i) denotes classroom-fixed effects,
that is, fixed effects for each combination of grade, group and school, denoted by g(i). In this case τi has
a slightly different definition: it is a dummy variable that takes the value of zero when the student has
not been exposed to fellows, and a value of one when the student has been exposed to fellows. The
coefficient β is the parameter of interest: the impact of exposure to fellows. The error term εi is
clustered by classroom.

9
It is important to clarify the meaning of “classroom” in the context of this evaluation. In CONAFE schools,
all students attend the same classroom because schools have only one room. Since we do not know who
is exposed to a fellow within each CONAFE school, if a fellow tutored some students of a school, we count
the entire school as treated. Thus, there is no distinction between school and classroom. In regular
Primaria, a classroom is defined as a combination of grade (4 to 6) and group (usually denoted A, B, C,
etc.) A combination of grade and group (e.g. 4B) denotes both a roster of students and a physical
space—a classroom—in the school where those students take classes. In Secundaria and Bachillerato,
the combination of grade (7-9 and 10-12) and group also defines a roster of students and a physical
space. Since students in Secundaria and Bachillerato have different instructors teaching different
subjects, instructors go from one classroom to the other to teach their classes. Thus, just as in regular
Primaria, a classroom denotes a roster of students that together takes the same courses in the academic
year in the same physical space. Students rarely switch across classrooms within the same academic
year.
We estimate equation (3) using different socioemotional scales as well as the scales that measure
attitudes and behaviors that can be interpreted as proxies of socioemotional skills. Since the sample of
analysis incudes students in grades 4-12, we estimate (3) for the whole sample and by educational level:
Primaria (grades 4-6), Secundaria (grades 7-9), and Bachillerato (grades 10-12).
As we explain in section 5, there are two issues observed in the data that affect our empirical strategy.
The first issue is treatment heterogeneity across schools and within the same school. Exposure to
fellows differs across treated classrooms. To incorporate this heterogeneity in our strategy we estimate
specification (3) for Secundaria and Bachillerato using two alternative definitions of treatment: the
number of fellows that taught the classroom, and the number of subjects taught to the classroom by
fellows.
The second issue is imperfect treatment fidelity. Given that fellows may face harsh conditions—
especially in CONAFE schools—retention is a challenge. Also, conditions in the field may change, and
fellows may be sent to a different school from the originally planned. To address this issue, we estimate
equation (3) in two ways: by Ordinary Least Squares using actual treatment status as the explanatory
variable, and by Two-Stage Least Squares, instrumenting actual treatment status with assigned
treatment status (when the sample was designed.) The instrumental variable is defined at the school
level because that is all that is known in advance (before the academic year starts.)
3.3 Longitudinal reference bias
A concern in the measurement of socioemotional skills brought up by Teach For All is reference bias
(Duckworth and Yeager, 2015). Most measures of socioemotional skills are based on subjective
assessments susceptible to social desirability and reference bias. In our context, social desirability may
bias students’ answers because they may want to give answers that make them look better in the eyes
of the person asking the questions. This type of bias is not a problem if social desirability is time-
invariant. Since we adopt a difference-in-differences strategy, we are not concerned about the levels of
the scales being inflated. We only care about changes in those scales in time—between endline and
baseline. The same can be said about reference bias caused by different students using different

10
references to judge themselves—what we can call “cross-sectional reference bias.” Since we analyze
changes in the scales between two points in time holding constant the pool of students, whatever
reference is used is purged from the change in the scale.
The source of real concern is “longitudinal reference bias” caused by the treatment. Exposure to fellows
may change the reference point used for the self-assessment. For instance, suppose we want to
measure whether a student works hard. In a baseline survey, the student must answer “yes” or “no” to
the question “Do you work hard?” Based on her experience, she answers “yes.” Then the student is
exposed to a fellow who convinces her that she should work much harder to achieve her goals, and she
starts working harder. In an endline survey, after exposure to the fellow, the same student is asked the
same question. Although she works harder than before, she may consider the new level of work not
being hard enough, and answer “no.” Her answers may suggest that exposure to the fellow had a
negative effect on hard work, when it had the opposite effect.
To empirically determine whether there is longitudinal reference bias in the context of this evaluation,
in the student endline and baseline questionnaires we included several items referring to a sibling. In
our view, those items could be affected by longitudinal changes in the reference, but are not directly
affected by exposure to fellows. We used those items as decoys or “pretend metrics of impact” in
regressions with the same specification described by equation (3). In those cases, the estimates of β are
informative of the presence of reference bias.
4 Questionnaires
An essential part of the evaluation was the development of instruments to measure socioemotional
skills and related behaviors and attitudes. As part of the questionnaire design process, Teach For All
brought in several experts to give us their opinions and suggestions. The design process also included
piloting questionnaires and doing cognitive interviews to determine whether respondents properly
understood what was asked. All questionnaires were designed to be optically read, with multiple-option
items. We tried to keep time of completion under 20 minutes because of time and quality concerns.
Below, we separately describe the questionnaires for students and teachers. The actual questionnaires
are included in the online Appendix, together with the formulae to compute the scales.
4.1 Student questionnaire
The items that comprise the student questionnaire can be split into three groups: controls, metrics of
impact, and information about effective teaching. The controls include educational attainment of the
mother, number of people living in the same dwelling, and number of books at home. We also included
ten items to measure the Big Five personality traits and used them as controls. The Big Five constitute
the best-known categorization of personality traits (Goldberg, 1993). They have long been used in
psychology to study how personality relates to job performance and satisfaction, academic success,
entrepreneurial status and financial attitudes and behaviors. The Big Five measure to what extent any
person is conscientious (orderly, responsible, dependable), extraverted (talkative, assertive, energetic),
agreeable (good-natured, cooperative, trustful), neurotic (not calm, easily upset), and open to new
experiences (intellectual, imaginative, open-minded.) (John and Srivastava, 1999). The ten-item

11
inventory can be applied quickly (Rammstedt and John, 2007) and has been applied to Mexican youths,
ages 15 to 29 (Peña, 2016).
As metrics of impact we included six socioemotional scales and six scales for behaviors and attitudes
related to those skills. Four of the socioemotional scales are from the California Office of Reform to
Education (CORE) Districts Survey. CORE is a consortium of school districts that is incorporating
socioemotional skills into school accountability systems. CORE and the organization Transforming
Education selected those four scales because they are valid predictors of academic success, and they are
likely to be malleable through school-based interventions. Additionally, those scales are assessed in less
than 20 minutes (West, 2016). The four CORE scales are: self-management, growth mindset, self-
efficacy, and social awareness. Self-management is the ability to regulate one’s emotions, thoughts, and
behaviors effectively in different situations. This includes managing stress, delaying gratifications,
motivating one’s self, and setting and working toward personal and academic goals. Growth mindset is
the belief that one’s abilities can grow with effort. Students with a growth mindset see effort as
necessary for success, embrace challenges, learn from criticism, and persist in the face of setbacks. Self-
efficacy is the belief in one’s own ability to succeed in achieving an outcome or reaching a goal. Self-
efficacy reflects confidence in the ability to exert control over one’s own motivation, behavior, and
environment. Social awareness is the ability to take the perspective of and empathize with others from
diverse backgrounds and cultures, to understand social and ethical norms of behavior, and to recognize
family, school, and community resources and supports. The use of the four scales in field studies
indicates that they are positively related to key indicators of academic performance and behavior (West,
2016).
The remaining two socioemotional scales are grit and academic locus of control. Grit is defined as
perseverance and passion for long-term goals and is predictive of academic and professional success
(Duckworth, Peterson, Matthews, and Kelly, 2007). We used the eight-item version of the scale
(Duckworth and Quinn, 2009), which has been used in Mexico in large-scale assessments among 9th and
12th graders. We decided not to include grit in the questionnaires for students in grades 4-6 because of
the complexity of the items in the scale. Locus of control can be internal or external. A person with an
internal locus of control believes that he or she can influence events and their outcomes, while someone
with an external locus of control blames outside forces for everything (Rotter, 1966). Academic locus of
control translates the same logic to the academic dimension. It is measured with nine-items (Arocha and
Lezama, 2007). Since the inclusion of grit and academic locus of control would make the student
questionnaire long, we opted for a so-called spiral structure. Half of the respondents were given the grit
scale, and the other half was given the academic locus of control scale. Which students were given what
scale was quasi-randomly determined by alternating questionnaire versions when they were handed to
students.
The other six metrics of impact are behaviors and attitudes related to socioemotional skills. They can be
thought of as ways in which changes in socioemotional skills materialize. The first scale in this group is
educational expectations. We measure this by eliciting desired and expected educational attainment, as
well as the perceived likelihood of obtaining a college degree. The second scale is given by the perceived
general returns on education. We measure it as the degree to which a student perceives education as a
means to get a better job and attain greater job satisfaction. The third scale is defined as perceived

12
pecuniary returns on education. We measure the scale by eliciting wage expectations at age 40 in
money intervals, in two hypothetical scenarios: if the respondent gets a college degree, and if the
respondent only gets a high school diploma. The difference between those two expectations (defined in
money intervals) is a measure of the perceived pecuniary returns on education. The fourth and fifth
scales in this group are two school-related behaviors: self-reported tardiness, absenteeism and class-
skipping, and self-reported time devoted to homework. The last scale in this group is the three-item civic
engagement scale of Doolittle and Faul (2013), which measures attitudes and behaviors of students
regarding their communities, eliciting whether they care and do anything for them.
Teach For All expressed concern about reference bias (see section 3.3). In our chats with experts, it
became clear that there is no infallible method to measure—let alone correct for—reference bias.
Measuring reference bias usually involves the use of “anchoring vignettes”, which are hypothetical
situations to be assessed by the respondent. Since the situations are the same across respondents, their
responses are supposed to be informative of the reference used by each respondent (Kyllonen and
Bertling, 2013). Given the skepticism expressed by the experts about the practical value of the
information gathered through anchoring vignettes, we took a different—new and original—route. To
assess whether reference bias could affect the results of this evaluation, we included seven items in the
student questionnaire, both at the baseline and the endline. Those items were asked twice in each
questionnaire. The first time they referred to the respondent, and the second time they referred to a
respondent’s sibling attending Secundaria or Bachillerato. Respondents with no siblings in Secundaria or
Bachillerato did not answer these items. We also asked whether the sibling mentioned attends the same
school as the respondent. This information allows us to include only the responses about siblings who
almost surely have had no contact with Enseña por México fellows. We arrived at the seven reference-
bias items using three criteria. First, they had to be a subset of the items included in the scales that are
our metrics of impact. Second, they are good candidates to suffer from reference bias. In other words,
we focused on items that have a reference that could, in principle, be modified by being exposed to a
fellow. Third, those items should refer to observable behaviors, so that the respondent could objectively
assess them for a sibling. The seven items are at the end of the questionnaires.
We included the seven scales in The Teach For All Student Survey (TSS) as measures of effective
teaching. The seven TSS scales are measured through student surveys and they reflect teaching
practices: (i) encouraging and supportive relationships fostered, (ii) positive culture and learning
environment created, (iii) understanding checked for and ensured, (iv) rigorous expectations held, (v)
engaging learning environment established, (vi) student input and ideas valued, (vii) learning fully
internalized. Higher scores in similar student-perception scales are associated with greater teacher
value-added in test scores (Kane, McCaffrey, Miller and Staiger, 2013). The TSS was included only in our
endline questionnaire because they require students to assess teacher performance. At the time of the
baseline students did not have enough elements for such assessment—the baseline took place near the
start of the academic year. In contrast, students can assess teacher performance in the endline because
it takes place close to the end of the academic year. We used the upper primary version of the TSS (35
items) for grades 4-9, and the secondary version (36 items) for grades 10-12. The full sets of questions in
both versions of the TSS are included in the online Appendix.

13
4.2 Instructor questionnaire
The evaluation did not require applying questionnaires to instructors. However, the information that
those questionnaires include may be helpful in interpreting its results. In principle, instructor
questionnaires allowed us analyzing whether there is empirical support for the theory of change. Before
describing how we arrived at the instrument applied in the field, it is worth noting that students are
already reporting teacher practices and values through the TSS questionnaires described in the previous
section. The intention behind giving a questionnaire to instructors is to gain additional insights
complementing the information on teacher performance (as assessed by students in the TSS) with self-
reported characteristics, practices and values.
In the context of our analysis, an appropriate instructor questionnaire must satisfy three requirements.
First, it must be “palatable,” i.e. it cannot ask questions that may be perceived as threatening to
instructors or principals. It must be short and non-intrusive. Some teacher questionnaires (e.g. the
Comprehensive Assessment for Leadership and Learning) are taken voluntarily and schools request—
and pay—to be surveyed. Other questionnaires like those of the OECD Teaching and Learning
International Survey (TALIS) are applied by mandate of the educational authorities (OECD, 2014). Our
case is entirely different. Schools and individual teachers may not be interested in responding to the
survey and could reject it without any consequence. After all, Enseña por México is an external
organization requesting the application of questionnaires that offer no benefits for the control schools,
or for regular teachers in treatment schools. Access to schools depends entirely on the good will of
principals and teachers. The second requirement for the instructor instrument is that it should measure
variables belonging to one of three categories: (1) easily-malleable behaviors, (2) non-malleable traits
observable at the recruitment stage, or (3) school-level factors that might be good complements for the
presence of fellows. This requirement is for the utility of the answers from the perspective of Enseña por
México. The third requirement is that the items in the questionnaire must be validated. Teach For All
expressed a strong inclination for relying on items that had been used by other researchers, preferably
in diverse contexts. For those two reasons we relied on TALIS. In 2013, TALIS teacher questionnaires were
applied to thousands of teachers in 34 countries, including Mexico. In our revision of the TALIS teacher
questionnaire we identified instances of “double-barreled” questions, and potential social desirability
and reference biases. Since any attempt to address those issues would require changing TALIS’ items and
thereby lose comparability, we did not try to address them.
The contents of the instructor questionnaire can be divided into five groups. In the first group are
demographic characteristics: gender, age, subject taught, and years of experience.
In the second group are personality traits and socioemotional skills. We included the ten-item Big Five
inventory and the eight-point grit scale described in the previous section.
In the third group are eight questions that elicit teaching values while trying to avoid desirability bias by
using a forced-choice structure. The forced-choice structure has been used when responses could be
subject to social desirability bias, because it prevents respondents from endorsing the desirable items
and rejecting the undesirable ones (Brown and Maydeu-Olivares, 2018). Forcing the choice does not
prevent respondents from trying to choose the most desirable option. But it requires them forming

14
hypotheses about what is more desirable (Meade, 2004). In our view, this is not necessarily a problem.
When instructors try to choose the most desirable answer in a force-choice question, we may be
extracting information about their teaching values—what they think is more socially desirable. In our
eight forced-choice questions, instructors must choose what is more important in a Likert-type scale
between two desirable situations that are, to some degree, in tension. For instance, in the first of those
eight questions, the instructor must choose whether achieving “disciplined students” in the classroom is
more important that “students that participate.” Both options are desirable, but one may come at the
expense of the other. The other pairs of situations in tension are: “fostering curiosity to learn” vs
“developing skills and capacities”, “teamwork” vs “independence of ideas”, “students who respect the
teacher” vs “students who trust the teacher”, “students focused on success” vs “students focused on
effort”, “students who make concrete, achievable plans” vs “students who set very ambitious goals”,
“students who like learning” vs “students who know that learning is useful”, and “developing the
potential of the most advanced students” vs “helping students who are lagging behind to catch up with
the rest of the class.”
The fourth group consists of eleven scales that characterize teacher practices, most of them were taken
from TALIS. The scales focus on curricular and extracurricular activities, expectations and perceptions
about students’ time devoted to the class taught be the instructor, perception of appropriate training
and qualifications, promotion of independent thinking, self-perception of effectiveness, proactivity in
the classroom, use of evaluation and feedback, and relationship to others in school.
The fifth group consists of two scales from TALIS that measure perceptions on culture of participation in
the school, and perceptions on harmony in school.
5 Data
Our analysis uses the results of applying the instruments described in the previous section to over
30,000 students and 800 instructors. Below we describe each step in the process to arrive at our sample
of analysis.
5.1 Sample design
Enseña por México does not unilaterally choose in what schools it operates. In any given academic year,
the list of participating schools is the result of negotiations with state authorities. For that reason, we
were not able to propose an experiment where fellows would be randomly allocated within a pool of
schools. Instead, we were given: (a) a list of treatment schools, which we refer to as “EPM schools”, and
(b) a list of schools where state authorities, in principle, granted access for the evaluation.
5.1.1 Schools with access
Although Enseña por México currently operates in 12 states, access to schools was granted in just four
states: Baja California Sur (BCS), Chiapas, Hidalgo and Puebla. Those four states accounted for 69% of
the active fellows at the beginning of the 2016-17 academic year. Authorities in those states provided
lists of schools of different educational levels with access. Table 1 shows the distribution of schools with
access for the evaluation.

15
Table 1. Schools with access for the evaluation
School level BCS Chiapas Hidalgo Puebla Primaria 396 829 240 4,310 Secundaria 189 0 0 2,175 Bachillerato 137 0 0 1,483 Total 722 829 240 7,968
It is important to note that in Chiapas and Hidalgo all schools with access are part of the CONAFE system.
In general, CONAFE schools are comparable amongst themselves but they are not comparable to non-
CONAFE schools. CONAFE schools are multi-grade and have very small student bodies (under 30). The small
number of students is accompanied by poverty and a lack of public infrastructure. Additionally, fellows
in CONAFE schools assumed the role of “itinerating pedagogic counselors,” tutoring students who needed
remedial work while splitting their time between two schools—switching locations every other week.
Leaving CONAFE schools aside, many other schools with access are not comparable to EPM schools. They
serve students of a different socio-economic status or have a better academic performance. They also
have student bodies of different sizes with different student-teacher ratios.
For the purposes of the evaluation, it is crucial to find non-EPM schools within the pool of schools with
access that are comparable to EPM schools. For that reason, we restricted the list of schools in BCS and
Puebla to schools with available performance records from PLANEA 2015, a national standardized test
given to students in grades 6, 9 and 12. We use PLANEA test scores as a measure of academic
performance in our search for comparable schools. The exclusion of schools without PLANEA test scores
disqualified recently created schools as well as schools that refused to take the test.
5.1.2 Coarsened exact matching
We applied the method known as Coarsened Exact Matching to the list of schools with access to find
comparable schools. We used Stata’s cem command (Blackwell et al., 2009). Depending on the state, we
used different variables for the matching: the number of students and teachers, the poverty index of the
municipality or town where the school is located, school infrastructure, and performance in the National
Plan for the Evaluation of Learning (PLANEA) 2015 test.1
In general, the Coarsened Exact Matching method finds strata of schools that are similar in terms of the
above-mentioned variables. If the matching is successful for the purposes of the evaluation, then in
every stratum where there are EPM schools we would also find non-EPM schools. By construction, those
1 Information on the number of students and teachers comes from the administrative records provided by state authorities and from publicly available data from the National System of Statistical Information on Education of the Ministry of Education. Poverty indices come from public data bases of the National Council for the Evaluation of Social Development Policy and the National Population Council. School level results for PLANEA 2015 are publicly available from the federal Ministry of Education. Information about school infrastructure comes from public data found in the School Census 2015 of the National Institute of Statistics and Geography.

16
non-EPM schools are comparable to the EPM schools in the same stratum. Therefore, they can
potentially serve as control schools.
The Coarsened Exact Matching method can be adjusted to provide finer or coarser matches. There is a
trade-off between how fine the match is and how many non-EPM schools we find that match the EPM
schools. If we want schools to be very similar, the result is fewer schools per stratum. In the extreme,
there would not be any match. On the opposite end, if the match is too coarse, we end up with many
matched schools that are not very similar. We took a trial-and-error approach to balance the similarity
of schools within the same stratum and number of matches. The process was done separately for each
of the four states. In some states, we were willing to tolerate coarser matches.
In the case of Baja California Sur, the matching was based on performance in PLANEA 2015 in Language
and Communication and in Mathematics. In Chiapas, the matching was based on the number of
students, the number of teachers, and the type of floor in the school (concrete or other material). In
Hidalgo, the matching was based on the number of students, the number of teachers, and the poverty
index of the town. Lastly, the match in Puebla was based on performance in PLANEA 2015 in Language
and Communication and in Mathematics, the number of students, the number of teachers, and the
poverty index. In all cases we considered the match of schools within the same educational level:
Primaria, Secundaria or Bachillerato.
Table 2 shows the results of the matching by state. The first two rows show the total number of strata
created and the number of strata where EPM schools were matched to non-EPM schools. For instance,
in the case of Baja California Sur (BCS) there are 40 strata; 14 of them include both EPM and non-EPM
schools.
Table 2. Results of the Coarsened Exact Matching
The lower part of Table 2 displays the number of schools matched and the number of schools
unmatched, by status (EPM or non-EPM.) Many non-EPM schools are unmatched. The most notable
case is Puebla, where access was granted to 5,236 non-EPM schools. However, 5,085 (97%) of those
schools do not resemble EPM schools. We also have unmatched EPM schools, but their number is
relatively modest: 12 out of 151 in the four states.
As Table 2 shows, we found 1,190 non-EPM matches for 139 EPM schools. However, due to cost
considerations we cannot include all the matched non-EPM schools in the sample of analysis. From
among all those pre-selected non-EPM schools (i.e., in matched strata), we proceeded to randomly
choose the ones that were part of the sample of analysis.

17
5.1.3 Random sampling of control schools
We included in the sample two or three non-EPM schools for each matched EPM school—bringing the
number of schools in the sample to over 400 schools. The selection of those schools was random and
stratified by stratum. In the end, we obtained a sample of analysis wherein non-EPM schools resemble
EPM schools in terms of the joint distributions of the variables used for the Coarsened Exact Matching.
Table 3 displays the number schools after the random sampling.
Table 3. Number of schools in the sample
Schools BCS Chiapas Hidalgo Puebla Total Non-EPM 71 76 78 94 319 EPM matched 26 36 38 39 139
EPM unmatched 0 2 1 9 12
Total 97 114 117 142 470
The resulting sample of analysis is roughly balanced across states. In the four states we had a ratio of
non-EPM schools to matched EPM schools of at least 2.05. Table 3 shows unmatched EPM schools
because, even though they will not be part of the analysis, we planned to collect surveys there.
We tested differences between matched EPM and non-EPM schools in the resulting sample—we
excluded EPM schools with no match. In the case of continuous variables (e.g., the number of students),
we used t-tests. In the case of categorical variables, we used chi-2 tests. Of the 19 tests performed, none
showed significant differences at 95% confidence. In other words, using the variables on which we
focused, the matching process resulted in the selection of similar schools.
5.2 Survey collection and attrition
The most important challenge we faced in the field during the survey collection was a combination of
communication problems between authorities and schools. 2 As we explain below, the number of
questionnaires collected in the endline is smaller than the number of questionnaires collected in the
baseline. Half of the drop is explained by “lost” classrooms in schools surveyed in both the baseline and
the endline. Since the field staff followed the same protocol for the baseline and the endline, we
attribute the loss of classrooms to absences when the endline survey was collected.
Another challenge experienced in a few cases was the lack of control school officials and teachers had
over their students. That translated into less than full cooperation with the evaluation. In some isolated
incidents, students were openly hostile to the survey collection process—questionnaires were
2 Some school principals slowed down the collection process a full day, arguing they hadn’t been notified. For some principals, a direct, written instruction to fully cooperate with the survey wasn’t enough. They requested to speak with their supervisors. In addition, planning was not very effective because, in many instances, schools took days off without informing the authorities.

18
destroyed, and field staff were intimidated. Some students answered the questionnaires carelessly or
with offensive messages.
In the baseline, we collected 45,723 questionnaires. By design, we did not identify students in the
surveys. Thus, our estimation approach relies on matching baseline and endline data at the classroom
level. As we explained in section 3.2, a classroom is defined as a combination of grade and group and it
means both a roster of students taking the same courses together and the physical location where they
take those courses. Our sample of analysis consists of the classrooms observed in both the baseline and
the endline. We have a total of 1,194 such classrooms in 328 schools. In those classrooms, we collected
30,389 questionnaires in the baseline and 26,127 in the endline.
Table 4 shows the sources of attrition. We collected 45,723 questionnaires in the baseline (first row.)
Some schools surveyed in the baseline refused to participate in the endline and some were not reached.
If we omit those schools from the baseline, we would have collected 39,491 questionnaires in the
endline (second row.) Within each school surveyed twice, some classrooms were surveyed in the
baseline but not in the endline. If we only count classrooms surveyed twice, the number of
questionnaires is 30,389 in the baseline (third row) and 26,127 in the endline (fourth row.)
Table 4. Attrition by educational level
Another way to explain the information in Table 4 is decomposing attrition starting with all students
surveyed in the baseline. Of those 45,723 students, 13.6% were lost because their schools were not
surveyed in the endline. Within schools surveyed in the endline, 23.0% of students were lost because
their classrooms were not surveyed. Lastly, 14.0% of students in classrooms surveyed were lost because
they did not show up the day of the endline survey. The resulting attrition is 42.9%.
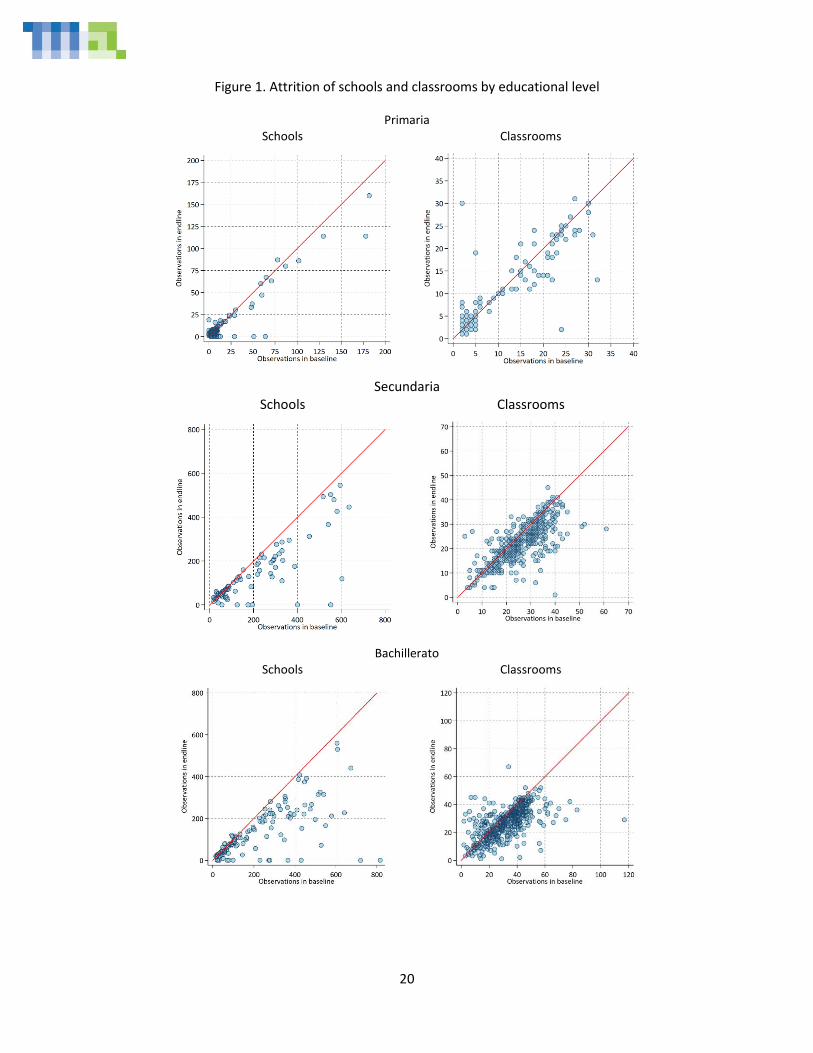
Figure 1 presents a graphic version of attrition. For each educational level, there are two graphs. In one
graph, each observation corresponds to one school. In the other graph, each observation corresponds to
one classroom. The horizontal axis denotes the number of schools or classrooms in the baseline. The
vertical axis denotes the number of schools or classrooms in the endline. The 45-degree line indicates
the expected relationship in the absence of attrition.
In the school-level graphs, the observations on the horizontal axis represent schools surveyed in the
baseline but not in the endline. For instance, there were a couple of Bachillerato schools with over 600
questionnaires in the baseline that refused to participate in the endline. In the classroom graphs, there
are observations above and below the 45-degree line. Some classrooms had more observations in the
baseline while others had more observations in the endline.
19
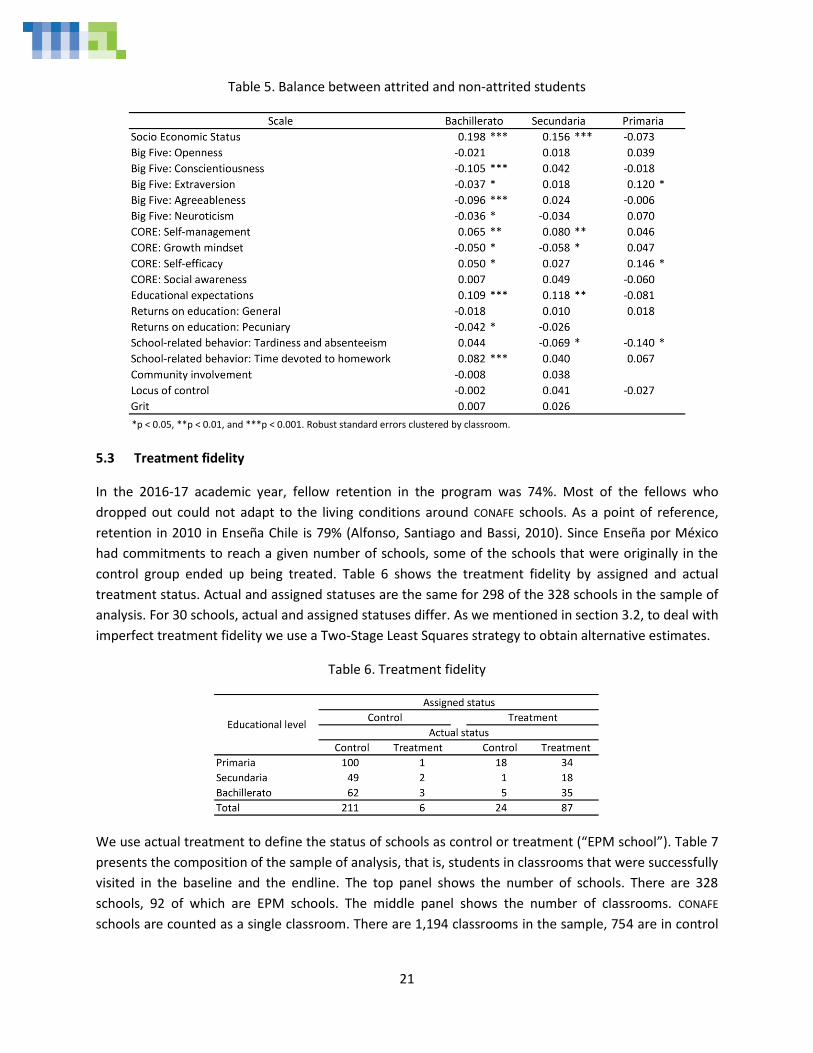
Table 5 presents the results of statistical tests to determine whether attrited students are similar to non-
attrited students in terms of the six control variables (socio economic status and the Big Five) and the
twelve metrics of impact. The results indicate that attrited students were different to non-attrited
students in five control variables for Bachillerato, one for Secundaria, and one for Primaria. In terms of
the metrics of impact, there are significant differences in six of them for Bachillerato, in four for
Secundaria, and in two for Primaria. In sum, Table 5 indicates that attrition was not random. Among the
more relevant results of the comparison are that attrited students in Bachillerato and Secundaria have
higher socioeconomic status, greater self-management, lower growth mindset, and higher educational
expectations.
20
Figure 1. Attrition of schools and classrooms by educational level
Primaria Schools Classrooms
Secundaria
Schools Classrooms
Bachillerato Schools Classrooms
21
Table 5. Balance between attrited and non-attrited students
*p < 0.05, **p < 0.01, and ***p < 0.001. Robust standard errors clustered by classroom.
5.3 Treatment fidelity
In the 2016-17 academic year, fellow retention in the program was 74%. Most of the fellows who
dropped out could not adapt to the living conditions around CONAFE schools. As a point of reference,
retention in 2010 in Enseña Chile is 79% (Alfonso, Santiago and Bassi, 2010). Since Enseña por México
had commitments to reach a given number of schools, some of the schools that were originally in the
control group ended up being treated. Table 6 shows the treatment fidelity by assigned and actual
treatment status. Actual and assigned statuses are the same for 298 of the 328 schools in the sample of
analysis. For 30 schools, actual and assigned statuses differ. As we mentioned in section 3.2, to deal with
imperfect treatment fidelity we use a Two-Stage Least Squares strategy to obtain alternative estimates.
Table 6. Treatment fidelity
We use actual treatment to define the status of schools as control or treatment (“EPM school”). Table 7
presents the composition of the sample of analysis, that is, students in classrooms that were successfully
visited in the baseline and the endline. The top panel shows the number of schools. There are 328
schools, 92 of which are EPM schools. The middle panel shows the number of classrooms. CONAFE
schools are counted as a single classroom. There are 1,194 classrooms in the sample, 754 are in control

22
schools and 435 are in EM schools. Of the 440 classrooms in EPMs schools, 288 had a fellow and 152 did
not. Lastly, the bottom two panels show the number of students in the baseline and the endline.
Table 7. Sample of analysis
Bachillerato Secundaria Primaria Total
Schools
Control 68 51 117 236 EPM schools 37 19 36 92 Total 105 70 153 328
Classrooms
Control schools 322 286 146 754 EPM schools, non-treated 68 78 6 152 EPM schools, treated 164 79 45 288 Total 554 443 197 1,194
Students in baseline
Control schools 9,582 7,197 1,173 17,952 EPM schools, non-treated 2,331 2,240 75 4,646 EPM schools, treated 5,529 1,896 366 7,791 Total 17,442 11,333 1,614 30,389
Students in endline
Control schools 8,130 6,319 1,113 15,562 EPM schools, non-treated 1,897 1,911 76 3,884 EPM schools, treated 4,707 1,651 323 6,681 Total 14,734 9,881 1,512 26,127
5.4 Balance
As we mentioned in section 5.2, attrition was a challenge. To explore whether attrition modified the
balance between EPM schools and control schools, we compare school-level characteristics. Table 8
shows the results of tests for differences in the same school characteristics used for Coarsened Exact
Matching described in section 5.1. The tests were implemented through a regression that includes fixed
effects for each combination of state and school level.
Table 8. Differences in school-level characteristics (EPM schools – control schools)
Estimates in bold type and shaded are significant at 95% confidence.
There is a significant difference in the average number of students in EPM schools, which are larger.
That is explained by Secundarias and Bachilleratos. On average, fellows at those levels are sent to larger
schools. In the rest of the variables, EPM and controls schools do not appear to be significantly different.

23
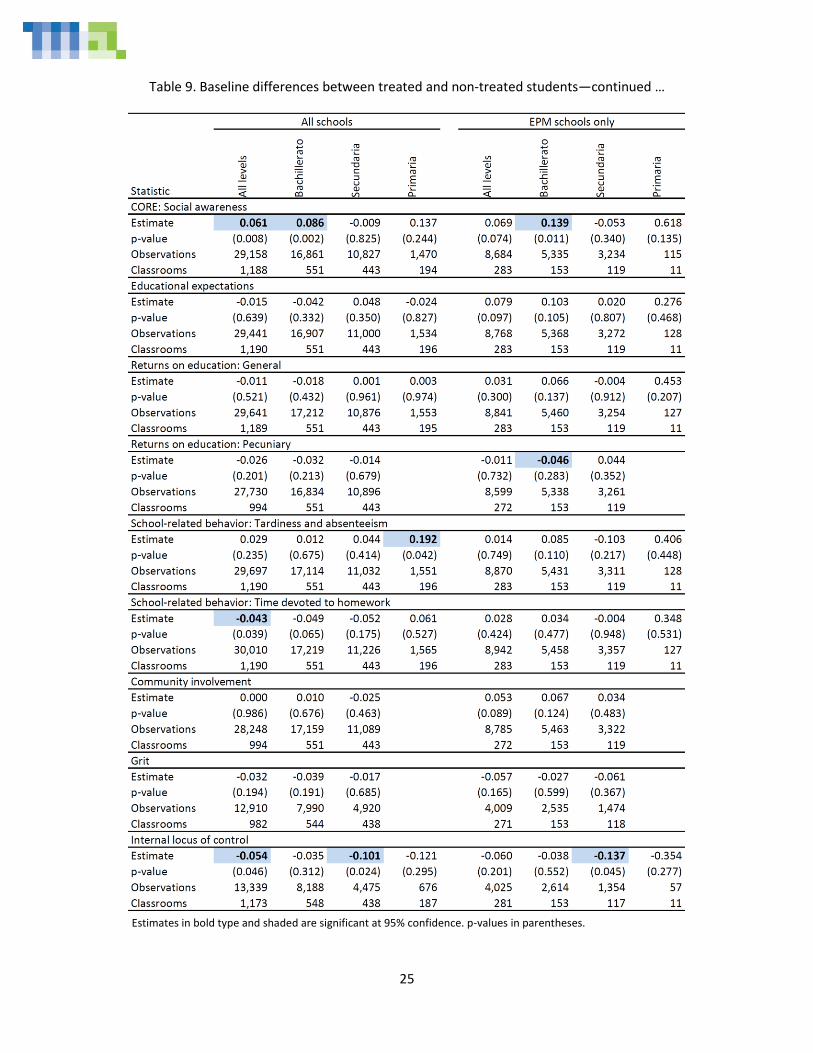
Table 9 presents the results of t-tests using student-level data for the controls and the metrics of impact
in the sample of analysis in the baseline. The first set of columns shows the results including all schools
in the sample (treated and non-treated), and the second set of columns shows the results including only
EPM schools, that is, schools where there was at least one EPM fellow. In those cases, the comparison
was made between treated and non-treated students. Within each set of columns, we present results
for the three educational levels together and separately.
We find significant differences in socioeconomic status, three of the Big Five (extraversion,
agreeableness and neuroticism), one of the CORE scales (social awareness), pecuniary returns on
education, tardiness and absenteeism, time devoted to homework, and internal locus of control. In sum,
treated and non-treated students do not look entirely similar in the baseline. However, no systematic
pattern of differences is apparent.

24
Table 9. Baseline differences between treated and non-treated students
Estimates in bold type and shaded are significant at 95% confidence. p-values in parentheses.
25
Table 9. Baseline differences between treated and non-treated students—continued …
Estimates in bold type and shaded are significant at 95% confidence. p-values in parentheses.

26
5.5 Heterogeneity in intensity
Leaving Primaria aside, treated students do not have the same degree of exposure to fellows, even
within the same school. There is variation in the number of fellows teaching different classrooms, and
even in the number of courses they teach. We define two measures of treatment intensity. The first
measure is the number of different fellows teaching to a classroom the full academic year. Since
Bachillerato is organized in semesters, it is possible for a fellow to teach in the Fall semester but not in
the Spring semester, or vice versa. Hence, the number of fellows teaching a classroom in Bachillerato is
defined in multiples of 0.5. The second measure of treatment intensity is the number of courses taught
by fellows to a classroom in an academic year—regardless of the number of fellows. The semester
organization means that the number of courses taught by fellows to one classroom is also defined in
multiples of 0.5. Based on the administrative records of Enseña por México, we computed these two
metrics of treatment intensity for the classrooms in our sample of analysis. Table 10 shows descriptive
statistics for the two measures of intensity, by the status of the classroom and its educational level.
Classrooms in the external control belong to control schools. Classrooms in the internal control belong
to EPM schools but were not treated.
Table 10. Heterogeneity in treatment intensity
27
We use the heterogeneity in treatment intensity to obtain an additional set of estimates. Although the
intensity within a school may not be random, it is not clear how it could be systematically related to
socioemotional learning. Fellows may be teaching subjects where there are staff shortages. Some
classrooms may have more intensive coursework in the subjects taught by fellows.
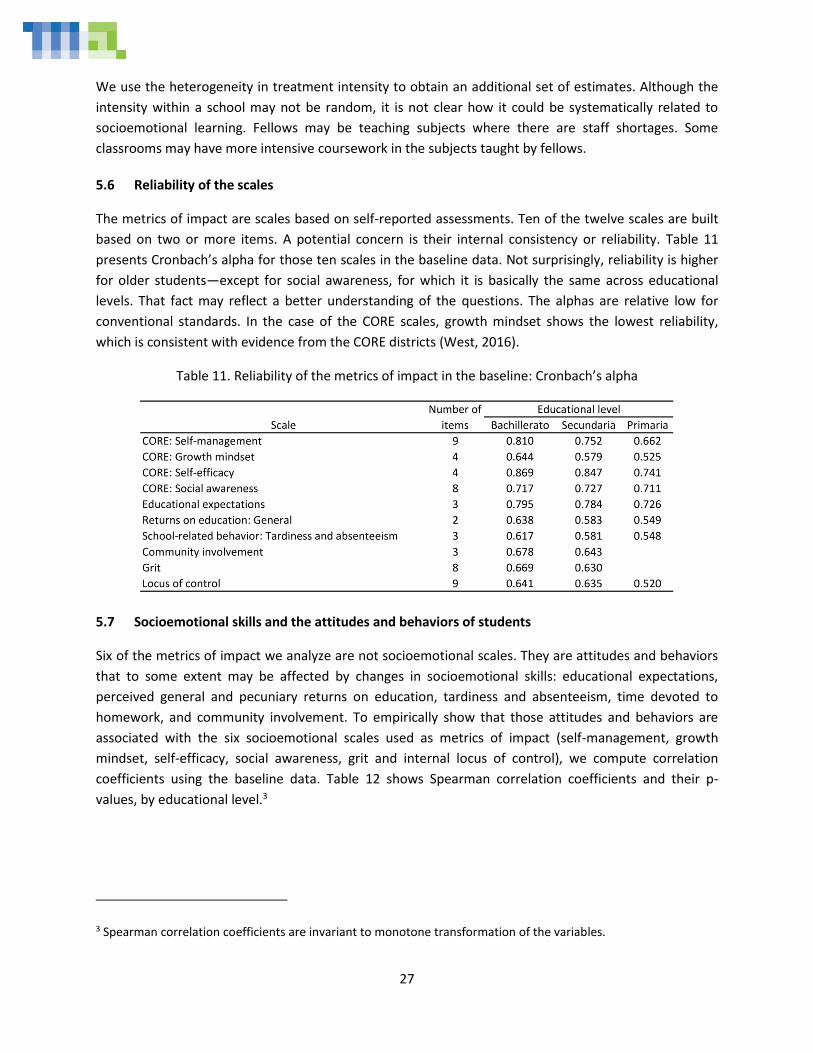
5.6 Reliability of the scales
The metrics of impact are scales based on self-reported assessments. Ten of the twelve scales are built
based on two or more items. A potential concern is their internal consistency or reliability. Table 11
presents Cronbach’s alpha for those ten scales in the baseline data. Not surprisingly, reliability is higher
for older students—except for social awareness, for which it is basically the same across educational
levels. That fact may reflect a better understanding of the questions. The alphas are relative low for
conventional standards. In the case of the CORE scales, growth mindset shows the lowest reliability,
which is consistent with evidence from the CORE districts (West, 2016).
Table 11. Reliability of the metrics of impact in the baseline: Cronbach’s alpha
5.7 Socioemotional skills and the attitudes and behaviors of students
Six of the metrics of impact we analyze are not socioemotional scales. They are attitudes and behaviors
that to some extent may be affected by changes in socioemotional skills: educational expectations,
perceived general and pecuniary returns on education, tardiness and absenteeism, time devoted to
homework, and community involvement. To empirically show that those attitudes and behaviors are
associated with the six socioemotional scales used as metrics of impact (self-management, growth
mindset, self-efficacy, social awareness, grit and internal locus of control), we compute correlation
coefficients using the baseline data. Table 12 shows Spearman correlation coefficients and their p-
values, by educational level.3
3 Spearman correlation coefficients are invariant to monotone transformation of the variables.
28
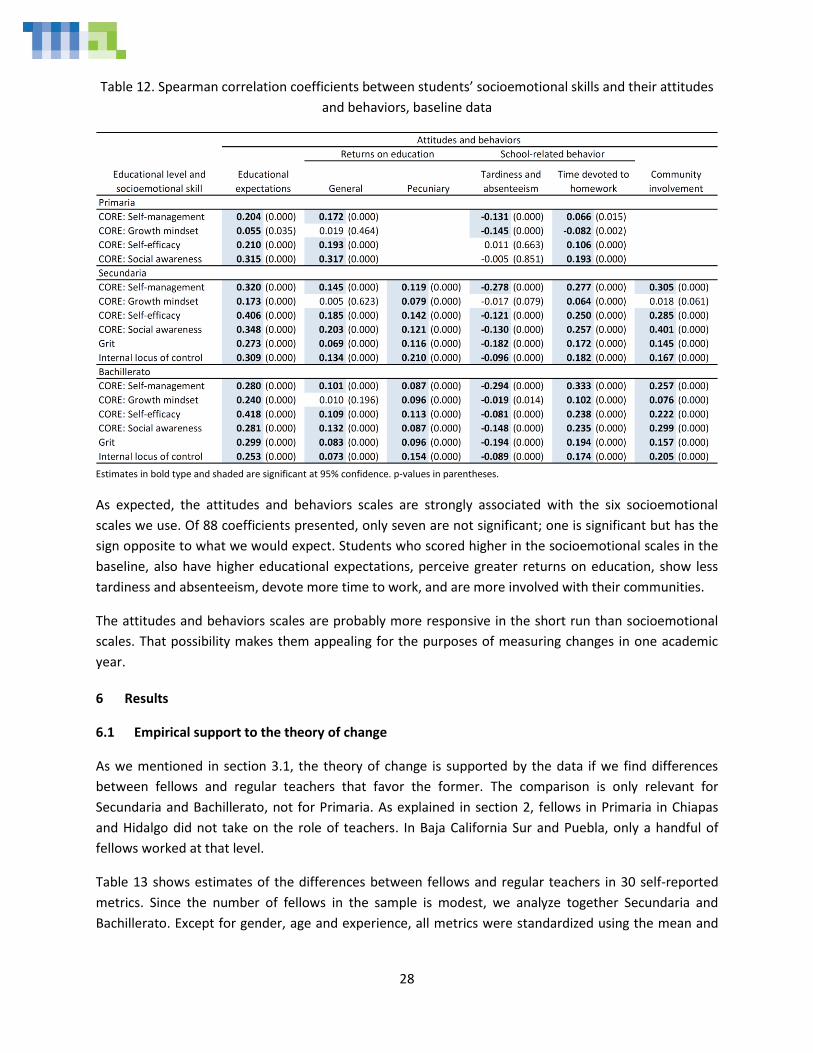
Table 12. Spearman correlation coefficients between students’ socioemotional skills and their attitudes
and behaviors, baseline data
Estimates in bold type and shaded are significant at 95% confidence. p-values in parentheses.
As expected, the attitudes and behaviors scales are strongly associated with the six socioemotional
scales we use. Of 88 coefficients presented, only seven are not significant; one is significant but has the
sign opposite to what we would expect. Students who scored higher in the socioemotional scales in the
baseline, also have higher educational expectations, perceive greater returns on education, show less
tardiness and absenteeism, devote more time to work, and are more involved with their communities.
The attitudes and behaviors scales are probably more responsive in the short run than socioemotional
scales. That possibility makes them appealing for the purposes of measuring changes in one academic
year.
6 Results
6.1 Empirical support to the theory of change
As we mentioned in section 3.1, the theory of change is supported by the data if we find differences
between fellows and regular teachers that favor the former. The comparison is only relevant for
Secundaria and Bachillerato, not for Primaria. As explained in section 2, fellows in Primaria in Chiapas
and Hidalgo did not take on the role of teachers. In Baja California Sur and Puebla, only a handful of
fellows worked at that level.
Table 13 shows estimates of the differences between fellows and regular teachers in 30 self-reported
metrics. Since the number of fellows in the sample is modest, we analyze together Secundaria and
Bachillerato. Except for gender, age and experience, all metrics were standardized using the mean and

29
the average for regular teachers. Although we have information for 833 instructors (fellows and
teachers), the sample of analysis includes only 27 fellows.4
Table 13. Differences between fellows and teachers in self-reported metrics
Estimates in bold type and shaded are significant at 95% confidence.
We found significant differences in twelve of the 30 self-reported metrics. Not surprisingly, fellows are
over ten years younger, and also over 10 years less experienced. In terms of personality traits, fellows
are more open, extraverted and agreeable. In terms of teaching values elicited though forced-choice
questions, fellows put the development of curiosity over the development of competencies, and they
prefer students having very ambitious goals over concrete and achievable plans. We found differences
4 According to Enseña por México, there were 97 fellows in the sample of analysis in Secundarias and Bachilleratos, where they teach only 13 hours per week on average, out of a maximum of 30 hours. Thus, we can assume that the probability of finding a particular fellow teaching at the time of the survey was 0.43 (= 13 ÷ 30), which, when multiplied by 90 fellows, equals 42. Ultimately, the number of fellows surveyed was 65% (= 27 ÷ 42) of the expected number.

30
in extracurricular activities: fellows participate more in those activities. They also see themselves as not
having appropriate training for the courses they teach. They rely more on evaluations and give more
feedback. Lastly, they have a more negative perception of the school where they work: with a less
participative culture and less harmony.
The analysis above has limitations. First, although we can a priori hypothesize that showing higher
scores in some variables is desirable (e.g., giving feedback to students about their performance), there
are other variables where desirability is not clear a priori (e.g., emphasizing very ambitious goals over
concrete and achievable plans). Second, the variables in Table 13 are self-reported. The answers given
by respondents may not reflect actual behaviors. Third, we do not know which of the variables matter
more for more effective teaching.
As an attempt to address those limitations, we can complement the analysis with what students think of
fellows and teachers by the end of the academic year. As described in section 4.1, we collected
information using the TSS, which is supposed to be informative of effective teaching. Table 14 shows
estimates of the differences between fellows and regular teachers in the seven TSS scales. The scores
were standardized using the mean and the standard deviation for regular teachers.
It should be clear that there is a small sample issue. We observe scores for less than 30 fellows. Despite
that, we do find significant differences in the seven TSS scales at 95% confidence. If we perform one-side
tests, the differences for the seven TSS scales are significant using Bachillerato and Secundaria together,
both with all schools and EPM schools only. It is worth emphasizing that the estimates in Table 14 rely
on metrics reported by students. On average, students perceive EPM fellows as more effective than
regular teachers (as measured by the TSS) by around a fifth of a standard deviation.

31
Table 14. Differences between fellows and teachers in The Teach For All Student Survey
Estimates in bold type and shaded are significant at 95% confidence. p-values in parentheses.

32
We can use the information from regular teachers to explore two questions. First, how much of the
difference in the seven scales between EPM fellows and regular teachers can be attributed to
observable variables, and how much is due to factors not observed in the data. Second, we can try to
determine which observed variables contribute more to the difference in the seven scales between
fellows and teachers.
Using the methodology described in section 3.1, we compute a predicted difference between fellows
and regular teachers for each of the seven scales, and compare it with the observed difference. We can
say that the gap between the observed and predicted differences is attributable to unobservable
variables. We also compute the contribution of each observed variable to the predicted difference.
Table 15 shows the results of the analysis. The top panel shows observed and predicted differences, as
well as the part of the difference attributable to unobservable traits of fellows. The bottom panel shows
the contribution of each variable to the predicted difference in the average score of each scale in the
TSS. The highlighted rows indicate the variables that contribute the most to the predicted difference
across the seven TSS scales.

33
Table 15. The Teach For All Student Survey and self-reported metrics among regular teachers
In sum, the evidence supports Enseña por México’s theory of change. Its fellows are different from
regular teachers and they are perceived by students as more effective. The difference in effectiveness
appears to be driven primarily by their having less experience, their openness to new experiences, and
their emphasis on developing students’ curiosity instead of competencies and skills. In the case of
“care”, there seems to be an important unobservable effect for fellows.
6.2 Impact estimates
We first present the estimates defining a classroom as treated if it was taught by an Enseña por México
fellow. We also show alternative results summarizing the twelve metrics of impact in one single metric,
defined as the first factor using factor analysis. Then we show results using two different definitions of
treatment that take into account treatment heterogeneity: (a) the number of fellows who taught the

34
same classroom, and (b) the number of subjects taught to each classroom by fellows. Lastly, we present
Two-Stage Least Squares estimates instrumenting actual treatment status with assigned treatment
status.
Table 16 presents our main impact estimates according to the specification (3) in section 3.2. Each panel
shows a separate metric of impact and four statistics from a separate regression: the impact estimate,
its p-value in a two-side test, the number of observations (baseline plus endline), and the number of
classrooms included. There are two sets of columns. The first set includes all schools in the sample:
treated schools and untreated schools in the terms described in section 3.2. The second set of columns
only includes treated schools, denoted as EPM schools. There are five columns within each set. The first
column includes the three educational levels (Primaria, Secundaria and Bachillerato) without
socioeconomic and personality controls. The second column adds socioeconomic and personality
controls. The remaining three columns present separate estimates by educational level, also including
socioeconomic and personality controls. In all cases, the standard errors are clustered by classroom.
Table 16 shows some evidence of a positive short-run impact of Enseña por México fellows after one
academic year of exposure. When we use all schools, we find a positive estimate (95% confidence on
two-sided tests) for self-efficacy (all levels together with controls), and negative estimates for tardiness
and absenteeism (all levels together with and without controls) When we only include EPM schools, we
find positive estimates for self-management and growth-mindset (Secundaria), and negative estimates
tardiness and absenteeism (all levels together, and Bachillerato). For one metric we find estimates
against the theory of change: social awareness (EPM schools only, all levels together without controls
and Bachillerato). Lastly, we also find a negative estimate for time devoted to homework (Bachillerato),
although this case does not necessarily go against the theory of change—it is possible that a more
effective instructor could rely less on giving homework. All significant estimates have a rather modest
magnitude: between 0.04 and 0.15 standardized units.
Of the 114 estimates presented in Table 16, 26 are significant or marginally significant (90% confidence
on two-sided tests). Sixteen of them point in the direction of fellows causing an improvement in the
metrics analyzed, seven of them point in the opposite direction, and three correspond to time devoted
to homework—which we argue is hard to interpret. It is worth noting that five estimates for social
awareness are negative and marginally significant. In principle, it is possible that exposure to fellows
could be shifting the reference of that scale. However, as we will show below, that hypothesis is not
supported by the evidence.
It could be argued that the socioemotional scales and related attitudes and behaviors in Table 16 belong
to the same domain, i.e. to some degree they measure the same underlying skill. If so, presenting
separate estimates for each scale using the same treatment and control groups would inflate the
number of significant estimates. In we believe they measure the same underlying variable, we could
adjust the significance of the estimates using the correction proposed by Benjamini and Hochberg
(1995). If we perform the correction, only the results for tardiness and absenteeism remain significant.
However, we do not believe all twelve scales belong to the same domain, therefore the correction
would to be too conservative.

35
Table 16. Impact estimates
Estimates in bold type and shaded are significant at 95% confidence. p-values in parentheses.

36
An alternative way to estimate impact, under the assumption that the metrics in Table 16 belong to the
same domain, is to summarize them in one single metric defined as the first factor of the socioemotional
and related scales. We computed that single metric using baseline data, and expressed it in standardized
units. Table 17 presents impact estimates under the single-metric approach. The estimates for
Secundaria are positive and significant: 0.07 and 0.13 standard deviations considering all schools and
EPM schools only, respectively.
Table 17. Estimates of impact using as a metric the first factor of the socioemotional ad related scales
Estimates in bold type and shaded are significant at 95% confidence. p-values in parentheses.
As we mentioned in section 5.5, treatment classrooms in Bachillerato and Secundaria were exposed to a
different number of fellows and were taught a different number of subjects by fellows (see Table 10).
Table 18 shows impact estimates for Bachillerato and Secundaria using the specification with controls
and three distinct definitions of treatment: (a) a dummy indicating whether a fellow taught a subject to
the classroom (which is our basic estimate presented in Table 16), (b) the number of fellows who taught
the classroom, and (c) the number of subjects taught by fellows.
When we differentiate by intensity and we focus only on treatment schools (internal control), we find
positive effects of having more exposure to fellows in Secundaria on self-management, growth mindset,
self-efficacy, social awareness, educational expectations, perceived returns on education, and locus of
control. In Bachillerato, we find negative effects on social awareness and time devoted to homework
when we use the external control. If we use the internal control, we find negative effects on social
awareness, and tardiness and absenteeism (i.e., tardiness and absenteeism improved).

37
Table 18. Estimates of the impact of treatment intensity
Estimates in bold type and shaded are significant at 95% confidence. p-values in parentheses.
Table 19 presents Two-Stage Least Square (2SLS) estimates of impact using the specification with
controls, side by side with the corresponding Ordinary Least Squares (OLS) estimates from Table 16
(with controls). The instrumented variable is the actual treatment status, and the instrument is the
assigned treatment status. The estimate for self-efficacy pooling the three educational levels remains
positive and significant. The negative estimates for tardiness and absenteeism for all levels and
Secundaria remain negative and significant. The 2SLS estimate for Primaria turns negative and
significant. Lastly, the negative and significant OLS estimate for time devoted to homework in
Bachillerato becomes positive and insignificant under the 2SLS approach. The 2SLS approach does not
alter the conclusions. If anything, the resulting estimates are more favorable to the hypothesis of
positive impact.

38
Table 19. Two-Stage Least Square estimates of impact instrumenting actual treatment status with
assigned treatment status
Estimates in bold type and shaded are significant at 95% confidence. p-values in parentheses.
6.3 Reference bias
A potential concern expressed by Teach For All was the presence of reference bias in the measurement
of socioemotional skills and related metrics of impact (as explained in section 3.3). Table 20 shows the
results of the regressions to assess the presence of reference bias. The structure of the table is the same
as that of Table 16. However, in this case there are two samples. One sample (top panel) includes all the
siblings reported by respondents. It includes respondents’ siblings in the school attended by the
respondent and who therefore may have interacted with fellows. The other sample (bottom panel) only
includes siblings who do not attend the school of the respondent. We assume that siblings in this second
sample did not interact with fellows. We do not find evidence of reference bias. In the top panel there
are no significant estimates. In the bottom panel there is only one significant estimate. It is important to
mention that the five items of the social awareness scale shown at the bottom of Table 20 do not show
evidence of reference bias. Thus, the negative estimates for that scale in Table 16 cannot be attributed
to this type of bias.

39
Table 20. Reference bias estimates
Estimates in bold type and shaded are significant at 95% confidence. p-values in parentheses.
7 Discussion of findings
The impact evaluation presented here constitutes an unprecedented effort in the measurement of
socioemotional skills in Mexico and in the Teach For All network. We visited (twice) 1,194 classrooms in
328 schools across four states, and collected 56,516 student surveys and 833 instructor surveys.
There are three reasons to be cautious when interpreting the results. First, the evaluation is quasi-
experimental. It relies on the assumption that the trends in the metrics of impact absent the treatment
would have been the same in the treatment and control groups. Second, the estimates are limited to
the short-run (one academic year) and one semester or year of exposure to fellows. The evaluation is
silent about what would happen with multi-year follow ups of students or with a longer exposure to
fellows. Third, the partnerships between Enseña por México and local educational authorities to deploy
the fellows are very idiosyncratic. Fellows in some states assume roles that greatly differ from roles

40
assumed in other states—CONAFE schools in Chiapas and Hidalgo are a clear example. Extrapolating the
results in such context may not be entirely appropriate.
The main lessons from the evaluation can be summarized in three points. First, Enseña por México
fellows differ from regular teachers in their teaching values and attitudes. Fellows give more importance
to developing student curiosity. They think it is more important for students to set ambitious goals.
Fellows engage in extracurricular activities, use evaluations, and give feedback to students to a larger
extent than regular teachers. In terms of the Big Five personality traits, fellows are more open to new
experiences, more extraverted, and more agreeable. Fellows score between 0.15 and 0.30 standard
deviations higher than regular teachers in the seven TSS scales of effective teaching, a set of scales
based on student surveys that are predictive of students’ academic achievement.
Second, taking together the main estimates and the estimates considering (a) a single metric, (b)
heterogeneity in intensity and (c) treatment fidelity, the image that emerges is that exposure to fellows
is associated with modest short-run improvements in socioemotional skills in Secundaria, as measured
by the CORE scales: self-management, growth mindset, self-efficacy and social awareness. There is also
evidence of a reduction in tardiness and absenteeism in all educational levels. In general, the
magnitudes are modest—the main estimates are below 0.15 standardized units. These results are in line
with evaluations of Teach For America (Backes and Hansen, 2017) and Enseña Chile (Alfonso, Santiago
and Bassi, 2010). Based on our analysis of potential reference bias, we conclude this is likely not an issue
in the estimates we present.
Third, accounting for heterogeneity in treatment intensity produces more estimates of improvements in
Secundaria. We interpret this finding as indicative of a window of greater potential impact on students
in their early teens (grades 7-9) relative to older teenagers (grades 10-12). It also suggests that Enseña
por México could gain from sending more fellows to fewer schools—increasing the intensive margin of
the program at the expense of the extensive margin.
In sum, the results indicate that Enseña por México fellows are more effective than regular teachers,
and they help foster student socioemotional skills. The Teach For All network as well as other
organizations and government programs may derive valuable lessons for their own agendas based on
this path-breaking effort. To our knowledge, this is the first large-scale impact evaluation focused on
socioemotional skills in Mexico. It provides an instance of how socioemotional learning can be measured
for impact evaluation purposes, and how socioemotional scales are associated with behaviors and
attitudes predictive of better academic achievement and greater educational attainment. The
evaluation also speaks on the crucial question of malleability. The results indicate that socioemotional
skills are malleable: exposure to Enseña por México fellows is associated with increases in some of the
socioemotional scales analyzed. Ahead lies a path of further research and evaluation to expand our
understanding of how socioemotional learning can be more effectively fostered. This study may be just
scratching the surface.

41
References
Alfonso, M., Santiago, A. & Bassi. 2010. Estimating the Impact of Placing Top University Graduates in
Vulnerable Schools in Chile. Inter-American Development Bank, Education Division, Technical Notes,
No. IDB-TN-230.
Allen, R. and Allnutt, J. 2017. The impact of Teach First on pupil attainment at age 16. British Educational
Research Journal, 43: 627–646.
Antecol, H., Eren, O., & Ozbeklik, S. 2013. The effect of Teach for America on the distribution of student
achievement in primary school: Evidence from a randomized experiment. Economics of Education
Review 37, 113-125.
Arocha, M.J. & Ledezma, L.E. 2007. Construcción, Validación y Confiabilidad de un Inventario de Locus
de Control Académico (ILC-A). Revista Iberoamericana de Diagnóstico y Evaluación, Nº 24, Vol. 2, pp.
151–175.
Backes, B. & Hansen M. 2017. The Impact of Teach for America on Non-Test Academic Outcomes,
Education Finance and Policy. Benjamini, Y., & Hochberg, Y. 1995. Controlling the false discovery rate: A practical and powerful
approach to multiple testing. Journal of the Royal Statistical Society Series B Methodological, 57(1),
289–300.
Bill & Melinda Gates Foundation. 2012. Asking Students about Teaching. Student Perception Surveys and
Their Implementation.
Blackwell, M., Iacus, S., King, G., & Porro, G. 2009. cem: Coarsened exact matching in Stata”, The Stata
Journal 9, Number 4, pp. 524–546.
Brown, A. & Maydeu-Olivares, A. 2018. Modeling forced-choice response formats. In Irwing, P., Booth, T.
& Hughes, D. (Eds.), The Wiley Handbook of Psychometric Testing. London: John Wiley & Sons.
Blazar, D. & Kraft, M.A. 2017. Teacher and Teaching Effects on Students’ Attitudes and Behaviors.”
Educational Evaluation and Policy Analysis, 39, 146-170.
Chacón, A. & Peña, P.A. 2015. A Cross-Sectional Impact Evaluation of Enseña por México in High Schools
of the State of Puebla. Microanalitica.
Chacón, A. & Peña, P.A. 2016. Evaluación de desempeño de los Profesionales Enseña por México. Una
comparación de corte transversal. Microanalitica.
Chiang, H. S., Clark, M. A. and McConnell, S. 2017. Supplying Disadvantaged Schools with Effective
Teachers: Experimental Evidence on Secondary Math Teachers from Teach For America. J. Pol. Anal.
Manage., 36: 97–125.
Doolittle, A., & Faul, A. C. 2013. Civic Engagement Scale: A Validation study. Sage Open Journal, 3, 1-7.
Duckworth, A. L., Peterson, C., Matthews, M. D., & Kelly, D. R. (2007). Grit: Perseverance and passion for
long-term goals. Journal of Personality and Social Psychology, 92(6), 1087-1101.
Duckworth. A.L. & Quinn, P.D. 2009. Development and Validation of the Short Grit Scale (Grit–S), Journal
of Personality Assessment, 91:2, 166-174
Duckworth, A.L. & Yeager, D.S. 2015. Measurement Matters: Assessing Personal Qualities Other Than
Cognitive Ability for Educational Purposes, Educational Researcher Vol 44, Issue 4, pp. 237-251

42
Farrington, C.A., Roderick, M., Allensworth, E., Nagaoka, J., Keyes, T.S., Johnson, D.W., & Beechum, N.O.
2012. Teaching adolescents to become learners. The role of noncognitive factors in shaping school
performance: A critical literature review. Chicago: University of Chicago Consortium on Chicago
School Research.
Glazerman, S., Mayer, D. & Decker, P. 2006. Alternative routes to teaching: The impacts of Teach for
America on student achievement and other outcomes, Journal of Policy Analysis and Management,
Volume 25, Issue 1, Winter, Pages 75–96.
Gertler, P.J., Martinez, S., Premand, P., Rawlings, L.B., Vermeersch, C.M.J. 2011. Impact Evaluation in
Practice, First Edition. World Bank.
Goldberg, L. R. (1993). The structure of phenotypic personality traits. American Psychologist, 48(1), 26-
34.
Heckman, J.J., Stixrud, J. & Urzua, S. 2006. The Effects of Cognitive and Noncognitive Abilities on Labor
Market Outcomes and Social Behavior. Journal of Labor Economics 24 (3): 411–48.
Jackson, C.K. 2016. What Do Test Scores Miss? The Importance of Teacher Effects on Non-Test Score
Outcomes. NBER Working Paper No. 22226.
Jennings, J.L. & DiPrete, T.A. 2010. Teacher Effects on Social and Behavioral Skills in Early Elementary
School." Sociology of Education, 83, 135-159.
John, O.P. & Srivastava, S. 1999. The Big Five Trait Taxonomy: History, measurement, and Theoretical
Perspectives. Handbook of Personality, Second Edition: Theory and Research. Lawrence A. Pervin,
Oliver P. John, Elsevier.
Kane, T.J., McCaffrey, D.F., Miller, T. & Staiger, D.O. 2013. Have We Identified Effective Teachers?
Validating Measures of Effective Teaching Using Random Assignment. MET Project Research Paper.
Kane T.J., Rockoff J.E., Staiger D.O. 2008. What does certification tell us about teacher effectiveness?
Evidence from New York City. Economics of Education Review, 27, 615-631.
Kraft, M.A. 2017. Teacher Effects on Complex Cognitive Skills and Social-Emotional Competencies.
Brown University.
Kyllonen P.C. & Bertling J. P. 2013. Innovative questionnaire assessment methods to increase cross-
country comparability. In Rutkowski L., von Davier M., Rutkowski D. (Eds.), Handbook of
international large-scale assessment: Background, technical Issues, and methods of data analysis
(pp. 277-285). London, England: Chapman & Hall.
Ladd, H.F. & Sorensen, L.C. 2017. Returns to Teacher Experience: Student Achievement and Motivation
in Middle School. Education Finance and Policy.
Meade, A.W. 2004. Psychometric problems and issues involved with creating and using ipsative
measures for selection. Journal of Occupational and Organizational Psychology 77(4):531-551.
OECD. 2017. Education at a Glance 2017: OECD Indicators, OECD Publishing, Paris.
OECD. 2014. TALIS 2013 Technical Report.
Peña, P.A. 2016. Personality and Financial Culture: A Study of Mexican Youths, International Handbook
of Financial Literacy, Springer, pp. 465-493.
Rammstedt, B. & John, O.P. 2007. Measuring personality in one minute or less: A 10-item short version
of the Big Five Inventory in English and German. Journal of Research in Personality, Volume 41, Issue
1, pp. 203-212.

43
Rotter, J.B. 1966. Generalized Expectancies for Internal Versus External Control of Reinforcement.
Psychological Monographs: General and Applied. Vol. 80, No. 1, pp. 1-28.
Ruzek, E.A., Domina, T., Conley, A.M., Duncan, G.J. & Karabenick, S.A. 2014. Using value-added models
to measure teacher effects on students’ motivation and achievement,” The Journal of Early
Adolescence, 1-31.
Sánchez Puerta, M.L., Valerio, A. & Gutiérrez Bernal, M. 2016. Taking Stock of Programs to Develop
Socioemotional Skills: A Systematic Review of Program Evidence. Directions in Development—
Human Development. Washington, DC: World Bank.
West, M.R. 2016. Should non-cognitive skills be included in school accountability systems? Preliminary
evidence from California’s CORE districts. Economics Studies at Brookings. Evidence Speaks Reports,
1(13).
Xu, Z., Hannaway, J., & Taylor, C. 2011. Making a difference? The effects of Teach For America in high
school. Journal of Policy Analysis and Management, 30(3), 447-469.