Embed Size (px)
Citation preview

213 THE IMPACT OF EXCHANGE RATE FLUCTUATIONS ON PROFIT MARGINS
Journal of Applied Economics. Vol X, No. 1 (May 2007), 213-235
THE IMPACT OF EXCHANGE RATE FLUCTUATIONS ONPROFIT MARGINS: THE UK CAR MARKET, 1971-2002
FRANCISCO REQUENA-SILVENTE ∗
University of Valencia
JAMES WALKER
University of Reading
Submitted October 2004; accepted March 2005
We investigate the impact on profit margins of exchange rate fluctuations in order to examineoptimal pricing policy by source countries in the UK car market. We first estimate a nestedlogit demand model of new cars to calculate model-specific profit margins. Next we use theseestimates to analyse the pricing-to-market (PTM) behaviour of car importers and local producers.The results show that: (1) profit margins fell over the period 1971-2002 as the UK car marketmoved from being a concentrated market to a looser oligopoly structure; (2) there is a positiveassociation between exchange rate changes and mark-up adjustments of imported cars. Followinga 10% pound depreciation, exporters’ profit margins declined by up to 4% and local producers’profit margins increased by up to 2%; (3) PTM behaviour is asymmetric between appreciationsand depreciations in bilateral exchange rates.
JEL classification codes: L2, L6Key words: exchange rates, markup adjustment, pricing to market, cars
I. Introduction
The degree of price discrimination in the UK car market has been a source of
considerable ongoing debate. Consumer advocacy groups have been outspoken
∗ Francisco Requena-Silvente (corresponding author): Department of Economics, Universityof Valencia, e-mail [email protected]. James Walker, CIBH, Department of Management,Business School, University of Reading. We thank the co-editor Jorge M. Streb, two referees,ETSG VI Annual Meeting (Nottingham, 2004), Jornadas de Economía Industrial (Granada,2004), Frontier Economics (London, 2004) and XXIX Simposio de Análisis Económico(Pamplona, 2004) for valuable comments. The findings, interpretations and conclusions inthis paper are entirely our responsibility. Francisco Requena acknowledges financial supportfrom the Generalitat Valenciana, through projects GRUPOS03/151 and GV06/324.
JOURNAL OF APPLIED ECONOMICS214
in their criticism of the pricing policy of car makers in the UK and from continental
Europe (BEUC: 1981, 1989, 1992). Academic research has also provided evidence
that price discrimination has occurred in the UK market (Cubbin 1975; Verboven
1996; Goldberg and Verboven, 2001). Price discrimination in the UK car market has
also evoked scrutiny of the market by regulatory authorities both within the UK
(House of Lords 1984; Monopolies and Mergers Commission 1992) and from the
European Commission (EC 2000, 2004; Verboven and Degryse 2000). The industry,
through its representative body, the Society of Motor Manufacturers and Traders,
have vigorously argued discrimination is not at work citing currency movements
as being responsible for substantial departures from prices charged for cars in
Continental Europe (Competition Commission (UK) 1999). The industry’s argument
feeds into a substantial literature in observing that the local currency prices of
imported goods are often insensitive to exchange-rate changes. On theoretical
grounds, this phenomenon is often referred to as “pricing-to-market” (PTM) and
reflects the view that exporters reduce their profit margins when faced with a
depreciation against their own currency in order to stabilise the prices in destination
currency (Krugman 1987).
An extensive body of literature has grown concerning the PTM phenomenon.1
These studies suggest that pricing-to-market is a global phenomenon but that the
main source of variation in their pattern is at the industry level (Knetter 1993) being
most pervasive in differentiated product markets (Froot and Klemperer 1988; Knetter
1993, 1995; Marston 1990; Kasa 1992). Indeed, the finding that PTM is more important
in differentiated product markets is reassuring since the ability firms have to segment
markets through the imperfect substitutability of their products underlie violations
in the “law of one price” in models of imperfect competition in international markets.
As a substantive global industry and quintessential differentiated product, cars
have been the most favoured market used to examine the extent of PTM behaviour
(Le Cacheux and Reichlin 1992; Feenstra 1989; Kirman and Schueller 1990; Gagnon
and Knetter 1995; Goldberg 1995; Irandoust 1998; Gross and Schmitt 2000; Goldberg
and Verboven 2001; Gil-Pareja 2003).
In itself the UK car market is an interesting case study. The ability of firms to
price discriminate at the beginning of the seventies was reflected in the UK market
1 Knetter and Goldberg (1997) provide an excellent survey of the PTM literature.
215 THE IMPACT OF EXCHANGE RATE FLUCTUATIONS ON PROFIT MARGINS
being a cosy oligopoly: being founded on four manufacturers, whose production
was based in the UK who were insulated from imports, through trade restrictions,
and from exchange rate movements, by the Breton Woods fixed exchange rate
regime.2 By 2002 the market had witnessed considerable regulatory scrutiny and a
number of direct initiatives including: British accession into the (then) EEC in
1973; intensifying pressure on manufacturers by consumer groups since the 1980s;
the completion of the Single Market Programme in 1 January 1993, and the
curtailment of Voluntary Export Restraints (VERs) on Japanese makers in December
1999, which were enforced since June 1977. Each of these factors may have
contributed to reduce the degree of discrimination in an increasingly fragmented
UK market.
Following Knetter (1989, 1993), past research has applied reduced form pricing
models to investigate the impact of exchange rate fluctuations on source currency
prices and has attempted to control for unobserved cost differences via the inclusion
of intercept terms (to capture changes in marginal costs or common profit margin
changes across source destinations) and a set of time dummies (to capture common
marginal cost or profit margins changes over time).
We take a different approach by directly estimating the impact on profit margins
of a change in exchange rates. First, we estimate a structural model of demand to
calculate model-specific price elasticities. Second, we calculate model-specific profit
margins (Lerner indices) expressed in local currency using information on prices,
market shares and the estimated price elasticities. This approach has two advantages
over previous research: (1) we do not require information about source-country
prices since mark-ups are fully determined in the destination market; (2) we can
model important features of the market, such as the multi-product nature of firms
operating in the market and the product differentiated nature of the products. As
will be shown in the analysis, explicitly modeling the multi-product nature of the
car market implies substantive differences in firm’s mark-up behavior and so is a
non-trivial issue. Finally, we examine the impact of exchange rate fluctuations on
the model-specific profit margins: (1) How much do profit margins respond to
exchange rate fluctuations? (2) Are all source-countries equally responsive to
their bilateral exchange rate fluctuations? (3) Is there any evidence of asymmetric
2 These four car makers were Ford UK, GM Vauxhall, Chrysler UK and British Leyland.
JOURNAL OF APPLIED ECONOMICS216
behaviour in the exchange rate pass-through, that is, do profit margins respond
differently when the local currency appreciates than when the local currency
depreciates? (4) Do local producers’ profit margins also respond to exchange rate
fluctuations? (5) Did voluntary export restraints have any effect on Japanese profit
margins’ response to fluctuations in exchange rates?
To preview results, profit margins over the period 1971-2002 fell as the UK car
market moved from being characterised by a high degree of concentration to a
considerably more fragmented oligopoly structure. The results indicate that
manufacturers have implemented a ‘pricing-to-market’ policy in the UK as exporters
reduce (increase) profit margins for foreign car models whose currencies have
appreciated (depreciated) against the pound. On the one hand, the magnitude of
the exchange rate pass through is different across countries and, on the other
hand, importers exhibit asymmetric PTM behaviour with mark-ups adjustment being
more pronounced during pound appreciation periods than when the pound
depreciated. Another result is that local producers are also sensitive to exchange
rate fluctuations. For example, following a depreciation of the pound, the profit
margin of the non-Japanese domestic makers increased by up to 2%. We also find
some evidence that voluntary export restraints for Japanese cars were binding.
The remainder of the paper is organised as follows. Section II describes the
data and salient trends in the supply location of cars marketed in the UK. Section
III presents a structural model of demand to estimate model-specific profit margins
in a differentiated-product industry and relates profit margin changes to exchange
rate changes. The results from model estimations are presented and interpreted in
Section IV, and Section V provides concluding remarks.
II. Data and trends in the supply location of cars marketed in theUK
A. Data
We have collected annual data on prices and sales, for all new models of cars
sold in the UK car market between 1971 and 2002. The highly differentiated nature
of products marketed by firms was captured by employing a rich set of product
attributes (power, size, fuel consumption and set of dummy variables that takes
value of one if the car specification includes: diesel engine, fuel injection, turbo
217 THE IMPACT OF EXCHANGE RATE FLUCTUATIONS ON PROFIT MARGINS
3 We use monthly industry publications to find out the month(s) in which the price of a modelchanged to convert retail prices in units of the exporter’s currency. On average firms changetheir price twice a year, with the larger changes being later in the year. Annual nominalexchange rates are calculated as the average of the end-of-the month exchange rate.
charging, air conditioning, ABS, PAS and air bags). We also collated the month of
entry and exit in the market, when prices changed during the year and the source-
country of production of each model. The product data set is merged with bilateral
exchange rates for each of the countries that supply cars in the UK car market.3
Further details concerning the construction and sources of the variables, as well
as their related descriptive statistics, are provided in Appendix 1.
B. The supply of cars by production location and exchange rate fluctuations
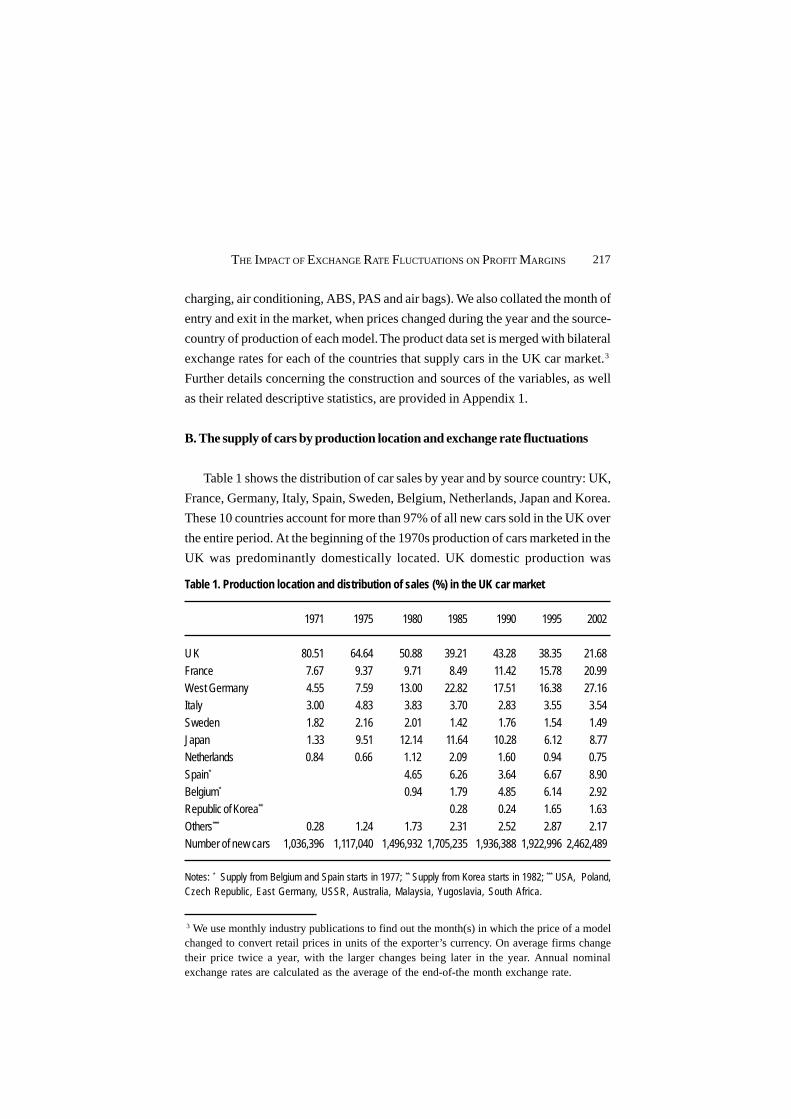
Table 1 shows the distribution of car sales by year and by source country: UK,
France, Germany, Italy, Spain, Sweden, Belgium, Netherlands, Japan and Korea.
These 10 countries account for more than 97% of all new cars sold in the UK over
the entire period. At the beginning of the 1970s production of cars marketed in the
UK was predominantly domestically located. UK domestic production was
Table 1. Production location and distribution of sales (%) in the UK car market
1971 1975 1980 1985 1990 1995 2002
UK 80.51 64.64 50.88 39.21 43.28 38.35 21.68
France 7.67 9.37 9.71 8.49 11.42 15.78 20.99West Germany 4.55 7.59 13.00 22.82 17.51 16.38 27.16Italy 3.00 4.83 3.83 3.70 2.83 3.55 3.54
Sweden 1.82 2.16 2.01 1.42 1.76 1.54 1.49Japan 1.33 9.51 12.14 11.64 10.28 6.12 8.77Netherlands 0.84 0.66 1.12 2.09 1.60 0.94 0.75
Spain* 4.65 6.26 3.64 6.67 8.90Belgium* 0.94 1.79 4.85 6.14 2.92Republic of Korea** 0.28 0.24 1.65 1.63
Others*** 0.28 1.24 1.73 2.31 2.52 2.87 2.17Number of new cars 1,036,396 1,117,040 1,496,932 1,705,235 1,936,388 1,922,996 2,462,489
Notes: * Supply from Belgium and Spain starts in 1977; ** Supply from Korea starts in 1982; *** USA, Poland,Czech Republic, East Germany, USSR, Australia, Malaysia, Yugoslavia, South Africa.
JOURNAL OF APPLIED ECONOMICS218
dominated by a group of three multinational operations, Ford UK, GM Vauxhall,
Chrysler UK, and the last remaining UK mass producer, British Leyland (later
Rover Group), with sales being roughly split between these two groups. By 2002
the location of production of cars sold in the UK had radically shifted. Less than
one quarter of market sales stemmed from local production, with sales of cars
emanating from West Germany eclipsing those in the UK, and the fraction of sales
from France following close behind those produced in the UK. The reduced
domestic production share in sales also reflected an expansion in market share by
Asian manufacturers, initially via a rapid expansion in sales by Japanese
manufacturers prior to the formalisation of Voluntary Export Restrictions agreements
in 1977, but also to a lesser extent due to the entry of Korean producers. The firm
distribution of UK production also shifted radically with the four firms that had
dominated domestic production capturing an ever diminishing share of UK
production. Chrysler UK was an early victim, exiting the UK market in 1979, with
Chrysler’s UK brands being discontinued by Chrysler Europe’s acquirer, PSA
Peugeot-Citroën by 1986. Rover Group sales have fallen precipitously to account
for a mere 4 percent of domestic sales in 2002, while Ford UK’s car production
peaked in 1972 and ended in 2002, and GM Vauxhall expanded UK production until
1992, from which time the firm’s production has more than halved. The market
shifted from being a concentrated domestically based oligopolistic structure to
one where a larger number of firms have carved out significant shares of the
market. This alteration in market structure suggests that firm’s ability to discriminate
within the market may have declined over time.4
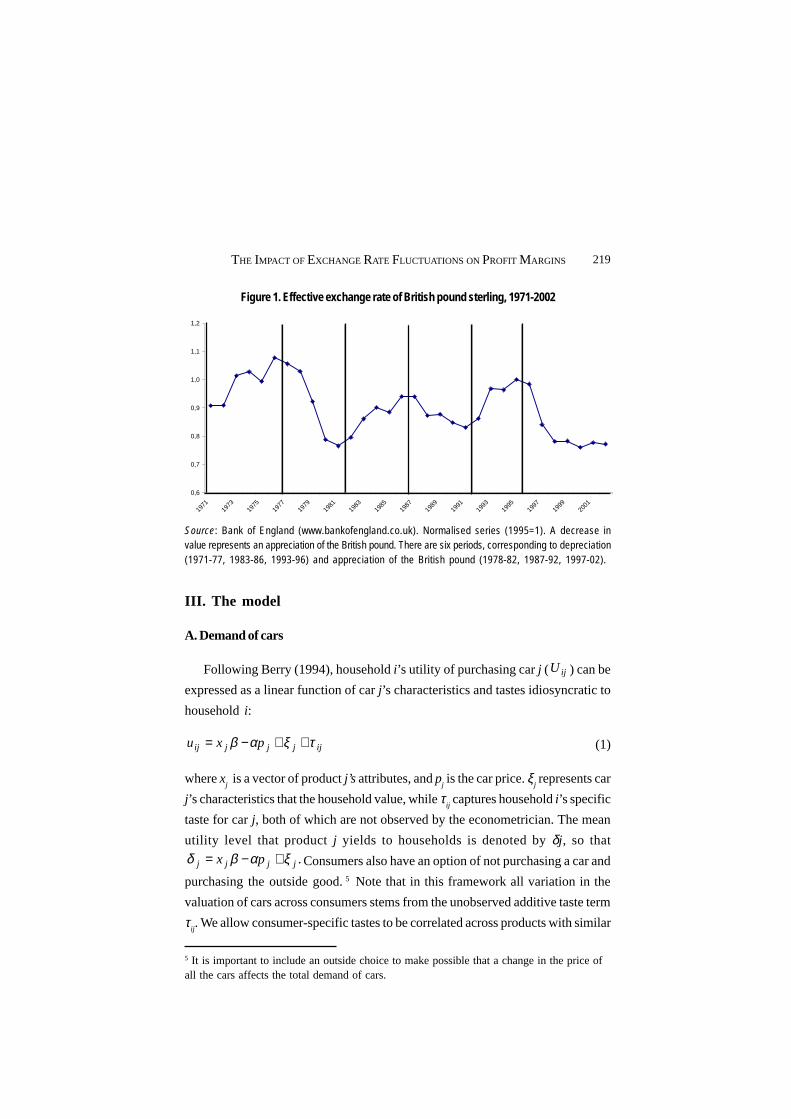
The volatile nature of UK’s exchange rates between domestic and source
currencies provided foreign manufacturers with ample opportunity to PTM. In
each of the three decades we investigate the Sterling experienced dramatic swings
against car manufacturers’ local currencies. In 1973 and 1993, the pound, expressed
as a real effective exchange rate, lost more than 10% of its value; in 1980 and 1997
the pound experienced an appreciation of 17% and 18%, respectively as is depicted
in Figure I. While annual movements have been quite volatile they followed a
strong cyclical pattern with three pairs of prolonged exchange rate shifts occurring
over the period: pound depreciations between 1971-76, 1982-86 and 1992-95; and
pound appreciations between 1978-82, 1987-1991 and 1996-2002.
4 Firm concentration, as measured by the Herfindahl index, has fallen from 0.049 in 1971 to0.021 by 2002.
219 THE IMPACT OF EXCHANGE RATE FLUCTUATIONS ON PROFIT MARGINS
Figure 1. Effective exchange rate of British pound sterling, 1971-2002
0,6
0,7
0,8
0,9
1,0
1,1
1,2
1971
1973
1975
1977
1979
1981
1983
1985
1987
1989
1991
1993
1995
1997
1999
2001
Source: Bank of England (www.bankofengland.co.uk). Normalised series (1995=1). A decrease invalue represents an appreciation of the British pound. There are six periods, corresponding to depreciation(1971-77, 1983-86, 1993-96) and appreciation of the British pound (1978-82, 1987-92, 1997-02).
III. The model
A. Demand of cars
Following Berry (1994), household i’s utility of purchasing car j ( ijU ) can be
expressed as a linear function of car j’s characteristics and tastes idiosyncratic to
household i:
ijjjjij pxu τξαβ ++−= (1)
where xj is a vector of product j’s attributes, and p
j is the car price. ξ
j represents car
j’s characteristics that the household value, while τij captures household i’s specific
taste for car j, both of which are not observed by the econometrician. The mean
utility level that product j yields to households is denoted by δj , so that
.jjjj px ξαβδ +−= Consumers also have an option of not purchasing a car and
purchasing the outside good. 5 Note that in this framework all variation in the
valuation of cars across consumers stems from the unobserved additive taste term
τij. We allow consumer-specific tastes to be correlated across products with similar
5 It is important to include an outside choice to make possible that a change in the price ofall the cars affects the total demand of cars.
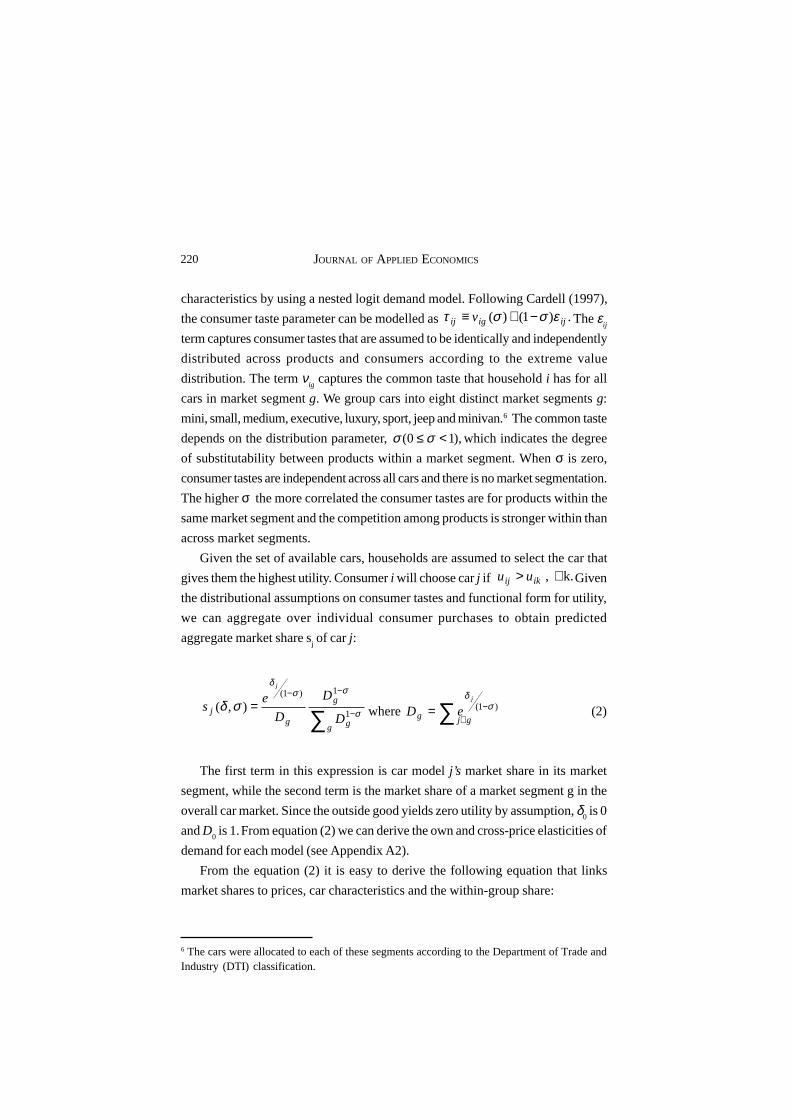
JOURNAL OF APPLIED ECONOMICS220
characteristics by using a nested logit demand model. Following Cardell (1997),
the consumer taste parameter can be modelled as .)1()( ijigij v εσστ −+≡ The εij
term captures consumer tastes that are assumed to be identically and independently
distributed across products and consumers according to the extreme value
distribution. The term νig captures the common taste that household i has for all
cars in market segment g. We group cars into eight distinct market segments g:
mini, small, medium, executive, luxury, sport, jeep and minivan.6 The common taste
depends on the distribution parameter, ),10( <≤ σσ which indicates the degree
of substitutability between products within a market segment. When σ is zero,
consumer tastes are independent across all cars and there is no market segmentation.
The higher σ the more correlated the consumer tastes are for products within the
same market segment and the competition among products is stronger within than
across market segments.
Given the set of available cars, households are assumed to select the car that
gives them the highest utility. Consumer i will choose car j if k. , ∀> ikij uu Given
the distributional assumptions on consumer tastes and functional form for utility,
we can aggregate over individual consumer purchases to obtain predicted
aggregate market share sj of car j:
∑ −
−−=
g g
g
gj
D
D
D
es
j
σ
σσδ
σδ1
1)1(
),( where ∑ ∈−=
gjg
j
eD )1( σδ
(2)
The first term in this expression is car model j’s market share in its market
segment, while the second term is the market share of a market segment g in the
overall car market. Since the outside good yields zero utility by assumption, δ0 is 0
and D0 is 1. From equation (2) we can derive the own and cross-price elasticities of
demand for each model (see Appendix A2).
From the equation (2) it is easy to derive the following equation that links
market shares to prices, car characteristics and the within-group share:
6 The cars were allocated to each of these segments according to the Department of Trade andIndustry (DTI) classification.

221 THE IMPACT OF EXCHANGE RATE FLUCTUATIONS ON PROFIT MARGINS
jgjjjj SpxSS ξσαβ ++−=− /0 lnlnln (3)
where Sj is the observed market share of product j, S
0 is the observed market share
of the outside good - in our case, following Berry, Levinsohn and Pakes (1995) and
others, the total potential market consists of all households in a given year - Sj|g
is
the observed market share of product j within its market segment g, xj is a vector
of observable attributes of car j, Pj is the price of car j and ξ
j represents the
unobservable attributes of car j such as (unobserved) quality, prestige or reliability.
This straightforward linear equation can be used to obtain the structural parameters
of demand (α, σ).
B. The pricing-to-market equation
We assume that the industry competes in a Bertrand oligopoly setting of pricing
behaviour.7 Car makers market several models in a foreign destination market. In
each period (omitting time subscripts), firm f maximizes its profits given by:
Mpscep jFj
jjf
f
)()(∑∈
−=π (4)
where p is the export price (expressed as price in the importer’s currency); sj (p) is
the product jth market share (a function of the price vector p in the importer’s
currency) and M is (exogenous) market size; e is the exchange rate (in units of the
exporter’s currency per unit of the importer’s currency); and cj is the product’s
marginal cost. The profit function accounts for the fact that car makers are multi-
product firms that simultaneously offer several products to the market at any one
point in time. When a car maker considers lowering a price of one of its products,
this will not only have the effect of reducing the market share of other rivals’
products, but may also undercut the sales of its own other products. Hence we
should explicitly capture the fact that a multi-product car maker might lower its
prices by less than in a situation when it only sells one product.
Assuming that firms compete in prices, the first-order conditions for profit
maximizing firm f with respect to product k yield:
7 The assumption of price setting behaviour in the car market is common (Goldberg andVerboven, 2001) and consistent with industry wisdom.
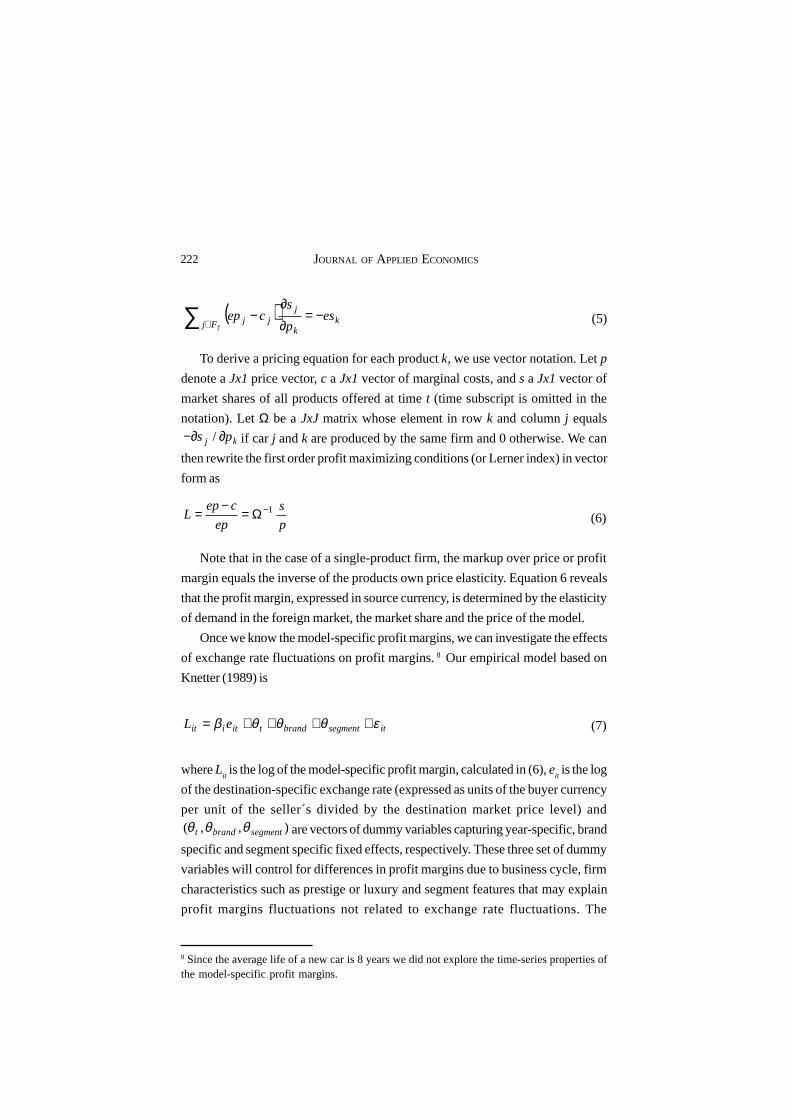
JOURNAL OF APPLIED ECONOMICS222
( )∑ ∈−=
∂
∂−
fFj kk
jjj es
p
scep (5)
To derive a pricing equation for each product k, we use vector notation. Let p
denote a Jx1 price vector, c a Jx1 vector of marginal costs, and s a Jx1 vector of
market shares of all products offered at time t (time subscript is omitted in the
notation). Let Ω be a JxJ matrix whose element in row k and column j equals
kj ps ∂−∂ / if car j and k are produced by the same firm and 0 otherwise. We can
then rewrite the first order profit maximizing conditions (or Lerner index) in vector
form as
p
s
ep
cepL 1−Ω=
−= (6)
Note that in the case of a single-product firm, the markup over price or profit
margin equals the inverse of the products own price elasticity. Equation 6 reveals
that the profit margin, expressed in source currency, is determined by the elasticity
of demand in the foreign market, the market share and the price of the model.
Once we know the model-specific profit margins, we can investigate the effects
of exchange rate fluctuations on profit margins. 8 Our empirical model based on
Knetter (1989) is
itsegmentbrandtitiit eL εθθθβ ++++= (7)
where Lit is the log of the model-specific profit margin, calculated in (6), e
it is the log
of the destination-specific exchange rate (expressed as units of the buyer currency
per unit of the seller´s divided by the destination market price level) and),,( segmentbrandt θθθ are vectors of dummy variables capturing year-specific, brand
specific and segment specific fixed effects, respectively. These three set of dummy
variables will control for differences in profit margins due to business cycle, firm
characteristics such as prestige or luxury and segment features that may explain
profit margins fluctuations not related to exchange rate fluctuations. The
8 Since the average life of a new car is 8 years we did not explore the time-series properties ofthe model-specific profit margins.
223 THE IMPACT OF EXCHANGE RATE FLUCTUATIONS ON PROFIT MARGINS
interpretation of the coefficient on the exchange rate variable, β1, is derived from
Knetter (1989). The β1 measure the destination-specific response of profit margins
to destination-specific changes in exchange rates. A value of β1 equal to zero
means that the mark-up to a particular destination is independent of fluctuations in
the value of the seller’s currency against the buyer’s. This implies that changes in
currency values are fully passed through to the buyer. Negative values of β1
indicate that mark-up adjustment is associated with stabilization of local currency
prices. Positive values of β1 imply that destination-specific mark-ups change in a
way which amplifies the effect of destination-specific exchange-rate changes on
the price in terms of the buyer’s currency.
IV. Econometric issues and results
A. Demand and profit margin results
The estimation of the demand equation (3) presents one econometric problem.
Its estimation by OLS will yield inconsistent estimates if car prices and within-
group market share (Sj|g) are correlated with unobserved quality (ξj). We address
the problem by estimating this equation using instrumental variable methods. We
make use of the instruments usually used in this literature: (1) location of production
dummies; (2) the number of models that a firm sells; (3) the number of models sold
by rival firms within each market segment; (4) the characteristics of the rival cars
averaged over models within each market segment. The key identifying assumptions
is that cost of production, rival product attributes and intensity of competition
measures are not correlated with unobserved quality. 9
Table 2 displays the estimation results. Columns 1 and 2 report the OLS estimates
of the demand parameters, while Column 3 reports the two-stage least squares
estimates. In order to evaluate the performance of the instruments, we report the F-
test of joint significance of the instruments of the regression of prices and segment
market shares on the exogenous variables and the instruments. We do not have a
weak instrumental problem as both F-tests are significant at 0.01 percent level.
Accounting for the endogeneity of price and within segment market share affects
9 For a detailed discussion about the validity of the selected instruments, see Berry, Levinsohnand Pakes (1995) and Bresnahan, Stern and Trajtenberg (1997) .

JOURNAL OF APPLIED ECONOMICS224
Table 2. Estimation of equation (3): Log (model market share/outside good market share)
Explanatory variables (1) (2) (3)
price (α) -0.020 *** -0.028 *** -0.049 ***(9.50) (18.89) (14.41)
segment (σ) 0.681 *** 0.331 ***(79.63) (20.02)
power -0.008 *** -0.006 *** 0.001 *
(8.66) (11.07) (1.72)size 0.009 *** 0.008 0.082 ***
(6.41) (0.01) (7.62)
mpp 0.009 *** 0.008 *** 0.007 ***(13.72) (19.50) (14.21)
inject 0.028 0.016 0.003
(0.52) (0.47) (0.09)diesel -0.578 *** -0.427 *** -0.438 ***
(5.48) (6.88) (5.43)
turbo -0.005 0.003 -0.912(0.06) (0.07) (1.29)
aircon -0.020 0.058 ** 0.148 ***
(0.29) (1.97) (2.67)abs -0.011 -0.359 -0.013
(0.17) (0.81) (0.26)
pas -0.378 *** -0.278 *** 0.185 ***(6.33) (7.01) (3.86)
airbag -0.317 *** -0.296 *** 0.179 ***
(4.05) (5.82) (2.92)constant -9.329 *** -5.913 *** -7.709 ***
(47.79) (41.60) (44.52)
R squared 0.21 0.72 0.51
Method of estimation OLS OLS IV
Period 1971-02 1971-02 1971-02
F-test (p-value) 0.00 / 0.00
Sargan test (p-value) 0.00
Number observations 4,692 4,692 4,692
Notes: t-ratios are reported in parenthesis. * Significant at the 90% level; ** Significant at the 95% level; ***Significant at the 99% level.
225 THE IMPACT OF EXCHANGE RATE FLUCTUATIONS ON PROFIT MARGINS
notably the estimated parameters. For example, the OLS estimate of the price
coefficient in Column 2 is -.028, while the IV estimate is -.049 in Column 3. These
estimates are in line with our expectation of upward bias in the OLS price coefficient.
The coefficients on other product attributes are sensible. The IV estimated value
of σ is 0.33 (compared to the OLS value of 0.68). The estimate is significantly
different from zero, which suggests that cars within the same market segment are
better substitutes for each other than cars across the market segments. The usual
interpretation for the differences between the OLS and IV results is that cars with
high unmeasured quality components will have (ceteris paribus) higher prices
and higher market shares, making price and quantity positively correlated with the
structural error term. The results provide a further indication that the instruments
we use are effective.10
10 The Sargan test for over-identifying restrictions is rejected at reasonable confidence values.The Sargan test is an omnibus specification test so there many reasons why it may be rejected.Nevo (2003) shows that it is fairly common to reject this test in models of differentiated-product demand on aggregate data.
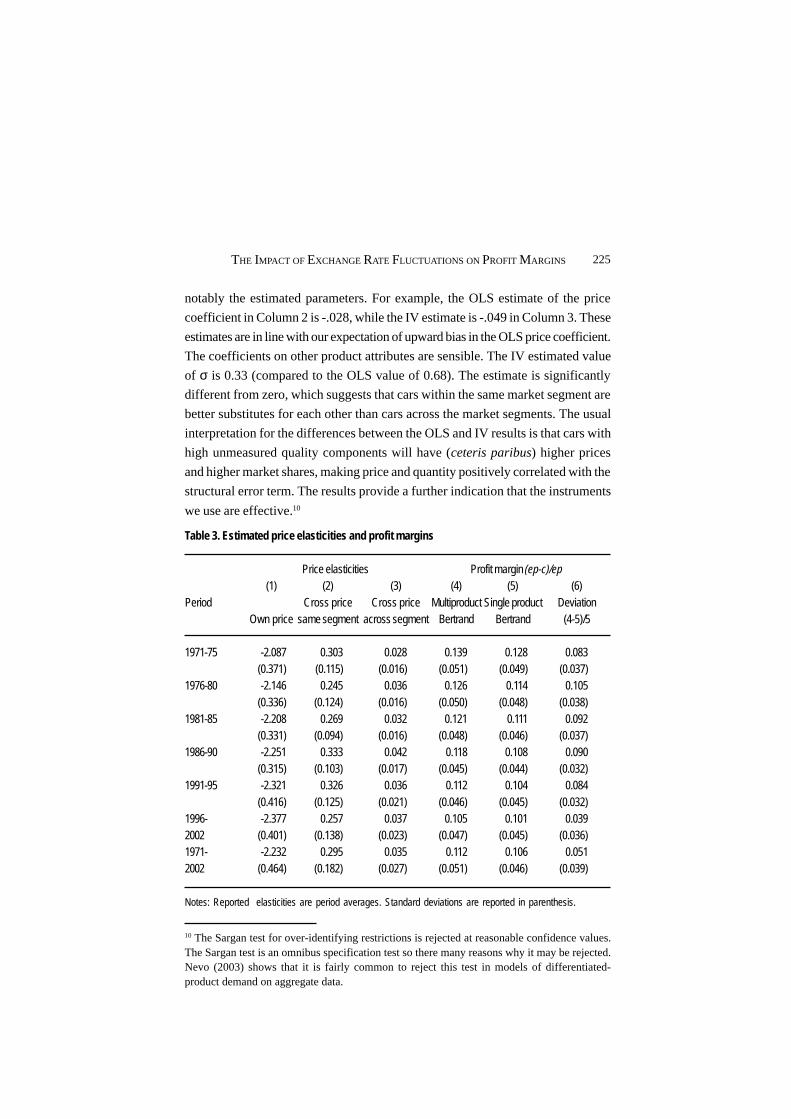
Table 3. Estimated price elasticities and profit margins
Price elasticities Profit margin (ep-c)/ep(1) (2) (3) (4) (5) (6)
Period Cross price Cross price Multiproduct Single product DeviationOwn price same segment across segment Bertrand Bertrand (4-5)/5
1971-75 -2.087 0.303 0.028 0.139 0.128 0.083(0.371) (0.115) (0.016) (0.051) (0.049) (0.037)
1976-80 -2.146 0.245 0.036 0.126 0.114 0.105(0.336) (0.124) (0.016) (0.050) (0.048) (0.038)
1981-85 -2.208 0.269 0.032 0.121 0.111 0.092(0.331) (0.094) (0.016) (0.048) (0.046) (0.037)
1986-90 -2.251 0.333 0.042 0.118 0.108 0.090(0.315) (0.103) (0.017) (0.045) (0.044) (0.032)
1991-95 -2.321 0.326 0.036 0.112 0.104 0.084(0.416) (0.125) (0.021) (0.046) (0.045) (0.032)
1996- -2.377 0.257 0.037 0.105 0.101 0.0392002 (0.401) (0.138) (0.023) (0.047) (0.045) (0.036)1971- -2.232 0.295 0.035 0.112 0.106 0.0512002 (0.464) (0.182) (0.027) (0.051) (0.046) (0.039)
Notes: Reported elasticities are period averages. Standard deviations are reported in parenthesis.
JOURNAL OF APPLIED ECONOMICS226
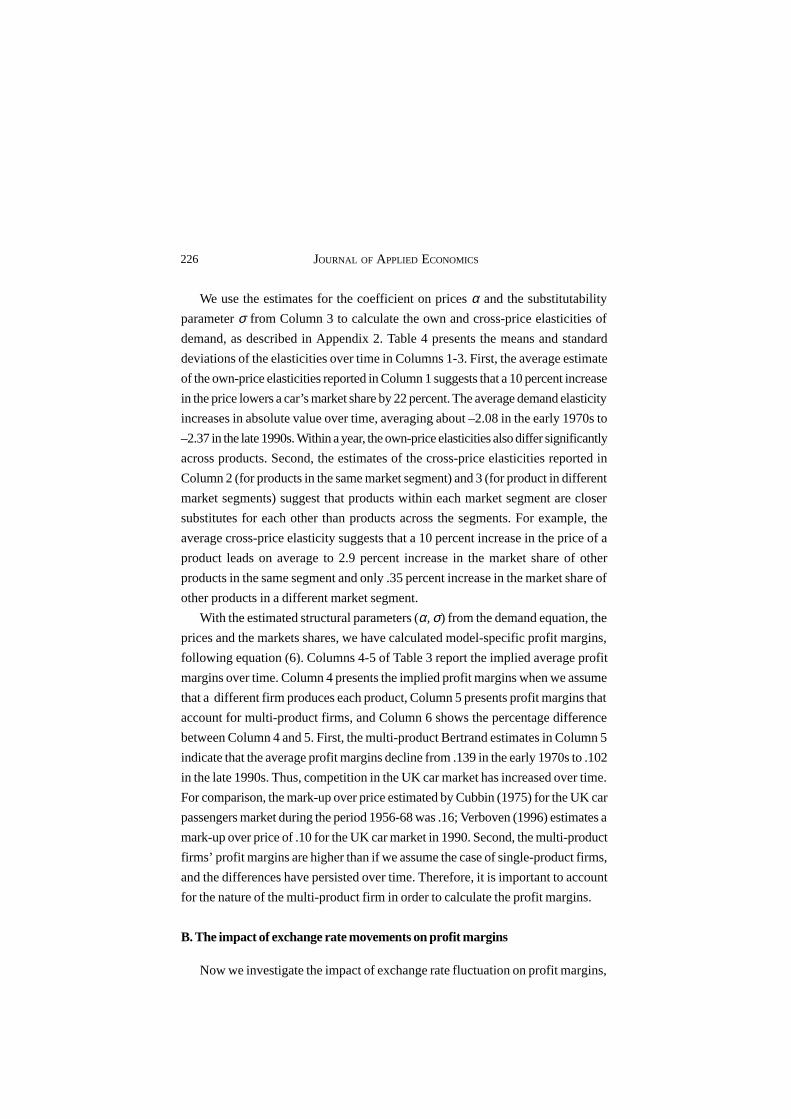
We use the estimates for the coefficient on prices α and the substitutability
parameter σ from Column 3 to calculate the own and cross-price elasticities of
demand, as described in Appendix 2. Table 4 presents the means and standard
deviations of the elasticities over time in Columns 1-3. First, the average estimate
of the own-price elasticities reported in Column 1 suggests that a 10 percent increase
in the price lowers a car’s market share by 22 percent. The average demand elasticity
increases in absolute value over time, averaging about –2.08 in the early 1970s to
–2.37 in the late 1990s. Within a year, the own-price elasticities also differ significantly
across products. Second, the estimates of the cross-price elasticities reported in
Column 2 (for products in the same market segment) and 3 (for product in different
market segments) suggest that products within each market segment are closer
substitutes for each other than products across the segments. For example, the
average cross-price elasticity suggests that a 10 percent increase in the price of a
product leads on average to 2.9 percent increase in the market share of other
products in the same segment and only .35 percent increase in the market share of
other products in a different market segment.
With the estimated structural parameters (α, σ) from the demand equation, the
prices and the markets shares, we have calculated model-specific profit margins,
following equation (6). Columns 4-5 of Table 3 report the implied average profit
margins over time. Column 4 presents the implied profit margins when we assume
that a different firm produces each product, Column 5 presents profit margins that
account for multi-product firms, and Column 6 shows the percentage difference
between Column 4 and 5. First, the multi-product Bertrand estimates in Column 5
indicate that the average profit margins decline from .139 in the early 1970s to .102
in the late 1990s. Thus, competition in the UK car market has increased over time.
For comparison, the mark-up over price estimated by Cubbin (1975) for the UK car
passengers market during the period 1956-68 was .16; Verboven (1996) estimates a
mark-up over price of .10 for the UK car market in 1990. Second, the multi-product
firms’ profit margins are higher than if we assume the case of single-product firms,
and the differences have persisted over time. Therefore, it is important to account
for the nature of the multi-product firm in order to calculate the profit margins.
B. The impact of exchange rate movements on profit margins
Now we investigate the impact of exchange rate fluctuation on profit margins,
227 THE IMPACT OF EXCHANGE RATE FLUCTUATIONS ON PROFIT MARGINS
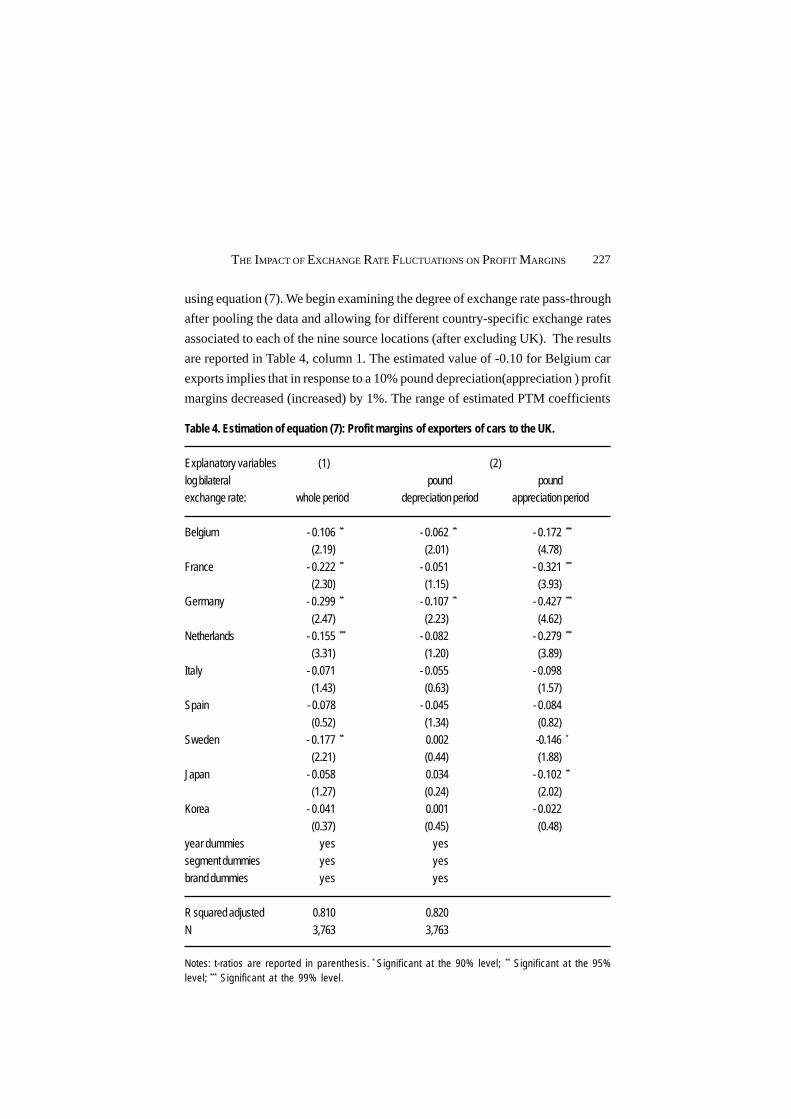
using equation (7). We begin examining the degree of exchange rate pass-through
after pooling the data and allowing for different country-specific exchange rates
associated to each of the nine source locations (after excluding UK). The results
are reported in Table 4, column 1. The estimated value of -0.10 for Belgium car
exports implies that in response to a 10% pound depreciation(appreciation ) profit
margins decreased (increased) by 1%. The range of estimated PTM coefficients
Table 4. Estimation of equation (7): Profit margins of exporters of cars to the UK.
Explanatory variables (1) (2)log bilateral pound poundexchange rate: whole period depreciation period appreciation period
Belgium - 0.106 ** - 0.062 ** - 0.172 ***
(2.19) (2.01) (4.78)
France - 0.222 ** - 0.051 - 0.321 ***
(2.30) (1.15) (3.93)Germany - 0.299 ** - 0.107 ** - 0.427 ***
(2.47) (2.23) (4.62)Netherlands - 0.155 *** - 0.082 - 0.279 ***
(3.31) (1.20) (3.89)
Italy - 0.071 - 0.055 - 0.098(1.43) (0.63) (1.57)
Spain - 0.078 - 0.045 - 0.084
(0.52) (1.34) (0.82)Sweden - 0.177 ** 0.002 -0.146 *
(2.21) (0.44) (1.88)
Japan - 0.058 0.034 - 0.102 **
(1.27) (0.24) (2.02)Korea - 0.041 0.001 - 0.022
(0.37) (0.45) (0.48)year dummies yes yessegment dummies yes yes
brand dummies yes yes
R squared adjusted 0.810 0.820
N 3,763 3,763
Notes: t-ratios are reported in parenthesis. * Significant at the 90% level; ** Significant at the 95%level; *** Significant at the 99% level.
JOURNAL OF APPLIED ECONOMICS228
range from –0.299 from German sourced cars, which obtained the largest share of
imports by the end of the period analysed, to -0.041 for cars exported from Korea.
The PTM coefficients are statistically significant at 10 percent level for all except
two European countries, Spain and Italy, and two non-European countries, Japan
and Korea. While German, French and Swedish cars´ profit margins seem to be
more sensitive to exchange rate fluctuations, Japanese and Korean exhibit the
lowest PTM coefficients.
It is possible that firms follow different pricing strategies when the sterling
appreciates or depreciates. Knetter (1994) sets out the two arguments that justify
an asymmetric response of export prices to appreciations and depreciations of the
exporter’s vis-à-vis the importer’s currency. Under the first scenario, firms adjust
profit margins more aggressively during appreciations of the exporter’s currency
(pound depreciation periods), a price strategy aimed at maintaining market share in
foreign markets. A desire to build market share implies that during an appreciation
of their currency, exporters prefer to reduce their markups and thus offset the
implied increase in destination currency prices in order to maintain their market
share in the foreign markets. However, when a depreciation of their currency occurs,
exporters intent of building market share will adjust markups to a lesser degree
permitting a larger proportion of the exchange rate shift to be passed-through in
order to reduce export prices and increase market share. Therefore, profit margins
tend to remain unchanged or increase marginally during pound appreciation periods.
Under a second scenario, firms will fully adjust profit margins during depreciations
of the exporter’s currency (pound appreciation periods) due to binding quantity
restrictions or volume trade restrictions. In the car industry, the existence of
temporary bottlenecks in foreign markets, that is, instances where car exporters
cannot expand their sales without also providing an expanded sales, distribution
and service infrastructure abroad is a possibility. Moreover, Japanese car makers
were subject to potentially binding voluntary export restrictions (VER) over the
period 1977-1999. Under the bottlenecks scenario, the optimal price strategy of the
exporters in response to a depreciation of their currency (pound appreciation
period) is to adjust their profit margins upward in order to keep importer’s currency
prices stable and clear the market (i.e., PTM is complete). For the case of Japanese
exporters, when quantity constraints bind and they are already charging the optimal
price in pounds to achieve the quota sales level, profit margins will fully adjust
229 THE IMPACT OF EXCHANGE RATE FLUCTUATIONS ON PROFIT MARGINS
upwards in response to a yen depreciation. However, since the number of cars
shipped can be below the quota level, appreciations of the yen against pound
may not elicit as much pricing-to-market, so profit margins will not fully adjust.11
Table 4, column 2, examines whether pricing behaviour have been asymmetric
during the period analysed. Given the long run nature of our data set, the 31 years
period incorporates three periods of sustained pound appreciation and pound
depreciation (as Figure 1 shows). Then we allow the country-specific exchange
rate coefficients to vary between periods of pound depreciation and periods of
pound appreciation. The results shows that across each of the nine source countries
the PTM elasticities are higher during pound appreciation periods and lower during
pound depreciations periods.12 The fact that profit margins among European makers
seem to be less sensitive to bilateral exchange rates during pound depreciation
periods than during pound appreciation periods strongly supports the hypothesis
that temporary bottlenecks are important in the UK market.13 Finally, the results
are also consistent with the bottlenecks hypothesis in that Japanese mark-ups are
more sensitive to changes in exchange rates during pound appreciation periods
rather than during depreciation periods. 14
Next we examine the mark-up response of local producers to British pound
11 There is some evidence supporting the relevance of asymmetric behaviour in the exchangerate pass-through using industry-level data, however the findings are far from conclusive.Marston (1990) found an asymmetric response for five of the seventeen Japanese productsexported to the US that he examined over the period 1980-1990. Of interest to our analysis,‘passenger cars’ did exhibit a considerably greater PTM elasticities during the yen appreciationperiod (between February 1985 and December 1987). Knetter (1994) and Gil-Pareja (2000)seldom reject the hypothesis of a symmetric response of export prices to changes in exchangesrates on a wide sample of exporting industries in seven European countries between 1988 and1996. In contrast, Ohno (1989), using quite aggregate industry data (2-digit) found PTMelasticities that were higher during yen depreciations in machinery and electrical equipment.Goldberg (1995) in simulations for the US car industry finds greater effect on import priceswhen the dollar depreciates than when it appreciates.
12 F-tests showed these deviations to be statistically important at conventional levels for all thesource countries.
13 Gil Pareja (2000) also found evidence of temporary bottlenecks in other European marketsfor large engine size vehicles.
14 However, Japanese car makers should adjust markups more than their European competitorsif there are binding quota constraints. But compared to their European competitors, Japaneseprofit margins appear to fluctuate less, suggesting that voluntary export restraints on Japanesecars may be not been effective over the whole period 1977-1999.
JOURNAL OF APPLIED ECONOMICS230
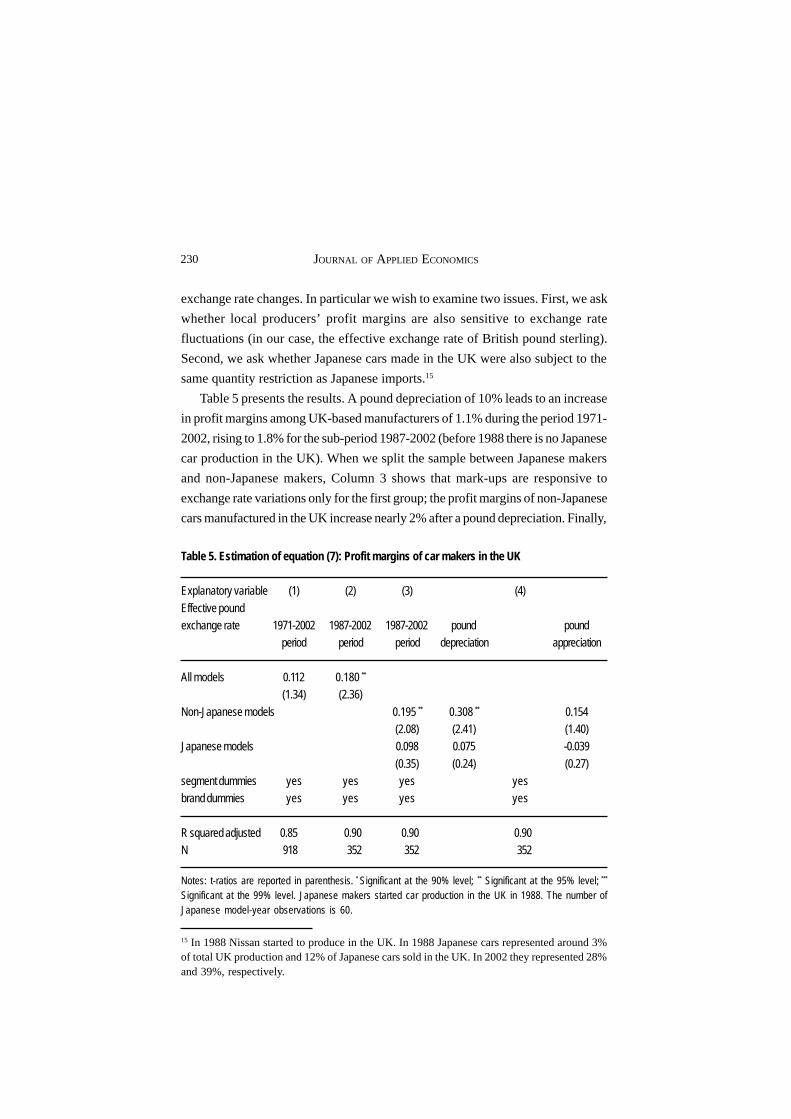
exchange rate changes. In particular we wish to examine two issues. First, we ask
whether local producers’ profit margins are also sensitive to exchange rate
fluctuations (in our case, the effective exchange rate of British pound sterling).
Second, we ask whether Japanese cars made in the UK were also subject to the
same quantity restriction as Japanese imports.15
Table 5 presents the results. A pound depreciation of 10% leads to an increase
in profit margins among UK-based manufacturers of 1.1% during the period 1971-
2002, rising to 1.8% for the sub-period 1987-2002 (before 1988 there is no Japanese
car production in the UK). When we split the sample between Japanese makers
and non-Japanese makers, Column 3 shows that mark-ups are responsive to
exchange rate variations only for the first group; the profit margins of non-Japanese
cars manufactured in the UK increase nearly 2% after a pound depreciation. Finally,
15 In 1988 Nissan started to produce in the UK. In 1988 Japanese cars represented around 3%of total UK production and 12% of Japanese cars sold in the UK. In 2002 they represented 28%and 39%, respectively.
Table 5. Estimation of equation (7): Profit margins of car makers in the UK
Explanatory variable (1) (2) (3) (4)
Effective poundexchange rate 1971-2002 1987-2002 1987-2002 pound pound
period period period depreciation appreciation
All models 0.112 0.180 **
(1.34) (2.36)
Non-Japanese models 0.195 ** 0.308 ** 0.154(2.08) (2.41) (1.40)
Japanese models 0.098 0.075 -0.039
(0.35) (0.24) (0.27)segment dummies yes yes yes yesbrand dummies yes yes yes yes
R squared adjusted 0.85 0.90 0.90 0.90N 918 352 352 352
Notes: t-ratios are reported in parenthesis. * Significant at the 90% level; ** Significant at the 95% level; ***
Significant at the 99% level. Japanese makers started car production in the UK in 1988. The number ofJapanese model-year observations is 60.

231 THE IMPACT OF EXCHANGE RATE FLUCTUATIONS ON PROFIT MARGINS
Column 4 shows that there is an asymmetric PTM behaviour in cars manufactured
in the UK, as was the case with for imported cars.16
V. Concluding remarks
This paper examined the pricing policy of foreign car manufacturers in the UK
market to reveal the degree of pass-through of exchange-rate fluctuations on profit
margins over an extensive time horizon where the market witnessed substantive
structural change. Rather than examining the relationship between prices and
exchange rates, we derive profit margins directly using discrete choice modelling
and then examine the effect of changes in the bilateral rate of exchange rates on
profit margins.
The results reveal that profit margins adjust in the UK car market to changes in
exchange rates. The estimated values of the exchange rate coefficients implied that
pricing to market behaviour of German manufacturers was more pronounced than
other European countries and Japan and Korea. The direction of the mark-up
adjustments reveals that exporters try to stabilize local currency prices; this is
particularly the case during periods of pound appreciation. The results also reveal
that local producers are sensitive to exchange rate fluctuations; in particular, non-
Japanese UK car models increase their profit margins more during pound depreciation
periods than during pound appreciation periods.
Appendix I. Definition of variables, descriptive statistics and datasources
Price: Retail price divided by CPI. Nominal prices are derived from the Motorists’
Guide to New and Used Car Prices (1971-1986) and Parkers’ Guide to New and
Used Car Prices (1987-2002). Since both sources use information provided by the
industry there are no comparability problems. The data used for new car prices is
the recommended retail price of new cars as reported by the car manufacturers,
since there are no data on the discounts offered by the retailers and, hence, on the
actual transaction prices. Prices of new cars change, on average, twice a year, but
any large change usually occur late in the year.
16 Domestic manufacturers include Ford UK, GM Vauxhall, Rover, Jaguar, Aston Martin,Daimler, Lotus, Rolls-Royce.
JOURNAL OF APPLIED ECONOMICS232
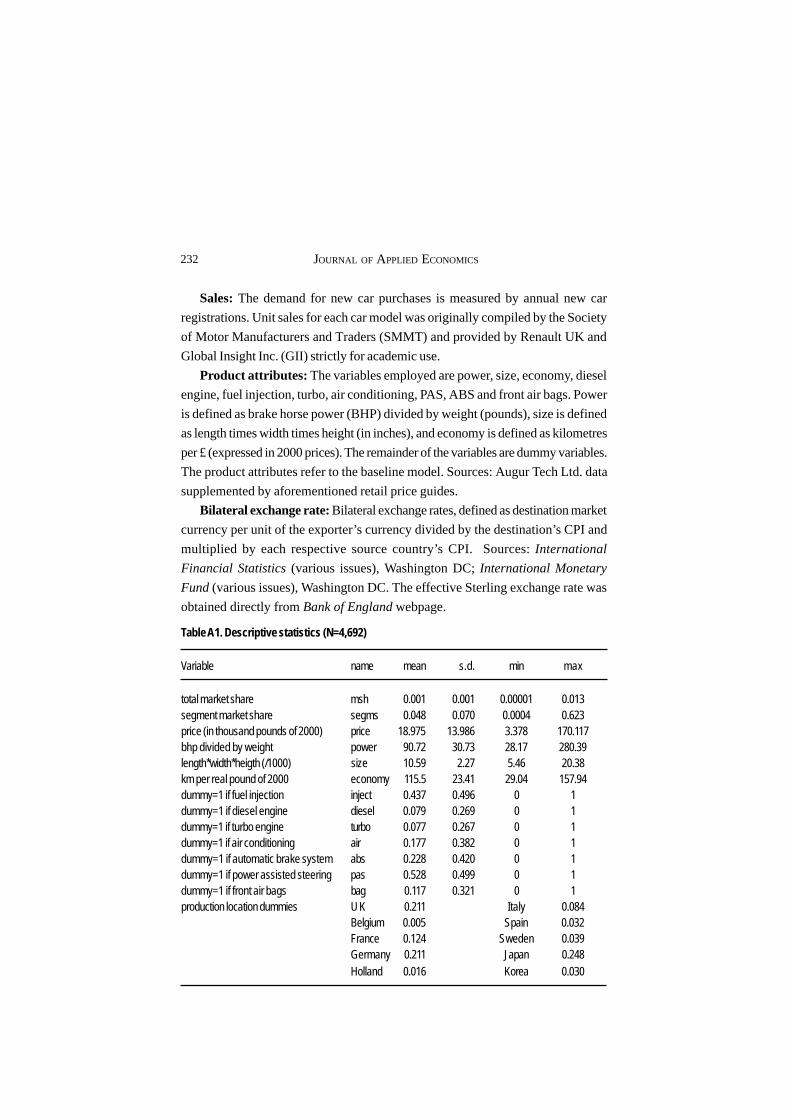
Sales: The demand for new car purchases is measured by annual new car
registrations. Unit sales for each car model was originally compiled by the Society
of Motor Manufacturers and Traders (SMMT) and provided by Renault UK and
Global Insight Inc. (GII) strictly for academic use.
Product attributes: The variables employed are power, size, economy, diesel
engine, fuel injection, turbo, air conditioning, PAS, ABS and front air bags. Power
is defined as brake horse power (BHP) divided by weight (pounds), size is defined
as length times width times height (in inches), and economy is defined as kilometres
per £ (expressed in 2000 prices). The remainder of the variables are dummy variables.
The product attributes refer to the baseline model. Sources: Augur Tech Ltd. data
supplemented by aforementioned retail price guides.
Bilateral exchange rate: Bilateral exchange rates, defined as destination market
currency per unit of the exporter’s currency divided by the destination’s CPI and
multiplied by each respective source country’s CPI. Sources: International
Financial Statistics (various issues), Washington DC; International Monetary
Fund (various issues), Washington DC. The effective Sterling exchange rate was
obtained directly from Bank of England webpage.
Table A1. Descriptive statistics (N=4,692)
Variable name mean s.d. min max
total market share msh 0.001 0.001 0.00001 0.013segment market share segms 0.048 0.070 0.0004 0.623price (in thousand pounds of 2000) price 18.975 13.986 3.378 170.117bhp divided by weight power 90.72 30.73 28.17 280.39length*width*heigth (/1000) size 10.59 2.27 5.46 20.38km per real pound of 2000 economy 115.5 23.41 29.04 157.94dummy=1 if fuel injection inject 0.437 0.496 0 1dummy=1 if diesel engine diesel 0.079 0.269 0 1dummy=1 if turbo engine turbo 0.077 0.267 0 1dummy=1 if air conditioning air 0.177 0.382 0 1dummy=1 if automatic brake system abs 0.228 0.420 0 1dummy=1 if power assisted steering pas 0.528 0.499 0 1dummy=1 if front air bags bag 0.117 0.321 0 1production location dummies UK 0.211 Italy 0.084
Belgium 0.005 Spain 0.032France 0.124 Sweden 0.039Germany 0.211 Japan 0.248Holland 0.016 Korea 0.030
233 THE IMPACT OF EXCHANGE RATE FLUCTUATIONS ON PROFIT MARGINS
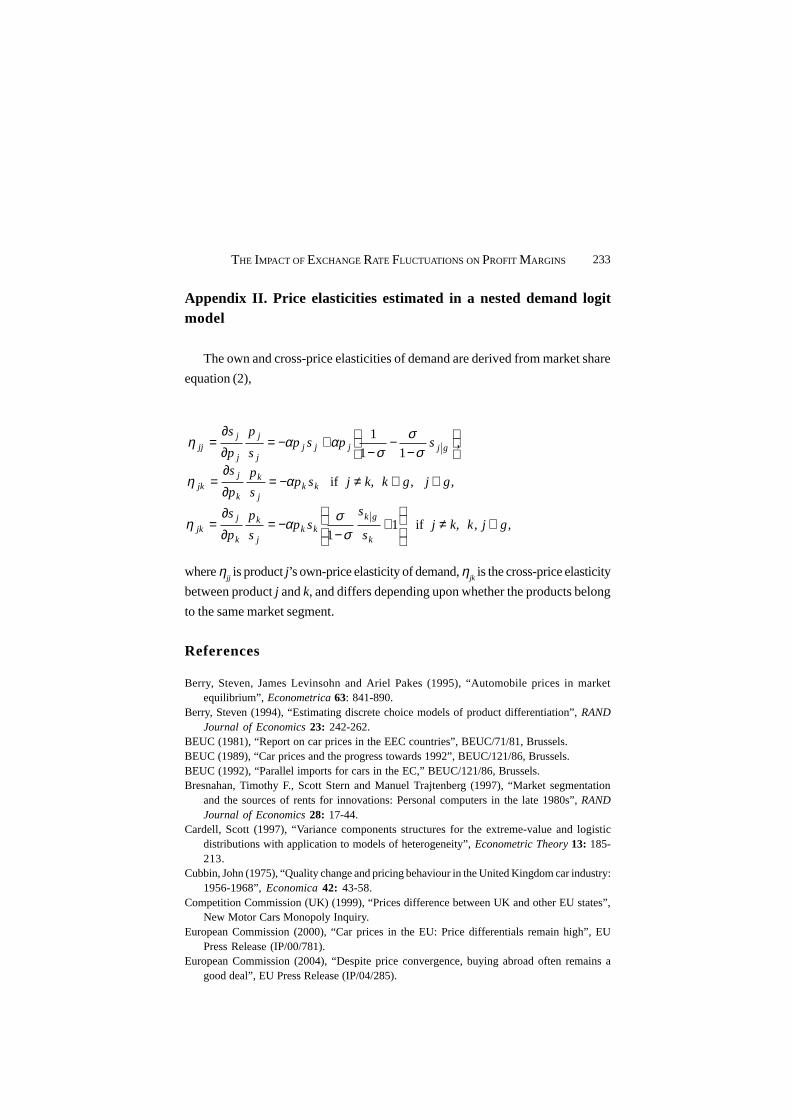
Appendix II. Price elasticities estimated in a nested demand logitmodel
The own and cross-price elasticities of demand are derived from market share
equation (2),
,, if 11
, , if
,11
1
gjkk, js
ssp
s
p
p
s
gjgkk, jsps
p
p
s
spsps
p
p
s
k
gkkk
j
k
k
jjk
kkj
k
k
jjk
gjjjjj
j
j
jjj
∈≠
+
−−=
∂
∂=
∈∉≠−=∂
∂=
−−
−+−=
∂∂
=
σσαη
αη
σσ
σααη
where ηjj is product j’s own-price elasticity of demand, η
jk is the cross-price elasticity
between product j and k, and differs depending upon whether the products belong
to the same market segment.
References
Berry, Steven, James Levinsohn and Ariel Pakes (1995), “Automobile prices in marketequilibrium”, Econometrica 63: 841-890.
Berry, Steven (1994), “Estimating discrete choice models of product differentiation”, RANDJournal of Economics 23: 242-262.
BEUC (1981), “Report on car prices in the EEC countries”, BEUC/71/81, Brussels.BEUC (1989), “Car prices and the progress towards 1992”, BEUC/121/86, Brussels.BEUC (1992), “Parallel imports for cars in the EC,” BEUC/121/86, Brussels.Bresnahan, Timothy F., Scott Stern and Manuel Trajtenberg (1997), “Market segmentation
and the sources of rents for innovations: Personal computers in the late 1980s”, RANDJournal of Economics 28: 17-44.
Cardell, Scott (1997), “Variance components structures for the extreme-value and logisticdistributions with application to models of heterogeneity”, Econometric Theory 13: 185-213.
Cubbin, John (1975), “Quality change and pricing behaviour in the United Kingdom car industry:1956-1968”, Economica 42: 43-58.
Competition Commission (UK) (1999), “Prices difference between UK and other EU states”,New Motor Cars Monopoly Inquiry.
European Commission (2000), “Car prices in the EU: Price differentials remain high”, EUPress Release (IP/00/781).
European Commission (2004), “Despite price convergence, buying abroad often remains agood deal”, EU Press Release (IP/04/285).
JOURNAL OF APPLIED ECONOMICS234
Feenstra, Robert (1989), “Symmetric pass-through of tariffs and exchange rates under imperfectcompetition: An empirical test”, Journal of International Economics 27: 25–45.
Froot, K. and Paul Klemperer (1989), “Exchange rate pass-through when market share matters”,American Economic Review 79: 637–654.
Gagnon, Joseph and Michael Knetter (1996), “Markup adjustment and exchange rate fluctuations:Evidence from panel data on cars and total manufacturing”, Journal of InternationalMoney and Finance 14: 289–310.
Gil-Pareja, Salvador (2000), “Exchange rates and European countries export prices: An empiricaltest for asymmetries in pricing to market behavior”, Weltwirtschaftliches Archiv 136: 1-23.
Gil-Pareja, Salvador (2003), “Pricing to market behaviour in European car markets”, EuropeanEconomic Review 47: 945-962.
Goldberg, Penelopi K. (1995), “Product differentiation and oligopoly in international markets:The case of the US automobile industry”, Econometrica, 63: 891-951.
Goldberg, Penelopi, and Frank Verboven (2001), “Market integration and convergence to thelaw of one price: Evidence from the European car market”, Discussion Paper 2926, CEPR.
Gross, Dominique M., and Nicolas Schmitt (2000), “Exchange rate pass through and dynamicoligopoly: An empirical investigation”, Journal of International Economics 52: 89-112.
House of Lords Select Committee on the European Community (1984), Distribution, Servicing,and Pricing of Motor Vehicles, London, HMSO.
Irandoust, Manuchehr (1998),“Pricing policy in the Swedish automobile market”, Journal ofEconomics and Business 50: 309-317.
Kasa, Kenneth (1992), “Adjustment costs and pricing-to-market: Theory and evidence”,Journal of International Economics 32: 1–30.
Kirman, Alan and Nathalie Schueller (1990), “Price leadership and discrimination in theEuropean car market”, Journal of Industrial Economics 39: 69–91.
Knetter, Michael (1989), Price discrimination by U.S. and German exporters”, AmericanEconomic Review 79: 198–210.
Knetter, Michael (1993), “International comparisons of pricing to market behaviour”, AmericanEconomic Review 83: 473–486.
Knetter, Michael (1994), “Is export price adjustment asymmetric?: Evaluation of the marketshare and marketing bottlenecks hypotheses”, Journal of International Money and Finance13: 55-77.
Knetter, Michael (1995), “Pricing to market in response to unobservable and observableshocks”, International Economic Journal 9: 1–26.
Knetter, Michael and Penelopi Goldberg (1997), “Goods prices and exchange rates: What havewe learned?”, Journal of Economic Literature 35.: 1243-1272.
Krugman, Paul (1987), “Pricing to market when exchange rate changes”, in S. W. Arndt and J.D. Richardson, eds., Real-Financial Linkages Among Open Economies, Cambridge, MITPress.
Le Cacheux, Jacques, and Lucrecia Reichlin (1992), “Exchange rates and import prices: Evidenceof pricing to market in European car markets”, in M. G. Dagenais and P. A. Muet, eds.,International Trade Modelling, London, Chapman & Hall.
Marston, Richard (1990), “Pricing to market in Japanese manufacturing”, Journal ofInternational Economics 29: 217–236.
Monopolies and Mergers Commission (1992), New Motor Cars – A Report on the Supply ofNew Motor Cars within the United Kingdom, Volumes I and II , London, HMSO.

235 THE IMPACT OF EXCHANGE RATE FLUCTUATIONS ON PROFIT MARGINS
Nevo, Aviv (2003), “New products, quality changes and welfare measures computed fromestimated demand systems”, Review of Economics and Statistics 85: 266-275.
Ohno, Kondow (1989), “Export pricing behaviour in manufacturing: A US-Japan comparison”,International Monetary Fund Staff Papers 36: 550-579.
Verboven, Frank (1996), “International price discrimination in the European car market”,RAND Journal of Economics 27: 240-268.
Verboven, Frank,. and John Degryse (2000), “Car price differential in the European Union: Aneconomic analysis”, Report for the Competition Directorate-General of the EuropeanCommission.