Embed Size (px)
Citation preview

THE IMPACT OF FIRMS’ FINANCIAL POSITION ON FIXED INVESTMENT AND EMPLOYMENT. AN ANALYSIS FOR SPAIN
Fátima Herranz González and Carmen Martínez-Carrascal
Documentos de Trabajo N.º 1714
2017

THE IMPACT OF FIRMS’ FINANCIAL POSITION ON FIXED INVESTMENT
AND EMPLOYMENT. AN ANALYSIS FOR SPAIN

THE IMPACT OF FIRMS’ FINANCIAL POSITION ON FIXED
INVESTMENT AND EMPLOYMENT. AN ANALYSIS FOR SPAIN (*)
Fátima Herranz González and Carmen Martínez-Carrascal
BANCO DE ESPAÑA
(*) Acknowledgments: this paper is a follow-up of previous joint work with Roberto Pascual. We thank Roberto Blanco, Laura Crespo, an anonymous referee and the rest of seminar participants at the Banco de España for helpful comments.
Documentos de Trabajo. N.º 1714
2017

The Working Paper Series seeks to disseminate original research in economics and fi nance. All papers have been anonymously refereed. By publishing these papers, the Banco de España aims to contribute to economic analysis and, in particular, to knowledge of the Spanish economy and its international environment.
The opinions and analyses in the Working Paper Series are the responsibility of the authors and, therefore, do not necessarily coincide with those of the Banco de España or the Eurosystem.
The Banco de España disseminates its main reports and most of its publications via the Internet at the following website: http://www.bde.es.
Reproduction for educational and non-commercial purposes is permitted provided that the source is acknowledged.
© BANCO DE ESPAÑA, Madrid, 2017
ISSN: 1579-8666 (on line)

Abstract
Using a large sample of Spanish companies, this paper investigates the impact that firms’
financial health has on their investment and employment decisions. The results indicate
that firms’ financial position is important for explaining firms’ capital expenditures and their
employment levels, since cash flow, indebtedness and the debt burden appear to be
relevant for explaining investment and employment dynamics. Likewise, the results
obtained point to a non-linear impact of financial position on these decisions, this being
larger for companies in a less sound financial situation, and suggest that the role of
financial factors in explaining investment and employment dynamics is likely to be greater
in recessionary periods.
Keywords: financial position, investment, employment, panel data.
JEL Classification: C33, E22, E24, E44, G32, J23.

Resumen
Utilizando una muestra de gran tamaño de empresas no financieras españolas, este trabajo
analiza el impacto que la situación financiera de las sociedades tiene sobre sus decisiones de
inversión y contratación de empleados. Los resultados indican que la posición patrimonial
de las empresas es relevante a la hora de explicar la inversión empresarial y los niveles de
empleo, ya que el flujo de caja, el endeudamiento y la carga financiera son relevantes a la hora
de explicar la evolución de ambas variables. Asimismo, los resultados obtenidos revelan que el
impacto de la posición financiera de las sociedades sobre estas variables es no lineal, siendo
más acusado para aquellas empresas que presentan una posición financiera menos saneada.
También sugieren que el papel que desempeñan los factores financieros a la hora de explicar la
evolución de la inversión y del empleo es mayor en períodos recesivos.
Palabras clave: posición financiera, inversión, empleo, datos de panel.
Códigos JEL: C33, E22, E24, E44, G32, J23.
BANCO DE ESPAÑA 7 DOCUMENTO DE TRABAJO N.º 1714
1 Introduction
The recent economic and financial crisis led to a substantial drop in corporate investment and
employment levels in Spain (investment level was in 2013 almost 40% below that in 2007,
and employment fell by almost 20% in the same period). Although many factors such as the
change in the housing market cycle, the decline in demand and in growth prospects and the
increase in uncertainty have played a large role in explaining this collapse, it is undisputed
that financial factors, such as the tightening of financing conditions (and, more generally, a
more restrictive supply of credit) and the worsening in private sector balance sheets have also
conditioned these dynamics.
The recent crisis has hence shown the relevance of taking into account financial
factors in order to make an optimal design of monetary policy and an adequate assessment
of the macroeconomic outlook. Our paper adds to the existing literature in this area by
focussing, first, on the potential existence of non-linearities in the impact of firm’ financial
position on their spending decisions, and, second, on the existence of differences in this
impact over the business cycle, (it is likely to be larger during recessionary periods than
during expansionary ones)1. The analysis focusses on the impact of firm’ financial pressure on
capital expenditures and employment, which are probably two of the most important
adjustment channels by firms in response to changes in financial conditions.
For this purpose, a large sample of Spanish firms, the Central Balance Sheet Data
Office Survey (CBI) is used. This large sample, which includes, on average, data for 450,000
firms per year whose gross value added accounts for a large share of total value added
generated by the Spanish companies2, has the advantage of being representative of the
Spanish corporate sector, with a good coverage of small and medium-sized companies. It
includes not only the data reported to the Annual Survey (CBA) carried out by the Central
Balance Sheet Data Office (which mainly includes large corporations) but also those from the
accounts filed with the mercantile registries (CBB). Since the impact of financial pressure on
firm real decisions is likely to be non-linear (more acute when it surpasses a certain
threshold), the availability of micro data becomes critical for the analysis. Likewise, the
prevalence of micro and small companies in the database used, which apart from being
those that prevail in the corporate sector are also those more affected by financial
constraints, becomes also crucial in order to make a proper evaluation of the impact of
financial factors on corporate decisions.
Applying panel data techniques to this large database, our results confirm that
financial position is an important determinant of firms’ demand of productive factors, and the
existence of a stronger impact of financial pressure on capital expenditures and employment
demand once financial pressure surpasses a certain threshold. Likewise, the results point
towards a more intense impact of financial pressure on these two variables during the recent
crisis, something that suggests that the role of financial factors in explaining investment and
employment dynamics is likely to be larger in recessionary periods.
1. The first one of these issues is also assessed in in Hernando and Martinez-Carrascal (2008), who also analyze the
existence of thresholds in the impact of financial factors on investment and employment, but with two important
differences. First, the database used here is much more representative of the Spanish corporate sector (the database
used in Hernando and Martinez-Carrascal (2008) was biased towards large companies,) and, second, their sample
period does not cover the recent crisis period.
2. See section 3 for a more detailed description of the database used.

BANCO DE ESPAÑA 8 DOCUMENTO DE TRABAJO N.º 1714
The rest of the paper is organized as follows. After briefly summarizing the existing
literature on the link between firms’ financial position and their demand of productive factors
in Section 2, Section 3 provides a preliminary look at the data, and investigates whether at a
simple bivariate and descriptive level this relationship seems to exist. Section 4 describes the
baseline specifications for fixed investment and employment, summarizes the estimation
methods and presents the estimation results. In this section it is also analysed whether the
impact of financial factors on investment and employment becomes more intense when
financial pressure exceed certain thresholds, and whether it changed during the recent
recessionary period. Finally, Section 5 summarizes the main findings.
BANCO DE ESPAÑA 9 DOCUMENTO DE TRABAJO N.º 1714
2 Literature review
A large number of theoretical and empirical studies have analyzed the impact of firms’
financial position on real corporate decisions. Given the existence of capital market
imperfections such as asymmetric information and agency problems, the extent to which
these frictions affect capital expenditures and labour demand is likely to depend on the firm’
balance sheet structure, its debt burden and profitability, which determine its credit
worthiness. In this line, there is ample evidence that firms’ financial position has a significant
effect on their investment and employment decisions.
Starting from the seminal work by Fazzari et al. (1988), many papers have tested the
sensitivity of corporate investment to firms’ internal funds. In this paper, the sensitivity of
investment to internal sources was taken as evidence for the presence of financing
restrictions (see also Fazzari et al., 2000, and Carpenter and Petersen, 2002). However,
several studies criticised afterwards the empirical test based on the cash flow sensitivity as a
meaningful evidence in favour of the existence of financing constraints (see Kaplan and
Zingales, 1997 and 2000, amongst others), arguing that the significance of cash flow in
investment equations can be the consequence of measurement errors in the usual proxy for
investment opportunities, Tobin’s Q. In any case, empirical evidence widely supports the
positive link between cash flow and investment (Alti, 2003; Guariglia, 2008; Hernando and
Martínez-Carrascal, 2008; Almeida et al., 2009, amongst others).
Other variables determining creditworthiness, such as leverage level and debt-
servicing payments, have also been found to be relevant in explaining firms’ investment
decisions. Using a sample of UK company panel data, Bond and Meghir (1994) highlight the
influence of firm indebtedness position on its investment behavior, through its impact on the
borrowing cost that firms face. Following the same approach, Estrada and Vallés (1998) find
the same results, using a sample of Spanish manufacturing firms. Likewise, Lang et al.
(1996), Hennessy (2004), Hennessy et al. (2007) and Kalemli-Özcan et al. (2015) also find
evidence of a negative link between investment and leverage, while Aivazianan et al (2005)
show that the negative link between leverage and investment is significantly stronger for firms
with low growth opportunities than those with high growth opportunities. Similarly, Cleary
(1999) finds that investment decisions of firms with high credit worthiness (according to
traditional financial ratios) are more sensitive to the availability of internal funds that firms that
are less creditworthy, while, instead, Whited (1992) finds that firms’ investment-cash flow
sensitivity is higher for those with higher leverage and higher interest expense to cash flow
ratios. She also finds that financial variables appear to be relevant in determining investment
for constrained firms, but not for the unconstrained ones. Also results in Benito and
Hernando (2007), Hernando and Martínez-Carrascal (2008) or Martínez-Carrascal and
Ferrando (2008) point towards a significant impact of indebtedness and debt burden on
investment by Spanish firms. In addition, Hernando and Martínez-Carrascal (2008) provide
evidence of a non-linear effect of financial position on investment (it becomes larger when
financial pressure exceeds a certain threshold).
Marchica and Mura (2010) study the link between financial flexibility (defined as debt
levels ‘permanently’ below what would be expected ex-ante) and investment ability. They find
that financial flexibility allows firms to take advantage of unexpected investment opportunities
and, as a result, the level of external debt influences a company's ability to invest. In addition,
BANCO DE ESPAÑA 10 DOCUMENTO DE TRABAJO N.º 1714
they also find that these financially flexible firms invest more and show higher levels of
profitability than firms that lack such flexibility, which might have to pass on profitable
investment opportunities.
Although less extensive, there is also empirical evidence on the link between firms’
financial health and employment decisions. For example, Nickell and Nicolitsas (1999) and
Benito and Hernando (2008) find a significant contractive impact of a high debt burden on
employment, and Benmelech et al. (2011) find that firms with higher financial leverage show
higher sensitivity of employment to cash flow. In addition, Benito and Hernando (2008) find
that the demand for flexible (temporary) labour is more sensitive (and reacts sooner) to
changes in financial factors than permanent employment, something that leads the authors to
conclude that where an adjustment in terms of employee numbers is required, the burden of
such adjustment is borne disproportionately by those with temporary contracts. In this
respect, Caggese and Cuñat (2008) develop a model that, once calibrated, shows that
financially constrained firms use fixed-term workers more intensely and make them absorb a
larger fraction of the total employment volatility than financially unconstrained firms do, a
hypothesis that is tested and confirmed using a sample of manufacturing Italian firms.
Hernando and Martínez Carrascal (2008) find evidence that the impact of financial factors on
firms’ employment is non-linear and increases when financial pressure exceeds certain
thresholds, in line with the evidence they find on the impact of financial factors on investment.
In the opposite causality direction, Agrawal and Matsa (2013) study, using a large
sample of US firms, the impact of worker unemployment cost on corporate financing
decisions, and find that higher employment protection is related to increases in firm leverage
and interest coverage ratios. Finally, there is also some recent literature that argues that a
weak financial position may have a negative impact on labour supply. For example, Brown
and Matsa (2015) find that the deterioration of firms’ financial position has a negative effect
on their ability to attract and retain workers. They argue that the reductions in job applicants
are related at least partly related to the desire by job seekers to reduce exposure to
unemployment risk, since applications from workers with greater protection provided by state
unemployment insurance are less sensitive to changes in firms’ financial situation3.
Spaliara (2009) analyzes the complementariness between labour and capital, and
concludes that firm-specific characteristics such as leverage, collateral, cash flow and interest
burden are important determinants of firms’ capital to labour ratio. More specifically, this ratio
is found to be negatively associated with the interest burden and leverage, especially for
more financially constrained firms; cash flow also exerts a negative impact on this ratio for
constrained firms.
In the last years, many studies have focussed on the financial crisis period, trying
to assess how firms’ financial pressure has conditioned investment and employment
decisions during these years and whether the link between them has changed with respect
to the previous expansionary period. Using a large panel of unquoted euro-area firms over
the period 2003-2011, Fernandes et al. (2014) find evidence of a negative impact of
financial pressure on employment, and find that this link was stronger during the 2007-
2009 period, especially for SMEs and firms in periphery countries. Similarly, Farinha and
Prego (2013) find evidence of a larger impact of firms’ financial standing on investment for
Portuguese firms during the period of the sovereign debt crisis in the euro area. Likewise,
3. Other papers, such as Benmelech et al (2012), Klassa, et al (2009) or Matsa (2010) focus on the impact of firm
financial pressure on wage bargaining, rather than on the employment level itself.

BANCO DE ESPAÑA 11 DOCUMENTO DE TRABAJO N.º 1714
Almeida et al. (2009) point out the importance of maturity debt structure for corporate
financial flexibility in the context of the 2007 credit crisis. They find that firms with a large
fraction of their long-term debt maturing at the time of the crisis showed lower investment
rates in the post-crisis period than similar firms with different long-term maturity debt
schedule. More recently, Chodorow-Reich (2014) and Bentolila et al. (2015) have studied
the impact of credit supply shocks on firm-level employment using data for the US and
Spain, respectively. Both articles exploit the differences in lender health at the onset of the
Great Recession, and find evidence that firms attached to weaker banks destroyed more
jobs than very similar firms working with healthier ones. While for the US the contractive
impact on employment is concentrated on SME firms, the paper by Bentolila et al. (2015)
points towards a sizable effect also for large firms (results in Hernando and Villanueva,
2014, point, however, to a limited impact of the deterioration of banks’ capital position on
the supply of loans to Spanish non-construction companies).
BANCO DE ESPAÑA 12 DOCUMENTO DE TRABAJO N.º 1714
3 A preliminary look at the data
In this section we first provide, primarily in graphical form, a preliminary analysis of the variables
involved in the analysis (investment, employment and indicators of firms’ financial position) for the
sample of Spanish non-financial companies used, and its evolution over the period 1997-2014.
Then we assess, on the basis of a preliminary bivariate descriptive analysis, whether investment
rates and employment growth of firms with different degree of financial soundness differ. The
analysis is based on the sample of non-financial corporations responding to the Integrated Central
Balance Sheet Data Office Survey (CBI), which includes the data reported to the Annual Survey
(CBA) and the data from the accounts filed with the mercantile registries (CBB). It has a wide
coverage of the non-financial corporation sector, since it includes, on average, data for 450,000
firms per year, whose gross value added accounts for around 45% of total value added generated
by all Spanish non-financial corporations in the latest years of the sample period. We apply
standard cleaning methods (we delete those observations with very extreme values in the variables
of interest or in the explanatory variables), and restrict the sample to those companies with at least
three consecutive annual observations in the final sample4. This produces an unbalanced sample
of around 140,000 companies with between 3 and 18 annual observations per company, resulting
in a sample with around 435,000 observations over the period 1999-2014.
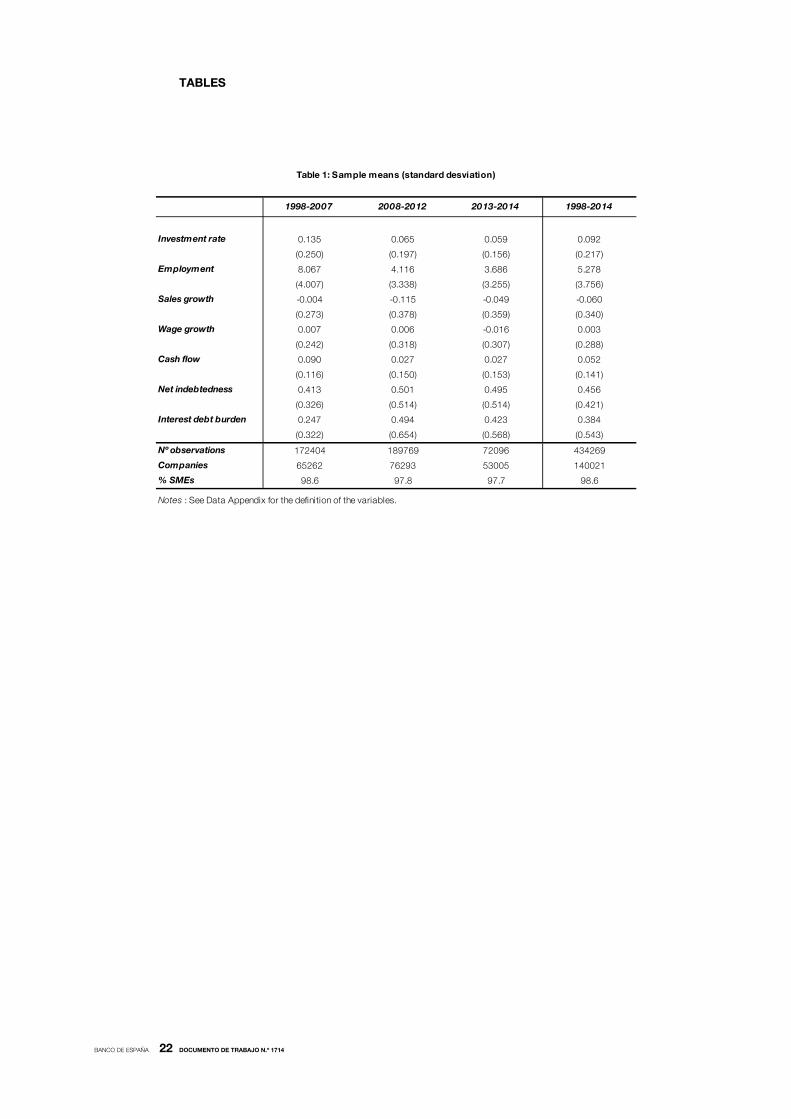
Summary statistics on the main variables of interest are presented in Table 1, both
for the entire sample period and three subsample periods distinguishing the pre and post
crisis years (before 2008, 2008-2012, after 2012). The investment rate presents a mean value
close to 10 %; however, there are great differences by subperiods: while before 2008 the
mean value is 13.5 %, from 2008 it drops to around 6 %, in a context of a substantial
downward revision in growth expectations. The same pattern can be observed in other
procyclical variables, such as employment and cash flow, while, as expected, net
indebtedness shows less variation over time and, debt burden is much higher on average in
the period 2008-2014 than in previous years.
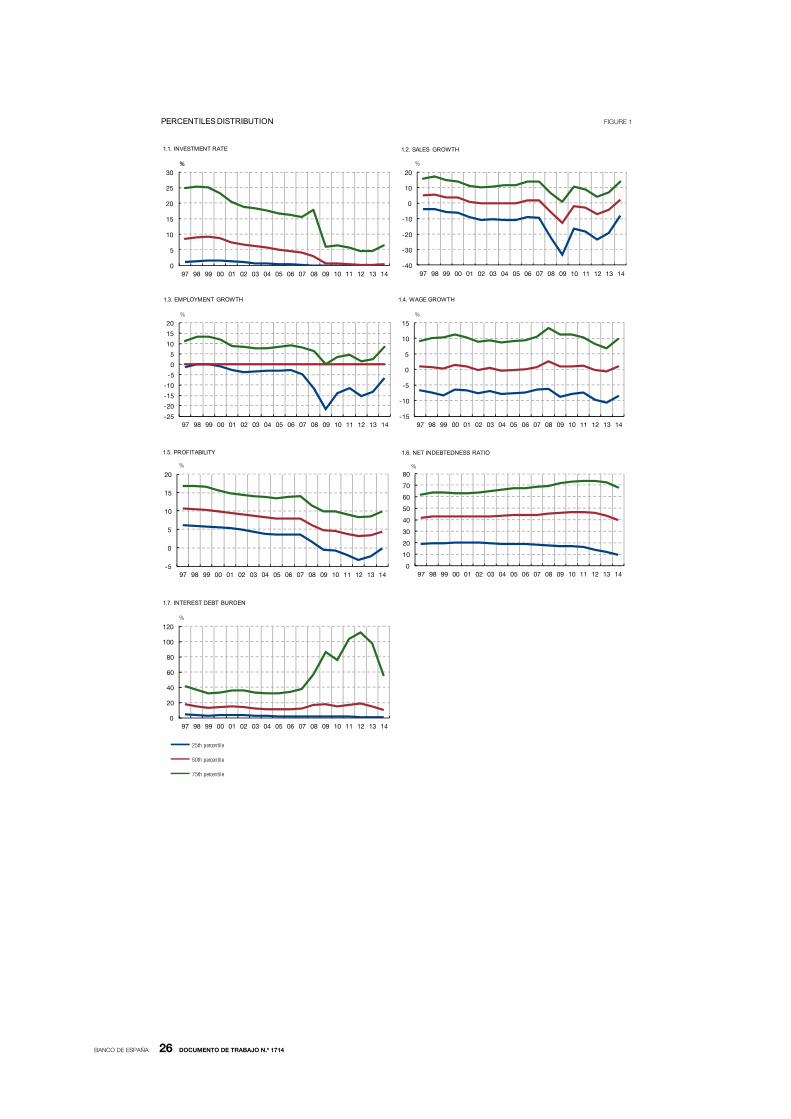
The first panel of Figure 1 displays the cross-sectional variation (through percentiles 25,
50 and 75 of the distribution) of the investment rate. As can be seen, the investment rate
reached its highest level in 1999-2000 and thereafter a downward trend is observed for all
percentiles, with a larger drop in 2008-2009 (especially in the highest percentile), reflecting the
slowdown in economic growth in Spain. Since 2009 the median value of the investment rate
remains close to 0%. At the same time, median sales growth rate recorded negative values
from 2008, with minimum values in 2009 and a recovery afterwards. The percentiles 25 and 75
of the employment growth showed a declining trend between end-nineties and 2008, and
some recovery afterwards, matching the double-dip recession observed in Spain during the
crisis. The median employment growth rate remained at zero over the entire sample period.
4. The requirement of using firms with at least three consecutive observations is not strictly required by the generalized
method of moments (GMM) procedure used in the paper, as time dummies are still available as instruments for the
earlier cross-sections. Nevertheless, this choice follows many previous studies using this type of data and estimator. For
instance, Bond et al. (2003) require at least six consecutive annual observations for the firms included in their final
samples. Similarly, Arellano and Bond (1991), Guariglia (1999) and Nickell and Nicolitsas (1999) use samples with at
least seven, four and six, respectively, consecutive observations. Using the complete sample, which includes companies
with less than three consecutive observations, led to problems with the validity of instruments and second-order
autocorrelation problems in the econometric specification, which might be linked to the large sample size. Since
companies excluded are, on average, in a weaker financial situation, the potential bias due to their exclusion, if existed,
would be positive (that is, the contractive impact of financial pressure on investment and employment would be larger
than here estimated).
BANCO DE ESPAÑA 13 DOCUMENTO DE TRABAJO N.º 1714
The return on assets ratio (net profit plus financial revenue over total assets) shows a
downward trend since the late nineties, specially marked between 2008 and 2012, in line
with the recessionary phase registered in these years. This ratio reached its minimum level in
2012, and a recovery in the different percentiles has been observed afterwards. As for
indebtedness, defined as the ratio of outstanding debt minus cash and its equivalent to total
assets5, an increasing trend is observed in the upper part of the distribution up to the late
2000’s, and a generalised decline in all percentiles afterwards (see sixth panel of Figure 1).
The burden of debt, defined as the ratio of interest payments to gross revenue and
financial income, measures the firms’ capacity to meet interest payments with the results it
generates, and, therefore, it reflects the impact of changes in interest rates, company
profitability and its indebtedness. As can be seen, this ratio showed a downward trend in the
second half of the nineties, in line with the reduction observed in interest rates, and increased
slightly afterwards in years 2000-2001, when a reduction in profitability was recorded. From
the start of the crisis period and up to 2012, a sharp upward trend is observed for this
indicator, mainly driven by the significant contraction of firm revenues observed during this
period. From 2013 onwards, a quick reversion of this upward trend is observed, thanks to
the reduction in interest rates and the recovery in firm revenues.
In left-hand-side panels of Figure 2 we compare how investment in physical capital
differs across firms which, according to alternative indicators, present a different degree of
financial soundness. The charts show the median investment level in different corporate
groupings, defined on the basis of their financial position, proxied by different indicators:
profitability, net indebtedness and interest debt burden. Each panel presents the median
investment rate for firms between the percentiles 0-25, 40-60 and 75-100 of a given financial
indicator (return on assets, the indebtedness ratio or the interest debt burden). The first group
includes those companies with the soundest financial situation (weakest, in the case of
profitability) while, analogously, the third one those in the weakest (soundest, in the case of
profitability) financial position.
First panel of Figure 2 reveals a clear relationship between the level or profitability
and the investment rate: firms with higher return on assets show higher investment in physical
capital. In contrast, before the crisis corporate investment rate does not seem to show a
monotonic relationship with indebtedness levels, and it is only after the inception of the crisis
that a negative relationship between both variables can be observed. The reasons that might
help to explain the absence of clear relationship between the debt level and the investment
rate at the company level in the first years of the sample period could be the result of two
opposite effects: on the one hand, firms with higher indebtedness may have difficulties in
gaining access to additional credit to finance new investment projects; but, on the other
hand, companies with higher levels of investment might be those firms that have been more
successful in attracting external funds to carry out their investment projects and take
advantage of their growth opportunities. Finally, panel 5 of Figure 2 compares the behaviour
of firms facing different degrees of financial pressure, according to the interest debt burden
indicator. As already pointed out in Hernando and Martínez-Carrascal (2008), the relationship
between investment and debt burden seems to be non-linear: there are no marked
differences between investment levels of companies which show a low debt burden ratio or
an intermediate one, while, instead, firms with a comparatively high financial burden in relation
to their capacity to generate funds display lower investment rates. In other words, it seems
5. Debt includes trade credit, since no information on this variable for most of the companies in the sample up to 2008.
This measure of indebtedness captures the importance of debt for firms once adjusted for liquidity at disposal.

BANCO DE ESPAÑA 14 DOCUMENTO DE TRABAJO N.º 1714
that debt burden conditions investment decisions only when it exceeds a certain threshold.
Firms for which interest debt burden is equal to zero, hence without costly debt, are those
that show the lowest investment rate; this result is probably linked to some specificities of
these companies with no costly debt, less capital intensive than others, that voluntarily show
low investment rate in spite of the fact that financial position does not pose a break on their
indebtedness possibilities and hence on their capital expansion.
Similarly, right-hand-side panels of Figure 2 compare how employment growth
differs across firms subject to a different degree of financial pressure. As can be seen, the
charts 2, 4 and 6 show a clear (positive) relationship between employment growth and
financial soundness: firms with higher profitability, lower debt burden and, from the start of
the crisis, lower indebtedness, show, on average, higher employment growth. In addition, the
relationship between financial pressure and employment seems to be non linear, especially
when the later is measured by means of indebtedness and debt burden. Moreover, the
difference in employment growth across the different groupings seems more marked in the
recent recessionary period, suggesting a larger role of financial factors in explaining
employment dynamics during these years.
In summary, the descriptive analysis seems to point towards several conclusions.
First, there seems to be a clear link between firms’ real decisions and financial pressure;
second, this impact might be not linear (it becomes more intense when financial pressure
exceeds certain threshold). And, third, differences in employment growth and, less clearly,
investment rates for firms showing different degree of financial pressure seem to have
intensified in the recent crisis.

BANCO DE ESPAÑA 15 DOCUMENTO DE TRABAJO N.º 1714
4 Estimation results
The model estimated for fixed investment is an error-correction model which specifies a
target level of the capital stock and allows for a flexible specification of the short-run
investment dynamics, in which we add different financial indicators as potential explanatory
variables. The specification adopted, which has been favoured, among others, by Bond et al.
(2003), is the following6:
itt
itititititiit XykyyKIKI
'2413211 )()/()/(
(1)
where i indexes companies i=1, 2...N, t indexes the year t=1, 2...T, denotes a first
difference, I/K is the investment rate, y is the log of real sales, k is the log of real fixed capital
stock, i are company-specific fixed effects, θt are time effects that control for
macroeconomic influences on investment rate that are common across companies, and is
a serially-uncorrelated, but possibly heteroskedastic error.
The labour demand equation is derived from a quadratic adjustment cost model, and takes
the following form (see Nickell and Nicolitsas, 1999, for derivation of the specification):
ititititititititiit Xwwknn '
5413211 (2)
where i indexes companies i=1,2..N and t indexes year t=1,2..T. n is (log) average company
employment during the year, w is the (log) average real wage at the company, k denotes (log)
real fixed capital stock. is a demand shock proxy which consists of the growth in log real
sales and t represents a set of common time effects (year dummies) which will control for
aggregate effects including aggregate demand.7 it is a serially uncorrelated but possibly
heteroskedastic error term.
The estimation method consists of the GMM system estimator proposed by Arellano
and Bover (1995) and examined in detail in Blundell and Bond (1998). These models control
for unobservable firm-specific fixed effects, the estimator being an extension of the GMM
estimator of Arellano and Bond (1991) that estimates equations not only in first differences
but also in levels.8 Apart from the biases that would arise if fixed effects were not controlled
6. We have chosen an ECM specification, that usually display reasonable long-run and short-run properties (see Bond
et al., 2003), instead of a more structural models – such as Q models-. Although these structural models would be more
appropriate from a theoretical point of view, because they control for expectational influences on the investment
decision, they may be significantly affected by measurement errors and have often failed to produce significant and
correctly signed key parameters. In any case, a Q model is not available here since most of the Spanish firms are not
quoted such that the usual Q variable could not be constructed, and Tobin’s Q calculated at sectoral level is non-
significant when included in the specification here presented.
7. The demand shock variable is not considered in the analysis of Nickell and Nicolitsas (1999), but it was included in a
similar specification by Bentolila and Saint-Paul (1992) and Benito and Hernando (2007), amongst others.
8. The use of the GMM system estimator is especially justified in the case of autoregressive models with high
persistence in the data, so that the lagged levels of a variable are not highly correlated with the first difference, which
results in finite sample biases associated with weak instruments in the first-difference estimator (see Blundell and Bond
(1998)). Blundell and Bond (1998) show that in these circumstances also including the levels equations in the system
estimator offers significant gains, countering the bias. They also show that in autoregressive distributed lag models, first
differences of the variables can be used as instruments in the levels equations provided that they are mean stationary.
The high levels of serial correlation displayed by several variables included in the models and the fact that they can be
regarded as mean stationary favour the use of a GMM system estimator rather than the first-difference estimator.

BANCO DE ESPAÑA 16 DOCUMENTO DE TRABAJO N.º 1714
for, it is also necessary to take into account that most current firm-specific variables are
endogenous. In order to avoid the bias associated with this endogeneity problem, a GMM
estimator is used, taking lags of the dependent and explanatory variables as instruments.
The estimation method requires the absence of second order serial correlation in the
first difference residuals, for which the Arellano Bond (1991) test, labelled M2, is presented. If
the underlying model’s residuals are white noise, then first-order correlation should be
expected in the first-differenced residuals. This hypothesis is tested by means of the Arellano-
Bond (1991) test, labelled M1.
4.1 Basic results
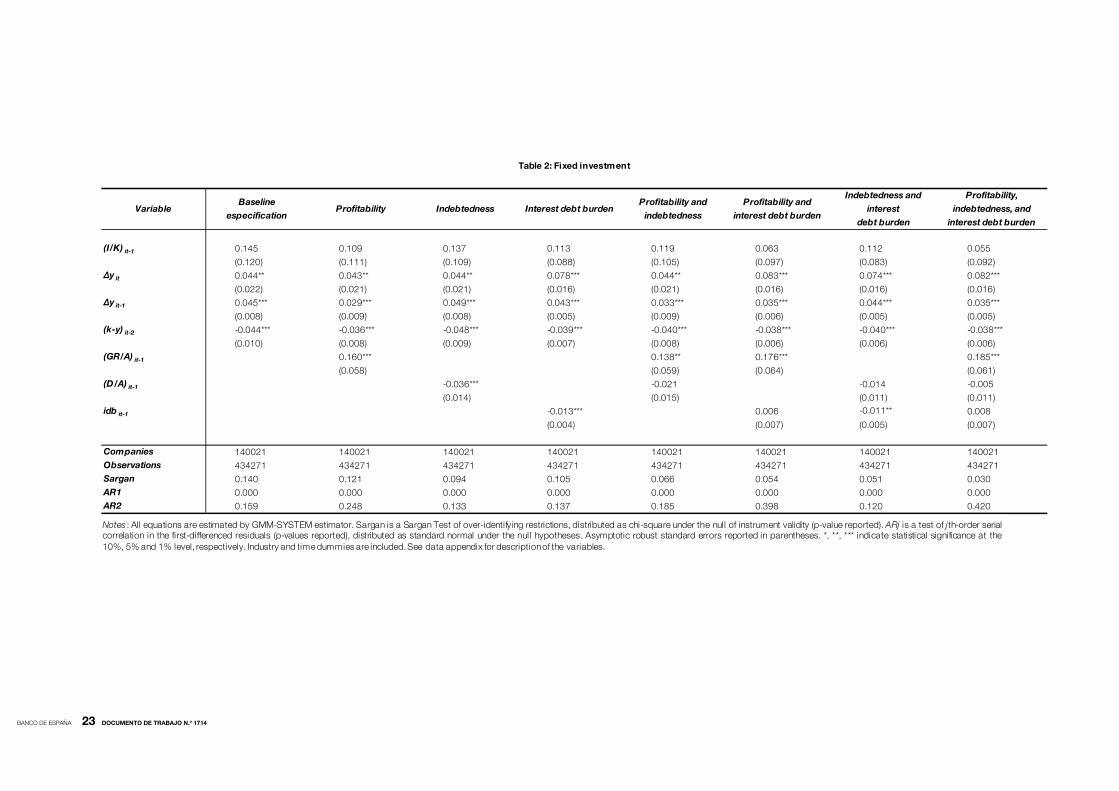
Estimation results for fixed investment are presented in Table 2. First column reports the
results obtained when estimating the basic equation, without any financial indicator. As
expected, sales growth has a positive effect on investment, and the error-correction term is
negative and highly significant. We find insignificant persistence levels in investment rates, a
result that is in line with those reported in previous studies (see for example Bond et al.,
2003, Martínez-Carrascal and Ferrando, 2008, or Hernando and Martínez-Carrascal, 2008).
The absence of second order serial correlation and insignificant values of the Sargan test at
conventional confidence levels (95%) indicate that there are no problems with the model
specification and the validity of instruments used.
We then consider augmenting the basic specification with financial variables, one at
a time. Column 2 in Table 2 reports the results including the cash flow term in the baseline
investment equation. A positive (and significant) coefficient is obtained, showing the expected
relationship between investment rates and profitability, which might be either capturing the
relevance of internal funds for investment or acting as a proxy for investment opportunities.
Likewise, when indebtedness is included as a regressor in the specification a well-determined
negative effective is found (see column 3), indicating that investment projects may be
postponed or cancelled when the firm is facing high levels of debt. Similarly, the interest debt
burden ratio turns out to be negative and highly significant (see column 4), suggesting that
financial pressure of debt servicing plays an important role in influencing firm investment
levels of firms and indicating that monetary policy has an impact on firms’ investment rates
through the induced changes in debt servicing costs. When including several financial
indicators at a time, p-values associated to the validity of the instruments decrease
significantly, and in some cases point towards some problems with their validity. In any case,
in these specifications, cash flow is the only one that persistently remains significant when
combined with other financial pressure indicators, while the coefficient and significance for
indebtedness and debt burden decline substantially, being both of them non significant (see
columns 5 to 8 in Table 2).
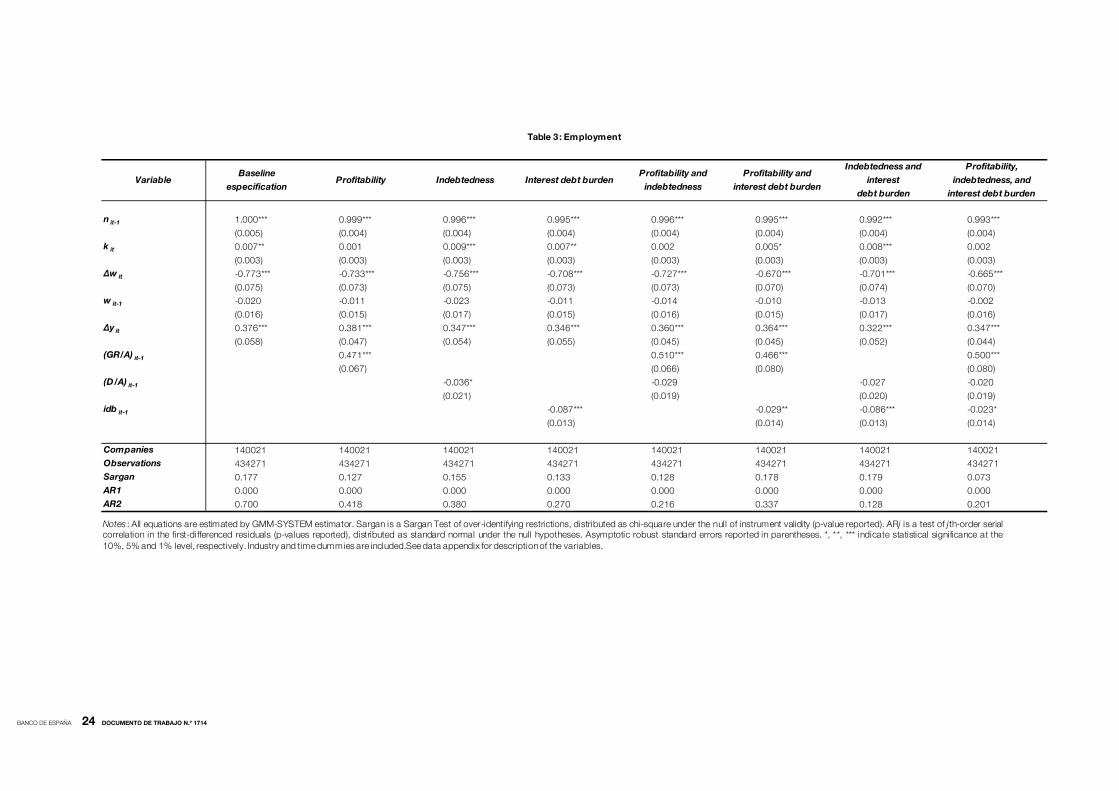
Table 3 shows the estimation results for the employment equation. Column 1 reports
the results of the baseline specification without financial variables. As expected, capital stock
is positively related to employment, while wage growth has a negative impact on firms’
employment and the positive coefficient on the sales growth term indicates that at the
company-level employment is procyclical. Then, when adding financial variables to the
specification, we obtain results consistent with those reported by Benito and Hernando
(2007) and Hernando and Martínez-Carrascal (2008) for Spanish firms. First, the profitability
indicator shows a strong positive link with employment, being its estimated coefficient (0.376)
highly significant (see column 2). Instead, as expected, leverage and debt burden indicators
are found to have a significant negative impact on labour demand, indicating the response of
BANCO DE ESPAÑA 17 DOCUMENTO DE TRABAJO N.º 1714
companies to financial pressure by reducing employment levels (see columns 3 and 4)9. The
significance of the debt burden indicator, which has a quantitatively larger impact on
employment than indebtedness, is robust to the addition of a control for cash flow (column
6), indebtedness (column 7) or both of them (column 8). This result reinforces the perception
of the important role of the borrowing ratio to explain employment behaviour and provides
evidence in favour of a monetary policy effect on employment at the company-level, through
the induced changes in the costs of debt servicing. Indebtedness, instead, loses significance
when combined with debt burden (see columns 7 and 8).
Overall, these results indicate that financial pressure appears to have a relevant
effect on firms’ capital expenditures and employment levels when it is proxied by cash flow,
indebtedness and debt burden. While profitability and debt burden seem to be the most
distinctive financial features to determine employment, in the investment equation profitability
seems to be the most relevant one.
4.2 Analyzing non-linear effects along the cycle
The descriptive evidence presented in Section 3 suggests that firms’ financial position affects
business activity and employment levels in a non-linear fashion, and points towards the
existence of some threshold beyond which the impact of firms’ balance sheet conditions
becomes more intense. Likewise, it also suggests that the impact of firms’ financial position
on investment rates and their employment levels might have intensified during the recent
crisis, in a context in which credit access tightened and credit institutions applied more strict
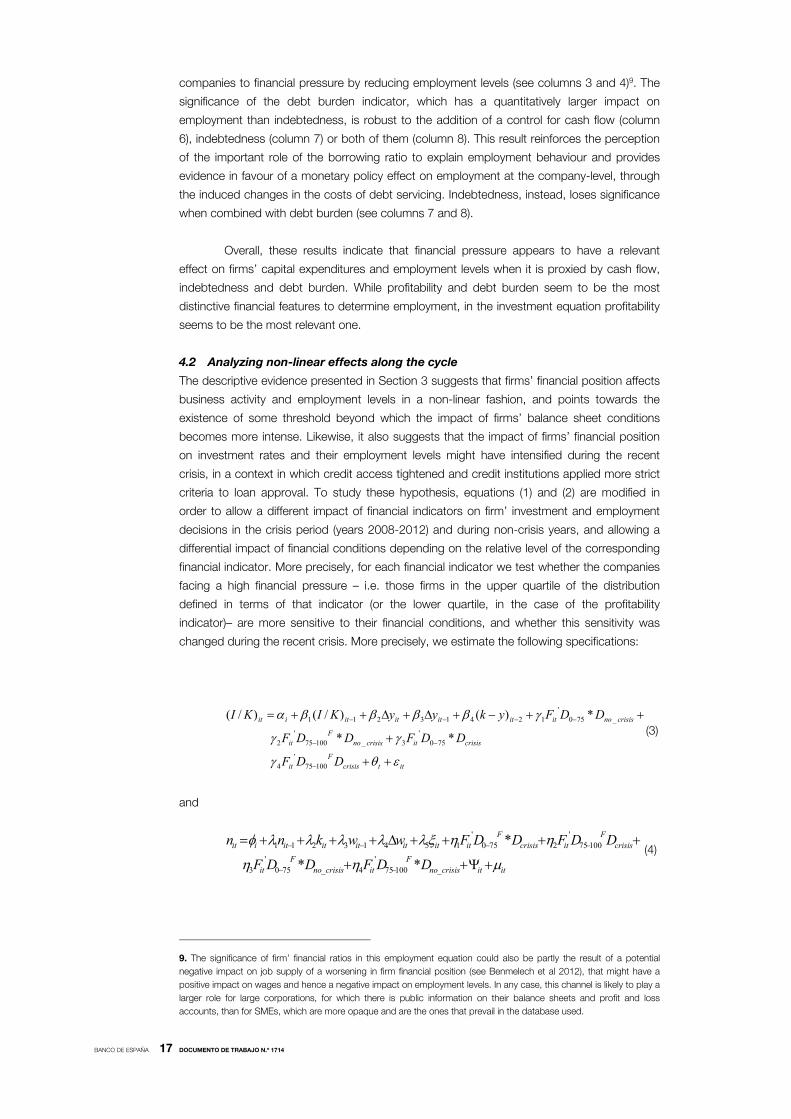
criteria to loan approval. To study these hypothesis, equations (1) and (2) are modified in
order to allow a different impact of financial indicators on firm’ investment and employment
decisions in the crisis period (years 2008-2012) and during non-crisis years, and allowing a
differential impact of financial conditions depending on the relative level of the corresponding
financial indicator. More precisely, for each financial indicator we test whether the companies
facing a high financial pressure – i.e. those firms in the upper quartile of the distribution
defined in terms of that indicator (or the lower quartile, in the case of the profitability
indicator)– are more sensitive to their financial conditions, and whether this sensitivity was
changed during the recent crisis. More precisely, we estimate the following specifications:
ittcrisisF
it
crisisitcrisisnoF
it
crisisnoitititititiit
DDF
DDFDDF
DDFykyyKIKI
10075'
4
750'
3_10075'
2
_750'
12413211
**
*)()/()/((3)
and
ititcrisisnoF
itcrisisnoF
it
crisisF
itcrisisF
ititititititiit
DDFDDF
DDFDDFwwknn
_10075'
4_750'
3
10075'
2750'
15413211
**
* (4)
9. The significance of firm’ financial ratios in this employment equation could also be partly the result of a potential
negative impact on job supply of a worsening in firm financial position (see Benmelech et al 2012), that might have a
positive impact on wages and hence a negative impact on employment levels. In any case, this channel is likely to play a
larger role for large corporations, for which there is public information on their balance sheets and profit and loss
accounts, than for SMEs, which are more opaque and are the ones that prevail in the database used.
BANCO DE ESPAÑA 18 DOCUMENTO DE TRABAJO N.º 1714
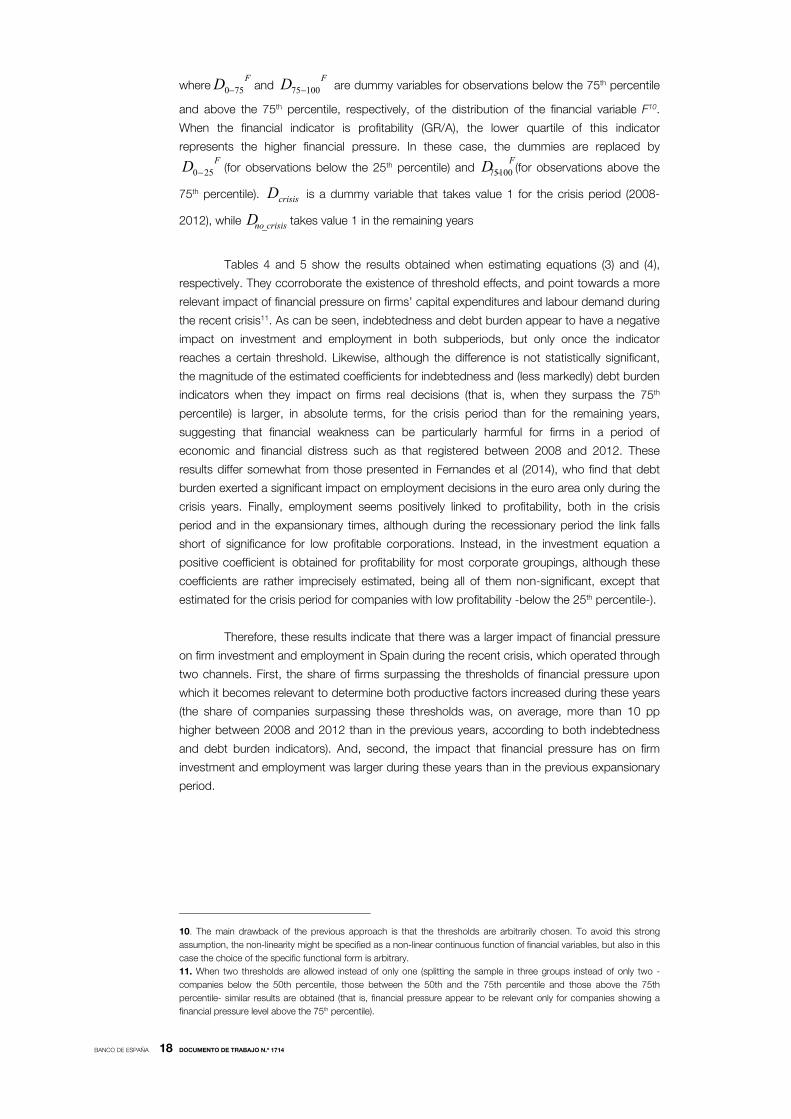
whereFD 750 and
FD 10075 are dummy variables for observations below the 75th percentile
and above the 75th percentile, respectively, of the distribution of the financial variable F10.
When the financial indicator is profitability (GR/A), the lower quartile of this indicator
represents the higher financial pressure. In these case, the dummies are replaced by FD 250 (for observations below the 25th percentile) and
FD 10075 (for observations above the
75th percentile). crisisD is a dummy variable that takes value 1 for the crisis period (2008-
2012), while crisisnoD _ takes value 1 in the remaining years
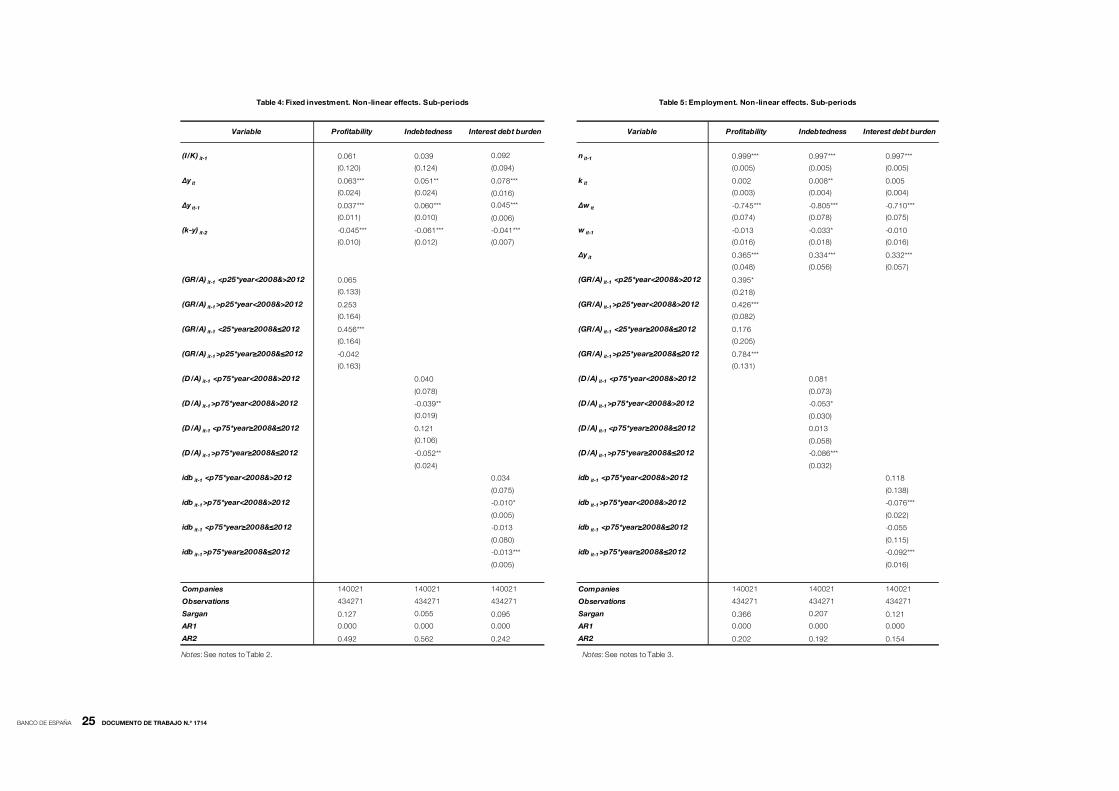
Tables 4 and 5 show the results obtained when estimating equations (3) and (4),
respectively. They ccorroborate the existence of threshold effects, and point towards a more
relevant impact of financial pressure on firms’ capital expenditures and labour demand during
the recent crisis11. As can be seen, indebtedness and debt burden appear to have a negative
impact on investment and employment in both subperiods, but only once the indicator
reaches a certain threshold. Likewise, although the difference is not statistically significant,
the magnitude of the estimated coefficients for indebtedness and (less markedly) debt burden
indicators when they impact on firms real decisions (that is, when they surpass the 75th
percentile) is larger, in absolute terms, for the crisis period than for the remaining years,
suggesting that financial weakness can be particularly harmful for firms in a period of
economic and financial distress such as that registered between 2008 and 2012. These
results differ somewhat from those presented in Fernandes et al (2014), who find that debt
burden exerted a significant impact on employment decisions in the euro area only during the
crisis years. Finally, employment seems positively linked to profitability, both in the crisis
period and in the expansionary times, although during the recessionary period the link falls
short of significance for low profitable corporations. Instead, in the investment equation a
positive coefficient is obtained for profitability for most corporate groupings, although these
coefficients are rather imprecisely estimated, being all of them non-significant, except that
estimated for the crisis period for companies with low profitability -below the 25th percentile-).
Therefore, these results indicate that there was a larger impact of financial pressure
on firm investment and employment in Spain during the recent crisis, which operated through
two channels. First, the share of firms surpassing the thresholds of financial pressure upon
which it becomes relevant to determine both productive factors increased during these years
(the share of companies surpassing these thresholds was, on average, more than 10 pp
higher between 2008 and 2012 than in the previous years, according to both indebtedness
and debt burden indicators). And, second, the impact that financial pressure has on firm
investment and employment was larger during these years than in the previous expansionary
period.
10. The main drawback of the previous approach is that the thresholds are arbitrarily chosen. To avoid this strong
assumption, the non-linearity might be specified as a non-linear continuous function of financial variables, but also in this
case the choice of the specific functional form is arbitrary.
11. When two thresholds are allowed instead of only one (splitting the sample in three groups instead of only two -
companies below the 50th percentile, those between the 50th and the 75th percentile and those above the 75th
percentile- similar results are obtained (that is, financial pressure appear to be relevant only for companies showing a
financial pressure level above the 75th percentile).
BANCO DE ESPAÑA 19 DOCUMENTO DE TRABAJO N.º 1714
5 Conclusions
This paper investigates the influence of firm’ financial position on corporate employment and
investment rates, focussing on two issues: first, the potential existence of non-linearities in the
impact of firm’ financial position on both productive factors, and, second, on the existence of
differences in this impact over the business cycle. For this purpose, we use firm-level data for
the period 1999-2014 contained in the Integrated Central Balance Sheet Data Office Survey
(CBI), a large firm-level panel dataset with a good coverage of the Spanish corporate sector
where, differently from other samples often used for this type of studies, small and medium
size companies prevail.
After confirming that financial position is an important determinant of firms’ capital
expenditures and their employment levels, our results corroborate the two hypothesis tested.
First, we find that debt burden exerts a negative impact on employment and firm investment
only when it surpass a certain threshold (60% of gross operating profit plus financial revenue).
Similarly, indebtedness restrains firms’ capital expenditures and employment only for highly
leveraged firms. Second, the results point towards a more intense impact of an excessive
financial pressure on firms’ capital expenditures and labour demand during the recent crisis,
which suggests that the role of financial factors in explaining investment and employment
dynamics is likely to be larger in recessionary periods.
These results imply that firm financial pressure had a larger role in explaining
investment and employment dynamics in Spain during the recent crisis not only because the
share of firms showing a degree of financial pressure over which it exerts a contractive
impact on both variables increased substantially (on average, by around 10 percentage
points), but also because the impact of an excessive level of financial pressure on investment
and employment was larger during this period.

BANCO DE ESPAÑA 20 DOCUMENTO DE TRABAJO N.º 1714
REFERENCES
AGRAWAL, A.K. and MATSA, D.A. (2013), “Labor unemployment risk and corporate financing decisions”. Journal of
Financial Economics, 108(2), pp.449-470.
AIVAZIAN, V. A., GE, Y., and QIU, J. (2005) “The impact of leverage on firm investment: Canadian evidence”, Journal of
Corporate Finance 11, p. 277-291.
ALMEIDA, H., CAMPELLO, M., LARANJEIRA, B., WEISBENNER, S. (2009), “Corporate Debt Maturity and the Real
Effects of the 2007 Credit Crisis”, Working Paper No. w14990, National Bureau of Economic Research.
Alti, A. (2003), “How Sensitive is Investment to Cash Flow when Financing is Frictionless?”, Journal of Finance, 58,
p707-722.
ARELLANO, M. and BOND, S. (1991), “Some Test of Specification for Panel Data: Monte Carlo Evidence and an
Application to Employment Equations”, Review of Economic Studies, 58, p277-297.
ARELLANO, M. and BOVER, O. (1995), “Another Look at the Instrumental-Variable Estimation of Error-Components
Models”, Journal of Econometrics, 69, p29-52.
BENITO, A. and HERNANDO, I. (2007), “Firm Behaviour and Financial Pressure: Evidence from Spanish Panel Data”,
Bulletin of Economic Research, 53 (4), p283-311.
BENITO, A. and Hernando, I. (2008), “Labour demand, flexible contracts and financial factors: new evidence from
Spain”. Oxford Bulletin of Economics and Statistics - 70 (3), pp. 283-301
BENMELECH, E., BERGMAN, N.K. and SERU, A. (2011), “Financial labor”, Working Paper No. 17144, National Bureau
of Economic Research.
BENMELECH, E., BERGMAN, N.K. and ENRIQUEZ, R.J. (2012), “Negociating with labor under financial distress”,
Review of Corporate Finance Studies, 1 (1) p. 28-67.
BENTOLILA, S., JANSEN, M., JIMÉNEZ, G. and RUANO, S. (2015), “When credit dries up: job losses in the great
recession”, CEMFI Working Paper No. 1310.
BENTOLILA, S. and SAINT-PAUL, G. (1992), “The Macroeconomic Impact of Flexible Labor Contracts with an
Application to Spain”, European Economic Review, 36, p1013-1053.
BLUNDELL, R.W. and BOND, S. (1998), “Initial conditions and moment restrictions in dynamic panel data models”,
Journal of Econometrics, 87, p115-143.
BOND, S., ELSTON, J., MAIRESSE, J. and MULKAY, B. (2003), “Financial Factors and Investment in Belgium, France,
Germany and the United Kingdom: a Comparison using Company Panel Data”, The Review of Economics and
Statistics, 85 (1), p153-165.
BOND, S. and MEGHIR, C. (1994), “Dynamic Investment Models and the Firm’s Financial Policy”, Review of Economic
Studies, 61 (2), p197-222.
BROWN, J. and MATSA, D.A. (2015), “Boarding a sinking ship? An investigation of job applications to distressed firms”.
The Journal of Finance.
CAGGESE, A. and CUÑAT, V. (2008), “Financing Constraints and Fixed-term Employment Contracts”, The Economic
Journal, Vol. 118, No. 533, pp. 2013-2046.
CARPENTER, R. and PETERSEN, B.C. (2002), “Is the Growth of Small Firms Constrained by Internal Finance?”, The
Review of Economics and Statistics, 84, p298-309.
CLEARY, S. (1999), “The relationship between firm investment and financial status”. The Journal of Finance, Vol. 54,
n.2, 1999.
CHODOROW-REICH, G. (2014), “The Employment Effects of Credit Market Disruptions: Firm-level Evidence from the
2008-9 Financial Crisis”, Quarterly Journal of Economics 129 (1): 1-59.
ESTRADA, A. and VALLÉS, J. (1998), “Investment and Financial Cost: Spanish Evidence with Panel Data”, Investigaciones
Económicas, 22, p337-359.
FARINHA, L. and PREGO, P. (2013) “Investment Decisions and Financial Standing of Portuguese Firms – recent
evidence”. Economic Bulletin and Financial Stability Report Articles, Banco de Portugal.
FAZZARI, S., HUBBARD, R.G., PETERSEN, B. (1988), “Financing Constraints and Corporate Investment”, Brookings
Papers on Economic Activity, No. 1, 141-195.
FAZZARI, S., HUBBARD, R.G., PETERSEN, B. (2000), “Investment-Cash Flow Sensitivities are Useful: A Comment on
Kaplan and Zingales”, Quarterly Journal of Economics, 695-705.
FERNANDES, F., KONTONIKAS, A. and TSOUKAS, S. (2014), “On the real effects of financial pressure: Evidence from
euro area firm-level employment during the recent financial crisis”, Scottish Institute for Research in Economics,
Discussion Paper 2014-020.
GUARIGLIA, A. (1999), “The Effects of Financial Constraints on Inventory Investment: Evidence from a Panel of UK
Firms”, Economica, Vol. 66, p43-62.
GUARIGLIA, A. (2008), “Internal financial constraints, external financial constraints, and investment choice: Evidence
from a panel of UK firms”, Journal of Banking Finance, 32 (9), p1795-1809.
HENNESSY, CHRISTOPHER A. (2004), “Tobin’s Q, Debt Overhang, and Investment”, The Journal of Finance 59 (4),
1717–1742.
HENNESSY, CHRISTOPHER A, LEVY, AMMON, and WHITED, TONI M. (2007), “Testing ‘Q’ Theory With Financing
Frictions”, Journal of Financial Economics 83 (3), 691–717.
HERNANDO, I. and MARTINEZ-CARRASCAL, C. (2008), “The impact of financial variables on firms’ real decisions:
Evidence from Spanish firm-level data”, Journal of Macroeconomics 30 (2008), 543–561.
HERNANDO, I and E. VILLANUEVA (2014), “The recent slowdown in bank lending in Spain: are supply-side factors
relevant?”, SERIEs, 5.245-285

BANCO DE ESPAÑA 21 DOCUMENTO DE TRABAJO N.º 1714
KAPLAN, S. N. and ZINGALES, L (1997). “Do Investment Cash-Flow Sensitivities Provide Useful Measures of Financing
Constraints?”, Quarterly Journal of Economics, CXII: 1, pp. 169-216.
KAPLAN, S. N. and ZINGALES, L. (2000), “Investment-Cash Flow Sensitivities are not valid measures of financing
constraints”, Quarterly Journal of Economics, CXV: 2, p707-712.
KALEMLI-ÖZCAN, SEBNEM, LUC LAEVEN, and DAVID MORENO (2015), “Debt Overhang in Europe: Evidence from
Firm-Bank-Sovereign Linkages,” unpublished manuscript.
KLASA, S., MAXWELL, W.F. and ORTIZ-MOLINA, H. (2009), “The strategic use of corporate cash holdings in collective
bargaining with labor unions”. Journal of Financial Economics, 92(3), pp.421-442.
KUZMINA, O. (2013). “Operating flexibility and capital structure: Evidence from a natural experiment”. Columbia
Business School Research Paper, 13-69.
LANG, L.E., OFEK, E., STULZ, R. (1996), “Leverage, Investment and Firm Growth”, Journal of Financial Economics, 40,
p3-29.
MARCHICA, M., and MURA, R. (2010), “Financial Flexibility, Investment Ability, and Firm Value: Evidence from Firms
with Spare Debt Capacity”, Financial Management-Winter, 1339-1365.
MARTÍNEZ-CARRASCAL, C. and FERRANDO, A. (2008), “The impact of financial position on investment: an analysis for
non-financial corporations in the euro area”, ECB Working Paper No. 943.
MATSA, D.A. (2010), “Capital structure as a strategic variable: Evidence from collective bargaining”. The Journal of
Finance, 65(3), pp.1197-1232.
NICKELL, S. and NICOLITSAS, D. (1999), “How does financial pressure affects firms?”, European Economic Review,
43, p1435-1456.
SIMINTZI, E., VIG, V. and VOLPIN, P. (2014), “Labor protection and leverage”. Review of Financial studies, p.hhu053.
SPALIARA, M-E (2009), “Do financial factors affect the capital–labour ratio? Evidence from UK firm-level data”, Journal
of Banking and Finance, 33, p1932-1947.
WHITED, T.M. (1992), “Debt, Liquidity Constraints, and Corporate Investment: Evidence from Panel Data”, Journal of
Finance, XLVII, p1425-1460.
BANCO DE ESPAÑA 22 DOCUMENTO DE TRABAJO N.º 1714
TABLES
1998-2007 2008-2012 2013-2014 1998-2014
Investment rate 0.135 0.065 0.059 0.092
(0.250) (0.197) (0.156) (0.217)
Employment 8.067 4.116 3.686 5.278
(4.007) (3.338) (3.255) (3.756)
Sales growth -0.004 -0.115 -0.049 -0.060
(0.273) (0.378) (0.359) (0.340)
Wage growth 0.007 0.006 -0.016 0.003
(0.242) (0.318) (0.307) (0.288)
Cash flow 0.090 0.027 0.027 0.052
(0.116) (0.150) (0.153) (0.141)
Net indebtedness 0.413 0.501 0.495 0.456
(0.326) (0.514) (0.514) (0.421)
Interest debt burden 0.247 0.494 0.423 0.384
(0.322) (0.654) (0.568) (0.543)
Nº observations 172404 189769 72096 434269
Companies 65262 76293 53005 140021
% SMEs 98.6 97.8 97.7 98.6
Notes : See Data Appendix for the definition of the variables.
Table 1: Sample means (standard desviation)
BANCO DE ESPAÑA 23 DOCUMENTO DE TRABAJO N.º 1714
VariableBaseline
especificationProfitability Indebtedness Interest debt burden
Profitability and
indebtedness
Profitability and
interest debt burden
Indebtedness and
interest
debt burden
Profitability,
indebtedness, and
interest debt burden
(I/K) it-1 0.145 0.109 0.137 0.113 0.119 0.063 0.112 0.055
(0.120) (0.111) (0.109) (0.088) (0.105) (0.097) (0.083) (0.092)
Δy it 0.044** 0.043** 0.044** 0.078*** 0.044** 0.083*** 0.074*** 0.082***
(0.022) (0.021) (0.021) (0.016) (0.021) (0.016) (0.016) (0.016)
Δy it-1 0.045*** 0.029*** 0.049*** 0.043*** 0.033*** 0.035*** 0.044*** 0.035***
(0.008) (0.009) (0.008) (0.005) (0.009) (0.006) (0.005) (0.005)
(k-y) it-2 -0.044*** -0.036*** -0.048*** -0.039*** -0.040*** -0.038*** -0.040*** -0.038***
(0.010) (0.008) (0.009) (0.007) (0.008) (0.006) (0.006) (0.006)
(GR/A) it-1 0.160*** 0.138** 0.176*** 0.185***
(0.058) (0.059) (0.064) (0.061)
(D/A) it-1 -0.036*** -0.021 -0.014 -0.005
(0.014) (0.015) (0.011) (0.011)
idb it-1 -0.013*** 0.006 -0.011** 0.008
(0.004) (0.007) (0.005) (0.007)
Companies 140021 140021 140021 140021 140021 140021 140021 140021
Observations 434271 434271 434271 434271 434271 434271 434271 434271
Sargan 0.140 0.121 0.094 0.105 0.066 0.054 0.051 0.030
AR1 0.000 0.000 0.000 0.000 0.000 0.000 0.000 0.000
AR2 0.159 0.248 0.133 0.137 0.185 0.398 0.120 0.420
Table 2: Fixed investment
Notes : All equations are estimated by GMM-SYSTEM estimator. Sargan is a Sargan Test of over-identifying restrictions, distributed as chi-square under the null of instrument validity (p-value reported). ARj is a test of jth-order serialcorrelation in the first-differenced residuals (p-values reported), distributed as standard normal under the null hypotheses. Asymptotic robust standard errors reported in parentheses. *, **, *** indicate statistical significance at the
10%, 5% and 1% level, respectively. Industry and time dummies are included.See data appendix for descriptionof the variables.
BANCO DE ESPAÑA 24 DOCUMENTO DE TRABAJO N.º 1714
VariableBaseline
especificationProfitability Indebtedness Interest debt burden
Profitability and
indebtedness
Profitability and
interest debt burden
Indebtedness and
interest
debt burden
Profitability,
indebtedness, and
interest debt burden
n it-1 1.000*** 0.999*** 0.996*** 0.995*** 0.996*** 0.995*** 0.992*** 0.993***
(0.005) (0.004) (0.004) (0.004) (0.004) (0.004) (0.004) (0.004)
k it 0.007** 0.001 0.009*** 0.007** 0.002 0.005* 0.008*** 0.002
(0.003) (0.003) (0.003) (0.003) (0.003) (0.003) (0.003) (0.003)
Δw it -0.773*** -0.733*** -0.756*** -0.708*** -0.727*** -0.670*** -0.701*** -0.665***
(0.075) (0.073) (0.075) (0.073) (0.073) (0.070) (0.074) (0.070)
w it-1 -0.020 -0.011 -0.023 -0.011 -0.014 -0.010 -0.013 -0.002
(0.016) (0.015) (0.017) (0.015) (0.016) (0.015) (0.017) (0.016)
Δy it 0.376*** 0.381*** 0.347*** 0.346*** 0.360*** 0.364*** 0.322*** 0.347***
(0.058) (0.047) (0.054) (0.055) (0.045) (0.045) (0.052) (0.044)
(GR/A) it-1 0.471*** 0.510*** 0.466*** 0.500***
(0.067) (0.066) (0.080) (0.080)
(D/A) it-1 -0.036* -0.029 -0.027 -0.020
(0.021) (0.019) (0.020) (0.019)
idb it-1 -0.087*** -0.029** -0.086*** -0.023*
(0.013) (0.014) (0.013) (0.014)
Companies 140021 140021 140021 140021 140021 140021 140021 140021
Observations 434271 434271 434271 434271 434271 434271 434271 434271
Sargan 0.177 0.127 0.155 0.133 0.128 0.178 0.179 0.073
AR1 0.000 0.000 0.000 0.000 0.000 0.000 0.000 0.000
AR2 0.700 0.418 0.380 0.270 0.216 0.337 0.128 0.201
Table 3 : Employment
Notes : All equations are estimated by GMM-SYSTEM estimator. Sargan is a Sargan Test of over-identifying restrictions, distributed as chi-square under the null of instrument validity (p-value reported). ARj is a test of jth-order serialcorrelation in the first-differenced residuals (p-values reported), distributed as standard normal under the null hypotheses. Asymptotic robust standard errors reported in parentheses. *, **, *** indicate statistical significance at the
10%, 5% and 1% level, respectively. Industry and time dummies are included.See data appendix for descriptionof the variables.
BANCO DE ESPAÑA 25 DOCUMENTO DE TRABAJO N.º 1714
Variable Profitability Indebtedness Interest debt burden Variable Profitability Indebtedness Interest debt burden
(I/K) it-1 0.061 0.039 0.092 n it-1 0.999*** 0.997*** 0.997***
(0.120) (0.124) (0.094) (0.005) (0.005) (0.005)
Δy it 0.063*** 0.051** 0.078*** k it 0.002 0.008** 0.005
(0.024) (0.024) (0.016) (0.003) (0.004) (0.004)
Δy it-1 0.037*** 0.060*** 0.045*** Δw it -0.745*** -0.805*** -0.710***
(0.011) (0.010) (0.006) (0.074) (0.078) (0.075)
(k-y) it-2 -0.045*** -0.061*** -0.041*** w it-1 -0.013 -0.033* -0.010
(0.010) (0.012) (0.007) (0.016) (0.018) (0.016)
Δy it 0.365*** 0.334*** 0.332***
(0.048) (0.056) (0.057)
(GR/A) it-1 <p25*year<2008&>2012 0.065 (GR/A) it-1 <p25*year<2008&>2012 0.395*
(0.133) (0.218)
(GR/A) it-1 >p25*year<2008&>2012 0.253 (GR/A) it-1 >p25*year<2008&>2012 0.426***
(0.164) (0.082)
(GR/A) it-1 <25*year≥2008&≤2012 0.456*** (GR/A) it-1 <25*year≥2008&≤2012 0.176
(0.164) (0.205)
(GR/A) it-1 >p25*year≥2008&≤2012 -0.042 (GR/A) it-1 >p25*year≥2008&≤2012 0.784***
(0.163) (0.131)
(D/A) it-1 <p75*year<2008&>2012 0.040 (D/A) it-1 <p75*year<2008&>2012 0.081
(0.078) (0.073)
(D/A) it-1 >p75*year<2008&>2012 -0.039** (D/A) it-1 >p75*year<2008&>2012 -0.053*
(0.019) (0.030)
(D/A) it-1 <p75*year≥2008&≤2012 0.121 (D/A) it-1 <p75*year≥2008&≤2012 0.013
(0.106) (0.058)
(D/A) it-1 >p75*year≥2008&≤2012 -0.052** (D/A) it-1 >p75*year≥2008&≤2012 -0.086***
(0.024) (0.032)
idb it-1 <p75*year<2008&>2012 0.034 idb it-1 <p75*year<2008&>2012 0.118
(0.075) (0.138)
idb it-1 >p75*year<2008&>2012 -0.010* idb it-1 >p75*year<2008&>2012 -0.076***
(0.005) (0.022)
idb it-1 <p75*year≥2008&≤2012 -0.013 idb it-1 <p75*year≥2008&≤2012 -0.055
(0.080) (0.115)
idb it-1 >p75*year≥2008&≤2012 -0.013*** idb it-1 >p75*year≥2008&≤2012 -0.092***
(0.005) (0.016)
Companies 140021 140021 140021 Companies 140021 140021 140021
Observations 434271 434271 434271 Observations 434271 434271 434271
Sargan 0.127 0.055 0.095 Sargan 0.366 0.207 0.121
AR1 0.000 0.000 0.000 AR1 0.000 0.000 0.000
AR2 0.492 0.562 0.242 AR2 0.202 0.192 0.154
Table 4: Fixed investment. Non-linear effects. Sub-periods Table 5: Employment. Non-linear effects. Sub-periods
Notes: See notes to Table 2. Notes: See notes to Table 3.
BANCO DE ESPAÑA 26 DOCUMENTO DE TRABAJO N.º 1714
FIGURE 1PERCENTILES DISTRIBUTION
-40
-30
-20
-10
0
10
20
97 98 99 00 01 02 03 04 05 06 07 08 09 10 11 12 13 14
1.2. SALES GROWTH
%
0
10
20
30
40
50
60
70
80
97 98 99 00 01 02 03 04 05 06 07 08 09 10 11 12 13 14
1.6. NET INDEBTEDNESS RATIO
%
0
5
10
15
20
25
30
97 98 99 00 01 02 03 04 05 06 07 08 09 10 11 12 13 14
1.1. INVESTMENT RATE
%%
-5
0
5
10
15
20
97 98 99 00 01 02 03 04 05 06 07 08 09 10 11 12 13 14
1.5. PROFITABILITY
%
0
20
40
60
80
100
120
97 98 99 00 01 02 03 04 05 06 07 08 09 10 11 12 13 14
25th percentile
50th percentile
75th percentile
1.7. INTEREST DEBT BURDEN
%
-25
-20
-15
-10
-5
0
5
10
15
20
97 98 99 00 01 02 03 04 05 06 07 08 09 10 11 12 13 14
1.3. EMPLOYMENT GROWTH
%
-15
-10
-5
0
5
10
15
97 98 99 00 01 02 03 04 05 06 07 08 09 10 11 12 13 14
1.4. WAGE GROWTH
%

BANCO DE ESPAÑA 27 DOCUMENTO DE TRABAJO N.º 1714
FIGURE 2FINANCIAL POSITION AND LEVEL OF ACTIVITY
SOURCES: Banco de España.
i. Firms between the percentiles 0-25ii. Firms between the percentiles 40-60iii. Firms between the percentiles 75-100
-20
-15
-10
-5
0
5
10
98 99 00 01 02 03 04 05 06 07 08 09 10 11 12 13 14
Low Cash flow (i) Med Cash flow (ii)High Cash flow (iii)
1.2. EMPLOYMENT GROWTH - CASH FLOW
%
-25
-20
-15
-10
-5
0
5
10
98 99 00 01 02 03 04 05 06 07 08 09 10 11 12 13 14
Low interest debt burden (i) Med interest debt burden (ii)High interest debt burden (iii) Zero interest debt burden
1.6. EMPLOYMENT GROWTH - INTEREST DEBT BURDEN
%
0
2
4
6
8
10
12
14
16
18
98 99 00 01 02 03 04 05 06 07 08 09 10 11 12 13 14
Low Cash flow (i) Med Cash flow (ii)High Cash flow (iii)
1.1. INVESTMENT RATE - CASH FLOW
%%
0
2
4
6
8
10
12
14
98 99 00 01 02 03 04 05 06 07 08 09 10 11 12 13 14Low interest debt burden (i) Med interest debt burden (ii)High interest debt burden (iii) Zero interest debt burden
1.5. INVESTMENT RATE - INTEREST DEBT BURDEN
%
0
2
4
6
8
10
12
98 99 00 01 02 03 04 05 06 07 08 09 10 11 12 13 14Low Indebtedness (i) Med Indebtedness (ii)High Indebtedness (iii)
1.3. INVESTMENT RATE - NET INDEBTEDNESS
%%
-20
-15
-10
-5
0
5
10
98 99 00 01 02 03 04 05 06 07 08 09 10 11 12 13 14Low Indebtedness (i) Med Indebtedness (ii)High Indebtedness (iii)
1.4. EMPLOYMENT GROWTH - NET INDEBTEDNESS
%%

BANCO DE ESPAÑA 28 DOCUMENTO DE TRABAJO N.º 1714
APPENDIX
Investment rate (I/K)
Purchase of fixed assets over capital stock.
Employment (n)
Average number of employees during the year.
Capital stock (k)
Fixed assets at replacement cost.
Sales (y)
Total company sales, deflated by the GDP deflator.
Wages (w)
The average company wage is given by direct employment costs (not including social security
contributions) divided by the employment head count and deflated by the GDP deflator.
Gross revenue over total assets (GR/A)
Gross operating profit plus financial revenue divided by total assets.
Net debt over total assets (D/A)
Total outstanding debt less cash and its equivalents divided by total assets.
Interest debt burden (idb)
Interest payments divided by gross operating profit plus financial revenue.
BANCO DE ESPAÑA PUBLICATIONS
WORKING PAPERS
1601 CHRISTIAN CASTRO, ÁNGEL ESTRADA and JORGE MARTÍNEZ: The countercyclical capital buffer in Spain:
an analysis of key guiding indicators.
1602 TRINO-MANUEL ÑÍGUEZ and JAVIER PEROTE: Multivariate moments expansion density: application of the dynamic
equicorrelation model.
1603 ALBERTO FUERTES and JOSÉ MARÍA SERENA: How fi rms borrow in international bond markets: securities regulation
and market segmentation.
1604 ENRIQUE ALBEROLA, IVÁN KATARYNIUK, ÁNGEL MELGUIZO and RENÉ OROZCO: Fiscal policy and the cycle
in Latin America: the role of fi nancing conditions and fi scal rules.
1605 ANA LAMO, ENRIQUE MORAL-BENITO and JAVIER J. PÉREZ: Does slack infl uence public and private labour
market interactions?
1606 FRUCTUOSO BORRALLO, IGNACIO HERNANDO and JAVIER VALLÉS: The effects of US unconventional monetary
policies in Latin America.
1607 VINCENZO MERELLA and DANIEL SANTABÁRBARA: Do the rich (really) consume higher-quality goods? Evidence from
international trade data.
1608 CARMEN BROTO and MATÍAS LAMAS: Measuring market liquidity in US fi xed income markets: a new synthetic
indicator.
1609 MANUEL GARCÍA-SANTANA, ENRIQUE MORAL-BENITO, JOSEP PIJOAN-MAS and ROBERTO RAMOS: Growing like
Spain: 1995-2007.
1610 MIGUEL GARCÍA-POSADA and RAQUEL VEGAS: Las reformas de la Ley Concursal durante la Gran Recesión.
1611 LUNA AZAHARA ROMO GONZÁLEZ: The drivers of European banks’ US dollar debt issuance: opportunistic funding
in times of crisis?
1612 CELESTINO GIRÓN, MARTA MORANO, ENRIQUE M. QUILIS, DANIEL SANTABÁRBARA and CARLOS TORREGROSA:
Modelling interest payments for macroeconomic assessment.
1613 ENRIQUE MORAL-BENITO: Growing by learning: fi rm-level evidence on the size-productivity nexus.
1614 JAIME MARTÍNEZ-MARTÍN: Breaking down world trade elasticities: a panel ECM approach.
1615 ALESSANDRO GALESI and OMAR RACHEDI: Structural transformation, services deepening, and the transmission
of monetary policy.
1616 BING XU, ADRIAN VAN RIXTEL and HONGLIN WANG: Do banks extract informational rents through collateral?
1617 MIHÁLY TAMÁS BORSI: Credit contractions and unemployment.
1618 MIHÁLY TAMÁS BORSI: Fiscal multipliers across the credit cycle.
1619 GABRIELE FIORENTINI, ALESSANDRO GALESI and ENRIQUE SENTANA: A spectral EM algorithm for dynamic
factor models.
1620 FRANCISCO MARTÍ and JAVIER J. PÉREZ: Spanish public fi nances through the fi nancial crisis.
1621 ADRIAN VAN RIXTEL, LUNA ROMO GONZÁLEZ and JING YANG: The determinants of long-term debt issuance by
European banks: evidence of two crises.
1622 JAVIER ANDRÉS, ÓSCAR ARCE and CARLOS THOMAS: When fi scal consolidation meets private deleveraging.
1623 CARLOS SANZ: The effect of electoral systems on voter turnout: evidence from a natural experiment.
1624 GALO NUÑO and CARLOS THOMAS: Optimal monetary policy with heterogeneous agents.
1625 MARÍA DOLORES GADEA, ANA GÓMEZ-LOSCOS and ANTONIO MONTAÑÉS: Oil price and economic growth:
a long story?
1626 PAUL DE GRAUWE and EDDIE GERBA: Stock market cycles and supply side dynamics: two worlds, one vision?
1627 RICARDO GIMENO and EVA ORTEGA: The evolution of infl ation expectations in euro area markets.
1628 SUSANA PÁRRAGA RODRÍGUEZ: The dynamic effect of public expenditure shocks in the United States.
1629 SUSANA PÁRRAGA RODRÍGUEZ: The aggregate effects of government incometransfer shocks - EU evidence.
1630 JUAN S. MORA-SANGUINETTI, MARTA MARTÍNEZ-MATUTE and MIGUEL GARCÍA-POSADA: Credit, crisis
and contract enforcement: evidence from the Spanish loan market.

1631 PABLO BURRIEL and ALESSANDRO GALESI: Uncovering the heterogeneous effects of ECB unconventional
monetary policies across euro area countries.
1632 MAR DELGADO TÉLLEZ, VÍCTOR D. LLEDÓ and JAVIER J. PÉREZ: On the determinants of fi scal non-compliance:
an empirical analysis of Spain’s regions.
1633 OMAR RACHEDI: Portfolio rebalancing and asset pricing with heterogeneous inattention.
1634 JUAN DE LUCIO, RAÚL MÍNGUEZ, ASIER MINONDO and FRANCISCO REQUENA: The variation of export prices
across and within fi rms.
1635 JUAN FRANCISCO JIMENO, AITOR LACUESTA, MARTA MARTÍNEZ-MATUTE and ERNESTO VILLANUEVA:
Education, labour market experience and cognitive skills: evidence from PIAAC.
1701 JAVIER ANDRÉS, JAVIER J. PÉREZ and JUAN A. ROJAS: Implicit public debt thresholds: an empirical exercise
for the case of Spain.
1702 LUIS J. ÁLVAREZ: Business cycle estimation with high-pass and band-pass local polynomial regression.
1703 ENRIQUE MORAL-BENITO, PAUL ALLISON and RICHARD WILLIAMS: Dynamic panel data modelling using maximum
likelihood: an alternative to Arellano-Bond.
1704 MIKEL BEDAYO: Creating associations as a substitute for direct bank credit. Evidence from Belgium.
1705 MARÍA DOLORES GADEA-RIVAS, ANA GÓMEZ-LOSCOS and DANILO LEIVA-LEON: The evolution of regional
economic interlinkages in Europe.
1706 ESTEBAN GARCÍA-MIRALLES: The crucial role of social welfare criteria for optimal inheritance taxation.
1707 MÓNICA CORREA-LÓPEZ and RAFAEL DOMÉNECH: Service regulations, input prices and export volumes: evidence
from a panel of manufacturing fi rms.
1708 MARÍA DOLORES GADEA, ANA GÓMEZ-LOSCOS and GABRIEL PÉREZ-QUIRÓS: Dissecting US recoveries.
1709 CARLOS SANZ: Direct democracy and government size: evidence from Spain.
1710 HENRIQUE S. BASSO and JAMES COSTAIN: Fiscal delegation in a monetary union: instrument assignment
and stabilization properties.
1711 IVÁN KATARYNIUK and JAIME MARTÍNEZ-MARTÍN: TFP growth and commodity prices in emerging economies.
1712 SEBASTIAN GECHERT, CHRISTOPH PAETZ and PALOMA VILLANUEVA: Top-down vs. bottom-up? Reconciling
the effects of tax and transfer shocks on output.
1713 KNUT ARE AASTVEIT, FRANCESCO FURLANETTO and FRANCESCA LORIA: Has the Fed responded to house
and stock prices? A time-varying analysis.
1714 FÁTIMA HERRANZ GONZÁLEZ and CARMEN MARTÍNEZ-CARRASCAL: The impact of fi rms’ fi nancial position on
fi xed investment and employment. An analysis for Spain.
Unidad de Servicios AuxiliaresAlcalá, 48 - 28014 Madrid
E-mail: [email protected]