Embed Size (px)
Citation preview

+
The Impact of Food and Drink Marketing on
Scotland’s Children and Young People
A report
on the results of questions about exposure and purchase responses
included in IPSOS-Mori’s 2014 Young People in Scotland Survey
Georgina Cairns
September 2015
ISM Institute for Social Marketing
A collaboration between the University of Stirling and The Open University
INSTITUTE FOR SOCIAL MARKETING University of Stirling & the Open University Stirling FK9 4LA Scotland Telephone: +44 (0) 1786 467390 Email: [email protected]

ii
CONTENTS 1. EXECUTIVE SUMMARY 1 2. INTRODUCTION 4 3. METHODS 7 4. RESULTS 11 4.1 Exposure to Food and Drink Marketing Promotions 11 4.2 Differences in Awareness of Food and Drink Marketing 12 4.3 The Foods and Drinks That Young People are Observing Promotions For 16 4.4 Purchase Responses to Food and Drink Marketing Promotions 18 4.5 Differences in Purchase Responses to Food and Drink Marketing 19 4.6 The Foods and Drinks Young People Buy in Response to Marketing 23 4.7 Purchases in Response to Till Display and Prompts 25 4.8 Purchases in Response to Price Promotions 26 5. DISCUSSION AND CONCLUSIONS 28 5.1 Exposure to Food and Drink Marketing 28 5.2 Food and Drink Purchases in Response to Marketing Overall 29 5.3 The Nature and Effects of Till-based Promotions 30 5.4 The Nature and Effects of Price Promotions 30 5.5 Congruence of Commercial Food and Drink Marketing with SHC’s 32 Consumer and Community Healthier Choices Promotional Strategy 5.6 In Summary 33 6. REFERENCES 34 Appendices Appendix 1: Food Standards Scotland foods and drinks classification 36
Appendix 2: Survey questions and response options 38 Appendix 3: Notes on computation of data and statistical analysis 41 List of Figures Figure 1: Breakdown of food and drink marketing methods: all observations 11 Figure 2: Frequency of marketing observations per respondent: all respondents 12 Figure 3: Exposure to marketing promotions: all classifiable responses 18 Figure 4: Breakdown of marketing methods prompting purchase: all reported purchases 19 Figure 5: Frequencies of marketing-prompted purchases per respondent: all respondents 20 Figure 6: Purchases in response to marketing: all classifiable responses 25 Figure 7: Purchases in response to till displays and prompts: all classifiable responses 26 Figure 8: Purchases in response to price promotions: all classifiable responses 27

iii
ACKNOWLEDGMENTS
The author would like to thank Institute for Social Marketing, University of Stirling colleagues,
Anne Marie MacKintosh for her help with statistical analysis and Aileen Paton for her help
with production of the final report. The author also wishes to thank Lily Cairns-Haylor for her
help preparing the charts included in this report. She is also grateful to Anne Milne and Gillian
Purdon from Food Standards Scotland and to Iain MacAllister and Peter Faassen de Heer from
the Scottish Government for their comments on earlier drafts of the report. Finally, the author
also takes this opportunity to acknowledge and thank Anne Milne, Gillian Purdon, Iain
MacAllister, Peter Faassen de Heer as well as Ipsos-MORI for their contributions in the
development of the survey questions.

1
1. EXECUTIVE SUMMARY
As well as increasing awareness and positive attitudes to promoted products, marketing also
directly influences purchase. In 2014 the Scottish Government commissioned research to
investigate the scale and nature of these effects on Scotland’s youth. Questions on exposure
as well as purchase responses to a range of currently prevalent food and drink marketing
methods were administered to 2,285 school students aged 11-18 years.
Survey findings indicate that food and drink marketing is a substantively salient feature of the
food environment in which Scotland’s youth make their dietary choices: collectively,
respondents reported seeing 4,426 food and drink marketing promotions and buying 1,897
products in response to a marketing promotion during the 7 days preceding their participation
in the survey. Nearly two thirds (63.5%, n=1446) of survey respondents reported seeing 1 or
more food and/or drink marketing promotion and nearly half (47%, n=1074) reported buying
1 or more food or drink in response to a marketing promotion during this 7 day period.
Price based promotions and advertising are the most salient forms of marketing for young
people (respectively 36 and 21 percent of all reported observations were attributed to these
2 marketing methods). Respondents also reported high levels of awareness of sponsorship,
social media marketing and outdoor/public space promotions.
The marketing landscape is dominated by promotions for foods and drinks targeted for
reduction in the Scottish Government’s Supporting Healthy Choices Framework because of
high energy/fat/salt and/or free sugar content. Seventy four percent of classifiable marketing
promotion observations were for these energy dense, low nutrition foods. The marketing of
foods and drinks high in free sugars, such as sugar sweetened soft drinks and confectionery
are particularly salient: 24 percent of classifiable observations were for sugar sweetened soft
drinks and 21 percent were for chocolate and sugar based confectionery.
High fat, salt, sugar foods and drinks are also the products most frequently bought in response
to marketing promotions. Sixty eight percent of classifiable purchases were for foods targeted

2
for reduction or reformulation in the Scottish Government’s Supporting Healthy Choices
Framework. Sugar sweetened soft drinks were especially dominant, with 23 percent of
classifiable purchases attributed to this category. Other high sugar products are also
frequently and effectively promoted: together, sugar based confectionery and chocolate
were responsible for 22 percent of all classifiable marketing-prompted purchases for
example.
Price promotions were by far the most frequently reported marketing method to prompt a
food or drink purchase. Fifty four percent of all reported marketing-prompted purchases were
attributed to some form of price promotion. Here too, high fat, salt, sugar foods and drinks
are dominant - over half (57 percent) of all classifiable price incentivised purchases were for
foods targeted for reduction in the Supporting Healthy Choices Framework. Sugar sweetened
soft drinks are the most dominant category, responsible for nearly a quarter (24 percent) of
all classifiable price-incentivised purchases. Other high sugar foods, especially chocolate and
sugar based confectionery are also heavily promoted: together these 3 product categories
accounted for 35 percent of all classifiable price-incentivised purchases.
High sugar foods are especially dominant in till-based marketing – sugar based confectionery,
chocolate and sugar sweetened soft drinks accounted for 84 percent of all classifiable till-
prompted purchases.
High salt and high fat foods were also found to be disproportionately salient in the food and
marketing landscape. For example, just 1 high fat, high salt product category - savoury snacks
- was responsible for 7 percent of all classifiable observations of marketing techniques, 8
percent of purchases in response to any form of marketing and 10 percent of price-
incentivised purchases.
On the other hand, visibility of marketing promotions for foods and drinks that are positively
supportive of dietary health and wellbeing is low. Less than 10 percent of classifiable
marketing observations and reports of purchase were attributed to foods and drinks targeted
for promotion in the Supporting Healthy Choices Framework.

3
In summary, survey results demonstrate there is a convincing, evidence-based case for the
marketing focused objectives included in the Scottish Government’s Supporting Healthy
Choices Framework. They indicate there are substantive opportunities for food and drink
marketers to rebalance the mix of food and drink promoted towards a more health supportive
choice set. There are also significant opportunities for marketers to build on and strengthen
their current corporate responsible marketing policies by reducing the volume of price
incentives to purchase energy dense, high fat, salt, sugar products, and by reducing the
volume and/or completely eliminating high sugar products from till-based promotions.

4
2. INTRODUCTION
A recent assessment of Scotland’s dietary public health status concluded that the Scottish diet
has ‘failed for many years to achieve the dietary recommendations set out in the Scottish
dietary goals’ (FSAS & Scottish Government, 2014a). The continued excess consumption of
foods and drinks high in energy, total and saturated fats, free sugars and salt (HFSS foods) is
noted to be of particular concern, as are its effects on overweight and obesity: approximately
65 percent of adults in Scotland and 30 percent of young people aged 2-15 years are
estimated to be at risk of overweight and obesity (Scottish Government, 2013).
Previous surveys of dietary habits have indicated that a substantive proportion of marketing
encourages the consumption of energy dense and/or HFSS foods: for example a recent survey
of Scottish purchases into the home, estimated that nearly 38 percent of all food energy
(calories) and 41 percent of food energy derived from total and saturated fats were purchased
in response to price promotions (FSAS & Scottish Government 2014a). Hence, one of the four
key principles of the Scottish Government’s Supporting Healthy Choices (SHC) Policy
Framework is to ‘rebalance promotional activities to significantly shift the balance towards
healthier choices’ (FSAS & Scottish Government, 2014b); and one of the four key priority areas
of the Government’s long term obesity strategy is ‘controlling exposure to, demand for, and
consumption of, excessive quantities of high calorific foods and drinks’ (Scottish Government,
2010).
In 2014, the Scottish Government commissioned the market research company, Ipsos-MORI
(I-M) to administer two sets of research questions aimed at generating evidence on exposure
levels and purchase responses of Scotland’s youth to a wide range of food and drink
marketing methods. Questions were designed to examine the prevalence and salience1 of
food and drink marketing, which marketing methods were most salient and which were most
effective in eliciting purchase amongst young people, and for what types of foods and drinks.
1 Salience is used here to describe the conspicuousness of marketing promotions, relative to other elements present in the food environment. It is therefore an indicator of the impact of promotions in terms of visibility and/or perceived importance to the person(s) reporting awareness/observations of their presence or absence.

5
The questions were administered as part of the I-M’s Young People in Scotland omnibus
survey. Two thousand, two hundred and eight five young people aged 11-18 years
participated in the survey. They were invited to answer questions included in the self-
administered questionnaire based survey on their observations of, and responses to, a range
of promotional activities for any and all foods and drinks. Closed questions were used to
capture data on which marketing techniques respondents had observed and which had
elicited a purchase response during the preceding 7 day period. Open questions were used
capture data on which food and drink products were observed to be marketed and/or were
purchased in response. Descriptions of the food and drink products were sorted into 1 of 47
food categories and 1 of 3 dietary health based classification groups. A copy of the 47 food
and drink category coding frame is included in this report as an Appendix and definitions for
the 3 dietary health based group classifications are as follows:
foods and drinks which can support a healthy diet and are targeted for promotion in
the SHC Framework (SHC Promote);
foods and drinks targeted for reduction or reformulation in the SHC Framework, plus
other foods and drinks high in calories, fats, free sugars and/or salt in the diet in
Scotland (HFSS);
foods and drinks not targeted for promotion in the SHC Framework or are not
classifiable without nutritional information (Unclassified).
The data was also critically appraised for implications regarding SHC Policy Commitments # 1,
4, 8 and 11 (FSAS & Scottish Government, 2014b):
Commitment # 1: We invite retailers and out of home caterers to take pragmatic steps
to remove confectionery and sugary drinks from till points, checkouts aisles and areas
around checkouts.
Commitment #4: We invite retailers to rebalance their food and drinks offering and
promotions, both in-store and online to positively support consumers to make
healthier choices.
Commitment # 8: We invite the food industry and other relevant partners to work
with the Scottish Government to build upon existing practice on the responsible

6
marketing of food and drink high in fat, salt and sugar to reduce children’s exposure
to messaging.
Commitment # 11: We invite food industry businesses and other relevant partners to
work in partnership with Scottish Government to implement our new healthy eating
social marketing campaign.
This report is intended to contribute to the evidence base on the current Scottish food and
drink marketing landscape and its impacts. It provides insights on the marketing landscape in
which young people are making food choices and which marketing methods are most salient
and/or effective in eliciting purchase. It provides quantitative data on Scottish youth’s
exposure to commercial food and drink marketing, the food and drinks being promoted and
by what means, as well as the impact of marketing on their purchase choices. It also therefore
provides a baseline against which the future progress of SHC’s marketing related objectives
can be monitored and evaluated.
Future surveys, along with other dietary public health evidence also provide a means through
which changes in commercial marketing practice and their contribution to the nations’ dietary
public health and wellbeing can be monitored and evaluated. Additionally, evidence from this
and future surveys can inform the design, development and implementation of future
intervention planning aimed at reducing adverse impacts of marketing on the nation’s dietary
health and wellbeing.

7
3. METHODS
I-M were responsible for overall survey design and methodology. The research questions on
food marketing were developed as a collaborative effort between the University of Stirling,
Food Standards Scotland (FSS)2 and the Scottish Government’s along with helpful inputs on
logistics and administration considerations from I-M.
The study was conducted September-November 2014 as part of I-M’s school-based repeating
omnibus Young People in Scotland Survey. The survey involved a representative sample of
2285 youth aged 11-18 years recruited from 50 state schools across Scotland. Schools were
selected from the Scottish Government’s school database using a sampling frame stratified
by local authority, school size, and urban-rural classification. Two school years from each
included school were selected through randomised allocation. Respondents participated in
the survey during mixed ability class time (e.g. Personal and Social Education) through a
confidential self-completion, paper-based questionnaire. Teachers were provided with
written instructions on questionnaire administration. To ensure confidentiality each
respondent was provided with a sealable envelope for their competed questionnaire.
I-M confirmed that all research activities were conducted in accordance with the Market
Research Society’s Code of Conduct for good practice (MRS, 2014). Information leaflets and
opt-out forms were provided to respondents’ parents and/or guardians. Students were
provided with information leaflets explaining the purpose of the survey, how confidentiality
was maintained and that they were free to accept or decline the invitation to participate and
if they chose to participate to what extent they did so.
Two sets of closed and open-ended research questions were used to capture data on food
and drink marketing impacts. Closed questions asking respondents to select a yes/no/don’t
know response were used to capture respondents’ observations of, and purchase responses
to, a range of specified food and drink marketing techniques during the past 7 days.
2 On the 1st April 2015, Food Standards Scotland took on all of the functions previously carried out in Scotland
by the Food Standards Agency.
8
Respondents were asked if during the previous 7 days they had seen any for food and drink
marketing involving the following techniques:
A television or cinema advert (advert)
In sponsorship of a programme or film on TV or online (sponsorship)
In an advert on Facebook, Twitter, YouTube or on any other social media (social media)
In a special offer or price promotion in a shop (price)
In school (school)
In a magazine, newspaper, leaflet or any other printed material (print)
At a public event such as a football match or concert or an outdoor place such as a
billboard or bus (outdoors)
In a text or email message (digital)
Respondents were also asked if during the previous 7 days they had purchased any food and
drink in response to the following food and drink marketing techniques:
The chance to enter a competition, win a prize or receive a giveaway (prize)
There was a special offer on the product (e.g. a meal deal, buy one get one free or a
price reduction) (price)
Because a celebrity or cartoon character advertises the product (endorsement)
Because the product sponsors an event, personality or team that you like
(sponsorship)
Because you saw or heard an advert for the product (advert)
Because the product was on display at the till point/cash desk and /or the checkout
assistant suggested it (till prompt)
A copy of the two sets of questions is included in the Appendices.
Respondents who answered yes to any of the questions above were asked to write a short
description of the food and/or drink for which they had observed a marketing promotion and
/ or bought in response to any of the specified marketing techniques.
9
A coding frame developed by FSS for the survey was provided to I-M to guide their translation
of respondent’s descriptions into 47 food and drink categories. A copy of the coding frame is
included in the Appendices. I-M also noted and recorded all written responses which could
not be coded for reasons of illegibility, insufficiency of information or were outside the scope
of the study (e.g. alcoholic drinks).
As well as providing direction on the 47 food and drink categories, the coding frame facilitated
the classification of responses into one of the following 3 dietary health based food and drink
groups:
foods and drinks which can support a healthy diet and are targeted for promotion in
the SHC Framework for example fruit, vegetables and water(SHC Promote);
foods and drinks targeted for reduction or reformulation in the SHC Framework, plus
other foods and drinks high in calories, fats, free sugars and/or salt in the diet in
Scotland for example sugar based confectionery, sugar sweetened soft drinks and
savoury snacks (HFSS);
foods and drinks not targeted for promotion in the SHC Framework or are not
classifiable without nutritional information for example fruit juices and sandwiches
(Unclassified).
Demographic data was recorded and case weightings for gender, year group, urban-rural
classification and Scottish Index of Multiple Deprivation (SIMD) classification (Scottish
Government, 2012) was computed and compiled by I-M.
I-M provided a complete fully anonymised, and coded dataset to the Scottish Government.
The data was analysed on behalf of the Scottish Government by the University of Stirling,
using IBM SPSS Version 21 software and Microsoft Excel 2010 was used to generate the
graphs included in this report. The report was prepared by the University of Stirling.
Descriptive statistics (frequency counts and percentages) were used to assess respondent’s
exposure and purchase responses to each of the specified marketing techniques and to food
and drink marketing overall. The same methods were used to assess which food and drink
product categories were most prominent to young people and were being bought in response

10
to marketing. Frequency counts are reported in whole numbers and percentages to the
nearest 0.5 percent. Chi-square (X2) tests were used to investigate if respondent’s awareness
of marketing and marketing-prompted purchases were related to gender, deprivation levels
as measured by SIMD classification and/or age as measured by school year. Statistically
significant associations and trends identified from this analysis are presented in the body of
the report and a more complete report on data computation and statistical testing is included
in the Appendices.

11
4. RESULTS
4.1 Exposure to Food and Drink Marketing Promotions
The total number of observations of food and drink marketing promotions reported was
4,426. Observations of food and drink marketing promotions in order of decreasing frequency
were: advertisements on TV or in the cinema (35%, n=1538), price promotions (21%, n=939),
film or programme sponsorship (10%, n=463), on social media and in outdoor/public
advertising spaces (9%, n=420 and n=397 respectively), in print media (7%, n=295), in school
(6%, n=271) and in personalised digital forms such as text messaging (2%, n=103). A
breakdown of marketing method observations is illustrated in Figure 1: Breakdown of food
and drink marketing methods: all observations.
Figure 1: Breakdown of food and drink marketing methods: all observations
advert35%
sponsorship10 %
social media9%
price 21%
school6%
print7%
outdoors9%
digital 2%

12
4.2 Differences in Awareness of Food and Drink Marketing
Breakdown and analysis of the characteristics of all respondents answering yes to one or more
of the questions on observations of food and drink marketing found the following:
Nearly two thirds (63.5%, n=1446) of the whole respondent population (n=2285) reported 1
or more observation of a food or drink product promotion during the previous 7 days. A little
over a third of the sample (36.5%, n=839) did not recall seeing any food or drink promotion
during the previous 7 days. Nearly a quarter (23.5%, n=533) of the whole sample reported 1
observation, 27 percent (n=614) reported 2-3 observations and 13 percent (n=299) reported
4-8 observations. A breakdown of observations frequencies per respondents is presented in
Figure 2: Frequency of reported awareness of marketing promotion: all respondents.
Figure 2: Frequency of marketing observations per respondent: all respondents
Breakdown and analysis of all marketing observations by gender found 62 percent (n=698) of
male respondents and 65 percent (n=725) of females reported seeing 1 or more marketing
promotion during the previous 7 days. X2 tests found no statistically significant differences in
the observation frequencies of boys and girls.

13
More detailed breakdown and analysis of observations by gender and marketing methods
found 49 percent (n=497) of observations of adverts were reported by boys and 51 percent
(n=515) were reported by girls. Fifty six percent (n=235) of sponsorship promotions were
observed by boys and 44 percent (n=188) by girls. Fifty two percent (n=198) of social media
promotions were observed by boys and 48 percent (n=182) by girls. Fifty two percent (n=376)
of price promotions were observed by boys and 48 percent (n=343) by girls. Forty eight
percent (n=106) of in school promotions were observed by boys and 52 percent (n=115) by
girls. Fifty percent (n=129) of print promotions were observed by boys and 50 percent (n=127)
by girls. Sixty percent (n=202) of outdoors promotions were observed by boys and 40 percent
(n=135) by girls. Forty six percent (n=44) of digital promotions were observed by boys and 54
percent (n=52) by girls.
X2 tests found the relatively more frequent reports of sponsorship based marketing and
outdoor spaces/public events marketing by boys than girls were both statistically significant
differences (sponsorship = p < .02 and outdoor = p < .01).
Breakdown and analysis of reported observations of all/any marketing by age/school year
overall found 60.5 percent (n=240) of S1 respondents, 63.5 percent (n=262) of S2, 66.5
percent (n=272) of S3, 58 percent (n=241) of S4, 63.5 percent (n=240) of S5 and 70.5 percent
(n=191) of S6 respondents reported seeing 1 or more marketing promotion during the
previous 7 days. X2 tests found no significant relationship trend in observation frequencies
across the 6 age/school year groups.
More detailed breakdown and analysis of observations by age/school year and marketing
methods found the following:
Thirty and a half percent (n=156) of S1 marketing observations, 30 percent (n=187) of S2, 28
percent (n=210) of S3, 30.5 percent (n=174) of S4, 27 percent (n=167) of S5 and 31.5 percent
(n=132) of S6 observations were for adverts. X2 tests found no significant relationship trend in
observation frequencies across the 6 age groups.

14
Eleven and a half percent (n=59) of S1 marketing observations, 12.5 percent (n=78) of S2, 12
percent (n=91) of S3, 13 percent (n=73) of S4, 13 percent (n=79) of S5 and 11.5 percent (n=48)
of S6 observations were for sponsorship promotions. X2 tests found no significant relationship
trend in observation frequencies across the 6 age groups.
Ten and a half percent (n=53) of S1 marketing observations, 12 percent (n=75) of S2, 11.5
percent (n=86) of S3, 12 percent (n=67) of S4, 11 percent (n=68) of S5 and 8.5 percent (n=35)
of S6 observations were for social media promotions. X2 tests found no significant relationship
trend in observation frequencies across the 6 age groups.
Nineteen percent (n=97) of S1 marketing observations, 19 percent (n=117) of S2, 19.5 percent
(n=146) of S3, 23 percent (n=129) of S4, 20.5 percent (n=127) of S5 and 26.5 percent (n=112)
of S6 observations were for price promotions. X2 tests found the increasing frequency of
observations of price promotions with increasing age/school year was statistically significant
(p < .01).
Eight and a half percent (n=44) of S1 marketing observations, 5.5 percent (n=35) of S2, 7.5
percent (n=55) of S3, 5 percent (n=28) of S4, 7 percent (n=42) of S5 and 4.5 percent (n=19) of
S6 were for in school promotions. X2 tests found no significant relationship trend in
observation frequencies across the 6 age groups.
Seven percent (n=35) of S1 marketing observations, 7.5 percent (n=45) of S2, 8.5 percent
(n=63) of S3, 7 percent (n=41) of S4, 9.5 percent (n=58) of S5 and 10.5 percent (n=16) of S6
marketing observations were for print promotions. X2 tests found no significant relationship
trend in observation frequencies across the 6 age groups.
Ten and a half percent (n=54) of S1 marketing observations, 11.5 percent (n=71) of S2, 10
percent (n=77) of S3, 6.5 percent (n=37) of S4, 9.5 percent (n=58) of S5 and 10.5 percent
(n=43) of S6 marketing observations were for outdoors promotions. X2 tests found no
significant relationship trend in observation frequencies across the 6 age groups.

15
Two and a half percent (n=13) of S1 marketing observations, 2 percent (n=11) of S2, 3 percent
(n=24) of S3, 3 percent (n=17) of S4, 3 percent (n=19) of S5 and 3.5 percent (n=14) of S6
marketing observations were for digital promotions. X2 tests found no significant relationship
trend in observation frequencies across the 6 age groups.
Breakdown and analysis of reported observations by relative deprivation, as measured by
SIMD status found 59 percent (n=267) of respondents classed as SIMD 1 (most deprived), 60.5
percent (n=261) classed as SIMD 2, 63 percent (n=275) classed as SIMD 3, 68 percent (n=331)
classed as SIMD 4 and 65 percent (n=312) classed as SIMD 5 (least deprived) reported seeing
1 or more marketing observation during the previous 7 days. X2 tests found the increasing
frequency of observations of any/all marketing methods as deprivation levels decreased was
statistically significant (p< .01).
More detailed breakdown and analysis of observations by deprivation levels and marketing
methods found the following:
Thirty one percent (n=198) of SIMD 1 observations, 29 percent (n=176) of SIMD 2, 31.5
percent (n=193) of SIMD 3, 29.5 percent (n=240) of SIMD 4 and 27.5 percent (n=219) of SIMD
5 observations were for adverts. X2 tests found no significant relationship trend in observation
reports across the SIMD quintiles.
Thirteen percent (n=83) of SIMD 1 observations, 12.5 percent (n=77) of SIMD 2, 11.5 percent
(n=71) of SIMD 3, 12 percent (n=98) of SIMD 4 and 12.5 percent (n=100) of SIMD 5
observations were for sponsorship promotions. X2 tests found no significant relationship trend
in observation reports across the SIMD quintiles.
Ten and a half percent (n=69) of SIMD 1 observations, 11.5 percent (n=71) of SIMD 2, 12.5
percent (n=77) of SIMD 3, 10.5 percent (n=84) of SIMD 4 and 10.5 percent (n=83) of SIMD 5
observations were for social media promotions. X2 tests found no significant relationship trend
in observation reports across the SIMD quintiles.

16
Seventeen and a half percent (n=113) of SIMD observations 1, 22.5 percent (n=136) of SIMD
2, 18.5 percent (n=114) of SIMD 3, 22.5 percent (n=184) of SIMD 4 and 23 percent (n=182) of
SIMD 5 observations were for price promotions. X2 tests found the increasing frequency of
observations for price-based promotions as deprivation levels decreased was statistically
significant (p < .01).
Six and a half percent (n=42) of SIMD 1 observations, 6 percent (n=37) of SIMD 2, 5.5 percent
(n=34) of SIMD 3, 7 percent (n=57) of SIMD 4 and 6.5 percent (n=52) of SIMD 5 observations
were for in school promotions. X2 tests found no significant relationship trend in observation
reports across the SIMD quintiles.
Seven and a half percent (n=47) of SIMD 1 observations, 7 percent (n=41) of SIMD 2, 8.5
percent (n=52) of SIMD 3, 7.5 percent (n=62) of SIMD 4 and 7 percent (n=56) of SIMD 5
observations were for print promotions. X2 tests found no significant relationship trend in
observation reports across the SIMD quintiles.
Ten percent (n=65) of SIMD 1 observations 8.5 percent (n=53) of SIMD 2, 9 percent (n=55) of
SIMD 3, 9 percent (n=75) of SIMD 4 and 11.5 percent (n=92) of SIMD 5 observations were for
outdoor/public space promotions. X2 tests found the increasing frequency of observations for
outdoor marketing as deprivation levels decreased was statistically significant (p < .01).
Four percent (n=25) of SIMD 1 observations, 3.5 percent (n=20) of SIMD 2, 3 percent (n=17)
of SIMD 3, 2 percent (n=18) of SIMD 4 and 2 percent (n=18) of SIMD 5 observations were for
digital promotions. X2 tests found no significant relationship trend in observation reports
across the SIMD quintiles.
4.3 The Foods and Drinks That Young People Observe Promotions For
Sixty two percent (n=2734) of respondents’ descriptions of exposure observations (reported
by 1030 respondents) included sufficient information for answers to be coded and sorted into

17
1 of the 47 FSS-defined food and drink categories and therefore 1 of the 3 dietary-health
based group classifications. This facilitated an assessment of which food and drink products
young people most frequently observed promotions for, and the relative share of marketing
promotions for HFSS, SHC Promote, Unclassified foods and drinks salient to young people. It
also facilitated an evaluation of the implications of current marketing practice with regards
to SHC Commitment #8 (reduce children’s exposure to promotional messaging for HFSS
products and increase responsible marketing practices).
Almost three quarters (73.5%, n=2,014) of reported marketing observations were for HFSS
foods and drinks. Just under 17 percent (n=459) were for Unclassified foods and less than I in
10 (9.5%, n=261) were for foods and drinks included in the SHC Promote group.
In order to identify which specific food and drink categories were most frequently promoted,
all product categories responsible for 3 percent or more of observations were identified. Six
product categories included in the HFSS group were each responsible for 3 percent or more
of respondents’ food and drink marketing observations. In order of decreasing frequency,
these were sugar sweetened soft drinks (24% n=648), chocolate (12% n=331), sugar based
confectionery (9%, n=237), ethnic takeaway (8%, n=214), savoury snacks (7%, n=183) and
sugar sweetened breakfast cereal (3%, n=82). Two Unclassified product categories were
responsible for 3 percent or more of reported observations. These were yoghurt and fromage
frais (3%, n=89) and fruit juice and smoothies (3%, n=82). No individual food or drink category
included in the SHC Promote group accounted for 3 percent or more of reported observations.
The breakdown of reported observations is illustrated in Figure 3: Exposure to marketing
promotions: all classifiable responses.

18
Figure 3: Exposure to marketing promotions: all classifiable responses
4.4 Purchase Responses to Food and Drink Marketing Promotions
Slightly less than half (47%, n=1,074) of all respondents reported at least one marketing-
prompted purchase and just over half (53%, n=1,210) reported no purchases. In total 1,897
marketing-prompted food and drink purchases reports were reported.
Purchases were most frequently attributed to price promotions (54%, n=1,019), followed by
competition and prize-based promotions (12.5%, n=238), till prompts (12%, n=235), adverts
(12%, n=224), sponsorships (6%, n=114), and endorsements (3.5%, n=67). These results are
presented in Figure 4: Breakdown of marketing methods prompting purchase: all reported
purchases.
9.5%
3%
7%
8%
7%
8.5%
12%
24%
11.5%
3%
3%
10.5%
miscellaneous SHC Promote
sugar sweetened b'fast cereals
savoury snacks
ethnic take away
savoury snacks
sugar based confectionery
chocolate
sugar sweetened soft drinks
miscellaneous HFSS
fruit juice and smoothies
yoghurt and fromage frais
miscellaneous Unclassified
Total SHC Promote = 9.5%
Total HFSS = 74%
Total Unclassified = 16.5%

19
Figure 4: Breakdown of marketing methods prompting purchase: all reported purchases
4.5 Differences in Purchase Responses to Food and Drink Marketing
Analysis on the characteristics of all respondents answering yes to one or more of the
questions on awareness of food and drink marketing found the following:
Slightly less than half (47%, n=1,074) of all respondents reported at least one marketing-
prompted purchase and just over half (53%, n=1,210) reported no purchases during the
previous seven days. Thirty two percent (n=725) of respondents reported making only a single
purchase, 10 percent (n=239) reported 2 purchases and 5 percent (n=111) reported 3-6
purchases resulting in a total of 1,897 reports of purchases. A breakdown of purchase
frequencies per respondent is presented in Figure 5: Frequencies of marketing prompted
purchases per respondent: all respondents.
prize12.5 %
price 54 %
endorsement 3.5 %
sponsorship 6 %
advert12 %
till prompt12 %

20
Figure 5: Frequencies of marketing-prompted purchases per respondent: all respondents
Breakdown and analysis of purchases by gender found 46.5 percent (n=522) of male
respondents and 48.5 percent (n=538) of female respondents reported they had made a
marketing-prompted purchase during the previous 7 days. X2 tests found no significant
differences in response rates for boys and girls.
More detailed breakdown and analysis of purchases by gender and marketing methods found
the following:
Twelve and a half percent (n=99) of boys’ purchases and 10.5 percent (n=81) of girls’
purchases were in response to prize-incentivised marketing. Forty eight percent (n=382) of
boys’ purchases and 53 percent (n=407) of girls’ purchases were in response to price-
incentivised marketing. Four and half percent (n=37) of boys’ purchases and 3.5 percent
(n=26) of girls’ purchases were in response to endorsements. Eight and a half percent (n=69)
of boys’ purchases and 5 percent (n=37) of girls’ purchases were in response to sponsorship.
Thirteen and a half percent (n=108) of boys’ purchases and 13 percent (n=98) of girls’
purchases were in response to adverts. Twelve and a half percent (n=101) of boys’ purchases
and 15.5 percent (n=118) of girls’ purchases were in response to till-prompt marketing. X2 tests
53 %32 %
10 %
5 %
Number of items bought/
respondent reporting purchase
3-621
Respondents reporting no purchases
21
found the relatively more frequent reports of sponsorship prompted purchases by boys than
girls was statistically significant (p < .02).
Analysis by age/school year found 47 percent (n=186) of S1 students, 49 percent (n=202) of
S2, 46.5 percent (n= 190) of S3, 51.5 percent (n=213) of S4, 41 percent (n=156) of S5 and 48
percent (n=130) of S6 students reported making a purchase in response to a marketing
promotion during the previous 7 days. X2 tests found no statistically significant relationship
trend between overall purchase responses to all/any marketing methods and age/school
year.
More detailed breakdown of observations by age/school year and marketing method results
are as follows:
Sixteen and a half percent (n=48) of S1, 15 percent (n=45) of S2, 9.5 percent (n=29) of S3, 10.5
percent (n=31) of S4, 10 percent (n=21) of S5 and 7 percent (n=13) of S6 purchases were in
response to prize incentivised marketing. X2 tests found the decreasing frequency of purchase
in response to prize-based marketing with increasing school age was statistically significant (p
< .01).
Thirty eight and a half percent (n=111) of S1, 46 percent (n=141) of S2, 49 percent (n=148) of
S3, 57 percent (n=168) of S4, 56.5 percent (n=120) of S5 and 59.5 percent (n=112) of S6
purchases were in response to price incentivised marketing. X2 tests found the increasing
frequency of purchase in response to price promotions and special offers with increasing
school age was statistically significant (p < .01).
Three percent (n=8) of S1, 6 percent (n=18) of S2, 6.5 percent (n=19) of S3, 1.5 percent (n=5)
of S4, 4 percent (n=9) of S5, and 3 percent (n=5) of S6 purchases were in response to
endorsement marketing. X2 tests found no significant differences in purchase frequencies
across the 6 age groups.
Ten and a half percent (n=30) of S1, 8.5 percent (n=26) of S2, 8.5 percent (n=26) of S3, 5
percent (n=14) of S4, 2 percent (n=4) of S5, and 5 percent (n=9) of S6 purchases were in

22
response to sponsorship marketing. X2 tests found the decreasing frequency of purchases with
increasing age/ school year was statistically significant (p < .01).
Seventeen percent (n=49) of S1, 14 percent (n=42) of S2, 12.5 percent (n=37) of S3, 13.5
percent (n=39) of S4, 10 percent (n=21) of S5, and 11 percent (n=21) of S6 purchases were in
response to advertisements. X2 tests found the decreasing frequency of purchases with
increasing age/ school year was statistically significant (p < .01).
Fifteen percent (n=43) of S1, 11 percent (n=33) of S2, 14 percent (n=42) of S3, 12.5 percent
(n=37) of S4, 17.5 percent (n=37) of S5, and 15 percent (n=28) of S6 purchases were in
response to till-prompted marketing. X2 tests found no significant differences purchase
frequencies across the 6 age groups.
Breakdown and analysis of purchase reports by relative deprivation, as measured by SIMD
status found 47.5 percent (n=215) of respondents classed as SIMD 1 (most deprived)
respondents, 44 percent (n=189) classed as SIMD 2, 44.5 percent (n=194) classed as SIMD 3,
47.5 percent (n=231) classed as SIMD 4 and 51.5 percent (n=246) classed as SIMD 5 (least
deprived) reported making 1 or more marketing prompted purchase during the previous 7
days. X2 tests found no statistically significant relationship trend between overall purchase
responses to all/any marketing methods and deprivation status.
More detailed breakdown and analysis of observations by deprivation levels and marketing
methods found the following:
Seventeen percent (n=54) of SIMD 1 purchases, 11.5 percent (n=33) of SIMD 2, 13 percent
(n=37) of SIMD 3, 10.5 percent (n=36) of SIMD 4 and 7.5 percent (n=27) of SIMD 5 purchases
were in response to prize-incentivised marketing. X2 tests found the increasing frequency of
purchase as deprivation levels increased was statistically significant (p < .01).
Forty seven and a half percent (n=152) of SIMD 1 purchases, 47 percent (n=134) of SIMD 2,
50 percent (n=140) of SIMD 3, 51 percent (n=179) of SIMD 4 and 54.5 percent (n=194) of SIMD
23
5 purchases were in response to price-incentivised marketing. X2 tests found the increasing
frequency of purchase as deprivation levels decreased was statistically significant (p < .05).
Six percent (n=19) of SIMD 1 purchases, 4 percent (n=12) of SIMD 2, 8 percent (n=7) of SIMD
3, 5.5 percent (n=13) of SIMD 4 and 7 percent (n=13) of SIMD 5 purchases were in response
to endorsement marketing. X2 tests found no significant relationship trend in purchasing
across the SIMD quintiles.
Eight percent (n=26) of SIMD 1 purchases, 6.5 percent (n=19) of SIMD 2, 2.5 percent (n=22)
of SIMD 3, 3.5 percent (n=19) of SIMD 4 and 3.5 percent (n=24) of SIMD 5 purchases were in
response to sponsorship marketing. X2 tests found no significant relationship trend in
purchasing across the SIMD quintiles.
Nine and a half percent (n=30) of SIMD 1 purchases, 18.5 percent (n=53) of SIMD 2, 9.5
percent (n=27) of SIMD 3, 13.5 percent (n=48) of SIMD 4 and 14.5 percent (n=52) of SIMD 5
purchases were in response to advertisements. X2 tests found no significant relationship trend
in purchasing across the SIMD quintiles.
Twelve percent (n=38) of SIMD 1 purchases, 12 percent (n=34) of SIMD 2, 17 percent (n=47)
of SIMD 3, 16 percent (n=56) of SIMD 4 and 12.5 percent (n=45) of SIMD 5 purchases were in
response to till prompts. X2 tests found no significant relationship trend in purchasing across
the SIMD quintiles.
4.6 The Foods and Drinks Young People Buy in Response to Marketing
Seventy two and a half percent (n=1,377) of respondents’ descriptions of purchases in
response to marketing (provided by 812 respondents) included sufficient legible information
for answers to be coded and sorted into 1 of the 47 FSS-defined food and drink categories
and 1 of the 3 dietary-health based group classifications. This facilitated an assessment of
which food and drink products young people most frequently bought and the relative share

24
of HFSS, SHC Promote, and Unclassified food groups bought in response to marketing
promotions. It also facilitated an assessment of the implications of current marketing practice
with regards to SHC Commitment #1 (inviting retailers and out of home caterers to take
pragmatic steps to remove confectionery and sugary drinks from till points, checkouts aisles
and areas around checkouts) and Commitment #4 (inviting retailers to rebalance their food
and drinks offering and promotions, both in-store and online to positively support consumers
to make healthier choices).
Sixty eight percent (n=933) were for HFSS products, 9 percent (n=124) were SHC Promote
products and 23 percent (n=320) were for food and drinks in the Unclassified group.
In order to identify which HFSS food and drink categories were most frequently bought in
response to marketing, all product categories responsible for 3 percent or more of all
categorised purchases were identified:
In order of decreasing frequency, sugar sweetened soft drinks (23%, n=318), chocolate (11%,
n=155) and sugar based confectionery (11%, n=147), savoury snacks (8%, n=109), ethnic
takeaway (3.5%, n=49) and sweet and savoury biscuits (3%, n=43) were all responsible for 3
percent or more of identifiable purchases. Two Unclassified product categories were
responsible for 3 percent or more of marketing-prompted purchases. These were sandwiches
(12%, n=165), and fruit juices and smoothies (5%, n=70). The only SHC Promote product
category responsible for 3 percent or more of marketing-prompted sales was bottled water
(3%, n=44). The breakdown of reported observations is also presented in Figure 6: Purchases
in response to marketing: all classifiable responses.

25
Figure 6: Purchases in response to marketing: all classifiable responses
4.7 Purchases in Response to Till Displays and Prompts
To evaluate the implications of current till marketing effects on purchase behaviours with
regard to Commitment # 1 (removing confectionery and sugary drinks from till and check out
areas), frequency counts for all classifiable purchases in response to till/cash desk displays
and prompts were performed. Ninety three percent were for HFSS products. Four percent of
purchases were for Unclassified products and 3 percent were for SHC Promote products.
A search for individual food products responsible for 3 percent or more of till-prompted
purchases identified 4 HFSS product categories. In order of decreasing frequency these were
3%
6%
3%
3.5%
8%
11%
11%
23%
9%
5%
12%
6%
water
miscellaneous SHC Promote
sweet and savoury biscuits
ethnic take away
savoury snacks
sugar based confectionery
chocolate
sugar sweetened soft drinks
miscellaneous HFSS
fruit juice and smoothies
sandwiches
miscellaneous Unclassified
Total SHC Promote = 9%
Total HFSS = 68%
Total Unclassified = 23%

26
sugar based confectionery (46%, n=81), chocolate (31%, n=55), sugar sweetened soft drinks
(6%, n=10) and savoury snacks (3%, n=6). Figure 7: Purchases in response to till displays and
prompts: all classifiable responses provides an illustrative breakdown of purchases by product
categories and dietary health based group classifications.
Figure 7: Purchases in response to till displays and prompts: all classifiable responses
4.8 Purchases in Response to Price Promotions
Price incentivised forms of marketing such as meal deals, buy-one-get-one-free and money
off future purchase offers was the marketing method most frequently reported to prompt
purchase. Sixty percent (n=833) of all classifiable product purchases were bought in response
to some form of price promotion. In order to evaluate implications of current marketing
practice effects on purchase behaviours with regard to Commitment # 4 (rebalancing price
promotions in favour of healthier choices), frequency counts for classifiable product
purchases in response to price promotions were performed. Over half (57%, n=477) of
purchases were for HFSS products, a third (33%, n=273) were for Unclassified products and
just 10 percent (n=83) were for products included in the SHC Promote group.
4%
3%
31%
6%
10%
46%
miscellaneous Unclassified
miscellaneous SHC Promote
chocolate
sugar sweetened soft drinks
miscellaneous HFSS
sugar based confectionery
Total HFSS= 93%
Total SHC Promote = 3%
Total Unclassified = 4%
27
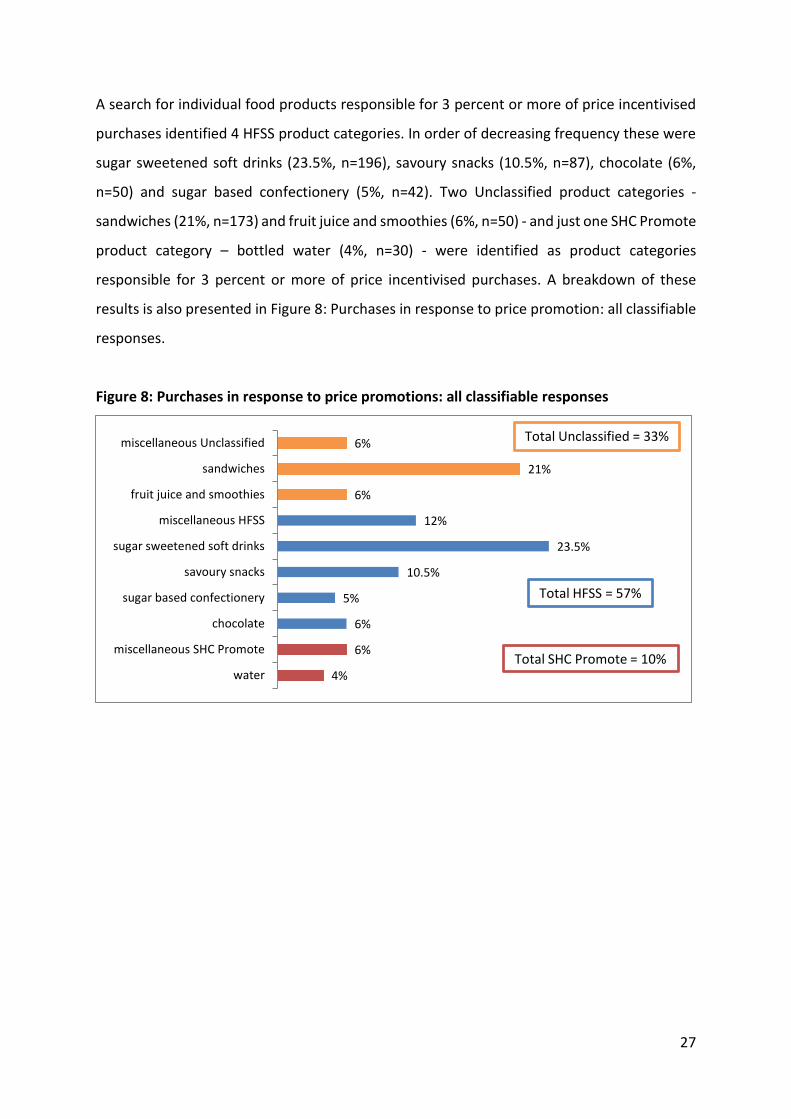
A search for individual food products responsible for 3 percent or more of price incentivised
purchases identified 4 HFSS product categories. In order of decreasing frequency these were
sugar sweetened soft drinks (23.5%, n=196), savoury snacks (10.5%, n=87), chocolate (6%,
n=50) and sugar based confectionery (5%, n=42). Two Unclassified product categories -
sandwiches (21%, n=173) and fruit juice and smoothies (6%, n=50) - and just one SHC Promote
product category – bottled water (4%, n=30) - were identified as product categories
responsible for 3 percent or more of price incentivised purchases. A breakdown of these
results is also presented in Figure 8: Purchases in response to price promotion: all classifiable
responses.
Figure 8: Purchases in response to price promotions: all classifiable responses
4%
6%
6%
5%
10.5%
23.5%
12%
6%
21%
6%
water
miscellaneous SHC Promote
chocolate
sugar based confectionery
savoury snacks
sugar sweetened soft drinks
miscellaneous HFSS
fruit juice and smoothies
sandwiches
miscellaneous Unclassified
Total SHC Promote = 10%
Total HFSS = 57%
Total Unclassified = 33%

28
5. DISCUSSION AND CONCLUSIONS
5.1 Exposure to Food and Drink Marketing
The results of this survey indicate food and drink marketing is a prominent feature of the food
environment in which Scotland’s youth make their dietary choices: a total of 4,426
observations in the 7 day period preceding the survey were reported by 63.5 percent of
survey respondents.
Results also indicate the marketing landscape is dominated by promotions for foods and
drinks high in energy, fat, salt and sugars: 73.5 percent of classifiable observations were of
HFSS foods and drinks. Less than 10 percent of classifiable responses were for SHC Promote
product categories, such as fruit, vegetables, water and bottled water.
Promotions for sugar-sweetened products are especially salient to young people. Just 4
product categories (sugar-based confectionery, sugar sweetened soft drinks, chocolate and
sweetened breakfast cereal) collectively accounted for more than 50 percent of all classifiable
observations. Promotions for sugar-sweetened soft drinks, which were responsible for the
greatest proportion of classifiable observations (24 percent) is a category whose marketing
particularly warrants continued monitoring and evaluation.
Survey results also indicate that a substantive proportion of marketing promotions salient to
young people are for product categories targeted for reduction and/or reformulation in the
SHC Framework because of relatively high fat and/or salt levels. Fifteen percent of classifiable
observation were attributed to just 2 product categories classified as HFSS because of high
fat and/or salt content. These were savoury snacks (7 percent) and traditionally prepared
ethnic takeaway foods, such as Indian and Italian pre-prepared meals (8 percent).
Advertising and price based promotions are the most visible forms of marketing, together
accounting for 57 percent of all reported observations, but sponsorship, social media and
outdoor/public space promotions are also important.

29
Overall results on exposure levels indicate there is strong evidence to support of the inclusion
in the SHC Framework of Commitment #8, which invites the food industry to build on and
strengthen responsible marketing practices. Many, substantive opportunities to reduce
young people’s exposure to promotional messaging for HFSS foods and drinks are evident: for
example by reducing the relative share of advertising and price promotions for these product
categories.
Analysis of data against respondent age/school year also indicates that awareness of food and
drink is high across all age groups. Further investigations on the potential benefits of
increasing responsible marketing age thresholds and strengthening protective controls for
younger children are clearly warranted.
5.2 Food and Drink Purchases in Response to Marketing Overall
The disproportionate dominance of marketing promotions for HFSS foods and drinks reported
by survey respondents is similarly reflected in the balance of food and drinks purchased in
response to marketing promotions: More than 50 percent of all classifiable purchase reports
were for food and drink products high in free sugars. Soft drinks, confectionery, sweet baked
goods and sweetened breakfast cereals for example accounted for 53 percent of classifiable
purchases. Additionally, just over 15 percent of classifiable marketing-prompted purchases
were for foods classified as HFSS because of high levels of salt and/or fat.
Better understanding of differential gender effects can contribute to understanding the
impacts of food and drink marketing. For example, a possible explanation for the greater
awareness of sponsorship and outdoor marketing and responsiveness to sponsorship-based
cues to purchase amongst boys than girls may be higher levels of interest in sports. Further
investigations would be required to confirm or refute this possibility and could help in
understanding the affective impacts of marketing on food behaviours.

30
The mixed results with regard to the analysis of marketing impacts by relative deprivation are
perhaps unsurprising. Marketing is just one of many factors that may moderate the impact of
relative deprivation on food behaviours and dietary health outcomes. Statistical analysis of
the survey results found the least deprived young people were most likely to be aware of
all/any marketing promotions in general as well as price-based and outdoors/public event
marketing methods specifically. Statistical analysis also found they were more likely to
purchase products in response to price promotions and advertisements. On the other hand,
statistical analysis also found the most deprived young people were the most likely to
purchase a food or drink in response to prize/competition based marketing. These results
indicate that factors contributing to differential impacts of marketing on young people
according to relative deprivation status are complex and warrant further investigation.
5.3 The Nature and Effects of Till-based Promotions
Commitment # 1 in the SHC Policy Framework invites retailers to remove confectionery and
sugar drinks from point of sale locations such as the areas around sales check out and till
points.
Chocolate and sugar based confectionery along with sugar sweetened soft drinks accounted
for 84 percent of till-prompted purchases. SHC Promote and Unclassified products accounted
for just 11 percent of till-prompted purchases. These results clearly demonstrate there is
much scope for change in retail practices in order that Commitment # 1 is fulfilled and till-
based cues to impulse purchase high sugar foods are reduced and/or eliminated.
5.4 The Nature and Effects of Price Promotions
Many forms of price-led promotions can be used to promote food and drink purchases,
including simple price discounts, money off next purchase vouchers, buy-one-get-one-free,
and special offers for combination purchases, such as meal deals. The results of this survey

31
demonstrate that price-led promotions are very effective in eliciting purchase: price
promotions were responsible for more purchases (54percent) than all other marketing
promotions combined. In common with survey findings on exposure, the effects of price-
based marketing on purchase are heavily skewed towards HFSS products with more than half
(57 percent) of all classifiable purchases attributed to these often energy dense, low nutrition
foods and drinks. High sugar products are especially dominant in purchases prompted by price
promotions and special offers. More than a quarter (24 percent) of all classifiable price-
incentivised purchases were attributed to sugar sweetened soft drinks. Furthermore, 35
percent of all classifiable price-incentivised purchase outcomes could be attributed to just 3
high sugar product categories, namely sugar sweetened soft drinks, chocolate and sugar
based confectionery.
In contrast, only 10 percent of price-incentivised purchases were for SHC Promote products
and the only SHC Promote product contributing significantly to this total was bottled water
(4 percent). The most dominant Unclassified product category was sandwiches (12 percent of
classifiable purchases). Readymade sandwiches ingredients are highly varied and without
nutritional information it is not possible to differentiate between sandwiches high in salt or
fat and therefore classifiable as HFSS, those whose nutrient composition is supportive of a
healthy diet and therefore classifiable as SHC Promote, and those which would remain in the
Unclassified dietary health based group because nutritional composition indicate no reason
to target for reduction or promotion. In view of their significant contribution to marketing-
prompted purchases further investigation into the marketing of sandwiches and their
nutritional composition is warranted.
Overall, survey results indicate there is the potential for a great deal of change in retail
practice in order for Commitment # 4 (for retailers to rebalance their food and drinks offering
and promotions, both in-store and online to positively support consumers to make healthier
choices), to be substantively realised.

32
5.5 Congruence of Commercial Food and Drink Marketing with SHC’s
Consumer and Community Healthier Choices Promotional Strategy
With regards to Commitment # 11 which invites the food industry and other stakeholders to
support the Scottish Government’s social marketing campaign ‘Eat better, feel better’, the
results of this survey indicate current marketing practices are substantively incongruent with
its priority objectives.
For example, objectives of the first phase of the campaign include increasing fruit and
vegetable purchase and consumption, reducing barriers to healthful food behaviours and
increasing positive attitudes towards healthful diet choices. Survey findings on classifiable
exposure and purchase outcomes indicate current marketing practices provide little support
for any of these objectives.
The campaign also aims to prioritise the most deprived population groups. The findings from
this survey were mixed. As discussed above, socioeconomic barriers to healthful dietary
behaviours are complex and marketing is only one of many factors determining these
behaviours. Notwithstanding this caveat, it seems reasonable to conclude from the
combination of the results of analysis by deprivation levels, as measured by SIMD status, and
the dominance of HFSS foods in marketing observations and purchase outcomes that current
marketing practices are making little or no contribution to the policy goal of targeted support
for the most deprived.
In short, the results of this survey indicate there are substantial opportunities for food and
drink marketers to modify current marketing practices and thus move towards the health
supportive partnership with government approach advocated in Commitment # 11.

33
5.6 In Summary
Marketing makes a substantive and important contribution to the food environment from
which Scotland’s youth source their daily diet. The results of this survey demonstrate there is
substantive potential to improve its contribution by closing the gap between current
marketing practises and the vision of the SHC Framework’s marketing focused objectives.
The results of this survey provide convincing evidence that the current marketing landscape
confers high levels of salience, and a disproportionate balance of marketing cues and
incentives, to purchase HFSS foods and drinks. The opportunities to adjust the marketing
landscape and shift the balance towards greater visibility for a more enabling and supportive
mix of food and drink products are therefore immense. Positive steps to reduce promotions
for food and drinks high in free sugars appear to be the most urgent priority, but reductions
in promotions for high fat and salt products are also important targets.

34
6. REFERENCES
Agresti A (1996). An Introduction to Categorical Data Analysis. New York: Wiley.
FSAS & Scottish Government (2014a). Background Paper to Supporting Healthy Choices. Food
Standards Agency Scotland & Scottish Government. Available at
http://www.gov.scot/Publications/2014/06/8869
FSAS and Scottish Government (2014). Supporting Healthy Choices: A Framework for
Voluntary Action, an invitation to the food industry to work in partnership with Government
in Scotland. Food Standards Agency & Scottish Government. Available at
http://www.gov.scot/Publications/2014/06/8253
MRS (2014). Protecting and promoting research in the UK and EU. Market Research Society.
Available at https://www.mrs.org.uk/standards/code_of_conduct/
Scottish Government (2010). Preventing Overweight and Obesity in Scotland, a route map
towards healthy weight. Scottish Government. Available at
http://www.gov.scot/Publications/2010/02/17140721/0
Scottish Government (2012). Scottish Index of Multiple Deprivation 2012: A national statistics
publication for Scotland 18 December, 2012. Scottish Government. Available at
http://simd.scotland.gov.uk/publication-2012/introduction-to-simd-2012/overview-of-the-
simd/what-is-the-simd/
Scottish Government (2013). The Scottish Health Survey 2013. Scottish Government. Available
at: http://www.gov.scot/Publications/2014/12/9982

35
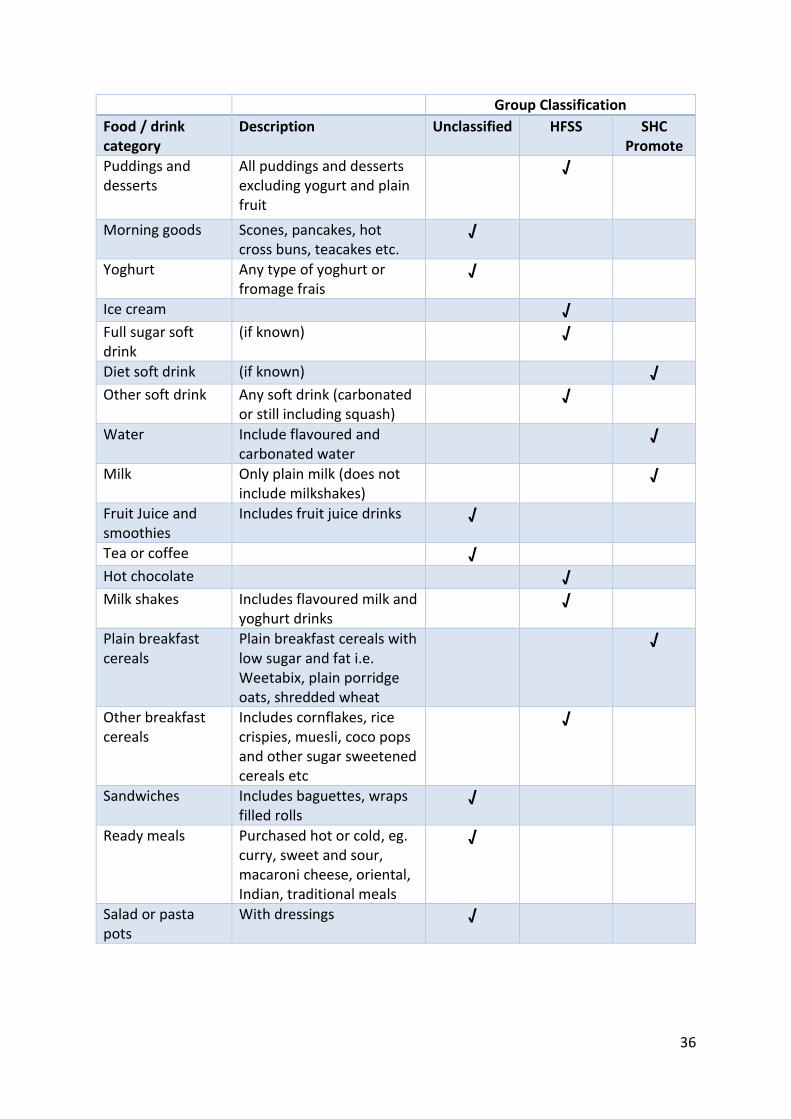
Appendix 1: Food Standards Scotland foods and drinks classification
Group Classification
Food / drink category
Description Unclassified HFSS SHC Promote
Fruit All fresh, tinned or frozen, whole or pre- prepared fruit
√
Vegetables All fresh, tinned, frozen vegetables and pre-prepared plain salads
√
Plain bread Includes all plain breads, buns etc with no additions
√
Plain starchy carbohydrates
Includes potatoes (eg. baked or boiled), pasta, noodles grains etc with no additions or sauces.
√
Oil rich fish Any, eg. tinned or fresh tuna, sardines, salmon (not in sandwiches)
√
Baked beans √ Chocolate confectionery
Includes all chocolate based confectionary
√
Sweet confectionery
Includes sugar sweets and gum and dried fruit with additions (e.g. coated in yoghurt/chocolate, flakes)
√
Sugar-free confectionery
Includes chewing gum, mints, and sweets
√
Biscuits All sweet and savoury including cereal bars
√
Cakes and sweet pastries
Includes cheesecakes, croissants, cream cakes, fruit pies and cake bars
√
Savoury snacks Includes crisps, popcorn, skips, quavers, mini cheddars etc
√
Savoury pies and pasties
Includes hot and cold sausage rolls, bacon rolls, meat pies, spring rolls, quiche etc.
√
36
Group Classification
Food / drink category
Description Unclassified HFSS SHC Promote
Puddings and desserts
All puddings and desserts excluding yogurt and plain fruit
√
Morning goods Scones, pancakes, hot cross buns, teacakes etc.
√
Yoghurt Any type of yoghurt or fromage frais
√
Ice cream √ Full sugar soft drink
(if known) √
Diet soft drink (if known) √ Other soft drink Any soft drink (carbonated
or still including squash) √
Water Include flavoured and carbonated water
√
Milk Only plain milk (does not include milkshakes)
√
Fruit Juice and smoothies
Includes fruit juice drinks √
Tea or coffee √ Hot chocolate √ Milk shakes Includes flavoured milk and
yoghurt drinks √
Plain breakfast cereals
Plain breakfast cereals with low sugar and fat i.e. Weetabix, plain porridge oats, shredded wheat
√
Other breakfast cereals
Includes cornflakes, rice crispies, muesli, coco pops and other sugar sweetened cereals etc
√
Sandwiches Includes baguettes, wraps filled rolls
√
Ready meals Purchased hot or cold, eg. curry, sweet and sour, macaroni cheese, oriental, Indian, traditional meals
√
Salad or pasta pots
With dressings √

37
Group Classification
Food / drink category
Description Unclassified HFSS SHC Promote
Noodle pot √
Soup √
Fried Fish √
Pizza √
Burgers √
Fried chicken √
Other takeaway meat item e.g. white/black pudding, sausage, bacon, hotdog
√
Fried chips √
Other takeaway Includes, Oriental, Indian, Italian, traditional meals
√
Dried fruit Plain dried fruit only i.e. raisin, sultanas, apricots etc
√
Plain nuts and seeds
With no additions √
Roasted/salted nuts
Includes all nuts with additions e.g. salted, coated etc
√
Cold meat/ cheese/ eggs
Not in sandwich √
Condiments Pickles/butter/jam/sauce etc
√
Sausages / hotdogs
Not takeaway √
Burgers Not takeaway √

38
Appendix 2: Survey questions and response options
Q.1 How old are you?
10
11
12
13
14
15
16
17
18
17/18
Not stated
Q.2 Are you male or female?
Male
Female
Not stated
Q.3 What year are you now in at school?
S1
S2
S3
S4
S5
S6
Q.4 What is your ethnic group?
White
Scottish
Other British
Irish
Polish
Gypsy/Traveller
Other white ethnic group
Any mixed or multiple ethnic groups
Pakistani, Pakistani Scottish or Pakistani British
Indian, Indian Scottish or Indian British
Bangladeshi, Bangladeshi Scottish or Bangladeshi British
Chinese, Chinese Scottish or Chinese British
Other
African, African Scottish or African British
Other
Caribbean, Caribbean Scottish or Caribbean British
Black, Black Scottish or Black British
Other
Arab Scottish or Arab British
Other
I don't know
I prefer not to say
Not stated

39
Q.27a In the last 7 days, did you buy, or have someone else buy for you, any food or drinks items because...? It gave you the chance to enter a competition, win a prize or receive a giveaway
Yes
No
Don't know
If yes, please describe which foods and/or drinks
Q.27b In the last 7 days, did you buy, or have someone else buy for you, any food or drinks items because...? Because there was a special offer on the product? (E.g. a meal deal, buy one get one free offer or a price reduction)
Yes
No
Don't know
If yes, please describe which foods and/or drinks
Q27c In the last 7 days, did you buy, or have someone else buy for you, any food or drinks items because...? Because a celebrity or cartoon character advertises the product
Yes
No
Don't know
If yes, please describe which foods and/or drinks
Q27d In the last 7 days, did you buy, or have someone else buy for you, any food or drinks items because...? Because the product sponsors an event, personality or team that you like
Yes/No/don't know/not stated
Yes
No
Don't know
If yes, please describe which foods and/or drinks
Q27e In the last 7 days, did you buy, or have someone else buy for you, any food or drinks items because...? Because you saw or heard an advert for the product
Yes
No
Don't know
If yes, please describe which foods and/or drinks
Q27f In the last 7 days, did you buy, or have someone else buy for you, any food or drinks items because...? Because the product was on display at the till point/cash desk and/or the check-out assistant suggested it
Yes
No
Don't know
If yes, please describe which foods and/or drinks
Q.28a In the last 7 days, have you seen a food or drink product promoted or advertised...? In a television or cinema advert
Yes
No
Don't know
If yes, please describe which foods and/or drinks

40
Q.28b In the last 7 days, have you seen a food or drink product promoted or advertised...? In a sponsorship of a programme or film on TV or online
Yes
No
Don't know
If yes, please describe which foods and/or drinks
Q.28c In the last 7 days, have you seen a food or drink product promoted or advertised...? In an advert on Facebook, Twitter, YouTube or on any other social media
Yes
No
Don't know
If yes, please describe which foods and/or drinks
Q.28d In the last 7 days, have you seen a food or drink product promoted or advertised...? In a special offer or price promotion in a shop
Yes
No
Don't know
If yes, please describe which foods and/or drinks
Q.28e In the last 7 days, have you seen a food or drink product promoted or advertised...? In school
Yes
No
Don't know
If yes, please describe which foods and/or drinks
Q.28f In the last 7 days, have you seen a food or drink product promoted or advertised...? In a magazine, newspaper, leaflet or any other printed material
Yes
No
Don't know
If yes, please describe which foods and/or drinks
Q.28g In the last 7 days, have you seen a food or drink product promoted or advertised...? At a public event such as a football match or concert, or an outdoor place such as a billboard or bus
Yes
No
Don't know
If yes, please describe which foods and/or drinks
Base size (all pupils):
Q.28h In the last 7 days, have you seen a food or drink product promoted or advertised...? In a text or e-mail message
Yes
No
Don't know
If yes, please describe which foods and/or drinks

41
Appendix 3: Notes on computation of data and statistical analysis
Prevalence of specific food and drink marketing techniques and marketing overall
Because the purpose of collecting data on exposure and purchase responses to specified marketing methods was to map the marketing environment (i.e. no
investigation of relations between variables), descriptive statistics were the most appropriate measurement method. Survey findings on the prevalence of
individual marketing techniques and their cumulative impacts are expressed as frequency counts and percentages (to the nearest 0.5%).
Identification of factors moderating marketing impacts
Categorical data (yes/no/don’t know) on responses to marketing was available for all 2285 respondents included in the survey sample. Basic demographic
data (gender, age/school year, and relative deprivation as measured by SIMD status) for all 2285 respondents was also available. Because the objective of
analysis of responses by demographic variables, was to investigate if the impacts of marketing interacted and/or were moderated by any of these variables,
chi square tests (X2) were performed. Because data on gender is nominal, Pearson’s X2 test for independence was used to examine if there was anyd
relationship between responses to questions on marketing and gender of respondents (Agresti, 1996). Because data on age/school year and SIMD status is
ordinal, the X2 linear by linear association test was used to investigate if the distribution of responses to questions on marketing and each of these 2
demographic variables was due to chance or indicated a relationship trend, and where an association was detected, to identify the direction of the relationship
trend (ibid.).
Food and drink marketing outcomes
Data on the types of foods and drinks marketing is promoting was only available from ‘yes’ responses to exposure and/or purchase response questions that
also provided a classifiable description of the food and drink product involved. This resulted in datasets of 2734 responses derived from 1030 respondents on
exposure and 1897 responses on purchase derived from 1074 respondents. Because these datasets do not include all responses collected in the survey and
because some respondents provided multiple responses, and therefore data points on food and drink types cannot be assumed to be fully independent of

42
one another, X2 are not appropriate (ibid.). Instead, frequency counts are used to measure and describe survey findings on the nutritional quality of foods
and drinks marketing is currently promoting. These findings are intended to provide a qualitative and quantitative context through which implications of
survey findings for the marketing focused objectives of the Supporting Healthy Choices Framework Policy could be assessed.
Details for X2 tests performed are presented below:
Q 28, Exposure: Pearson’s X2 test of independence of responses against gender
Marketing method
No answer count (%); Yes answer count (%)
Male yes count
(expected count)
Female yes count
(expected count)
X2 df Significance level (p)
Advert 1227 (54.8%);ǂ
1012 (45.2%)
497 (508.9) 515 (503.1) 1.03 1 .311
Sponsorship 1817 (81.1%); 423 (18.9%)
235 (212.8) 188 (210.2) 5.73 1 .017*
Social media 1861 (83.0%);ǂ
380 (17.0%)
198 (191.1) 182 (188.9) 0.60 1 .437
Price 1522 (67.9%);ǂ
719 (32.1%)
376 (361.6) 343 (357.4) 1.70 1 .192
In school 2019 (90.1%); 221 (9.9%)
106 (111.2) 115 (109.8) 0.54 1 .462
Print 1985 (88.6%);ǂ
256 (11.4%)
129 (128.7) 127 (127.3) 0.00 1 .973
Outdoors 1903 (85.0%); 337 (15.0%)
202 (169.6) 135 (167.4) 14.71 1 .000*
Digital 2144 (95.7%); 96.0 (4.3%)
44 (48.3) 52 (47.7) 0.81 1 .370
All marketing 817 (36.5%); 1423 (63.5%)
698 (715.3) 725 (707.7) 2.31 1 .129
Key
* = statistically significant
ǂ = difference between count and computed n due to rounding of cell
counts
df = degrees of freedom

43
Q 28, Exposure: X2 linear by linear association analysis of all respondent’s responses against SIMD/relative deprivation status
Marketing method
SIMD 1-5 Totals
Weighted SIMD 1 (most
deprived)
Weighted SIMD 2
Weighted SIMD 3
Weighted SIMD 4
SIMD 5 (least
deprived)
X2 df Significance level (p)
No answer count (%); Yes answer count (%)
Yes answer count
(expected count)
Yes answer count
(expected count)
Yes answer count
(expected count)
Yes answer count
(expected count)
Yes answer count
(expected count)
Advert 1259 (55.1%); 1026 (44.9%)
198 (203.0) 176 (194.4) 193 (195.3) 240 (218.2) 219 (215.1) 2.93 1 .087
Sponsorship 1856 (81.2%); 429 (18.85)
83 (84.9) 77 (81.1) 71 (81.5) 98 (91.4) 100 (90.1) 1.65 1 .199
Social media 1899 (83.2%); ǂ 384 (16.8%)
69 (76.0) 71 (72.7) 77 (73.0) 84 (81.7) 83 (80.6) 0.80 1 .370
Price 1558 (68.1%); ǂ 729 (31.9%)
113 (144.1) 136 (138.0) 114 (138.7) 184 (155.2) 182 (153.0) 22.59 1 .000*
In school 2062 (90.3%); ǂ 222 (9.7%)
42 (43.9) 37 (42.1) 34 (42.2) 57 (47.2) 52 (46.6) 2.15 1 .142
Print 2027 (88.7%); ǂ 258 (11.3%)
47 (51.0) 41 (48.9) 52 (49.0) 62 (55.0) 56 (54.1) 1.55 1 .214
Outdoors 1945 (85.1%); ǂ 340 (14.9%)
65 (67.3) 53 (64.4) 55 (64.7) 75 (72.3) 92 (71.3) 6.14 1 .013*
Digital 2186 (95.7%); ǂ 98 (4.3%)
25 (19.4) 20 (18.5) 17 (18.6) 18 (20.9) 18 (20.6) 2.24 1 .134
All marketing 839 (36.7%); ǂ 1446 (63.3%)
267 (286) 261 (273.4) 275 (275.3) 331 (307.6) 312 (303.8) 7.57 1 .006*

44
Q 28, Exposure: X2 linear by linear association analysis of all respondent’s responses against age/ school year
Marketing method
No answer count (%); Yes answer count (%)
S1 S2 S3 S4 S5 S6 X2 df Significance level (p)
Answer yes count
(expected count)
Answer yes count
(expected count)
Answer yes count
(expected count)
Answer yes count
(expected count)
Answer yes count
(expected count)
Answer yes count
(expected count)
Advert 1258 (55.1%); 1026 (44.9%)
156 (178.3) 187 (186.0) 210 (183.7) 174 (186.4) 167 (169.8) 132 (121.7) 2.11 1 .147
Sponsorship 1858 (81.3%);ǂ
428 (18.7%)
59 (74.5) 78 (77.5) 91 (76.6) 73 (77.7) 79 (71.0) 48 (50.7) 1.22 1 .269
Social media 1900 (83.2%); 384 (16.8%)
53 (66.7) 75 (69.6) 86 (68.8) 67 (69.8) 68 (63.6) 35 (45.6) 0.01 1 .906
Price 1556 (68.1%); 728 (31.9%)
97 (126.5) 117 (132.0) 146 (130.4) 129 (132.0) 127 (120.8) 112 (86.4) 19.38 1 .000*
In school 2062 (90.2%);ǂ
223 (9.8%)
44 35 (40.4) 55 (39.9) 28 (40.5) 42 (37.0) 19 (26.4) 1.67 1 .197
Print 2026 (88.7%); 258 (11.3%)
35 (44.8) 45 (46.8) 63 (46.2) 41 (46.8) 58 (42.8) 16 (30.6) 0.01 1 .928
Outdoors 1945 (85.1%);ǂ
340 (14.9%)
54 (59.1) 71 (61.6) 77 (60.9) 37 (61.8) 58 (56.4) 43 (40.3) 0.21 1 .646
Digital 2187 (95.7%);ǂ
98 (4.3%)
13 (17.0) 11 (17.8) 24 (17.6) 17 (17.8) 19 (16.3) 14 (11.6) 2.84 1 .092
All marketing 838 (36.7%); 1446 (63.3%)
240 (251.3) 262 (262.1) 272 (258.9) 241 (262.7) 240 (239.3) 191 (171.6) 2.60 1 .107

45
Q 27, Marketing-prompted purchases: Pearson’s X2 test of independence for all respondent’s responses against gender
Marketing method
No count (%); Yes count (%)
Male yes count
(expected)
Female yes count
(expected)
X2 df Significance level (p)
Prize 2060 (92.0%); 180 (8.0%)
99 (90.6) 81 (89.4) 1.72 1 .190
Price 1451 (64.8%); 789 (35.2%)
382 (397) 407 (392) 1.75 1 .186
Endorsement 2178 (97.2%); ǂ 63 (2.8%)
37 (31.7) 26 (31.3) 1.85 1 .174
Sponsorship 2135 (95.3%); ǂ 106 (4.7%)
69 (53.3) 37 (52.7) 9.75 1 .002*
Advert 2034 (90.8%); ǂ 206 (9.2%)
108 (103.6) 98 (102.4) 0.42 1 .515
Till prompt 2021 (90.2%); ǂ 219 (9.8%)
101 (110.2) 118 (108.8) 1.71 1 .191
All marketing 1179 (52.7%); ǂ 1060 (47.3%)
522 (533.1) 538 (526.9) 0.88 1 .348
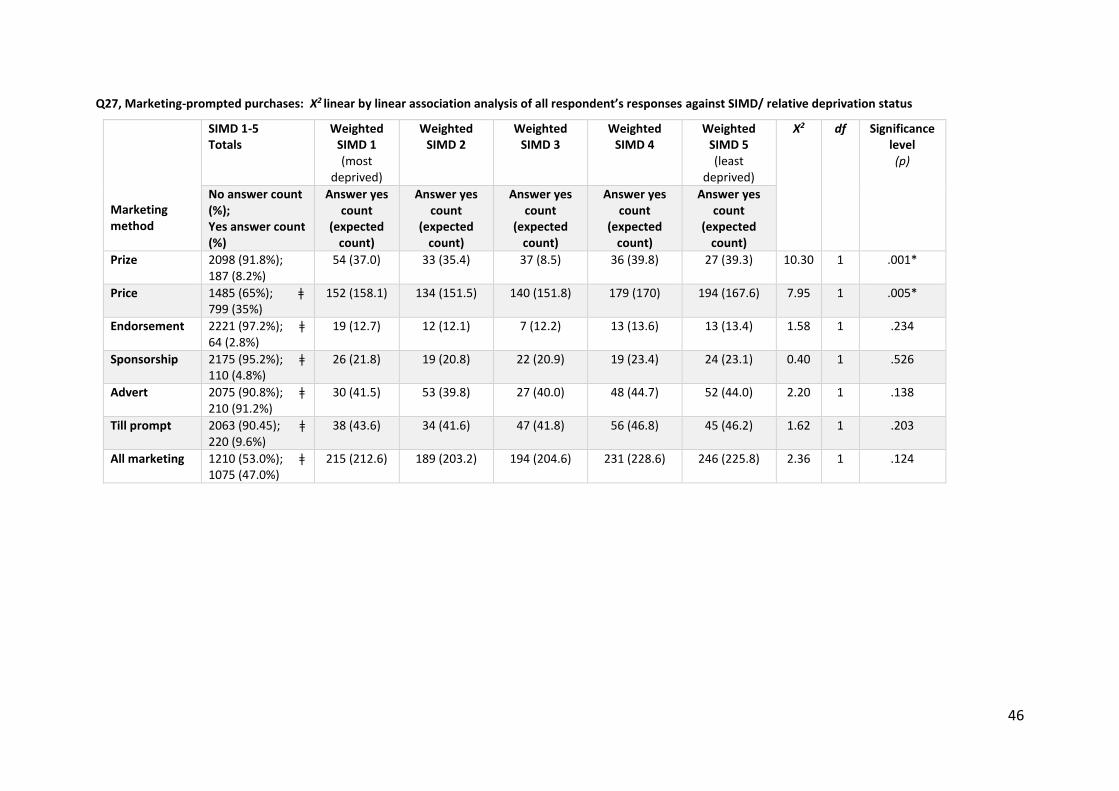
46
Q27, Marketing-prompted purchases: X2 linear by linear association analysis of all respondent’s responses against SIMD/ relative deprivation status
Marketing method
SIMD 1-5 Totals
Weighted SIMD 1 (most
deprived)
Weighted SIMD 2
Weighted SIMD 3
Weighted SIMD 4
Weighted SIMD 5 (least
deprived)
X2 df Significance level (p)
No answer count (%); Yes answer count (%)
Answer yes count
(expected count)
Answer yes count
(expected count)
Answer yes count
(expected count)
Answer yes count
(expected count)
Answer yes count
(expected count)
Prize 2098 (91.8%); 187 (8.2%)
54 (37.0) 33 (35.4) 37 (8.5) 36 (39.8) 27 (39.3) 10.30 1 .001*
Price 1485 (65%); ǂ 799 (35%)
152 (158.1) 134 (151.5) 140 (151.8) 179 (170) 194 (167.6) 7.95 1 .005*
Endorsement 2221 (97.2%); ǂ 64 (2.8%)
19 (12.7) 12 (12.1) 7 (12.2) 13 (13.6) 13 (13.4) 1.58 1 .234
Sponsorship 2175 (95.2%); ǂ 110 (4.8%)
26 (21.8) 19 (20.8) 22 (20.9) 19 (23.4) 24 (23.1) 0.40 1 .526
Advert 2075 (90.8%); ǂ 210 (91.2%)
30 (41.5) 53 (39.8) 27 (40.0) 48 (44.7) 52 (44.0) 2.20 1 .138
Till prompt 2063 (90.45); ǂ 220 (9.6%)
38 (43.6) 34 (41.6) 47 (41.8) 56 (46.8) 45 (46.2) 1.62 1 .203
All marketing 1210 (53.0%); ǂ 1075 (47.0%)
215 (212.6) 189 (203.2) 194 (204.6) 231 (228.6) 246 (225.8) 2.36 1 .124

47
Q27 on Marketing-prompted purchases: X2 linear by linear association analysis of all respondent’s responses against age/ school year
Marketing method
No answer count (%); Yes answer count (%)
S1 S2 S3 S4 S5 S6 X2 df Significance level (p)
Answer yes count (expected count)
Answer yes count
(expected count)
Answer yes count
(expected count)
Answer yes count
(expected count)
Answer yes count
(expected count)
Answer yes count
(expected count)
Prize 2100 (91.8%); 187 (8.2%)
48 (32.5) 45 (33.9) 29 (33.4) 31 (33.9) 21 (31.0) 13 (22.2) 18.69 1 .000*
Price 1486 (65.0%); ǂ 800 (35.0%)
111 (139.3) 141 (144.9) 148 (143.1) 168 (145.2) 120 (132.3) 112 (95.2) 8.55 1 .003*
Endorsement 2221 (97.2%); ǂ 64 (2.8%)
8 (11.1) 18 (11.6) 19 (11.5) 5 (11.6) 9 (10.6) 5 (7.6) 1.90 1 .168
Sponsorship 2176 (95.2%); ǂ 109 (4.8%)
30 (18.9) 26 (19.7) 26 (19.5) 14 (19.8) 4 (18.1) 9 (12.9) 19.79 1 .000*
Advert 2075 (90.8%); ǂ 209 (9.2%)
49 (36.3) 42 (37.9) 37 (37.4) 39 (37.9) 21 (34.7) 21 (24.8) 8.87 1 .003*
Till prompt 2065 (90.4%); ǂ 220 (9.6%)
43 (38.3) 33 (39.9) 42 (39.4) 37 (39.9) 37 (36.4) 28 (26.2) 0.01 1 .956
All marketing 1210 (52.9%); ǂ 1077 (47.1%)
186 (187) 202 (195.4) 190 (192.6) 213 (195.4) 156 (178.5) 130 (128.1) 0.45 1 .500