Embed Size (px)
Citation preview
International Journal of Science and Research (IJSR) ISSN: 2319-7064
SJIF (2019): 7.583
Volume 10 Issue 1, January 2021
www.ijsr.net Licensed Under Creative Commons Attribution CC BY
The Impact of Gender on Leadership Styles and
Leadership Effectiveness
Basel Dwiri1, Kağan Okatan
2
1Istanbul Aydin University, Institute of Graduated Students, Istanbul, Turkey
ORCID: 0000-0002-6455-6927
2Istanbul Aydin University, Istanbul, Turkey
Abstract: The purpose and aim of this research are to show and evaluate the impact of gender and the effectiveness (Decision making
and relationships) between transformational leadership and transactional leadership respectively in real estate and construction
companies. In addition, to bring to light whether male leaders are more effective than female leaders, or the opposite. Data were
collected from 267 respondents in Istanbul, sample of Turkish firms based on the study model data were examined using the Statistical
Package for the Social Sciences (SPSS) software by applying frequency distribution tables also bar charts of questionnaire (part A) and
further correlation, R-Square, ANOVA and Regression Analysis for questionnaire (part B). Results show that the relationship between
gender, transformational leadership and transactional leadership and their effectiveness (Decision making and Relationships) in the
companies is positive. This study has analyzed through descriptive approach that was used to study about demographic profile of
companies in Istanbul, and TRFL and TRSL items have been developed to test the hypothesis. Five-point Likert scale questionnaire and
Seven-point Likert scale questionnaire has been adopted for data collection, the reliability statistics of all items was 0.887 for men and
0.915 for women which is excellent, in order to measure the relationship among variables correlation a test was used, regression
analysis R-Square interpretation, ANOVA was used to show the impact of DM and R on TRFL and TRSL of the companies. Statistical
analysis also showed results and suggestions for this model.
Keywords: Gender, Transformational Leadership, Transactional Leadership, Decision Making, Relationships, Turkey
1. Introduction
Throughout history, we have witnessed societies fall into
anarchy because of the lack of proper leadership. Indeed,
human beings are social creatures that live together and
occupy different roles in society; some occupy the role of
leaders, whereas others play the role of followers. It has
been noticed that societies with good leaders often inspire
their people to reach their full potential and grow therefore
to be highly developed countries.
On the other hand, societies that lack good leaders often fall
into chaos. This proves the importance of good leadership
for any society to function, grow and eventually thrive.
Similarly, but on a smaller scale, businesses and
organizations need proper leaders and managers to operate
successfully. This, of course, leads us to wonder about what
it means to be a good leader. Some basic qualities associated
with leadership include self-reliance, independence,
assertiveness, ambition, and risk-taking. Although most
leaders share these characteristics, different leaders tend to
adopt different leadership styles because of various reasons.
One dimension that is said to affect leadership style among
leaders, and their leadership effectiveness by extension is
gender. Studies have shown that male and female leaders
tend to operate and manage differently. Also, it goes without
saying that women nowadays occupy more management
positions in organizations and business than ever before.
However, most leadership positions remain occupied by
men. This, again, leads us to wonder about the impact of
gender on both leadership styles and effectiveness within
companies and organizations.
1.1. Research Problem
Many studies have been conducted to reveal the impact of
gender on leadership styles and leadership effectiveness.
Some of these studies found no correlation between these
variables, whereas others concluded that gender impacts
both leadership styles and effectiveness. Among the latter,
there are researchers who found that males are more
effective leaders than females, and researches who stated the
opposite. Therefore, there‟s a clear disparity in the results of
previous studies. In addition to this, most of the research
conducted on this topic is done in western societies. In other
words, there isn‟t a lot of data about the relationship of
leadership and gender in countries like Turkey for example,
and it will therefore be interesting to conduct a study about
the impact of gender on leadership styles and effectiveness
in Turkey.
1.2. Significance of the Study
There is a positive correlation between gender diversity and
business success [1]. Also, a gender balance in senior
management is positively associated with GDP growth.
However, in almost half of the 13, 000 enterprises surveyed
in 70 countries, female managers account for less than 33%.
[1]. The reason for this according to the ILO is that most
enterprises require an “anytime, anywhere” availability
which women supposedly cannot always offer due to their
household and family responsibilities. A second reason,
referred to as the “glass wall”, describes how female
managers are confined to roles such as human resources,
finance, and administration, which are less strategic and less
likely to lead to senior management positions.
Paper ID: SR21126183926 DOI: 10.21275/SR21126183926 1419
International Journal of Science and Research (IJSR) ISSN: 2319-7064
SJIF (2019): 7.583
Volume 10 Issue 1, January 2021
www.ijsr.net Licensed Under Creative Commons Attribution CC BY
Therefore, this study will shed some light on the differences
between male and female managers in terms of their
preferred leadership styles and their leadership effectiveness.
This will hopefully clarify if the prejudices against women,
that are keeping them from occupying as many managerial
positions as men, are indeed well founded, or if they are
wrong assumptions that need to be corrected.
In conclusion, this study is important in that it might help
organizations make better decisions regarding their
recruiting of senior managers by understanding how men
and women operate in leadership positions.
1.3. Research objectives
The objectives of this research are:
To discover whether there are any differences between
male and female leaders.
To reveal the extent to which gender influences the
choice of leadership styles.
To discover which leadership styles are more likely to be
associated with male leaders, and which are more likely
to be associated with female leaders.
To reveal the extent to which gender impacts leadership
effectiveness.
To bring to light whether male leaders are more effective
than female leaders, or the opposite.
1.4. Hypotheses of the Study
Two styles of leadership were chosen, transformational
leadership (TRFL) and transactional leadership (TRSL).
Two types of leadership effectiveness were chosen, decision
making (DM) and relationships (R). This results in 8
hypotheses:
H1= Gender (male) in transformational leadership has an
impact on decision making.
H2= Gender (male) in transactional leadership has an
impact on decision making.
H3= Gender (male) in transformational leadership has an
impact on relationships.
H4= Gender (male) in transactional leadership has an
impact on relationships.
H5= Gender (female) in transformational leadership has
an impact on decision making.
H6= Gender (female) in transactional leadership has an
impact on decision making.
H7= Gender (female) in transformational leadership has
an impact on relationships.
H8= Gender (female) in transactional leadership has an
impact on relationships
2. Review of the Literature
There is ample evidence available on studies, that female
leaders perform different leadership behaviors than male
leaders [2, 3, 4, 5, 6].Few studies in Germany found no
gender disparities in leadership style and their efficacy [7].
In the other hand, there is a study concluded that men are
more successful than woman leaders [8]. Analysis carried
out before the late 1900s showed no substantial gap in the
success of the actions of female and male leadership but in
later years the significant researchers [9, 10, 11]their own
study has begun to be challenged and analysis doubt has
been reported for further inquiries. This misunderstanding
sparked a continuing discussion over the efficacy of the
numerous leadership practices followed by male and female
leaders. Businesses and corporate organizations with a high
number of women in their senior management and
leadership roles appear to have a greater positive effect on
both financial success and operational quality [12]. Women
are reported to be more participative and transformational in
democracy than men [13] instead of their sexually
stereotyped sense of security, genuine diplomacy, and
contact [14].
2.1. Gender
Gender is derived etymologically from a word, genus,
meaning 'kind' or 'shape' in Latin. Gender as a term applies
to society which refers to the assigning of each sex with
different traits, refers to what is normative or what is
predicted which predicted in the actions of men and women.
If male and female are the proper terms for sex, the
corresponding terms for gender are masculine and feminine;
therefore, the sum of masculinity or femininity contained in
an individual is gender [15].In the sense of transformational
leadership, a great deal of study has been undertaken to
recognize the gaps between men and women. It has been
shown that both have distinct leadership styles. Women
respond to more democratic leadership and less autocratic
than males [16]. Although men are task-oriented, women are
people-oriented. Many surveys also suggest that women are
better leaders in change than men are. Woman leaders score
higher than male leaders in transformational activities [17].
Women prefer to use more democratic and transformational
leadership styles than men [18].They will be more
recognized and trusted than male transformational leaders as
women display more positive actions compared to men [19,
20]. While several scholars have shown that women are
more transformative than men, a few limitations make them
less effective.
When women want to actively manipulate their
subordinates, the responses towards them are hostile [6]. In
addition, both masculine and feminine aspects are required
for excellence in today's market setting [21].
2.2. Gender and Leadership
Gender roles are the accepted or predicted actions in social
culture for men and women, implying what is commonly
perceived to be the appropriate roles in each culture for men
and women [22, 23, 24, 25].
Gender roles can be divided into two characters according to
social role theory: the male agentic character, which shows
steadiness, power, superiority, and self-confidence, and the
female communal character, which shows emotion,
benevolence, helpfulness, compassion, interpersonal
sensitivity and gentleness [26, 27]. Leaders have historically
been men, and women have had many challenges to
becoming leaders [28]. Many experiments have shown that,
based on the gender of leaders, subordinates are likely to
display different psychological reactions and job habits and
Paper ID: SR21126183926 DOI: 10.21275/SR21126183926 1420

International Journal of Science and Research (IJSR) ISSN: 2319-7064
SJIF (2019): 7.583
Volume 10 Issue 1, January 2021
www.ijsr.net Licensed Under Creative Commons Attribution CC BY
show different approval of female and male managers [29,
30].
In conventional patriarchal ideology, female leaders do not
conform with the job demands and their success is judged to
various criteria. For this cause, even though their success is
similar, the assessment of male and female managers varies.
In comparison, most female managers earn unfavourable
assessments, primarily because of gender role expectations
rather than their real abilities to work [29, 30]. Research on
people's expectations of successful managers reveals that the
"successful leadership image" is close to the "male image, "
and that male managers are usually more likely than female
managers to be viewed as successful and traditional
managers [31, 32, 33, 34].
2.3. Leadership Styles (LS)
Leadership is an inherently abstract term [35]. Most of the
topic of female's leadership centres on what has been called
the issue of production and care for people [36]. Other
approaches to conceptualize this dichotomy in leadership are
by comparing questions over relationship-related roles [37].
Some of the evidence suggests that women leaders appear to
be more relationship-oriented and male leaders more task-
oriented [38, 39].
The transformational-transactional leadership paradigm has
become a common theme in leadership literature in recent
years [40, 41, 42, 43, 44, 45]. In comparison to task versus
relationship-oriented leadership, the idea of
transformational-transactional leadership is seen as a
continuum that enables individuals to use transformational
and transactional characteristics at the same time [41,
46].The definition of transformational and transactional
leadership is presented below:
2.3.1. Transformational Leadership (TRFL)
Transformational leadership is a type of leadership that
focuses on effecting revolutionary cultural change by
contributing to that organization's vision [47, 48].
Transformation leaders rely on future needs and are more
concerned about long-term concerns [49].It is a person
entered style of leadership that facilitates subordinate
creativity and workplace climate change [50]. Additionally,
transformational leaders aim to inspire and empower their
workforce to accomplish the organization's target [51].
When using this style, greater levels of intrinsic motivation,
confidence, devotion, and loyalty from followers are
required [52]. The leader must have good empathic abilities
[51]. The leadership style of transformation has a strong
positive effect on employee, community, and organizational
results and a study reveal that followers are more inspired,
active, and happy with transformational leaders [53].
According to [54] transformational leadership has four
dimensions including:
2.3.1.1. Idealized Influence (II)
Divided into two terms: idealized attributed and behaviour.
First, idealized influence attributed (IIA) relates to whether
the leader is perceived as charismatic, strong, and optimistic
or not and whether the followers choose to be identified with
him/her. Secondly, idealized influence behaviour (IIB)
involves communicating about his/her most significant
ideals and convictions, stressing the common goal and
purpose, and considering the ethical repercussions of his/her
choices [55].
2.3.1.2. Inspirational Motivation (IM)
Inspirational motivation requires a leader who is confident
and excited about building an enticing picture of the future,
using emotional reasons [52]. The degree to which the
leader articulates a message that communicates to supporters
and encourages them.
2.3.1.3. Intellectual Stimulation (IS)
The degree to which the leader questions expectations, takes
chances, and demands ideas from followers. Leaders with
this characteristic stimulate their followers and promote
imagination [56].
2.3.1.4. Individualized Consideration (IC)
Leaders handle workers as humans and not merely part of a
community. This is achieved through sympathy,
appreciation, and attention to the needs of workers, along
with acknowledgment and celebration of accomplishments
[53].
2.3.2. Transactional Leadership (TRSL)
Transactional leadership is focused on the use of legal
authority within the organization's bureaucratic system [57].
The reality is that when they consider an offer of jobs, team
members promise to follow their boss in all legitimate cases.
The subordinates' continuity of this obedience is dependent
on a bond of shared confidence and the leader's willingness
to uphold agreements made. Good work will be rewarded,
and poor performance will not, but the leader will intervene
if things go bad [58]. This leadership style attempts to
increase employee productivity by using extrinsic
motivation [52].
Stable, predictable environments, a skilful transactional
leader is likely to be effective. The leader satisfies the needs
of supporters in exchange for performance that meets basic
expectations [59].
Many scholars today conclude that transactional leadership
can require the following styles of behaviour [56]:
2.3.2.1. Contingent Reward (CR)
The leader clarifies the job that needs to be done to change
behavior. To obtain success as goals are met, the leader uses
benefits or bonuses. It also applies to lead habits that tend to
explain tasks and duties, then give incentives to followers.
It's a relational and financial transaction if followers meet
the desired results [60].
2.3.2.2. Management-by-Exception Active (MBEA)
The leader tracks the work undertaken and uses disciplinary
measures to ensure that the work is done and meet agreed
expectations. To control the behavior. MBEA's goal is to
monitor followers and the processes [61]. Leaders are
vigilant to ensure their followers achieve the regular
objectives [41].
Paper ID: SR21126183926 DOI: 10.21275/SR21126183926 1421
International Journal of Science and Research (IJSR) ISSN: 2319-7064
SJIF (2019): 7.583
Volume 10 Issue 1, January 2021
www.ijsr.net Licensed Under Creative Commons Attribution CC BY
2.3.2.3. Management-by-Exception Passive (MBEP)
The leader uses corrections or discipline to control actions as
a reaction to unacceptable results or to deviate from agreed
expectations. Also, this aspect applies to leaders who
interfere either when non-compliance has happened or after
mistakes have already occurred, in other words, leaders sit
back and wait for anything to go wrong before taking action
[41].
2.4. Leadership Effectiveness
In the area of leadership, leadership effectiveness is an
important term. More than five thousand meanings of the
same is catalogued [62]. In a nutshell, the success of
leadership depends primarily on the measurability of
production and the fulfillment of mutual priorities. To deal
with evolving expectations to develop good client,
employee, and corporate relationships and to create effective
productive relationships [63].
2.4.1. Decision Making (DM)
Decision-making is one of the factors that assess a leader 's
efficacy. Gender research of leadership indicates that men
and women display different differences of decision-making.
Some of the differences concern the essence of the actions,
the activities involved, and the creation of working
relationships. Studies show that women rely on establishing
and maintaining good working relationships to streamline
processes for both junior and senior staff. On the other hand,
men seldom concentrate on job relationships as they
concentrate on outcomes [64].
2.4.2. Relationships (R)
Employees' views of relationships can be calculated
according to their partnership philosophy. The following
elements were used to assess organizational relationships
[65]:
2.4.2.1. Control Mutuality (CM)
It applies to the degree to which parties‟ consent on who has
the legitimate authority to affect each other. Although
certain imbalances are normal, stable partnerships require
some regulation for each entity and public.
2.4.2.2. Trust (T)
Trust is focused on the degree of confidence and desire of a
party to open to the other party. For confidence, there are
three dimensions. Integrity applies to the confidence that a
corporation is honest and just. Dependability refers to the
presumption that what it claims it will do will be achieved
by an entity. Competence is the confidence that a
corporation has the potential to do what it claims it can do.
2.4.2.3. Commitment (C)
This is the extent of which each individual trust and thinks
that it is worth investing resources to sustain and promote
the relationship. Continuing commitment, which refers to a
particular course of action, and affective commitment, which
is a relational disposition, are two aspects of commitment.
2.4.2.4. Satisfaction (S)
This refers to the degree to which each person feels
favorable towards the other, so the relationship's optimistic
expectations are improved. That of which the rewards
outweigh the costs is a rewarding partnership.
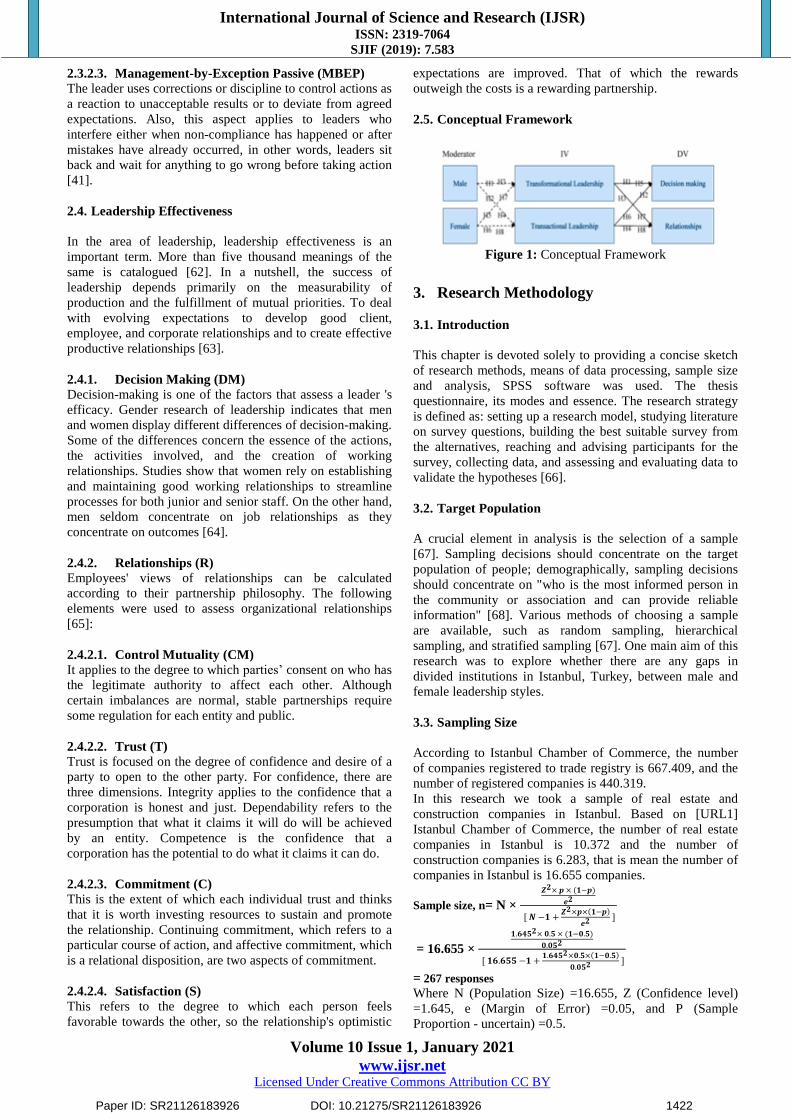
2.5. Conceptual Framework
Figure 1: Conceptual Framework
3. Research Methodology
3.1. Introduction
This chapter is devoted solely to providing a concise sketch
of research methods, means of data processing, sample size
and analysis, SPSS software was used. The thesis
questionnaire, its modes and essence. The research strategy
is defined as: setting up a research model, studying literature
on survey questions, building the best suitable survey from
the alternatives, reaching and advising participants for the
survey, collecting data, and assessing and evaluating data to
validate the hypotheses [66].
3.2. Target Population
A crucial element in analysis is the selection of a sample
[67]. Sampling decisions should concentrate on the target
population of people; demographically, sampling decisions
should concentrate on "who is the most informed person in
the community or association and can provide reliable
information" [68]. Various methods of choosing a sample
are available, such as random sampling, hierarchical
sampling, and stratified sampling [67]. One main aim of this
research was to explore whether there are any gaps in
divided institutions in Istanbul, Turkey, between male and
female leadership styles.
3.3. Sampling Size
According to Istanbul Chamber of Commerce, the number
of companies registered to trade registry is 667.409, and the
number of registered companies is 440.319.
In this research we took a sample of real estate and
construction companies in Istanbul. Based on [URL1]
Istanbul Chamber of Commerce, the number of real estate
companies in Istanbul is 10.372 and the number of
construction companies is 6.283, that is mean the number of
companies in Istanbul is 16.655 companies.
Sample size, n= N ×
𝒁𝟐× 𝒑 × (𝟏−𝒑)
𝒆𝟐
[ 𝑵 −𝟏 + 𝒁𝟐×𝒑× 𝟏−𝒑
𝒆𝟐 ]
= 16.655 ×
𝟏.𝟔𝟒𝟓𝟐× 𝟎.𝟓 × (𝟏−𝟎.𝟓)
𝟎.𝟎𝟓𝟐
[ 𝟏𝟔.𝟔𝟓𝟓 −𝟏 + 𝟏.𝟔𝟒𝟓𝟐×𝟎.𝟓× 𝟏−𝟎.𝟓
𝟎.𝟎𝟓𝟐 ]
= 267 responses
Where N (Population Size) =16.655, Z (Confidence level)
=1.645, e (Margin of Error) =0.05, and P (Sample
Proportion - uncertain) =0.5.
Paper ID: SR21126183926 DOI: 10.21275/SR21126183926 1422
International Journal of Science and Research (IJSR) ISSN: 2319-7064
SJIF (2019): 7.583
Volume 10 Issue 1, January 2021
www.ijsr.net Licensed Under Creative Commons Attribution CC BY
By using the above equation, the sample size required for
this study is 267 responses.
3.4. Sampling
The sample will be collected from both real estate and
construction companies in Istanbul from European and
Anatolian sides. For the collection of data, simple and
random sampling will be used. The data will be collected
from 267 respondents of those companies.
3.5. Research Methodology
There are three types of methods to research: qualitative,
quantitative, and mixed [69]. The quantitative approach is
typically used where the purpose of the analysis is to find
the relationship between variables [70]. This research uses a
quantitative approach as the aim is to evaluate the
relationships and decision-making of dependent variables
and independent variables of leadership styles and gender.
The obtained data was evaluated using version 22.0.0. of the
Statistical Package for Social Sciences (SPSS). Moderator
variables are male and female, independent variables used in
this study are transformational leadership and transactional
leadership whereas dependent variables are decision making
and relationships. The leadership style is assessed by [71]
Multifactor Leadership Questionnaire (MLQ). This
instrument consisted of a model of transformational
leadership and a style of transactional leadership. This
instrument has been used by many researchers in their
studies [72, 73, 74].
3.6. Data Collection
The most critical aspect of any research is data collection.
This very important point lies in the outcome of every
analysis. Most researchers do not stick to this stage very
well, which is why, through their study, they struggle to
achieve desired results. For that purpose, we have paid
careful attention to this stage of our journey to keep the
findings of the research intact and efficient for future use.
We used an all-embracing questionnaire that discusses every
aspect of our theses and theories to efficiently collect data.
Researchers use primary data collection, which means that
the entire data is gathered by the researcher through
questionnaire with Likert type Scale. To obtain information
from them, this questionnaire is spread among the
respondents.
4. Analysis
4.1. Demographic Discussion
For this study, 267 respondents were contacted. The key
feature of demographic discussion will be discussed below:
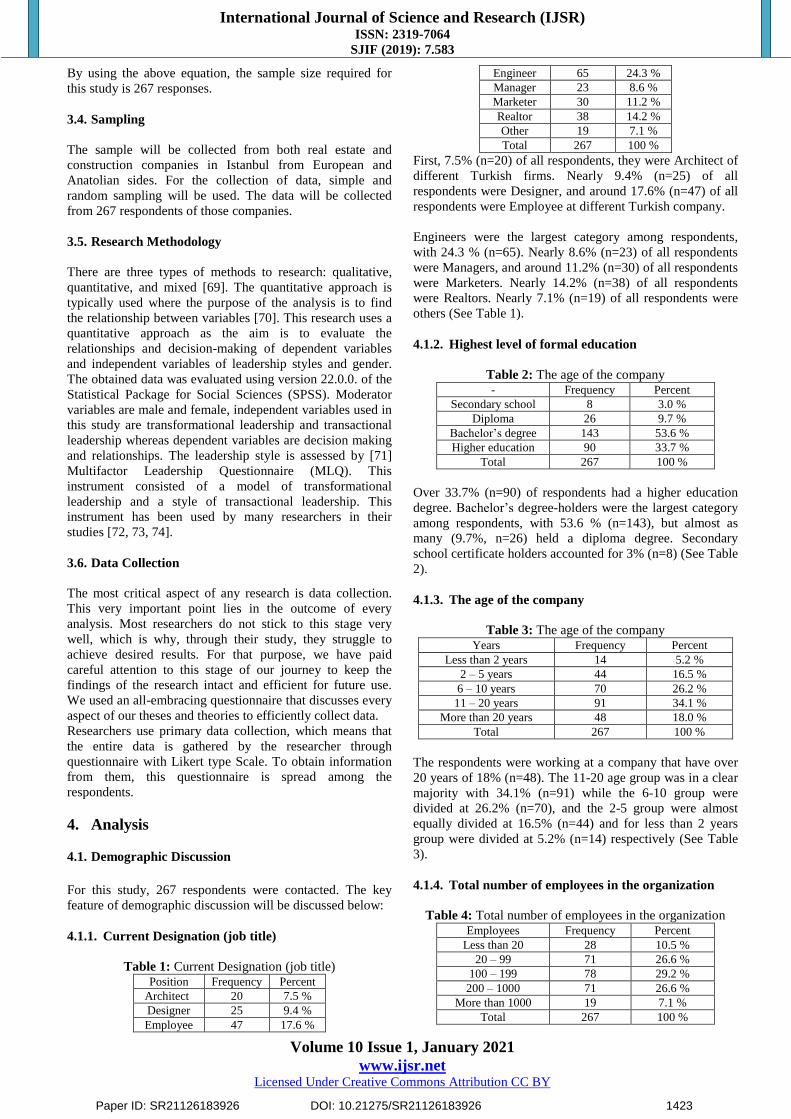
4.1.1. Current Designation (job title)
Table 1: Current Designation (job title) Position Frequency Percent
Architect 20 7.5 %
Designer 25 9.4 %
Employee 47 17.6 %
Engineer 65 24.3 %
Manager 23 8.6 %
Marketer 30 11.2 %
Realtor 38 14.2 %
Other 19 7.1 %
Total 267 100 %
First, 7.5% (n=20) of all respondents, they were Architect of
different Turkish firms. Nearly 9.4% (n=25) of all
respondents were Designer, and around 17.6% (n=47) of all
respondents were Employee at different Turkish company.
Engineers were the largest category among respondents,
with 24.3 % (n=65). Nearly 8.6% (n=23) of all respondents
were Managers, and around 11.2% (n=30) of all respondents
were Marketers. Nearly 14.2% (n=38) of all respondents
were Realtors. Nearly 7.1% (n=19) of all respondents were
others (See Table 1).
4.1.2. Highest level of formal education
Table 2: The age of the company - Frequency Percent
Secondary school 8 3.0 %
Diploma 26 9.7 %
Bachelor‟s degree 143 53.6 %
Higher education 90 33.7 %
Total 267 100 %
Over 33.7% (n=90) of respondents had a higher education
degree. Bachelor‟s degree-holders were the largest category
among respondents, with 53.6 % (n=143), but almost as
many (9.7%, n=26) held a diploma degree. Secondary
school certificate holders accounted for 3% (n=8) (See Table
2).
4.1.3. The age of the company
Table 3: The age of the company Years Frequency Percent
Less than 2 years 14 5.2 %
2 – 5 years 44 16.5 %
6 – 10 years 70 26.2 %
11 – 20 years 91 34.1 %
More than 20 years 48 18.0 %
Total 267 100 %
The respondents were working at a company that have over
20 years of 18% (n=48). The 11-20 age group was in a clear
majority with 34.1% (n=91) while the 6-10 group were
divided at 26.2% (n=70), and the 2-5 group were almost
equally divided at 16.5% (n=44) and for less than 2 years
group were divided at 5.2% (n=14) respectively (See Table
3).
4.1.4. Total number of employees in the organization
Table 4: Total number of employees in the organization Employees Frequency Percent
Less than 20 28 10.5 %
20 – 99 71 26.6 %
100 – 199 78 29.2 %
200 – 1000 71 26.6 %
More than 1000 19 7.1 %
Total 267 100 %
Paper ID: SR21126183926 DOI: 10.21275/SR21126183926 1423
International Journal of Science and Research (IJSR) ISSN: 2319-7064
SJIF (2019): 7.583
Volume 10 Issue 1, January 2021
www.ijsr.net Licensed Under Creative Commons Attribution CC BY
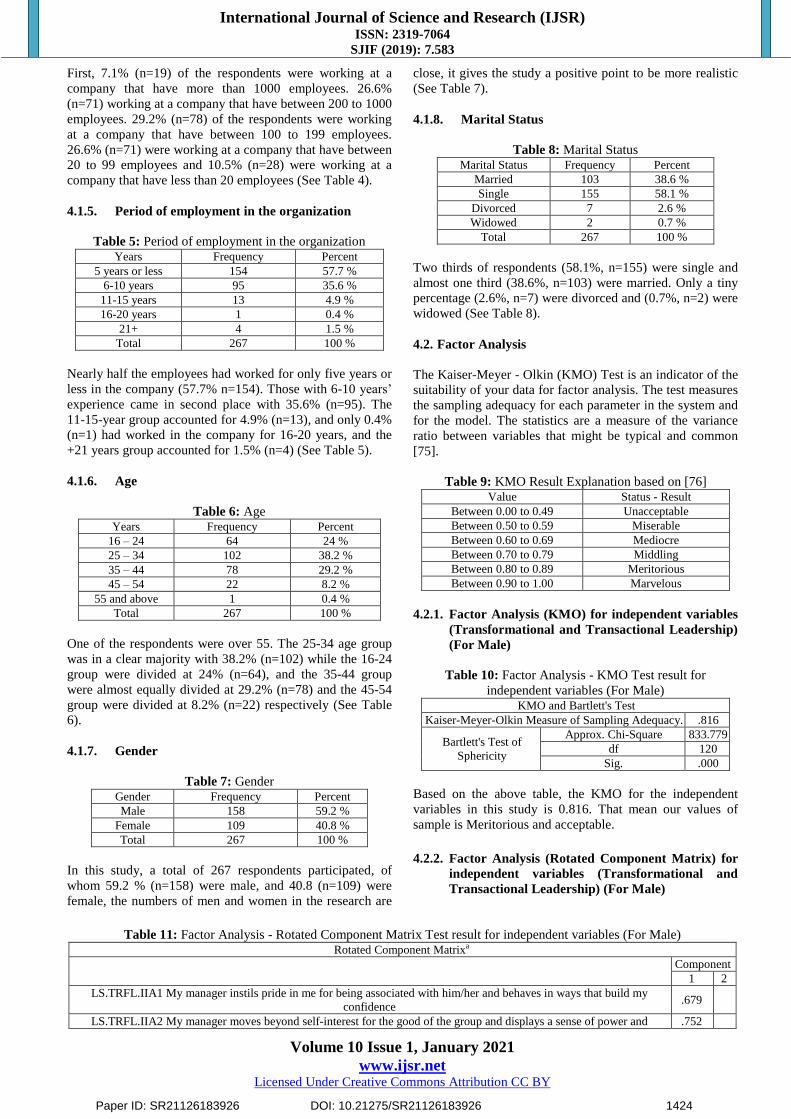
First, 7.1% (n=19) of the respondents were working at a
company that have more than 1000 employees. 26.6%
(n=71) working at a company that have between 200 to 1000
employees. 29.2% (n=78) of the respondents were working
at a company that have between 100 to 199 employees.
26.6% (n=71) were working at a company that have between
20 to 99 employees and 10.5% (n=28) were working at a
company that have less than 20 employees (See Table 4).
4.1.5. Period of employment in the organization
Table 5: Period of employment in the organization Years Frequency Percent
5 years or less 154 57.7 %
6-10 years 95 35.6 %
11-15 years 13 4.9 %
16-20 years 1 0.4 %
21+ 4 1.5 %
Total 267 100 %
Nearly half the employees had worked for only five years or
less in the company (57.7% n=154). Those with 6-10 years‟
experience came in second place with 35.6% (n=95). The
11-15-year group accounted for 4.9% (n=13), and only 0.4%
(n=1) had worked in the company for 16-20 years, and the
+21 years group accounted for 1.5% (n=4) (See Table 5).
4.1.6. Age
Table 6: Age Years Frequency Percent
16 – 24 64 24 %
25 – 34 102 38.2 %
35 – 44 78 29.2 %
45 – 54 22 8.2 %
55 and above 1 0.4 %
Total 267 100 %
One of the respondents were over 55. The 25-34 age group
was in a clear majority with 38.2% (n=102) while the 16-24
group were divided at 24% (n=64), and the 35-44 group
were almost equally divided at 29.2% (n=78) and the 45-54
group were divided at 8.2% (n=22) respectively (See Table
6).
4.1.7. Gender
Table 7: Gender Gender Frequency Percent
Male 158 59.2 %
Female 109 40.8 %
Total 267 100 %
In this study, a total of 267 respondents participated, of
whom 59.2 % (n=158) were male, and 40.8 (n=109) were
female, the numbers of men and women in the research are
close, it gives the study a positive point to be more realistic
(See Table 7).
4.1.8. Marital Status
Table 8: Marital Status Marital Status Frequency Percent
Married 103 38.6 %
Single 155 58.1 %
Divorced 7 2.6 %
Widowed 2 0.7 %
Total 267 100 %
Two thirds of respondents (58.1%, n=155) were single and
almost one third (38.6%, n=103) were married. Only a tiny
percentage (2.6%, n=7) were divorced and (0.7%, n=2) were
widowed (See Table 8).
4.2. Factor Analysis
The Kaiser-Meyer - Olkin (KMO) Test is an indicator of the
suitability of your data for factor analysis. The test measures
the sampling adequacy for each parameter in the system and
for the model. The statistics are a measure of the variance
ratio between variables that might be typical and common
[75].
Table 9: KMO Result Explanation based on [76] Value Status - Result
Between 0.00 to 0.49 Unacceptable
Between 0.50 to 0.59 Miserable
Between 0.60 to 0.69 Mediocre
Between 0.70 to 0.79 Middling
Between 0.80 to 0.89 Meritorious
Between 0.90 to 1.00 Marvelous
4.2.1. Factor Analysis (KMO) for independent variables
(Transformational and Transactional Leadership)
(For Male)
Table 10: Factor Analysis - KMO Test result for
independent variables (For Male) KMO and Bartlett's Test
Kaiser-Meyer-Olkin Measure of Sampling Adequacy. .816
Bartlett's Test of
Sphericity
Approx. Chi-Square 833.779
df 120
Sig. .000
Based on the above table, the KMO for the independent
variables in this study is 0.816. That mean our values of
sample is Meritorious and acceptable.
4.2.2. Factor Analysis (Rotated Component Matrix) for
independent variables (Transformational and
Transactional Leadership) (For Male)
Table 11: Factor Analysis - Rotated Component Matrix Test result for independent variables (For Male) Rotated Component Matrixa
Component
1 2
LS.TRFL.IIA1 My manager instils pride in me for being associated with him/her and behaves in ways that build my
confidence .679
LS.TRFL.IIA2 My manager moves beyond self-interest for the good of the group and displays a sense of power and .752
Paper ID: SR21126183926 DOI: 10.21275/SR21126183926 1424

International Journal of Science and Research (IJSR) ISSN: 2319-7064
SJIF (2019): 7.583
Volume 10 Issue 1, January 2021
www.ijsr.net Licensed Under Creative Commons Attribution CC BY
confidence
LS.TRFL.IIB1 My manager emphasizes the value of getting a collective sense of mission and a strong sense of purpose .558
LS.TRFL.IIB2 My manager talks about our fundamental interests and beliefs .671
LS.TRFL.IM1 My manager talks optimistically and excitedly about the future .670
LS.TRFL.IM2 My manager shows a clear vision of the future and expresses confidence that goals will be achieved .620
LS.TRFL.IS1 My manager seeks to get me look from many different angles and differing perspectives when solving
problems .516
LS.TRFL.IS2 My manager suggests new ways of looking at how to complete assignments .538
LS.TRFL.IC1 My manager spends time teach and coach to help me developing my strengths .534
LS.TRFL.IC2 My manager treats me as an individual rather than just a member of a group because he knows that I have
different needs and abilities from others
LS.TRSL.CR2 My manager discusses in specific terms who is responsible for achieving performance targets and what one
expects to receive when performance goals are achieved
.80
7
LS.TRSL.CR1 My manager provides me with assistance in exchange for my contributions and he expresses satisfaction
when I meet expectations
.79
0
LS.TRSL.MBEA1 My manager keeps track of all mistakes and focuses attention on irregularities, exceptions, and
deviations from standards and concentrates his/her full attention on dealing with them all
.73
9
LS.TRSL.MBEA2 My manager directs my attention toward failures to meet standards
.83
6
LS.TRSL.MBEP1 My manager fails to interfere until problems become serious and demonstrates that problems must
become chronic before taking action
LS.TRSL.MBEP2 My manager shows that he/she is a firm believer in ―if it ain„t broke, don„t fix it
Extraction Method: Principal Component Analysis.
Rotation Method: Varimax with Kaiser Normalization.a
a. Rotation converged in 3 iterations.
Based on table 11, the researcher founds the below about
independent variables:
Transformational leadership (TRFL), its grouped in one
group (factor). That is mean the Transformational
Leadership will be as it is. Transactional leadership
(TRSL), its grouped in one group (factor). That is mean
the Transactional Leadership will be as it is.
The question LS.TRFL.IC2 in Transformational
Leadership, its discarded because of its factor can‟t be
grouped.
The questions LS.TRSL.MBEP1 and LS.TRSL.MBEP2 in
Transactional Leadership, its discarded because of its
factor can‟t be grouped.
4.2.3. Factor Analysis (KMO) for dependent variables
(Decision making and Relationships) (For Male)
Table 12: Factor Analysis - KMO Test result for dependent
variables (For Male)
KMO and Bartlett's Test
Kaiser-Meyer-Olkin Measure of Sampling Adequacy .886
Bartlett's Test of
Sphericity
Approx. Chi-Square 851.016
df 105
Sig. .000
Based on the above table, the KMO for dependent variables
in this study is 0.886. That mean our values of sample is
Meritorious and acceptable.
4.2.4. Factor Analysis (Rotated Component Matrix)
for dependent variables (Decision making and
Relationships) (For Male)
Table 13: Factor Analysis - Rotated Component Matrix Test result for dependent variables (For Male) Rotated Component Matrixa
Component
1 2
DM1 My manager makes his decisions in line with the company's goals to achieve the desired targets. .774
DM2 My manager chooses the easiest alternative to practical application when making his decisions. .697
DM3 Employees do not face major obstacles in implementing the decisions my manager takes because he takes it
considering the workers' capabilities. .736
DM4 My manager takes his decisions in the appropriate time to face urgent problems. .628
DM5 The decisions my manager made are accepted by the relevant workers because he consults workers when making
decisions. .733
R.CM1 Employees at the company are attentive to each other's sayings. .569
R.CM2 Employees at the company believe my views and opinions are legitimate. .583
R.CM3 Workers at the company have a tendency to throw their weight around when dealing with people like me.
R.T1 Employees at the company treat me fairly and justly. .766
R.T2 Whenever managers make a significant decision, I know that they're going to be concerned about me. .639
R.T3 Employees at the company can be relied on to keep their promises. .698
R.C1 There's a long-lasting bond between the employees working at the company and me and wanting to keep a
relationship with me. .666
R.S1 I'm very happy and pleased with the company. .703
R.S2 I have a mutual relationship with the employees at the company. .714
Paper ID: SR21126183926 DOI: 10.21275/SR21126183926 1425

International Journal of Science and Research (IJSR) ISSN: 2319-7064
SJIF (2019): 7.583
Volume 10 Issue 1, January 2021
www.ijsr.net Licensed Under Creative Commons Attribution CC BY
R.S3 The majority of employees are happy with their interactions with the company. .683
Extraction Method: Principal Component Analysis.
Rotation Method: Varimax with Kaiser Normalization.a
a. Rotation converged in 3 iterations.
Based on table 13, the researcher founds the below about
dependent variables:
Decision making (DM), its grouped in one group
(factor). That is mean the Decision making will be as it
is. Relationships (R), its grouped in one group (factor).
That is mean the Relationships will be as it is.
The question R.CM3 in relationships, its discarded
because of its factor can‟t be grouped.
4.2.5. Factor Analysis (KMO) for independent
variables (Transformational and Transactional
Leadership) (For Female)
Table 14: Factor Analysis - KMO Test result for
independent variables (For Female)
KMO and Bartlett's Test
Kaiser-Meyer-Olkin Measure of Sampling Adequacy. .815
Bartlett's Test of Sphericity
Approx. Chi-Square 721.532
df 120
Sig. .000
Based on the above table, the KMO for dependent variables
in this study is 0.815. That mean our values of sample is
Meritorious and acceptable.
4.2.6. Factor Analysis (Rotated Component Matrix)
for independent variables (Transformational
and Transactional Leadership) (For Female)
Table 15: Factor Analysis - Rotated Component Matrix Test result for independent variables (For Female)
Rotated Component Matrixa
Component
1 2
LS.TRFL.IIA1 My manager instils pride in me for being associated with him/her and behaves in ways that build my confidence .828
LS.TRFL.IIA2 My manager moves beyond self-interest for the good of the group and displays a sense of power and confidence .603
LS.TRFL.IIB1 My manager emphasizes the value of getting a collective sense of mission and a strong sense of purpose .555
LS.TRFL.IIB2 My manager talks about our fundamental interests and beliefs .541
LS.TRFL.IM1 My manager talks optimistically and excitedly about the future .656
LS.TRFL.IM2 My manager shows a clear vision of the future and expresses confidence that goals will be achieved .509
LS.TRFL.IS1 My manager seeks to get me look from many different angles and differing perspectives when solving problems .599
LS.TRFL.IS2 My manager suggests new ways of looking at how to complete assignments .550
LS.TRFL.IC1 My manager spends time teach and coach to help me developing my strengths .754
LS.TRFL.IC2 My manager treats me as an individual rather than just a member of a group because he knows that I have
different needs and abilities from others .536
LS.TRSL.CR2 My manager discusses in specific terms who is responsible for achieving performance targets and what one
expects to receive when performance goals are achieved .747
LS.TRSL.CR1 My manager provides me with assistance in exchange for my contributions and he expresses satisfaction when I
meet expectations .740
LS.TRSL.MBEA1 My manager keeps track of all mistakes and focuses attention on irregularities, exceptions, and deviations
from standards and concentrates his/her full attention on dealing with them all .674
LS.TRSL.MBEA2 My manager directs my attention toward failures to meet standards .728
LS.TRSL.MBEP1 My manager fails to interfere until problems become serious and demonstrates that problems must become
chronic before taking action
LS.TRSL.MBEP2 My manager shows that he/she is a firm believer in ―if it ain„t broke, don„t fix it
Extraction Method: Principal Component Analysis.
Rotation Method: Varimax with Kaiser Normalization.a
a. Rotation converged in 3 iterations.
Based on table 18, the researcher founds the below about
independent variables:
Transformational leadership (TRSL), its grouped in two
groups (factors). That is mean the Transformational
Leadership will be Transformational Leadership-
Development and Transformational Leadership-
directive. Transactional leadership (TRSL), its grouped
in one group (factor). That is mean the Transactional
Leadership will be as it is.
The questions LS.TRFL.IIA1, LS.TRFL.IIA2,
LS.TRFL.IIB2, LS.TRFL.IM1, LS.TRFL.IM2 and
LS.TRFL.IC1 are related to Transformational
Leadership- Development (TRFL-Development).
The questions LS.TRFL.IIB1, LS.TRFL.IS1,
LS.TRFL.IS2 and LS.TRFL.IC2 are related to
Transformational Leadership- Directive (TRFL-
Directive).
Paper ID: SR21126183926 DOI: 10.21275/SR21126183926 1426
International Journal of Science and Research (IJSR) ISSN: 2319-7064
SJIF (2019): 7.583
Volume 10 Issue 1, January 2021
www.ijsr.net Licensed Under Creative Commons Attribution CC BY
The question LS.TRFL.IC2 in Transformational
Leadership, its discarded because of its factor can‟t be
grouped.
The questions LS.TRSL.MBEP1 and LS.TRSL.MBEP2
in Transactional Leadership, its discarded because of its
factor can‟t be grouped.
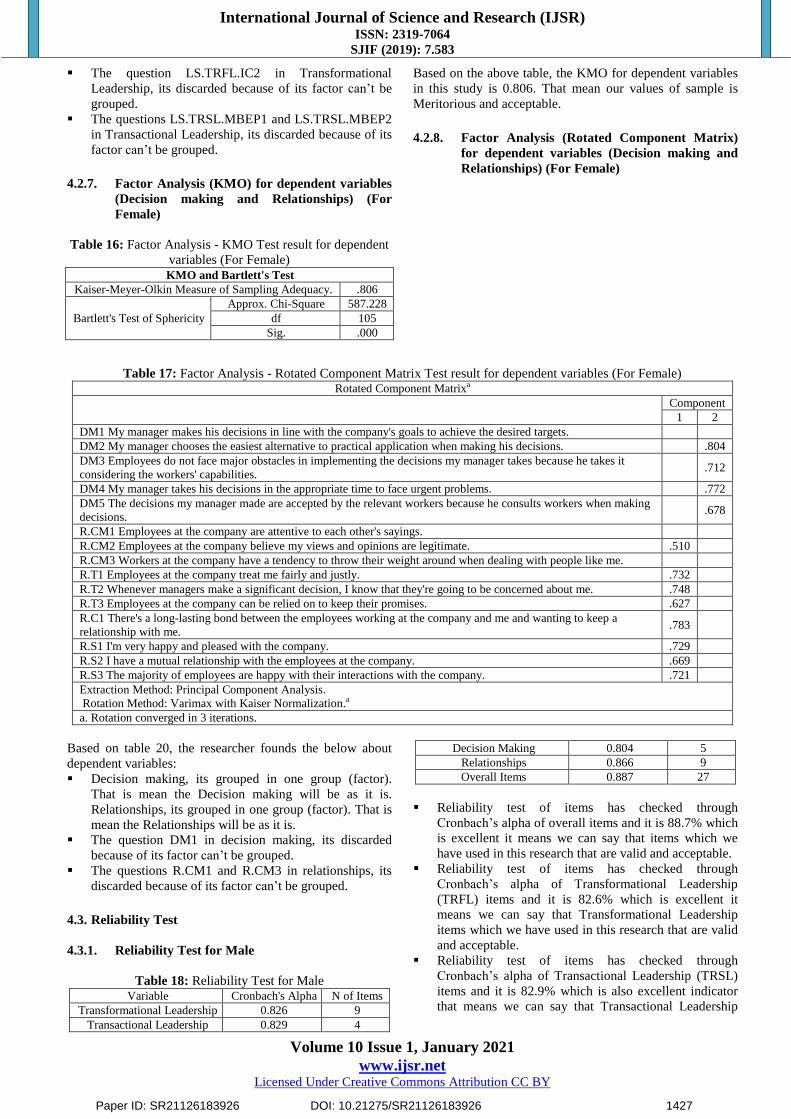
4.2.7. Factor Analysis (KMO) for dependent variables
(Decision making and Relationships) (For
Female)
Table 16: Factor Analysis - KMO Test result for dependent
variables (For Female)
KMO and Bartlett's Test
Kaiser-Meyer-Olkin Measure of Sampling Adequacy. .806
Bartlett's Test of Sphericity
Approx. Chi-Square 587.228
df 105
Sig. .000
Based on the above table, the KMO for dependent variables
in this study is 0.806. That mean our values of sample is
Meritorious and acceptable.
4.2.8. Factor Analysis (Rotated Component Matrix)
for dependent variables (Decision making and
Relationships) (For Female)
Table 17: Factor Analysis - Rotated Component Matrix Test result for dependent variables (For Female) Rotated Component Matrixa
Component
1 2
DM1 My manager makes his decisions in line with the company's goals to achieve the desired targets.
DM2 My manager chooses the easiest alternative to practical application when making his decisions. .804
DM3 Employees do not face major obstacles in implementing the decisions my manager takes because he takes it
considering the workers' capabilities. .712
DM4 My manager takes his decisions in the appropriate time to face urgent problems. .772
DM5 The decisions my manager made are accepted by the relevant workers because he consults workers when making
decisions. .678
R.CM1 Employees at the company are attentive to each other's sayings.
R.CM2 Employees at the company believe my views and opinions are legitimate. .510
R.CM3 Workers at the company have a tendency to throw their weight around when dealing with people like me.
R.T1 Employees at the company treat me fairly and justly. .732
R.T2 Whenever managers make a significant decision, I know that they're going to be concerned about me. .748
R.T3 Employees at the company can be relied on to keep their promises. .627
R.C1 There's a long-lasting bond between the employees working at the company and me and wanting to keep a
relationship with me. .783
R.S1 I'm very happy and pleased with the company. .729
R.S2 I have a mutual relationship with the employees at the company. .669
R.S3 The majority of employees are happy with their interactions with the company. .721
Extraction Method: Principal Component Analysis.
Rotation Method: Varimax with Kaiser Normalization.a
a. Rotation converged in 3 iterations.
Based on table 20, the researcher founds the below about
dependent variables:
Decision making, its grouped in one group (factor).
That is mean the Decision making will be as it is.
Relationships, its grouped in one group (factor). That is
mean the Relationships will be as it is.
The question DM1 in decision making, its discarded
because of its factor can‟t be grouped.
The questions R.CM1 and R.CM3 in relationships, its
discarded because of its factor can‟t be grouped.
4.3. Reliability Test
4.3.1. Reliability Test for Male
Table 18: Reliability Test for Male Variable Cronbach's Alpha N of Items
Transformational Leadership 0.826 9
Transactional Leadership 0.829 4
Decision Making 0.804 5
Relationships 0.866 9
Overall Items 0.887 27
Reliability test of items has checked through
Cronbach‟s alpha of overall items and it is 88.7% which
is excellent it means we can say that items which we
have used in this research that are valid and acceptable.
Reliability test of items has checked through
Cronbach‟s alpha of Transformational Leadership
(TRFL) items and it is 82.6% which is excellent it
means we can say that Transformational Leadership
items which we have used in this research that are valid
and acceptable.
Reliability test of items has checked through
Cronbach‟s alpha of Transactional Leadership (TRSL)
items and it is 82.9% which is also excellent indicator
that means we can say that Transactional Leadership
Paper ID: SR21126183926 DOI: 10.21275/SR21126183926 1427
International Journal of Science and Research (IJSR) ISSN: 2319-7064
SJIF (2019): 7.583
Volume 10 Issue 1, January 2021
www.ijsr.net Licensed Under Creative Commons Attribution CC BY
items which we have used in this research that are valid
and acceptable.
Reliability test of items has checked through
Cronbach‟s alpha of Decision-Making (DM) items and
it is 80.4% which is also excellent indicator that means
we can say that Decision Making items which we have
used in this research that are valid and acceptable.
Reliability test of items has checked through
Cronbach‟s alpha of Relationships (R) items and it is
86.6% which is also excellent indicator that means we
can say that Relationships items which we have used in
this research that are valid and acceptable.
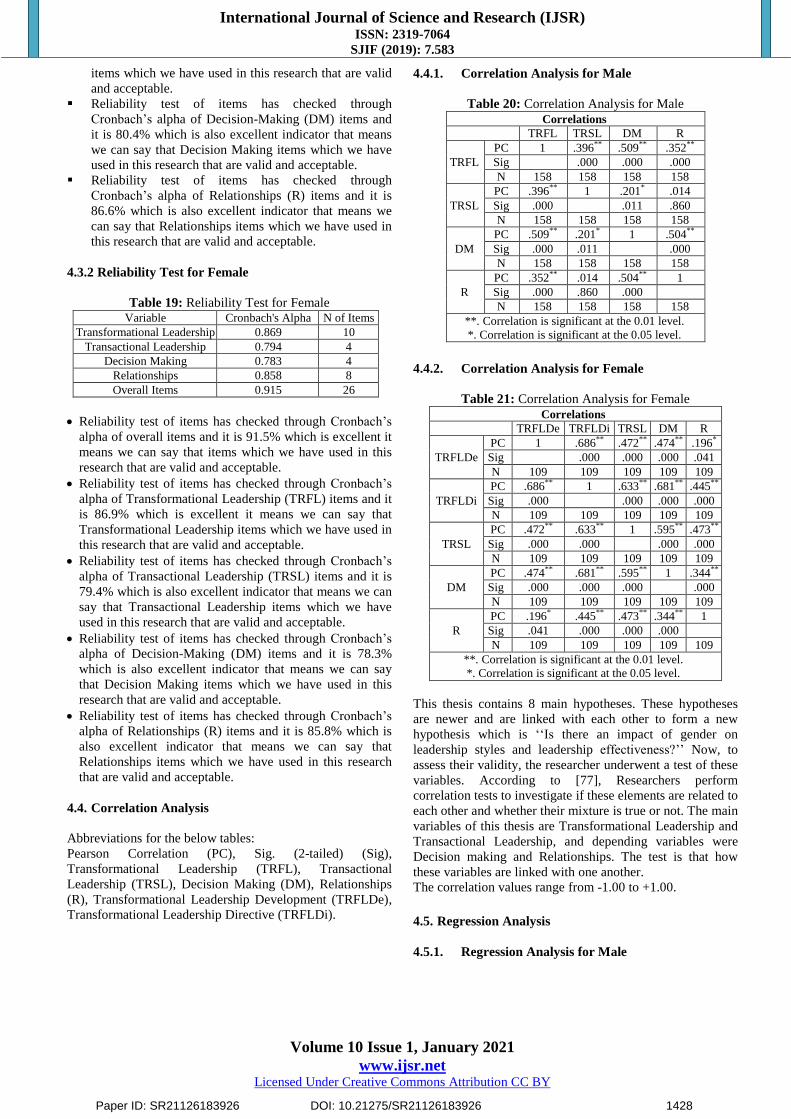
4.3.2 Reliability Test for Female
Table 19: Reliability Test for Female Variable Cronbach's Alpha N of Items
Transformational Leadership 0.869 10
Transactional Leadership 0.794 4
Decision Making 0.783 4
Relationships 0.858 8
Overall Items 0.915 26
Reliability test of items has checked through Cronbach‟s
alpha of overall items and it is 91.5% which is excellent it
means we can say that items which we have used in this
research that are valid and acceptable.
Reliability test of items has checked through Cronbach‟s
alpha of Transformational Leadership (TRFL) items and it
is 86.9% which is excellent it means we can say that
Transformational Leadership items which we have used in
this research that are valid and acceptable.
Reliability test of items has checked through Cronbach‟s
alpha of Transactional Leadership (TRSL) items and it is
79.4% which is also excellent indicator that means we can
say that Transactional Leadership items which we have
used in this research that are valid and acceptable.
Reliability test of items has checked through Cronbach‟s
alpha of Decision-Making (DM) items and it is 78.3%
which is also excellent indicator that means we can say
that Decision Making items which we have used in this
research that are valid and acceptable.
Reliability test of items has checked through Cronbach‟s
alpha of Relationships (R) items and it is 85.8% which is
also excellent indicator that means we can say that
Relationships items which we have used in this research
that are valid and acceptable.
4.4. Correlation Analysis
Abbreviations for the below tables:
Pearson Correlation (PC), Sig. (2-tailed) (Sig),
Transformational Leadership (TRFL), Transactional
Leadership (TRSL), Decision Making (DM), Relationships
(R), Transformational Leadership Development (TRFLDe),
Transformational Leadership Directive (TRFLDi).
4.4.1. Correlation Analysis for Male
Table 20: Correlation Analysis for Male
Correlations
TRFL TRSL DM R
TRFL
PC 1 .396** .509** .352**
Sig .000 .000 .000
N 158 158 158 158
TRSL
PC .396** 1 .201* .014
Sig .000 .011 .860
N 158 158 158 158
DM
PC .509** .201* 1 .504**
Sig .000 .011 .000
N 158 158 158 158
R
PC .352** .014 .504** 1
Sig .000 .860 .000
N 158 158 158 158
**. Correlation is significant at the 0.01 level.
*. Correlation is significant at the 0.05 level.
4.4.2. Correlation Analysis for Female
Table 21: Correlation Analysis for Female
Correlations
TRFLDe TRFLDi TRSL DM R
TRFLDe
PC 1 .686** .472** .474** .196*
Sig .000 .000 .000 .041
N 109 109 109 109 109
TRFLDi
PC .686** 1 .633** .681** .445**
Sig .000 .000 .000 .000
N 109 109 109 109 109
TRSL
PC .472** .633** 1 .595** .473**
Sig .000 .000 .000 .000
N 109 109 109 109 109
DM
PC .474** .681** .595** 1 .344**
Sig .000 .000 .000 .000
N 109 109 109 109 109
R
PC .196* .445** .473** .344** 1
Sig .041 .000 .000 .000
N 109 109 109 109 109
**. Correlation is significant at the 0.01 level.
*. Correlation is significant at the 0.05 level.
This thesis contains 8 main hypotheses. These hypotheses
are newer and are linked with each other to form a new
hypothesis which is „„Is there an impact of gender on
leadership styles and leadership effectiveness?‟‟ Now, to
assess their validity, the researcher underwent a test of these
variables. According to [77], Researchers perform
correlation tests to investigate if these elements are related to
each other and whether their mixture is true or not. The main
variables of this thesis are Transformational Leadership and
Transactional Leadership, and depending variables were
Decision making and Relationships. The test is that how
these variables are linked with one another.
The correlation values range from -1.00 to +1.00.
4.5. Regression Analysis
4.5.1. Regression Analysis for Male
Paper ID: SR21126183926 DOI: 10.21275/SR21126183926 1428
International Journal of Science and Research (IJSR) ISSN: 2319-7064
SJIF (2019): 7.583
Volume 10 Issue 1, January 2021
www.ijsr.net Licensed Under Creative Commons Attribution CC BY
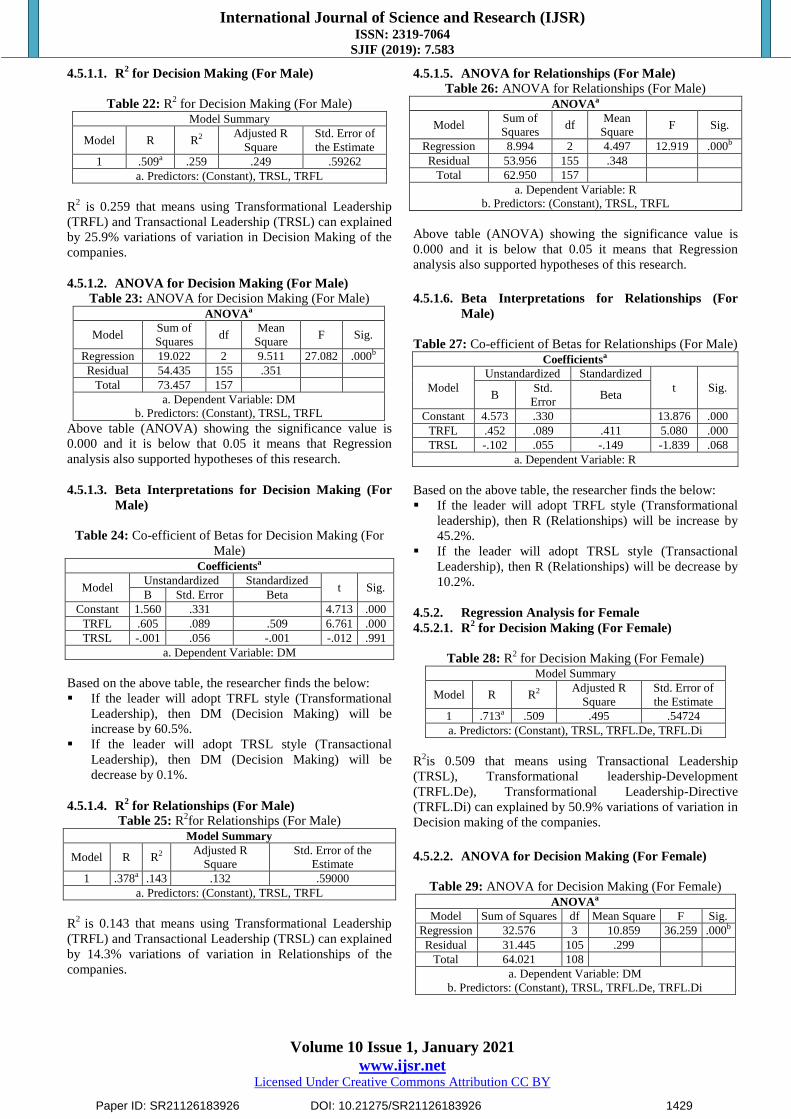
4.5.1.1. R2 for Decision Making (For Male)
Table 22: R2 for Decision Making (For Male)
Model Summary
Model R R2 Adjusted R
Square
Std. Error of
the Estimate
1 .509a .259 .249 .59262
a. Predictors: (Constant), TRSL, TRFL
R2 is 0.259 that means using Transformational Leadership
(TRFL) and Transactional Leadership (TRSL) can explained
by 25.9% variations of variation in Decision Making of the
companies.
4.5.1.2. ANOVA for Decision Making (For Male)
Table 23: ANOVA for Decision Making (For Male)
ANOVAa
Model Sum of
Squares df
Mean
Square F Sig.
Regression 19.022 2 9.511 27.082 .000b
Residual 54.435 155 .351
Total 73.457 157
a. Dependent Variable: DM
b. Predictors: (Constant), TRSL, TRFL
Above table (ANOVA) showing the significance value is
0.000 and it is below that 0.05 it means that Regression
analysis also supported hypotheses of this research.
4.5.1.3. Beta Interpretations for Decision Making (For
Male)
Table 24: Co-efficient of Betas for Decision Making (For
Male)
Coefficientsa
Model Unstandardized Standardized
t Sig. B Std. Error Beta
Constant 1.560 .331 4.713 .000
TRFL .605 .089 .509 6.761 .000
TRSL -.001 .056 -.001 -.012 .991
a. Dependent Variable: DM
Based on the above table, the researcher finds the below:
If the leader will adopt TRFL style (Transformational
Leadership), then DM (Decision Making) will be
increase by 60.5%.
If the leader will adopt TRSL style (Transactional
Leadership), then DM (Decision Making) will be
decrease by 0.1%.
4.5.1.4. R2 for Relationships (For Male)
Table 25: R2for Relationships (For Male)
Model Summary
Model R R2 Adjusted R
Square
Std. Error of the
Estimate
1 .378a .143 .132 .59000
a. Predictors: (Constant), TRSL, TRFL
R2
is 0.143 that means using Transformational Leadership
(TRFL) and Transactional Leadership (TRSL) can explained
by 14.3% variations of variation in Relationships of the
companies.
4.5.1.5. ANOVA for Relationships (For Male)
Table 26: ANOVA for Relationships (For Male)
ANOVAa
Model Sum of
Squares df
Mean
Square F Sig.
Regression 8.994 2 4.497 12.919 .000b
Residual 53.956 155 .348
Total 62.950 157
a. Dependent Variable: R
b. Predictors: (Constant), TRSL, TRFL
Above table (ANOVA) showing the significance value is
0.000 and it is below that 0.05 it means that Regression
analysis also supported hypotheses of this research.
4.5.1.6. Beta Interpretations for Relationships (For
Male)
Table 27: Co-efficient of Betas for Relationships (For Male)
Coefficientsa
Model
Unstandardized Standardized
t Sig. B
Std.
Error Beta
Constant 4.573 .330 13.876 .000
TRFL .452 .089 .411 5.080 .000
TRSL -.102 .055 -.149 -1.839 .068
a. Dependent Variable: R
Based on the above table, the researcher finds the below:
If the leader will adopt TRFL style (Transformational
leadership), then R (Relationships) will be increase by
45.2%.
If the leader will adopt TRSL style (Transactional
Leadership), then R (Relationships) will be decrease by
10.2%.
4.5.2. Regression Analysis for Female
4.5.2.1. R2 for Decision Making (For Female)
Table 28: R2 for Decision Making (For Female)
Model Summary
Model R R2 Adjusted R
Square
Std. Error of
the Estimate
1 .713a .509 .495 .54724
a. Predictors: (Constant), TRSL, TRFL.De, TRFL.Di
R2is 0.509 that means using Transactional Leadership
(TRSL), Transformational leadership-Development
(TRFL.De), Transformational Leadership-Directive
(TRFL.Di) can explained by 50.9% variations of variation in
Decision making of the companies.
4.5.2.2. ANOVA for Decision Making (For Female)
Table 29: ANOVA for Decision Making (For Female)
ANOVAa
Model Sum of Squares df Mean Square F Sig.
Regression 32.576 3 10.859 36.259 .000b
Residual 31.445 105 .299
Total 64.021 108
a. Dependent Variable: DM
b. Predictors: (Constant), TRSL, TRFL.De, TRFL.Di
Paper ID: SR21126183926 DOI: 10.21275/SR21126183926 1429

International Journal of Science and Research (IJSR) ISSN: 2319-7064
SJIF (2019): 7.583
Volume 10 Issue 1, January 2021
www.ijsr.net Licensed Under Creative Commons Attribution CC BY
Above table (ANOVA) showing the significance value is
0.000 and it is below that 0.05 it means that Regression
analysis also supported hypotheses of this research.
4.5.2.3. Beta Interpretations for Decision Making (For
Female
Table 30: Beta Interpretations for Decision Making (For
Female)
Coefficientsa
Model Unstandardized Standardized
t Sig. B Std. Error Beta
Constant 1.066 .355 3.001 .003
TRFLDe -.009 .115 -.007 -.078 .938
TRFLDi .492 .103 .513 4.784 .000
TRSL .249 .081 .274 3.090 .003
a. Dependent Variable: DM
Based on the above table, the researcher finds the below:
If the leader will adopt TRFL.Destyle
(Transformational Leadership-Development), then DM
(Decision Making) will be decrease by 0.9%.
If the leader will adopt TRFL.Di style
(Transformational Leadership-Directive), then DM
(Decision Making) will be increase by 49.2%.
If the leader will adopt TRSL style (Transactional
Leadership), then DM (Decision Making) will be
increase by 24.9%.
4.5.2.4. R2 for Relationships (For Female)
Table 31: R2 for Relationships (For Female)
Model Summary
Model R R2 Adjusted R
Square
Std. Error of the
Estimate
1 .535a .287 .266 .53459
a. Predictors: (Constant), TRSL, TRFL.De, TRFL.Di
R2 is 0.287 that means using Transactional Leadership
(TRSL), Transformational leadership-Development
(TRFL.De), Transformational Leadership-Directive
(TRFL.Di) can explained by 28.7% variations of variation in
Relationships of the companies.
4.5.2.5. ANOVA for Relationships (For Female)
Table 32: ANOVA for Relationships (For Female) ANOVAa
Model Sum of Squares df Mean Square F Sig.
Regression 12.060 3 4.020 14.067 .000b
Residual 30.007 105 .286
Total 42.068 108
a. Dependent Variable: R
b. Predictors: (Constant), TRSL, TRFL.De, TRFL.Di
Above table (ANOVA) showing the significance value is
0.000 and it is below that 0.05 it means that Regression
analysis also supported hypotheses of this research.
4.5.2.6. Beta Interpretations for Relationships (For
Female)
Table 33: Beta Interpretations for Relationships (For
Female) Coefficientsa
Model Unstandardized Standardized
t Sig. B Std. Error Beta
Constant 4.862 .347 14.017 .000
TRFLDe -.228 .113 -.229 -2.021 .046
TRFLDi .304 .100 .392 3.030 .003
TRSL .246 .079 .333 3.121 .002
a. Dependent Variable: DM
Based on the above table, the researcher finds the below:
If the leader will adopt TRFL.De style (Transformational
Leadership-Development), then R (Relationships) will be
decrease by 22.8%.
If the leader will adopt TRFL.Di style (Transformational
Leadership-Directive), then R (Relationships) will be
increase by 30.4%.
If the leader will adopt TRSL style (Transactional
Leadership), then R (Relationships) will be increase by
24.6%.
4.6. Updated Conceptual Framework
Figure 2: Updated Conceptual Framework
4.7. Updated and Testing Hypotheses
1) H1: Male in transformational leadership has an impact
on decision making.
Based on table 20, value of R is 0.509 and ρ ˂ 0.05.
Based on table 22, R2 = 0.259.
Based on table 23, ρ ˂ 0.05.
Based on table 24, ρ ˂ 0.05.
Based on the above results, it means there is strong
relationship between Male, Transformational Leadership
and Decision Making, that is supported H1 hypothesis.
2) H2: Male in transactional leadership has an impact on
relationships.
Based on table 20, value of R is 0.014 and ρ ˃ 0.05.
Based on table 25, R2 = 0.143.
Based on table 26, ρ ˂ 0.05.
Based on table 27, ρ ˃ 0.05.
Based on the above results, it means there no strong
significant relationship between Male, Transactional
Leadership and Relationships, that is not supported H2
hypothesis.
Paper ID: SR21126183926 DOI: 10.21275/SR21126183926 1430
International Journal of Science and Research (IJSR) ISSN: 2319-7064
SJIF (2019): 7.583
Volume 10 Issue 1, January 2021
www.ijsr.net Licensed Under Creative Commons Attribution CC BY
3) H3: Male in transformational leadership has an impact
on Relationship.
Based on table 20, value of R is 0.352 and ρ ˂ 0.05.
Based on table 25, R2 = 0.143.
Based on table 26, ρ ˂ 0.05.
Based on table 27, ρ ˂ 0.05.
Based on the above results, it means there is strong
relationship between Male, Transformational Leadership
and Relationships, that is supported H3 hypothesis.
4) H4: Male in transactional leadership has an impact on
decision making.
Based on table 20, value of R is 0.201 and ρ ˃ 0.05.
Based on table 22, R2 = 0.259.
Based on table 23, ρ ˂ 0.05.
Based on table 24, ρ ˃ 0.05.
Based on the above results, it means there is no strong
significant relationship between Male, Transactional
Leadership and Decision Making, that is not supported H4
hypothesis.
5) H5: Female in transformational leadership-development
has an impact on decision making.
Based on table 21, value of R is 0.474 and ρ ˂ 0.05.
Based on table 28, R2 = 0.509.
Based on table 29, ρ ˂ 0.05.
Based on table 30, ρ ˃ 0.05.
Based on the above results, it means there is no strong
significant relationship between Female, Transformational
Leadership-Development and Decision Making, that is not
supported H5 hypothesis.
6) H6: Female in transformational leadership-
development has an impact on relationships.
Based on table 21, value of R is 0.196 and ρ ˂ 0.05.
Based on table 31, R2 = 0.287.
Based on table 32, ρ ˂ 0.05.
Based on table 33, ρ ˂ 0.05.
Based on the above results, it means there is strong
relationship between Female, Transformational Leadership-
Development and Relationships, that is supported H6
hypothesis.
7) H7: Female in transformational leadership- directive
has an impact on decision making.
Based on table 21, value of R is 0.681 and ρ ˂ 0.05.
Based on table 28, R2 = 0.509.
Based on table 29, ρ ˂ 0.05.
Based on table 34, ρ ˂ 0.05.
Based on the above results, it means there is strong
relationship between Female, Transformational Leadership-
Directive and Decision Making, that is supported H7
hypothesis.
8) H8: Female in transformational leadership- directive
has an impact on relationships.
Based on table 21, value of R is 0.445 and ρ ˂ 0.05.
Based on table 31, R2 = 0.287.
Based on table 32, ρ ˂ 0.05.
Based on table 33, ρ ˂ 0.05.
Based on the above results, it means there is strong
relationship between Female, Transformational Leadership-
Directive and Relationships, that is supported H8
hypothesis.
9) H9: Female in transactional leadership has an impact on
decision making.
Based on table 21, value of R is 0.595 and ρ ˂ 0.05.
Based on table 28, R2 = 0.509.
Based on table 29, ρ ˂ 0.05.
Based on table 30, ρ ˂ 0.05.
Based on the above results, it means there is strong
relationship between Female, Transactional Leadership and
Decision Making, that is supported H9 hypothesis.
10) H10: Female in transactional leadership has an impact
on relationships.
Based on table 21, value of R is 0.473 and ρ ˂ 0.05.
Based on table 31, R2 = 0.287.
Based on table 32, ρ ˂ 0.05.
Based on table 33, ρ ˂ 0.05.
Based on the above results, it means there is strong
relationship between Female, Transactional Leadership and
Relationships, that is supported H10 hypothesis.
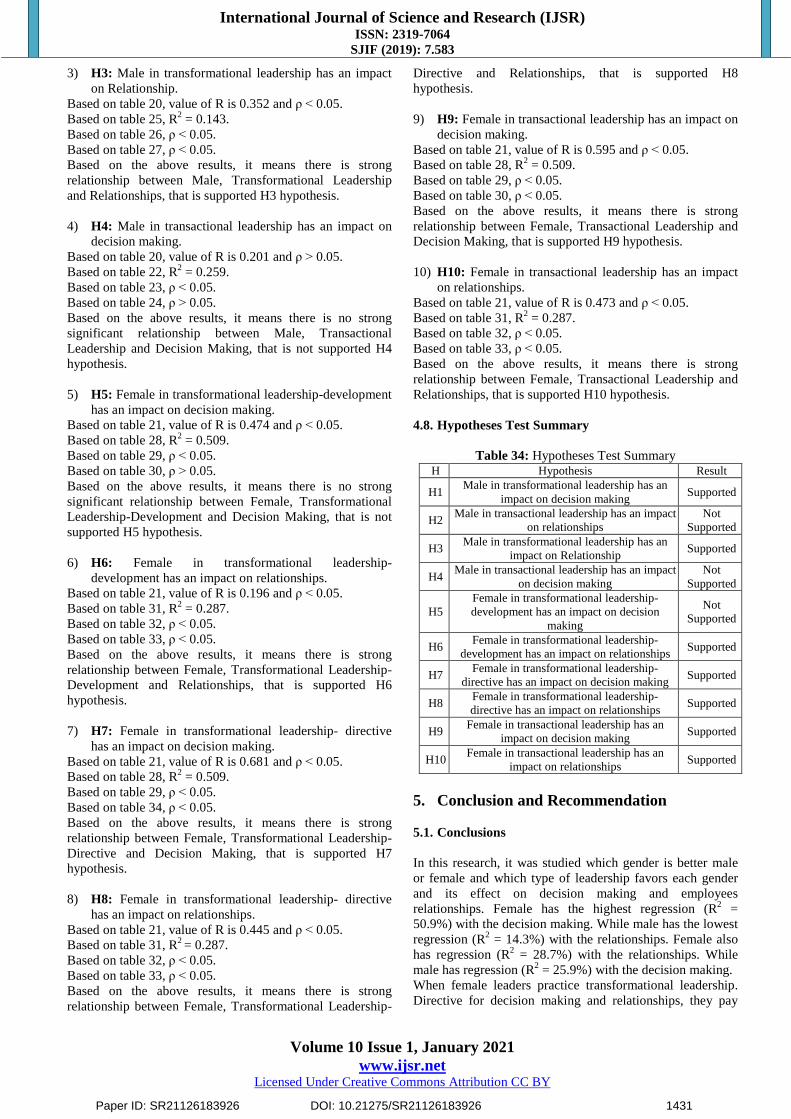
4.8. Hypotheses Test Summary
Table 34: Hypotheses Test Summary H Hypothesis Result
H1 Male in transformational leadership has an
impact on decision making Supported
H2 Male in transactional leadership has an impact
on relationships
Not
Supported
H3 Male in transformational leadership has an
impact on Relationship Supported
H4 Male in transactional leadership has an impact
on decision making
Not
Supported
H5
Female in transformational leadership-
development has an impact on decision
making
Not
Supported
H6 Female in transformational leadership-
development has an impact on relationships Supported
H7 Female in transformational leadership-
directive has an impact on decision making Supported
H8 Female in transformational leadership-
directive has an impact on relationships Supported
H9 Female in transactional leadership has an
impact on decision making Supported
H10 Female in transactional leadership has an
impact on relationships Supported
5. Conclusion and Recommendation
5.1. Conclusions
In this research, it was studied which gender is better male
or female and which type of leadership favors each gender
and its effect on decision making and employees
relationships. Female has the highest regression (R2 =
50.9%) with the decision making. While male has the lowest
regression (R2 = 14.3%) with the relationships. Female also
has regression (R2 = 28.7%) with the relationships. While
male has regression (R2 = 25.9%) with the decision making.
When female leaders practice transformational leadership.
Directive for decision making and relationships, they pay
Paper ID: SR21126183926 DOI: 10.21275/SR21126183926 1431

International Journal of Science and Research (IJSR) ISSN: 2319-7064
SJIF (2019): 7.583
Volume 10 Issue 1, January 2021
www.ijsr.net Licensed Under Creative Commons Attribution CC BY
attention to the needs of their supporters, display empathy,
and foster personal growth and expression.
Also, according to the results, transactional leadership also
has high percent Beta for both decision making and a
relationship, that is means female leaders also adopt
transactional leadership, but transformational leadership has
a larger impact than transactional leadership [78, 79, 80].
On the other hand, male leaders practice transformational
leadership for decision making and relationships, they also
raising individuals from low levels of need to higher levels
of survival [81].
In summary, according to the results of the research, female
leaders are more effective and have a huge impact than male
leaders on decision making and employees relationships in
real estate and construction companies in Istanbul, Turkey.
5.2. Suggestion and Recommendation for Future
Research
The results of this study demonstrate the effect of
transformational and transactional leadership on decision
making and relationships in construction and real estate
companies; the generalizability of these findings to other
companies, such as healthcare services and education
companies, is questioned. Will equivalent findings be
achieved by an education company with a history of
business problems? The environmental and historical
background of a company possibly plays a role in the
relationship between types of leadership and effectiveness.
This topic could be answered by potential field studies.
Longitudinal studies could help explain how, over time, the
relationship between transformational and transactional
leadership and effectiveness works. There will certainly be
improvements in how transformational and transactional
leadership and leadership effectiveness interconnect over
such different periods of a company life cycle as growth,
deterioration, mergers, etc. For instance, during the
establishment of the company, development, and
revitalization phases of a company transformational
leadership is most important [82]. In other leadership styles,
such as bureaucratic and autocratic leadership, another area
that can be exposed to future study is to check if there is a
disparity in male and female leadership.
The analysis is also performed much of the time using
quantitative methods. Since certain elements of leadership
can be evaluated using qualitative methods, both methods
should be used to carry out future research.
References
[1] Gender diversity journey: company good practices /
International Labour Office, Bureau for Employers‟
Activities (ACT/EMP). - Geneva: ILO, 2017.
[2] Grant, Jan. (1998). Women as managers: What they
can offer to organizations. Organizational Dynamics,
16(3), 56-63.
[3] Kabacof, R. I., & Stoffey, R. W. (2001). Age
differences in organizational leadership. In 16th
Annual Conference of the Society for Industrial and
Organizational Psychology, San Diego, CA.
[4] Karau, S. J., & Eagly, A. H. (1999). Invited reaction:
Gender, social roles, and the emergence of leaders.
Human Resource Development Quarterly, 10(4), 321-
327.
[5] Kim, H. S., & Shim, S. (2003). Gender-based approach
o the understanding of leadership roles among retail
managers. Human Resource Development Quarterly,
14(3), 321-342.
[6] Eagly, A. H., Johannesen-Schmidt, M. C., & Van
Engen, M. L. (2003). Transformational, transactional,
and laissez-faire leadership styles: Ameta-analysis
comparing women and men.
[7] Mohr, G., & Wolfram, H. J. (2008). Leadership and
effectiveness in the context of gender: The role of
leaders' verbal behaviour. British Journal of
Management, 19(1), 4-16.
[8] Burke, S., & Collins, K. M. (2001). Gender differences
in leadership styles and management skills. Women in
Management Review, 16(5), 244-257.
[9] Powell, G. N. (1990). One more time: Do female and
male managers differ? The Executive, 4(3), 68-75.
[10] Rosener, J. B. (1990). Ways women lead. Harvard
business review, 68(6), 119-125.
[11] Bass, B. M. (1997). Does the transactional–
transformational leadership paradigm transcend
organizational and national boundaries? American
psychologist, 52(2), 130.
[12] McKinsey, C. (2007). Women Matter: Gender
diversity, a corporate performance driver.
[13] Trinidad, C., & Normore, A. H. (2005). Leadership
and gender: A dangerous liaison? Leadership &
Organization Development Journal, 26(7), 574-590.
[14] Olsson, S., & Walker, R. (2003). Through a gendered
lens? Male and female executives‟ representations of
one another. Leadership & Organization Development
Journal, 24(7), 387-396.
[15] Balasubramanian, P., & Krishnan, V. R. (2012).
Impact of gender and transformational leadership on
ethical behaviours. Great Lakes Herald, 6(1), 48-58.
[16] Eagly, A. H., Johannesen-Schmidt, M. C., & Van
Engen, M. L. (2003). Transformational, transactional,
and laissez-faire leadership styles: a meta-analysis
comparing women and men. Psychological bulletin,
129(4), 569.
[17] Bass, B.M., & Avolio, B.J. (1994). Shatter the glass
ceiling: Women may make better managers. Human
Resource Management, 33, 549-560.
[18] Van Engen, M. L., & Willemsen, T. M. (2004). Sex
and leadership styles: A meta-analysis of Research
Published in the 1990s. Psychological Reports, 94 (1),
3-18.
[19] Gregory, A. (1990). Three theoretical perspectives
concerning women in management Journal of Business
Ethics, 9, 257- 266.
[20] Eagly, A. H., & Karau, S. J. (1991). Gender and
emergence of leaders: Ameta analysis, Journal of
Personality and Social Psychology, 60, 685-710.
[21] Korabik, K., & Ayman, R. (1989). Should women
managers have to act like men? Journal of
Management Development, 8(6), 23-32.
Paper ID: SR21126183926 DOI: 10.21275/SR21126183926 1432
International Journal of Science and Research (IJSR) ISSN: 2319-7064
SJIF (2019): 7.583
Volume 10 Issue 1, January 2021
www.ijsr.net Licensed Under Creative Commons Attribution CC BY
[22] Smith PB, Wang ZM (1996). Chinese leadership and
organizational structure. In MH, Bond. eds. The
handbook of Chinese psychology. Hong Kong: Oxford
University Press.
[23] Hosftede G (1980). Culture‟s consequences:
International differences inwork related values.
Beverly Hill, CA: Sage.
[24] Smith PB, Bond MH (1993). Social psychology across
cultures: Analysis and perspectives. Needham, MA:
Allyn and Bacon.
[25] Gelfand MJ, Erez M, Aycan Z (2007). Cross-cultural
organizational behavior. Annu. Rev. Psychol., 58: 479-
514.
[26] Eagly AH (1987). Sex differences in social behavior:
A social-role Interpretation. Erlbaum, NJ: Hillsdale.
[27] Eagly AH, Wood W, Diekman AB (2000). Social role
theory of sex differences and similarities: A current
appraisal. In Eckes T, Trautner HM (Eds.). The
developmental social psychology of gender. Mahwah,
NJ: Lawrence Erlbaum Associates. pp. 123-174.
[28] Eagly AH, Karau SJ (2002). Role congruity theory of
prejudice toward female leaders. Psychol. Rev.,
109(3): 573-598.
[29] Eagly AH, Makhijani MG, Klonsky BG (1992).
Gender and the evaluation of leaders: A meta-analysis.
Psychol. Bull. 111(1), 18(1): 39–50.
[30] Vecchio RP, Bullis RC (2001). Moderators of the
influence of supervisor-subordinate similarity on
subordinate outcomes. J. Appl. Psychol., 86(5): 884-
896.
[31] Brenner O, Tomkiewicz J, Schein VE (1989). The
relationship betweens ex role stereotypes and requisite
management characteristics revisited. Acad. Manag. J.,
32(3): 662-669.
[32] Deal JJ, Stevenson MA (1998). Perceptions of female
and male managers in the 1990s: Plus ça change. Sex
Roles, 38(3): 287-300.
[33] Powell GN, Butterfield DA (1989). The “good
manager”: Did androgynyfare better in the 1980s?
Group Org. Stud., 14(2): 216-233.
[34] Powell GN, Butterfield DA, Parent JD (2002).Gender
and managerial stereotypes: Have the times changed?
J. Manag., 28(2): 177-193.
[35] Moss, J. and Jensrud, Q. 1995. “Gender, leadership
and vocational education”. Journal of Industrial
Teacher Education, Vol. 33 (1): 6-23.
[36] Blake, R. and Mouton, J. 1964. The Managerial Grid:
Key Orientations for Achieving Production Through
People, Houston, TX: Gulf Publishing.
[37] Hersey, P. and Blanchard, K. H. 1988. Management of
Organizational Behaviour. Englewood Cliffs,
NJ:Prentice-Hall.
[38] Eagly, A. H. and Johnson, B. T. 1990. "Gender and
leadership style: a meta-analysis". Psychological
Bulletin, Vol. 108: 233-256.Self-identity and Work.
New York: Oxford University Press.
[39] Park, D. 1996. "Gender role, decision style and
leadership style". Women in Management Review, Vol.
11 (8):13-17.
[40] Avolio, B. J. and Howell, J. M. 1992. "The impact of
leader behaviour and leader-follower personality
match on satisfaction and unit performance", in Clarke,
K. E. Clarke, M. B., and CampbellD. R. (Eds.). Impact
of Leadership, Greensboro, NC, The Center for
Creative Leadership.
[41] Bass, B. M. 1985. Leadership and Performance
Beyond Expectations. New York, NY: Free Press.
[42] Hater, J. J. and Bass, B. M. 1988. “Supervisors
evaluations and subordinates‟ perceptions of
transformational leadership”. Journal of Applied
Psychology, Vol. 73: 695-702.
[43] Neumann, Y. and Neumann, E. F. 1999. “The
president and the college bottom line: the role of
strategic leadership styles”. The International Journal
of Educational Management, Vol. 13 (2): 73-81.
[44] Ramsden, P. 1998. Learning to Lead in Higher
Education. New York: Routledge.
[45] Seltzer, J and Bass, B. M. 1990. “Transformational
leadership: beyond initiation and consideration”.
Journal of Management, Vol. 16: 693-703.
[46] Bryman, A. 1992. Charisma and Leadership in
Organizations. London: Sage.
[47] Sullivan, E. and Decker, P.P. (2001). Effective
Leadership and Management in Nursing. Image Credit:
Daveeza, flickr.com
[48] Nayab, N. (2010). Characteristics of Transformational
Leadership. http://www.brighthubinc./March 23, 2011.
[49] Saeed, T., Almas, S., Anis-ul-Haq, M., Niazi, G.S.K.
(2014), Leadership styles: Relationship with conflict
management styles. International Journal of Conflict
Management, 25(3), 214-225.
[50] Bass, B. M. (1997). Does the transactional–
transformational leadership paradigm transcend
organizational and national boundaries? American
Psychologist, 52, 130–139.
[51] Druskat, V.U. (1994). Gender and Leadership Style:
Transformational and Transactional Leadership in The
Roman Catholic Church. Leadership Quarterly, 5(2),
99-199.
[52] Kreitner, R. & Kinicki, A. (2008). Organizational
Behaviour (8the ed.). New York: McGrawHill.
[53] Bass, B.M. and Avolio, B.J. (1994), Improving
Organizational Effectiveness Through
Transformational Leadership, Sage, Thousand Oaks,
CA.
[54] Bass, B.M., Avolio, B.J. and Atwater, L. (1996). The
Transformational and Transactional Leadership of
Men and Women. Applied Psychology: An
International Review, Vol. 45, 5-34.
[55] Aydogdu, S., & Asikgil, B. (2011). The effect of
transformational leadership behaviour on
organizational culture: An application in
pharmaceutical industry. International Review of
Management and Marketing, 1(4), 65.
[56] Covey (2007). The transformational leadership report:
Developing tomorrow‟s transformational leaders
today. Accessed on June 21, 2011 from
www.transformationalleadership.net
[57] Mullins, L. (2005). Management and Organisational
Behaviour, 7th Ed. London: Prentice Hall.
[58] Bass, B.M. (1990). From Transactional to
Transformational Leaders: Learning to Share the
Vision. Organizational Dynamics, 18(3), 19-31.
[59] Lowe, K.B., Kroeck, K.G., & Sivasubramaniam, N.
(1996). Effectiveness Correlates of Transformational
and Transactional Leadership: A Meta-Analytic
Paper ID: SR21126183926 DOI: 10.21275/SR21126183926 1433

International Journal of Science and Research (IJSR) ISSN: 2319-7064
SJIF (2019): 7.583
Volume 10 Issue 1, January 2021
www.ijsr.net Licensed Under Creative Commons Attribution CC BY
Review of The MLQ Literature. Leadership Quarterly
7(3), 385-425.
[60] Bass, B. M., & Avolio, B. J. (2004). Manual for the
multifactor leadership questionnaire (MLQ – Form
5X). CA, Redwood City: Mindgarden.
[61] Sosik, J. J., & Jung, D. I. (2010). Full range leadership
development: Pathways for people, profit and planet.
New York: Routledge.
[62] Bass, B., & Stogdill, R. (1990). Bass and Stogdill's
handbook of leadership: Theory research and
managerial applications. New York: Free Press.
[63] Cooper, J. F. & Nirenberg, J. (2004). Leadership
effectiveness. Encyclopedia of leadership (pp. 845–
854). Thousand Oaks, CA: SAGE Publications.
[64] Yaqoub, H. A. A. (2018). Effects of Gender on
Leadership. California university of Pennsylvania.
[65] Grunig, J.E., & Hon, L. (1999). Guidelines for
Measuring Relationships in PublicRelations. The
Institute for Public Relations Commission on PR
Measurement and Evaluation, 1-40.
[66] Kurt, A., & Zehir, C. (2016). “The relationship
between cost leadership strategy, total quality
management applications and financial performance”,
Doğuş Üniversitesi Dergisi, 17 (1) 2016, 97-110.
[67] Collis, J. and Hussey, R. (2003), Business research,
2nd ed, Palgrave MacMillan.
[68] Czaja, R. and Blair, J. (2005) Designing Surveys: A
Guide to Decisions and Procedures (second edition).
Thousand Oaks: Sage, Pine Forge Press.
[69] Creswell, J. W. (2014). Research Design: Qualitative,
Quantitative and Mixed Methods Approaches (4th ed.).
Thousand Oaks, CA: Sage.
[70] Kumar, J. (2005). Research methodology: A step-by-
step guide for beginners (2nd ed.). London: Sage.
[71] Bass, B. M. & Avolio, B. J. (1997). Full range
leadership development - Manual for the multifactor
leadership questionnaire. Redwood City, CA: Mind
Garden.
[72] Bass, B. M., Avolio, B. J., Jung, D. I., & Berson, Y.
(2003). Predicting Unit Performance by Assessing
Transformational and Transactional Leadership.
Journal of Applied Psychology, 88, 207-218.
[73] Alsayed, A. K., Motaghi, M. H. ve Osman, I. B.
(2012). The use of the multifactor leadership
questionnaire and communication satisfaction
questionnaire in Palestine: A research note.
International Journal of Scientific and Research
Publications, 2(11).
[74] Paracha, M. U., Qamar, A., Mirza, A., Hassan, I. and
Waqas, H. (2012). Impact of leadership
style(transformational & transactional leadership) on
employee performance & mediating role of job
satisfaction: Study of private school (educator) in
Pakistan. Global Journal of Management and Business
Research, 12(4), 55-64.
[75] Cerny, B. A., & Kaiser, H. F. (1977). A study of a
measure of sampling adequacy for factor-analytic
correlation matrices. Multivariate Behavioural
Research, 12(1), 43–47.
[76] Kaiser, H. F. "An index of factorial simplicity,
Psychometrics 39: 31–36." (1974).
[77] Pallant, J. (2007). SPSS survival manual, 3rd. Edition.
McGrath Hill, 15.
[78] Northouse, P. G. (2001). Leadership: Theory and
practice (2nd ed.). Sage Publications, Inc.
[79] Dvir, T., D. Eden, B. J. Avolio, & B. Shamir. (2002).
Impact of transformational leadership on follower
development and performance: A field experiment.
Academy of Management Journal, 45(4), 735–744.
[80] Waldman, D. A., Ramirez, G. G., House, R. J., &
Puranam, P. 2001. Does leadership matter?:CEO
leadership attributes under conditions of perceived
environmental uncertainty. Academy of Management
Journal, 44: 134-143.
[81] Yukl, G. (1989). Leadership in organizations, second
edition. Englewood Cliffs, NJ: Prentice-Hall.
[82] Baliga, B. R., Dachler, H. P., & Schriesheim, C. A.
(1988). Emerging leadership vistas (pp. 85-88). J. G.
Hunt (Ed.). Lexington, MA: Lexington Books.
URL1:˂https://bilgibankasi.ito.org.tr/en/data-
bank/company-statics/number-of-active-
companies˃(Accessed on 13/10/2020)
Author Profile
Basel Dwiri. Received the bachelor‟s degree in civil
engineering from Al-Ahliyya Amman University,
Amman, Jordan, and master‟s degree in Business
Administration (MBA) from Istanbul Aydin
University, Istanbul, Turkey. CEO & Founder at EserEd, a
company specialized in student services and educational
consultations, Istanbul, Turkey.
Dr. Kağan Okatan. He worked as a manager in the
field of Information Technologies for many years. He
led large-scale digital transformation projects. He
holds a doctorate in business administration and a
master's degree in information technology. He is a university
lecturer and research and development projects consultant. He has
focused mainly on management information systems in the fields
of knowledge-based management and innovation management of
organizations.
Paper ID: SR21126183926 DOI: 10.21275/SR21126183926 1434