Embed Size (px)
Citation preview
n. 524 February 2014
ISSN: 0870-8541
The Impact of Industry Characteristics
on Firms' Export Intensity
Joana Reis1
Rosa Forte1,2
1 FEP-UP, School of Economics and Management, University of Porto2 CEF.UP, Research Center in Economics and Finance, University of Porto
1
THE IMPACT OF INDUSTRY CHARACTERISTICS ON FIRMS ’ EXPORT INTENSITY
Joana Reis*
Faculty of Economics and Management,
University of Porto
Rosa Forte†
Faculty of Economics and Management,
University of Porto, and CEF.UP‡
ABSTRACT
The process of globalization of economies and markets has led firms to consider entry into
foreign markets. Exporting is the simplest foreign market entry mode, but also the most
common, not requiring high financial and human resources. Hence it is important to study the
factors that can affect the firm’s export intensity, measure commonly used to assess the export
performance. Several authors have studied the factors that influence the firm’s export
performance, but few have addressed the relationship between industry characteristics and
export intensity. Thus, the objective of the present study is to analyze the impact of industry
characteristics (capital intensity, R&D intensity, labor productivity, export orientation, and
concentration level) on the firm’s export intensity, seeking to add empirical evidence to this
relatively neglected research area. Based on a sample of 1,425 Portuguese firms during the
period 2008-2010, and using panel data estimation, the empirical results show that some
industry characteristics (labor productivity, export orientation, concentration), as well as firm
characteristics (labor productivity, size) are important determinants of a firm’s export
intensity. In particular, we conclude that firm export intensity is positively affected by labor
productivity (at industry and firm level), corroborating the idea that firms and governments
need to direct their policies towards increased productivity in order to improve
competitiveness in foreign markets.
Keywords: Export performance, export intensity, Portuguese firms, industry characteristics.
JEL-Codes: L25, L69
* Email: [email protected] † Corresponding author. Rua Dr. Roberto Frias, 4200 – 464 Porto. Tel. 00351 225 571 100. Email: [email protected]. ‡ CEF.UP – Center for Economics and Finance at UP is financially supported by FCT (Fundação para a Ciência e a Tecnologia).
2
1. INTRODUCTION
Export is a key activity for the economic health of nations since it contributes significantly to
the improvement of the trade balance, the economic growth and improvement of living
standards (Guner et al., 2010 based on Czinkota and Ronkainen, 1998), the promotion and
increase of domestic production capacity, the creation of new job opportunities, the
accumulation of foreign exchange reserves and the enhancement of industrial productivity
(Moghaddam et al., 2012).
Exports account for over 10% of world economic activity, being an important strategic
opportunity for firms (Ahmed and Rock, 2012) because they are seen as a relatively easy and
rapid foreign market entry mode (Sousa et al., 2008), requiring reduced financial and human
resources when compared with other entry modes (Sousa, 2004). According to Moghaddam et
al. (2012), exports have several benefits for firms, ensuring their survival and growth.
Therefore, to study the determinants that influence a firm’s export intensity is essential not
only for firms but also for the governments of the countries that have the responsibility to
develop policies to encourage exports. According to Estrin et al. (2008), export intensity
represents the proportion of firms’ sales that are exported, and should not be confused with
the propensity to export which is related to the firm’s choice of whether or not to export.
Export intensity is the most widely used measures to assess firms export performance (Sousa,
2004).
Several authors have addressed the issue concerning the factors that influence export
performance (e.g., Nazar and Saleem, 2009; Salomon and Shaver, 2005; Zou and Stan, 1998),
however, few studies have analyzed the influence of industry characteristics on the firm’s
export intensity. Zou and Stan (1998) carry out a review of the empirical literature on the
determinants of the export capacity of firms published between 1987 and 1997, dividing them
into internal / external and controllable / uncontrollable (e.g., industry characteristics are
considered external and non-controllable), making only a brief reference to some industry
characteristics (technological intensity and level of instability). Similarly, Sousa et al. (2008)
carry out a review of the empirical literature published between 1998 and 2005.1 Based on
this literature the authors emphasize, within the internal factors, the role of export marketing
strategy, the firm's characteristics and the characteristics of the firm's management. Within the
1 It should be noted that most studies focusing on the export performance of firms (e.g., Zou and Stan, 1998; Leonidou et al., 2002; Nazar and Saleem, 2009) use export intensity as a measure of this performance. Thus, we consider that the determinants of export performance are also determinants of export intensity.
3
external factors they highlight the characteristics of the domestic and foreign markets. Note
that these factors can be divided, having the authors found a total of 40 different determinants,
of which 31 are internal factors and 9 external factors. However, these authors do not mention
the relationship between industry characteristics and export intensity, which shows that this
issue has been neglected in the literature.
For more recent studies (e.g., Iyer, 2010; Lu et al., 2012), it appears that they focus primarily
on firm characteristics, such as size and age, also neglecting the characteristics of the industry.
Thus, this paper focuses on a determinant poorly addressed so far in the literature. The
objective focuses on the study of the relationship between industry characteristics and a firm’s
export intensity, based on a sample of Portuguese firms. The focus on the Portuguese case is
due to the fact that to our knowledge only one study (Lages and Montgomery, 2005) analyzes
this country and with a different objective. Lages and Montgomery (2005) focus on the
relationship between the pricing strategy adaptation and export performance. Through the
present study we intend to explore the role that industry characteristics (capital intensity, R &
D intensity, labor productivity, export orientation and concentration) may have on the firms
export intensity, making an important contribution to the related literature.
This paper is organized as follows. In Section 2, through a brief literature review, we intend to
identify the main determinants of a firm’s export performance and their expected impact, with
particular emphasis on the relationship between industry characteristics and the firm’s export
intensity. In Section 3, we describe the methods employed, with details on the econometric
model, the proxy variables and respective data sources and we also make a descriptive
analysis of the model’s variables. Section 4 presents the main empirical results. Finally, in the
Conclusion Section, we highlight the main results of the study, as well as the respective
limitations and lines for future research analysis.
2. EXPORT PERFORMANCE DETERMINANTS
2.1. Initial considerations
The concept of export performance is not consensual in the literature (Zou and Stan, 1998).
The authors identify three types of export performance measures: financial, nonfinancial and
composite scales. Financial measures are more objective and include sales, profit and growth.
On the other hand, nonfinancial measures are considered more subjective and include
measures of success, satisfaction and goals. Composite scales are based on the results of a set
4
of performance measures. Also Sousa (2004), in his literature review, classifies export
performance measures as objective and subjective, indicating that researchers resort to
subjective measures when managers are unable or unwilling to provide financial data of their
firms. The former are based on numerical values and include measures of sales, profit and
market (e.g. number of markets to which the firm exports), while the latter refers to measures
of perception and attitude. According to Sousa (2004), export intensity is the most widely
used measure in the existing literature. This measure indicates the importance of exports in
total sales of the firm (Estrin et al., 2008) and is on the determinants of export intensity that
the present study focuses on.
In fact, in 43 empirical studies analyzed by Sousa (2004) the author concludes that the most
used objective measure is export intensity (used to define export performance in 16 studies),
followed by the growth rate of export sales (used in 12 studies). However, the variable growth
of export sales is criticized by some authors (Sousa (2004), based on Balcome and Kirpalani
(1987)), because it may overestimate the export performance of firms in the event of price
increases or underestimate it in situations of falling demand.
Once export intensity is accepted as one of the most widely used measures of export
performance, we consider that the determinants of export performance are also determinants
of export intensity.
Export performance determinants are generally grouped into internal factors and external
factors. The former can be controlled by the firm, unlike the second relating to the external
environment (Zou and Stan, 1998; Sousa et al., 2008). According to Zou and Stan (1998), the
internal determinants are justified by the resource based theory while the external
determinants are justified by the theory of industrial organization. The resource-based theory
considers that the firm controls a set of tangible and intangible resources, having the ability to
implement strategies aiming at enhancing its efficiency. For this theory, the internal
organization of resources is the main determinant of export performance (Zou and Stan
(1998), based on Barney (1991) and Collins (1991)). On the other hand, for the theory of
industrial organization, the main determinants of export performance are the external factors
and the firm’s strategies. This theory focuses on the importance of the role of external factors
in the firm's strategy, considering that these factors pressure the firm to adapt in order to
survive and grow (Zou and Stan (1998), based on Collins (1991)).
5
On the one hand, according to Sousa et al. (2008), the foreign market characteristics (e.g.,
environmental turbulence, cultural similarity, market competitiveness, among others) and the
domestic market characteristics (e.g. Export assistance and Environmental hostility) are
considered external factors. Zou and Stan (1998) also mention two characteristics of the
industry (such as, technological intensity and instability). On the other hand, the export
marketing strategy (e.g. product, price, promotion, and distribution strategy), the firm's
characteristics (e.g. size, age, and international experience), as well as the characteristics of
the firm's management (e.g. education, age, and international experience), are considered
internal factors (Sousa et al., 2008). According to the review of Sousa et al. (2008) we realize
that the existing literature has focused on the impact of internal factors. Thus, our work
focuses on an external factor rarely addressed: the characteristics of the industry.
2.2. The impact of industry characteristics
Regarding the characteristics of the industry, Table 1 summarizes the main features addressed
in the few studies on the subject. Table 1 also presents the proxies used to measure the
industry characteristics, the results obtained, method used, the period and country analyzed.
According to the literature, the relationship between the instability of the industry and the
firm’s export performance (export intensity) is positive or not statistically significant. Das
(1994), using a sample of 58 Indian firms and through a discriminant analysis confirms a
strong association between industry instability and export intensity. According to this author,
the instability of the industry is measured by the score of responses to several statements of
whether industry is unstable, has unpredictable changes, changes rapidly, has
seasonal/cyclical fluctuations, is very risky, has a high level of competition, and whether
many new competitors are entering the industry. To measure the instability of the industry
Lim et al. (1996) use the variable “changes in global business conditions (i.e. technology,
products, economic, and socio-political changes)”. Based on a survey conducted of 438
American firms the authors also obtain a positive relationship between changes in products
and export success (measured by the export intensity). Concerning technological, economic
and socio-political changes the relationship found is not statistically significant.

6
Table 1: Characteristics of the industry and export performance
Characteristics of the industry
Proxy Results Author (year)
Method Period Country
Instability
Sum of the fluctuations of the market shares of
each firm
0 Gao et al.
(2010) Regression
model 2002- 2005
China
Changes in global business conditions
+ / 0 Lim et al.
(1996) Regression
model 1996 US
Score of responses to several statements
+ Das (1994) Discrimi-
nant analysis
1994 India
Capital intensity
The ratio of total assets to total sales
- Guner et al. (2010)
Regression model
2001- 2005
US, Japan and Germany
The ratio of total fixed assets to total
employees -
Fu et al. (2009)
Regression model
1999- 2003
China
The ratio of total assets to total employees
- Zhao and
Zou (2002) Regression
model 1990 China
R&D Intensity
R&D expenditures to total industry sales
0 Ito and Pucik (1993)
Regression model
1982/ 1986
Japan
+ Guner et al. (2010)
Regression model
2001- 2005
US, Japan and Germany
Concentration
The ratio of the four largest firms’ sales
to total industry sales +/0
Guner et al. (2010)
Regression model
2001- 2005
US, Japan and Germany
The ratio of the five largest firms’ sales
to total industry sales 0 Iyer (2010)
Regression model
2000- 2006
New Zealand
Herfindahl index 0 Fu et al. (2009)
Regression model
1999- 2003
China
Concentration index
of (8 firms) -
Zhao and Zou (2002)
Regression model
1990 China
Labor productivity
Sales volume per employee
+ / - Guner et al. (2010)
Regression model
2001- 2005
US, Japan and Germany
Life cycle Industry sales
growth +/0
Guner et al. (2010)
Regression model
2001- 2005
US, Japan and Germany
Export-orientation
% of exporters in a specific industry
+ Fu et al. (2009)
Regression model
1999- 2003
China
+ Gao et al.
(2010) Regression
model 2002- 2005
China
Nº of exporters in an industry
0 Iyer (2010) Regression
model 2000- 2006
New Zealand
Legend: (+) positive relationship; (-) negative relationship; (0) relationship is not statistically significant. Source: Own elaboration
Still with regard to the instability of the industry, Gao et al. (2010), basing on a sample of
18,644 Chinese firms, with a panel data over 4 years (2002-2005), also conclude that the
relationship between the instability of the industry (measured by the sum of the fluctuations of
the market shares of each firm in a specific industry) and export intensity is not statistically
significant. Despite this non-significant result, these authors claim that when the domestic
7
market is stable, firms have less motivation to export, because the risk of venturing abroad is
high compared with the risk of competing in the domestic market.
More recent studies (Guner et al., 2010; Iyer, 2010; Fu et al., 2009) also emphasize the role of
industry characteristics. Guner et al. (2010) analyze the impact of five industry characteristics
(capital intensity, R & D intensity, labor productivity, concentration level and life cycle) on
firms export intensity, resorting to a sample of firms from three countries: 560 firms from
Germany, 580 from Japan, and 545 from United States (US).
According to Guner et al. (2010), based on Czinkota & Ronkainen (1998), capital intensity
contributes to the technological sophistication of operations, cost reduction, operational
advantages and ease of entry into foreign markets. In this way, we can expect a positive
relationship between capital intensity and export intensity. However, the results obtained by
Guner et al. (2010) show that, for all three countries, the capital intensity (measured by total
assets over total sales) has a negative impact on export intensity. The same result is obtained
by Zhao and Zou (2002) for a sample of 999 Chinese export firms and by Fu et al. (2009),
also for a sample of Chinese firms (36,941). Fu et al. (2009) claim that lower capital intensity
represents higher labor intensity, that is, firms in labor-intensive industries tend to present
higher export intensity, confirming the idea that the expansion of Chinese firms depends
heavily on its comparative advantage in abundant and cheap labor.
The R & D intensity is another factor likely to influence firms export intensity. Measured by
the ratio of total expenditure on R & D over total sales, Guner et al. (2010) find that it
positively influences the firms export performance in the three countries analyzed. According
to Guner et al. (2010) this is explained by the fact that the investment in R & D enables the
firm to be more competitive in areas such as product development, operational efficiency and
cost reduction. In turn, Ito and Pucik (1993), for a sample of 271 Japanese firms find no
statistically significant relationship between the R & D intensity of the industry and the
percentage of sales for export (export intensity), although they achieve a positive relationship
between the R & D intensity of the industry and export sales.
Also industry concentration (measured by the proportion of sales of the largest firms in total
industry sales) may influence the firms export intensity. According to Guner et al. (2010),
higher concentration levels can positively affect export performance, as dominant firms hold
the necessary resources to compete internationally. The authors obtain a positive relationship
between the four firm concentration ratio and export performance in the case of American
8
firms and Japanese firms. Regarding German firms results are not statistically significant. Iyer
(2010), based on Cloughety and Zang (2008), present two conflicting hypothesis. On the one
hand, industry concentration may allow firms to achieve economies of scale, this being a
factor that favors the entry of firms in foreign markets. On the other hand, the concentration
can also result in a lower incentive to identify new markets, to diversify its products and to
improve the firms export performance. However, results obtained by Fu et al (2009) and Iyer
(2010) are not statistically significant. On the other hand, Zhao and Zou (2002) present a
negative relation between the level concentration of the industry and the export intensity of
the firm.
With regard to labor productivity, Guner et al. (2010) argue that it is a major determinant of
cost and competitiveness, affecting the firm's ability to compete with competitors in foreign
markets. The authors find a positive influence on firms export intensity but only in Japan. In
the other countries the relationship obtained was negative. That is, only in Japan firms in
more productive industries tend to export a higher percentage of their sales.
The life cycle of the industry (measured by industry sales growth: growing industry, declining
or mature industry) is another determinant analyzed by Guner et al. (2010). Quoting Porter
(1990), Guner et al. (2010, p. 128 ) state that “In international trade, growth industries have a
natural competitive edge as they possess the first mover advantage until the technology and
process are diffused”. The authors conclude that the life cycle only has a positive influence on
American and German firms that have annual growth rates above 10%. For Japanese firms
results obtained are not statistically significant.
Finally, still within the industry characteristics, Fu et al. (2009) conclude that firms operating
in highly export-oriented industries with many exporters are more likely to export and have
higher export intensity. On the one hand, non-exporting firms are attracted to exporting,
influenced by the exporting firms. On the other hand, exporting firms may contribute to the
reduction of exporting costs of other firms by obtaining information about foreign markets
and the creation of skilled employment (Fu et al. 2009). Gao et al. (2010) also find a positive
relationship between export orientation and export intensity, arguing that firms can obtain
benefits from exporting, such as economies of scale and revenue diversification. These
authors also state that it is common for firms to imitate the behavior of other exporting firms
in the same industry and that exporting firms may serve as a sign of attractiveness to other
firms that intend to become exporters. On the other hand, Iyer (2010) shows a statistically not
significant relationship between export orientation and export intensity.

9
In short, and as we can see from Table 1, there are few studies that focus on the impact of
industry characteristics on the firm’s export intensity. Thus, this study focuses on a relatively
neglected subject, seeking to improve the knowledge in this area of research.
3. FIRMS EXPORT INTENSITY AND INDUSTRY CHARACTERISTICS : METHODOLOGICAL
APPROACH
3.1. Econometric model and its variables
According to the literature review conducted in the previous section, there are several groups
of variables likely to explain the firms export intensity: export marketing strategy, firm
characteristics, management characteristics, industry characteristics, and domestic and foreign
market characteristics. In the present work, and similarly to Guner et al. (2010), Iyer (2010),
Gao et al. (2010), Fu et al. (2009), Zhao and Zou (2002), and Ito and Pucik (1993), we use
multivariable estimation techniques to analyze the effects of industry characteristics on firms
export intensity. As shown in Table 1, this is the most used methodology. According to these
studies, and taking into account the availability of data, our study focus will be on the
following industry characteristics: capital intensity (CP), R & D intensity (RD), export
orientation (Exp_Or), labor productivity (PRd), and concentration (CR4).2 Thus, as already
stated, to analyze the impact of industry characteristics on the firms export intensity we will
implement a regression model whose expression is represented below:3
(1)
Where Exp_I represents the dependent variable (firm export intensity), S, AG and PRdF
represent, respectively, the size, age and labor productivity of the firm (control variables) and
itε refers to the disturbance term for the i th individual (firm) at the time (year) t.
The econometric analysis deals with a broad range of 1,425 Portuguese firms (unit of analysis)
over three years: 2008-2010. Therefore, we use panel data estimation. The choice of
Portuguese firms is due to the fact that there is a gap in the literature regarding studies
focusing on this country and the greater ease in obtaining the data. Considering the literature
review of Sousa et al. (2008), of the 52 studies reviewed, countries most often analyzed are
2 For example, we do not include the variable life cycle of the product because the period for which we have information is quite small (only 3 years), making it impossible to calculate sales growth rates. 3 Subscripts i, j and t denote firm, industry, and year, respectively.

10
the US, Australia, China, New Zealand and the UK. Only Lages and Montgomery (2005)
focus on the Portuguese case, estimating the relation between the adaptation price strategy
and export performance, that is, their analysis focuses on another type of determinants. In turn,
the studies included in the review of Zou and Stan (1998) make no reference to the
Portuguese case: with a total of 50 studies reviewed, the majority focuses on countries like the
US, Canada, Australia, Austria and Japan.
For the constitution of the sample we used the SABI database which provides access to
financial information on a large set of Portuguese firms. From a total of 45,772 Portuguese
manufacturing firms (sample extracted from the SABI database on February 14, 2013) we
consider those that, for the years 2008 to 2010 show information relating to exports.4 The year
2011 was not included in the sample due to lack of data regarding R & D expenditures. Thus,
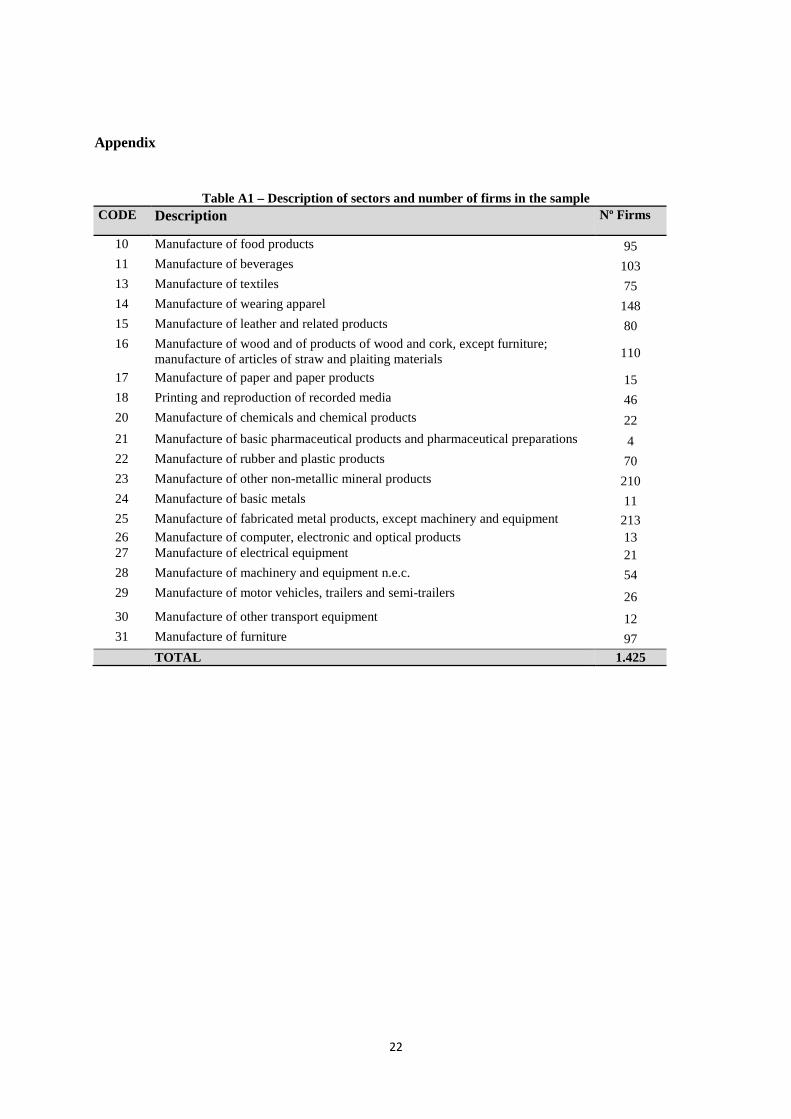
we obtained a sample of 1,425 firms, spanning 20 industries, disaggregated at 2 digits
according to the Portuguese Classification of Economic Activities (NACE Rev. 3), as is
shown in Table A1 in Appendix.5 To obtain the values of the model’s variables, in addition to
the SABI database it was necessary to consider some data provided by the Instituto Nacional
de Estatística (INE), in particular the data on research and development expenditures /
development projects.
As the dependent variable, and following most studies in this area (e.g., Guner et al., 2010;
Iyer, 2010), we use the export intensity of the firm, that is, the share of exports in total sales.
The independent (explanatory) variables, as well as the respective proxies and the expected
effect on the export intensity, are summarized in Table 2.
As independent variables relating to the characteristics of the industry we use the capital
intensity, the R & D intensity, export orientation, labor productivity and concentration.
Similarly to Guner et al. (2010), we chose to measure the capital intensity by total assets in
total industry sales and the R & D intensity by the ratio of expenditure on development
projects in total industry sales.6 To measure industry labor productivity, we resort to the
4 The database SABI is a wide coverage of the Portuguese manufacturing industry: the 45,772 firms represented, in 2010, 62.53% of the total sales of the Portuguese manufacturing industry, 80.50% of the total number of workers in manufacturing firms, and 61.79% of all manufacturing firms (percentages obtained from INE data). 5 Sectors 12 (Manufacture of tobacco products) and 19 (Manufacture of coke and refined petroleum products) are not included due to the lack of data. The sector 32 (Other manufacturing) is not included because it represents a residual value. 6 With the change of Plano Oficial de Contabilidade (POC) to the Sistema de Normalização Contabilistica (SNC), this item changed from "Expenditure on research and development" to "Expenditure on development projects" (Franco, 2010).
11
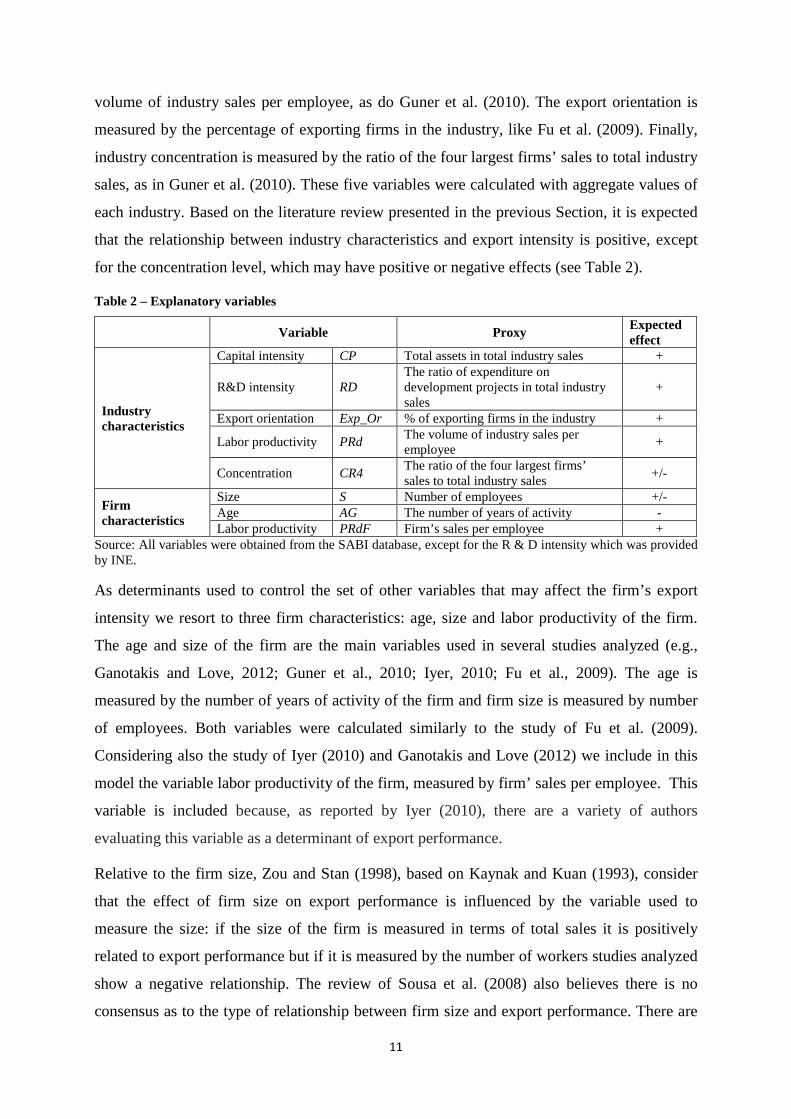
volume of industry sales per employee, as do Guner et al. (2010). The export orientation is
measured by the percentage of exporting firms in the industry, like Fu et al. (2009). Finally,
industry concentration is measured by the ratio of the four largest firms’ sales to total industry
sales, as in Guner et al. (2010). These five variables were calculated with aggregate values of
each industry. Based on the literature review presented in the previous Section, it is expected
that the relationship between industry characteristics and export intensity is positive, except
for the concentration level, which may have positive or negative effects (see Table 2).
Table 2 – Explanatory variables
Variable Proxy Expected effect
Industry characteristics
Capital intensity CP Total assets in total industry sales +
R&D intensity RD The ratio of expenditure on development projects in total industry sales
+
Export orientation Exp_Or % of exporting firms in the industry +
Labor productivity PRd The volume of industry sales per employee
+
Concentration CR4 The ratio of the four largest firms’ sales to total industry sales
+/-
Firm characteristics
Size S Number of employees +/- Age AG The number of years of activity - Labor productivity PRdF Firm’s sales per employee +
Source: All variables were obtained from the SABI database, except for the R & D intensity which was provided by INE.
As determinants used to control the set of other variables that may affect the firm’s export
intensity we resort to three firm characteristics: age, size and labor productivity of the firm.
The age and size of the firm are the main variables used in several studies analyzed (e.g.,
Ganotakis and Love, 2012; Guner et al., 2010; Iyer, 2010; Fu et al., 2009). The age is
measured by the number of years of activity of the firm and firm size is measured by number
of employees. Both variables were calculated similarly to the study of Fu et al. (2009).
Considering also the study of Iyer (2010) and Ganotakis and Love (2012) we include in this
model the variable labor productivity of the firm, measured by firm’ sales per employee. This
variable is included because, as reported by Iyer (2010), there are a variety of authors
evaluating this variable as a determinant of export performance.
Relative to the firm size, Zou and Stan (1998), based on Kaynak and Kuan (1993), consider
that the effect of firm size on export performance is influenced by the variable used to
measure the size: if the size of the firm is measured in terms of total sales it is positively
related to export performance but if it is measured by the number of workers studies analyzed
show a negative relationship. The review of Sousa et al. (2008) also believes there is no
consensus as to the type of relationship between firm size and export performance. There are
12
authors who argue that larger firms have more resources and capabilities to export more
(Sousa et al., 2008; based on Bonaccorsi, 1992) while others find no significant relationship
between firm size and export performance (Sousa et al. 2008; based on Moen, 1999, Wolff
and Pett, 2000 Contractor et al., 2005). This disagreement occurs also in more recent studies.
The study conducted by Fu et al. (2009), from a sample of 36,941 Chinese industrial firms
(between 1999 and 2003) concludes that firm size, measured by the number of employees,
positively affects the firm’s export intensity. In the opposite direction are the conclusions
obtained by Iyer (2010) and Ahmed and Rock (2012). Iyer (2010) finds that firm size
negatively influences their export intensity whereby large firms tend to have a high share in
the domestic market. Similarly, Ahmed and Rock (2012) through the analysis of 133 firms in
the manufacturing sector of Chile, conclude that the small size of the firms contributes
positively to their export intensity.
Note also that there is a large number of studies that did not find evidence of a statistically
significant relationship between firm size and export intensity. For example, Pla-Barber and
Alegre (2007), analyzing a sample of 121 French firms operating in the biotechnology
industry, do not consider the size of the firm as a major factor in the issue of firms’
internationalization, having found weak relationships and even statistically insignificant
relationships between the firm’s size and the export intensity. Additionally, Lu et al. (2012),
through the study of a sample of 10 Australian firms that export services, conclude that firm
size is not a relevant factor for the export performance of all firms in this sample. Similarly,
Ganotakis and Love (2012), with a sample of 412 technology firms in the UK, find no
significant relationship between firm size (measured by the number of employees) and export
intensity.
In short, we can not state unequivocally that firm size positively influences its export intensity
because there is no consensus regarding the influence of firm size on a firm’s export
performance.
Another feature of the firm that provides inconsistent results is the age, expressed by the
number of years of activity (Zou and Stan, 1998). These authors present two negative results
and one not statistically significant regarding the relationship between firm age and export
intensity. Also Sousa et al. (2008) presents one negative result and one not statistically
significant result. More recent studies conclude the same, considering the negative
relationship between firm age and export intensity found by Fu et al. (2009) and Ganotakis
and Love (2012), while Iyer (2010) concludes that this variable is not statistically significant
13
in explaining export intensity. A negative relation between firm age and its foreign activities,
particularly exports, is explained by Ursic and Czinkota (1984). According to these authors
and from a sample of 126 US firms, newer firms export between 21-25% of sales, compared
to 16% that older firms export. These authors, through a questionnaire completed by the firms
in their sample also conclude that all companies of less than 20 years of age perform export
activity, while only 85% of firms with more than 20 years do. Ursic and Czinkota (1984)
argue that newer companies that do not have enough resources to compete in the domestic
market should consider to venture internationally, in order to get experience, becoming more
competitive in the domestic market.
Finally, Iyer (2010) recognizes that the labor productivity of firms considered in their sample
(1140 exporting firms in the primary sector - agriculture and forestry - from New Zealand) is
positively related to the firms’ export intensity. According to the author, this result means that
more productive exporting firms tend to export larger quantities of product, which is due to
the existence of fixed and variable costs that productive firms are better able to withstand
(Iyer (2010), based on Hiep and Nishijima (2009)), being more likely to get into a larger
number of markets (Iyer (2010), based on Bernard et al. (2003)). Meanwhile, Arnold and
Hussinger (2005) find a positive relationship between firm labor productivity and the
probability of exporting, confirming that the firm's productivity can influence their export
performance. In the same line, also Ganotakis and Love (2012) obtained a positive
relationship between firm performance (measured by labor productivity) and export
propensity and intensity, stating that more productive firms tend to export more because they
hold lower marginal costs and can bear the costs of entry into the foreign market. To
summarize, from the firm variables we expect a negative relationship between firm age and
export intensity, a positive or negative relationship between firm size and export intensity,
and finally a positive relationship between labor productivity of the firm and export intensity,
as evidenced in Table 2.
3.2. Short descriptive analysis of the model’s variables
In order to understand the behavior of the model variables, it is useful to examine their
descriptive statistics, both globally and at the sector level. Table 3 shows the descriptive
statistics of all the variables of the model. Note that sector differences are also significant. For

14
this analysis we consider Table A2 in the Appendix, with values aggregated by sector
(average of three years under study).
The dependent variable, export intensity (Exp_I), has a global mean value of 45.8%, which
means that on average 45.8% of the total sales of the firms of the sample are exported. Taking
into account table A2 in Appendix, it appears that the sector whose firms have lower export
intensity is sector 18 (Printing and reproduction of recorded media) and the sector whose
firms have higher export intensity is sector 14 (Manufacture of wearing apparel). The
discrepancy between the minimum (0.0004) and the maximum value (1.0000) means that
there are firms with very small sales abroad and, on the other hand, firms in which all sales
are exported.
Table 3: Descriptive statistics
Firm variables Industry variables
Exp_I AG S PRdF CP RD Exp_Or PRd CR4
Mean 0.4579 18.662 42.023 101.491 1.444 0.007 0.088 87.468 0.211 Maximum 1.0000 92.000 3365.000 6710.000 3.016 0.107 0.266 321.527 0.749
Minimum 0.0004 0.000 1.000 0.220 0.623 0.001 0.031 24.630 0.074 Standard Deviation
0.3604 13.4609 112.256 204.094 0.454 0.006 0.053 57.160 0.140
Nº Obs. 4275 4275 4275 4275 4275 4275 4275 4275 4275
Source: Own calculations
Regarding the age variable, the global average of the firms of the 20 sectors is approximately
19 years of existence of the firm, and the sector 17 (Manufacture of paper and paper products)
is the one whose firms are older, with an average age of approximately 23, and the sector 26
(Manufacture of computer, electronic and optical products) is the one whose firms are
younger, with an average of 10 years of existence.
With regard to firm size, sector 29 (Manufacture of motor vehicles, trailers and semi-trailers)
is the one whose firms employ a larger number of workers (average of 224 employees per
firm) and sectors 20 (Manufacture of chemicals and chemical products) and 28 (Manufacture
of machinery and equipment n.e.c.) are those whose firms have fewer employees, both with
about 24 workers per firm.
In relation to firms’ labor productivity, the sector whose firms have lower sales per employee
is sector 31 (Manufacture of furniture) and the sector whose firms have higher productivity is
sector 21 (Manufacture of basic pharmaceutical products and pharmaceutical preparations).

15
This variable is the one with the greatest difference between the minimum volume of sales per
worker (0.220) and the maximum value (6710.000).
Analyzing the characteristics of the industry, it appears that sector 17 is the most capital
intensive and sector 26 is the least capital intensive. Regarding R & D intensity, sector 14 has
the lowest values and sector 21 has the highest R & D intensity. In turn, sector 11
(Manufacture of beverages) is the most export oriented, with a percentage of exporting firms
of about 26% and sector 10 (Manufacture of food products) is the least export oriented (3.2%
of exporting firms). In relation to labor productivity, it is clear that sector 20 is the most
productive and sector 14 is the least productive. The sector that has the lower capital intensity
and the lower age (sector 26) is also the one with the greatest degree of concentration. The
sales of the four largest firms account for 71.9% of total sales in the industry. Sector 14 is the
one which shows less concentration, that is, sales of the four largest firms in this sector
represents only 8.7% of sales of all firms of that sector.
4. INDUSTRY CHARACTERISTICS AND FIRMS EXPORT INTENSITY . EMPIRICAL RESULTS
This paper aims to test the influence of industry characteristics (capital intensity, R & D
intensity, export orientation, labor productivity and concentration) on the export intensity of
firms, controlling for a set of factors likely to influence this export intensity (age, size and
productivity of the firm). After exploratory data analysis performed in the previous section,
let us now perform a causality analysis resorting to multivariate econometric techniques with
panel data.
Using a balanced panel data set with 4,275 observations we start by estimating a pooled
regression model by OLS. Column (1), in Table 4, displays the results of this estimation
which indicates that all the explanatory variables (industry characteristics and firm
characteristics) are statistically significant, but not all have the expected results, according to
the literature review. However, the "pooled" model neglects the existence of heterogeneity
among individuals, assuming the same coefficient for all (note that each individual unique
effects are included in the term εit). It is possible that a great number of factors that affect
export intensity, particularly those related to the characteristics of the firm in terms of export
marketing strategy, management characteristics, among others, are not included in the right-
hand-side of the equation (1). We can assume that these missing or unobserved variables
express the individual (firm) heterogeneity, while remaining constant over time. Moreover,

16
according to Wooldridge (2001), with a large number of individuals and a small number of
periods (as is our case: 1,425 firms during 3 years) we should allow for separate intercepts for
each time period, allowing for aggregate time effects that have the same influence on export
intensity for all i (firms), such as unobserved macroeconomic factors. A common formulation
of such a model can be written as:
(2)
where ittiit u++= θαε with iα being the unknown individual effects to be estimated for each
unit (firm) i, tθ represents different time intercepts and the itu refers to the idiosyncratic
disturbance term. In this way, we have estimated a model with cross fixed effects and time
effects were introduced in the model through two year dummies.7 The results are represented
in column (2) of Table 4.
Table 4: Panel estimation results (Dependent variable: Export intensity)8
Notes: (1) *** , ** and * indicate 1, 5 and 10 percentage significant levels, respectively; (2) t-statistic in parentheses using White cross-section’s heteroscedasticity correction; (3) Like Guner et al. (2010), we use the logarithm for some variables.
7 Note that the pooled model also resorts to time effects. When testing the joint significance of the estimates of
fixed effects (cross-section and time), the two statistics obtained (the F statistic of 25.9 and Chi-Square 11276)
and associated p-values reject the null hypothesis that the cross section and period effects are redundant. 8 To estimate the model we have used the Eviews software.
Independent variables (1) Pooled OLS (2) Cross fixed effects
Industry characteristics
CP -0.152561***
(21.08181) 0.023528
(1.309610)
RD -5.465421*** (-12.67190)
0.110605 (0.093119)
EXP_Or 1.211781*** (-12.67190)
-1.762527* (-1.742430)
LOG(PRd) -0.252705***
(7.122488) 0.121059** (3.114435)
CR4 0.435042*** (5.032834)
-0.158368* (-1.939772)
Firm characteristics
AG -0.001692*** (-22.07157)
LOG(S) 0.016977*** (6.337268)
0.052238*** (4.664228)
LOG(PRdF) 0.027195*** (44.65441)
0.033509*** (4.925277)
Time effects YES YES
F Statistic 60.3938 29.5306
Nº observations 4.275 4.275

17
Note that the use of the cross fixed effects model required the exclusion of the variable age
(AG) due to a problem of perfect multicollinearity. It was also used the Hausman test to check
whether it is appropriate to estimate the specified model using fixed effects or random effects.
The result, in terms of a Chi-Square statistic (115.414) suggests that the fixed effects model is
more appropriate.
Analyzing the results of the fixed effects model (column (2) of Table 4) we realize that three
variables related to the industry characteristics (export orientation, industry labor productivity
and concentration), as well as variables related to firm characteristics (size and labor
productivity) emerge as statistically significant. The variables capital intensity and R & D
intensity are not statistically significant.
Regarding the characteristics of the industry, our results indicate that industry labor
productivity has a positive impact on firms export intensity that is firms in industries with
higher labor productivity tend to export a higher percentage of sales, similar to the results
obtained by Guner et al. (2010) for Japan.
Concerning industry concentration (CR4), the result indicates that firms in industries with
higher (lower) concentration levels tend to exhibit lower (higher) export intensity. This result
is in line with Zhao and Zou (2002), in which they found that industry concentration has a
negative influence on both export propensity and export intensity of Chinese firms. According
to Zhao and Zou (2002, p.66), “Insofar as industry concentration means oligopolistic power,
dominant Chinese firms are able to avoid the possibility of exporting by exploiting their
favorable market positions in the home market”. We can also argue that low levels of
concentration in the industry can mean a high competition in the domestic market leading
companies to look for new markets and consequently presenting higher export intensity.
Finally, regarding industry export orientation, contrary to expectations our results indicate
that industry export orientation has a negative effect on a firm’s export intensity. We think
that this unexpected result could be justified with the reduced disintegration of industries
(only 2 digits), thus including firms that exhibit very different values for the variable export
intensity. Note that considering variables defined in percentage, the export intensity is the one
that has the greatest standard deviation while export orientation presents the lowest standard
deviation.
In relation to the effects of the control variables, the results are in agreement with
expectations. Firms with higher labor productivity tend to present a higher ratio of exports to

18
total sales, which is in line with the results of Iyer (2010). The firm size, measured by the
number of employees also exerts a positive influence on a firm’s export intensity, similar to
the study of Fu et al. (2009). This result is consistent with the idea that large firms usually
own large amounts of capital, advanced technology, intangible assets, or brand name, which
give them a competitive advantage in foreign markets (Fu et al., 2009).
5. CONCLUSIONS
It is widely recognized that exports contribute to ensure the growth and survival of firms,
being particularly relevant when the domestic market is stagnant. Exports are also essential to
ensure the growth of an economy. Thus, the knowledge of the factors likely to affect firms
export performance becomes crucial.
Although there is a vast literature on the determinants of export performance, this has been
focused on the internal/controllable determinants, while the external/uncontrollable
determinants have received scant attention (Zhao and Zou, 2002). In this way, our study
focuses on a relatively unexplored subject, analyzing the impact of industry characteristics
(external/uncontrollable determinant) on export intensity (variable often used to measure
export performance).
Based on a sample of 1,425 Portuguese firms during the period 2008-2010, the empirical
results show that some industry characteristics (labor productivity, export orientation,
concentration), as well as firm characteristics (labor productivity, size) are important
determinants of firm’s export intensity. Regarding industry capital intensity and R & D
intensity results obtained were inconclusive.
Our results are particularly relevant with respect to the variables of industry productivity and
firm productivity. In fact, we conclude that firm export intensity is positively affected by
labor productivity (at industry and firm level), that is firms exhibiting higher productivity and
in industries characterized by higher productivity levels tend to export a higher percentage of
their sales. This result is extremely important for companies and governments responsible for
developing policies to encourage exports since it corroborates the idea that to improve
competitiveness in foreign markets, firms and governments need to direct their policies
towards increased productivity.
Another important result concerns the relationship between the concentration level of the
industry and the firm’s export intensity. The results indicate that the export intensity of firms
19
tends to be higher in industries with lower concentration and therefore more competitive. This
result thus points to an important role of government policies towards promoting competition.
This work presents however some limitations. First, due to the lack of data on the export
intensity for the years prior to 2008, the number of years considered in the panel is very small,
making it impossible to introduce a lag in the independent variables (such as R & D intensity
or capital intensity), as suggested by Ito and Pucik (1993). Thus, further work in this area
should seek to correct this limitation by increasing the number of years in the panel. Second,
contrary to expectations, our results indicate that industry export orientation has a negative
effect on a firm’s export intensity. We suggest that this unexpected result could be due to the
reduced disintegration of industries (only 2 digits), thus including firms that exhibit very
different values of variable export intensity. In this way, future research should address these
issues.
REFERENCES
Ahmed, S. and Rock, J. (2012), “Exploring the relationship between export intensity and
exporter characteristics, resources, and capabilities: evidence from Chile”, Latin
American Business Review, Vol. 13 (1), pp.29-57.
Arnold, J. and Hussinger, K. (2005), “Export behavior and firm productivity in German
manufacturing: a firm-level analysis”, Review of World Economics, Vol. 141 (2), pp.
219-243.
Das, M. (1994), “Successful and unsuccessful exporters from developing countries”,
European Journal of Marketing, Vol. 28 (12), pp. 19-33.
Estrin,S., Meyer, K., Wright, M. and Foliano, F. (2008), “Export propensity and intensity of
subsidiaries in emerging economies”, International Business Review, Vol. 17 (5), pp.574-
586.
Franco, P. (2010), “POC versus SNC explicado”, OTOC - ORDEM DOS TÉCNICOS
OFICIAIS DE CONTAS.
Fu, D., Wu, Y. and Tang, Y. (2009), “The effects of ownership structure and industry
characteristics on export performance”, Discussion Paper 10.09, The University of
Western Australia.

20
Ganotakis, P. and Love, J. (2012), “Export propensity, export intensity and firm performance:
the role of the entrepreneurial founding team”, Journal of International Business Studies,
Vol. 43 (8), pp. 693-718.
Gao, G., Murray, J., Kotabe, M. and Lu, J. (2010), “A ‘strategy tripod’ perspective on export
behaviors: evidence from domestic and foreign firms based in an emerging economy”,
Journal of International Business Studies, Vol. 41 (3), pp. 377-396.
Guner, B., Lee, J., and Lucius, H. (2010), “The impact of industry characteristics on export
performance: a three country study”, International Journal of Business and Economics
Perspectives, Vol. 5 (2), pp. 126-141.
INE (Instituto Nacional de Estatística, I.P.), “Empresas em Portugal 2011”, Lisboa.
Ito, K. and Pucik, V. (1993), “R&D spending, domestic competition, and export performance
of Japanese manufacturing firms”, Strategic Management Journal, Vol. 14 (1), pp. 61-75.
Iyer, K. (2010), “The determinants of firm-level export intensity in New Zealand agriculture
and forestry”, Economic Analysis & Policy, Vol. 40 (1), pp. 75-84.
Lages, L. and Montgomery, D. (2005), “The relationship between export assistance and
performance improvement in Portuguese export ventures: an empirical test of the
mediating role of pricing strategy adaptation”, European European Journal of Marketing,
Vol. 39 (7/8), pp. 755-784.
Leonidou, L., Katsikeas, C. and Samiee, S. (2002), “Marketing strategy determinants of
export performance: a meta-analysis”, Journal of Business Research, Vol. 55 (1), pp. 51-
67.
Lim, J., Sharkey, T. and Kim, K. (1996), “Competitive environmental scanning and export
involvement: an initial inquiry”, International Marketing Review, Vol. 13 (1), pp. 65-80.
Lu, V., Quester, P., Medlin, C. and Scholz, B. (2012), “Determinants of export success in
professional business services: a qualitative study”, The Service Industries Journal, Vol.
32 (10), pp. 1637-1652.
Moghaddam, F., Hamid, A. and Aliakbar, E.(2012), “Management influence on the export
performance of firms: A review of the empirical literature 1989 – 2009”, African Journal
of Business Management, Vol. 6 (15), pp. 5150-5158.

21
Nazar, M. and Saleem, H. (2009), “Firm-level determinants of export performance”,
International Business & Economics Research Journal, Vol. 8 (2), pp. 105-112.
Pla-Barber, J. and Alegre, J. (2007), “Analysing the link between export intensity, innovation
and firm size in a science-based industry”, International Business Review, Vol. 16 (3), pp.
275-293.
Salomon, R. and Shaver J. (2005), “Export and domestic sales: their interrelationship and
determinants”, Strategic Management Journal, Vol. 26 (9), pp. 855-871.
Sousa, C. (2004), “Export performance measurement: an evaluation of the empirical research
in the literature”, Academy of Marketing Science Review, Vol. 2004 (9), pp. 1-21.
Sousa, C., Martínez-Lopez, F. and Coelho, F. (2008), “The determinants of export
performance: a review of the research in the literature between 1998 and 2005”,
International Journal of Management Reviews, Vol. 10 (4), pp. 343-374.
Ursic, M. and Czinkota, M. (1984), “An experience curve explanation of export expansion”,
Journal of Business Research, Vol. 12 (2), pp. 159-168.
Wooldridge, J. (2001), “Applications of generalized method of moments estimation”, Journal
of Economic Perspectives, Vol. 15 (4), pp. 87-100.
Zhao, H. and S. Zou, 2002, The Impact of Industry Concentration and Firm Location on
Export Propensity and Intensity: An Empirical Analysis of Chinese Manufacturing Firms.
Journal of International Marketing Vol.10 (1), pp. 52-71.
Zou, S. and Stan, S. (1998), “The determinants of export performance: a review of the
empirical literature between 1987 and 1997”, International Marketing Review, Vol. 15
(5), pp. 333-356.
22
Appendix
Table A1 – Description of sectors and number of firms in the sample CODE Description Nº Firms
10 Manufacture of food products 95 11 Manufacture of beverages 103 13 Manufacture of textiles 75 14 Manufacture of wearing apparel 148 15 Manufacture of leather and related products 80 16 Manufacture of wood and of products of wood and cork, except furniture;
manufacture of articles of straw and plaiting materials 110
17 Manufacture of paper and paper products 15 18 Printing and reproduction of recorded media 46 20 Manufacture of chemicals and chemical products 22 21 Manufacture of basic pharmaceutical products and pharmaceutical preparations 4 22 Manufacture of rubber and plastic products 70 23 Manufacture of other non-metallic mineral products 210 24 Manufacture of basic metals 11 25 Manufacture of fabricated metal products, except machinery and equipment 213 26 Manufacture of computer, electronic and optical products 13 27 Manufacture of electrical equipment 21 28 Manufacture of machinery and equipment n.e.c. 54 29 Manufacture of motor vehicles, trailers and semi-trailers 26
30 Manufacture of other transport equipment 12 31 Manufacture of furniture 97
TOTAL 1.425

23
Table A2 – Average, by sector
Variables calculated for each firm Variables calculated for the industry
Industry Exp_I AG S PRdF CP RD Exp_Or PRd CR4
10 0.264 20.221 64.825 157.431 0.915 0.002 0.032 114.569 0.122 11 0.326 22.835 36.149 117.297 2.222 0.013 0.260 210.582 0.522 13 0.543 19.120 47.867 180.080 1.771 0.006 0.059 52.229 0.136 14 0.781 16.703 35.802 76.551 1.066 0.001 0.063 25.878 0.087 15 0.682 14.350 44.288 72.995 0.810 0.002 0.072 44.707 0.097 16 0.490 21.136 33.097 106.645 1.586 0.004 0.071 88.342 0.224 17 0.201 23.467 56.911 184.093 2.408 0.003 0.053 205.584 0.561 18 0.062 21.804 28.500 61.410 1.977 0.012 0.056 50.615 0.202 20 0.379 15.000 23.576 313.759 1.187 0.007 0.062 257.334 0.323 21 0.311 13.000 132.500 345.833 1.476 0.086 0.069 160.975 0.365 22 0.342 19.086 38.867 106.489 1.035 0.008 0.107 112.000 0.213 23 0.497 18.533 35.881 80.851 1.681 0.006 0.118 90.241 0.241 24 0.412 17.545 84.939 325.902 0.910 0.006 0.082 234.532 0.480 25 0.410 17.751 29.045 72.249 1.528 0.007 0.059 54.443 0.118 26 0.592 10.538 57.462 137.440 0.705 0.021 0.092 130.311 0.719 27 0.306 16.476 99.746 117.527 0.953 0.011 0.085 153.366 0.405 28 0.414 20.204 24.278 73.735 1.324 0.010 0.076 78.264 0.184 29 0.530 18.192 224.551 114.512 0.706 0.011 0.086 172.836 0.475 30 0.499 18.750 36.222 98.774 2.235 0.022 0.087 46.536 0.383 31 0.383 17.845 30.027 56.726 1.506 0.004 0.075 42.772 0.128
Global 0.458 18.662 42.023 101.491 1.444 0.006 0.088 87.468 0.211 Source: Own calculations

Editorial Board ([email protected])Download available at: http://wps.fep.up.pt/wplist.php
also in http://ideas.repec.org/PaperSeries.html
25